Embed Size (px)
Citation preview
Vibration in dwellings from road and rail traffic —Part II: exposure–effect relationships based onordinal logit and logistic regression models
R. Klæboea,*, I.H. Turunen-Riseb, L. Harvikc, C. Madshusc
aInstitute of Transport Economics, PO Box 6110 Etterstad, N-0602 Oslo, NorwaybNorwegian Council for Building Standardization, PO Box 129 Blindern, N-0314 Oslo, Norway
cNorwegian Geotechnical Institute, PO Box 3930 Ulleval Stadion, N-0806 Oslo, Norway
Received 23 April 2001; received in revised form 4 June 2002; accepted 10 June 2002
Abstract
The 1998 Norwegian Socio-vibrational Survey with 1503 respondents from 14 study areaswas undertaken in the autumns of 1997 and 1998. Telephone interviews were used forobtaining people’s reactions to vibrations in dwellings while in-dwelling vibration values were
calculated for 1427 of these respondents. The response rate was 50%. The calculations of thevibration values were based on measurements and calculations by using a semi-empiricalvibration prediction model. The logarithmic transformation of the calculated statistical max-
imum vibration value vw,95 as defined in the new Norwegian Standard NS 8176, was selectedas exposure measure. There were no significant differences in reactions to vibrations fromdifferent sources. An estimated exposure–effect ordinal logit model for degrees of annoyanceas a function of the vibration exposure measure shows good fit and narrow statistical error
bands. Further studies are needed to determine whether the exposure measure should alsoinclude the number and duration of vibration events.# 2002 Elsevier Science Ltd. All rights reserved.
Keywords: Perception of vibration; Traffic-induced vibration; Socio-vibrational study
Applied Acoustics 64 (2003) 89–109
www.elsevier.com/locate/apacoust
0003-682X/02/$ - see front matter # 2002 Elsevier Science Ltd. All rights reserved.
PI I : S0003-682X(02 )00053 -1
* Corresponding author. Tel.: +47-22573800; fax: +47-22570290.
E-mail address: [email protected] (R. Klæboe).
1. Introduction
In the first paper of the three-part presentation of Nordic projects dealing with vibra-tion in dwellings from road and rail traffic, Turunen-Rise et al. [1] presents the back-ground for work with the new Norwegian Standard NS 8176 [2]. This new Norwegianstandard defines the statistical maximum weighted vibration velocity vw,95 (or alter-natively the statistical maximum weighted acceleration aw,95) and describes themeasurement procedure. The reader is referred to part I for a description of this measure.In order to assess the size of the adverse effects caused by vibrations for use in the
standard, the 1998 Norwegian Socio-vibrational Survey [3] was undertaken. Its mainpurpose was to provide exposure–effect relationships between the new vibrationvelocity measure, vw,95, and the degree of annoyance by vibrations and the newvibration measure, the statistical maximum vibration velocity measure (vw,95).Relationships between this measure and other effects such as self-reported dis-turbances and rest were also to be obtained.The original project included the determination of vibration values for the respon-
dents in a Swedish socio-acoustic study [4]. This study contained questions onannoyance from vibrations, and could be retrofitted with vibration values The inten-tion was to pool the data from the Swedish and the Norwegian studies and thusenhance both the quantity and quality of the data available for analyses. Results fromexisting vibration measurements in buildings in the Swedish study areas were there-fore converted according to NS 8176 and used as input to the semi-empirical predic-tion model producing estimates of the vibration exposure measure (vw,95) for the otherdwellings along the track. However, the analyses of exposure–effect relationshipsutilising the converted vibration exposure measures gave inconsistent results. Theexposure–effect relationships for each of the Swedish areas differed, as did the expo-sure–effect relationship based on the pooled Swedish data when compared with therelationship estimated from the pooled Norwegian data set. One problem with usingthe previously existing measurements was that they often were obtained from build-ings where the inhabitants had complained about vibrations. The measurementsmight therefore not be representative for other buildings in the area. There were alsoconcerns that there might be differences in the scaling of the measurement values.Lacking the resources to secure new measurements according to the new standard NS8176 in these areas, a decision was made to proceed without these data.The experiences from the Swedish study together with the 1998 Norwegian Socio-
vibrational Survey formed the basis for the new Nordtest Method NT ACO 106 forassessing annoyance from vibrations from road and rail traffic presented in the thirdof the articles [5].
2. Methodology
2.1. Choice of study areas
Twelve study areas where ground conditions, building types etc. were known toresult in vibrations in dwellings from road, rail, tram or subway traffic were in the
90 R. Klæboe et al. / Applied Acoustics 64 (2003) 89–109
autumn of 1997 selected from the south-eastern parts of Norway. The goal was tosample respondents being exposed to vibration velocity values (vw,95) between 0 and3 mm/s. To reduce the modifying effect of transportation noise on vibrationannoyance, these sites were selected so that noise levels should be low. Thisrequirement was exemplified by that the indoors 24-h A-weighted equivalentcontinuous sound pressure levels should be low, and not exceed 30 dB. Studyareas featuring high maximum noise levels or with known noise problems werelikewise avoided. Sites where public actions against road or rail traffic had takenplace were also avoided. When protests from the residents are a direct result of theexposure in an area, it is not necessarily a factor that should be controlled for sta-tistically in multivariate analyses or avoided. However, extraordinary media atten-tion and/or spirited efforts from community action groups might bias people’sresponses.Inspection of the calculated in-dwelling vibration values for the respondents in the
different study areas revealed a lack of vibration velocity values, vw,95, above 0.75mm/s. It therefore became necessary to supplement the original 12 study areas withtwo additional areas known to have high vibration values. In one of the two areasthere had been widespread protests against the steep increase in railway traffic thatwould follow from the opening of the new Oslo Airport in 1998. The choice of thisstudy area thus violated the initial selection criteria. Due to financial constraints andthe need to utilise existing measurements, there were no other areas with the suffi-cient number of respondents exposed to high vibration values available. The sup-plemental survey in this study area was undertaken after the completion of anextensive noise screening and insulation program to reduce railway noise and rightbefore the opening of the new highspeed train link to the new Oslo Airport. Onemight therefore hope that the reactions to vibrations in this area would not differtoo much from that of other areas. A test for differences between exposure–effectrelationships in different study areas was performed as part of the statisticalanalyses—see Section 4.5.
2.2. Sampling procedure
The boundary each study area was defined geographically by means of mapcoordinates, and all valid addresses within the study area were recorded and listed.The national telephone directory was thereafter used to find all households withaddresses matching those in the list. The set of household addresses was thereafterused as a sampling frame.A two-step sampling procedure was used to select candidates for the telephone
interviews. At the first stage a simple random sample of households was taken fromeach study area. At the second stage, the person in the household more than 18years old and having last celebrated his/her birthday, was selected. This samplingprocedure has a systematic tendency to include fewer people from larger households[6], but this is not likely to influence the exposure–effect relationships. After aresponse rate of 51%, which is typical for this type of survey, answers from 1503respondents were available. The main reason for non-response was unwillingness to
R. Klæboe et al. / Applied Acoustics 64 (2003) 89–109 91
participate. The interviews were conducted during the month of September 1997 andfor the supplementary sample during September 1998.
2.3. Survey questions
The survey was introduced as a general community study of neighbourhoodquality. The initial questions dealt with a variety of environmental qualities andproblems associated with the respondent’s neighbourhood. After enquiring aboutthe respondent’s address to check on the address information listed in the telephonedirectory, the following introduction was given:We are also interested in whether you are annoyed or bothered by different types of
traffic when you are in your dwelling.After questions whether the respondent hears noise from road, tram, sub-way or
trains1 and if so whether the noise is ‘‘highly annoying, somewhat annoying, a littleannoying or not annoying for you’’, the question on vibration annoyance was givenin two steps by first enquiring:Can you in your dwelling notice shaking or vibration caused by <source>? If the
response was affirmative, the respondents were asked: ‘‘Is the shaking/these vibra-tions highly annoying, somewhat annoying, a little annoying or not annoying for you’’.Additional questions on other types of reactions might have been included, and used
for establishing a composite reaction measure. The reliability and validity of a compo-site reaction measure are often superior to the reliability and validity of a single reactionindicator. There are however several unresolved questions on how to establish a morevalid and reliable composite reaction measure. Not least is the multidimensionality ofadverse reactions to environmental stimuli—see [7]. Annoyance (Norwegian ‘‘Plaget’’)has also a special standing as it is this reactionmeasure that Norwegian authorities referto when setting environmental standards, guidelines and limits. As the main purpose ofthe study was to provide the authorities the necessary input for establishing comfortcriteria for dwellings exposed to vibrations, it was decided to concentrate on producingthe exposure–effect curves for annoyance. Respondents that noticed vibrations in theirdwelling were also asked how often they notice various manifestations of vibrations:
How do you notice shaking/vibrations:Do you often, sometimes or never notice that the house shakes or vibrates?2
Do you often, sometimes or never notice that things shift around, move or fall down?Do you often, sometimes or never notice that household items rattle or clink?How often can you bodily feel the vibrations: often sometimes or never?
The questions concerning activity disturbances were as follows:
I will now mention some inconveniences when indoors that traffic can cause: arethese inconveniences that you notice: Does shaking/vibrations lead you to:
1 Only the source(s) applicable to each area.2 People noticing doors or windows rattling are also expected to answer here.
92 R. Klæboe et al. / Applied Acoustics 64 (2003) 89–109
� having problems falling to sleep?� awakening at night?� wakening too early in the morning?� being disturbed when wanting to rest?� being disturbed when talking on the phone?� being disturbed during conversations indoors?� being disturbed when you listen to the radio or watch TV??� being anxious/afraid of damage to house/dwelling?� becoming generally anxious/afraid?
The allowed answers were ‘‘Yes’’ or ‘‘No’’.The interviewer noted the respondent’s gender. Respondents reported in which of
the age groups 18–19, 20–24, 25–39, 40–66 and over 66 years old they belonged. Therespondents were also asked whether they had children below 7 and/or 10 yearsrespectively.
2.4. Vibration measures
The statistical maximum vibration velocity value vw,95 was determined for eachrespondent by means of a semi-empirical prediction model for vibrations developedby Madshus et al. [8].Differences in track quality, ground conditions, attenuation of vibration, distance
from vibration source, vehicle speed and amplification of vibration from the groundinto the dwellings, were factors that were entered into the prediction model. Eachfactor was defined by a mean value and a coefficient of variation.Input parameters were partly based on expert assessment given the ground con-
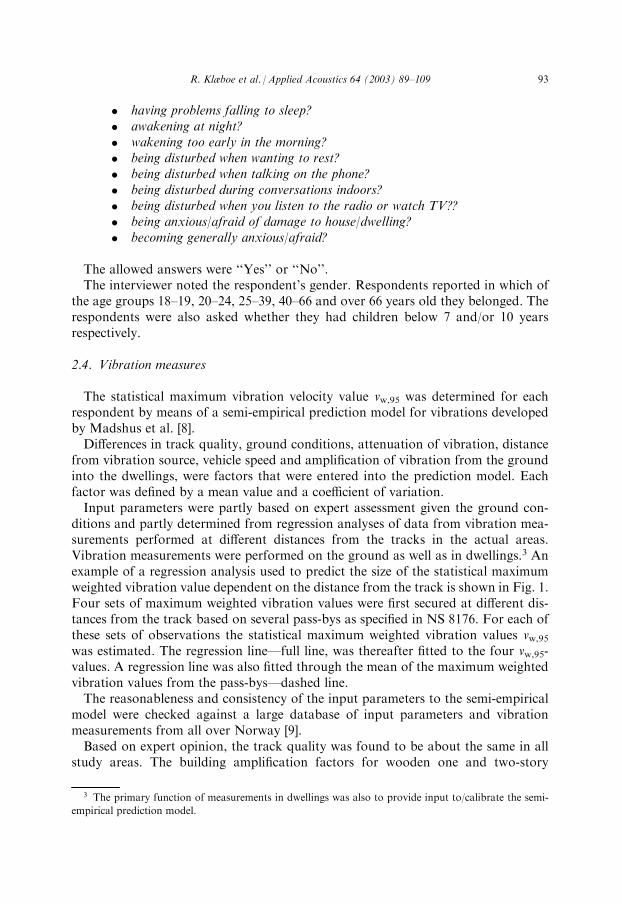
ditions and partly determined from regression analyses of data from vibration mea-surements performed at different distances from the tracks in the actual areas.Vibration measurements were performed on the ground as well as in dwellings.3 Anexample of a regression analysis used to predict the size of the statistical maximumweighted vibration value dependent on the distance from the track is shown in Fig. 1.Four sets of maximum weighted vibration values were first secured at different dis-tances from the track based on several pass-bys as specified in NS 8176. For each ofthese sets of observations the statistical maximum weighted vibration values vw,95was estimated. The regression line—full line, was thereafter fitted to the four vw,95-values. A regression line was also fitted through the mean of the maximum weightedvibration values from the pass-bys—dashed line.The reasonableness and consistency of the input parameters to the semi-empirical
model were checked against a large database of input parameters and vibrationmeasurements from all over Norway [9].Based on expert opinion, the track quality was found to be about the same in all
study areas. The building amplification factors for wooden one and two-story
3 The primary function of measurements in dwellings was also to provide input to/calibrate the semi-
empirical prediction model.
R. Klæboe et al. / Applied Acoustics 64 (2003) 89–109 93
houses and four/five-story brick houses were about the same, so there were no needto introduce separate factors for different buildings. The vehicle speed was set equalto the speed limit in each area. The vibration velocity increases proportionally withthe speed of the vehicles. Statistical maximum vibration velocity values vw,95 werecalculated according to the procedures in the Norwegian Standard [1].As the main effort has been directed towards gathering vibration data from the
target (main) vibration source within each study area, vibration values for morethan one source were only available for a few of the study areas. The largest of thevibration values was therefore chosen as exposure measure without any adjustment.A dummy variable was constructed to make note of situations were people wereexposed to vibrations from two sources.
Fig. 1. Measurements of four sets of maximum weighted vibration values at different distances from the
rail/road based on a set of pass-bys. A regression line is fitted to the statistical maximum weighted vibra-
tion values estimated on the basis of each of these sets—full line. In addition a regression line has been
fitted through the means of each set of maximum weighted vibration values—dashed line.
94 R. Klæboe et al. / Applied Acoustics 64 (2003) 89–109
3. Analyses of exposure–effect relationships
Vibrations that cause some people to be highly annoyed may be perceived asmerely as moderately annoying or not annoying at all by others. In spite of such largeindividual differences in people’s reactions, there is at the same time a clear andsystematic relationship between the size of the vibration exposure values and thepercentage of people reporting varying degrees of annoyance. A simple empiricalapproach and two slightly different statistical models were used for describing suchexposure–effect relationships.
3.1. Simple illustrations of exposure and exposure–effect relationships
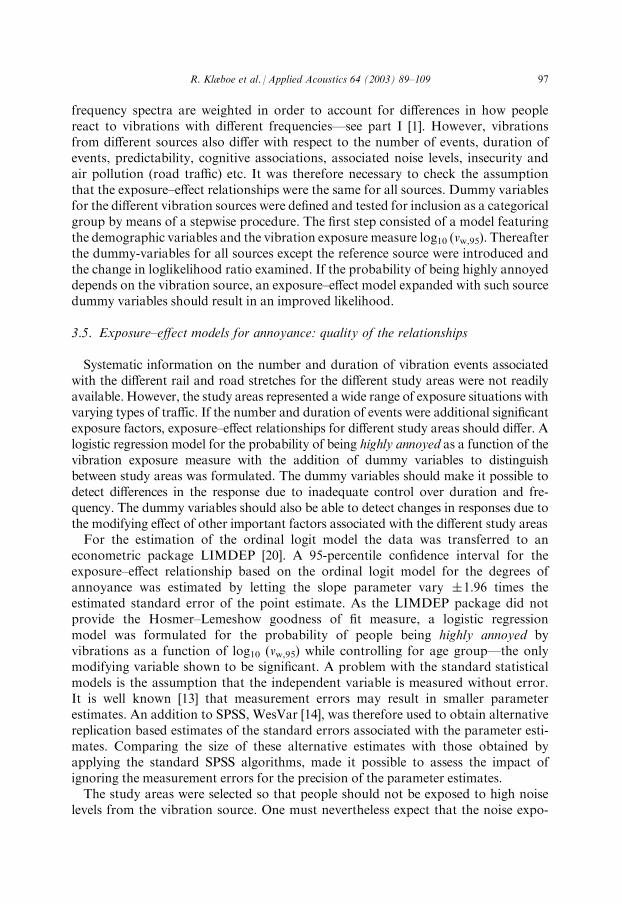
Box plots were used to describe the distribution and range of the values of thevibration exposure measure for different vibration sources in different study areas.Such box plots—see Fig. 2, show the median value (horizontal line), the inter-quartile range (grey area or ‘‘box’’) and the largest and smallest observation (whis-kers) not being an outlier. Outliers are defined as lying 1.5–3 box lengths from theedge of the box (small circles) and extremes lying more that 3 box lengths from theedge of the box (small stars).Box plots were also used to describe the distribution of the propagation distances
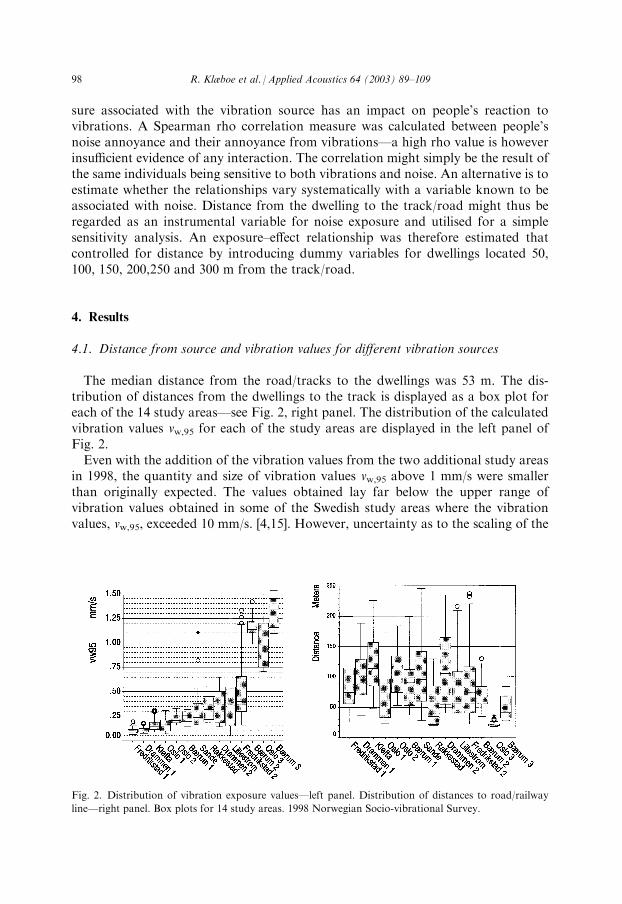
from the respondents’ dwellings to the railway line or road. A stacked bar chart wasused to describe the number and proportion of people reporting different degrees ofannoyance for each interval of the vibration exposure measure—see Fig. 2. This simpleapproach ensures that a predefined functional form is not forced upon the data by thestatistical models. Visualisation of the relationships by stacked bar charts can thusprovide insights into effects or factors that otherwise would go unnoticed.
3.2. Statistical models for describing exposure–effect relationships
Most environmental research measuring people’s adverse reactions to environ-mental exposures, feature dependent variables that are ordinal and categorical [10].Degrees of annoyance, degrees of disturbance, how often people awaken (daily,weekly, monthly), the severity of subjective health complaints symptoms etc. areexamples of such variables. Linear regression models are nevertheless often appliedfor analysing such variables by attaching a numeric value to each category. However,the linear regression model fails to take into account the non-linearity and hetero-scedasticity of the relationships. Predictions from linear regression models can thus insome cases give response probabilities outside of the allowable range of [0..1]. Logisticregression and ordinal logit models do not suffer from these shortcomings.
3.3. Models estimated for annoyance, disturbances, and other effects of vibrations
The questionnaire contained questions on how often people notice different man-ifestations of the vibrations (that the house shakes or vibrates, rattling of furnitureand household items that things move about and/or that they can bodily feel the
R. Klæboe et al. / Applied Acoustics 64 (2003) 89–109 95
vibrations). By coding ‘‘often’’ as one and other responses zero the responses weredichotomised. This made it possible to use logistic regression models for the expo-sure–effect relationships for each of these effects. Logistic regression was also usedfor people experiencing different types of disturbances from vibrations in dwellings.The data from the 1998 Norwegian Socio-vibrational Survey was archived and definedby means of an SPSS file and SPSS [11] was used for most analyses. The logisticregression module in SPSS includes convenient stepwise routines for testing the inclu-sion of explanatory factors, and also includes the Hosmer–Lemeshow [12] test of fit-ness that is applicable when the design matrix is sparse. Such is the case when one ofthe independent variables, such as the vibration exposure measure, is continuous.A disadvantage of the logistic regression is that it throws away all the information
on the transitions between the other response categories as a function of the vibra-tion measure. This inefficiency translates into parameter estimates with unnecessarylarge standard errors. When the dependent variable is ordinal, an ordinal logitmodel is therefore often the appropriate choice. An additional advantage of theordinal logit model is that it provides politicians and the authorities with a broaderpicture about the full range and size of annoyance effects without compromising theaccuracy of the estimated relationships. Focusing on people highly annoyed might bewarranted in cases where authorities want to spend scarce resources only to thosemost in need of them. Politicians wishing to improve quality of life more generallymight want to look at the fraction of people highly and somewhat annoyed. The ordinallogit model produces both relationships using all the available data. As the relation-ship between the degrees of annoyance caused by vibrations and the exposure measurewas the most important of the results to be obtained from the socio-vibrational survey,the additional effort of estimating an ordinal logit model for the degrees of annoyanceas a function of the vibration exposure measure was therefore undertaken.
3.4. Exposure–effect models for annoyance: testing procedure
The statistical maximum weighted vibration value vw,95 defined in NS 8176, was toserve as basis for the vibration exposure measure. An initial task for the statisticalanalyses was to determine the functional form of the exposure–effect relationship forannoyance from vibrations. Another important task was to determine whether peo-ple react differently to vibrations from different sources.In order to determine whether log10 (vw,95) or vw,95 should be used as exposuremeasure,
two alternative logistic regression models for the probability of people being ‘‘highlyannoyed’’ were estimated using the whole data set and not distinguishing betweenvibrations from different vibration sources. The testing proceeded in a stepwise fashion:A model featuring only gender, age group and having a child under 10 years old asindependent variables was estimated initially. A log likelihood ratio test was used to testif the subsequent additional inclusion of the vibration measure in linear and logarithmicform respectively resulted in a significant improvement in model fit. If both modelspassed this test, the model resulting in the highest likelihood value was to be selected.Using the whole data set to determine functional form is only correct if people do
not react differently to vibrations from different vibration sources. The vibration
96 R. Klæboe et al. / Applied Acoustics 64 (2003) 89–109
frequency spectra are weighted in order to account for differences in how peoplereact to vibrations with different frequencies—see part I [1]. However, vibrationsfrom different sources also differ with respect to the number of events, duration ofevents, predictability, cognitive associations, associated noise levels, insecurity andair pollution (road traffic) etc. It was therefore necessary to check the assumptionthat the exposure–effect relationships were the same for all sources. Dummy variablesfor the different vibration sources were defined and tested for inclusion as a categoricalgroup by means of a stepwise procedure. The first step consisted of a model featuringthe demographic variables and the vibration exposure measure log10 (vw,95). Thereafterthe dummy-variables for all sources except the reference source were introduced andthe change in loglikelihood ratio examined. If the probability of being highly annoyeddepends on the vibration source, an exposure–effect model expanded with such sourcedummy variables should result in an improved likelihood.
3.5. Exposure–effect models for annoyance: quality of the relationships
Systematic information on the number and duration of vibration events associatedwith the different rail and road stretches for the different study areas were not readilyavailable. However, the study areas represented a wide range of exposure situations withvarying types of traffic. If the number and duration of events were additional significantexposure factors, exposure–effect relationships for different study areas should differ. Alogistic regression model for the probability of being highly annoyed as a function of thevibration exposure measure with the addition of dummy variables to distinguishbetween study areas was formulated. The dummy variables should make it possible todetect differences in the response due to inadequate control over duration and fre-quency. The dummy variables should also be able to detect changes in responses due tothe modifying effect of other important factors associated with the different study areasFor the estimation of the ordinal logit model the data was transferred to an
econometric package LIMDEP [20]. A 95-percentile confidence interval for theexposure–effect relationship based on the ordinal logit model for the degrees ofannoyance was estimated by letting the slope parameter vary �1.96 times theestimated standard error of the point estimate. As the LIMDEP package did notprovide the Hosmer–Lemeshow goodness of fit measure, a logistic regressionmodel was formulated for the probability of people being highly annoyed byvibrations as a function of log10 (vw,95) while controlling for age group—the onlymodifying variable shown to be significant. A problem with the standard statisticalmodels is the assumption that the independent variable is measured without error.It is well known [13] that measurement errors may result in smaller parameterestimates. An addition to SPSS, WesVar [14], was therefore used to obtain alternativereplication based estimates of the standard errors associated with the parameter esti-mates. Comparing the size of these alternative estimates with those obtained byapplying the standard SPSS algorithms, made it possible to assess the impact ofignoring the measurement errors for the precision of the parameter estimates.The study areas were selected so that people should not be exposed to high noise
levels from the vibration source. One must nevertheless expect that the noise expo-
R. Klæboe et al. / Applied Acoustics 64 (2003) 89–109 97
sure associated with the vibration source has an impact on people’s reaction tovibrations. A Spearman rho correlation measure was calculated between people’snoise annoyance and their annoyance from vibrations—a high rho value is howeverinsufficient evidence of any interaction. The correlation might simply be the result ofthe same individuals being sensitive to both vibrations and noise. An alternative is toestimate whether the relationships vary systematically with a variable known to beassociated with noise. Distance from the dwelling to the track/road might thus beregarded as an instrumental variable for noise exposure and utilised for a simplesensitivity analysis. An exposure–effect relationship was therefore estimated thatcontrolled for distance by introducing dummy variables for dwellings located 50,100, 150, 200,250 and 300 m from the track/road.
4. Results
4.1. Distance from source and vibration values for different vibration sources
The median distance from the road/tracks to the dwellings was 53 m. The dis-tribution of distances from the dwellings to the track is displayed as a box plot foreach of the 14 study areas—see Fig. 2, right panel. The distribution of the calculatedvibration values vw,95 for each of the study areas are displayed in the left panel ofFig. 2.Even with the addition of the vibration values from the two additional study areas
in 1998, the quantity and size of vibration values vw,95 above 1 mm/s were smallerthan originally expected. The values obtained lay far below the upper range ofvibration values obtained in some of the Swedish study areas where the vibrationvalues, vw,95, exceeded 10 mm/s. [4,15]. However, uncertainty as to the scaling of the
Fig. 2. Distribution of vibration exposure values—left panel. Distribution of distances to road/railway
line—right panel. Box plots for 14 study areas. 1998 Norwegian Socio-vibrational Survey.
98 R. Klæboe et al. / Applied Acoustics 64 (2003) 89–109
original Swedish measurements that were converted, and that the measurementsoften had been obtained in buildings where the inhabitants had complained of thevibrations, precluded the additional use of these data.
4.2. Empirical exposure–effect relationships for annoyance from vibrations
A simple stacked bar chart shows the annoyance distribution for different vw,95intervals. The proportion of people being annoyed increases as the vibration valuesincrease—see Fig. 3: right panel. As some of the proportions are calculated on thebasis of responses from relatively few people—see Fig. 3: left panel, the size of thebars in the stacked bar chart can change a lot from one interval to the next. Thismakes it difficult to obtain a clear picture of the relationships. Statistical analysesweigh the obtained annoyance distribution within a vibration interval according tothe number of respondents exposed. An annoyance distribution based on a smallgroup of respondents is not given the same weight as an annoyance distributionbased on a larger group of people. The statistical analysis also makes use of the factthat as the vibration people are exposed to increases, the average level of annoyanceshould increase monotonically.
4.3. Results of the tests of functional form and independence of source
The results of the test of functional form showed that the logistic regression modelusing log10 (vw,95) resulted in the highest likelihood for the fitted model. Log10 (vw,95)
Fig. 3. People reporting different degrees of annoyance at different vibration exposure intervals. Numbers
of respondents—left panel; stacked proportions in cumulative percentages—right panel. 1998 Norwegian
Socio-vibrational Survey.
R. Klæboe et al. / Applied Acoustics 64 (2003) 89–109 99
was accordingly selected to serve as the vibration exposure measure. The choice wasdependent on the subsequent confirmation that it was indeed correct to pool thedata and not to distinguish between annoyance from vibrations in dwellings causedby different sources. This test resulted in nonsignificant parameter estimates for thesource dummy variables, indicating that estimating a generic exposure–effect rela-tionship would be sufficient, and that it was not necessary to estimate source specificexposure–effect relationships.
4.4. Estimation results based on the generic ordinal logit model for degrees of annoyance
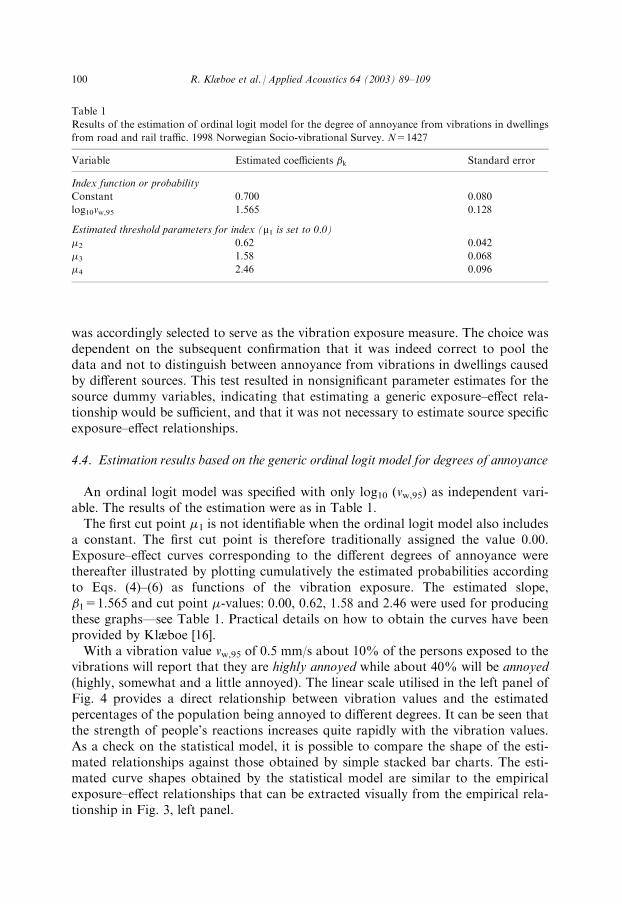
An ordinal logit model was specified with only log10 (vw,95) as independent vari-able. The results of the estimation were as in Table 1.The first cut point �1 is not identifiable when the ordinal logit model also includes
a constant. The first cut point is therefore traditionally assigned the value 0.00.Exposure–effect curves corresponding to the different degrees of annoyance werethereafter illustrated by plotting cumulatively the estimated probabilities accordingto Eqs. (4)–(6) as functions of the vibration exposure. The estimated slope,�1=1.565 and cut point �-values: 0.00, 0.62, 1.58 and 2.46 were used for producingthese graphs—see Table 1. Practical details on how to obtain the curves have beenprovided by Klæboe [16].With a vibration value vw,95 of 0.5 mm/s about 10% of the persons exposed to the
vibrations will report that they are highly annoyed while about 40% will be annoyed(highly, somewhat and a little annoyed). The linear scale utilised in the left panel ofFig. 4 provides a direct relationship between vibration values and the estimatedpercentages of the population being annoyed to different degrees. It can be seen thatthe strength of people’s reactions increases quite rapidly with the vibration values.As a check on the statistical model, it is possible to compare the shape of the esti-mated relationships against those obtained by simple stacked bar charts. The esti-mated curve shapes obtained by the statistical model are similar to the empiricalexposure–effect relationships that can be extracted visually from the empirical rela-tionship in Fig. 3, left panel.
Table 1
Results of the estimation of ordinal logit model for the degree of annoyance from vibrations in dwellings
from road and rail traffic. 1998 Norwegian Socio-vibrational Survey. N=1427
Variable Estimated coefficients �k Standard error
Index function or probability
Constant 0.700 0.080
log10vw,95 1.565 0.128
Estimated threshold parameters for index (m1 is set to 0.0)
�2 0.62 0.042
�3 1.58 0.068
�4 2.46 0.096
100 R. Klæboe et al. / Applied Acoustics 64 (2003) 89–109
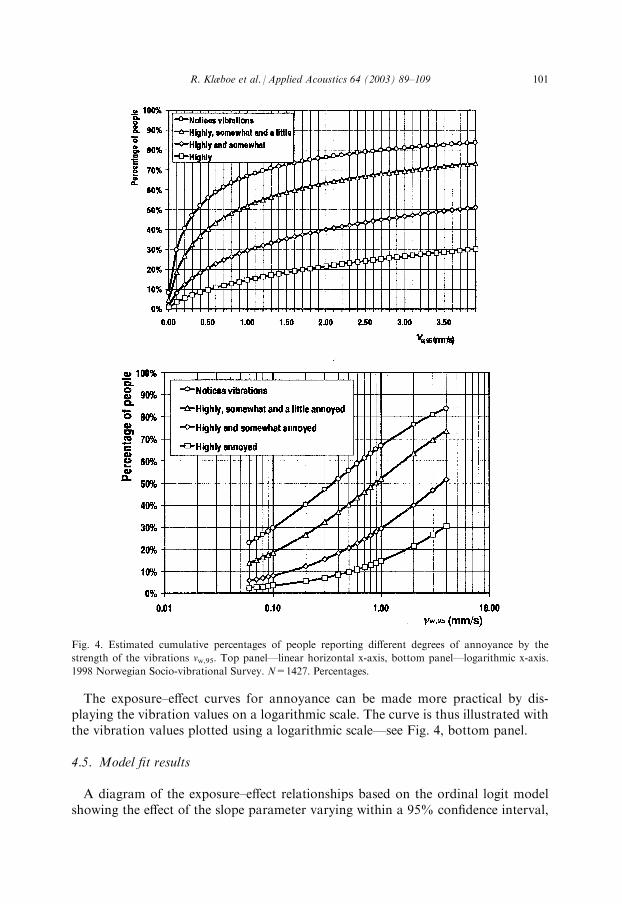
The exposure–effect curves for annoyance can be made more practical by dis-playing the vibration values on a logarithmic scale. The curve is thus illustrated withthe vibration values plotted using a logarithmic scale—see Fig. 4, bottom panel.
4.5. Model fit results
A diagram of the exposure–effect relationships based on the ordinal logit modelshowing the effect of the slope parameter varying within a 95% confidence interval,
Fig. 4. Estimated cumulative percentages of people reporting different degrees of annoyance by the
strength of the vibrations vw,95. Top panel—linear horizontal x-axis, bottom panel—logarithmic x-axis.
1998 Norwegian Socio-vibrational Survey. N=1427. Percentages.
R. Klæboe et al. / Applied Acoustics 64 (2003) 89–109 101
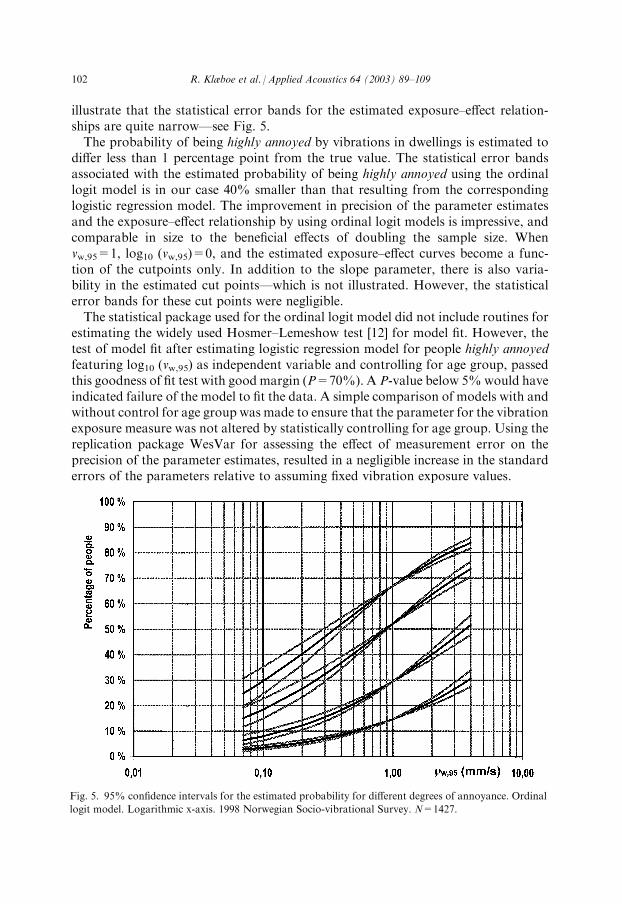
illustrate that the statistical error bands for the estimated exposure–effect relation-ships are quite narrow—see Fig. 5.The probability of being highly annoyed by vibrations in dwellings is estimated to
differ less than 1 percentage point from the true value. The statistical error bandsassociated with the estimated probability of being highly annoyed using the ordinallogit model is in our case 40% smaller than that resulting from the correspondinglogistic regression model. The improvement in precision of the parameter estimatesand the exposure–effect relationship by using ordinal logit models is impressive, andcomparable in size to the beneficial effects of doubling the sample size. Whenvw,95=1, log10 (vw,95)=0, and the estimated exposure–effect curves become a func-tion of the cutpoints only. In addition to the slope parameter, there is also varia-bility in the estimated cut points—which is not illustrated. However, the statisticalerror bands for these cut points were negligible.The statistical package used for the ordinal logit model did not include routines for
estimating the widely used Hosmer–Lemeshow test [12] for model fit. However, thetest of model fit after estimating logistic regression model for people highly annoyedfeaturing log10 (vw,95) as independent variable and controlling for age group, passedthis goodness of fit test with good margin (P=70%). A P-value below 5%would haveindicated failure of the model to fit the data. A simple comparison of models with andwithout control for age group was made to ensure that the parameter for the vibrationexposure measure was not altered by statistically controlling for age group. Using thereplication package WesVar for assessing the effect of measurement error on theprecision of the parameter estimates, resulted in a negligible increase in the standarderrors of the parameters relative to assuming fixed vibration exposure values.
Fig. 5. 95% confidence intervals for the estimated probability for different degrees of annoyance. Ordinal
logit model. Logarithmic x-axis. 1998 Norwegian Socio-vibrational Survey. N=1427.
102 R. Klæboe et al. / Applied Acoustics 64 (2003) 89–109
The purpose of the study was not to isolate the sensory experience of vibrations,but to provide a link between a vibration exposure measure and an average annoy-ance reaction from vibrations. Such an average response is also associated with‘‘normal’’ levels of associated air and structure borne noise, visual indications ofvibrations etc. Care was therefore taken to avoid study areas with excessive noise,not to totally avoid the associated noise exposure. The Norwegian Standard NS8176 explicitly warns that annoyance from vibrations will be higher and that morecare should be taken when people are exposed to high levels of noise in addition tovibrations in dwellings.The annoyance from vibrations correlated 0.57 (Spearman rho) with annoyance
from noise. This means that noise can be perceived to have some impact on theannoyance from vibrations and visa versa. However, part of this correlation mightalso be explained by the fact that people that are sensitive to one environmentalproblem might also be sensitive to other environmental problems [17]. Exposureeffect-relationships for annoyance as a function of the vibration exposure measureand controlling for the distance between the track/road and the dwellings show nosignificant separate4 effect of distance (here serving as a proxy for noise exposure) onpeople’s annoyance from vibrations. This is an indication that the choice of studyareas with low associated noise levels was successful and that the responses are notseriously biased by excessive noise.
4.6. Exposure–effect relationships for other effects
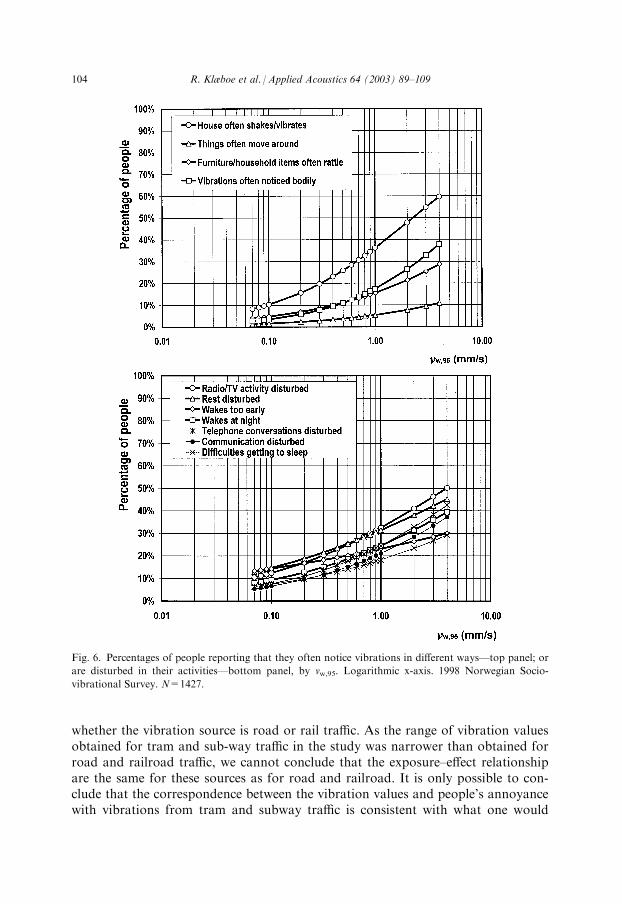
The manifestation of vibrations in the dwellings reported by most people is thatthe house shakes or vibrates.5 At a vibration value of 0.3 mm/s about 20% of therespondents report that the house often shakes, while 9% report rattling of furnitureand household items and/or that they can bodily feel the vibrations—see Fig. 6: toppanel. The respondents who are the most annoyed are also those who most oftennotice vibrations in the forms described.Listening to radio or watching TV are the activities that most respondents report
to be disturbed by vibrations—Fig. 6: bottom panel. One must, however, also expectthat these reported disturbances are the ones most affected by the associated noiseproblems. Between 10 and 15% of the respondents report rest and sleep dis-turbances at a vibration value (vw,95) of about 0.1 mm/s i.e. when vibration valuesare very low.
5. Discussion
The fact that there were no significant differences in people’s reactions to vibra-tions from different sources, suggests that the frequency weighting has been suc-cessful and that exposure–effect relationships can be estimated without considering
4 Other than that captured by the vibration exposure measure.5 Often this will be windows or doors rattling or shaking.
R. Klæboe et al. / Applied Acoustics 64 (2003) 89–109 103
whether the vibration source is road or rail traffic. As the range of vibration valuesobtained for tram and sub-way traffic in the study was narrower than obtained forroad and railroad traffic, we cannot conclude that the exposure–effect relationshipare the same for these sources as for road and railroad. It is only possible to con-clude that the correspondence between the vibration values and people’s annoyancewith vibrations from tram and subway traffic is consistent with what one would
Fig. 6. Percentages of people reporting that they often notice vibrations in different ways—top panel; or
are disturbed in their activities—bottom panel, by vw,95. Logarithmic x-axis. 1998 Norwegian Socio-
vibrational Survey. N=1427.
104 R. Klæboe et al. / Applied Acoustics 64 (2003) 89–109
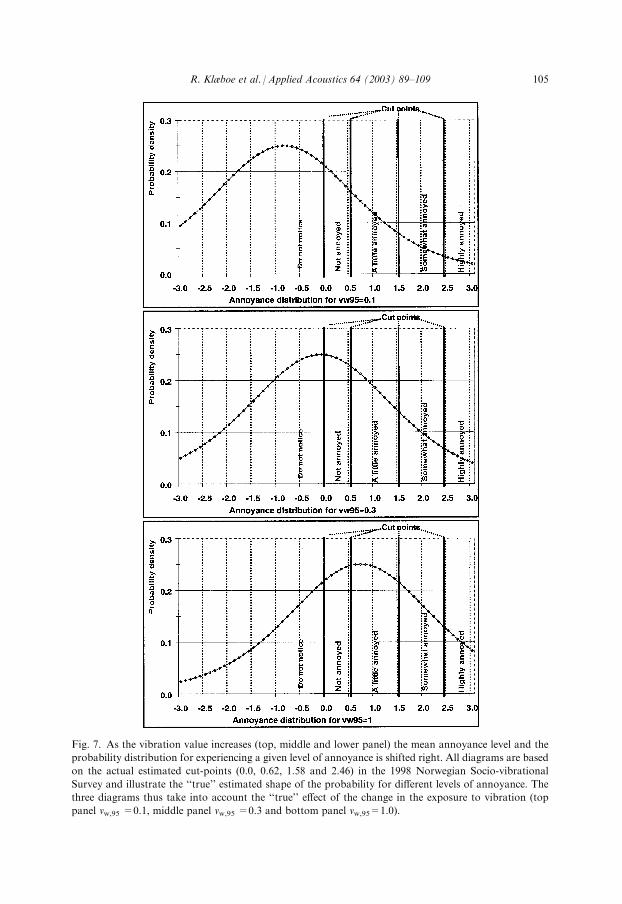
Fig. 7. As the vibration value increases (top, middle and lower panel) the mean annoyance level and the
probability distribution for experiencing a given level of annoyance is shifted right. All diagrams are based
on the actual estimated cut-points (0.0, 0.62, 1.58 and 2.46) in the 1998 Norwegian Socio-vibrational
Survey and illustrate the ‘‘true’’ estimated shape of the probability for different levels of annoyance. The
three diagrams thus take into account the ‘‘true’’ effect of the change in the exposure to vibration (top
panel vw,95 =0.1, middle panel vw,95 =0.3 and bottom panel vw,95=1.0).
R. Klæboe et al. / Applied Acoustics 64 (2003) 89–109 105
expect from a generic exposure–effect relationship for annoyance covering allvibration sources.The quality of the exposure–effect relationships is mainly dependent on the ade-
quacy of the exposure measure and the lack of more explicit control with the mod-ifying effect of exposure to transportation noise associated with the vibration source.The logarithm10 of the vibration measure specified in NS 8176 has been used as anexposure measure without taking into account the number of vibration events ortheir duration. The study areas, however, include railroad stretches and roads car-rying different amounts of traffic. When including dummy-variables for study area,no area had significantly different response. The estimated relationship for peoplehighly annoyed by log10 (vw,95) with control for age group, also passed the goodnessof fit test specified by Hosmer–and Lemeshow with good margin (P=0.70). Thismeans that there seems to be nothing seriously wrong with the relationships.There is still a chance that reactions will be lower when traffic volume is much less
as suggested by the Swedish study [4]. Vibrations characterized by a high vibrationvalue may be regarded as not annoying, if they only occur once a day.Later projects should try to establish a composite exposure measure that takes the
number of events and duration into account as suggested by Griffin [18]. Since thepurely statistical errors caused by the estimation process are small due to the effi-ciency of the ordinal logit model, this model should be considered for use in futureenvironmental exposure–effect studies. An additional advantage of the ordinal logitmodel is that it provides politicians and the authorities a broader picture about thefull range and size of annoyance effects without compromising the accuracy of theestimated relationships.Ideally a study should simultaneously assess the combined effect of a number of
different environmental exposures on the respective annoyance reactions. Thisdepends however on the available resources for such a study and the availability ofstudy areas where the different exposures are not heavily correlated. Due to thesparseness of the railway coverage in the Nordic countries this might be difficultwithout a broader international cooperation. Modelling such interactions is also noteasy due to the confounding effect of people being generally sensitive to differentenvironmental exposures.
Appendix. Explanation of the ordinal logit model
The ordinal logit model linking a categorical response variable to the level of anexposure indicator, has not yet been widely applied in annoyance research. This ispartly due to the model’s relative obscurity and partly because it has not beenimplemented as widely as logistic regression in statistical packages. When appro-priate, applying ordinal logit models to estimate exposure–effect relationshipsshould be of great benefit for researchers wanting to analyse the results of othersocio-acoustic, socio-vibrational and social surveys.The rationale for the model is relatively simple, but nevertheless not easy to fol-
low. A set of diagrams has therefore been drawn to illustrate the rationale for the
106 R. Klæboe et al. / Applied Acoustics 64 (2003) 89–109
model. In each of the diagrams in Fig. 7 the mean level of annoyance experienced ina population is described by the position on a continuous virtual annoyance x-scale.As different people are not equally sensitive to vibrations; the level of annoyanceexperienced by different people is not this fixed mean value, but can best be descri-bed by a probability distribution. This probability distribution is centered at themean level of annoyance in the population for that particular vibration exposurevalue. As the vibration value increases (top, middle to lower panel) the meanannoyance level and the whole probability distribution is shifted to the right. Peopleare more likely to experience the higher levels of annoyance and less likely to toexperience lower levels of annoyance.As people are asked to indicate their annoyance response by choosing between
distinctive levels of annoyance, people having similar degrees of annoyance willreport the same categoric level of annoyance. A set of cut points delimit the annoy-ance levels reported as not noticeable, not annoying, a little annoying, somewhatannoying and highly annoying. The probability of an individual reporting beingannoyed to degree j can then be estimated as the size of the areas between the J�1cut points (vertical lines) and below the probability distribution. The proportion ofresponses in the highest verbal annoyance category increases with increasing vibra-tion values while fewer report that they are unable to notice the vibrations. Theprobability of a person reporting an intermediate category can both increase ordecrease with the vibration value. That depends on whether more or less people areshifted up from the left lower annoyance categories into the intermediate categorythan are shifted from the intermediate category upwards to the next category to theright, higher category.The diagrams in Fig. 7 are drawn using the actual estimated regression and cut-
point values found in the 1998 Norwegian Socio-vibrational Survey.More formally: an ordinal logit model [19] describes the probability of obtaining
each of the response alternatives of the ordinal dependent variable (such as theexperienced degree of annoyance from vibrations) for a person i as a function of avector xi, i 2[1..n] of independent variables.The probability of obtaining a response of ‘‘do not notice’’ at a given vibration
exposure value, is the probability of obtaining a response in the leftmost area of theprobability distribution curve, that is to the left of the first cut point:
P Y ¼ 1 xij Þð ¼ P "i < �1 � �0xið Þ ¼ F �1 � �0xið Þ ð1Þ
The probability of obtaining an intermediate response is the probability of fallingbetween the two cut points defining the category:
P Y ¼ j xij Þð ¼ P �j�1 � �0xi� �
< "i < �j � �0xi� �
¼ F �j � �0xi� �
� F �j�1 � �0xi� �
j 2 2::J� 1½ �
ð2Þ
R. Klæboe et al. / Applied Acoustics 64 (2003) 89–109 107
The probability of ending up as ‘‘highly annoyed’’ is one minus the probability ofobtaining a lower response:
P Y ¼ J xij Þ ¼ P �J�1 � �0xið Þ < "ið Þ ¼ 1� F �J�1 � �0xið Þ ð3Þ
The transpose of �, �0 is a row vector of parameters [b0..bn] of size n, while xi is avector of independent variables [x0..xm] including the constant one (ie. x0=1, foreach person (i)). �j j 2[1..J�1] are cut points. (The parameterisation �j��0x is usedinstead of �j+�0x to ensure that �k>0 has the usual meaning that Y tends toincrease with xk).Under the assumption that F is the cumulative logit probability distribution
P Y ¼ 1 xij Þð ¼e��0xi
1þ e��0xi�1 is usually fixed at 0ð Þ ð4Þ
PðY ¼ jjxiÞ ¼e�j��0xi
1þ e�j��0xi�
e�j�1��0xi
1þ e�j�1��0xij 2 2::J� 1½ � ð5Þ
PðY ¼ J xij Þ ¼ 1�XJ�1
j¼1
PðYi ¼ j xij Þ ¼ 1�e�J�1��0xi
1þ e�J�1��0xið6Þ
The model is also called a proportional odds model as the odds of obtaining aresponse <=j is e�k b�að Þ times higher at xk=b than at xk=a when keeping all othervariables xf fixed f 2[0..m] f 6¼k.
References
[1] Turunen-Rise IH, Brekke A, Harvik L, Madshus C, Klæboe R. Vibration in dwellings from road
and rail traffic — Part I: a new Norwegian measurement standard and classification system. Applied
Acoustics 2003;64(1):71–87.
[2] Norwegian Standard NS 8176. Vibration and shock. Measurement of Vibration in Buildings from
Land-based Transport and Evaluation of Effects on Human beings. Oslo: Norwegian Council for
Building Standardization; 1999.
[3] Klæboe R, Fyhri A. People’s reactions to Vibrations in Dwellings from Road and Rail. TØI report
443/1999. Institute of Transport Economics, Oslo: 1999.
[4] Ohrstrom E, Skanberg A. Reactions to noise and vibrations from railway traffic, results from a
socio-acoustic survey in 15 Swedish areas. Report 1/95. Gothenburg: University of Gothenburg,
Environmental Medicine, 1995.
[5] Klæboe, R, Ohrstrom, E, Turunen-Rise, IH, Bendtsen, H, Nykanen, H. Vibration in dwellings from
road and rail traffic — Part III: towards a common methodology for soclo-vibrational surveys.
Applied Acoustics 2003;64(1):111–120.
[6] Klæboe, R, Grue, B. The Sampling Method in the 1998 Norwegian Travel Survey. An analysis of
estimator properties using WesVar. TØI working report 1135/1999. Oslo: Institute of Transport
Economics; 1999.
[7] Guski R, Felscher-Suhr U, Schuemer R. The concept of noise annoyance: how international experts
see it. Journal of Sound and Vibration 1999;223(4):513–27.
108 R. Klæboe et al. / Applied Acoustics 64 (2003) 89–109
[8] Madshus C, Bessason B, Harvik L. Prediction model for low frequency vibration from high speed
railways on soft ground. Journal of Sound and Vibration 1996;193(1):195–203.
[9] Madshus C, Harvik L. Vibration criteria for road and rail traffic. VIBBASE—a database system for
measured vibrations from road and rail traffic. Report 515136–1. Oslo: Norwegian Geotechnical
Institute; 1995.
[10] Agresti A. Categorical Data Analysis. New York: John Wiley & Sons; 1990.
[11] Norusis MJ. SPSS Advanced Statistics User’s Guide. Chicago: SPSS Inc; 1990.
[12] Hosmer DW, Lemeshow S. Applied Logistic Regression. New York: John Wiley & Son; 1989.
[13] Bollen KA. Structural Equations With Latent Variables. New York: John Wiley; 1989.
[14] Brick MJ, Morganstein D. WesVarPC: software for computing variance estimates from complex
designs. In: Proceedings of the 1996 Annual Research Conference Washington, DC: U.S. Bureau of
the Census, 2001, pp. 861–866.
[15] Harvik L. Norwegian Standard for vibrations from road and rail traffic NS 8176. Calculated vibra-
tion values for the Norwegian and simple exposure effect relationships for the Swedish Socio-vibra-
tional Study. Report 515159–1. Oslo: Norwegian Geotechnical Institute, 1998.
[16] Klæboe R. Ordinal logit models for assessing degrees of annoyance in environmental surveys. Pro-
ceedings of the 1999 international congress on noise control engineering Washington: INCE 1999;3:
1645–8.
[17] Klæboe R, Kolbenstvedt M, Clench-Aas J, Bartonova A. Oslo traffic study—part 1: an integrated
approach to assess the combined effects of noise and air pollution on annoyance. Atmospheric
Environment 2000;34(27):4727–36.
[18] Griffin MJ. Handbook of Human Vibration. London: Academic Press; 1990.
[19] McKelvey RD, Zavoina W. A statistical model for the analysis of ordinal level dependent variables.
Journal of mathematical sociology 1975;4:103–20.
[20] Greene WH. LIMDEP Version 7.0 User’s Manual. Bellport: Econometric Software Inc.; 1995.
R. Klæboe et al. / Applied Acoustics 64 (2003) 89–109 109