Embed Size (px)
Citation preview
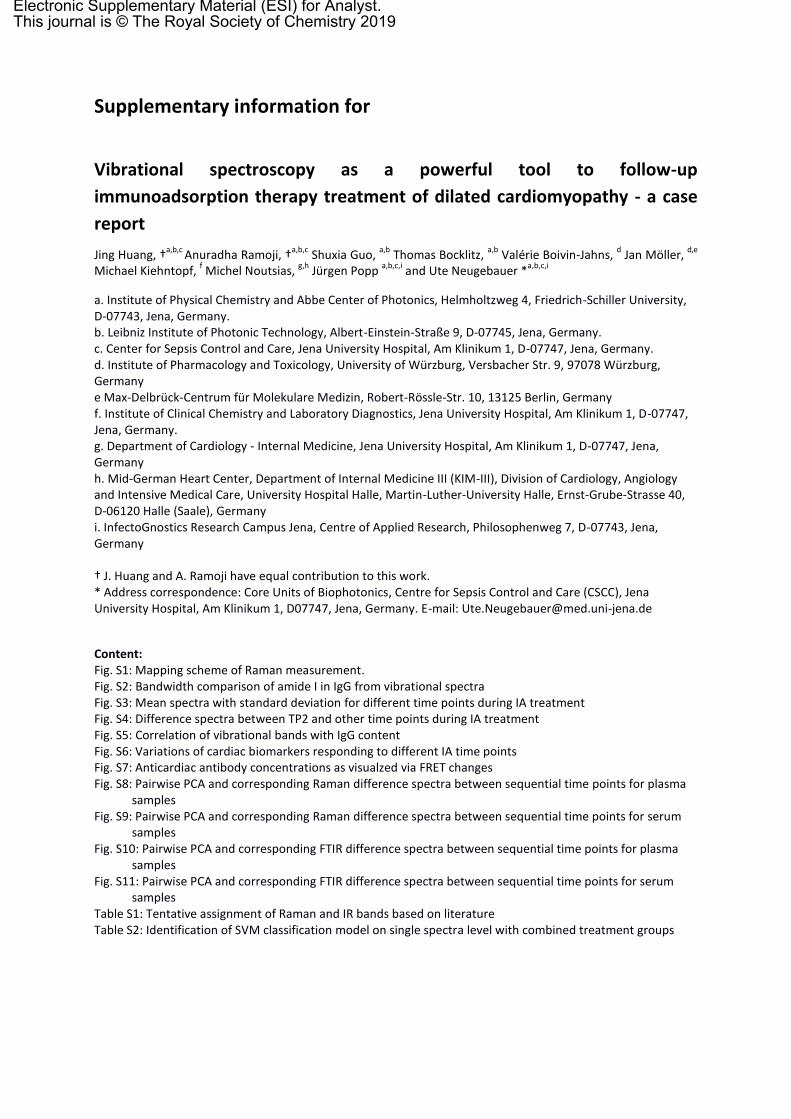
Supplementary information for
Vibrational spectroscopy as a powerful tool to follow-up
immunoadsorption therapy treatment of dilated cardiomyopathy - a case
report
Jing Huang, †a,b,c
Anuradha Ramoji, †a,b,c
Shuxia Guo, a,b
Thomas Bocklitz, a,b
Valérie Boivin-Jahns, d Jan Möller,
d,e
Michael Kiehntopf, f Michel Noutsias,
g,h Jürgen Popp
a,b,c,i and Ute Neugebauer *
a,b,c,i
a. Institute of Physical Chemistry and Abbe Center of Photonics, Helmholtzweg 4, Friedrich-Schiller University, D-07743, Jena, Germany. b. Leibniz Institute of Photonic Technology, Albert-Einstein-Straße 9, D-07745, Jena, Germany. c. Center for Sepsis Control and Care, Jena University Hospital, Am Klinikum 1, D-07747, Jena, Germany. d. Institute of Pharmacology and Toxicology, University of Würzburg, Versbacher Str. 9, 97078 Würzburg, Germany e Max-Delbrück-Centrum für Molekulare Medizin, Robert-Rössle-Str. 10, 13125 Berlin, Germany f. Institute of Clinical Chemistry and Laboratory Diagnostics, Jena University Hospital, Am Klinikum 1, D-07747, Jena, Germany. g. Department of Cardiology - Internal Medicine, Jena University Hospital, Am Klinikum 1, D-07747, Jena, Germany h. Mid-German Heart Center, Department of Internal Medicine III (KIM-III), Division of Cardiology, Angiology and Intensive Medical Care, University Hospital Halle, Martin-Luther-University Halle, Ernst-Grube-Strasse 40, D-06120 Halle (Saale), Germany i. InfectoGnostics Research Campus Jena, Centre of Applied Research, Philosophenweg 7, D-07743, Jena, Germany † J. Huang and A. Ramoji have equal contribution to this work. * Address correspondence: Core Units of Biophotonics, Centre for Sepsis Control and Care (CSCC), Jena University Hospital, Am Klinikum 1, D07747, Jena, Germany. E-mail: [email protected]
Content: Fig. S1: Mapping scheme of Raman measurement. Fig. S2: Bandwidth comparison of amide I in IgG from vibrational spectra Fig. S3: Mean spectra with standard deviation for different time points during IA treatment Fig. S4: Difference spectra between TP2 and other time points during IA treatment Fig. S5: Correlation of vibrational bands with IgG content Fig. S6: Variations of cardiac biomarkers responding to different IA time points Fig. S7: Anticardiac antibody concentrations as visualzed via FRET changes Fig. S8: Pairwise PCA and corresponding Raman difference spectra between sequential time points for plasma
samples Fig. S9: Pairwise PCA and corresponding Raman difference spectra between sequential time points for serum
samples Fig. S10: Pairwise PCA and corresponding FTIR difference spectra between sequential time points for plasma
samples Fig. S11: Pairwise PCA and corresponding FTIR difference spectra between sequential time points for serum
samples Table S1: Tentative assignment of Raman and IR bands based on literature Table S2: Identification of SVM classification model on single spectra level with combined treatment groups
Electronic Supplementary Material (ESI) for Analyst.This journal is © The Royal Society of Chemistry 2019
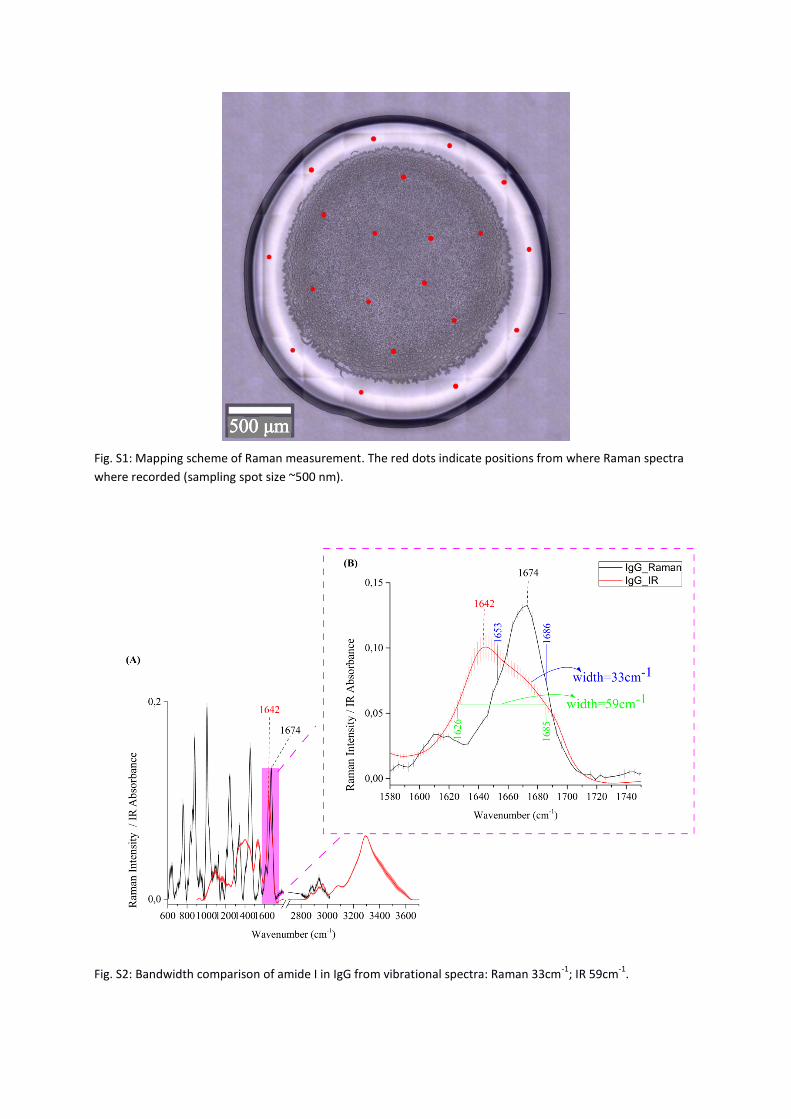
Fig. S1: Mapping scheme of Raman measurement. The red dots indicate positions from where Raman spectra
where recorded (sampling spot size ~500 nm).
Fig. S2: Bandwidth comparison of amide I in IgG from vibrational spectra: Raman 33cm-1
; IR 59cm-1
.
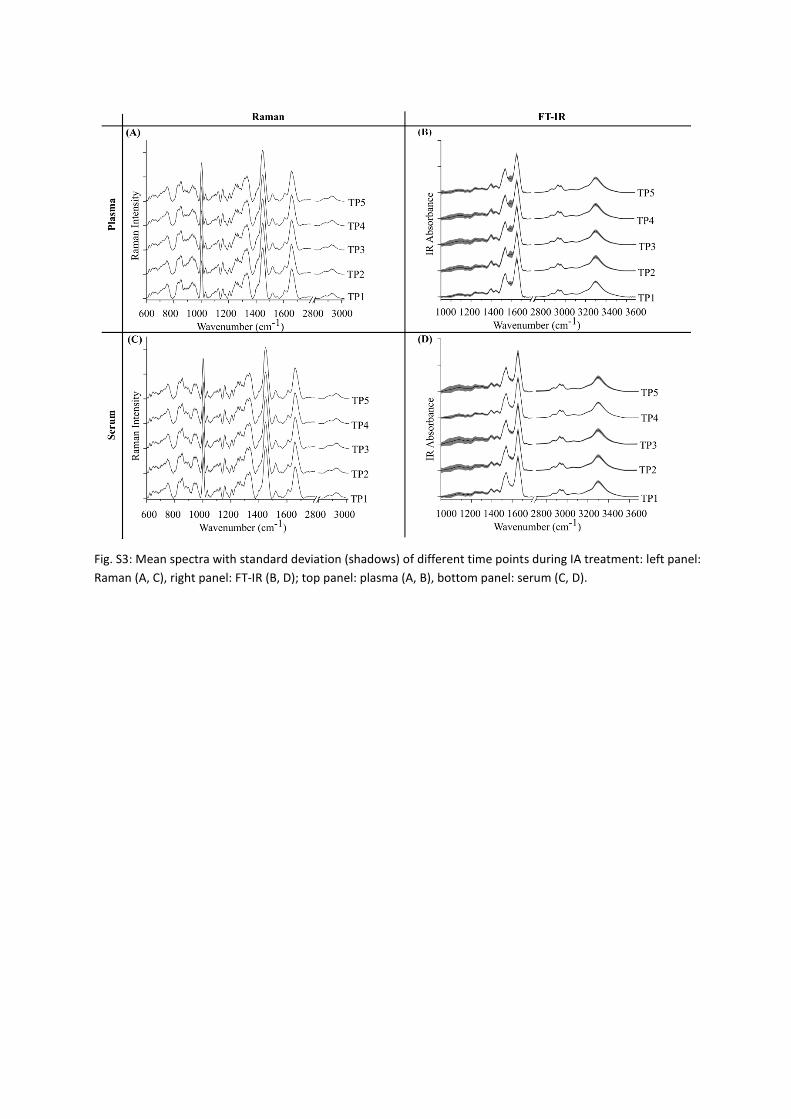
Fig. S3: Mean spectra with standard deviation (shadows) of different time points during IA treatment: left panel:
Raman (A, C), right panel: FT-IR (B, D); top panel: plasma (A, B), bottom panel: serum (C, D).
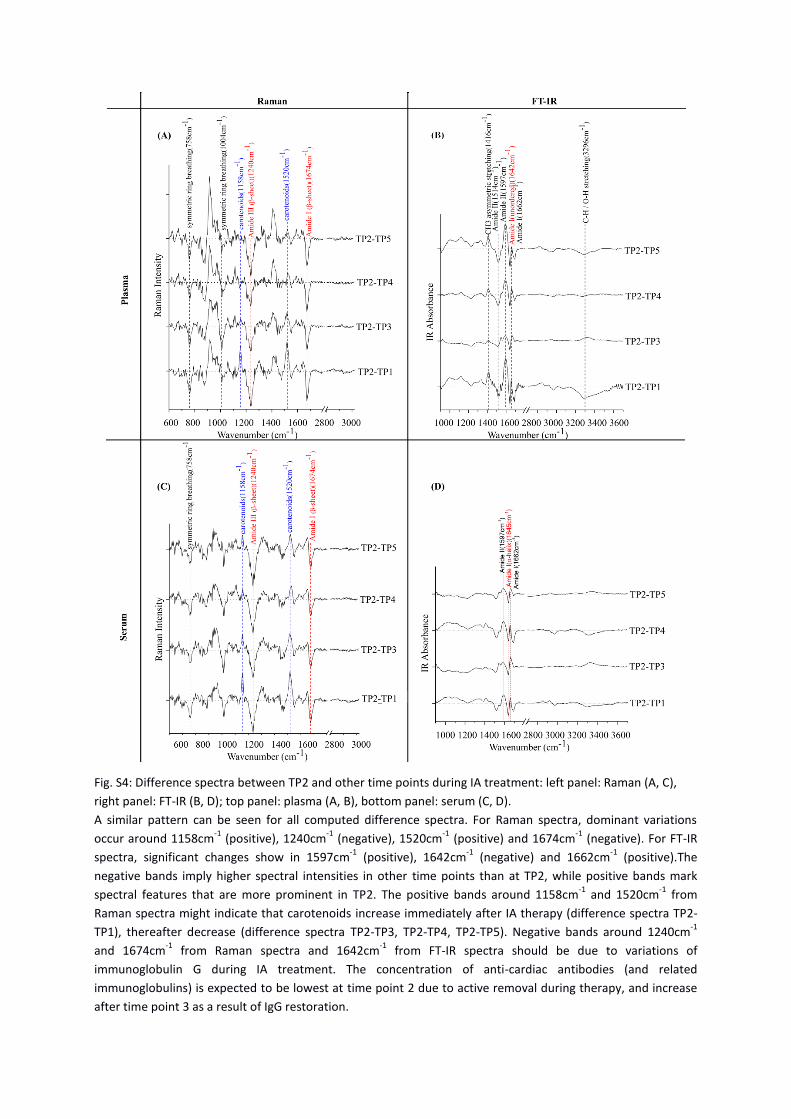
Fig. S4: Difference spectra between TP2 and other time points during IA treatment: left panel: Raman (A, C),
right panel: FT-IR (B, D); top panel: plasma (A, B), bottom panel: serum (C, D).
A similar pattern can be seen for all computed difference spectra. For Raman spectra, dominant variations
occur around 1158cm-1
(positive), 1240cm-1
(negative), 1520cm-1
(positive) and 1674cm-1
(negative). For FT-IR
spectra, significant changes show in 1597cm-1
(positive), 1642cm-1
(negative) and 1662cm-1
(positive).The
negative bands imply higher spectral intensities in other time points than at TP2, while positive bands mark
spectral features that are more prominent in TP2. The positive bands around 1158cm-1
and 1520cm-1
from
Raman spectra might indicate that carotenoids increase immediately after IA therapy (difference spectra TP2-
TP1), thereafter decrease (difference spectra TP2-TP3, TP2-TP4, TP2-TP5). Negative bands around 1240cm-1
and 1674cm-1
from Raman spectra and 1642cm-1
from FT-IR spectra should be due to variations of
immunoglobulin G during IA treatment. The concentration of anti-cardiac antibodies (and related
immunoglobulins) is expected to be lowest at time point 2 due to active removal during therapy, and increase
after time point 3 as a result of IgG restoration.
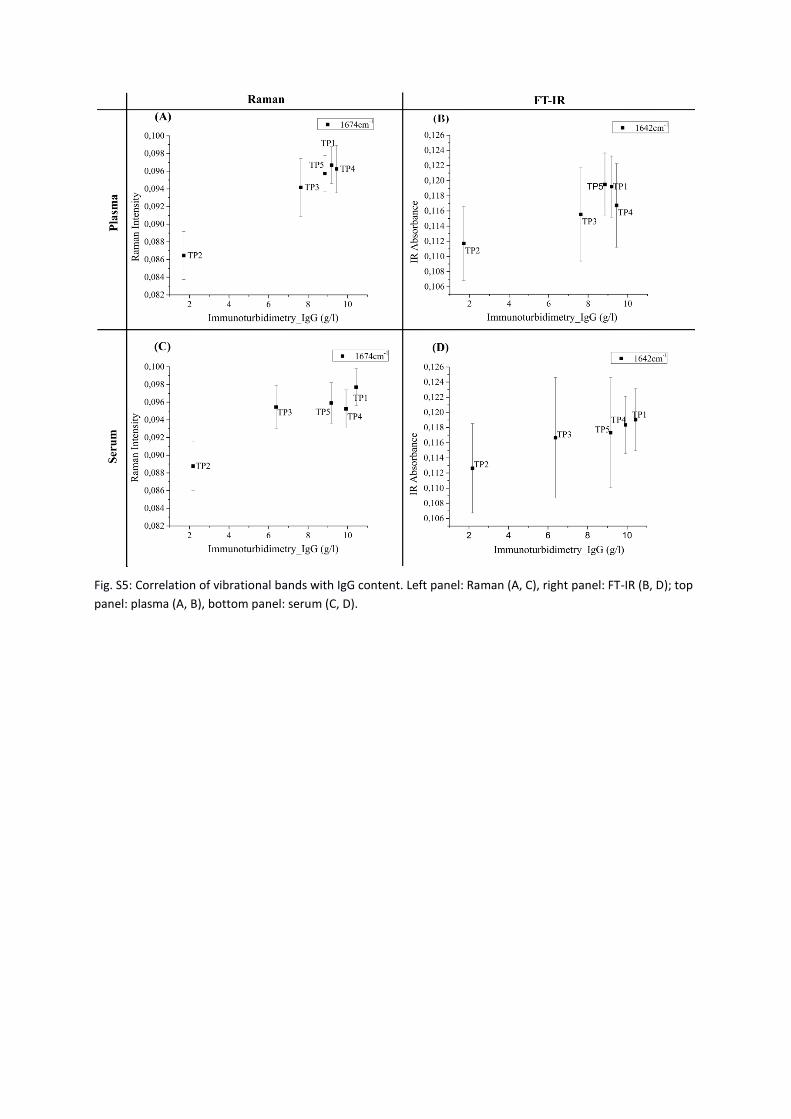
Fig. S5: Correlation of vibrational bands with IgG content. Left panel: Raman (A, C), right panel: FT-IR (B, D); top
panel: plasma (A, B), bottom panel: serum (C, D).
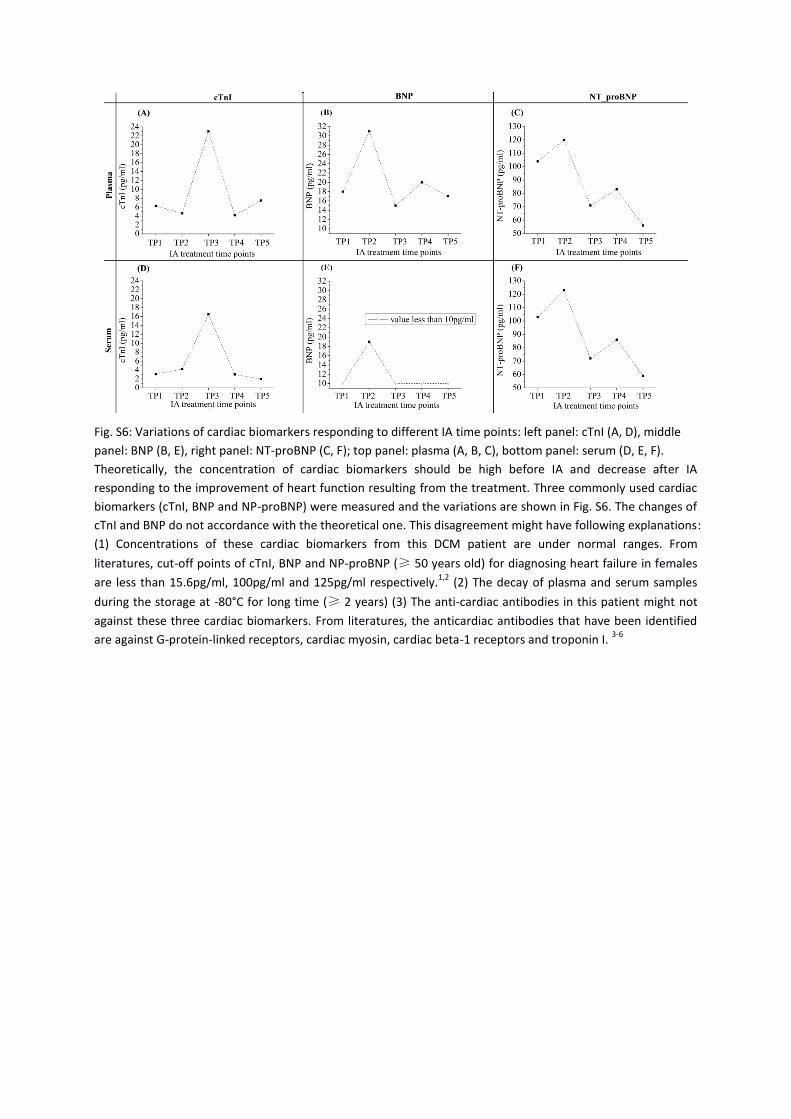
Fig. S6: Variations of cardiac biomarkers responding to different IA time points: left panel: cTnI (A, D), middle
panel: BNP (B, E), right panel: NT-proBNP (C, F); top panel: plasma (A, B, C), bottom panel: serum (D, E, F).
Theoretically, the concentration of cardiac biomarkers should be high before IA and decrease after IA
responding to the improvement of heart function resulting from the treatment. Three commonly used cardiac
biomarkers (cTnI, BNP and NP-proBNP) were measured and the variations are shown in Fig. S6. The changes of
cTnI and BNP do not accordance with the theoretical one. This disagreement might have following explanations:
(1) Concentrations of these cardiac biomarkers from this DCM patient are under normal ranges. From
literatures, cut-off points of cTnI, BNP and NP-proBNP (≥ 50 years old) for diagnosing heart failure in females
are less than 15.6pg/ml, 100pg/ml and 125pg/ml respectively.1,2
(2) The decay of plasma and serum samples
during the storage at -80°C for long time (≥ 2 years) (3) The anti-cardiac antibodies in this patient might not
against these three cardiac biomarkers. From literatures, the anticardiac antibodies that have been identified
are against G-protein-linked receptors, cardiac myosin, cardiac beta-1 receptors and troponin I. 3-6
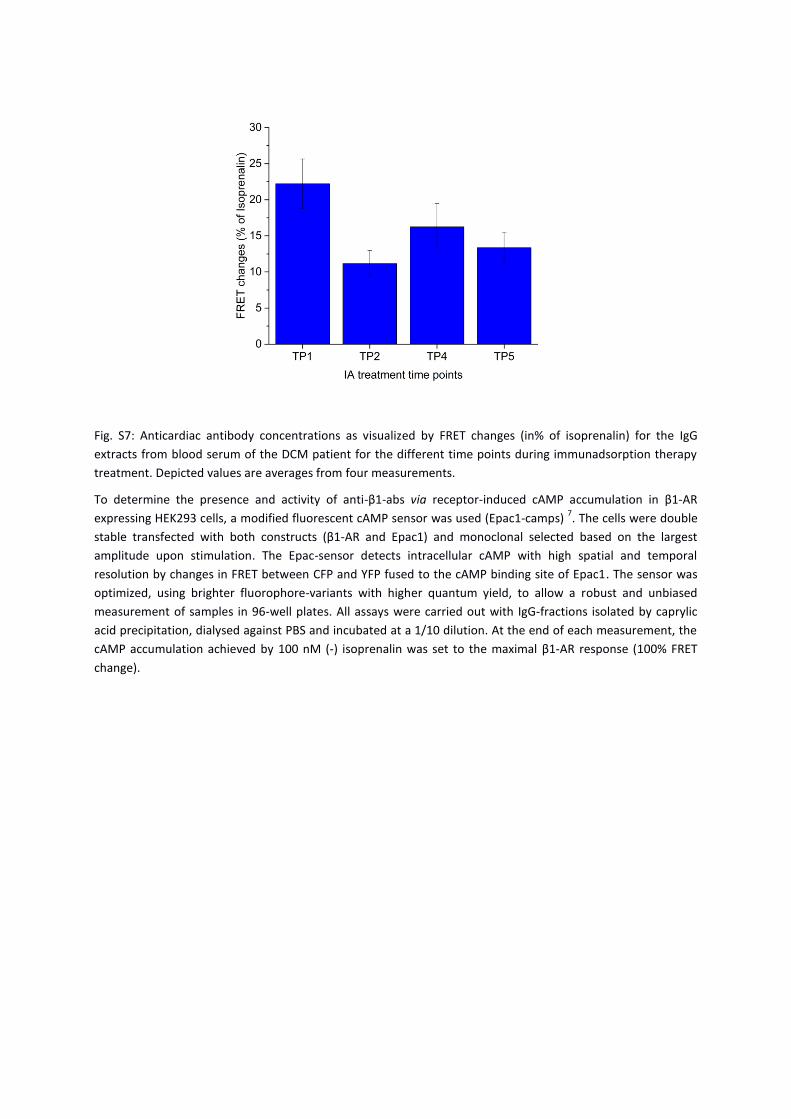
Fig. S7: Anticardiac antibody concentrations as visualized by FRET changes (in% of isoprenalin) for the IgG
extracts from blood serum of the DCM patient for the different time points during immunadsorption therapy
treatment. Depicted values are averages from four measurements.
To determine the presence and activity of anti-β1-abs via receptor-induced cAMP accumulation in β1-AR
expressing HEK293 cells, a modified fluorescent cAMP sensor was used (Epac1-camps) 7. The cells were double
stable transfected with both constructs (β1-AR and Epac1) and monoclonal selected based on the largest
amplitude upon stimulation. The Epac-sensor detects intracellular cAMP with high spatial and temporal
resolution by changes in FRET between CFP and YFP fused to the cAMP binding site of Epac1. The sensor was
optimized, using brighter fluorophore-variants with higher quantum yield, to allow a robust and unbiased
measurement of samples in 96-well plates. All assays were carried out with IgG-fractions isolated by caprylic
acid precipitation, dialysed against PBS and incubated at a 1/10 dilution. At the end of each measurement, the
cAMP accumulation achieved by 100 nM (-) isoprenalin was set to the maximal β1-AR response (100% FRET
change).
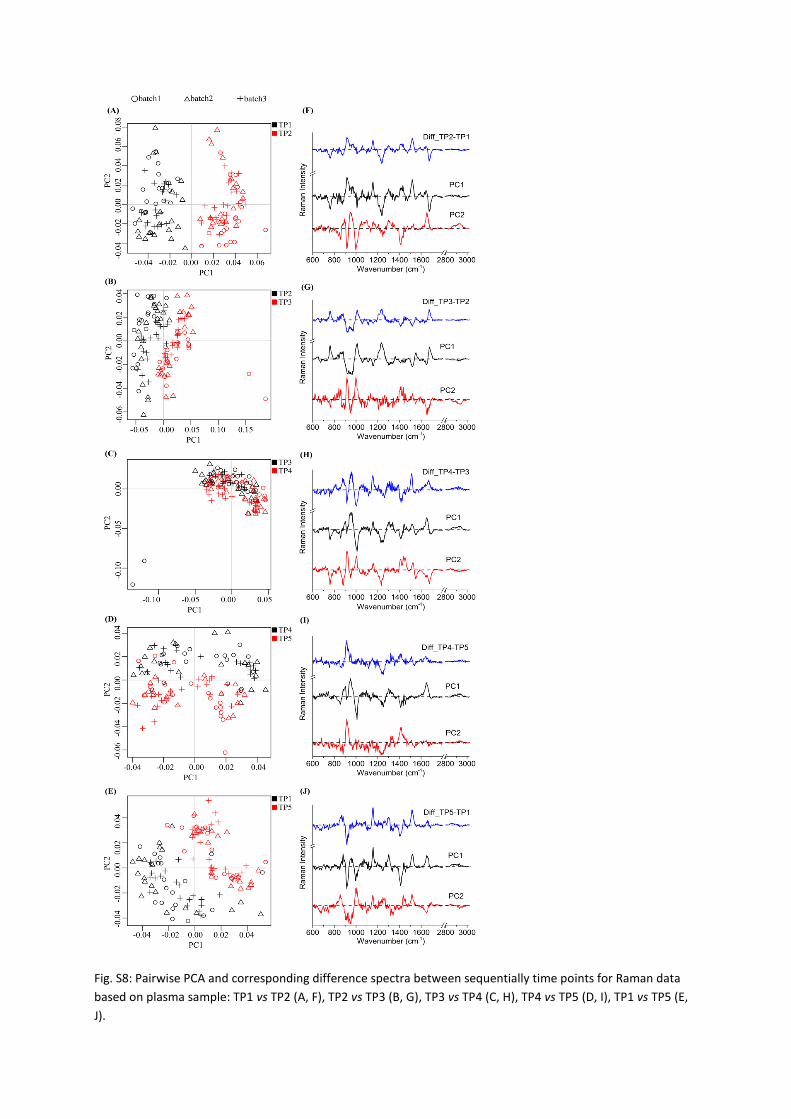
Fig. S8: Pairwise PCA and corresponding difference spectra between sequentially time points for Raman data
based on plasma sample: TP1 vs TP2 (A, F), TP2 vs TP3 (B, G), TP3 vs TP4 (C, H), TP4 vs TP5 (D, I), TP1 vs TP5 (E,
J).
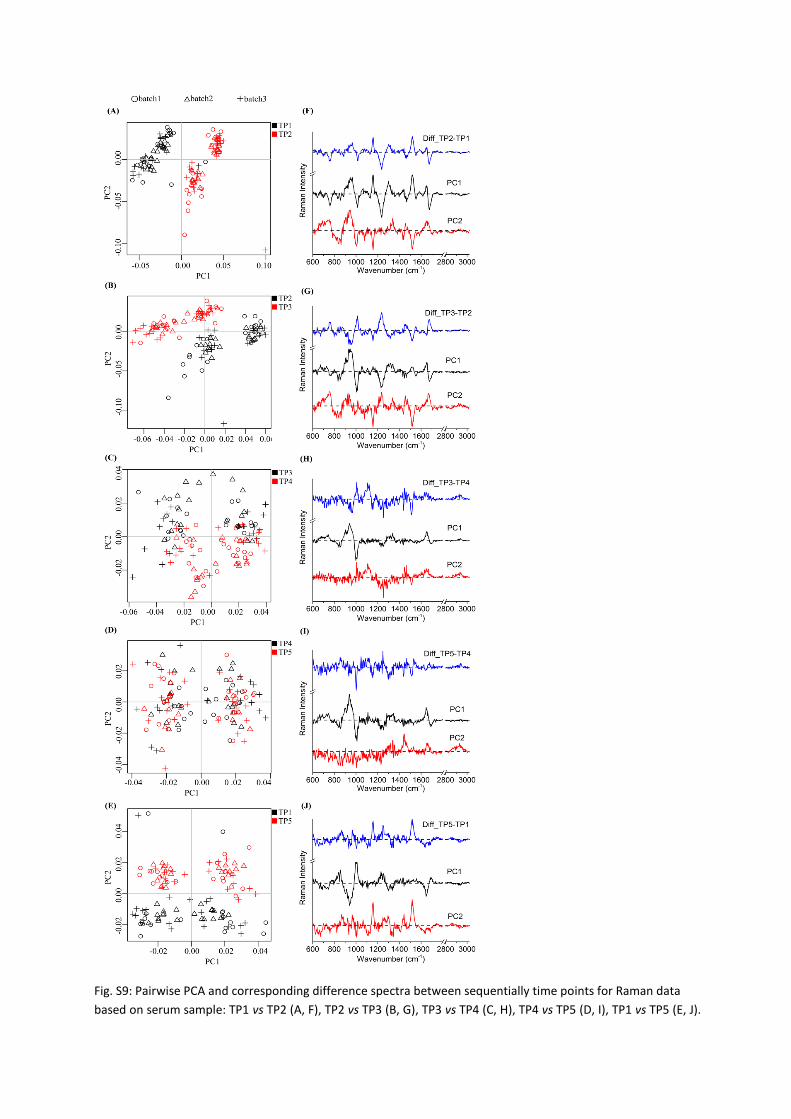
Fig. S9: Pairwise PCA and corresponding difference spectra between sequentially time points for Raman data
based on serum sample: TP1 vs TP2 (A, F), TP2 vs TP3 (B, G), TP3 vs TP4 (C, H), TP4 vs TP5 (D, I), TP1 vs TP5 (E, J).
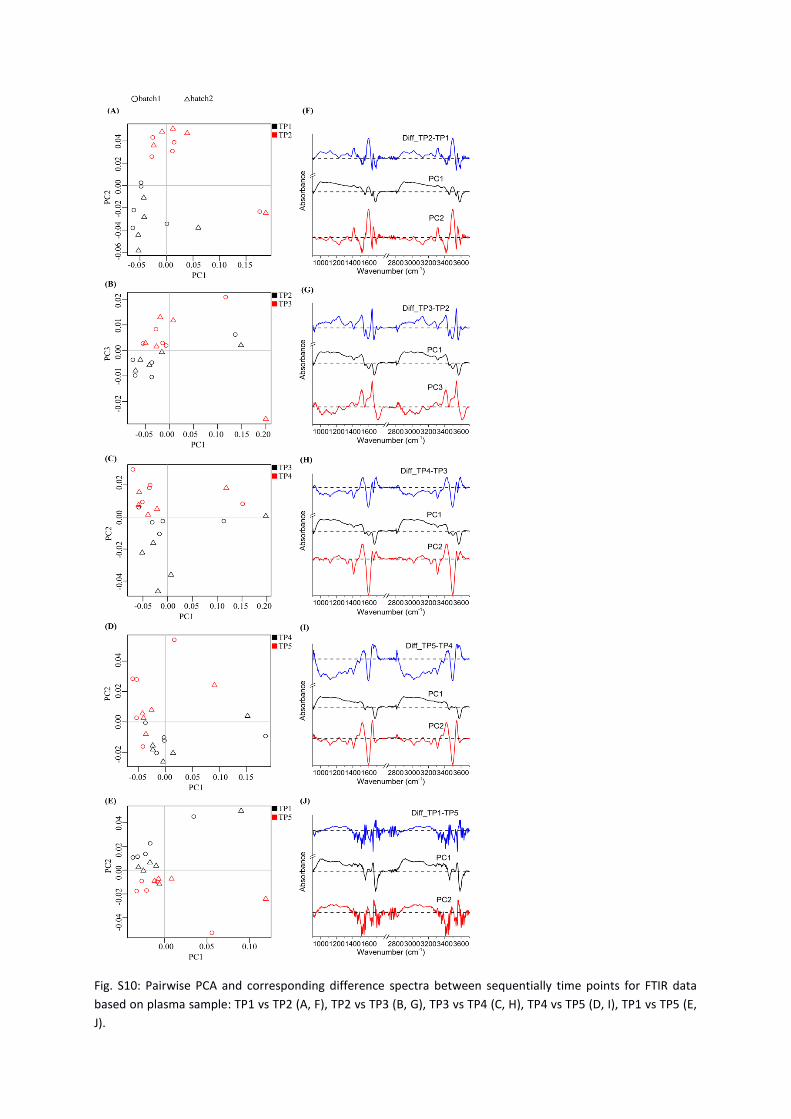
Fig. S10: Pairwise PCA and corresponding difference spectra between sequentially time points for FTIR data
based on plasma sample: TP1 vs TP2 (A, F), TP2 vs TP3 (B, G), TP3 vs TP4 (C, H), TP4 vs TP5 (D, I), TP1 vs TP5 (E,
J).
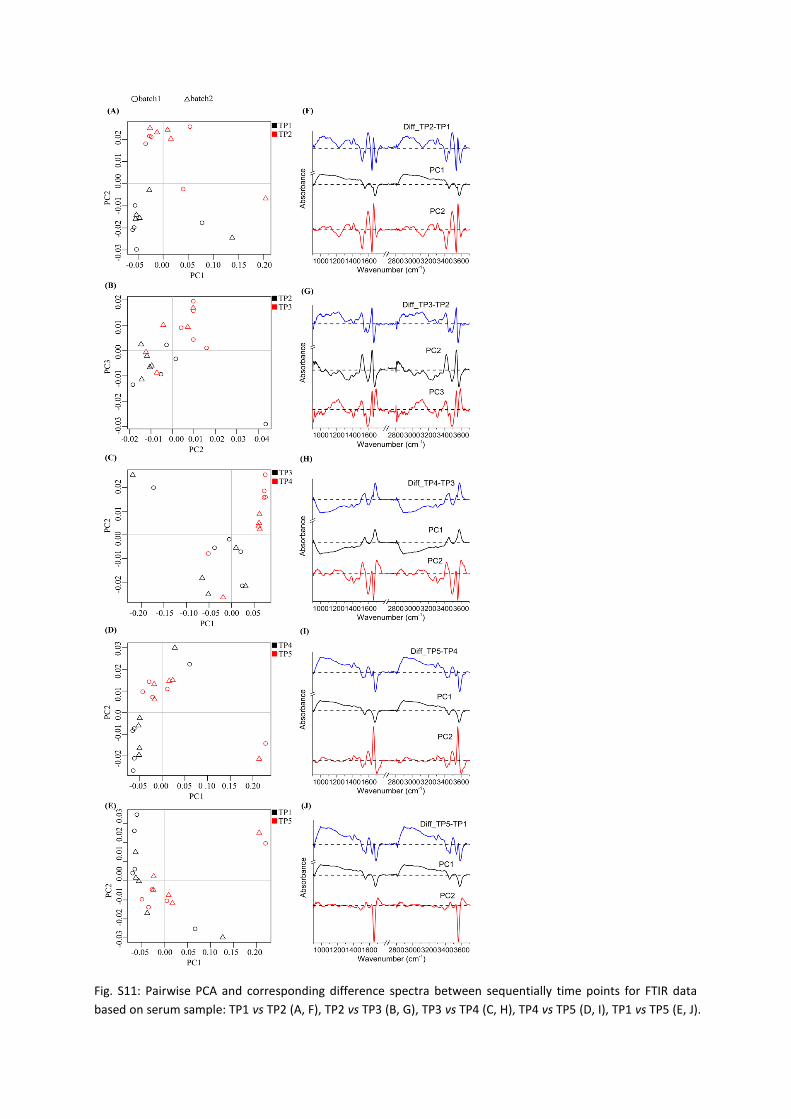
Fig. S11: Pairwise PCA and corresponding difference spectra between sequentially time points for FTIR data
based on serum sample: TP1 vs TP2 (A, F), TP2 vs TP3 (B, G), TP3 vs TP4 (C, H), TP4 vs TP5 (D, I), TP1 vs TP5 (E, J).
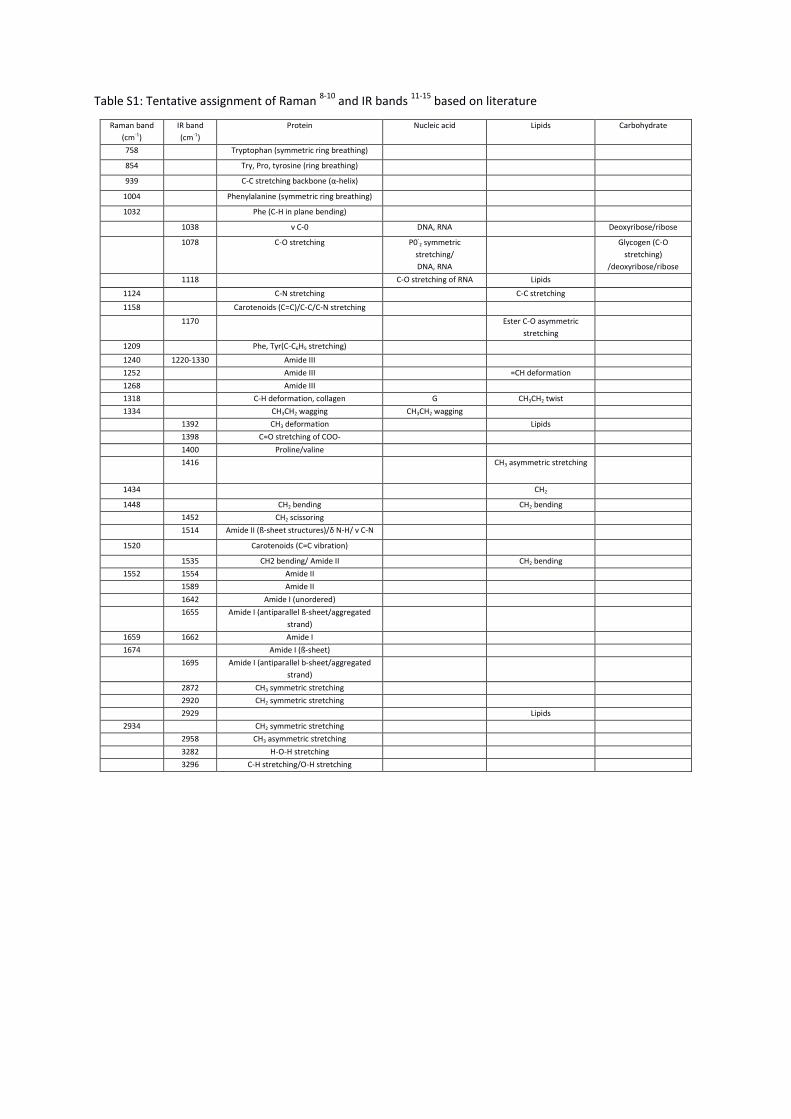
Table S1: Tentative assignment of Raman 8-10
and IR bands 11-15
based on literature
Raman band
(cm-1)
IR band
(cm-1)
Protein Nucleic acid Lipids Carbohydrate
758 Tryptophan (symmetric ring breathing)
854 Try, Pro, tyrosine (ring breathing)
939 C-C stretching backbone (α-helix)
1004 Phenylalanine (symmetric ring breathing)
1032 Phe (C-H in plane bending)
1038 ν C-0 DNA, RNA Deoxyribose/ribose
1078 C-O stretching P0-2 symmetric
stretching/
DNA, RNA
Glycogen (C-O
stretching)
/deoxyribose/ribose
1118 C-O stretching of RNA Lipids
1124 C-N stretching C-C stretching
1158 Carotenoids (C=C)/C-C/C-N stretching
1170 Ester C-O asymmetric
stretching
1209 Phe, Tyr(C-C6H5 stretching)
1240 1220-1330 Amide III
1252 Amide III =CH deformation
1268 Amide III
1318 C-H deformation, collagen G CH3CH2 twist
1334 CH3CH2 wagging CH3CH2 wagging
1392 CH3 deformation Lipids
1398 C=O stretching of COO-
1400 Proline/valine
1416 CH3 asymmetric stretching
1434 CH2
1448 CH2 bending CH2 bending
1452 CH2 scissoring
1514 Amide II (ß-sheet structures)/δ N-H/ ν C-N
1520 Carotenoids (C=C vibration)
1535 CH2 bending/ Amide II CH2 bending
1552 1554 Amide II
1589 Amide II
1642 Amide I (unordered)
1655 Amide I (antiparallel ß-sheet/aggregated
strand)
1659 1662 Amide I
1674 Amide I (ß-sheet)
1695 Amide I (antiparallel b-sheet/aggregated
strand)
2872 CH3 symmetric stretching
2920 CH2 symmetric stretching
2929 Lipids
2934 CH2 symmetric stretching
2958 CH3 asymmetric stretching
3282 H-O-H stretching
3296 C-H stretching/O-H stretching
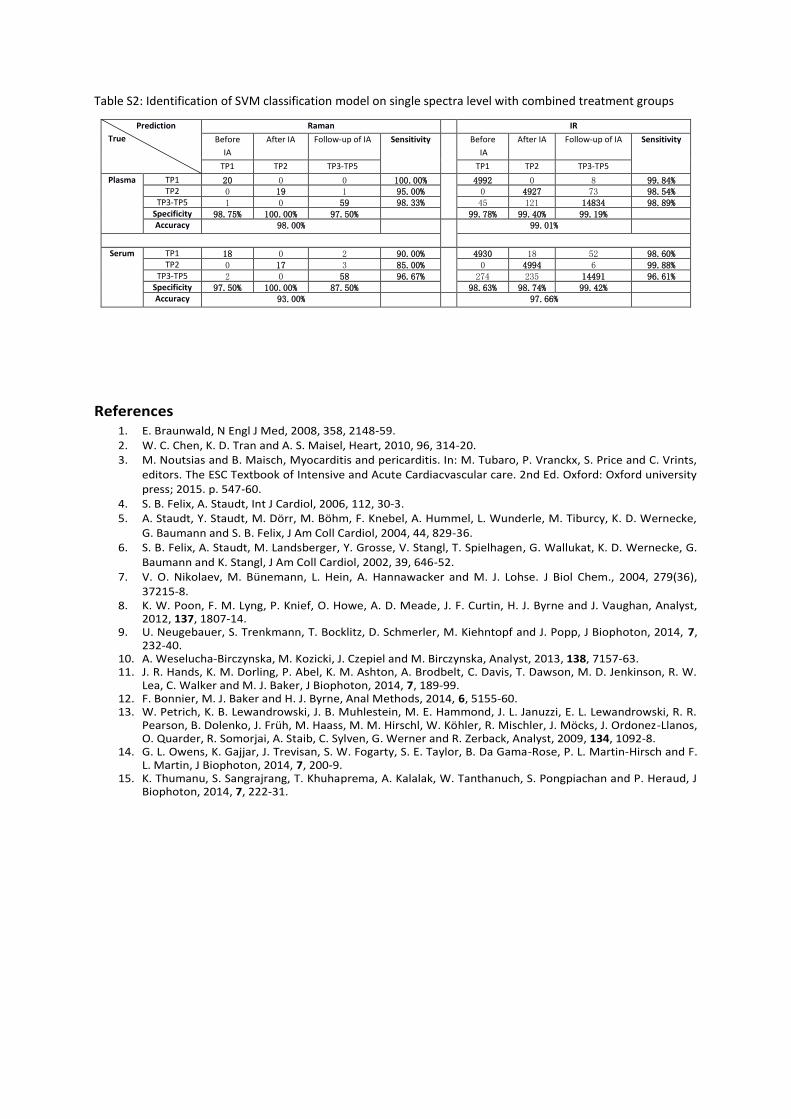
Table S2: Identification of SVM classification model on single spectra level with combined treatment groups
Prediction
True
Raman IR
Before
IA
After IA Follow-up of IA Sensitivity
Before
IA
After IA Follow-up of IA Sensitivity
TP1 TP2 TP3-TP5 TP1 TP2 TP3-TP5
Plasma TP1 20 0 0 100.00% 4992 0 8 99.84% TP2 0 19 1 95.00% 0 4927 73 98.54%
TP3-TP5 1 0 59 98.33% 45 121 14834 98.89% Specificity 98.75% 100.00% 97.50% 99.78% 99.40% 99.19% Accuracy 98.00% 99.01%
Serum TP1 18 0 2 90.00% 4930 18 52 98.60% TP2 0 17 3 85.00% 0 4994 6 99.88%
TP3-TP5 2 0 58 96.67% 274 235 14491 96.61% Specificity 97.50% 100.00% 87.50% 98.63% 98.74% 99.42% Accuracy 93.00% 97.66%
References 1. E. Braunwald, N Engl J Med, 2008, 358, 2148-59. 2. W. C. Chen, K. D. Tran and A. S. Maisel, Heart, 2010, 96, 314-20. 3. M. Noutsias and B. Maisch, Myocarditis and pericarditis. In: M. Tubaro, P. Vranckx, S. Price and C. Vrints,
editors. The ESC Textbook of Intensive and Acute Cardiacvascular care. 2nd Ed. Oxford: Oxford university press; 2015. p. 547-60.
4. S. B. Felix, A. Staudt, Int J Cardiol, 2006, 112, 30-3. 5. A. Staudt, Y. Staudt, M. Dörr, M. Böhm, F. Knebel, A. Hummel, L. Wunderle, M. Tiburcy, K. D. Wernecke,
G. Baumann and S. B. Felix, J Am Coll Cardiol, 2004, 44, 829-36. 6. S. B. Felix, A. Staudt, M. Landsberger, Y. Grosse, V. Stangl, T. Spielhagen, G. Wallukat, K. D. Wernecke, G.
Baumann and K. Stangl, J Am Coll Cardiol, 2002, 39, 646-52. 7. V. O. Nikolaev, M. Bünemann, L. Hein, A. Hannawacker and M. J. Lohse. J Biol Chem., 2004, 279(36),
37215-8. 8. K. W. Poon, F. M. Lyng, P. Knief, O. Howe, A. D. Meade, J. F. Curtin, H. J. Byrne and J. Vaughan, Analyst,
2012, 137, 1807-14. 9. U. Neugebauer, S. Trenkmann, T. Bocklitz, D. Schmerler, M. Kiehntopf and J. Popp, J Biophoton, 2014, 7,
232-40. 10. A. Weselucha-Birczynska, M. Kozicki, J. Czepiel and M. Birczynska, Analyst, 2013, 138, 7157-63. 11. J. R. Hands, K. M. Dorling, P. Abel, K. M. Ashton, A. Brodbelt, C. Davis, T. Dawson, M. D. Jenkinson, R. W.
Lea, C. Walker and M. J. Baker, J Biophoton, 2014, 7, 189-99. 12. F. Bonnier, M. J. Baker and H. J. Byrne, Anal Methods, 2014, 6, 5155-60. 13. W. Petrich, K. B. Lewandrowski, J. B. Muhlestein, M. E. Hammond, J. L. Januzzi, E. L. Lewandrowski, R. R.
Pearson, B. Dolenko, J. Früh, M. Haass, M. M. Hirschl, W. Köhler, R. Mischler, J. Möcks, J. Ordonez-Llanos, O. Quarder, R. Somorjai, A. Staib, C. Sylven, G. Werner and R. Zerback, Analyst, 2009, 134, 1092-8.
14. G. L. Owens, K. Gajjar, J. Trevisan, S. W. Fogarty, S. E. Taylor, B. Da Gama-Rose, P. L. Martin-Hirsch and F. L. Martin, J Biophoton, 2014, 7, 200-9.
15. K. Thumanu, S. Sangrajrang, T. Khuhaprema, A. Kalalak, W. Tanthanuch, S. Pongpiachan and P. Heraud, J Biophoton, 2014, 7, 222-31.