Embed Size (px)
Citation preview

Vibrational spectroscopy
• Chemical composition: finger print• Bonding orientation: adsorption structure on surfaces
Infrared Spectroscopy (IR)
High Resolution Electron Energy Loss Spectroscopy (HREELS)
Surface Enhanced Raman Spectroscopy (SERS)
Second Harmonic Generation (SHG)
Photo-acoustic Spectroscopy (PAS)
Inelastic electron tunneling Spectroscopy (IETS)
Inelastic Neutron Scattering (INS)
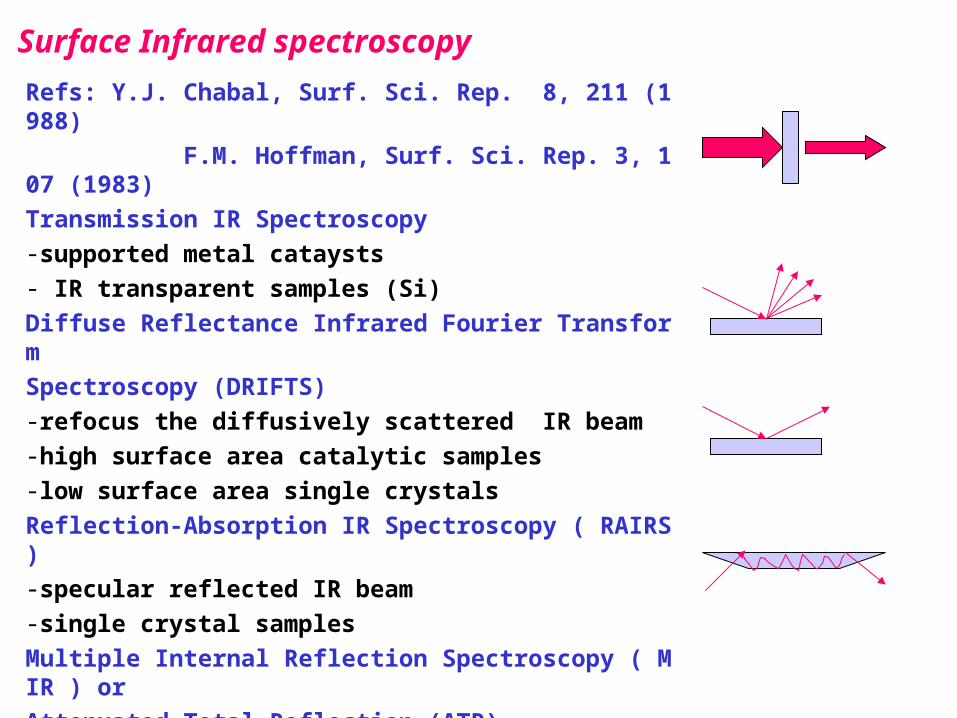
Surface Infrared spectroscopy
Refs: Y.J. Chabal, Surf. Sci. Rep. 8, 211 (1988)
F.M. Hoffman, Surf. Sci. Rep. 3, 107 (1983)
Transmission IR Spectroscopy
-supported metal cataysts
- IR transparent samples (Si)
Diffuse Reflectance Infrared Fourier Transform
Spectroscopy (DRIFTS)
-refocus the diffusively scattered IR beam
-high surface area catalytic samples
-low surface area single crystals
Reflection-Absorption IR Spectroscopy ( RAIRS )
-specular reflected IR beam
-single crystal samples
Multiple Internal Reflection Spectroscopy ( MIR ) or
Attenuated Total Reflection (ATR)
-total internal reflection
-SAM , polymer films

Background
Transmission and absorption mode
Transmittance T = I/I0 = exp(kcl)
Absorbance A = cl
k: absorption coefficient; : absorptivity
c : concentration; l : cell thickness
Imaginary part of refractive index n = k
n = n + ik for absorbing medium
n = n for dielectric non-absorbing medium
-needs to take reference and sample spectra
-not popular for surface studies due to the large bulk contribution
-
I0
I-+

Reflection
The reflection angles
Snell’s law
n1/n2 = sini/sint
Crtical angle: c= sin-1(n2/n1)
Intenstiy of the reflected light
- Depend on polarizations
Fresnel’s equations
n = n + ik
s-polarized light : || the plane of incidence
Rs = [(n-sec)2+k2]/ [(n+sec)2+k2]
p-polarized light : ㅗ the plane of incidence
Rp = [(n-cos)2+k2]/ [(n+cos)2+k2]
- i must be large: grazing incidence for thin fi
lms on reflective surface
Ep
xEs
i r
t
x
the plane of incidence

Phase shift , electric field, intensity of p-polarized light as a function of incidence angle from a metal surface
0 incidence angle 90
Ph
ase shift o
n refelctio
ns
0
p-pol||
s-pol ㅗ
0 incidence angle 90
Su
rface inten
sity fu
nctio
n
(E/E
o)2sec
n =3, k=30
20
40
60
Su
rface electric field
E/E
0
s-polarized light at the surface - uniform phase shift - vanishing E field at the surfacep-polarized light at the surface - dependent on incidence angle - strong E field at large incidence angle, ie, grazing incidence
Absorbance is proportional to
E2 and area of surface as 1/cos I ~ E2/cos
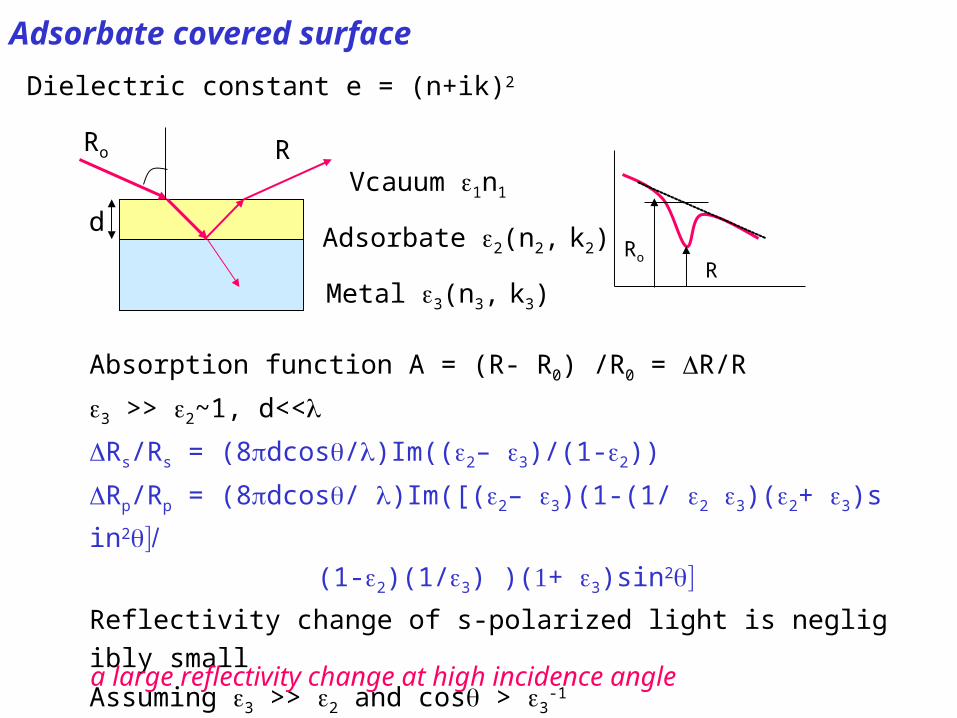
Adsorbate covered surface
Dielectric constant e = (n+ik)2
Vcauum 1n1
Adsorbate 2(n2, k2)
Metal 3(n3, k3)
Ro R
RRo
Absorption function A = (R- R0) /R0 = R/R
3 >> 2~1, d<<
Rs/Rs = (8dcos/)Im((2– 3)/(1-2))
Rp/Rp = (8dcos/ )Im([(2– 3)(1-(1/ 2 3)(2+ 3)sin2
(1-2)(1/3) )(+ 3)sin2
Reflectivity change of s-polarized light is negligibly small
Assuming 3 >> 2 and cos > 3-1
Rp/Rp = (8dsin2/lcos)Im(-1/2)a large reflectivity change at high incidence angle
d
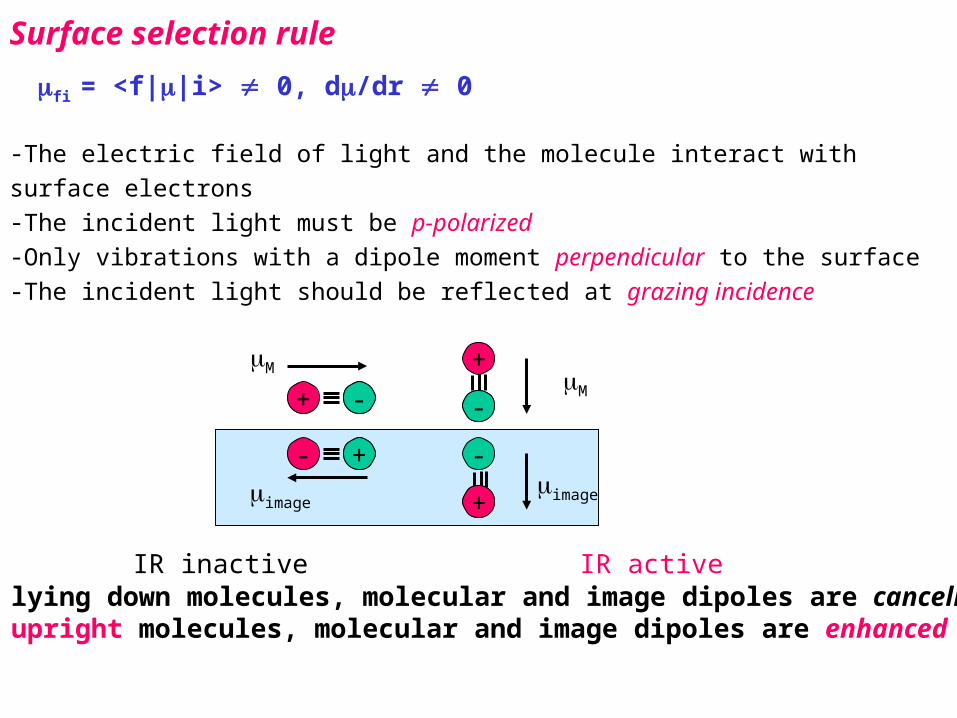
Surface selection rule
-The electric field of light and the molecule interact with surface electrons-The incident light must be p-polarized-Only vibrations with a dipole moment perpendicular to the surface-The incident light should be reflected at grazing incidence
+ -
- +
+
-
-
+
M M
imageimage
IR inactive IR active
fi = <f||i> 0, d/dr 0
- for lying down molecules, molecular and image dipoles are cancelled out- for upright molecules, molecular and image dipoles are enhanced
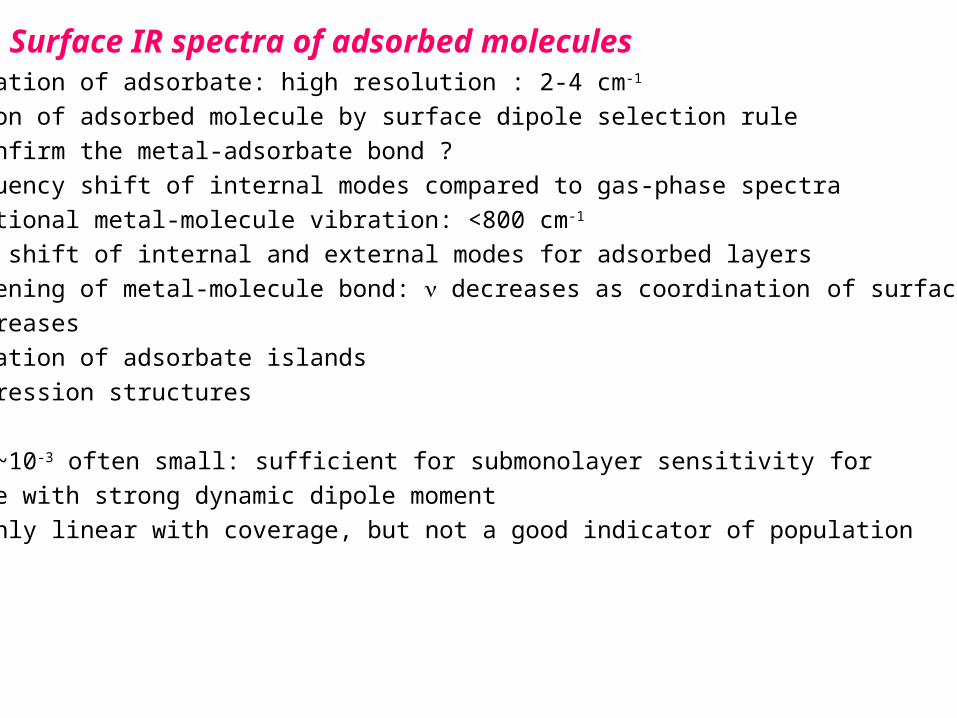
Surface IR spectra of adsorbed moleculesIdentification of adsorbate: high resolution : 2-4 cm-1
Orientation of adsorbed molecule by surface dipole selection rule
How to confirm the metal-adsorbate bond ?
- frequency shift of internal modes compared to gas-phase spectra
- additional metal-molecule vibration: <800 cm-1
Frequency shift of internal and external modes for adsorbed layers
- weakening of metal-molecule bond: decreases as coordination of surface atoms
increases
- formation of adsorbate islands
- compression structures
R/R: 0.1~10-3 often small: sufficient for submonolayer sensitivity for
molecule with strong dynamic dipole moment
R/R roughly linear with coverage, but not a good indicator of population

Peak width and intensity
homogeneous broadening
- coupling to phonon
- electron-hole creation
inhomogeneous broadening
- inhomogeneous distribution of harmonic oscillator
- intermolecular interaction
energy transport between molecule and surface
dipole-surface interaction: dynamic dipole interaction

Instrumentation: RAIRS
J.E. Reutt-Robey et al, JCP 93, 9113 (1990)
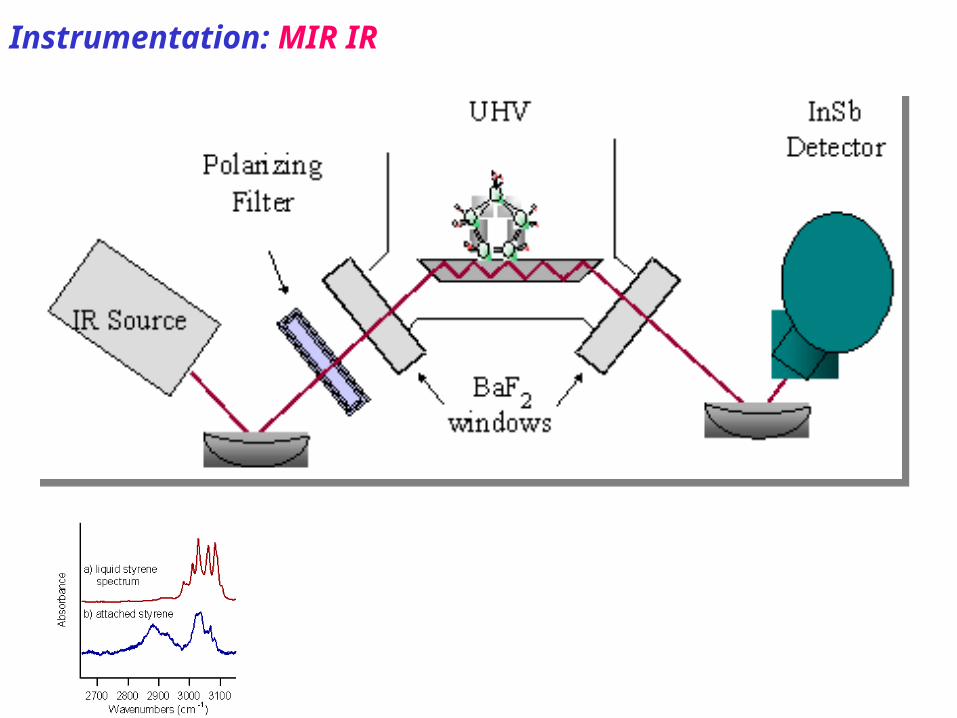
Instrumentation: MIR IR
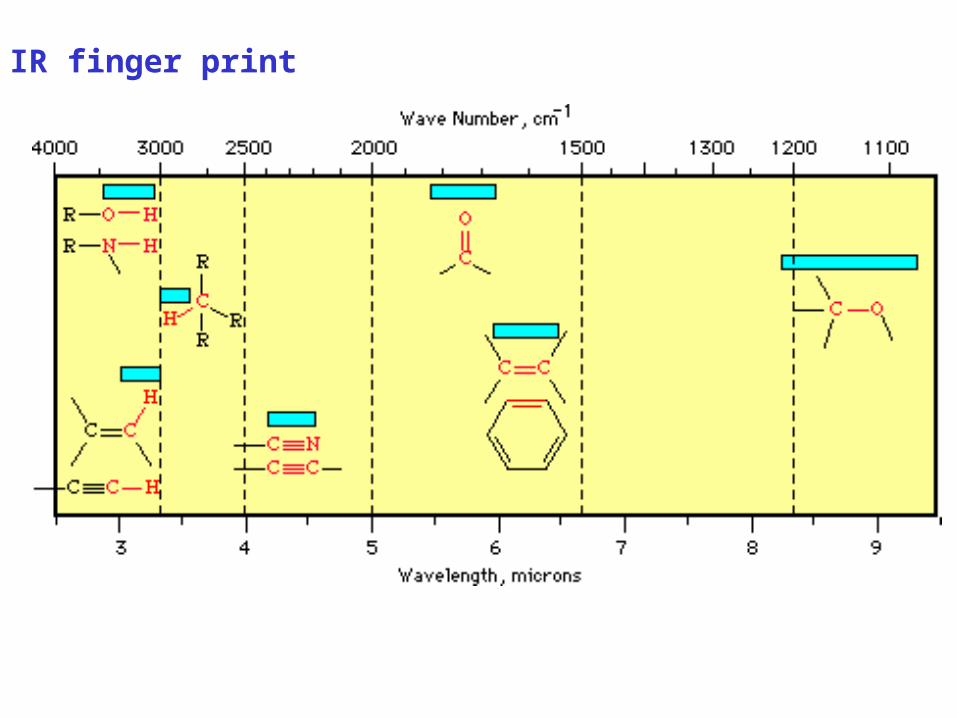
IR finger print
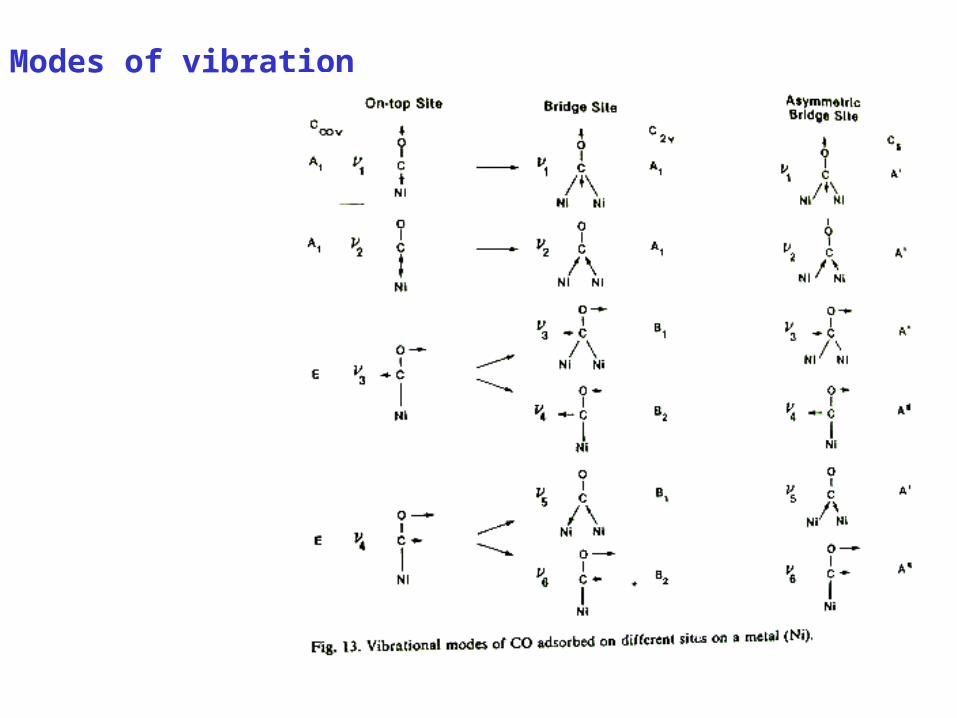
Modes of vibration
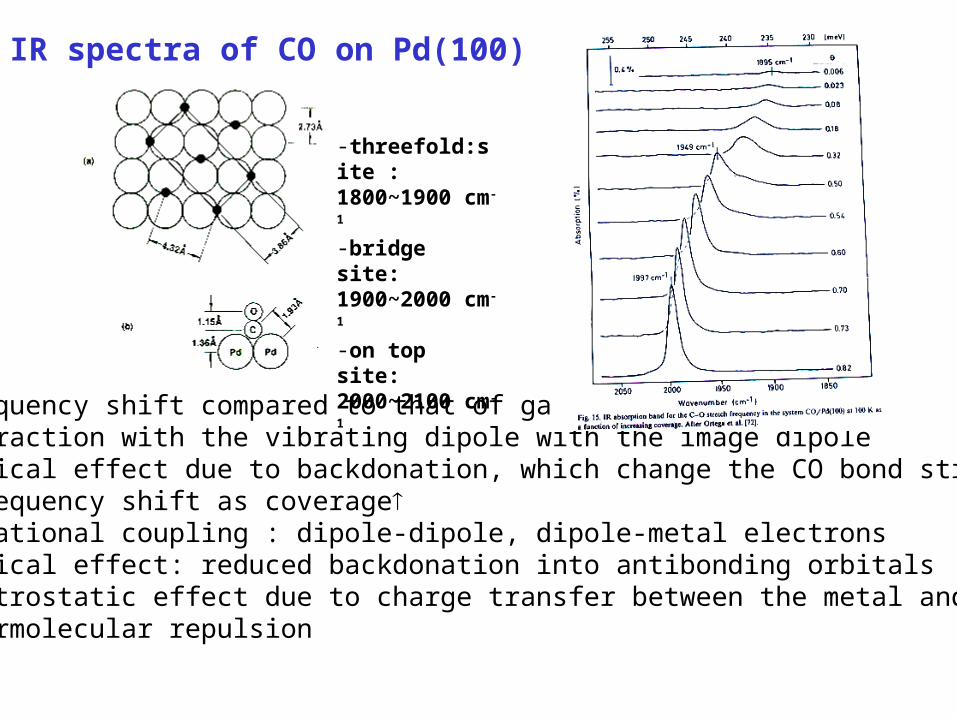
IR spectra of CO on Pd(100)
Lower frequency shift compared to that of gas phase ? - Interaction with the vibrating dipole with the image dipole\ - Chemical effect due to backdonation, which change the CO bond strengthHigher frequency shift as coverage - vibrational coupling : dipole-dipole, dipole-metal electrons - chemical effect: reduced backdonation into antibonding orbitals - electrostatic effect due to charge transfer between the metal and moelcule - intermolecular repulsion
-threefold:site : 1800~1900 cm-1
-bridge site: 1900~2000 cm-1
-on top site: 2000~2100 cm-1
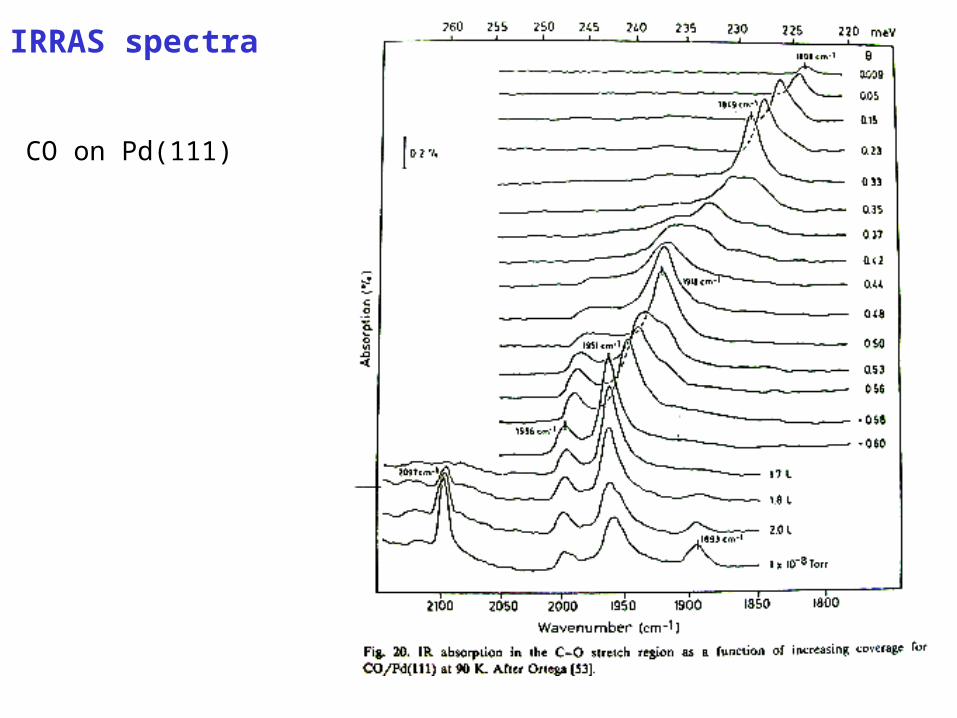
IRRAS spectra
CO on Pd(111)

Diffuse reflectance IR spectra
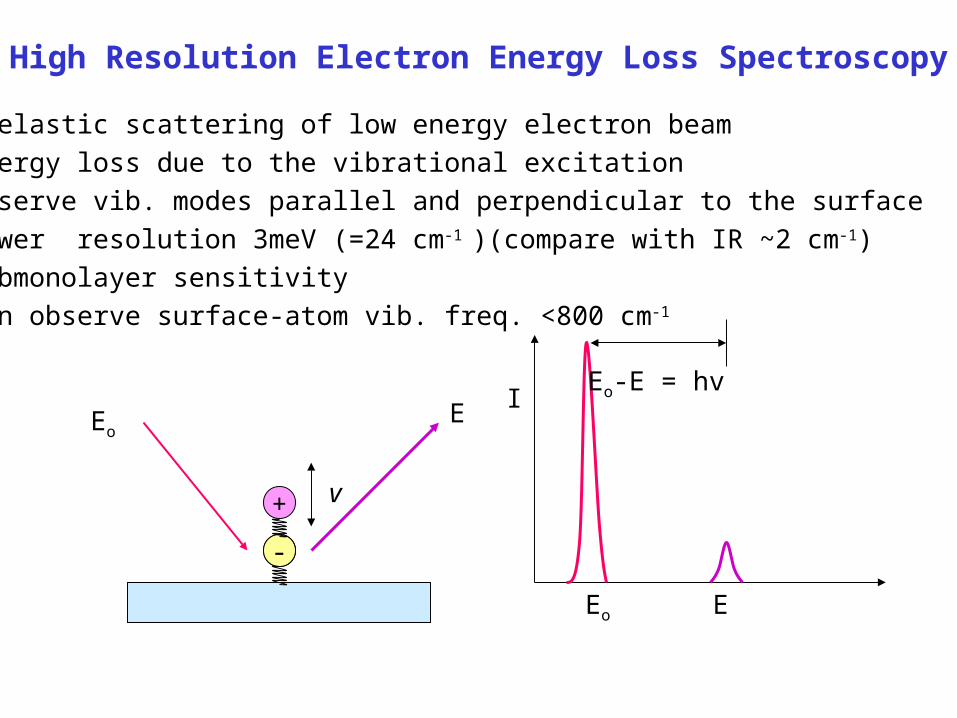
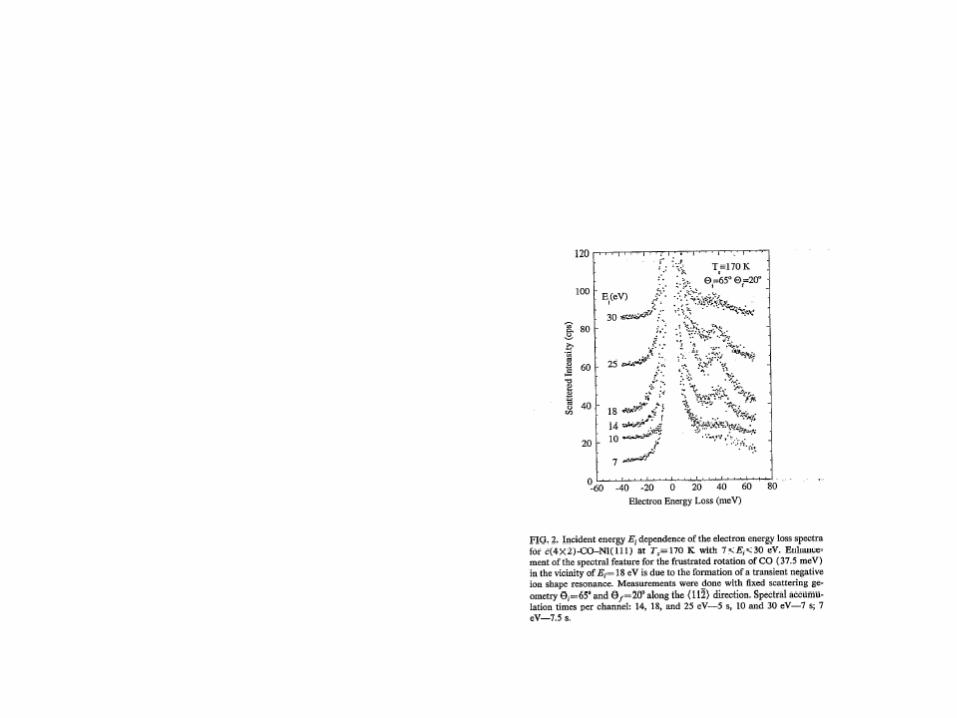
High Resolution Electron Energy Loss Spectroscopy
- Inelastic scattering of low energy electron beam- Energy loss due to the vibrational excitation - observe vib. modes parallel and perpendicular to the surface- Lower resolution 3meV (=24 cm-1 )(compare with IR ~2 cm-1) - Submonolayer sensitivity- can observe surface-atom vib. freq. <800 cm-1
+
-
EoE
Eo E
Eo-E = hvI
v

Scattering mechanism Dipole scatteringImpact scatteringResonance scatteringDipole scattering
- electrons interact with the long range field at surface- electron momentum perpendicular to the surface normal is condserved- forward scattering by adsorbate- peaked in the specular position elastic electrons: specular inelastic electrons: near specular- vibration perpendicular to the surface normal can be excited- larger cross section for smaller Eo(~5 eV)
EoE
g||
ki kf
||
ㅗ
g ||
ㅗki
+ -
- +
+
-
-
+
M M
imageimage
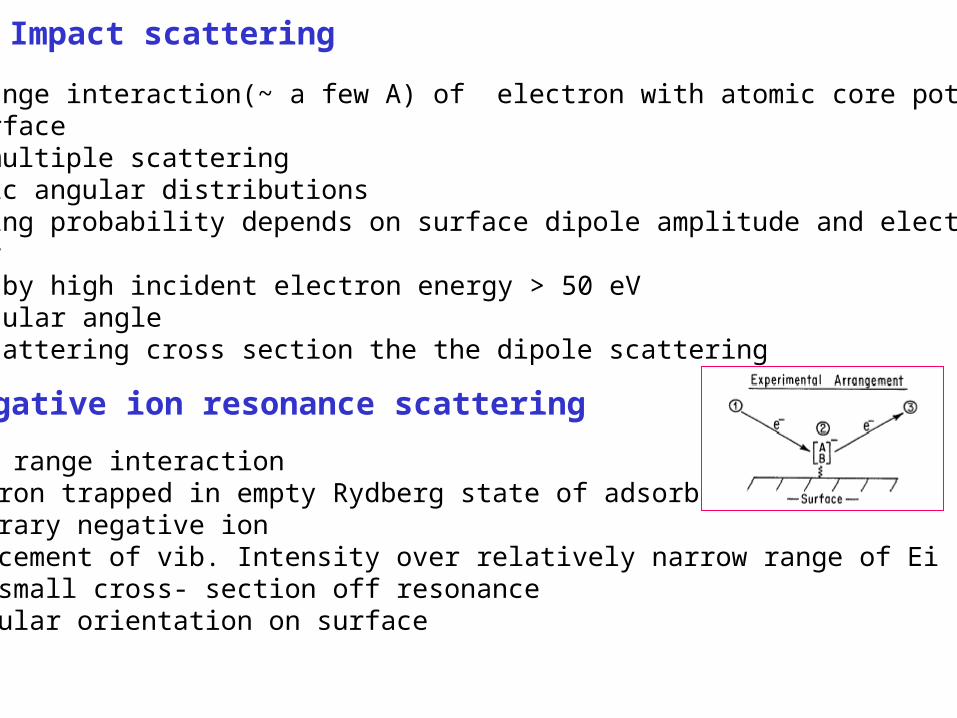
Impact scattering
- short range interaction(~ a few A) of electron with atomic core potential of surface- strong multiple scattering- Isotropic angular distributions- scattering probability depends on surface dipole amplitude and electron energy- favored by high incident electron energy > 50 eV- off specular angle- lower scattering cross section the the dipole scattering
Negative ion resonance scattering
- short range interaction- electron trapped in empty Rydberg state of adsorbate- temporary negative ion- enhancement of vib. Intensity over relatively narrow range of Ei- very small cross- section off resonance- molecular orientation on surface
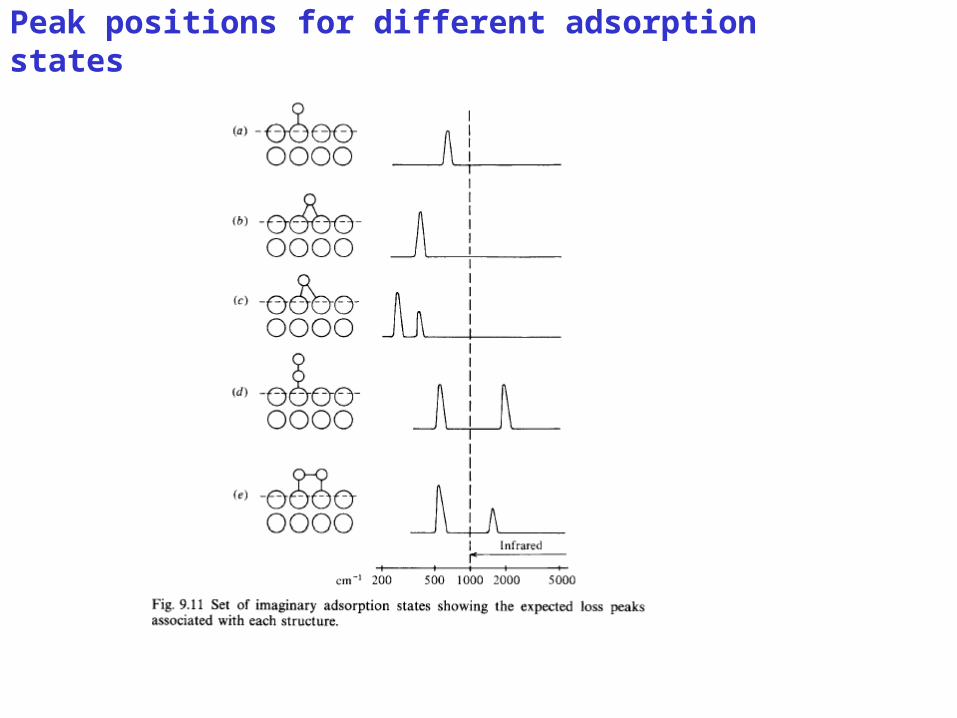
Peak positions for different adsorption states
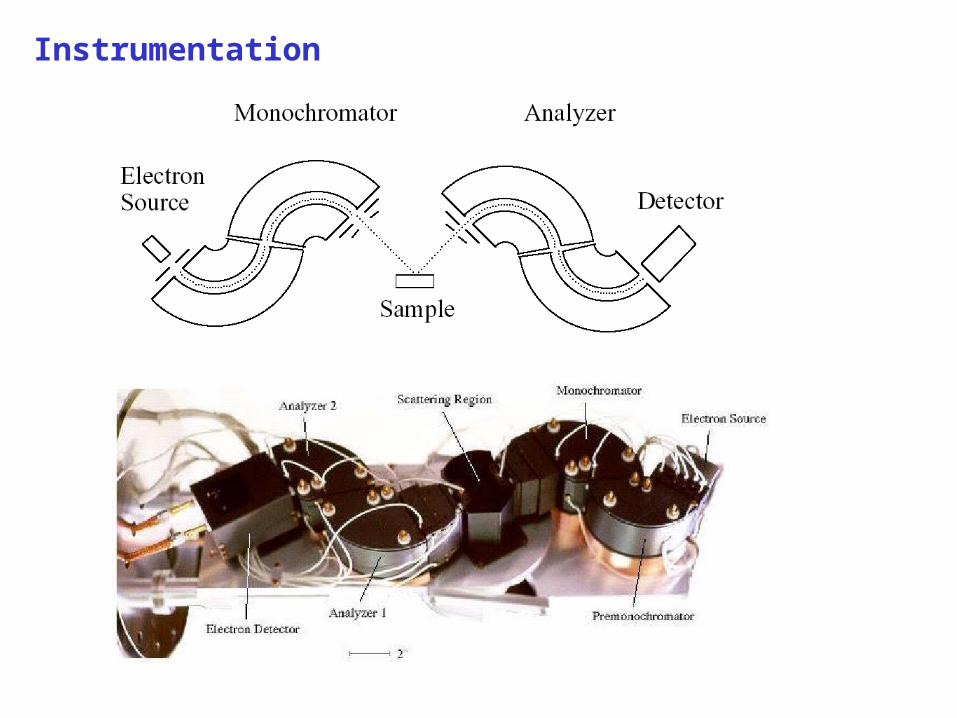
Instrumentation
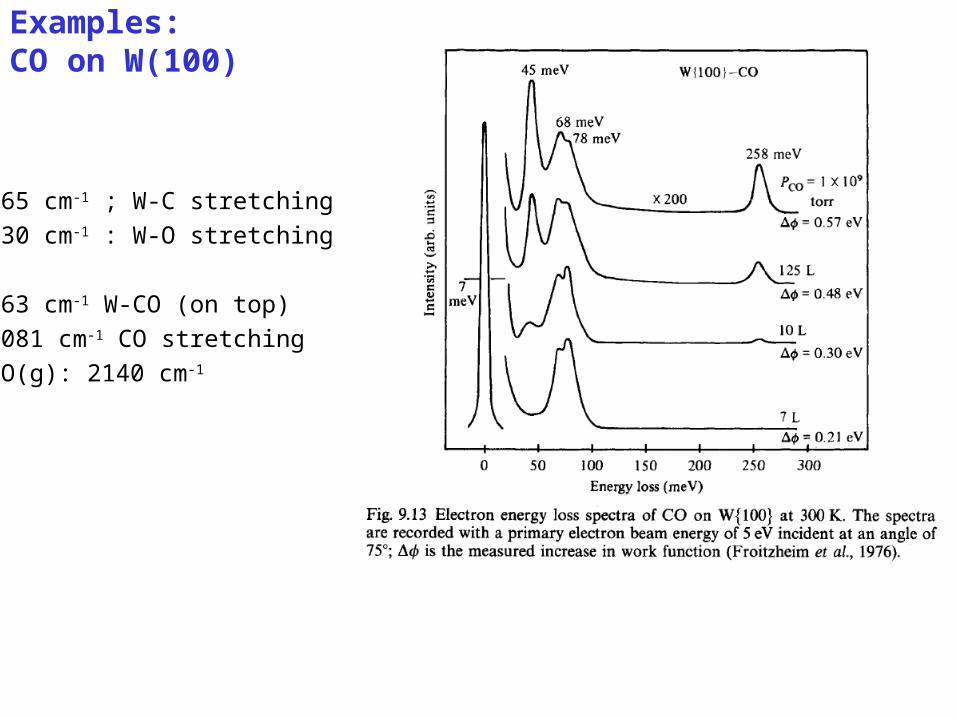
Examples: CO on W(100)
565 cm-1 ; W-C stretching
630 cm-1 : W-O stretching
363 cm-1 W-CO (on top)
2081 cm-1 CO stretching
CO(g): 2140 cm-1
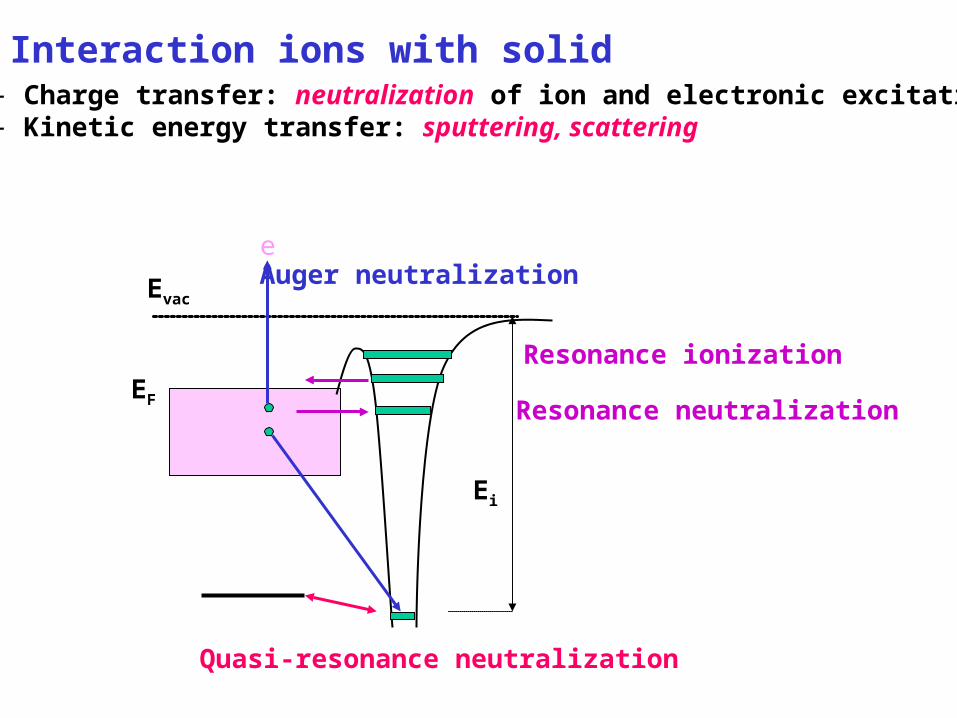
Interaction ions with solid
Evac
EF
Ei
Auger neutralization
Resonance ionization
Resonance neutralization
Quasi-resonance neutralization
- Charge transfer: neutralization of ion and electronic excitation- Kinetic energy transfer: sputtering, scattering
e
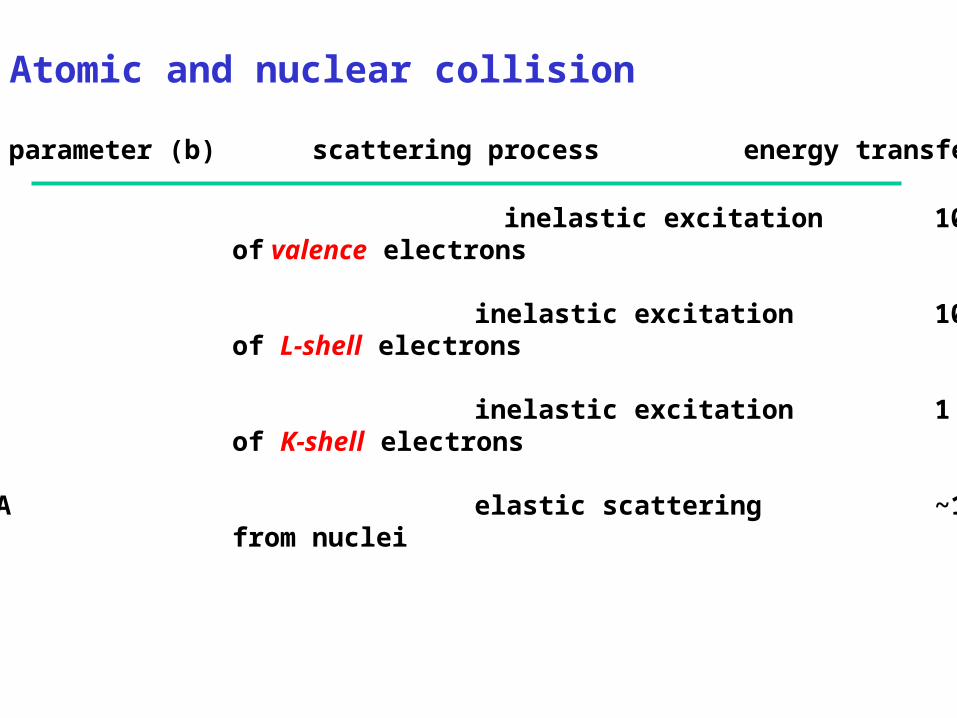
Atomic and nuclear collision
Impact parameter (b) scattering process energy transfer (Tc)
~1 A inelastic excitation 10eV of valence electrons
~10-1 A inelastic excitation 100eV of L-shell electrons
~10-2 A inelastic excitation 1 keV of K-shell electrons
~ 10-4 A elastic scattering ~100keV from nuclei
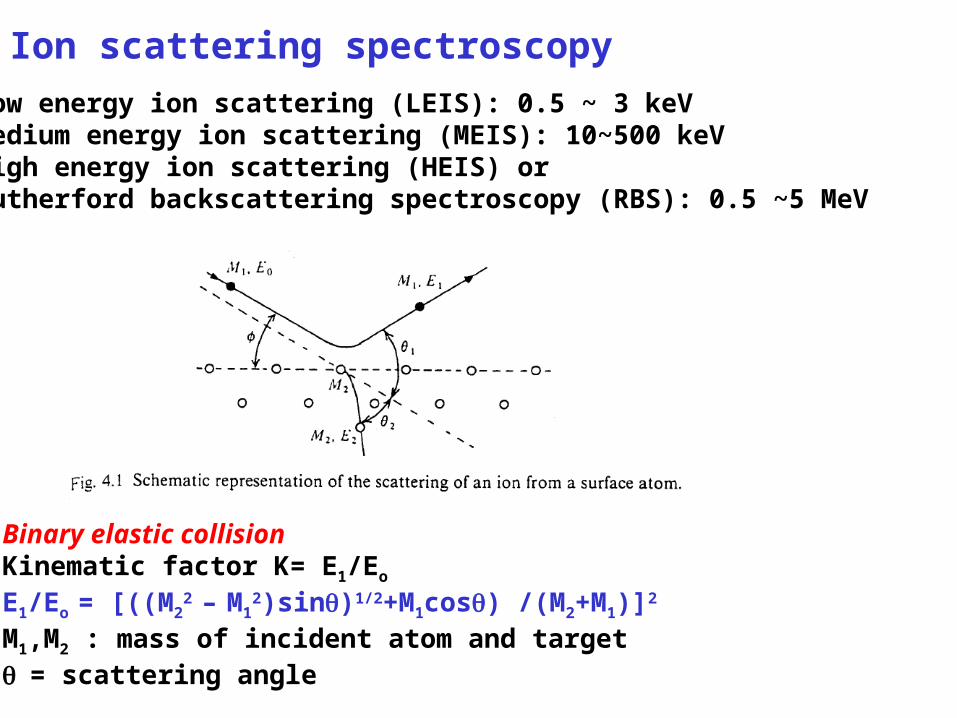
Ion scattering spectroscopy
Low energy ion scattering (LEIS): 0.5 ~ 3 keVMedium energy ion scattering (MEIS): 10~500 keVHigh energy ion scattering (HEIS) orRutherford backscattering spectroscopy (RBS): 0.5 ~5 MeV
Binary elastic collisionKinematic factor K= E1/Eo
E1/Eo = [((M22
– M12)sin)1/2+M1cos) /(M2+M1)]2
M1,M2 : mass of incident atom and target= scattering angle

Ion trajectroy

Blocking, shadowing, and channeling effect
- scattering cross section at a certain angle depend on atomic potentials of incident and substrate atoms-scattering depend on incident angle and impact parameter-lower ion energy, larger shadow cone
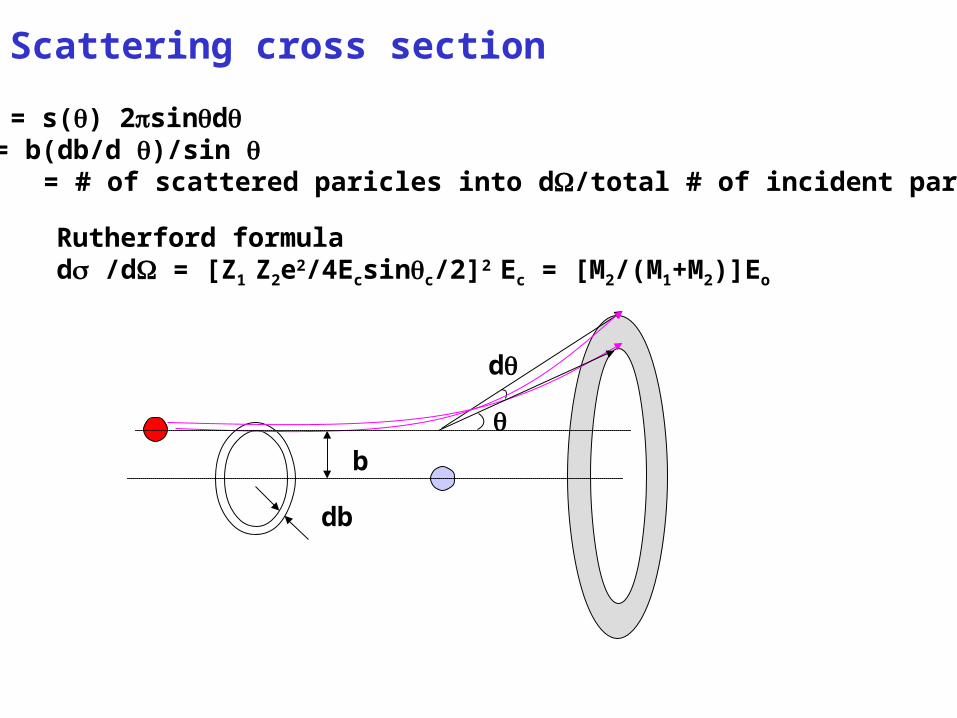
Scattering cross section
2bdb = s() 2sind() = b(db/d )/sin = # of scattered paricles into d/total # of incident particles
Rutherford formulad /d = [Z1 Z2e2/4Ecsinc/2]2 Ec = [M2/(M1+M2)]Eo
db
b
d

Quantitative analysis
Total # of particles of impurity mas M3, atomic number Z3, surfacedensity N3(atoms/cm2)The measured yield Y3
Y3 = N3 (d /d) QQ: measured # of incident particles : solid angle accepted by detector- N3 can be determined typically with an accuracy better than 10%
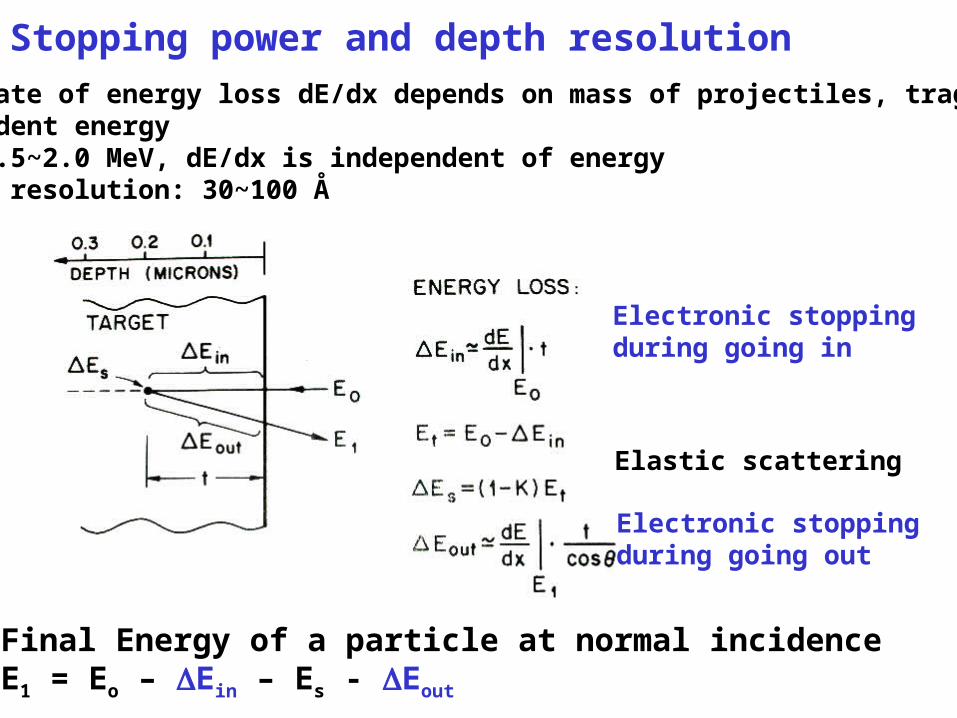
Stopping power and depth resolution
Electronic stoppingduring going in
Elastic scattering
Electronic stopping during going out
Final Energy of a particle at normal incidenceE1 = Eo – Ein – Es - Eout
-the rate of energy loss dE/dx depends on mass of projectiles, traget, and incident energy-for 0.5~2.0 MeV, dE/dx is independent of energy-Depth resolution: 30~100 Å
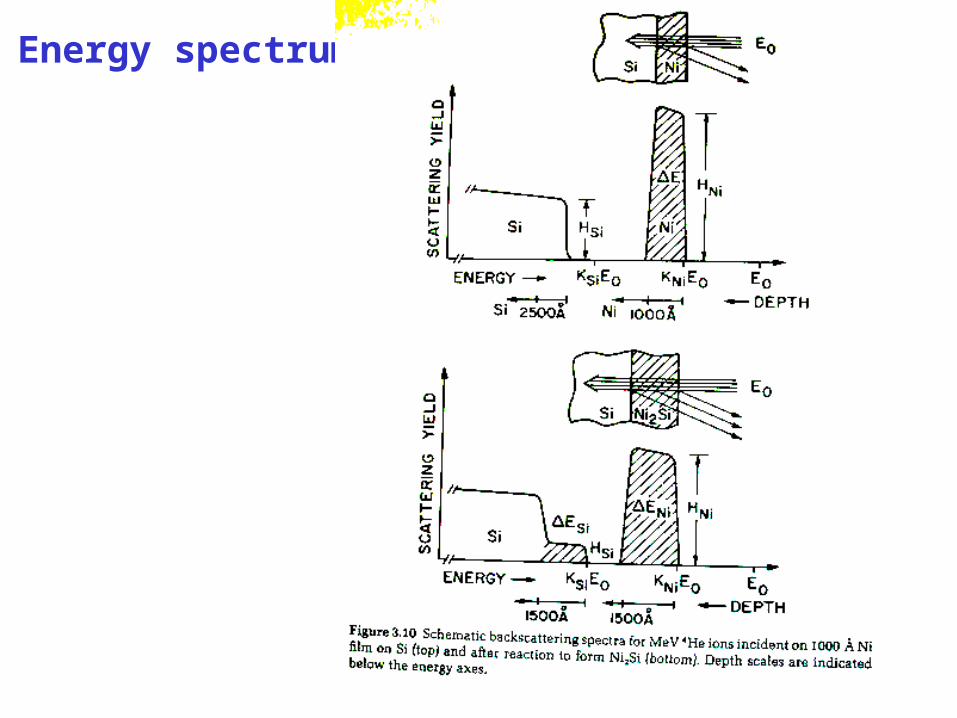
Energy spectrum
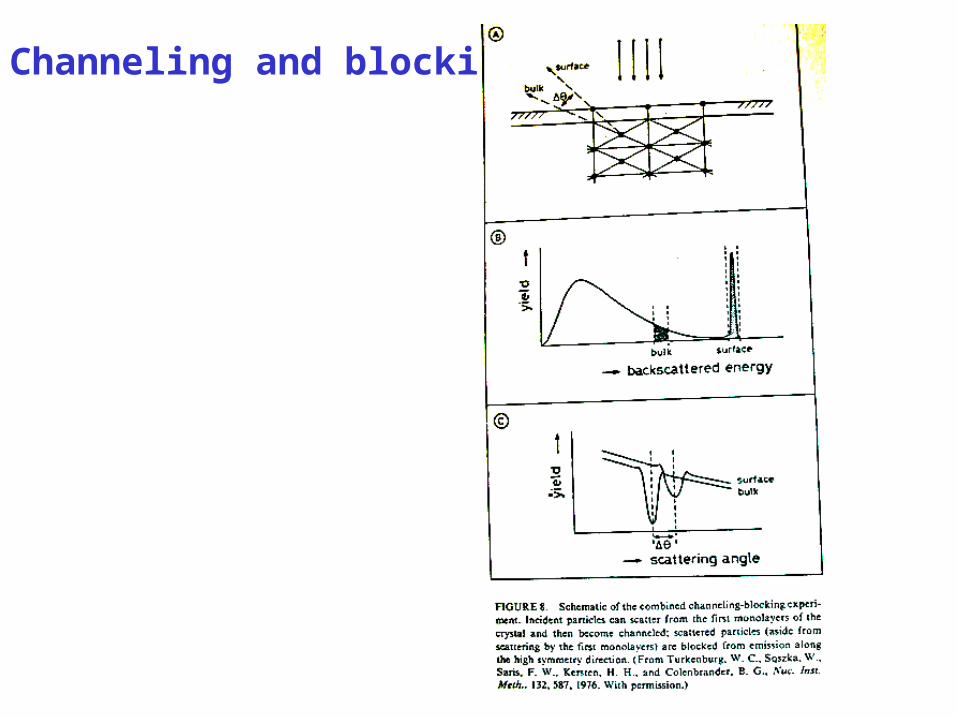
Channeling and blocking
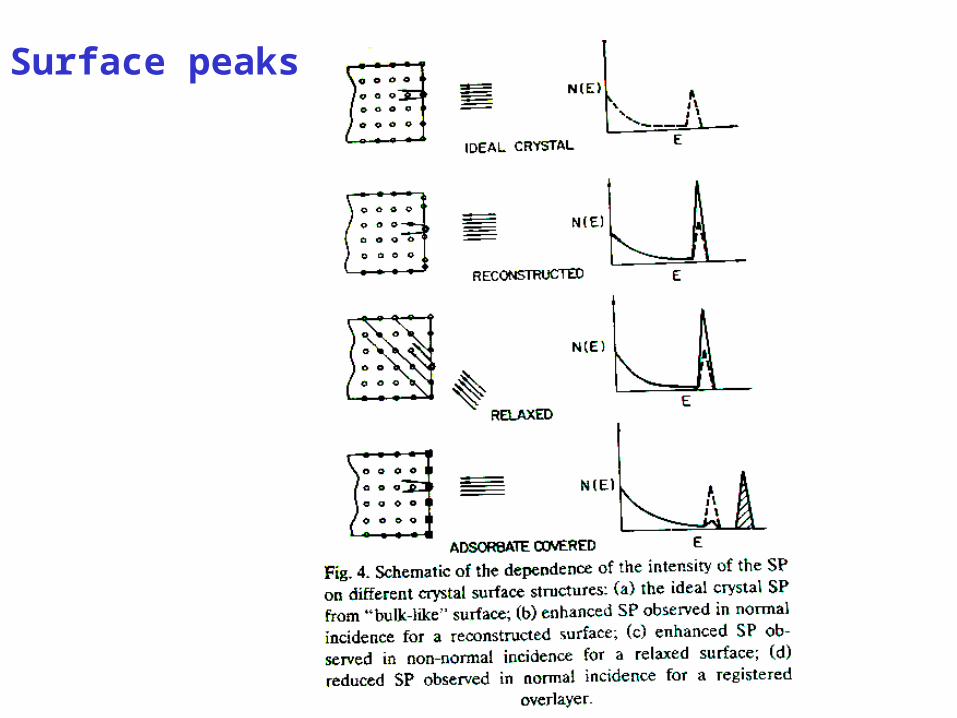
Surface peaks
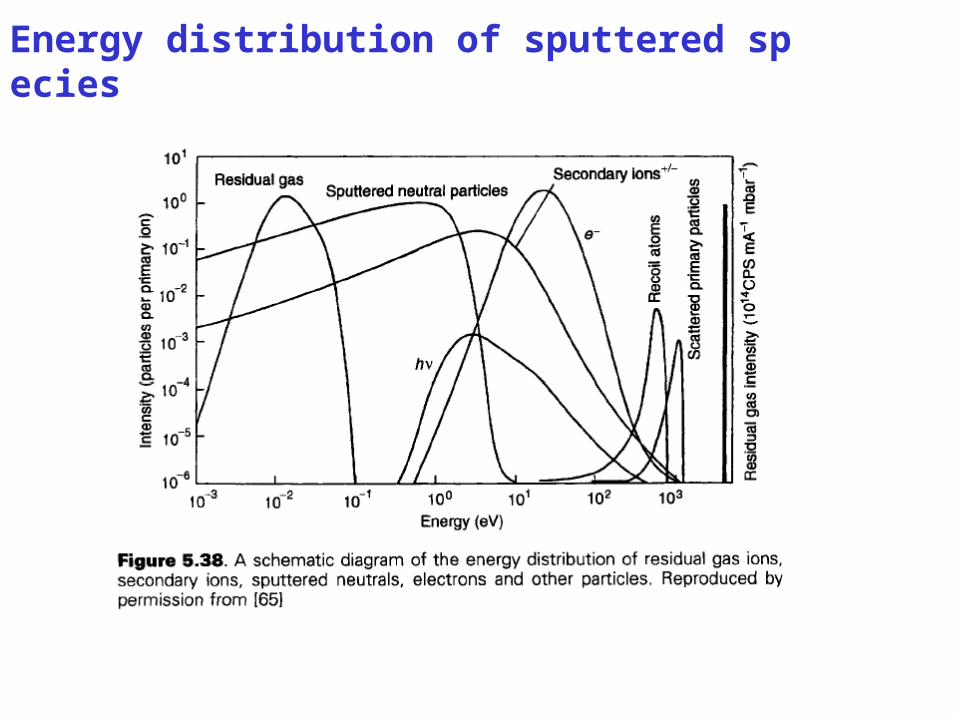
Energy distribution of sputtered species
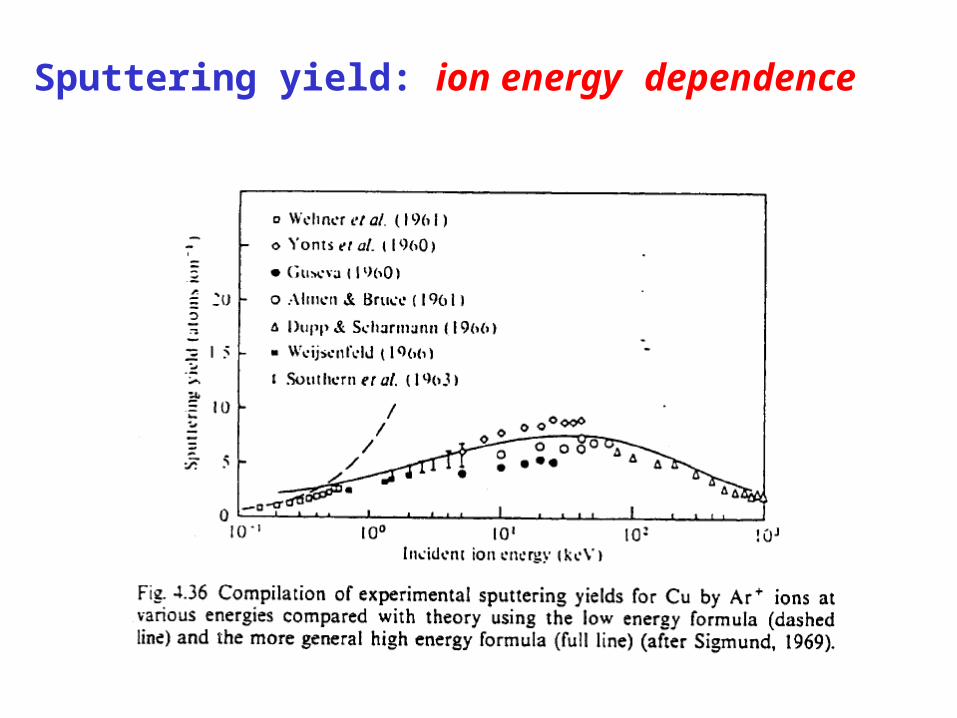
Sputtering yield: ion energy dependence
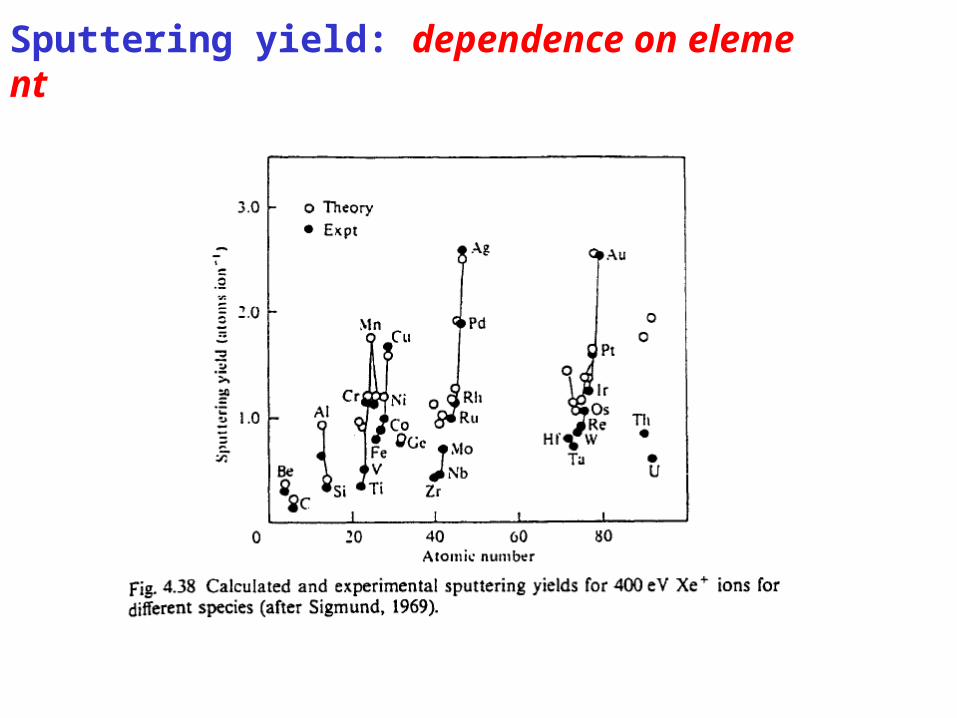
Sputtering yield: dependence on element
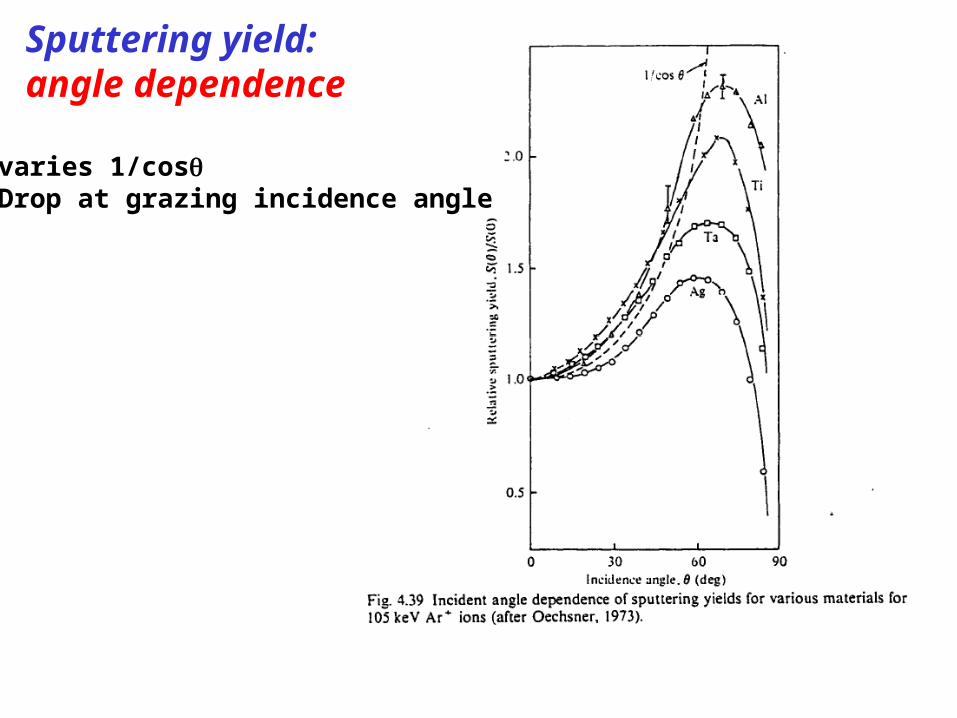
Sputtering yield: angle dependence
-varies 1/cos-Drop at grazing incidence angle
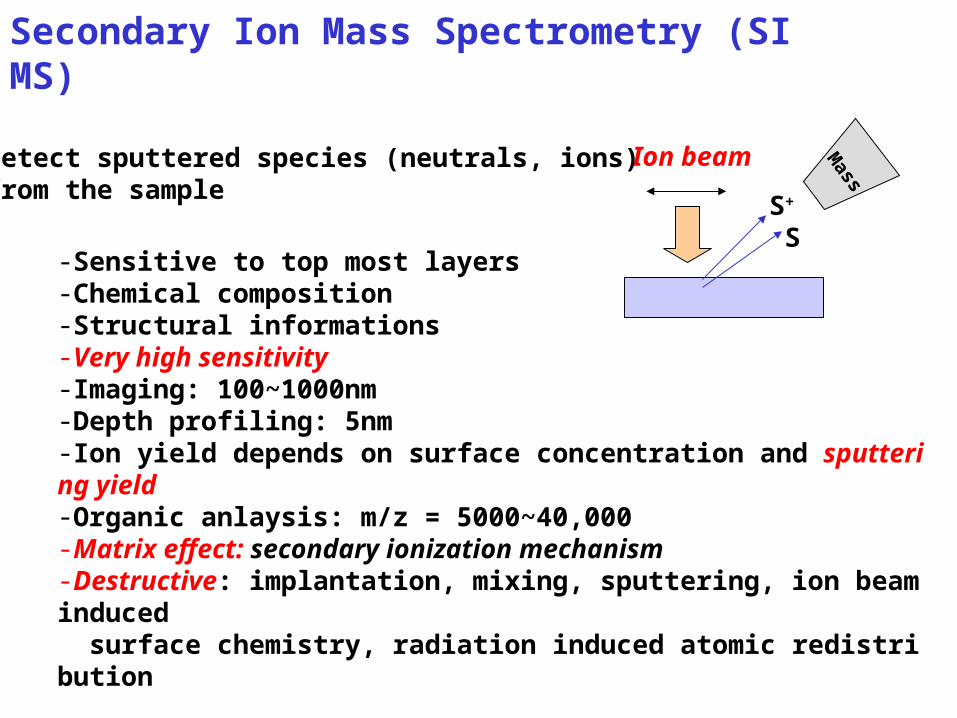
Secondary Ion Mass Spectrometry (SIMS)
Ion beam
S+
-Sensitive to top most layers-Chemical composition-Structural informations-Very high sensitivity-Imaging: 100~1000nm-Depth profiling: 5nm-Ion yield depends on surface concentration and sputtering yield-Organic anlaysis: m/z = 5000~40,000-Matrix effect: secondary ionization mechanism-Destructive: implantation, mixing, sputtering, ion beam induced surface chemistry, radiation induced atomic redistribution
Mass
detect sputtered species (neutrals, ions)from the sample
S

SIMS modes
-Static SIMS - low sputter rate ~1nA/cm2
<10 Å/hr - nondestructive- Submonolayer analysis
-Dynamic SIMS - high sputter rate ~10 mA/cm2
~100 m/hr - destructive- Depth profiling
1nA/cm2
=10-9A/cm2/1.6x10-19 C= 6.3x10⁹ ions/sec-cm2
= 6.3x10⁹ ions/sec-cm2
1015atoms/cm2
= 1.6x10⁻⁵ ML

InstrumentationIonization methods: -electron impact - microwave-field ionization-laser ablation
Ion sourceAr+ ionO2
+: for electropositive elementsCs+: for electronegative elementsLiquid metal: Ga+, In+
- small beam size
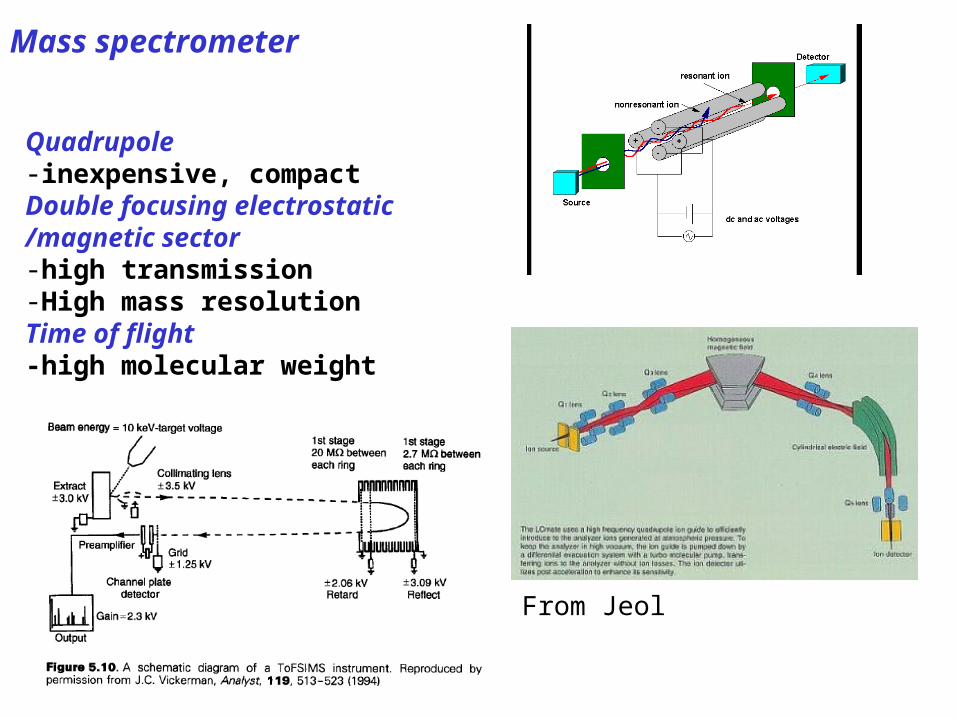
Mass spectrometer
Quadrupole-inexpensive, compactDouble focusing electrostatic/magnetic sector-high transmission-High mass resolutionTime of flight-high molecular weight
From Jeol
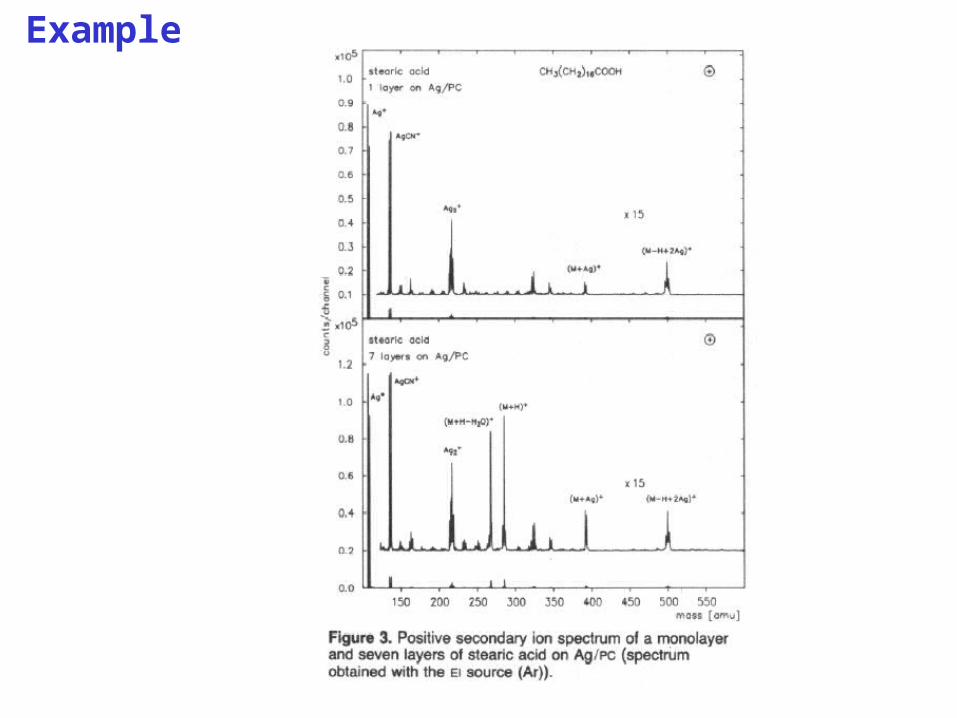
Example
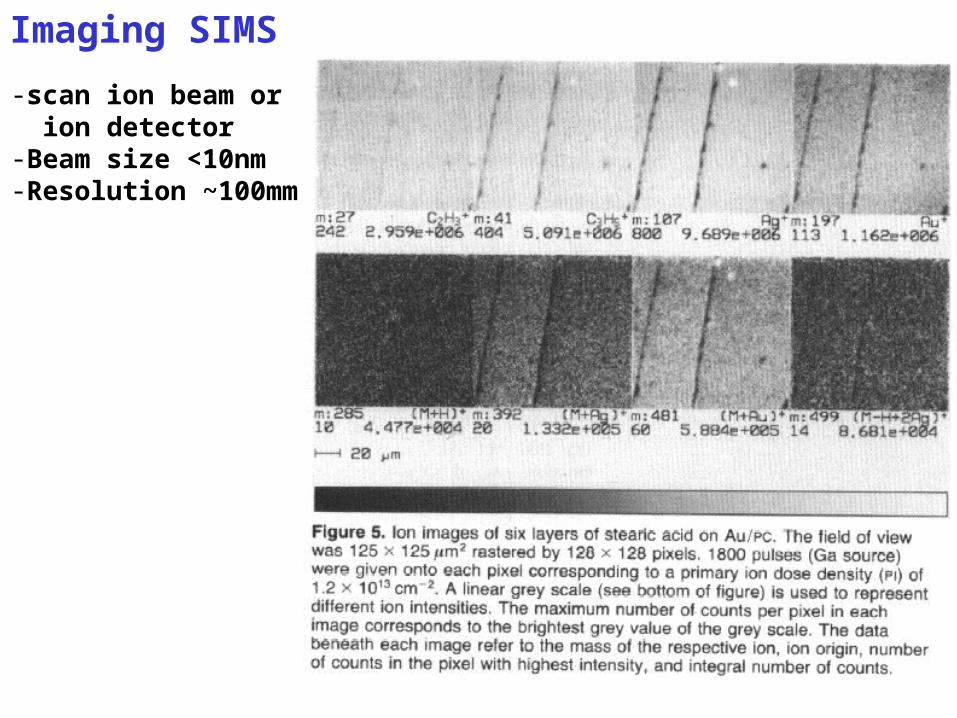
Imaging SIMS
-scan ion beam or ion detector-Beam size <10nm-Resolution ~100mm

Thermal desorption spectroscopyTemperature programmed desorpion
-measure desorbing molecules by heating the surface using mass spectrometer
Quadrupole mass spectrometer
heater
Adsorbed molecules
-Heat of adsorption if Eads =Edes-Surface coverage: peak area-Adsorption sites: peak position-Intermolecular interaction-Kinetics of desorption : peak shape
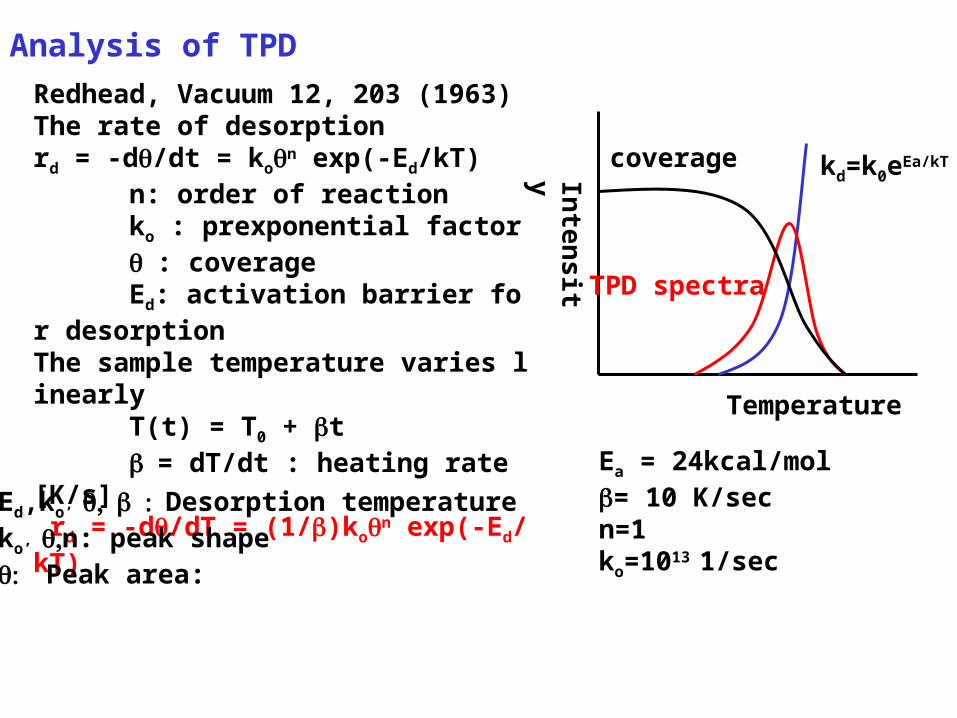
Analysis of TPD
Redhead, Vacuum 12, 203 (1963)The rate of desorptionrd = -d/dt = kon exp(-Ed/kT) n: order of reaction ko : prexponential factor : coverage Ed: activation barrier for desorptionThe sample temperature varies linearly T(t) = T0 + t = dT/dt : heating rate[K/s] rd = -d/dT = (1/)kon exp(-Ed/kT)
coverage kd=k0eEa/kT
TPD spectra
TemperatureIn
ten
sit
y
Ea = 24kcal/mol= 10 K/secn=1ko=1013 1/sec
Ed,ko’ Desorption temperatureko’ n: peak shapePeak area:
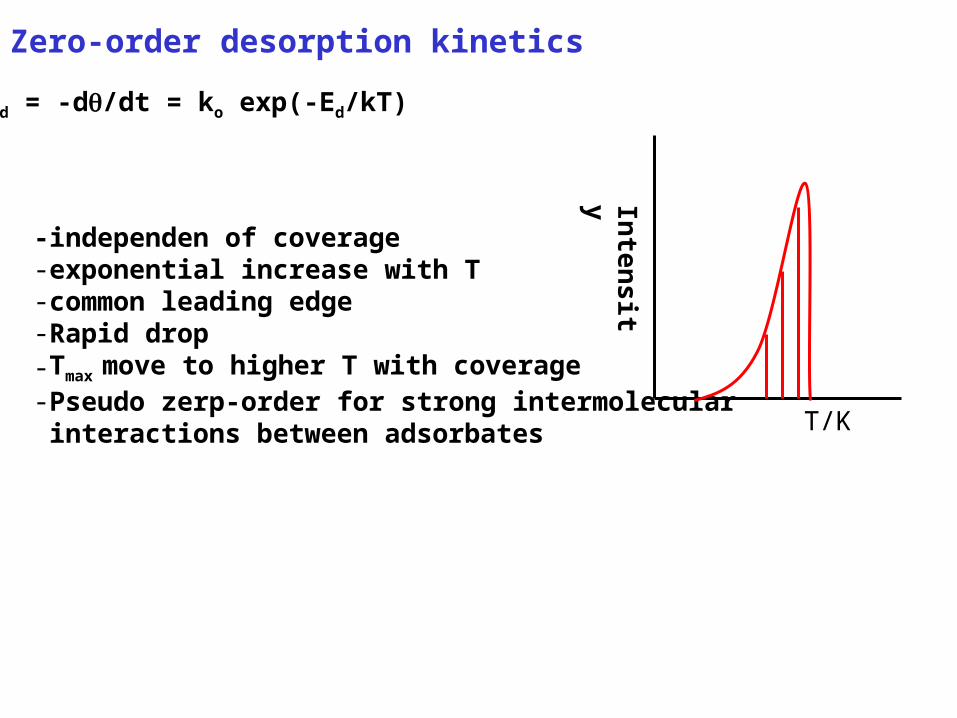
Zero-order desorption kinetics
-independen of coverage-exponential increase with T-common leading edge-Rapid drop-Tmax move to higher T with coverage-Pseudo zerp-order for strong intermolecular interactions between adsorbates
Inte
nsit
y
T/K
rd = -d/dt = ko exp(-Ed/kT)
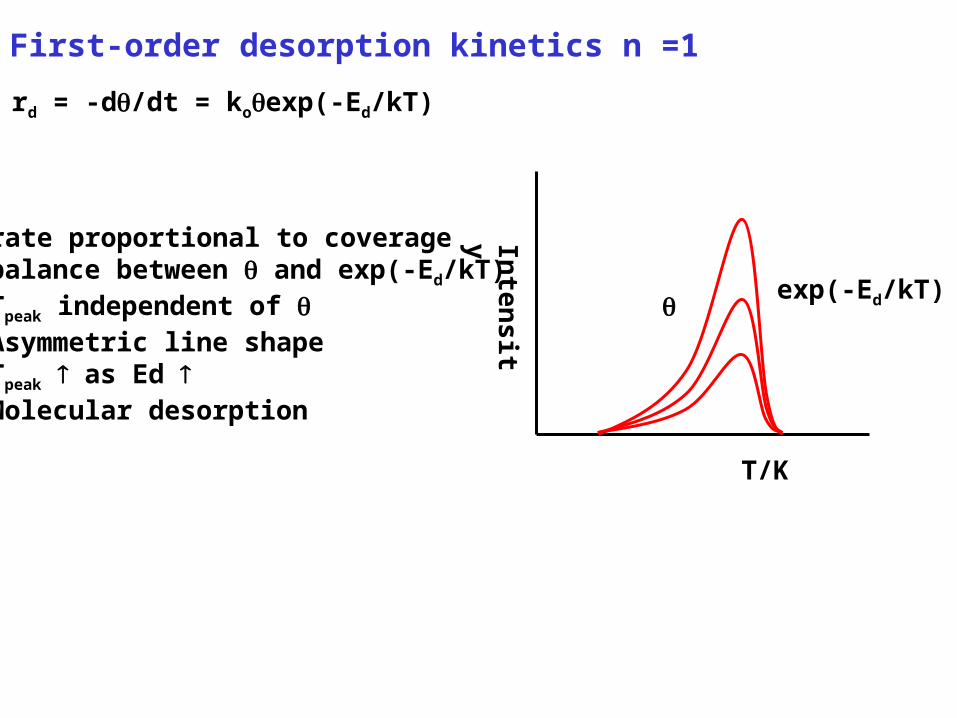
First-order desorption kinetics n =1
Inten
sit
yT/K
rd = -d/dt = koexp(-Ed/kT)
exp(-Ed/kT)
-rate proportional to coverage-balance between and exp(-Ed/kT)-Tpeak independent of -Asymmetric line shape-Tpeak as Ed -Molecular desorption
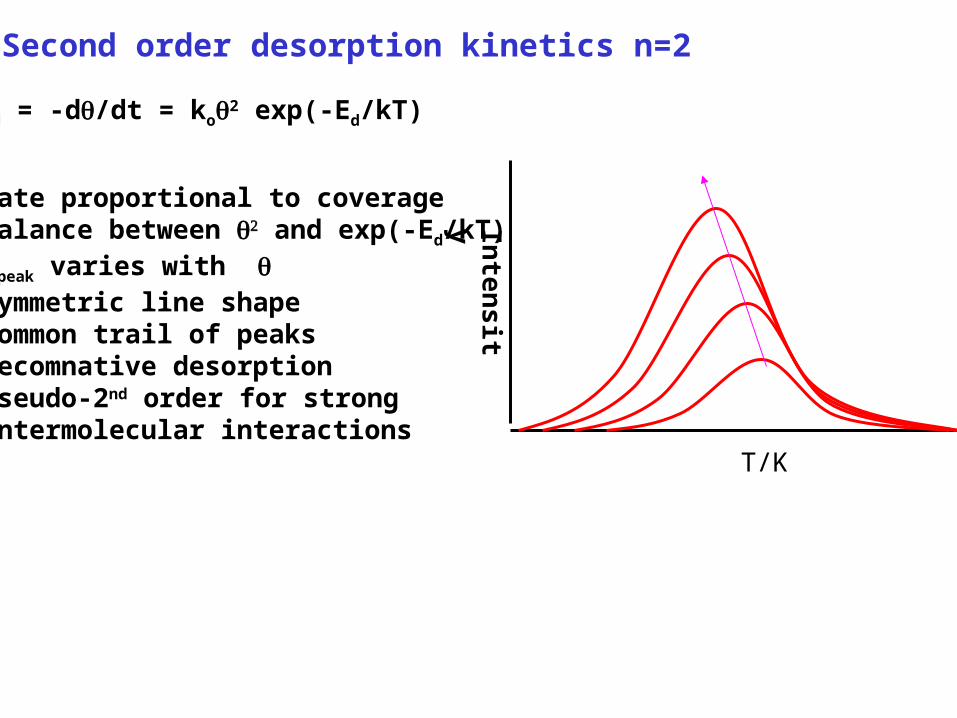
Second order desorption kinetics n=2
T/K
rd = -d/dt = ko2 exp(-Ed/kT)
-rate proportional to coverage-balance between and exp(-Ed/kT)-Tpeak varies with -symmetric line shape-Common trail of peaks-Recomnative desorption-Pseudo-2nd order for strong intermolecular interactions
Inte
nsit
y
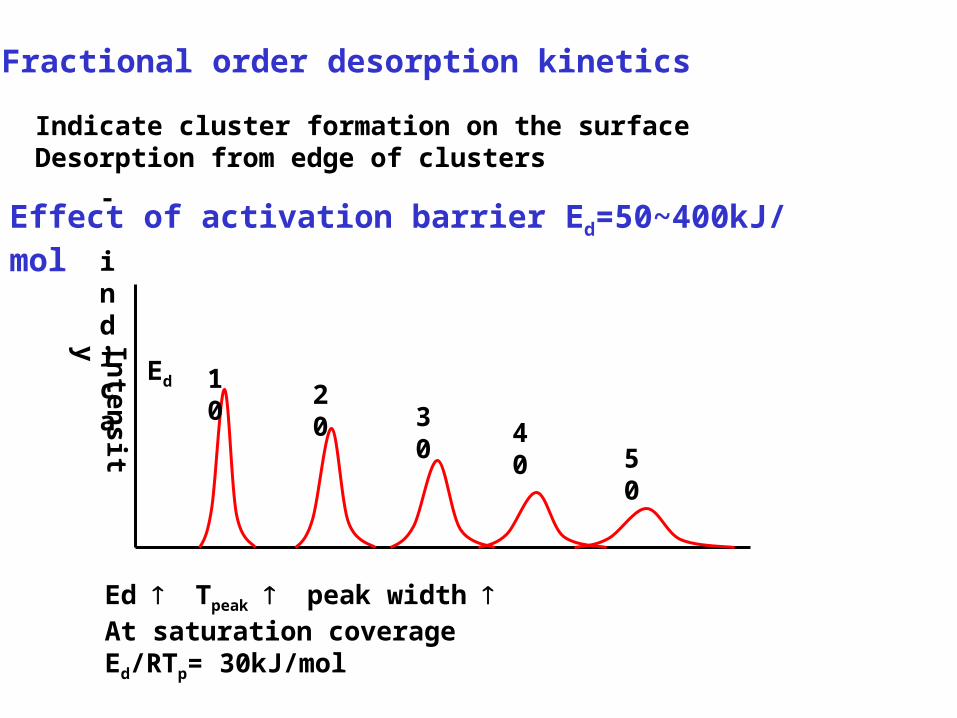
Fractional order desorption kinetics
- indica
Indicate cluster formation on the surfaceDesorption from edge of clusters
Effect of activation barrier Ed=50~400kJ/mol
Inte
nsit
y
Ed 1020
3040
50
Ed Tpeak peak width At saturation coverageEd/RTp= 30kJ/mol
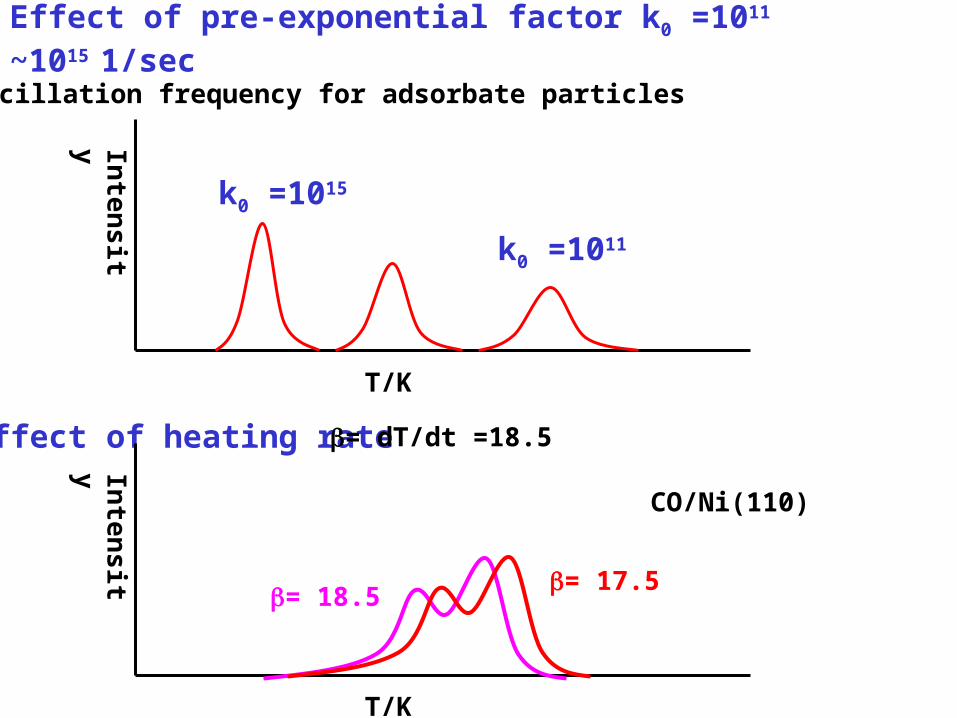
Effect of pre-exponential factor k0 =1011 ~1015 1/sec
Inte
nsit
y
k0 =1015
k0 =1011
T/K
-oscillation frequency for adsorbate particles
Effect of heating rate
Inte
nsit
y
T/K
= dT/dt =18.5
= 18.5= 17.5
CO/Ni(110)
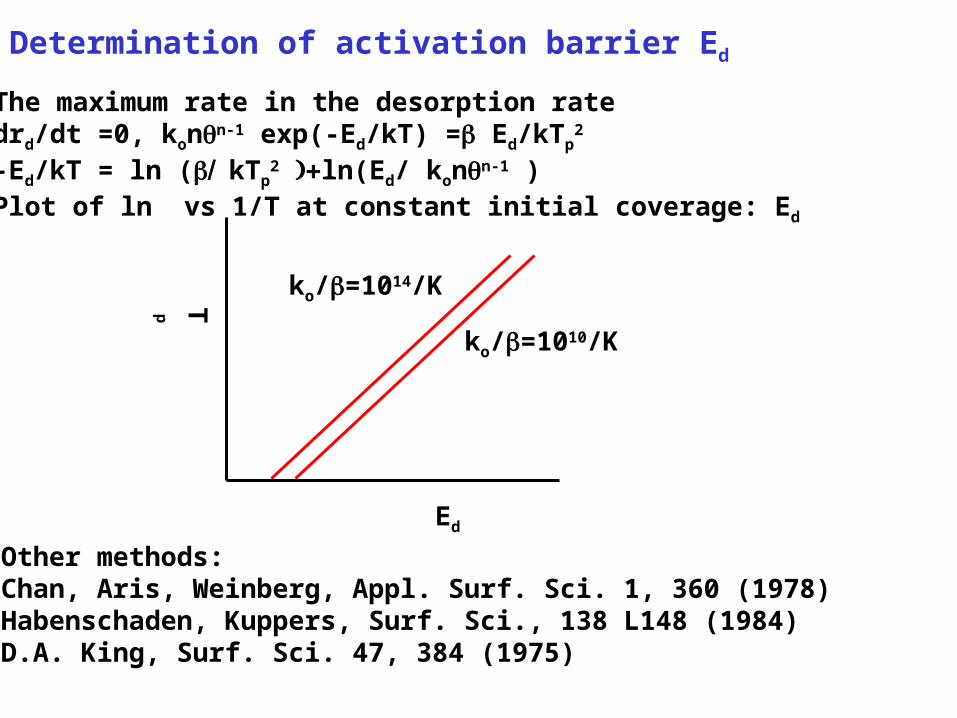
Determination of activation barrier Ed
The maximum rate in the desorption ratedrd/dt =0, konn-1 exp(-Ed/kT) = Ed/kTp
2
-Ed/kT = ln (kTp2 ln(Ed/ konn-1 )
Plot of ln vs 1/T at constant initial coverage: Ed
Tp
Ed
ko/=1014/K
ko/=1010/K
Other methods:Chan, Aris, Weinberg, Appl. Surf. Sci. 1, 360 (1978)Habenschaden, Kuppers, Surf. Sci., 138 L148 (1984)D.A. King, Surf. Sci. 47, 384 (1975)