Embed Size (px)
Citation preview
Vibrational spectroscopy of clusters
André FielickeFHI Berlin, Molecular Physics
http://www.fhi-berlin.mpg.de/mp/fielicke/
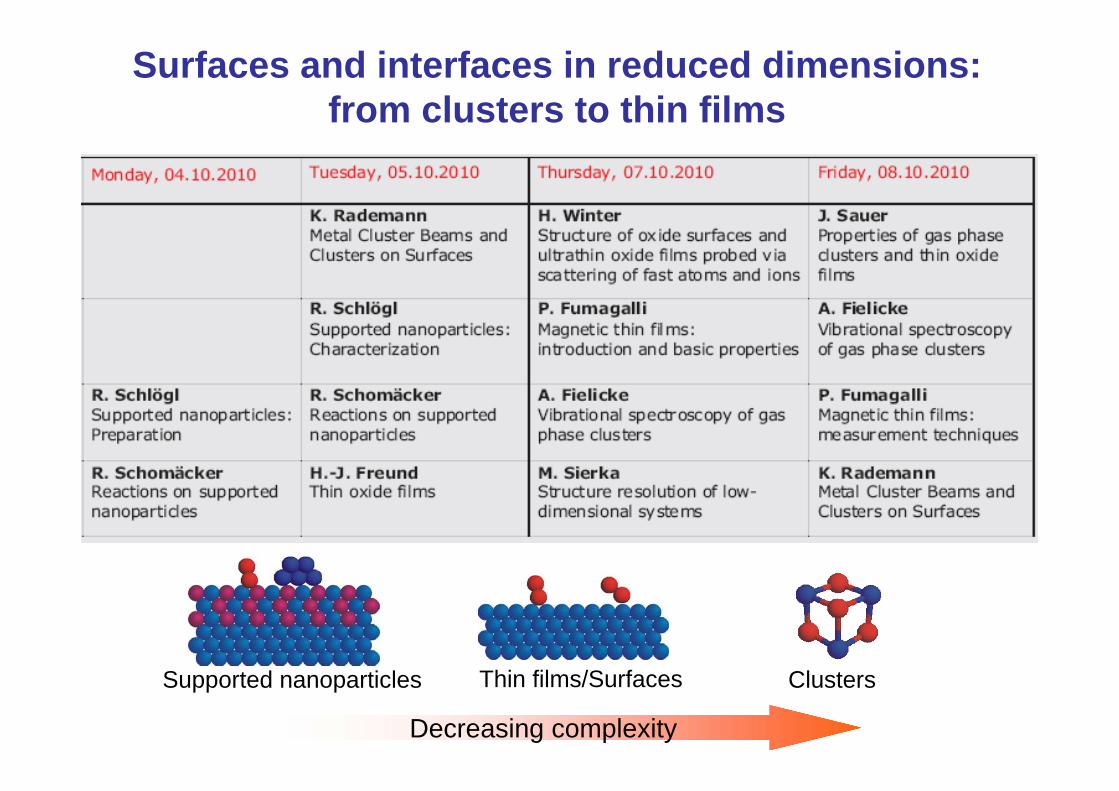
Clusters Supported nanoparticles Thin films/Surfaces
Decreasing complexity
Surfaces and interfaces in reduced dimensions:from clusters to thin films
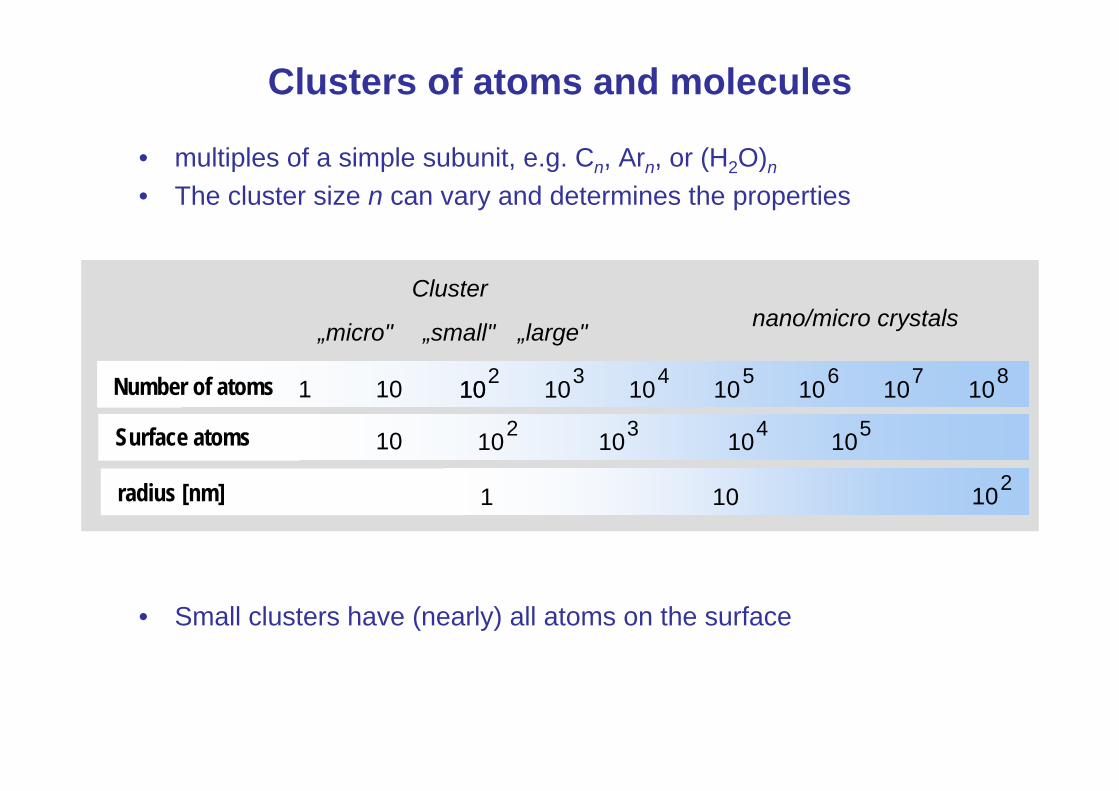
Clusters of atoms and molecules
• multiples of a simple subunit, e.g. Cn, Arn, or (H2O)n
• The cluster size n can vary and determines the properties
• Small clusters have (nearly) all atoms on the surface
Number of atoms
Surface atoms
radius [nm] 1 10 102
1 10 10310 104 105 106 107 108102
10 102 103 105104
„micro" „small" „large"
Clusternano/micro crystals
Experiments on free clusters
• Clusters in different charge states can be prepared and characterized, (including neutrals)
• Characterization is often performed in molecular beams or on trapped cluster ions (gas-phase)
• Most experiments use mass spectrometric detection
• Neutrals can be detected spectroscopically or after ionization via MS
• Effect of charge, size and composition can be studied.
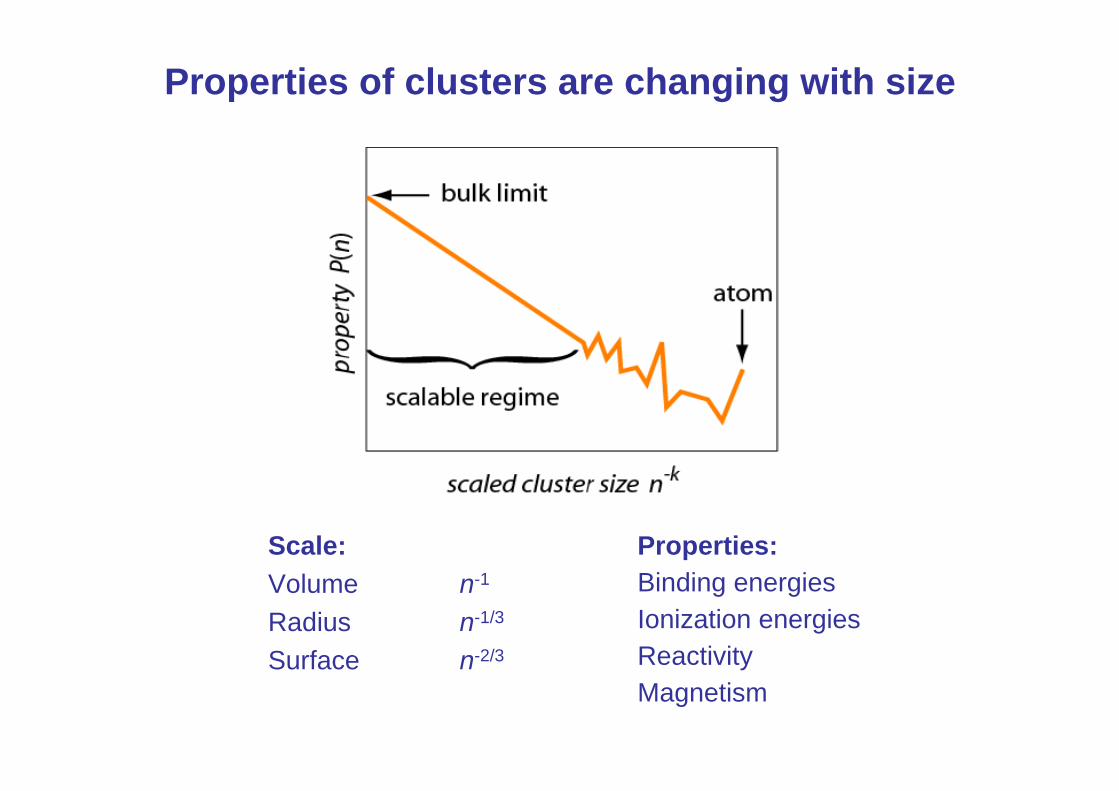
Properties of clusters are changing with size
Scale:Volume n-1
Radius n-1/3
Surface n-2/3
Properties:Binding energiesIonization energiesReactivityMagnetism
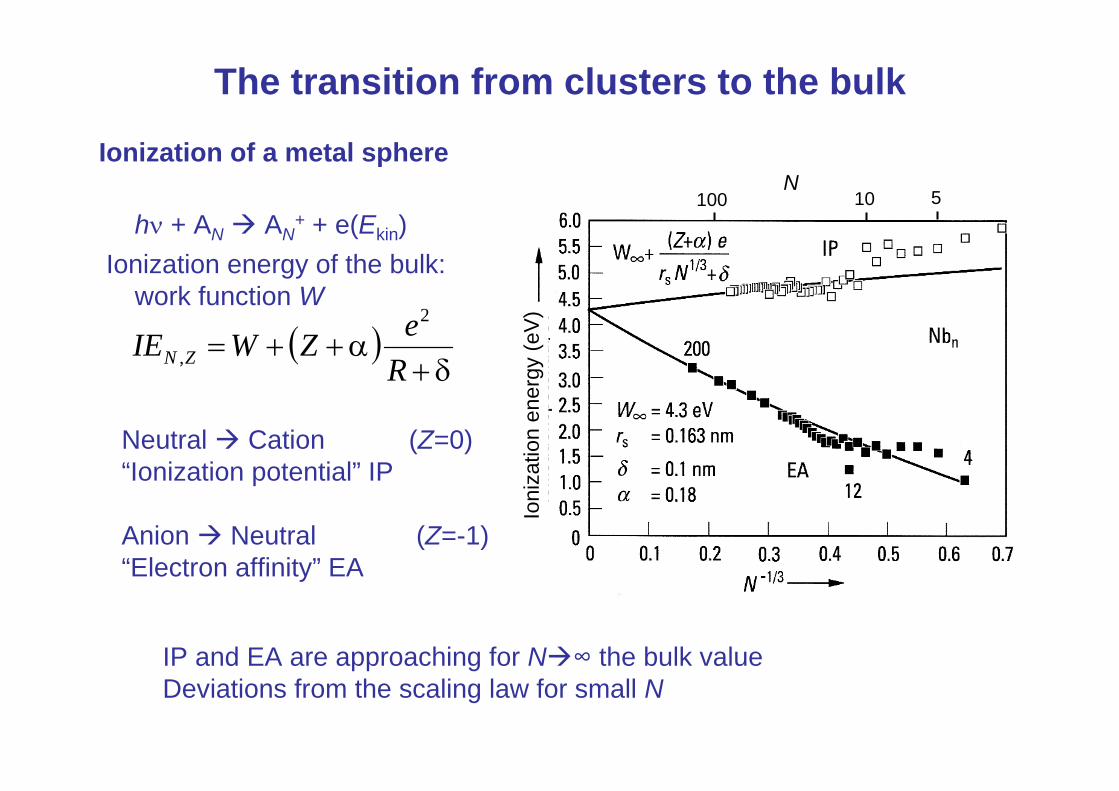
Ionization of a metal sphere
hν + AN AN+ + e(Ekin)
Ionization energy of the bulk: work function W
The transition from clusters to the bulk
Ioni
zatio
n en
ergy
(eV
)
10 5100N
( )δ+
α++=ReZWIE ZN
2
,
Neutral Cation (Z=0)“Ionization potential” IP
Anion Neutral (Z=-1)“Electron affinity” EA
IP and EA are approaching for N ∞ the bulk valueDeviations from the scaling law for small N
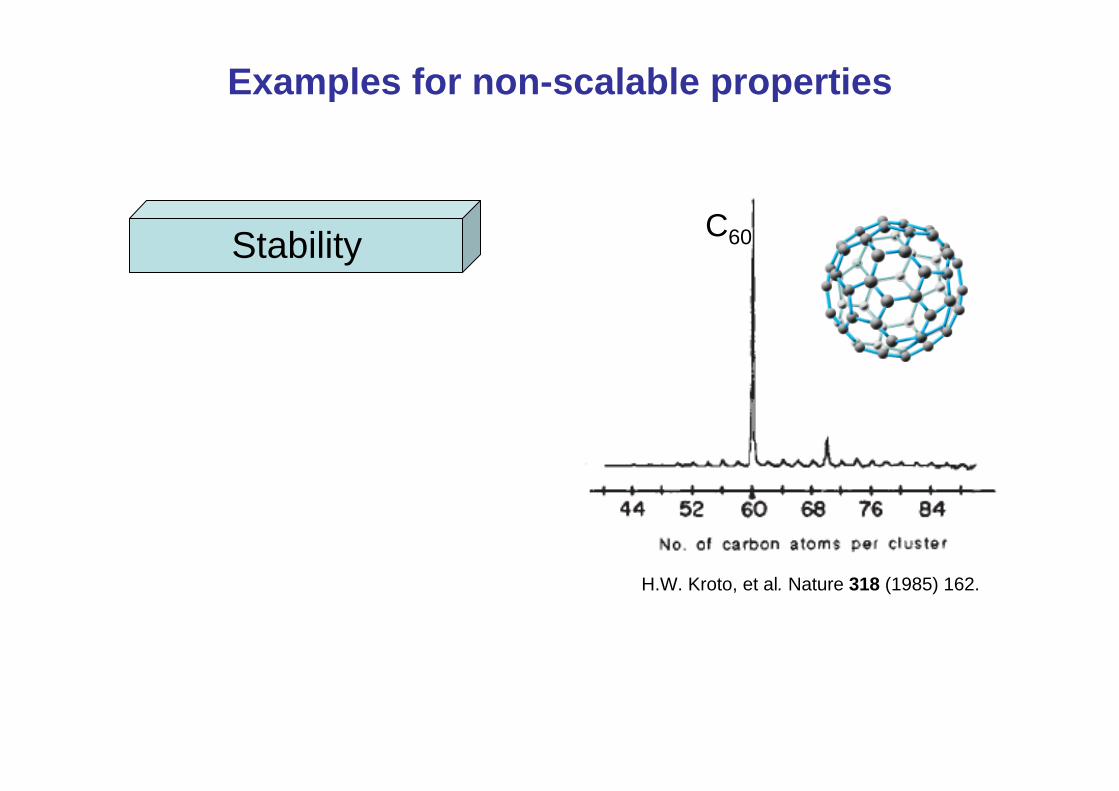
Examples for non-scalable properties
Stability C60
H.W. Kroto, et al. Nature 318 (1985) 162.
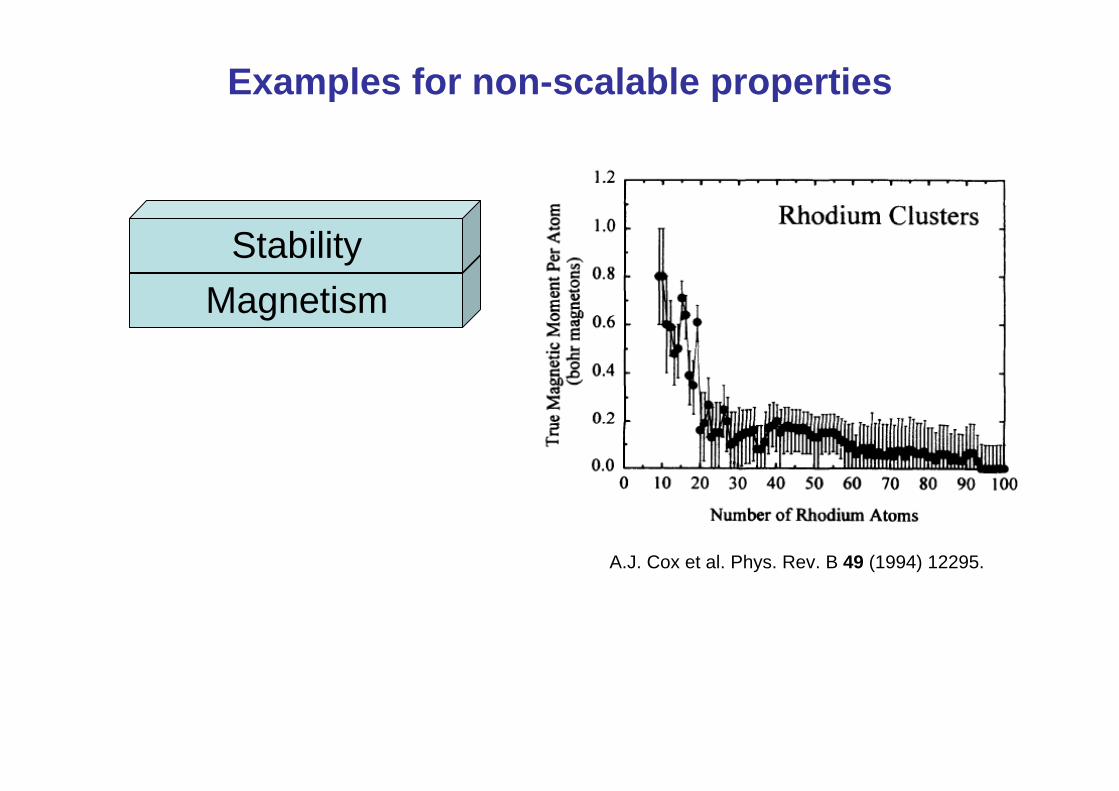
Magnetism
A.J. Cox et al. Phys. Rev. B 49 (1994) 12295.
Examples for non-scalable properties
Stability
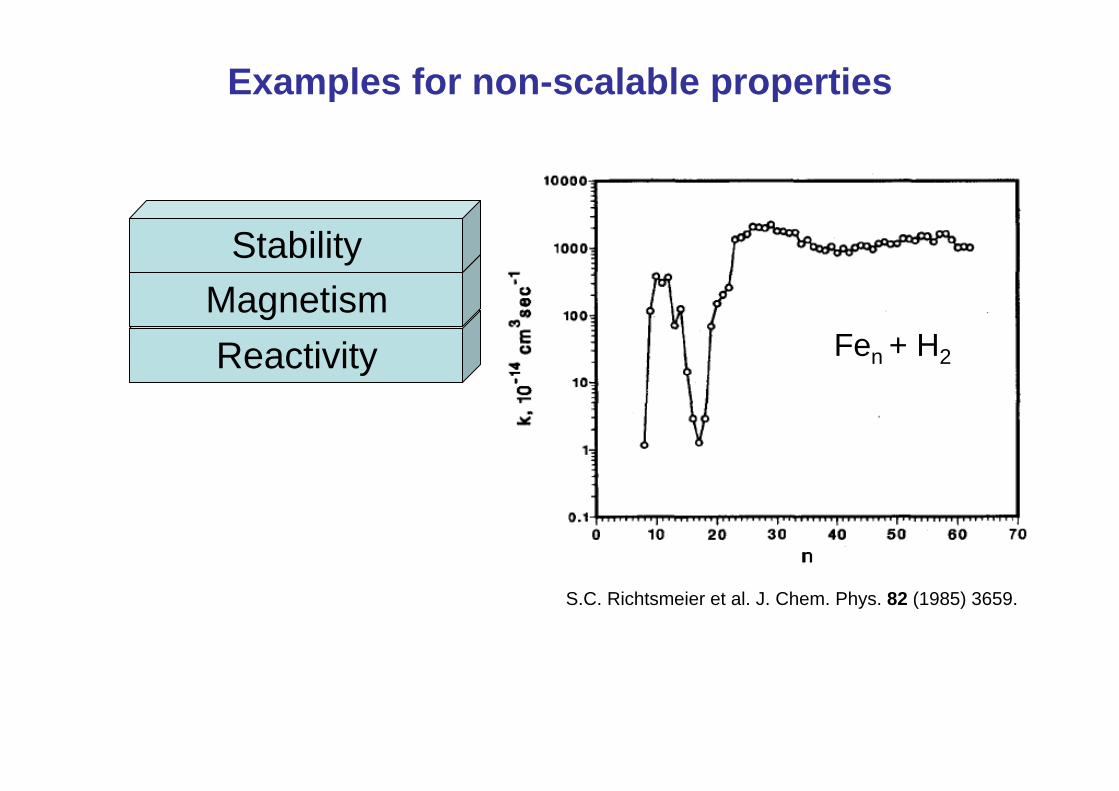
ReactivityMagnetism
S.C. Richtsmeier et al. J. Chem. Phys. 82 (1985) 3659.
Examples for non-scalable properties
Stability
Fen + H2
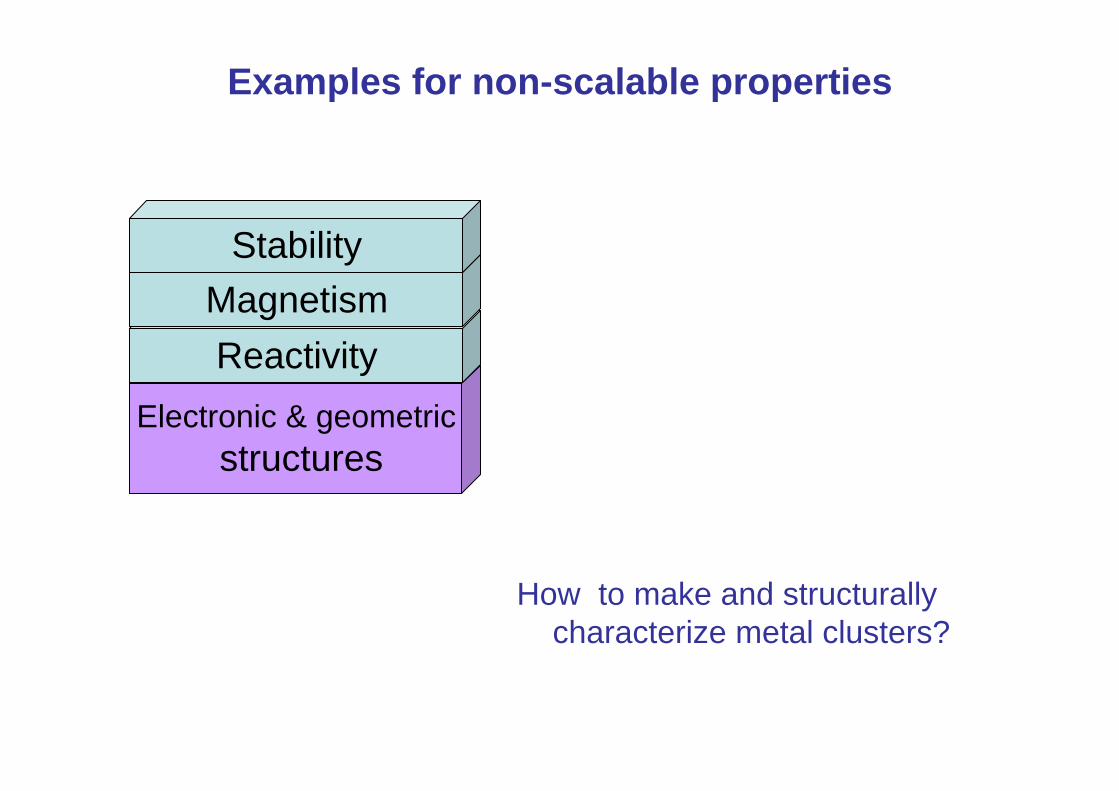
Electronic & geometricstructures
ReactivityMagnetism
Examples for non-scalable properties
Stability
How to make and structurally characterize metal clusters?
Vibrational spectroscopy on clusters
•TechniquesGas-phase clustersCluster-size specific spectroscopyRaman spectroscopy in an inert matrixAnion-photoelectron spectroscopy
•IR - Photodissociation spectroscopyIR Free Electron LaserMultiple photon excitationFar-IR spectroscopy of metal clustersCluster-complexes
Literature
H. Haberland (Ed.): Clusters of Atoms and Molecules, Vol. 1&2, 1994 (Springer, Berlin)
J. R. Lombardi, B. Davis, Periodic Properties of Force Constants of Small Transition-Metal and Lanthanide Clusters, Chem. Rev. 102, 2431 (2002).
M. B. Knickelbein, Reactions of Transition Metal Clusters with Small Molecules, Ann. Rev. Phys. Chem. 50, 79 (1999).
K. R. Asmis, A. Fielicke, G. von Helden, G. Meijer, Vibrational spectroscopy of gas-phase clusters and complexes, in Atomic Clusters; From Gas Phase to Deposited, The Chemical Physics of Solid Surfaces, Vol. 12, D.P. Woodruff (Ed.), Elsevier, Amsterdam (2007)
P. Gruene, J. T. Lyon, and A. Fielicke, Vibrational Spectroscopy of Strongly Bound Clusters, in Handbook of Nanophysics Vol. 2: Clusters and Fullerenes, K. Sattler (Ed.), Taylor & Francis (2010) pp. 9.1-14.
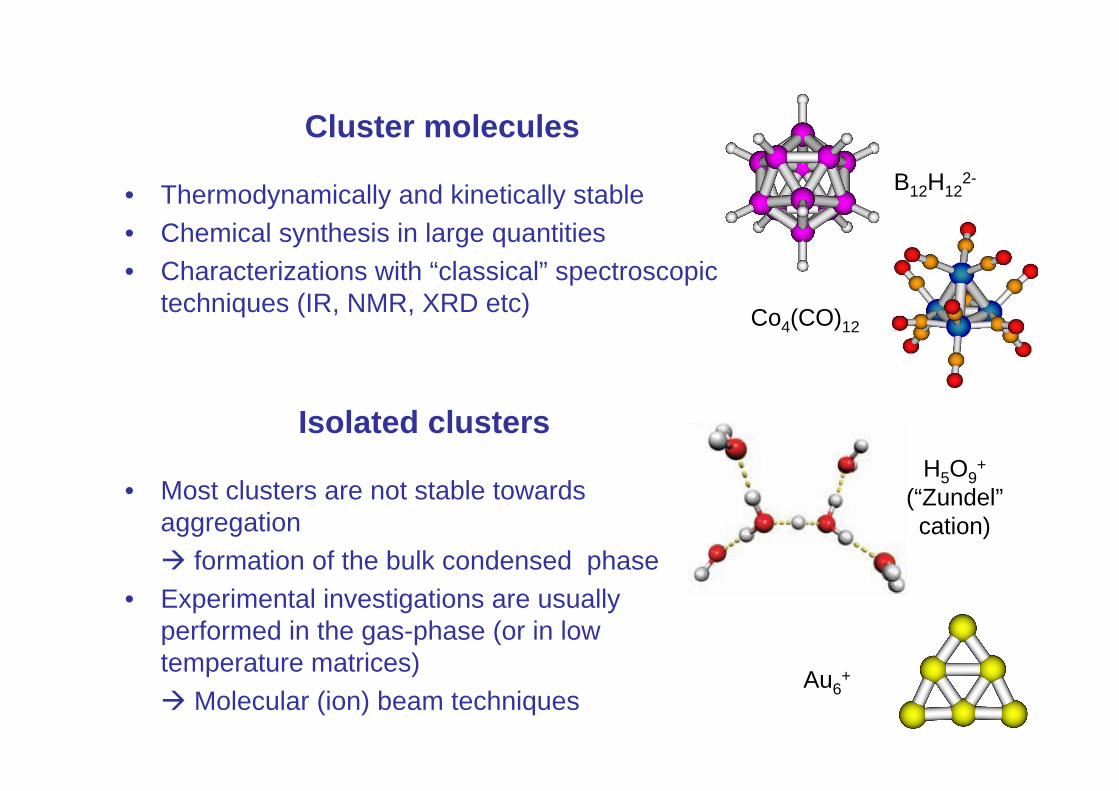
Cluster molecules
• Thermodynamically and kinetically stable• Chemical synthesis in large quantities• Characterizations with “classical” spectroscopic
techniques (IR, NMR, XRD etc)
Isolated clusters
• Most clusters are not stable towards aggregation
formation of the bulk condensed phase• Experimental investigations are usually
performed in the gas-phase (or in low temperature matrices)
Molecular (ion) beam techniques
Co4(CO)12
Au6+
H5O9+
(“Zundel”cation)
B12H122-
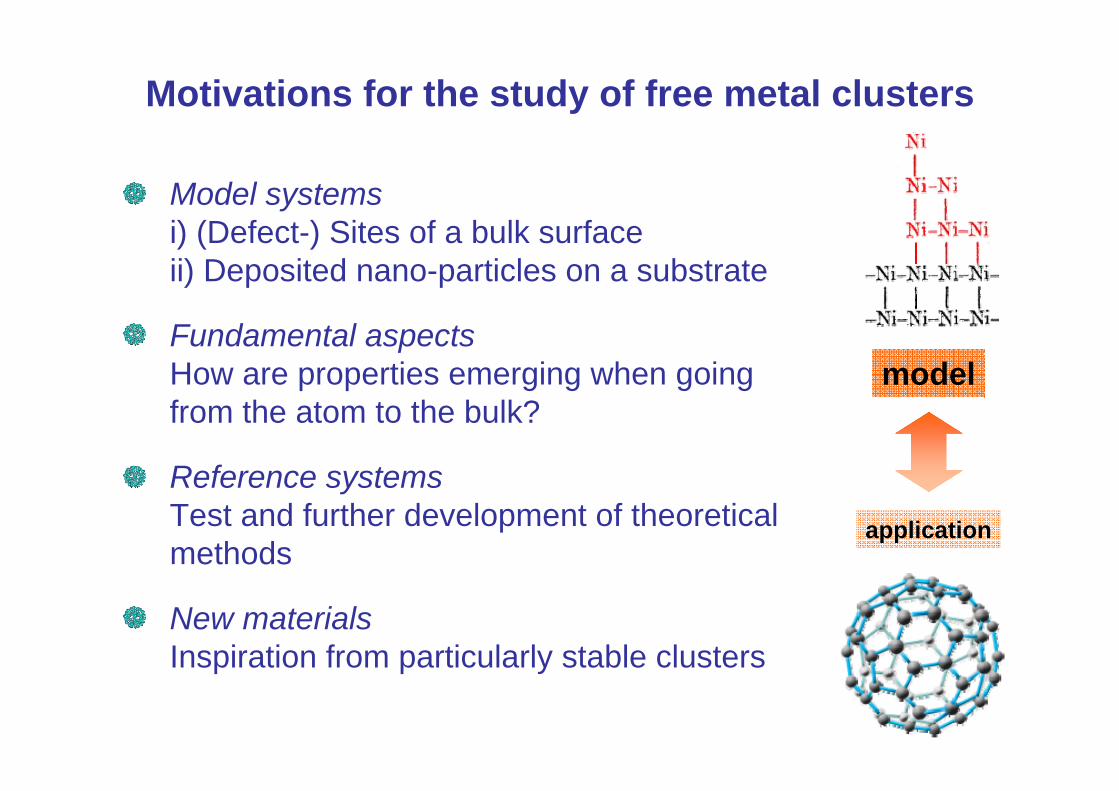
Motivations for the study of free metal clusters
Model systemsi) (Defect-) Sites of a bulk surfaceii) Deposited nano-particles on a substrate
Fundamental aspectsHow are properties emerging when going from the atom to the bulk?
Reference systemsTest and further development of theoretical methods
New materialsInspiration from particularly stable clusters
model
application
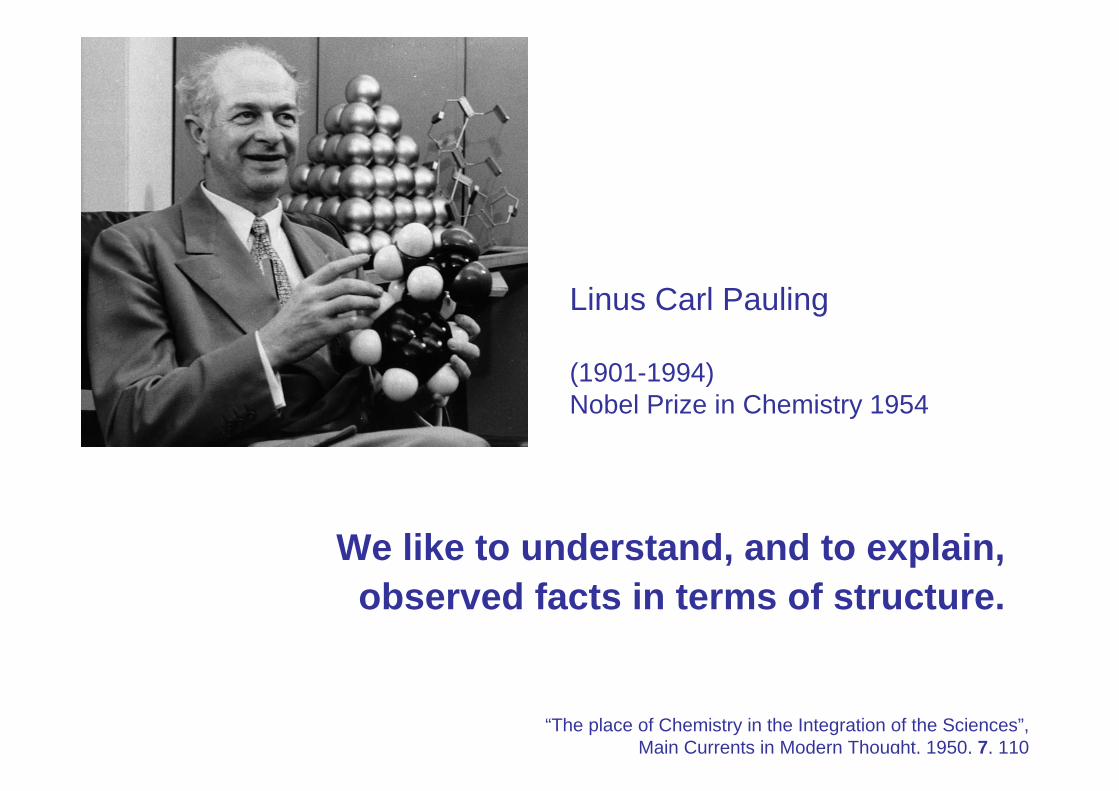
We like to understand, and to explain, observed facts in terms of structure.
Linus Carl Pauling
(1901-1994)Nobel Prize in Chemistry 1954
“The place of Chemistry in the Integration of the Sciences”, Main Currents in Modern Thought, 1950, 7, 110
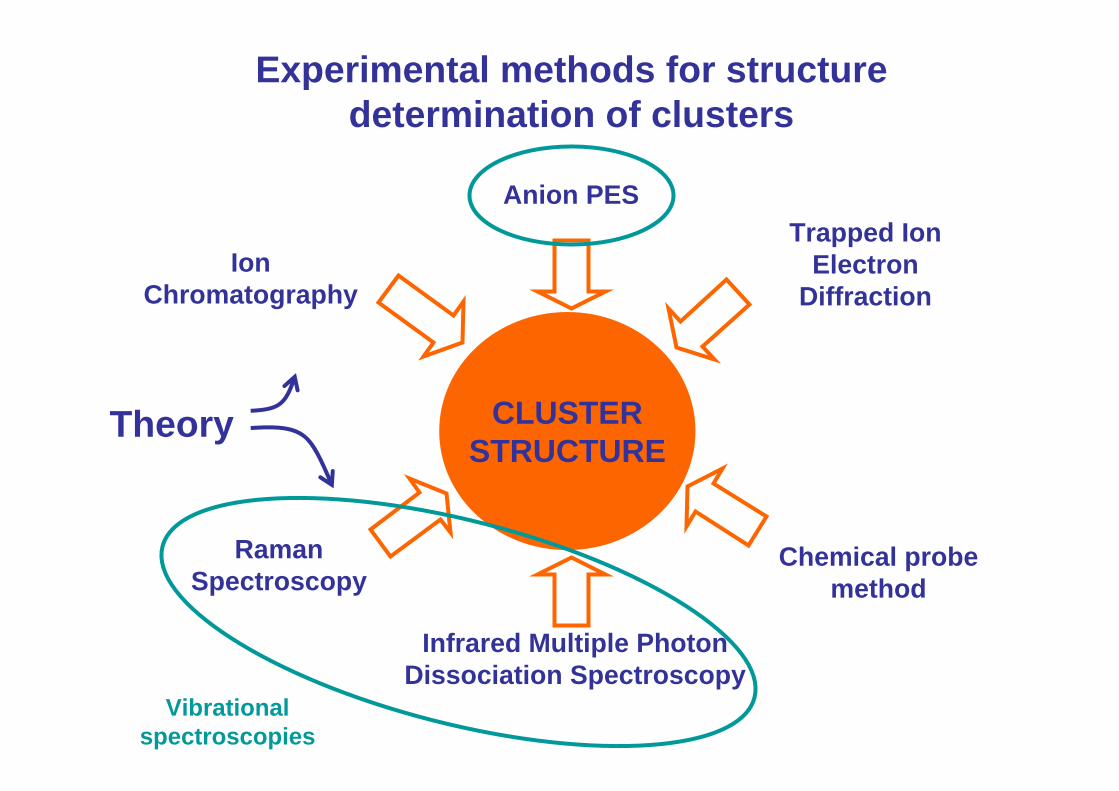
CLUSTERSTRUCTURE
Ion Chromatography
Anion PESTrapped Ion
ElectronDiffraction
RamanSpectroscopy
Infrared Multiple Photon Dissociation Spectroscopy
Chemical probe method
Experimental methods for structure determination of clusters
Vibrationalspectroscopies
Theory
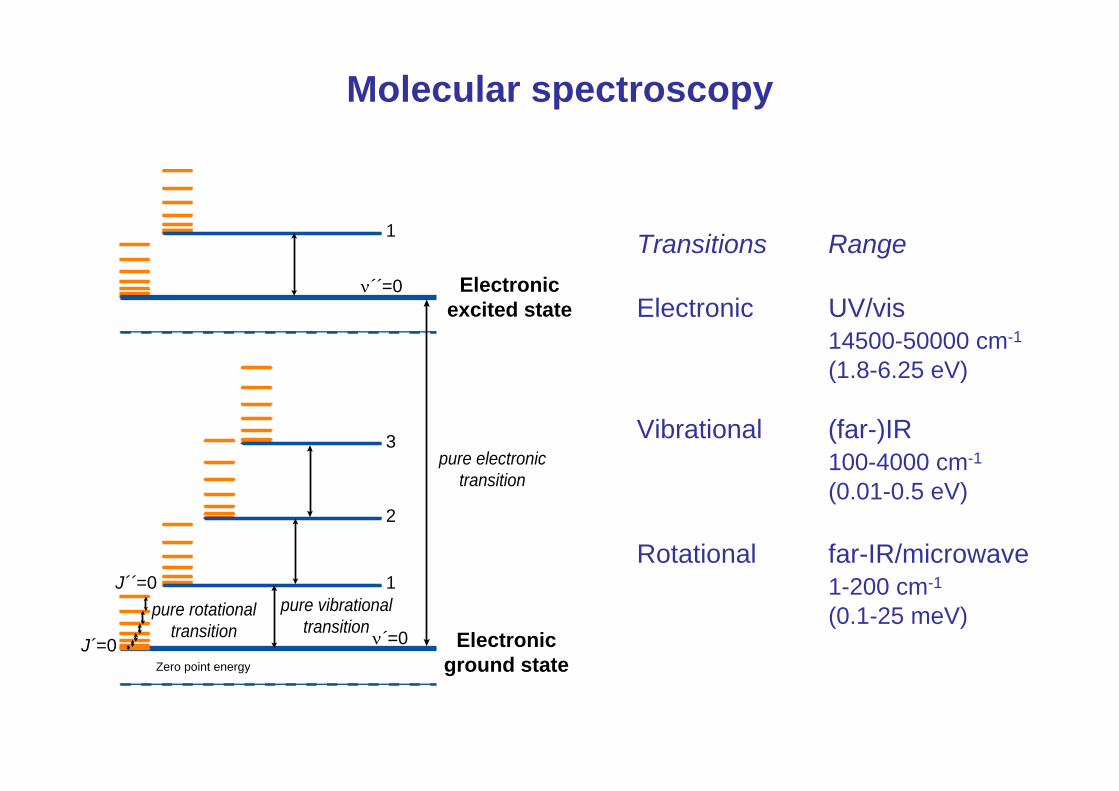
Molecular spectroscopy
pure rotationaltransition
J´=0 Electronicground state
J´´=0
Zero point energy
pure vibrationaltransition
ν´=0
1
2
3
Electronicexcited state
pure electronictransition
ν´´=0
1 Transitions Range
Electronic UV/vis14500-50000 cm-1
(1.8-6.25 eV)
Vibrational (far-)IR100-4000 cm-1
(0.01-0.5 eV)
Rotational far-IR/microwave1-200 cm-1
(0.1-25 meV)
1. Making and characterizing free metal clusters
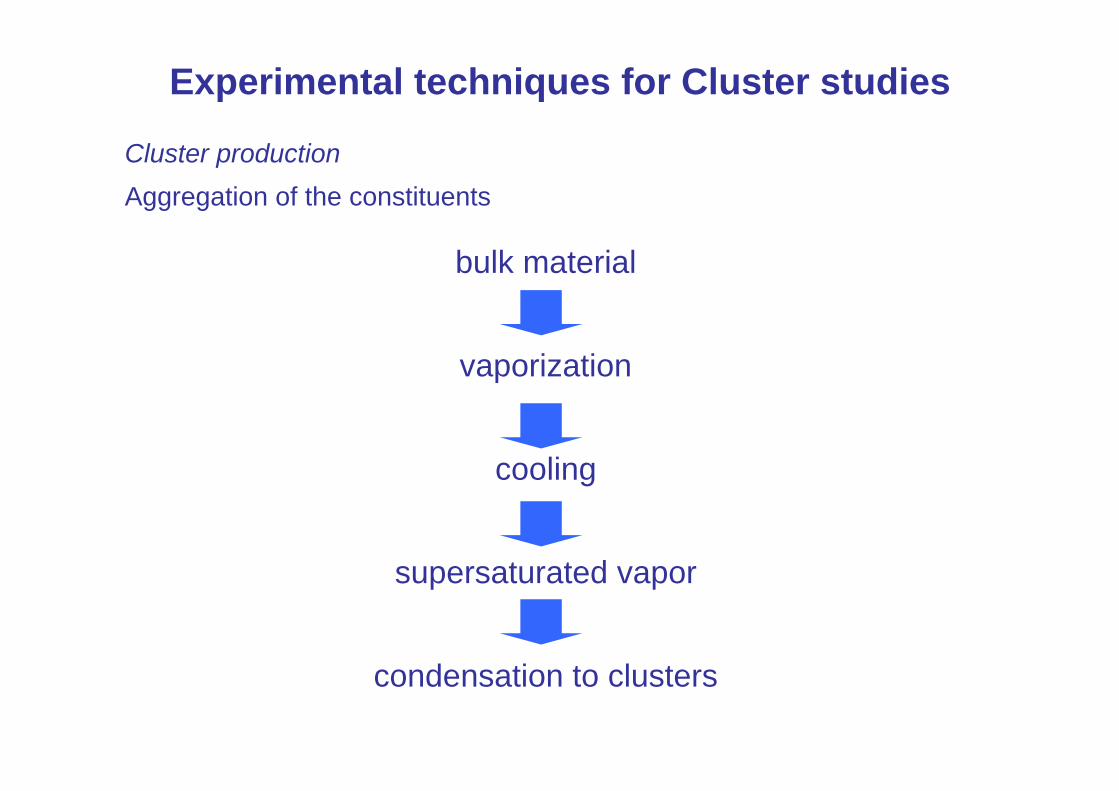
Experimental techniques for Cluster studies
Cluster productionAggregation of the constituents
bulk material
vaporization
cooling
supersaturated vapor
condensation to clusters
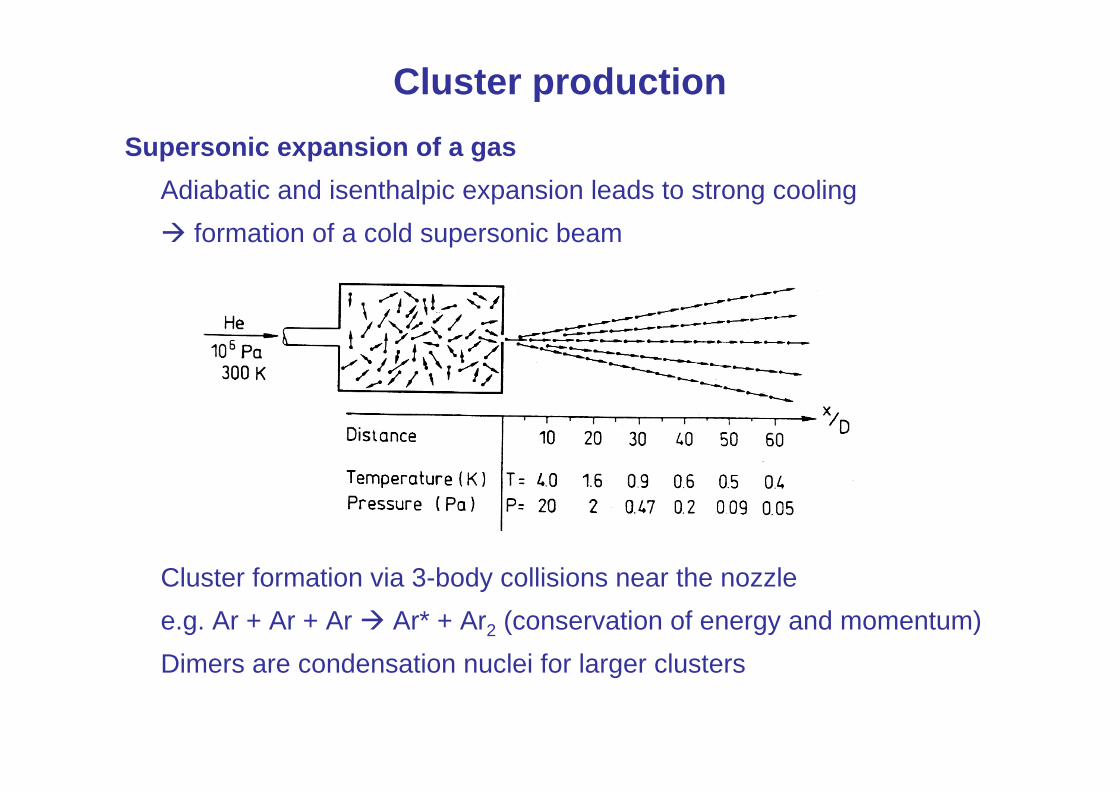
Cluster productionSupersonic expansion of a gas
Adiabatic and isenthalpic expansion leads to strong coolingformation of a cold supersonic beam
Cluster formation via 3-body collisions near the nozzlee.g. Ar + Ar + Ar Ar* + Ar2 (conservation of energy and momentum)Dimers are condensation nuclei for larger clusters
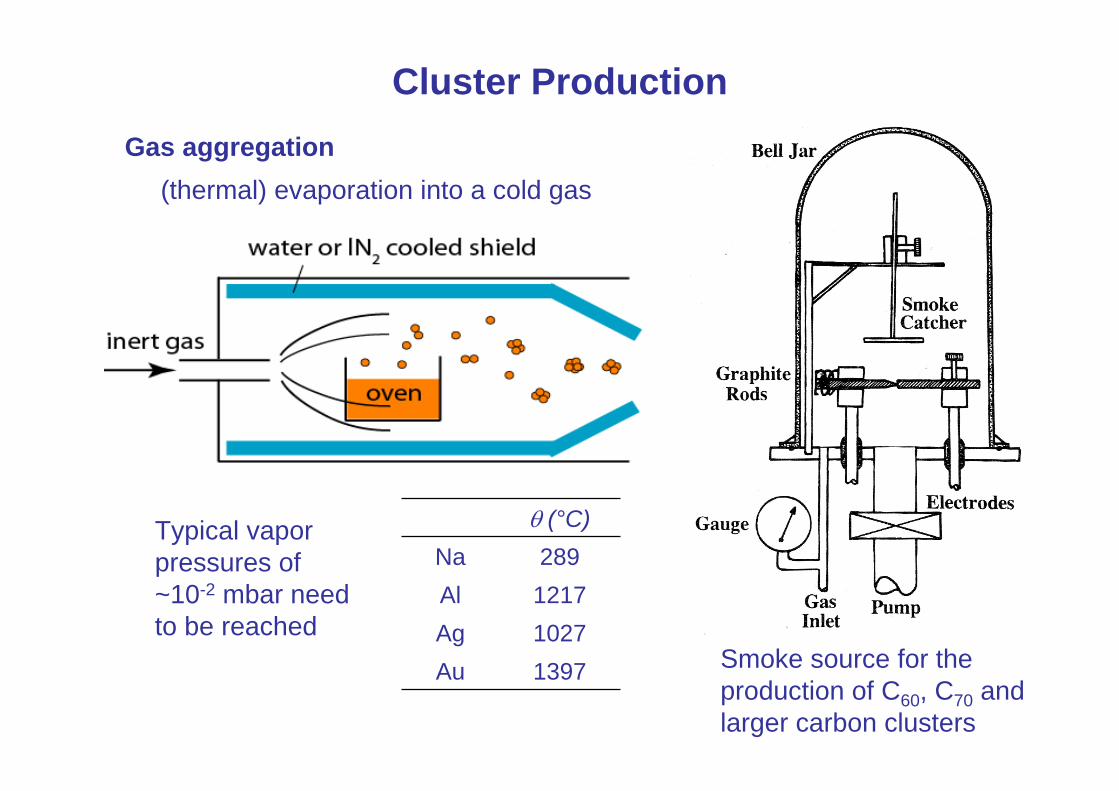
Cluster ProductionGas aggregation
(thermal) evaporation into a cold gas
Smoke source for the production of C60, C70 and larger carbon clusters
Typical vapor pressures of ~10-2 mbar need to be reached
1397Au1027Ag1217Al289Na
θ (°C)
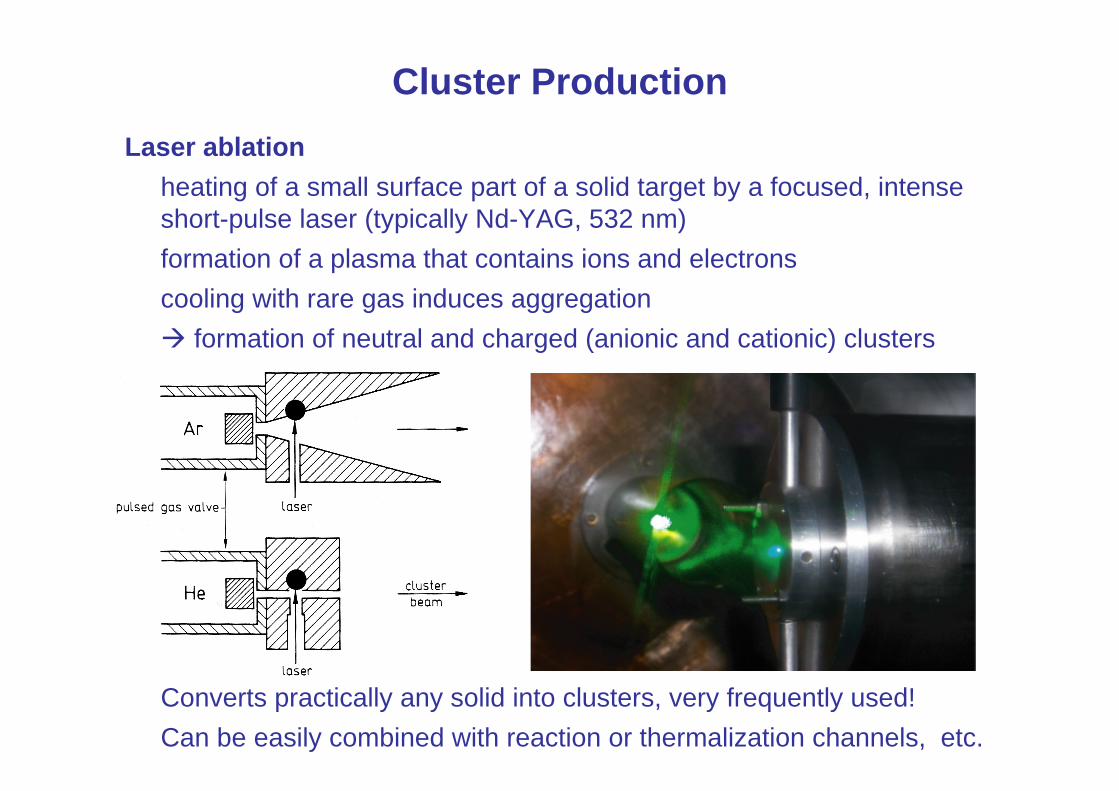
Cluster ProductionLaser ablation
heating of a small surface part of a solid target by a focused, intense short-pulse laser (typically Nd-YAG, 532 nm)formation of a plasma that contains ions and electronscooling with rare gas induces aggregation
formation of neutral and charged (anionic and cationic) clusters
Converts practically any solid into clusters, very frequently used!Can be easily combined with reaction or thermalization channels, etc.
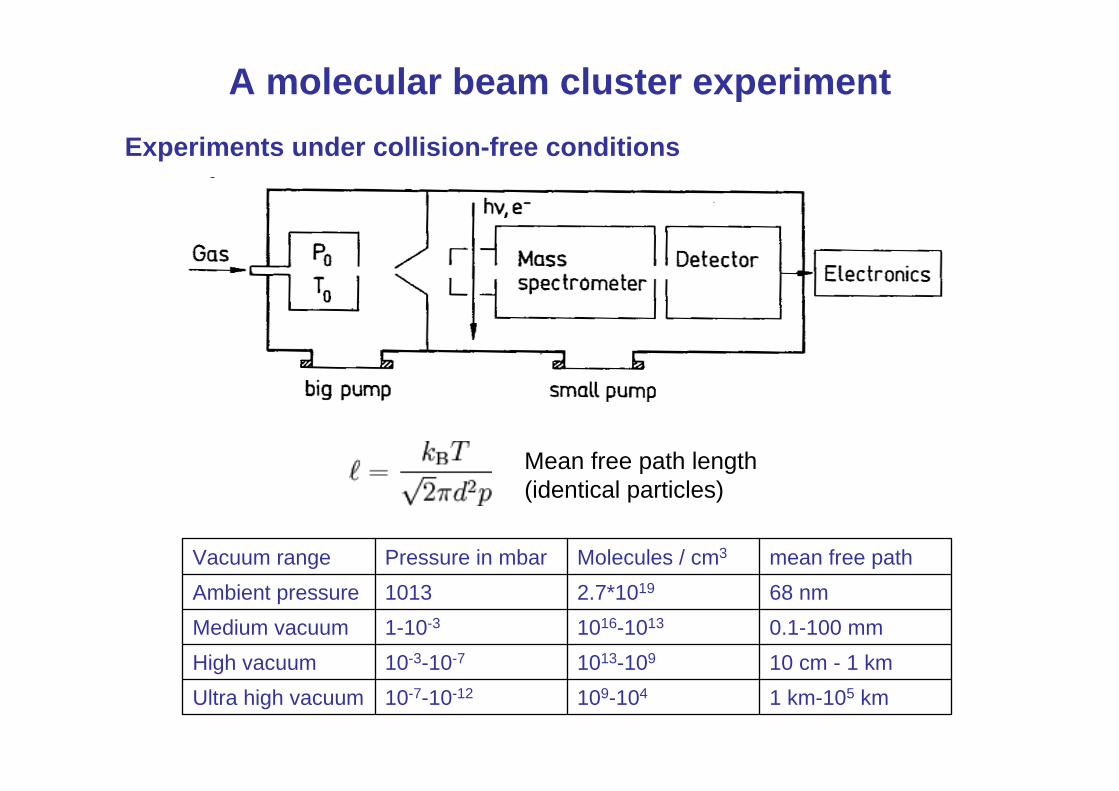
A molecular beam cluster experiment
Mean free path length (identical particles)
Experiments under collision-free conditions
1 km-105 km109-10410-7-10-12Ultra high vacuum 10 cm - 1 km1013-10910-3-10-7High vacuum 0.1-100 mm1016-10131-10-3Medium vacuum 68 nm2.7*1019 1013 Ambient pressure mean free pathMolecules / cm3Pressure in mbar Vacuum range
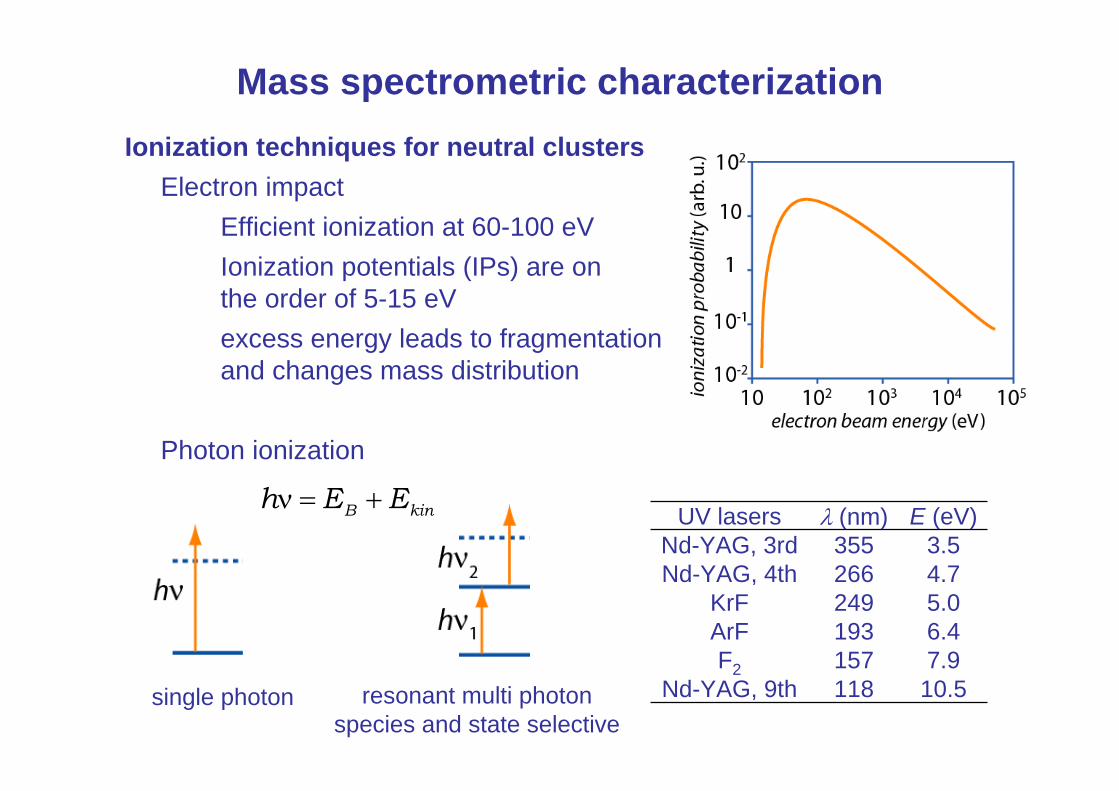
Mass spectrometric characterizationIonization techniques for neutral clusters
Electron impactEfficient ionization at 60-100 eVIonization potentials (IPs) are onthe order of 5-15 eVexcess energy leads to fragmentationand changes mass distribution
Photon ionization
7.9157F2118
193249266355
λ (nm)
4.7Nd-YAG, 4th
10.5Nd-YAG, 9th
6.4ArF5.0KrF
3.5Nd-YAG, 3rdE (eV)UV lasers
single photon resonant multi photonspecies and state selective
kinB EEh +=ν
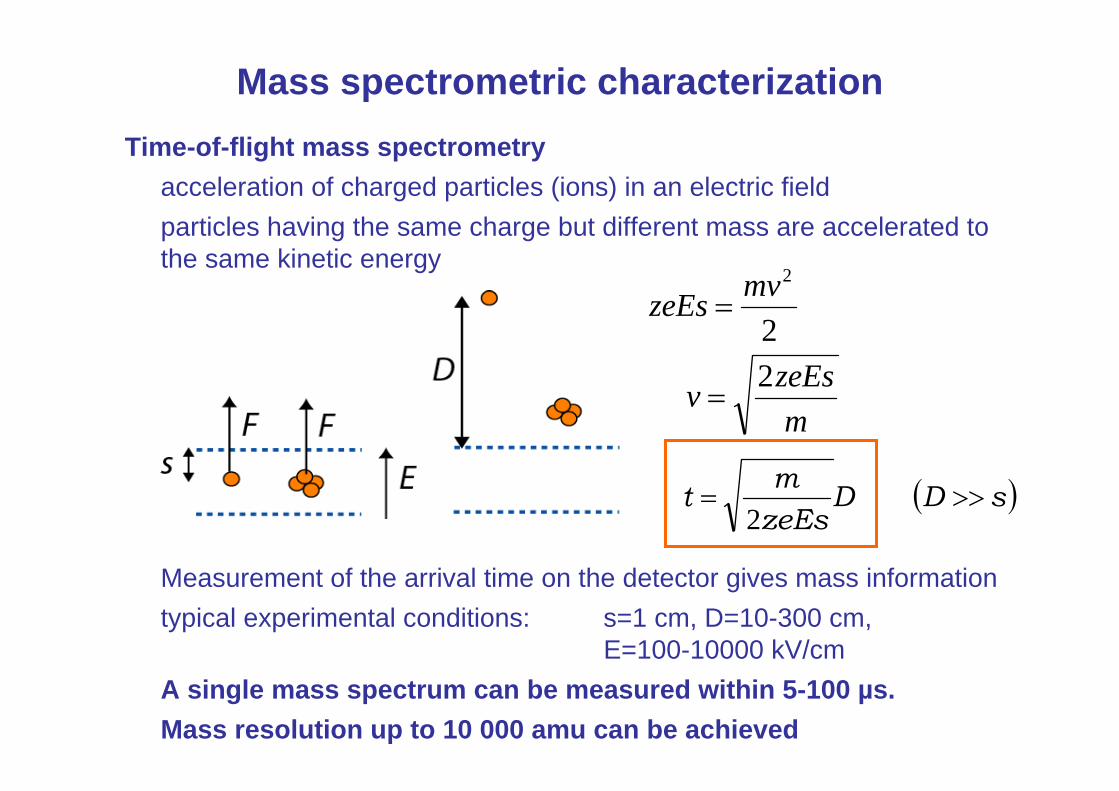
Mass spectrometric characterizationTime-of-flight mass spectrometry
acceleration of charged particles (ions) in an electric fieldparticles having the same charge but different mass are accelerated to the same kinetic energy
Measurement of the arrival time on the detector gives mass informationtypical experimental conditions: s=1 cm, D=10-300 cm,
E=100-10000 kV/cmA single mass spectrum can be measured within 5-100 µs.Mass resolution up to 10 000 amu can be achieved
2
2mvzeEs =
mzeEsv 2
=
( )sDDzeEsmt >>=
2
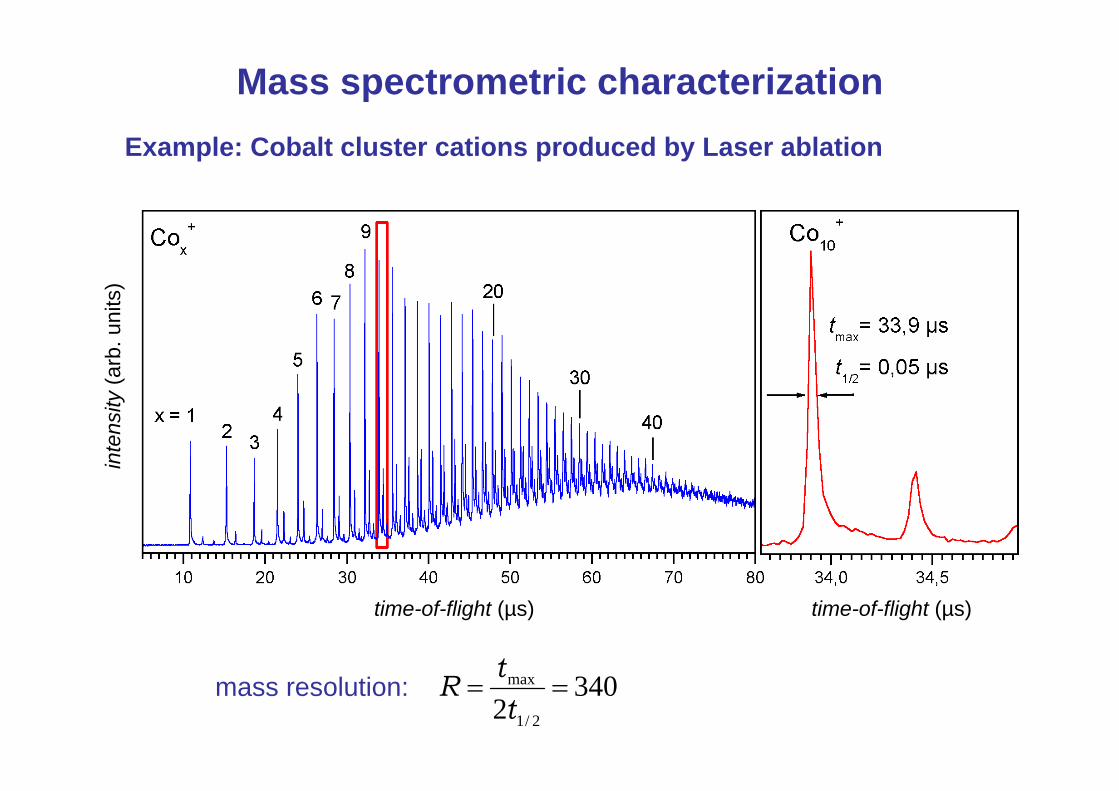
Example: Cobalt cluster cations produced by Laser ablation
Mass spectrometric characterization
time-of-flight (µs) time-of-flight (µs)
inte
nsity
(arb
. uni
ts)
mass resolution: 3402 2/1
max ==ttR
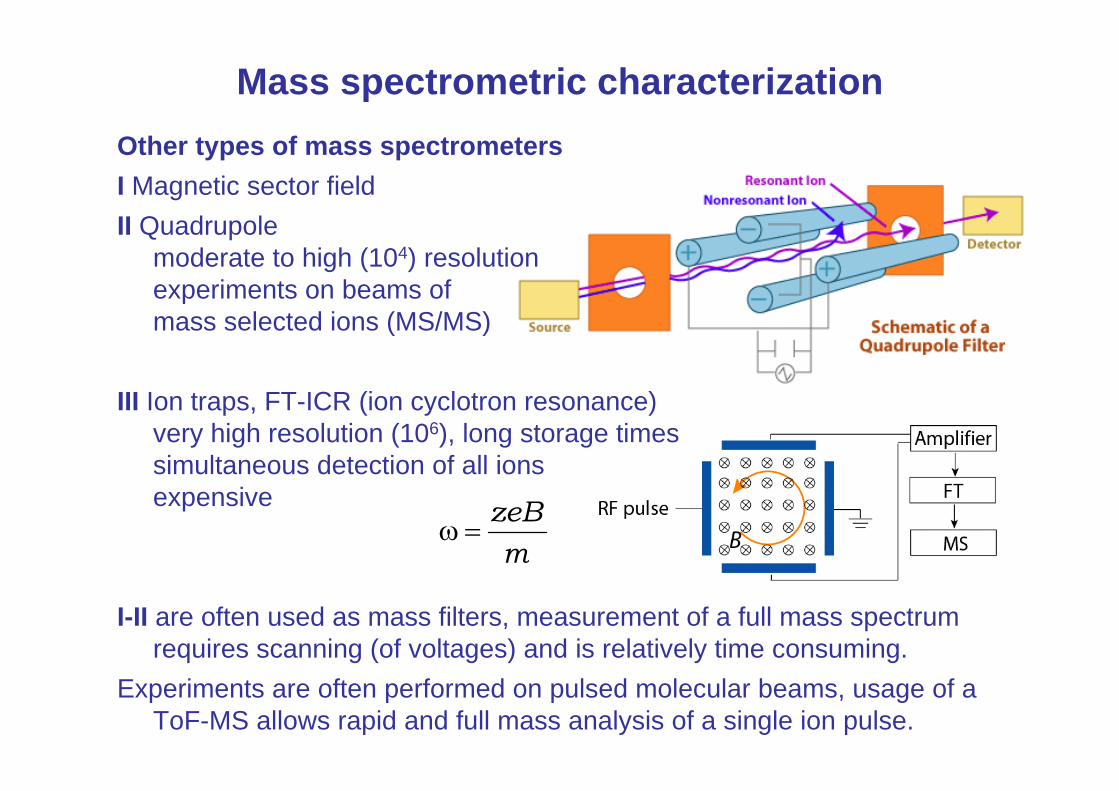
Other types of mass spectrometersI Magnetic sector fieldII Quadrupole
moderate to high (104) resolution experiments on beams of mass selected ions (MS/MS)
III Ion traps, FT-ICR (ion cyclotron resonance) very high resolution (106), long storage timessimultaneous detection of all ionsexpensive
I-II are often used as mass filters, measurement of a full mass spectrum requires scanning (of voltages) and is relatively time consuming.
Experiments are often performed on pulsed molecular beams, usage of a ToF-MS allows rapid and full mass analysis of a single ion pulse.
Mass spectrometric characterization
mzeB
=ω
2. Vibrational spectroscopy of size selected clusters
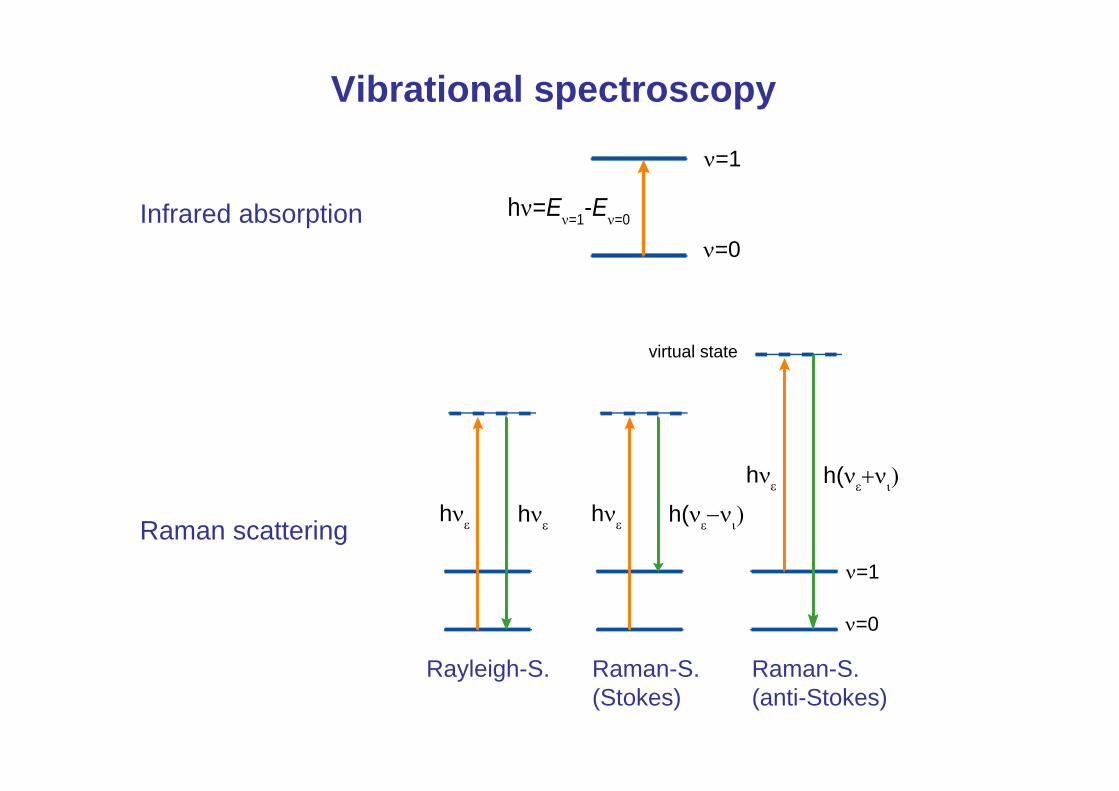
Vibrational spectroscopy
Infrared absorption
Raman scattering
ν=0
ν=1
hνε hνε hνε h(νε−νι)
hνε h(νε+νι)
virtual state
ν=0
ν=1
hν=Eν=1-Eν=0
Rayleigh-S. Raman-S.(Stokes)
Raman-S.(anti-Stokes)
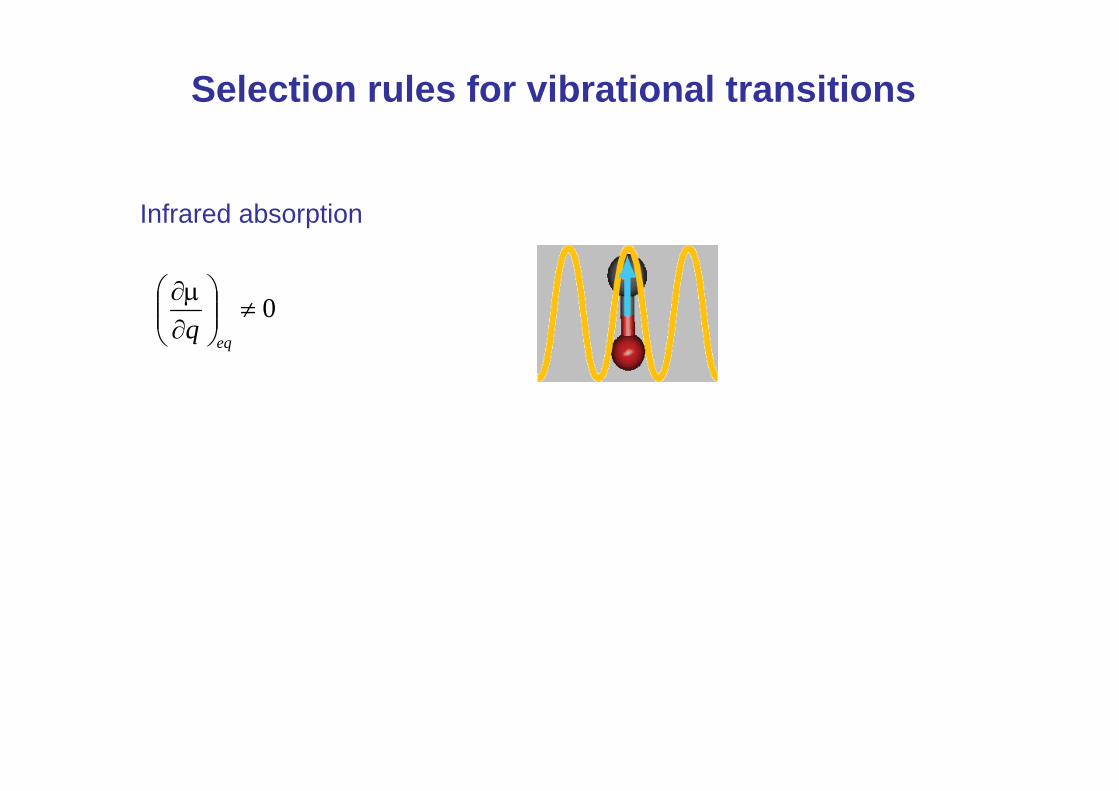
Selection rules for vibrational transitions
Infrared absorption
0≠⎟⎟⎠
⎞⎜⎜⎝
⎛∂μ∂
eqq
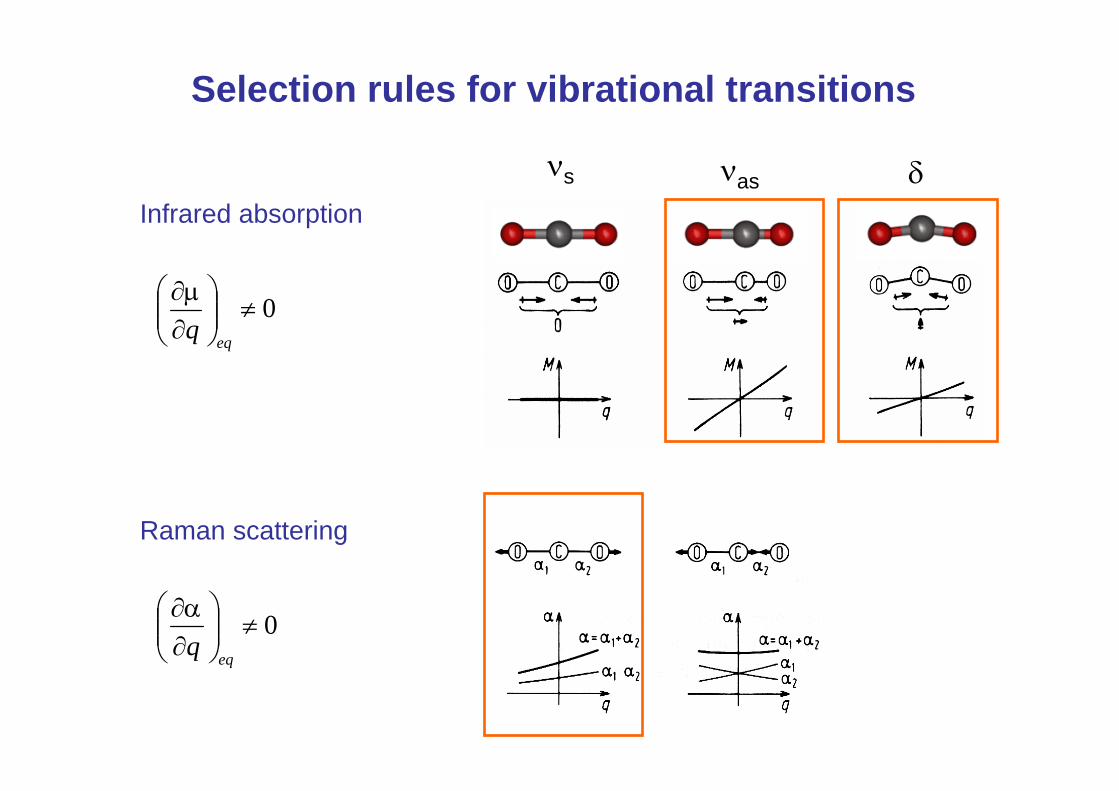
Selection rules for vibrational transitions
Infrared absorption
Raman scattering
0≠⎟⎟⎠
⎞⎜⎜⎝
⎛∂α∂
eqq
0≠⎟⎟⎠
⎞⎜⎜⎝
⎛∂μ∂
eqq
νs νas δ
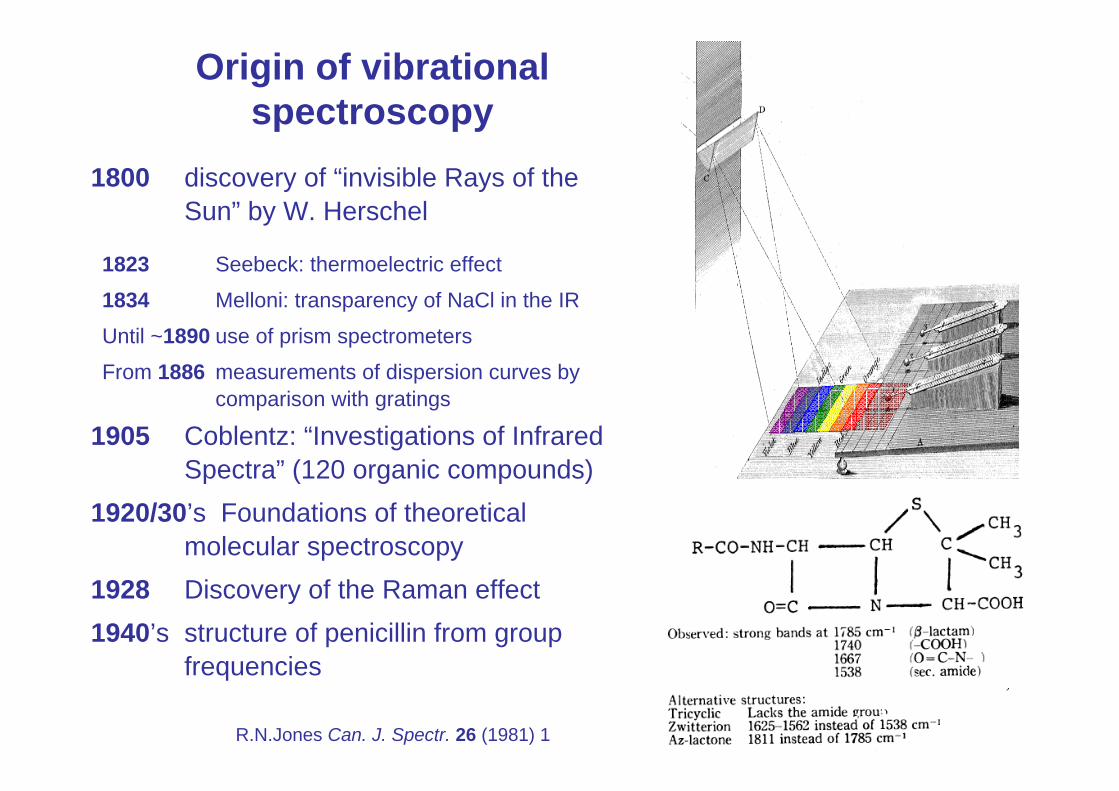
Origin of vibrational spectroscopy
1800 discovery of “invisible Rays of the Sun” by W. Herschel
1905 Coblentz: “Investigations of Infrared Spectra” (120 organic compounds)
1920/30’s Foundations of theoretical molecular spectroscopy
1928 Discovery of the Raman effect 1940’s structure of penicillin from group
frequencies
1823 Seebeck: thermoelectric effect
1834 Melloni: transparency of NaCl in the IR
Until ~1890 use of prism spectrometers
From 1886 measurements of dispersion curves by comparison with gratings
R.N.Jones Can. J. Spectr. 26 (1981) 1
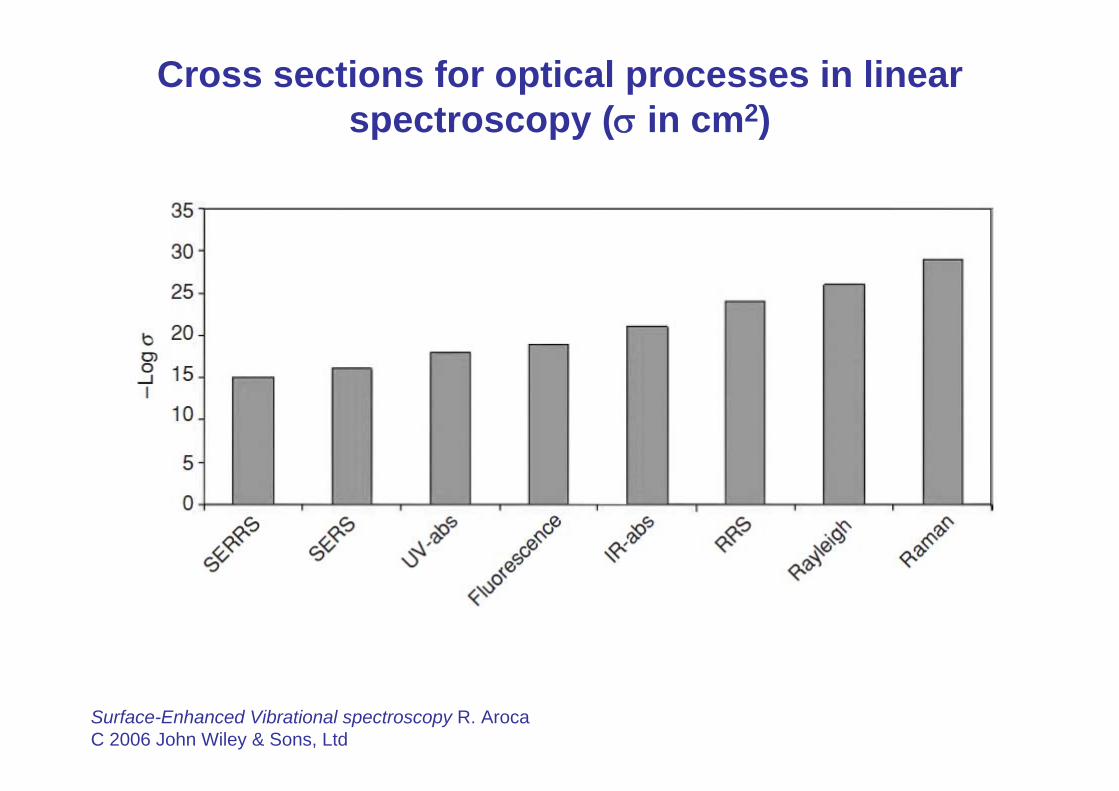
Cross sections for optical processes in linear spectroscopy (σ in cm2)
Surface-Enhanced Vibrational spectroscopy R. ArocaC 2006 John Wiley & Sons, Ltd
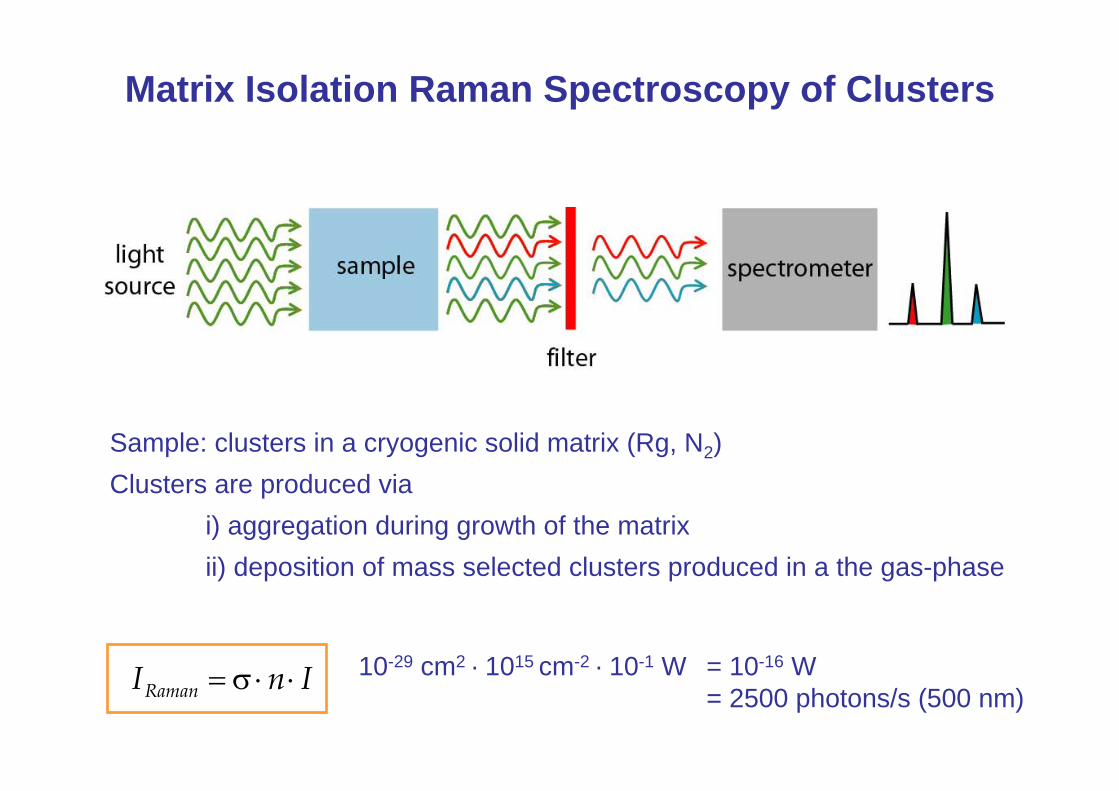
Matrix Isolation Raman Spectroscopy of Clusters
Sample: clusters in a cryogenic solid matrix (Rg, N2)Clusters are produced via
i) aggregation during growth of the matrixii) deposition of mass selected clusters produced in a the gas-phase
InIRaman ⋅⋅σ= 10-29 cm2 · 1015 cm-2 · 10-1 W = 10-16 W = 2500 photons/s (500 nm)
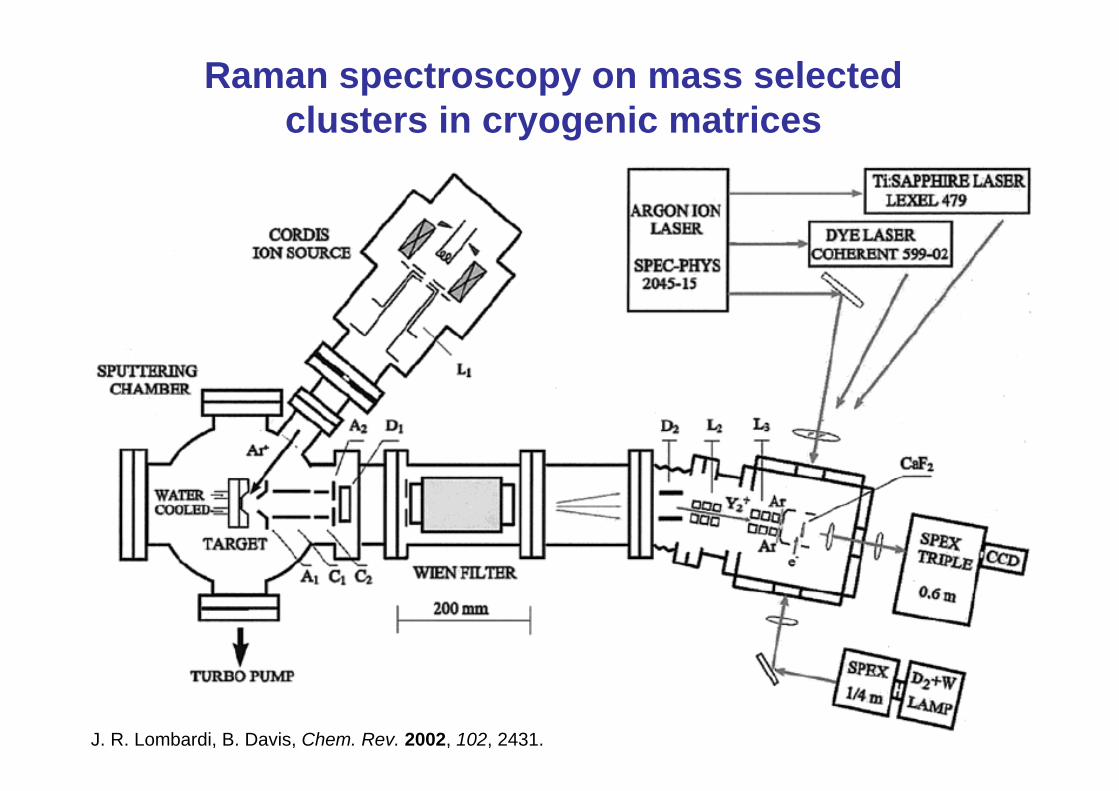
Raman spectroscopy on mass selected clusters in cryogenic matrices
J. R. Lombardi, B. Davis, Chem. Rev. 2002, 102, 2431.
Approaches for size-selectivity
a) Mass selection, accumulation, spectroscopy
b) Size-specific detection ( Action spectroscopy)
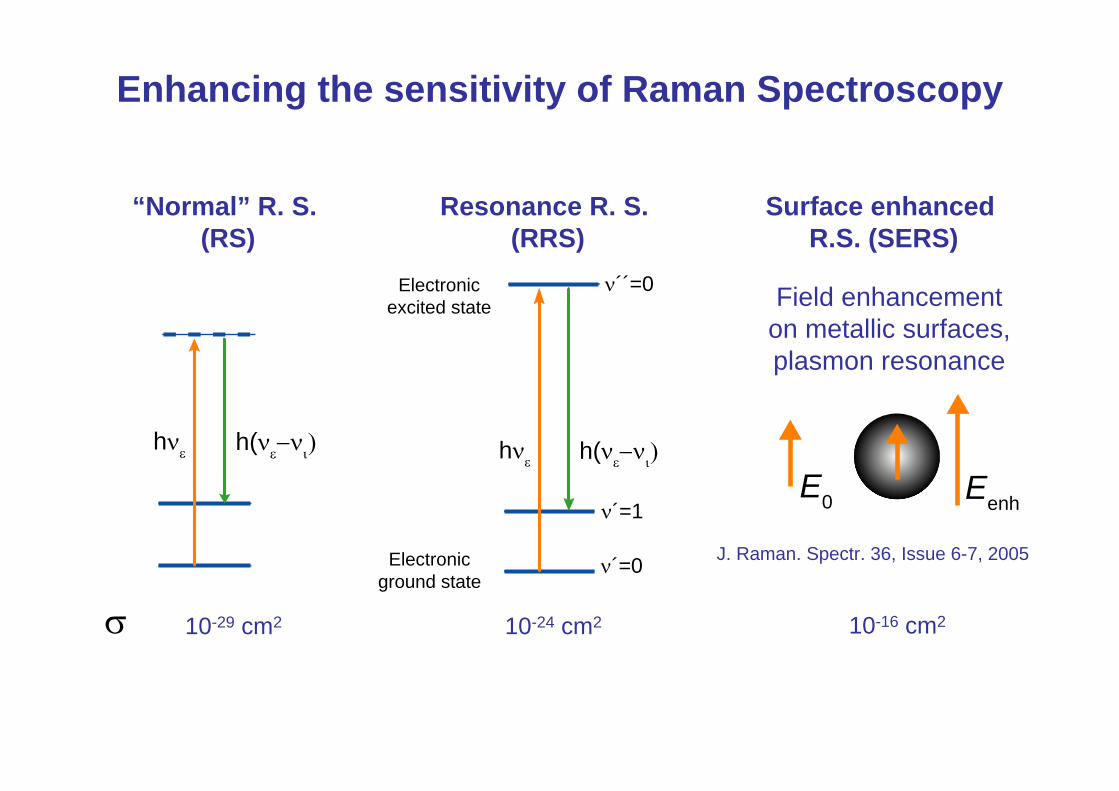
Enhancing the sensitivity of Raman Spectroscopy
hνε h(νε−νι)
ν´=0
ν´=1
ν´´=0
Resonance R. S. (RRS)
Electronicground state
Electronicexcited state
10-24 cm2
Surface enhanced R.S. (SERS)
10-16 cm2
“Normal” R. S. (RS)
10-29 cm2
hνε h(νε−νι)
Field enhancement on metallic surfaces,plasmon resonance
J. Raman. Spectr. 36, Issue 6-7, 2005
E0 Eenh
σ
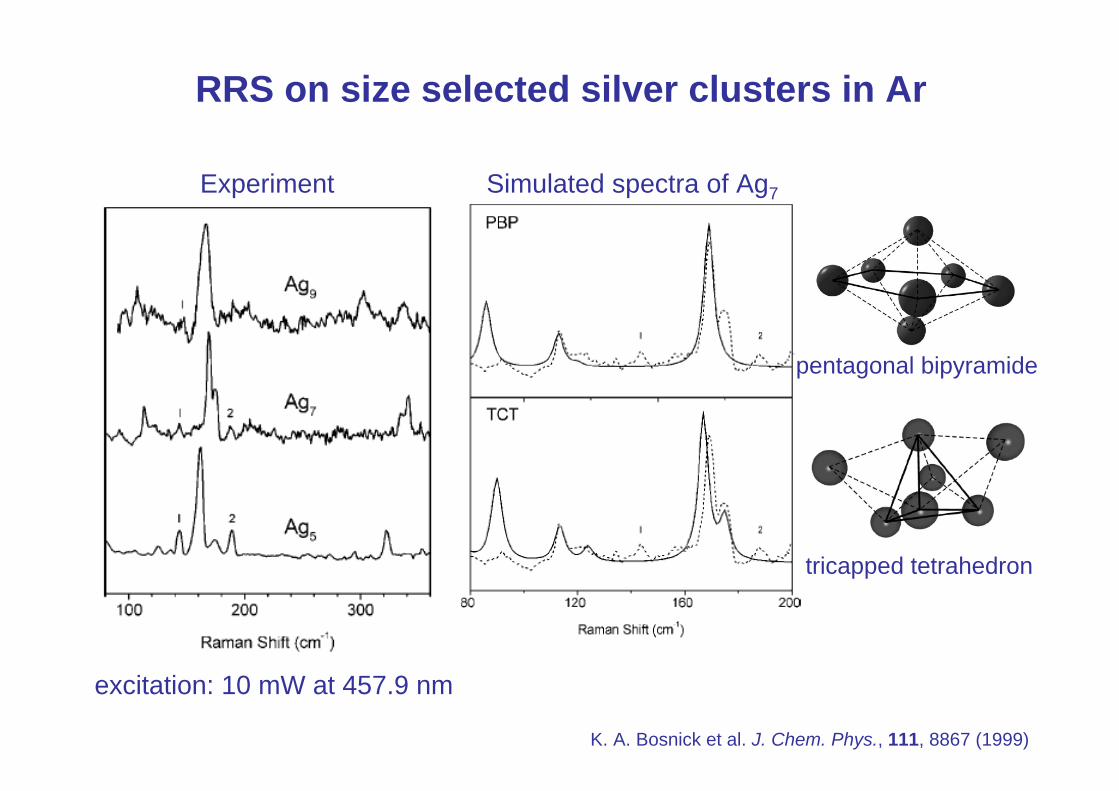
RRS on size selected silver clusters in Ar
K. A. Bosnick et al. J. Chem. Phys., 111, 8867 (1999)
excitation: 10 mW at 457.9 nm
Experiment Simulated spectra of Ag7
pentagonal bipyramide
tricapped tetrahedron
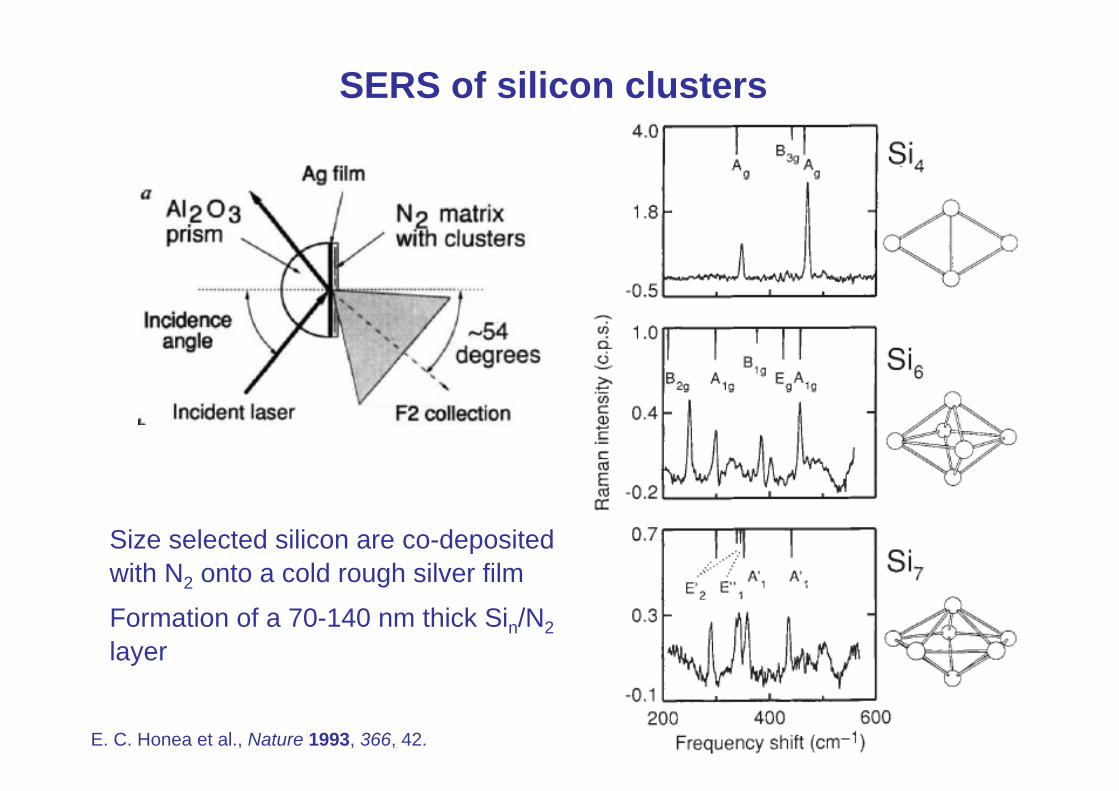
SERS of silicon clusters
Size selected silicon are co-deposited with N2 onto a cold rough silver film
Formation of a 70-140 nm thick Sin/N2layer
E. C. Honea et al., Nature 1993, 366, 42.
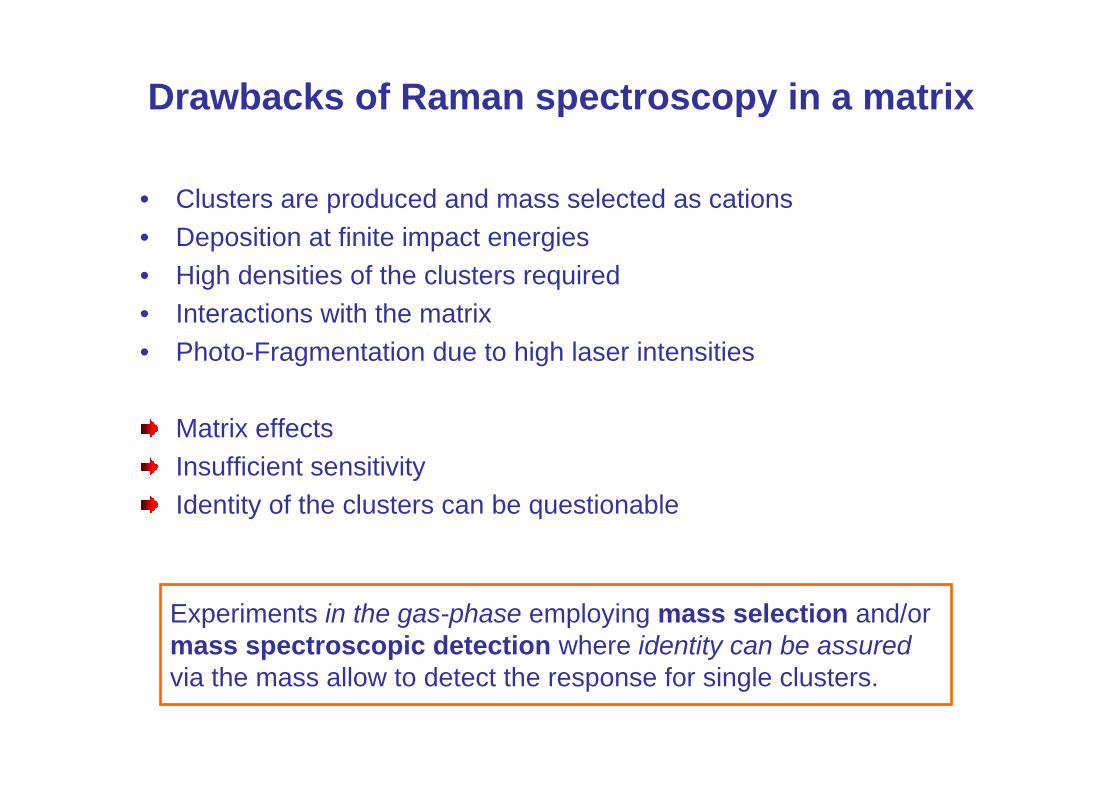
Drawbacks of Raman spectroscopy in a matrix
• Clusters are produced and mass selected as cations• Deposition at finite impact energies• High densities of the clusters required• Interactions with the matrix• Photo-Fragmentation due to high laser intensities
Matrix effectsInsufficient sensitivityIdentity of the clusters can be questionable
Experiments in the gas-phase employing mass selection and/or mass spectroscopic detection where identity can be assuredvia the mass allow to detect the response for single clusters.
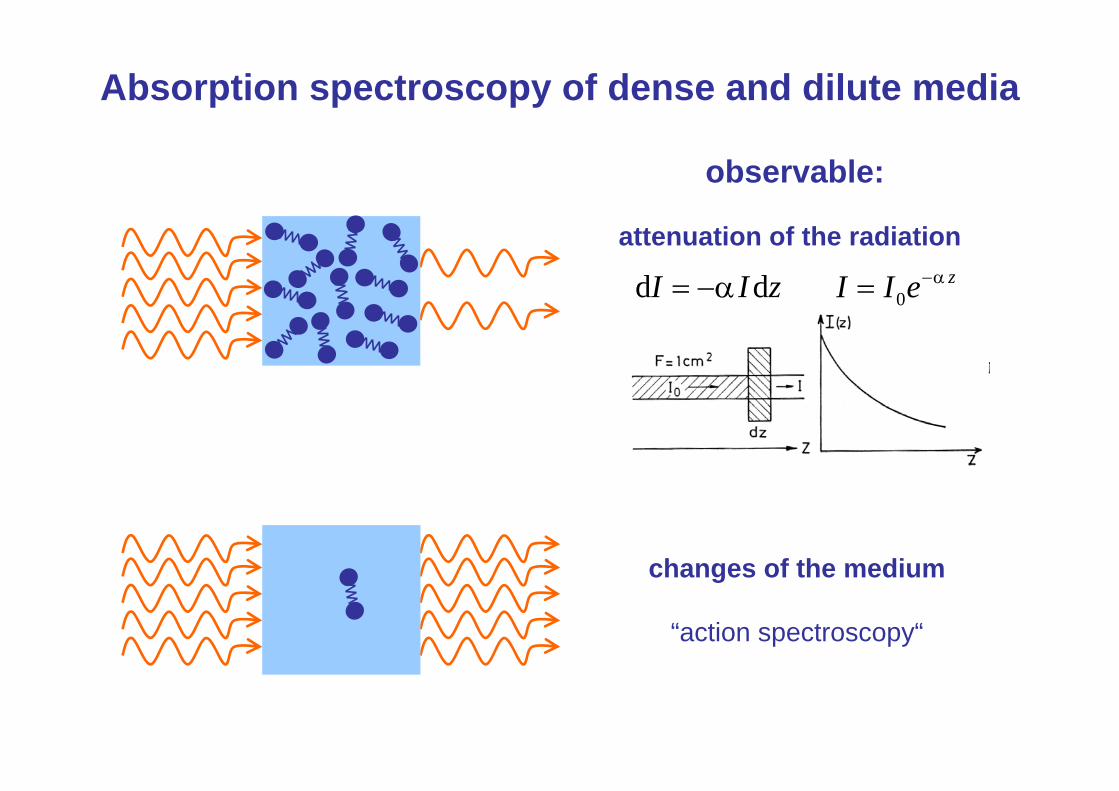
Absorption spectroscopy of dense and dilute media
observable:
changes of the medium
“action spectroscopy“
attenuation of the radiation
zII dd α−= zeII α−= 0
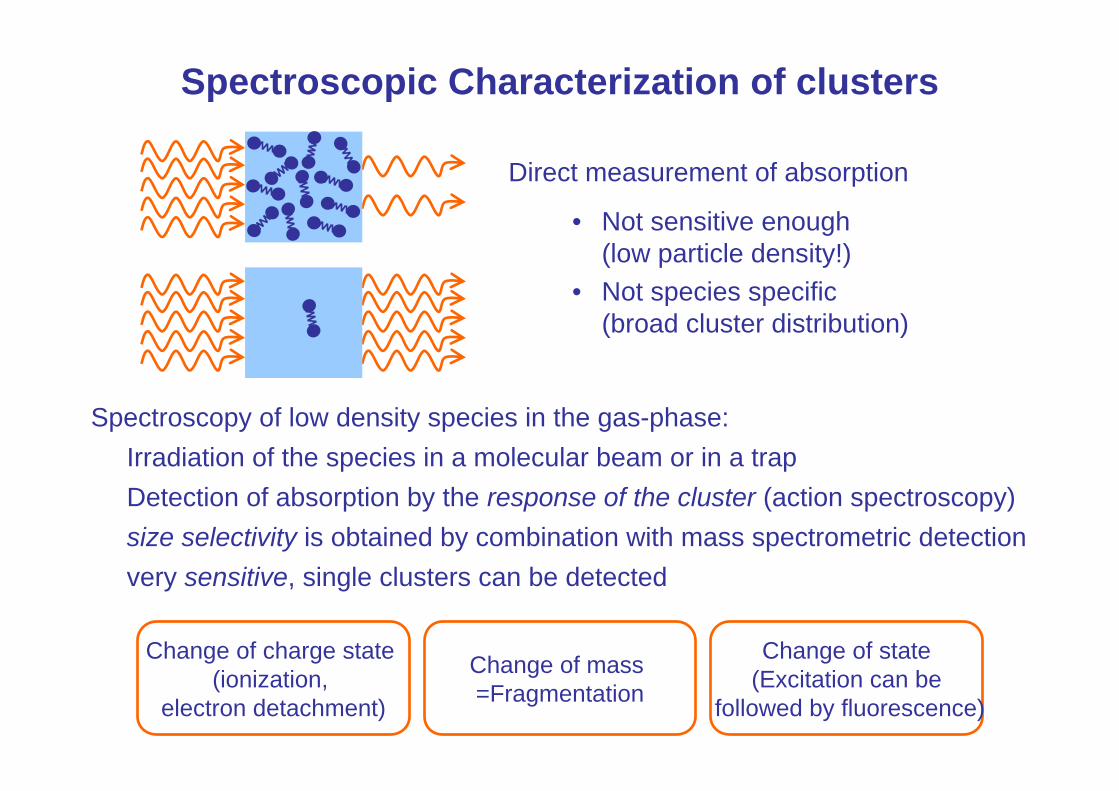
Spectroscopy of low density species in the gas-phase:Irradiation of the species in a molecular beam or in a trapDetection of absorption by the response of the cluster (action spectroscopy)size selectivity is obtained by combination with mass spectrometric detectionvery sensitive, single clusters can be detected
Spectroscopic Characterization of clusters
• Not sensitive enough(low particle density!)
• Not species specific(broad cluster distribution)
Direct measurement of absorption
Change of charge state (ionization,
electron detachment)
Change of mass =Fragmentation
Change of state(Excitation can be
followed by fluorescence)
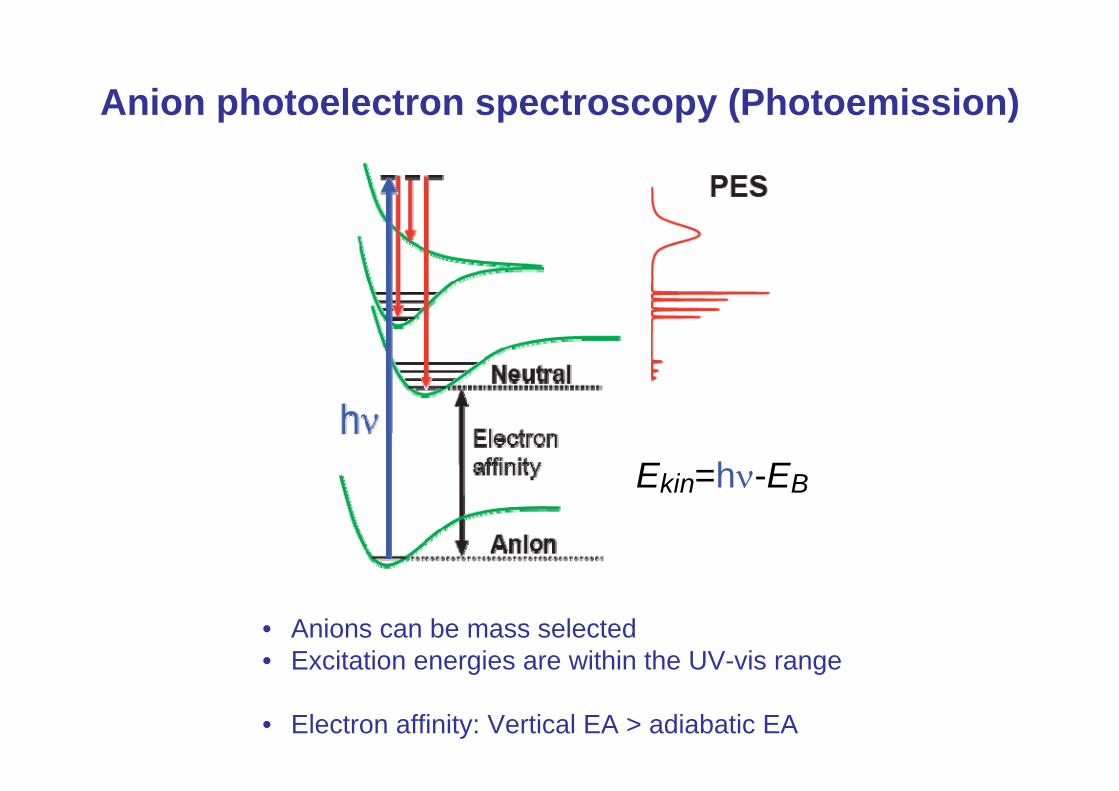
Anion photoelectron spectroscopy (Photoemission)
• Anions can be mass selected• Excitation energies are within the UV-vis range
• Electron affinity: Vertical EA > adiabatic EA
Ekin=hν-EB
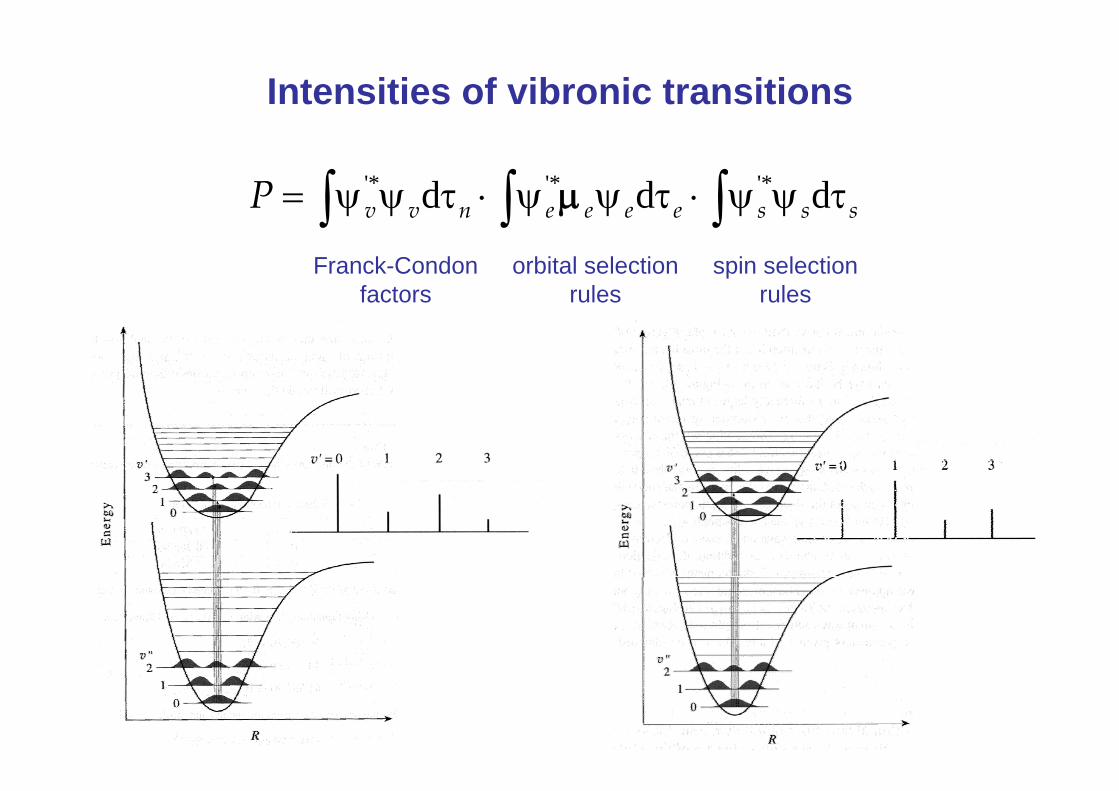
Intensities of vibronic transitions
∫∫∫ τψψ⋅τψψ⋅τψψ= ssseeeenvvP ddd '*'*'* μ
orbital selectionrules
spin selectionrules
Franck-Condonfactors
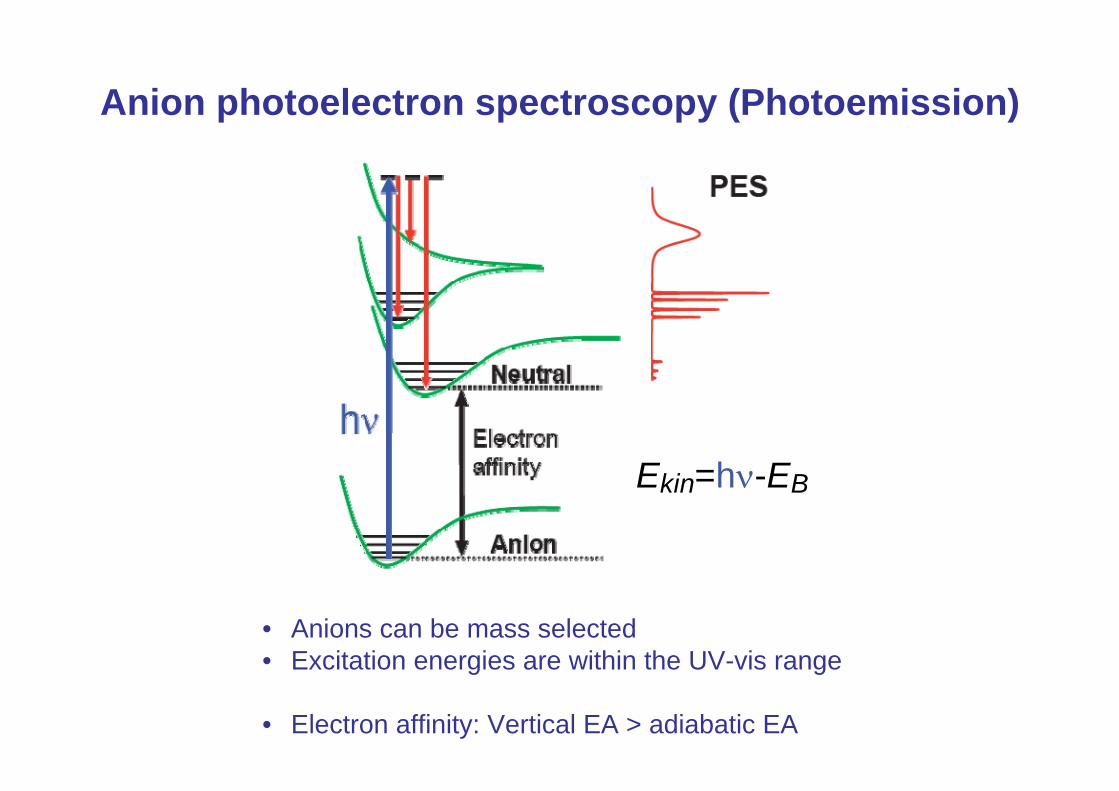
Anion photoelectron spectroscopy (Photoemission)
• Anions can be mass selected• Excitation energies are within the UV-vis range
• Electron affinity: Vertical EA > adiabatic EA
Ekin=hν-EB
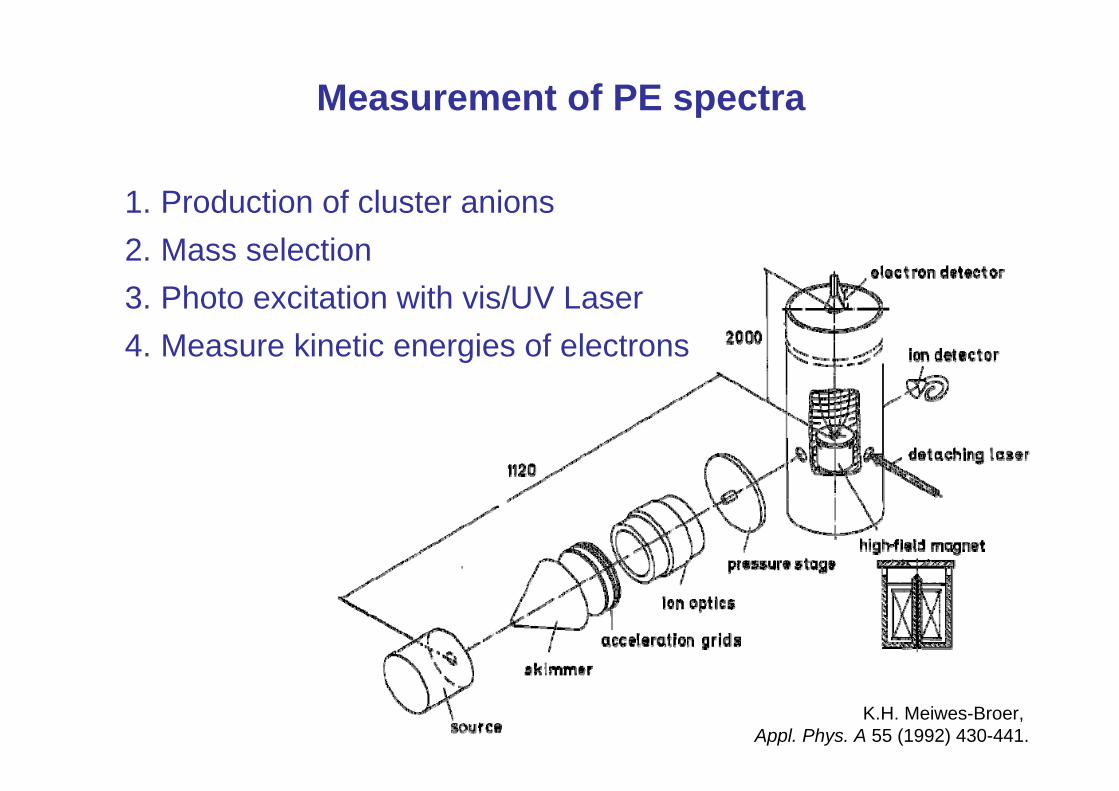
Measurement of PE spectra
K.H. Meiwes-Broer, Appl. Phys. A 55 (1992) 430-441.
1. Production of cluster anions2. Mass selection3. Photo excitation with vis/UV Laser4. Measure kinetic energies of electrons
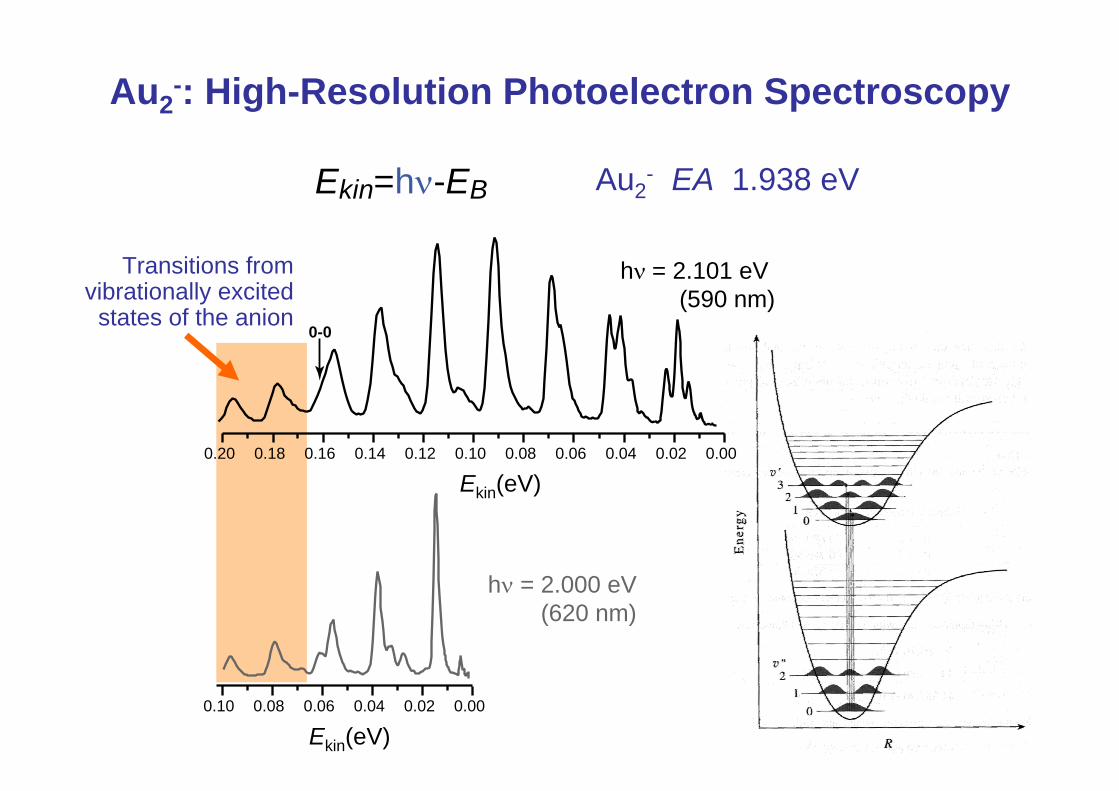
Au2-: High-Resolution Photoelectron Spectroscopy
0-0
hν = 2.000 eV(620 nm)
hν = 2.101 eV(590 nm)
0.20 0.18 0.16 0.14 0.12 0.10 0.08 0.06 0.04 0.02 0.00
Au2- EA 1.938 eV
Ekin(eV)
0.10 0.08 0.06 0.04 0.02 0.00
Ekin(eV)
Transitions from vibrationally excited
states of the anion
Ekin=hν-EB
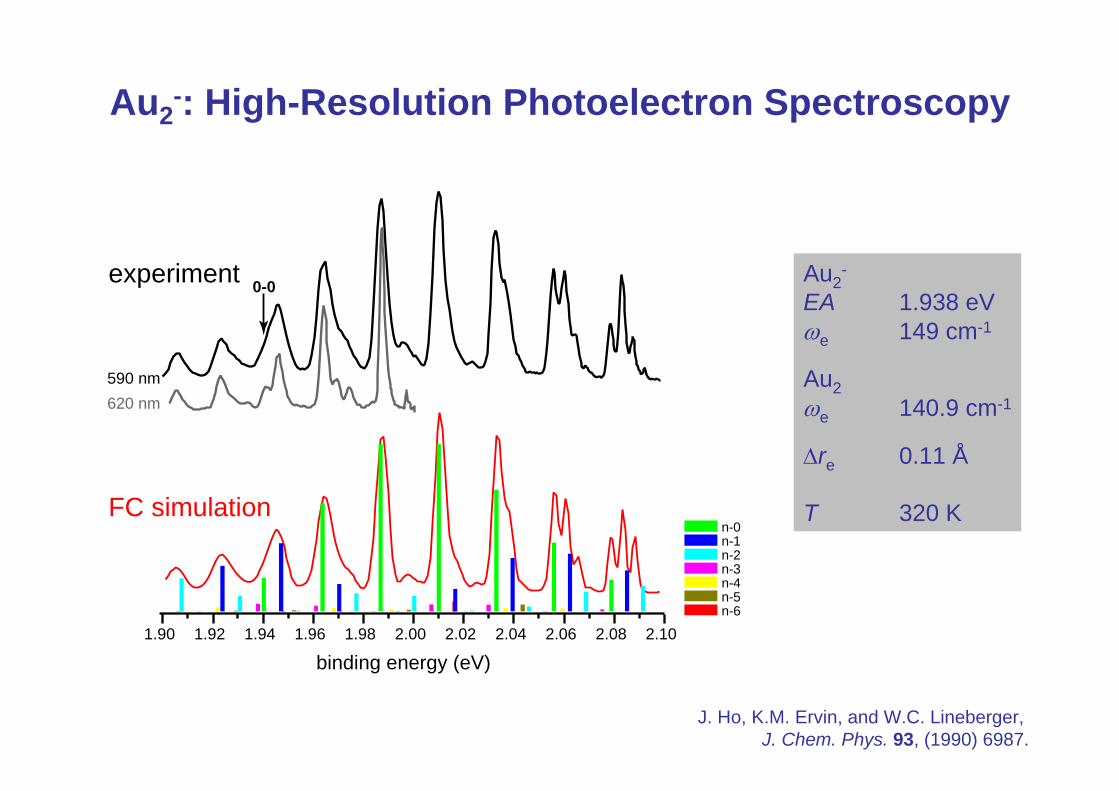
Au2-: High-Resolution Photoelectron Spectroscopy
experiment
FC simulation
Au2-
EA 1.938 eVωe 149 cm-1
Au2ωe 140.9 cm-1
Δre 0.11 Å
T 320 K
J. Ho, K.M. Ervin, and W.C. Lineberger, J. Chem. Phys. 93, (1990) 6987.
1.90 1.92 1.94 1.96 1.98 2.00 2.02 2.04 2.06 2.08 2.10
binding energy (eV)
n-0n-1n-2n-3n-4n-5n-6
0-0
620 nm590 nm
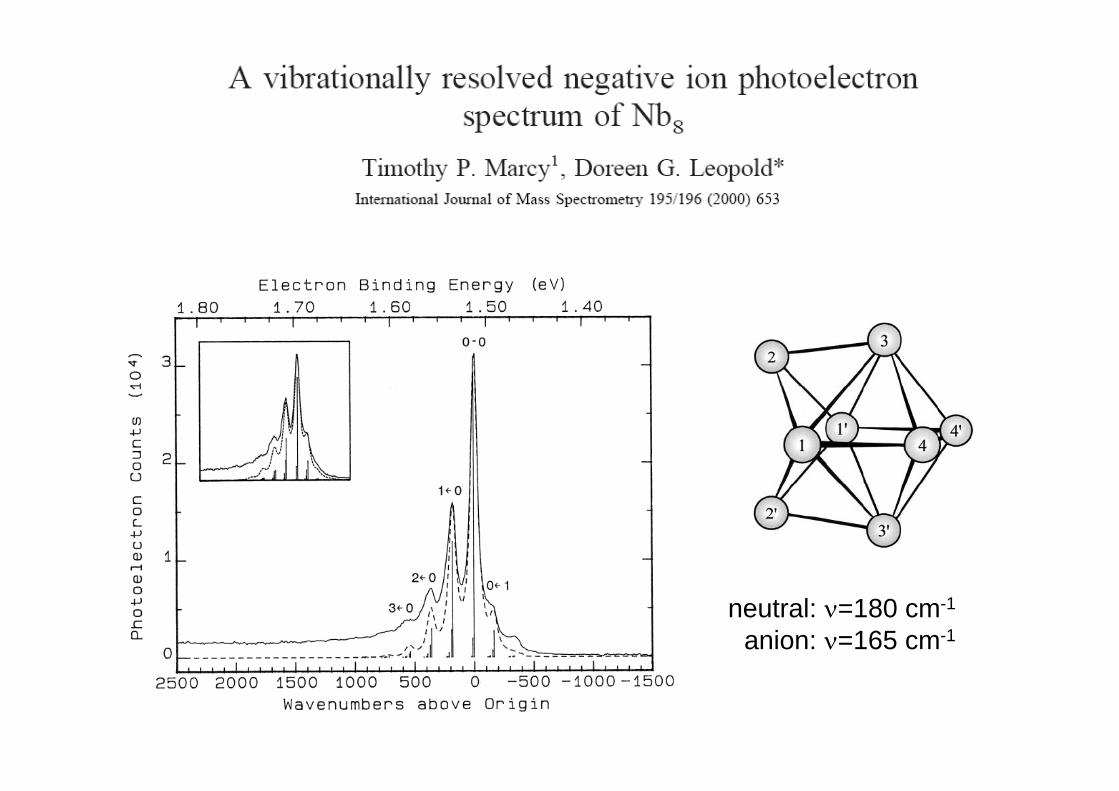
neutral: ν=180 cm-1
anion: ν=165 cm-1
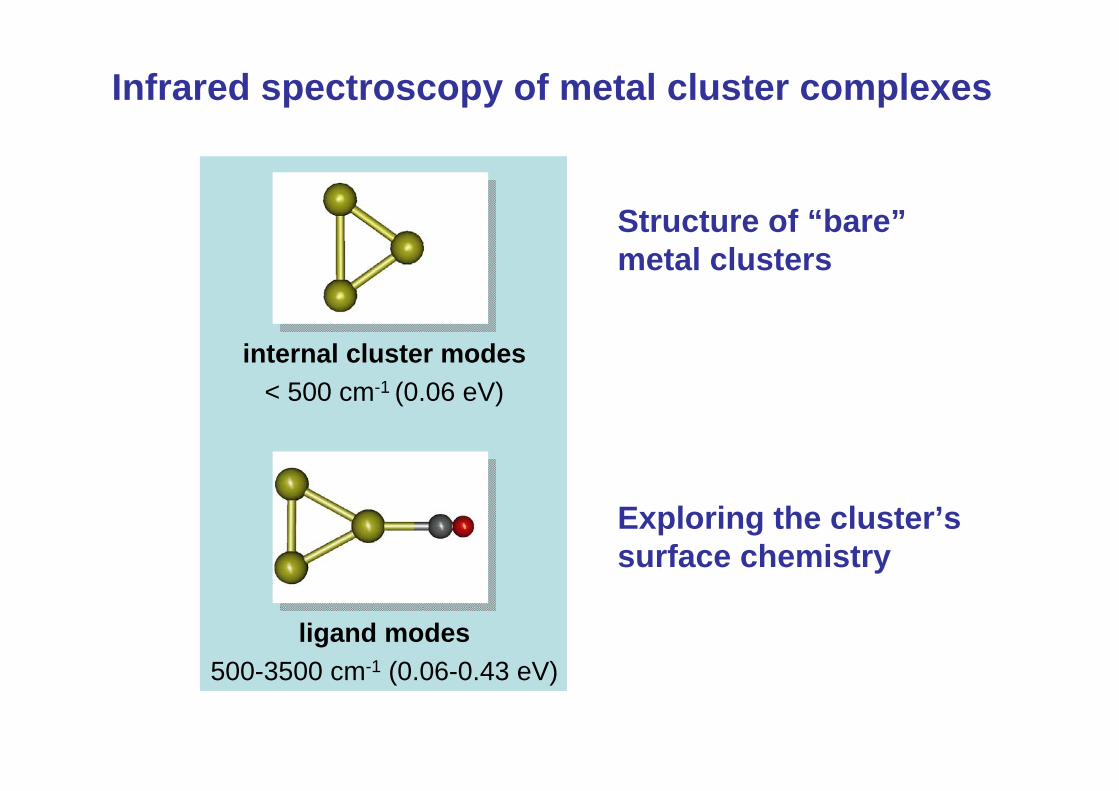
Infrared spectroscopy of metal cluster complexes
ligand modes500-3500 cm-1 (0.06-0.43 eV)
internal cluster modes< 500 cm-1 (0.06 eV)
Structure of “bare”metal clusters
Exploring the cluster’s surface chemistry
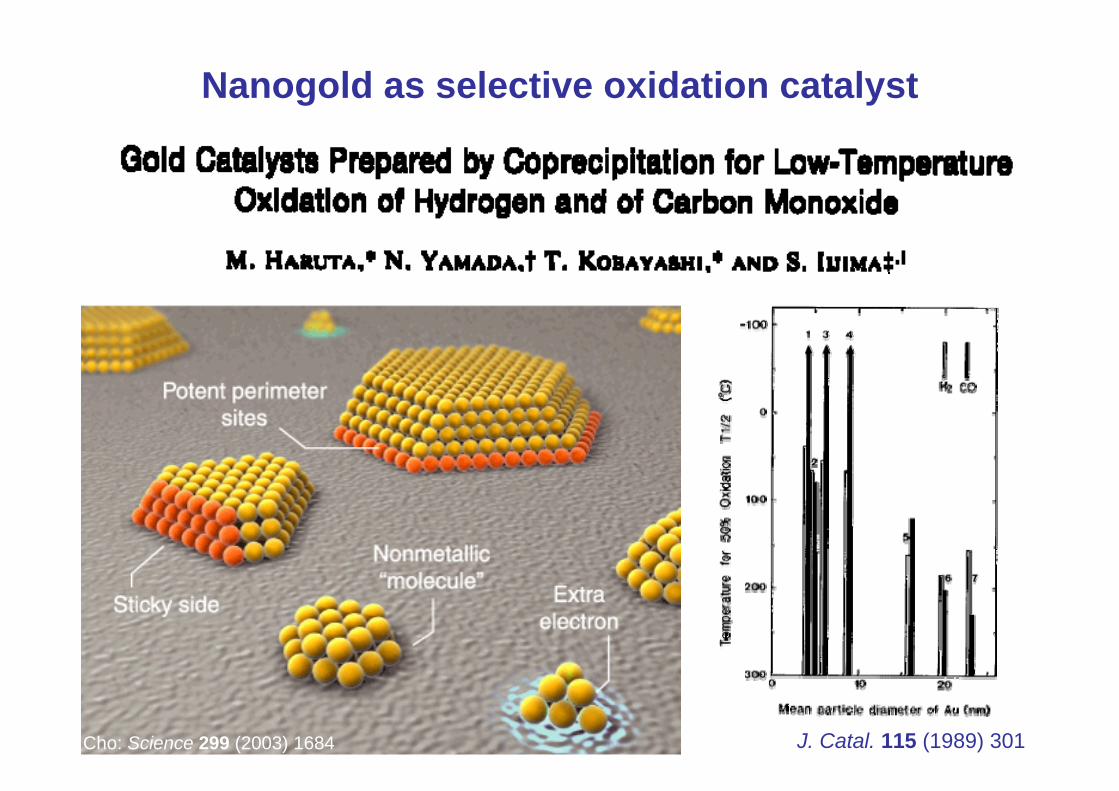
Nanogold as selective oxidation catalyst
J. Catal. 115 (1989) 301Cho: Science 299 (2003) 1684
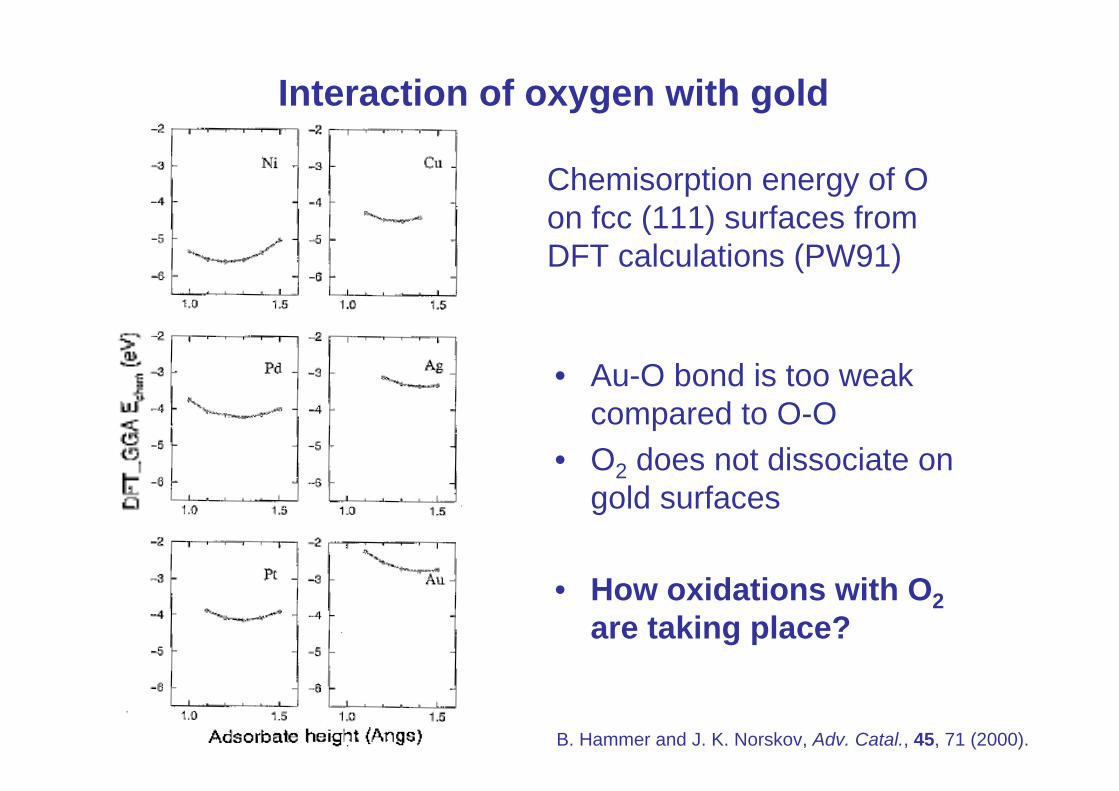
Interaction of oxygen with gold
• Au-O bond is too weak compared to O-O
• O2 does not dissociate on gold surfaces
• How oxidations with O2are taking place?
Chemisorption energy of O on fcc (111) surfaces from DFT calculations (PW91)
B. Hammer and J. K. Norskov, Adv. Catal., 45, 71 (2000).
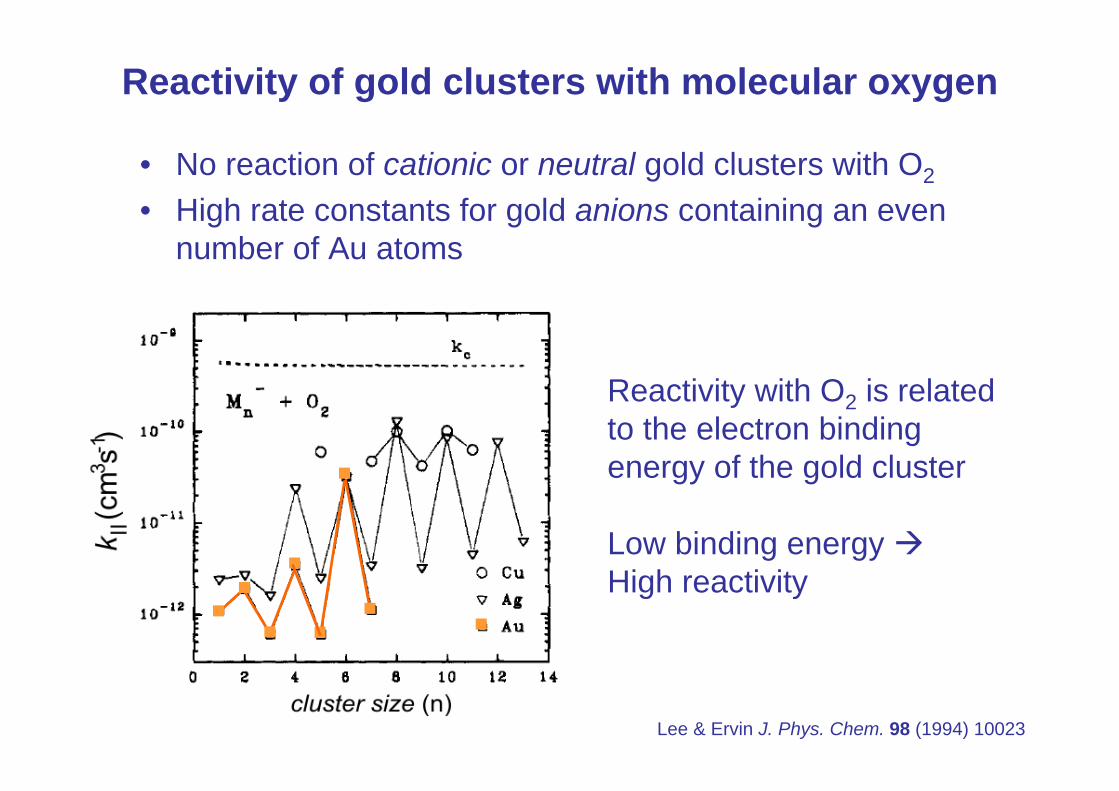
Reactivity of gold clusters with molecular oxygen
■■
■ ■
■
■
■
■
Lee & Ervin J. Phys. Chem. 98 (1994) 10023
• No reaction of cationic or neutral gold clusters with O2
• High rate constants for gold anions containing an even number of Au atoms
Reactivity with O2 is related to the electron binding energy of the gold cluster
Low binding energy High reactivity
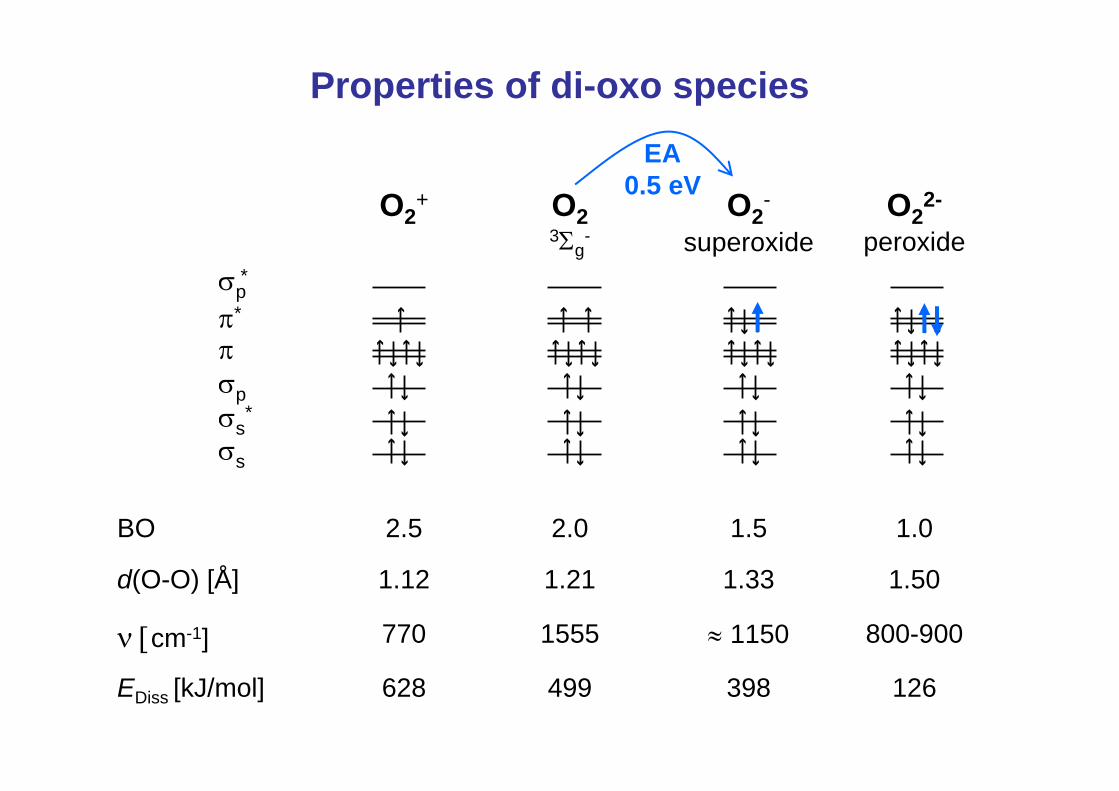
Properties of di-oxo species
126398499628EDiss [kJ/mol]
800-900≈ 11501555770ν [cm-1]
1.501.331.211.12d(O-O) [Å]
1.01.52.02.5BO
O22-
peroxideO2
-
superoxideO2 3Σg
-O2
+
σp*
π*
πσpσs
*
σs
EA0.5 eV
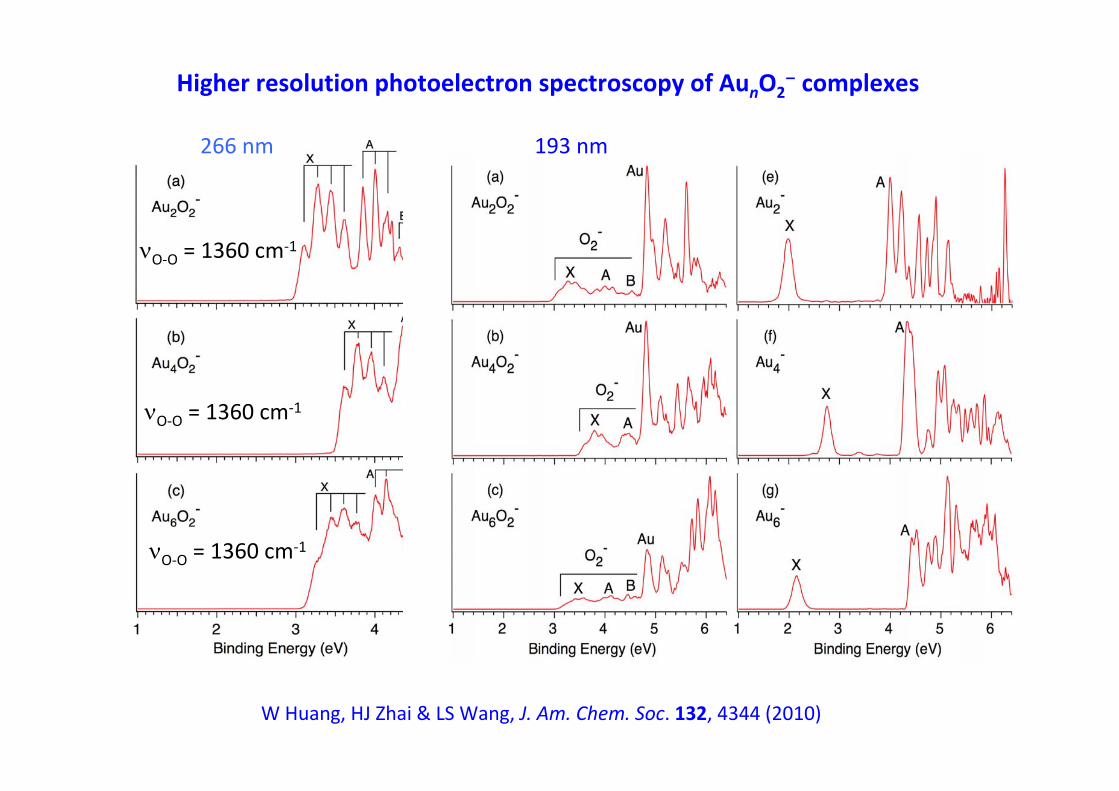
Higher resolution photoelectron spectroscopy of AunO2− complexes
266 nm 193 nm
W Huang, HJ Zhai & LS Wang, J. Am. Chem. Soc. 132, 4344 (2010)
νO‐O = 1360 cm‐1
νO‐O = 1360 cm‐1
νO‐O = 1360 cm‐1
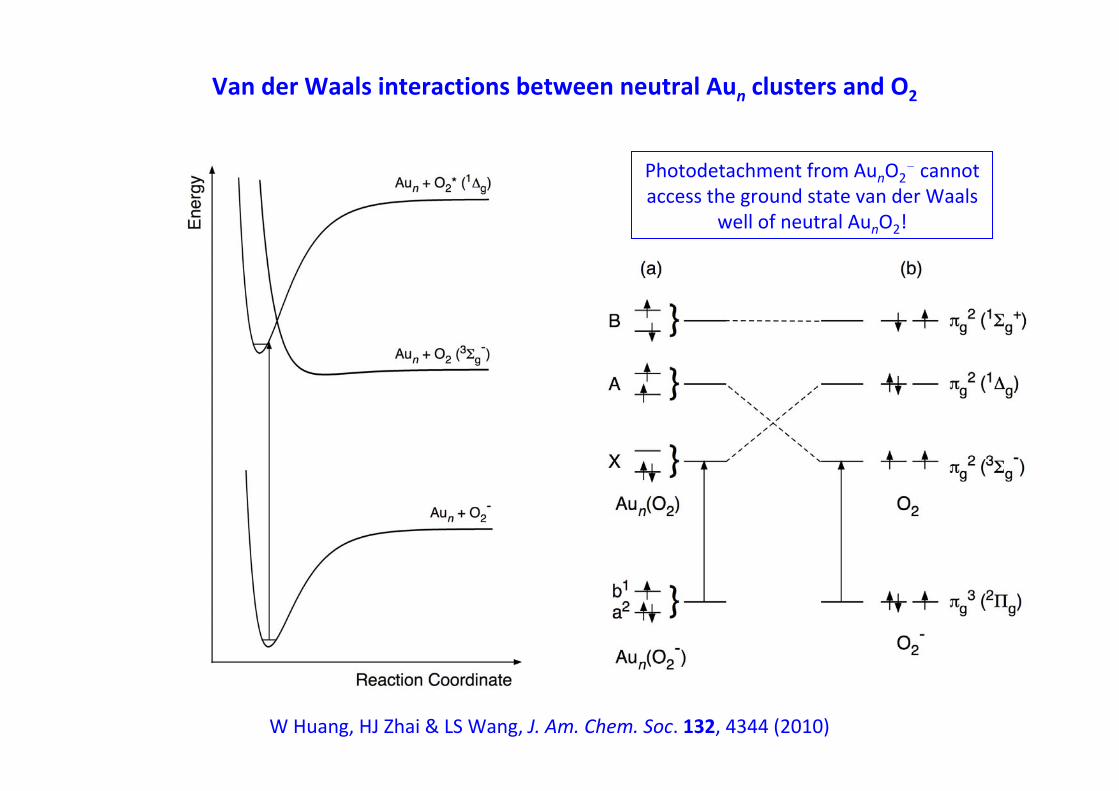
WHuang, HJ Zhai & LS Wang, J. Am. Chem. Soc. 132, 4344 (2010)
Van der Waals interactions between neutral Aun clusters and O2
Photodetachment from AunO2− cannot
access the ground state van der Waalswell of neutral AunO2!
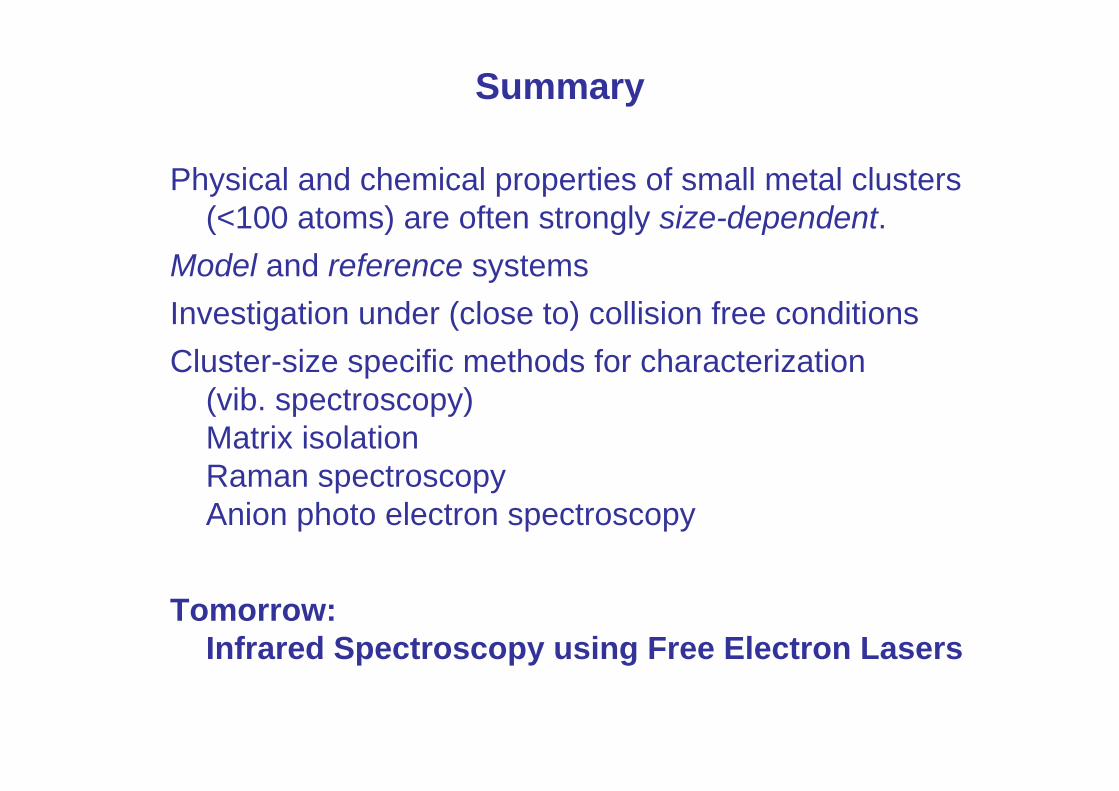
Physical and chemical properties of small metal clusters (<100 atoms) are often strongly size-dependent.
Model and reference systems Investigation under (close to) collision free conditionsCluster-size specific methods for characterization
(vib. spectroscopy)Matrix isolationRaman spectroscopyAnion photo electron spectroscopy
Tomorrow: Infrared Spectroscopy using Free Electron Lasers
Summary


![Isoperimetric Pentagonal · PDF filediscoveredby the now famous housewife Marjorie Rice[R],featuredinDorisSchattschneider’sarticle ... Isoperimetric Pentagonal Tilings Our](https://img.pdfslide.net/doc/110x75/5aa465c17f8b9a517d8bdc91/isoperimetric-pentagonal-the-now-famous-housewife-marjorie-ricerfeaturedindorisschattschneidersarticle.jpg)

![Icosahedral Ni Nanowires Formed from Nanocontacts Breaking: … · 2018. 2. 11. · long pentagonal nanowires [10-12], and that there exists an optimal temperature at which the pentagonal](https://img.pdfslide.net/doc/110x75/609af585851c7d6be814e6ad/icosahedral-ni-nanowires-formed-from-nanocontacts-breaking-2018-2-11-long.jpg)


![Oxidation State Silicon Clusters Synthesis and Structure of … · 2017-11-13 · SI1 Low Oxidation State Silicon Clusters – Synthesis and Structure of [NHCDippCu( 4‐Si9)]3‐](https://img.pdfslide.net/doc/110x75/5f03b0c47e708231d40a4b3a/oxidation-state-silicon-clusters-synthesis-and-structure-of-2017-11-13-si1-low.jpg)