Embed Size (px)
Citation preview
Chemical Geology 284 (2011) 296–305
Contents lists available at ScienceDirect
Chemical Geology
j ourna l homepage: www.e lsev ie r.com/ locate /chemgeo
Research papers
Vibrational, X-ray absorption, and Mössbauer spectra of sulfate minerals from theweathered massive sulfide deposit at Iron Mountain, California
Juraj Majzlan a,⁎, Charles N. Alpers b, Christian Bender Koch c, R. Blaine McCleskey d,Satish C.B. Myneni e, John M. Neil f
a Institute of Geosciences, Friedrich-Schiller-University, Burgweg 11, Jena, D-07749, Germanyb U.S. Geological Survey, 6000 J Street, Placer Hall, Sacramento CA 95819, USAc Department of Basic Sciences and Environment, University of Copenhagen, Thorvaldsensvej 40, DK-1871 Frederiksberg C, Denmarkd U.S. Geological Survey, 3215 Marine Street, Suite E-127, Boulder CO 80303, USAe Department of Geosciences, Princeton University, Princeton NJ 08544, USAf Thermochemistry Facility, Department of Chemical Engineering and Materials Science, University of California, Davis CA 95616, USA
⁎ Corresponding author at: Friedrich-Schiller UniverBurgweg 11, D-07749 Jena, Germany. Tel.: +49 3641 94
E-mail address: [email protected] (J. Majzla
0009-2541/$ – see front matter © 2011 Elsevier B.V. Adoi:10.1016/j.chemgeo.2011.03.008
a b s t r a c t
a r t i c l e i n f oArticle history:Received 28 September 2010Received in revised form 28 February 2011Accepted 10 March 2011Available online 17 March 2011
Editor: D.B. Dingwell
Keywords:Iron MountainSulfate mineralsInfrared spectraX-ray absorption spectraMössbauer spectraOxygen bridging
The Iron Mountain Mine Superfund site in California is a prime example of an acid mine drainage (AMD)system with well developed assemblages of sulfate minerals typical for such settings. Here we present anddiscuss the vibrational (infrared), X-ray absorption, and Mössbauer spectra of a number of these phases,augmented by spectra of a few synthetic sulfates related to the AMD phases. The minerals and relatedphases studied in this work are (in order of increasing Fe2O3/FeO): szomolnokite, rozenite, siderotil,halotrichite, römerite, voltaite, copiapite, monoclinic Fe2(SO4)3, Fe2(SO4)3·5H2O, kornelite, coquimbite, Fe(SO4)(OH), jarosite and rhomboclase. Fourier transform infrared spectra in the region 750–4000 cm−1 arepresented for all studied phases. Position of the FTIR bands is discussed in terms of the vibrations of sulfateions, hydroxyl groups, and water molecules. Sulfur K-edge X-ray absorption near-edge structure (XANES)spectra were collected for selected samples. The feature of greatest interest is a series of weak pre-edgepeaks whose position is determined by the number of bridging oxygen atoms between Fe3+ octahedra andsulfate tetrahedra. Mössbauer spectra of selected samples were obtained at room temperature and 80 K forferric minerals jarosite and rhomboclase and mixed ferric–ferrous minerals römerite, voltaite, andcopiapite. Values of Fe2+/[Fe2++Fe3+] determined by Mössbauer spectroscopy agree well with thosedetermined by wet chemical analysis. The data presented here can be used as standards in spectroscopicwork where spectra of well-characterized compounds are required to identify complex mixtures ofminerals and related phases.
sity, Institute of Geosciences,8700; fax: +49 3641 948602.n).
ll rights reserved.
© 2011 Elsevier B.V. All rights reserved.
1. Introduction
Iron sulfates compose a large and variable group of minerals thatare most commonly linked to acid mine or acid rock drainage, i.e.,discharge of acidic waters produced by weathering of sulfides in ore,mine waste, or undisturbed geological materials. Acidic discharges aregenerally rich in iron, aluminum, heavy metals, and sulfate ions andcommonly precipitate sulfate minerals in association with evapora-tion and microbial oxidation of ferrous iron (Nordstrom and Alpers,1999; Jambor et al., 2000). Acid mine drainage (AMD) is a widelyrecognized environmental problem because of the acidification ofsoils, streams, and underground water. This problem can present a
threat to living organisms, including humans (Nordstrom et al., 2000;Buckby et al., 2003). One of the best and well-studied examples of anAMD system is the Iron Mountain Mines Superfund site in California,USA (e.g., Alpers et al., 2003). Here, a large number of sulfate mineralsprecipitate because the acidity reaches formidable levels (Nordstromet al., 2000) and the concentration of the dissolved solutes isprodigious. Macroscopic samples of the sulfate minerals lendthemselves not only for the detailed mineralogical and geochemicalstudies (Nordstrom and Alpers, 1999; Nordstrom et al., 2000) but arealso excellent for the collection of various types of spectra because ofthe relative ease of separation and characterization of such material.
The sequence of iron-sulfate and iron-oxide mineral precipitatesfollows specific spatial patterns that may guide remediation efforts ifthese patterns are recognized. Field identification can be based onvisual inspection, or more efficiently, by aerial mapping usingreflected IR and visible light radiation (e.g., Hunt (1979); Townsend(1987); Swayze et al. (2000); Montero-Sanchez et al. (2005)). Inaddition, there is considerable interest in mapping the distribution

Fig. 1. Location of Iron Mountain mine in northern California, near the city of Redding.
297J. Majzlan et al. / Chemical Geology 284 (2011) 296–305
of sulfate minerals on extra-terrestrial targets using remote sensing(e.g., Vilas et al. (1994); Geissler et al. (1993); Klingelhöfer et al.(2004); Morris et al. (2004); Gendrin et al. (2005); Langevin et al.(2005)).
In a laboratory, more quantitative techniques, such as X-ray pow-der diffraction (XRD) or Fourier transform infrared (FTIR) spectros-copy may be utilized. Powder patterns of most natural iron-sulfateminerals are tabulated (ICDD Powder Diffraction Files), and XRDtechniques may be used routinely on these samples. On the otherhand, exhaustive spectroscopic information that could find their usein laboratory studies, aerial mapping, and extra-terrestrial remotesensing is generally not available. The iron-sulfate minerals could beused for further understanding of megascopic and macroscopicfeatures on Earth and also on other bodies in the solar system.
Iron sulfates can provide valuable insight into microscopic phe-nomena, such as magnetic frustration (Wills and Harrison, 1996),redox conditions of geochemical systems, or interaction of iron andsulfate at interfaces and in solutions (Majzlan and Myneni, 2005).A plethora of spectroscopic techniques may be applied to thesecompounds to gather the necessary information. In many cases, thespectra, which may serve as a starting or reference point, have notbeen reported.
The goal of this study is to expand the existing data sets with FTIR,XANES, and Mössbauer spectra taken on a suite of sulfate mineralsand phases that may be found in AMD systems. The samples were allcharacterized by X-ray diffraction and wet chemical analyses toprovide the basic structural and chemical data. In this work, weprovide only a brief explanation of the observed spectral features eventhough the results of each of the techniques for each of the mineralsdeserve much more detailed attention. In specific cases, we arecurrently working on the interpretation of such details and the resultswill be reported separately. The database presented here should beregarded as a reference from which a particular mineral can be se-lected as an appropriate representative of an unknown in a specificstudy.
2. Materials and methods
Both natural and synthetic samples were used in this study. Naturalsamples were collected at the Iron Mountain Mine Superfund site,California (Fig. 1) (Nordstrom and Alpers, 1999; Nordstrom et al., 2000;Alpers et al., 2003). The fewer synthetic samples were preparedaccording to the procedures described by Posnjak and Merwin (1922).The exceptionwasmonoclinic Fe2(SO4)3whichwas prepared accordingto the procedure described by Long et al. (1979).
X-ray diffraction patterns were collected with a Scintag PAD Vdiffractometer, Cu Kα radiation and a diffracted beam graphitemonochromator. The starting crystal structure models were refinedby the Rietveld technique using GSAS (Larson and von Dreele, 1994).
Metal concentrations in the ferric sulfate samples were deter-mined by inductively-coupled plasma optical-emission spectrometry(ICP-OES). The samples were also analyzed by the Ferrozine methodfor Fe2+ (Stookey, 1970), and Fe3+ was determined by the differencebetween total Fe and Fe2+. Sulfate concentrations were analyzed byion chromatography.
The infrared spectra were collected with a Bruker Fourier transf-orm infrared (FTIR) spectrometer with a DTGS (deuterated triglycinesulfate) detector and a KBr beamsplitter. The spectral resolution was4 cm−1 and the spectra were measured from 750 to 4000 cm−1. Mostsamples were embedded in a KCl pellet and analyzed in the trans-mission mode. Some samples, especially rhomboclase, were found toreact rapidly with KBr or KCl, and the spectra could be collected onlyin attenuated total reflectance (ATR) mode with samples pressedagainst a single-reflection diamond crystal. The rhomboclase samplehad to be carefully dried before data collection because the solution
associated with rhomboclase (concentrated H2SO4) could damage thediamond crystal.
XANES spectra were collected at the Stanford SynchrotronRadiation Lightsource (SSRL) using beamline 6–2 and Si (111) mono-chromator crystals. The incident photon fluxwas enhancedwith a He-flight path chamber. The spectra were collected in the fluorescencemode using a Lytle detector. All of the sulfate spectra were calibratedagainst the low-energy transition in solid Na2(SO3S)·5H2O, whichwas set at 2469.2 eV. The spectra of Na2(SO3S)·5H2O were collectedfrequently during the XANES data measurements to correct for thesystematic error associated with the drift of the monochromator.
Mössbauer spectra were obtained at room temperature and 80 Kusing a conventional constant acceleration spectrometer with a
57Co in
Rh source. The spectrometer was calibrated using a 12.5 μm foil ofnatural Fe at room temperature and isomer shifts are given withrespect to the center of the spectrum of this sample. The samples weretransferred into self-supporting Perspex holders and their amountswere adjusted to ensure that the maximum absorption of any com-ponent was smaller than 6%. Fitting of the paramagnetic spectrawere carried out using simple Lorentzian shaped doublets that wascarried to have identical linewidths in complex spectra. Theexperimental line width of the instrumental setup is 0.22 mms−1.
3. Crystal structures
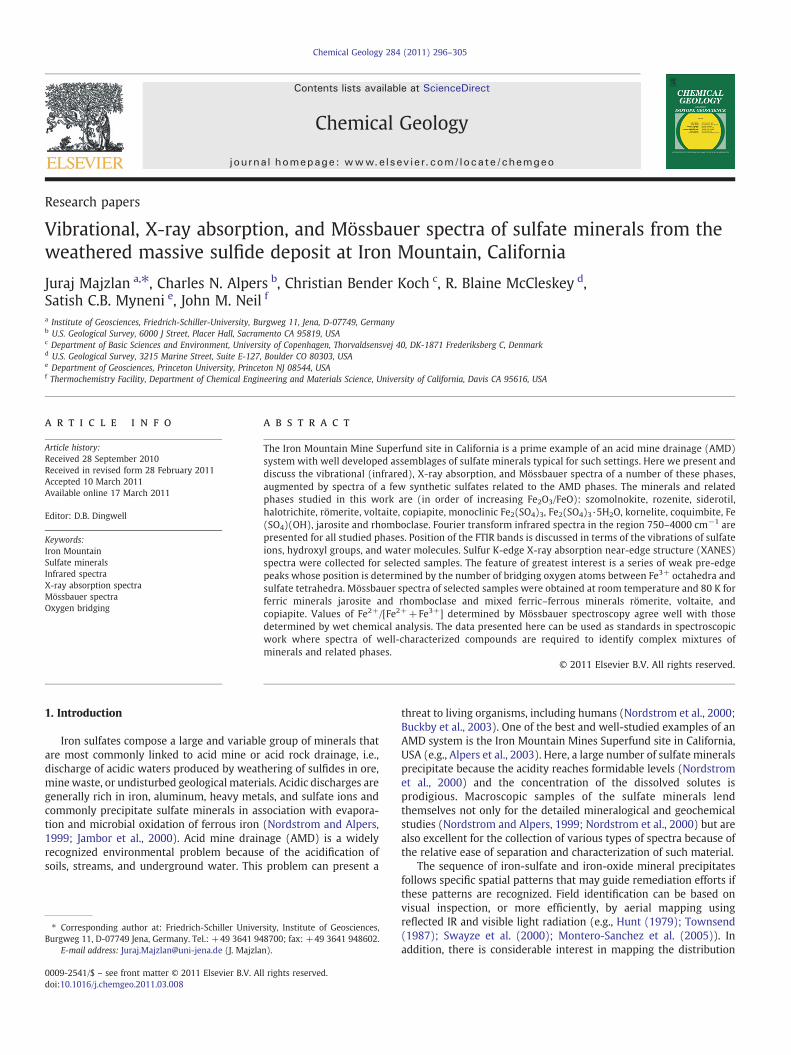
Crystal structures of sulfateminerals were reviewed by Hawthorneet al. (2000) so we will only briefly discuss the structural featuresimportant in the evaluation of this work. The crystal structuresconsidered are built by SO4 tetrahedra, Fe(O,OH,H2O)6 octahedra,hydroxyl groups or water molecules. The connectivity of theoctahedral and tetrahedral units is briefly described and depicted inTable 1. With the exception of network structures (e.g., szomolno-kite), the octahedral–tetrahedral units (clusters, chains, or sheets) areheld together by a network of hydrogen bonds. The position ofhydrogen atoms in these structures is generally not known or poorlyknown. Some structures (e.g., copiapite) contain water molecules thatlink the structural units. The presence of the H3O+ ion in hydroniumjarosite or alunite has been suspected (Ripmeester et al., 1986; Willsand Harrison, 1996) and definitely proven by NMR studies (Nielsenet al., 2008). The intersheet portion in rhomboclase is believed tocontain (H5O2)+ groups (Mereiter, 1974). At least one proton ismobile at room temperature as indicated by proton conductivitystudies (Brach and Goodenough, 1988).
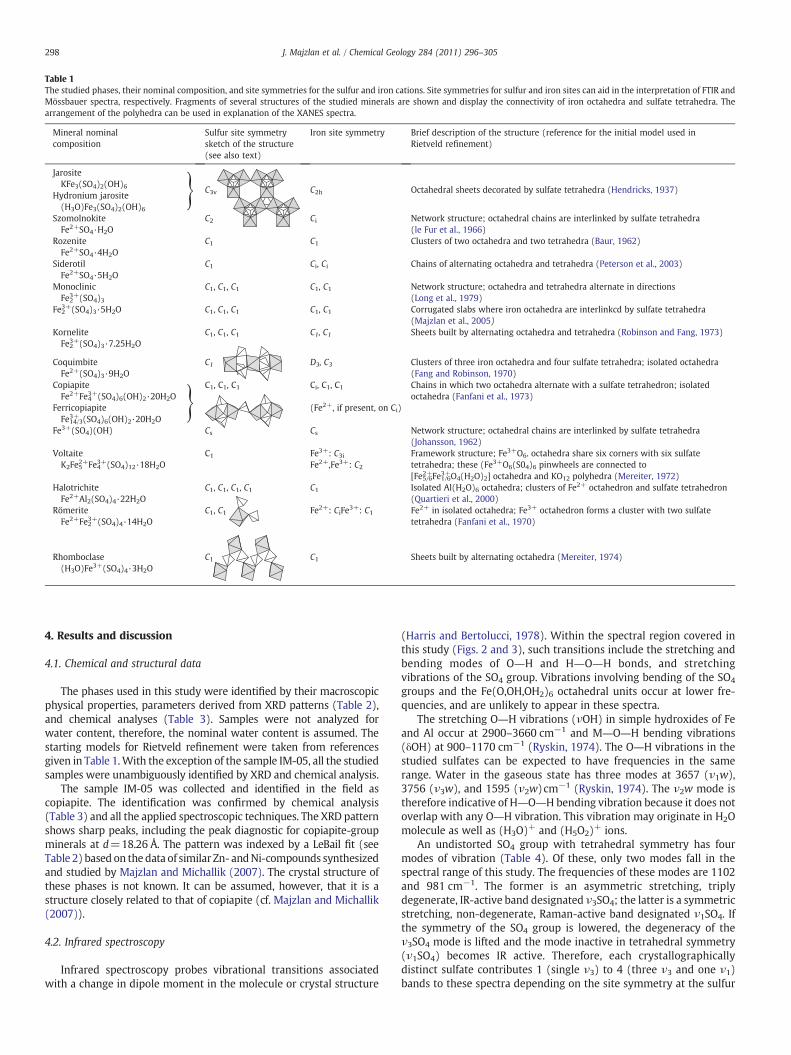
Table 1The studied phases, their nominal composition, and site symmetries for the sulfur and iron cations. Site symmetries for sulfur and iron sites can aid in the interpretation of FTIR andMössbauer spectra, respectively. Fragments of several structures of the studied minerals are shown and display the connectivity of iron octahedra and sulfate tetrahedra. Thearrangement of the polyhedra can be used in explanation of the XANES spectra.
Mineral nominalcomposition
Sulfur site symmetrysketch of the structure(see also text)
Iron site symmetry Brief description of the structure (reference for the initial model used inRietveld refinement)
JarositeKFe3(SO4)2(OH)6 t C3v C2h Octahedral sheets decorated by sulfate tetrahedra (Hendricks, 1937)
Hydronium jarosite(H3O)Fe3(SO4)2(OH)6
SzomolnokiteFe2+SO4·H2O
C2 Ci Network structure; octahedral chains are interlinked by sulfate tetrahedra(le Fur et al., 1966)
RozeniteFe2+SO4·4H2O
C1 C1 Clusters of two octahedra and two tetrahedra (Baur, 1962)
SiderotilFe2+SO4·5H2O
C1 Ci, Ci Chains of alternating octahedra and tetrahedra (Peterson et al., 2003)
MonoclinicFe23+(SO4)3
C1, C1, C1 C1, C1 Network structure; octahedra and tetrahedra alternate in directions(Long et al., 1979)
Fe23+(SO4)3·5H2O C1, C1, C1 C1, C1 Corrugated slabs where iron octahedra are interlinkcd by sulfate tetrahedra(Majzlan et al., 2005)
KorneliteFe23+(SO4)3·7.25H2O
C1, C1, C1 C1, C1 Sheets built by alternating octahedra and tetrahedra (Robinson and Fang, 1973)
CoquimbiteFe2+(SO4)3·9H2O
C1 D3, C3 Clusters of three iron octahedra and four sulfate tetrahedra; isolated octahedra(Fang and Robinson, 1970)
CopiapiteFe2+Fe43+(SO4)6(OH)2·20H2O t
C1, C1, C1 Ci, C1, C1 Chains in which two octahedra alternate with a sulfate tetrahedron; isolatedoctahedra (Fanfani et al., 1973)
FerricopiapiteFe14/33+ (SO4)6(OH)2·20H2O
(Fe2+, if present, on Ci)
Fe3+(SO4)(OH) Cs Cs Network structure; octahedral chains are interlinked by sulfate tetrahedra(Johansson, 1962)
VoltaiteK2Fe52+Fe43+(SO4)12·18H2O
C1 Fe3+: C3iFe2+,Fe3+: C2
Framework structure; Fe3+O6. octahedra share six corners with six sulfatetetrahedra; these (Fe3+O6(S04)6 pinwheels are connected to[Fe5/62+Fe1/63+O4(H2O)2] octahedra and KO12 polyhedra (Mereiter, 1972)
HalotrichiteFe2+Al2(SO4)4·22H2O
C1, C1, C1, C1 C1 Isolated Al(H2O)6 octahedra; clusters of Fe2+ octahedron and sulfate tetrahedron(Quartieri et al., 2000)
RömeriteFe2+Fe23+(SO4)4·14H2O
C1, C1 Fe2+: CiFe3+: C1 Fe2+ in isolated octahedra; Fe3+ octahedron forms a cluster with two sulfatetetrahedra (Fanfani et al., 1970)
Rhomboclase(H3O)Fe3+(SO4)4·3H2O
C1 C1 Sheets built by alternating octahedra (Mereiter, 1974)
298 J. Majzlan et al. / Chemical Geology 284 (2011) 296–305
4. Results and discussion
4.1. Chemical and structural data
The phases used in this study were identified by their macroscopicphysical properties, parameters derived from XRD patterns (Table 2),and chemical analyses (Table 3). Samples were not analyzed forwater content, therefore, the nominal water content is assumed. Thestarting models for Rietveld refinement were taken from referencesgiven in Table 1.With the exception of the sample IM-05, all the studiedsamples were unambiguously identified by XRD and chemical analysis.
The sample IM-05 was collected and identified in the field ascopiapite. The identification was confirmed by chemical analysis(Table 3) and all the applied spectroscopic techniques. The XRD patternshows sharp peaks, including the peak diagnostic for copiapite-groupminerals at d=18.26 Å. The pattern was indexed by a LeBail fit (seeTable 2) based on the data of similar Zn- andNi-compounds synthesizedand studied by Majzlan and Michallik (2007). The crystal structure ofthese phases is not known. It can be assumed, however, that it is astructure closely related to that of copiapite (cf. Majzlan and Michallik(2007)).
4.2. Infrared spectroscopy
Infrared spectroscopy probes vibrational transitions associatedwith a change in dipole moment in the molecule or crystal structure
(Harris and Bertolucci, 1978). Within the spectral region covered inthis study (Figs. 2 and 3), such transitions include the stretching andbending modes of O―H and H―O―H bonds, and stretchingvibrations of the SO4 group. Vibrations involving bending of the SO4
groups and the Fe(O,OH,OH2)6 octahedral units occur at lower fre-quencies, and are unlikely to appear in these spectra.
The stretching O―H vibrations (νOH) in simple hydroxides of Feand Al occur at 2900–3660 cm−1 and M―O―H bending vibrations(δOH) at 900–1170 cm−1 (Ryskin, 1974). The O―H vibrations in thestudied sulfates can be expected to have frequencies in the samerange. Water in the gaseous state has three modes at 3657 (ν1w),3756 (ν3w), and 1595 (ν2w)cm−1 (Ryskin, 1974). The ν2w mode istherefore indicative of H―O―H bending vibration because it does notoverlap with any O―H vibration. This vibration may originate in H2Omolecule as well as (H3O)+ and (H5O2)+ ions.
An undistorted SO4 group with tetrahedral symmetry has fourmodes of vibration (Table 4). Of these, only two modes fall in thespectral range of this study. The frequencies of these modes are 1102and 981 cm−1. The former is an asymmetric stretching, triplydegenerate, IR-active band designated ν3SO4; the latter is a symmetricstretching, non-degenerate, Raman-active band designated ν1SO4. Ifthe symmetry of the SO4 group is lowered, the degeneracy of theν3SO4 mode is lifted and the mode inactive in tetrahedral symmetry(ν1SO4) becomes IR active. Therefore, each crystallographicallydistinct sulfate contributes 1 (single ν3) to 4 (three ν3 and one ν1)bands to these spectra depending on the site symmetry at the sulfur

Table 2Space groups and lattice parameters of the studied samples.
Phase, sample ID Space group Lattice parameters (Å, º)
Natural samplesSzomolnokite, IM-01 C21/c a=7.0764(6), b=7.5480(6), c=7.6002(6), β=116.176(4)Rhomboclase, IM-02 Pnma a=9.726(3), b=18.293(9), c=5.428(3)IM-05a Triclinic a=7.3820(1), b=7.3831(1), c=36.614(1)
α=92.919(2), β=92.911(2), γ=102.413(1)Copiapite, 91RS 210A P
_1 a=7.3453(2), b=18.7332(8), c=7.3675(3)
α=91.448(3), β =102.188(3), γ=99.067(3)Voltaite, IMJ-05 Fd
_3c a=27.206(2)
Voltaite, IM-06 Fd_3c a=27.214(2)
Voltaite, IMJ-06 Fd_3c a=27.204(2)
Voltaite, 91RS 210A Fd_3c a=27.232(2)
Kornelite, IM-09 P21/n a=14.319(5), b=20.139(6), c=5.429(2), β=96.78(2)Jarosite, IMJ-09 R
_3 m a=7.315(1), c=17.179(5)
Römerite, IM-10 P_1 a=6.453(1), b=15.309(3), c=6.322(1)
α=90.146(8), β=100.932(9), γ=85.86(1)Halotrichite, IM-11 P21/c a=6.184(1), b =24.276(6), c=21.237(4), β=100.46(1)Coquimbite, IM-12 P
_31c a=10.9153(4), c=17.0770(8)
Rozenite, IM-13 P21/n a=5.9638(5), b=13.607(1), c=7.9618(6), β=90.482(6)Siderotil, IM-14 P
_1 a=6.294(2), b=10.638(3), c=6.070(2)
α=82.22(2), β=109.83(2), γ=105.10(2)Synthetic samplesFerricopiapite P
_1 a=7.3867(6), b=18.363(2), c=7.3275(5)
α=93.940(5), β=102.201(5), γ=98.916(4)Fe2(SO4)3 P21/n a=8.2957(7), b=8.5358(8), c=11.625(1), β=90.729(6)Fe2(SO4)3·5H2O P21/m a=10.705(1), b=11.080(1), c=5.5736(6), β=98.864(6)Hydronium jarosite R
_3m a=7.35463(2), c=17.01795(4)
Fe(OH)(SO4) Pnma a=7.333(1), b=6.415(1), c=7.138(1)Rhomboclase Pnma a=9.7226(8), b=18.2800(9), c=5.4270(5)
a The structure of this phase is not known but is most likely closely related to that of copiapite (see text for details). The lattice parameters were refined in a LeBail fit.
299J. Majzlan et al. / Chemical Geology 284 (2011) 296–305
positions (Table 1). The symmetry apparent from the spectra dependson the degree of distortion of the SO4 group. Even if the symmetry ofSO4 group is lower than Td, the splitting may be too small and becomeobscured by overlap of the individual sulfate bands. The problem isfurther compounded by possible overlap of the S―O stretching andO―H bending vibrations.
IR data for numerous sulfates and other salts with tetrahedraloxyanions were reviewed by Farmer (1974). A newer dataset for anumber of sulfate minerals was presented by Dyar et al. (2005).
Table 3Chemical composition of the sulfate samples. Note that not all samples were analyzed, althochemical analyses. Small charge imbalances in the formulae are caused by analytical errors
Phase, sample ID
Formula based on chemical analysis
Natural samplesSzomolnokite, IM-01: (Fe0.88Zn0.06Ca0.01)2+SO4·H2ORhomboclase, IM-02: (H3O)Fe3+(SO4)2·3H2OIM-05: (Fe0.54Zn0.38Mg0.07Ca0.05)2+(Fe3.91)3+(SO4)6(OH)2·20H2OVoltaite, IMJ-05: (K1.12Na0.05)+(Fe3.45Mg1.17Ca0.09Zn0.06Mn0.06Cu0.05)2+
(Fe2.85Al1.0B0.01)3+(SO4)12·18H2OVoltaite, IM-06: (K1.48Na0.06)+(Fe3.40Mg0.82Zn0.71Cu0.11Ca0.06Cd0.01)2+
(Fe3.13Al1.03)3+(SO4)12·18H2OVoltaite, IMJ-06: (K1.4Na0.05)+(Fe3.79Mg0.53Zn0.42Cu0.13Ca0.09Cd0.01Mn0.01)2+
(Fe2.79Al0.91)3+(SO4)12·18H2OKornelite, IM-09: (Fe1.85)3+(SO4)3·7H2ORömerite, IM-10: (Fe0.80Zn0.16Mg0.02)2+(Fe1.94Al0.01)3+(SO4)4·14H2OCoquimbite, IM-12: (Fe1.73Al0.21)3+(SO4)3·9H2ORozenite, IM-13: (Fe0.91Zn0.03Mg0.01)2+SO4·4H2OSiderotil, IM-14: (Fe0.57Cu0.22Zn0.13Mg0.02)2+SO4·5H2O
Synthetic samplesFerricopiapite: Fe3+4.78(SO4)6(OH)2·20H2OFe2(SO4)3 (monoclinic): Fe2.00(SO4)3Fe2(SO4)3·5H2O: Fe3+2.1(SO4)3·5H2OHydronium jarosite: (H3O)0.91Fe2.91(SO4)2[(OH)5.64(H2O)0.18]Rhomboclase: (H3O)Fe3+0.92(SO4)2·3H2O
a derived from chemical analyses.b derived from Mössbauer data. Uncertainty on the areas of the components is better tha
There are additional weak bands in our spectra (Fig. 3). Organicimpurities in our natural samples of kornelite and romerite are thecause of the appearance of a triplet with a peak at 2922 cm−1,characteristic of the C―H stretching vibrations. The weak bands at~1450 cm−1 are due to the C―H bending vibrations.
4.2.1. Ferrous sulfate hydratesThere should be four sulfate bands in the spectra of each
FeSO4·nH2O compound due to a relatively low sulfur site symmetry
ugh lattice parameters are reported for all. The formulae were calculated from the wet-.
Fe2+/(Fe2++Fe3+)
Ideal Analyticala Analyticalb
1.00 1.000.00 0.00 0.000.20 0.12 0.110.56 0.55 0.56
0.56 0.52
0.56 0.60 0.58
0.00 0.000.33 0.29 0.290.00 0.001.00 1.001.00 1.00
1.00 1.001.00 1.001.00 1.001.00 1.001.00 1.00
n 2%.
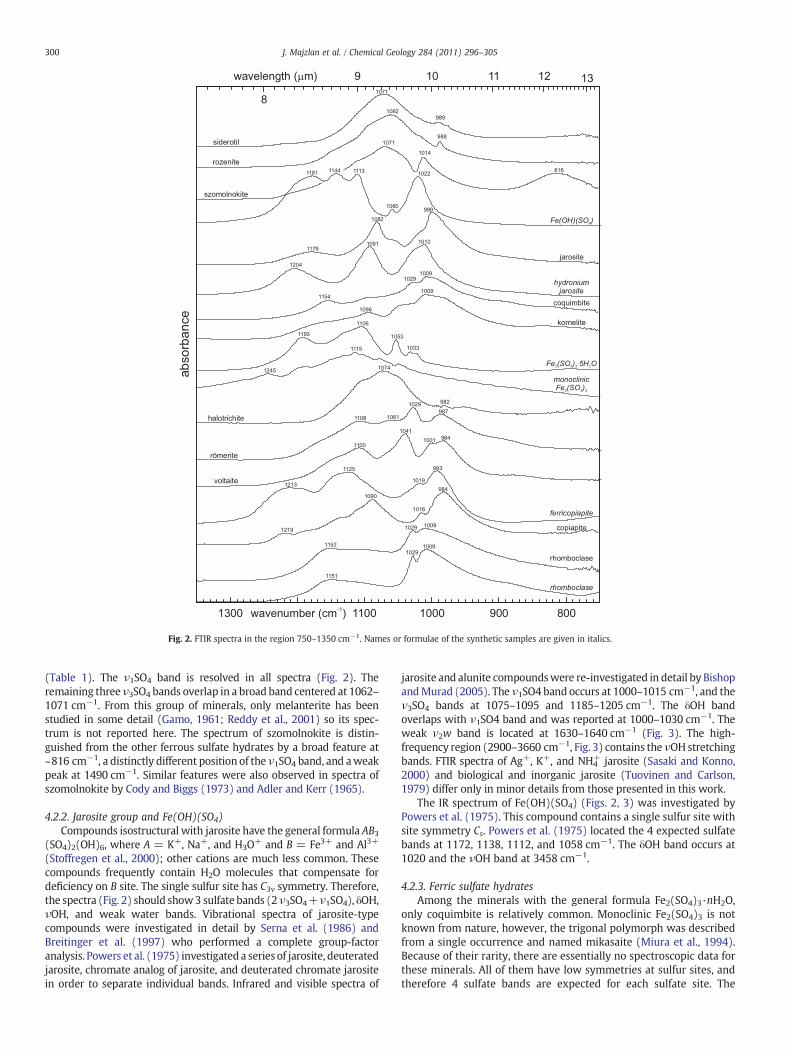
Fig. 2. FTIR spectra in the region 750–1350 cm−1. Names or formulae of the synthetic samples are given in italics.
300 J. Majzlan et al. / Chemical Geology 284 (2011) 296–305
(Table 1). The ν1SO4 band is resolved in all spectra (Fig. 2). Theremaining threeν3SO4 bands overlap in a broad band centered at 1062–1071 cm−1. From this group of minerals, only melanterite has beenstudied in some detail (Gamo, 1961; Reddy et al., 2001) so its spec-trum is not reported here. The spectrum of szomolnokite is distin-guished from the other ferrous sulfate hydrates by a broad feature at~816 cm−1, a distinctly different position of the ν1SO4 band, and aweakpeak at 1490 cm−1. Similar features were also observed in spectra ofszomolnokite by Cody and Biggs (1973) and Adler and Kerr (1965).
4.2.2. Jarosite group and Fe(OH)(SO4)Compounds isostructural with jarosite have the general formula AB3
(SO4)2(OH)6, where A = K+, Na+, and H3O+ and B = Fe3+ and Al3+
(Stoffregen et al., 2000); other cations are much less common. Thesecompounds frequently contain H2O molecules that compensate fordeficiency on B site. The single sulfur site has C3v symmetry. Therefore,the spectra (Fig. 2) should show3 sulfate bands (2ν3SO4+ν1SO4), δOH,νOH, and weak water bands. Vibrational spectra of jarosite-typecompounds were investigated in detail by Serna et al. (1986) andBreitinger et al. (1997) who performed a complete group-factoranalysis. Powers et al. (1975) investigated a series of jarosite, deuteratedjarosite, chromate analog of jarosite, and deuterated chromate jarositein order to separate individual bands. Infrared and visible spectra of
jarosite and alunite compoundswere re-investigated in detail by BishopandMurad (2005). The ν1SO4 band occurs at 1000–1015 cm−1, and theν3SO4 bands at 1075–1095 and 1185–1205 cm−1. The δOH bandoverlaps with ν1SO4 band and was reported at 1000–1030 cm−1. Theweak ν2w band is located at 1630–1640 cm−1 (Fig. 3). The high-frequency region (2900–3660 cm−1, Fig. 3) contains the νOH stretchingbands. FTIR spectra of Ag+, K+, and NH4
+ jarosite (Sasaki and Konno,2000) and biological and inorganic jarosite (Tuovinen and Carlson,1979) differ only in minor details from those presented in this work.
The IR spectrum of Fe(OH)(SO4) (Figs. 2, 3) was investigated byPowers et al. (1975). This compound contains a single sulfur site withsite symmetry Cs. Powers et al. (1975) located the 4 expected sulfatebands at 1172, 1138, 1112, and 1058 cm−1. The δOH band occurs at1020 and the νOH band at 3458 cm−1.
4.2.3. Ferric sulfate hydratesAmong the minerals with the general formula Fe2(SO4)3·nH2O,
only coquimbite is relatively common. Monoclinic Fe2(SO4)3 is notknown from nature, however, the trigonal polymorph was describedfrom a single occurrence and named mikasaite (Miura et al., 1994).Because of their rarity, there are essentially no spectroscopic data forthese minerals. All of them have low symmetries at sulfur sites, andtherefore 4 sulfate bands are expected for each sulfate site. The
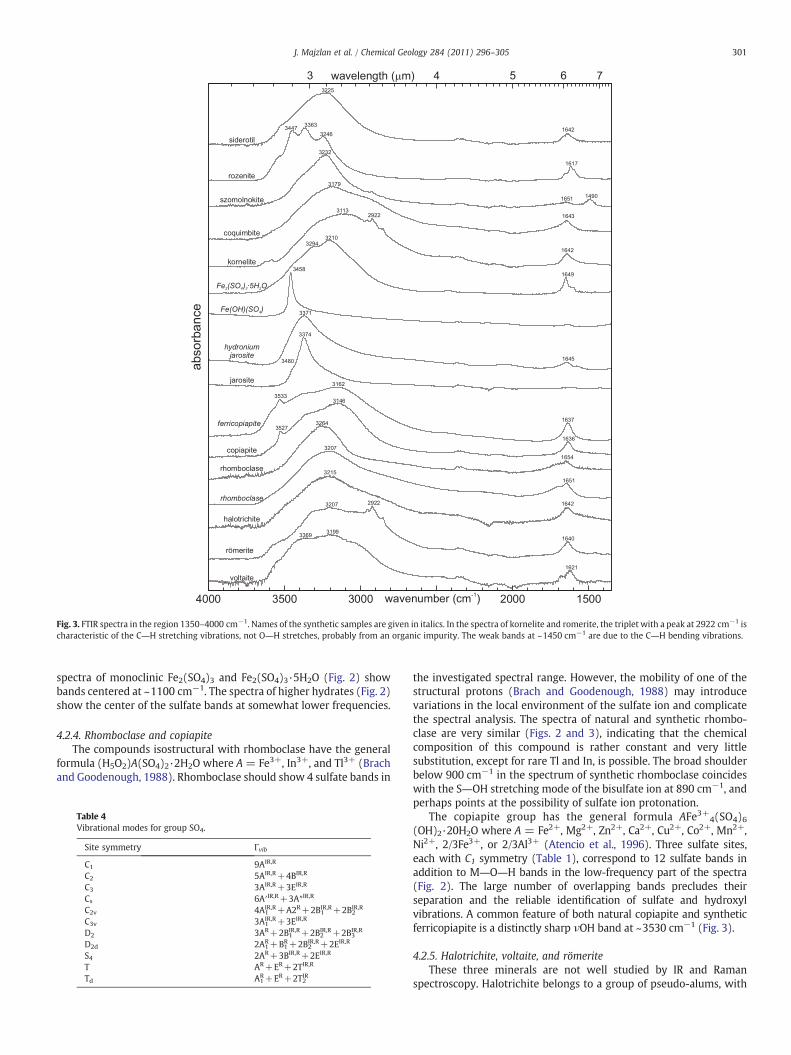
Fig. 3. FTIR spectra in the region 1350–4000 cm−1. Names of the synthetic samples are given in italics. In the spectra of kornelite and romerite, the triplet with a peak at 2922 cm−1 ischaracteristic of the C―H stretching vibrations, not O―H stretches, probably from an organic impurity. The weak bands at ~1450 cm−1 are due to the C―H bending vibrations.
301J. Majzlan et al. / Chemical Geology 284 (2011) 296–305
spectra of monoclinic Fe2(SO4)3 and Fe2(SO4)3·5H2O (Fig. 2) showbands centered at ~1100 cm−1. The spectra of higher hydrates (Fig. 2)show the center of the sulfate bands at somewhat lower frequencies.
4.2.4. Rhomboclase and copiapiteThe compounds isostructural with rhomboclase have the general
formula (H5O2)A(SO4)2·2H2O where A = Fe3+, In3+, and Tl3+ (Brachand Goodenough, 1988). Rhomboclase should show 4 sulfate bands in
Table 4Vibrational modes for group SO4.
Site symmetry Гvib
C1 9AIR,R
C2 5AIR,R+4BIR,R
C3 3AIR,R+3EIR,R
Cs 6A′IR,R+3A″IR,R
C2v 4A1IR,R+A2R+2B1
IR,R+2B2IR,R
C3v 3A1IR,R+3EIR,R
D2 3AR+2B1IR,R+2B2IR,R+2B3IR,R
D2d 2A1R+B1R+2B2IR,R+2EIR,R
S4 2AR+3BIR,R+2EIR,R
T AR+ER+2TIR,R
Td A1R+ER+2T2IR
the investigated spectral range. However, the mobility of one of thestructural protons (Brach and Goodenough, 1988) may introducevariations in the local environment of the sulfate ion and complicatethe spectral analysis. The spectra of natural and synthetic rhombo-clase are very similar (Figs. 2 and 3), indicating that the chemicalcomposition of this compound is rather constant and very littlesubstitution, except for rare Tl and In, is possible. The broad shoulderbelow 900 cm−1 in the spectrum of synthetic rhomboclase coincideswith the S―OH stretching mode of the bisulfate ion at 890 cm−1, andperhaps points at the possibility of sulfate ion protonation.
The copiapite group has the general formula AFe3+4(SO4)6(OH)2·20H2O where A = Fe2+, Mg2+, Zn2+, Ca2+, Cu2+, Co2+, Mn2+,Ni2+, 2/3Fe3+, or 2/3Al3+ (Atencio et al., 1996). Three sulfate sites,each with C1 symmetry (Table 1), correspond to 12 sulfate bands inaddition to M―O―H bands in the low-frequency part of the spectra(Fig. 2). The large number of overlapping bands precludes theirseparation and the reliable identification of sulfate and hydroxylvibrations. A common feature of both natural copiapite and syntheticferricopiapite is a distinctly sharp νOH band at ~3530 cm−1 (Fig. 3).
4.2.5. Halotrichite, voltaite, and römeriteThese three minerals are not well studied by IR and Raman
spectroscopy. Halotrichite belongs to a group of pseudo-alums, with
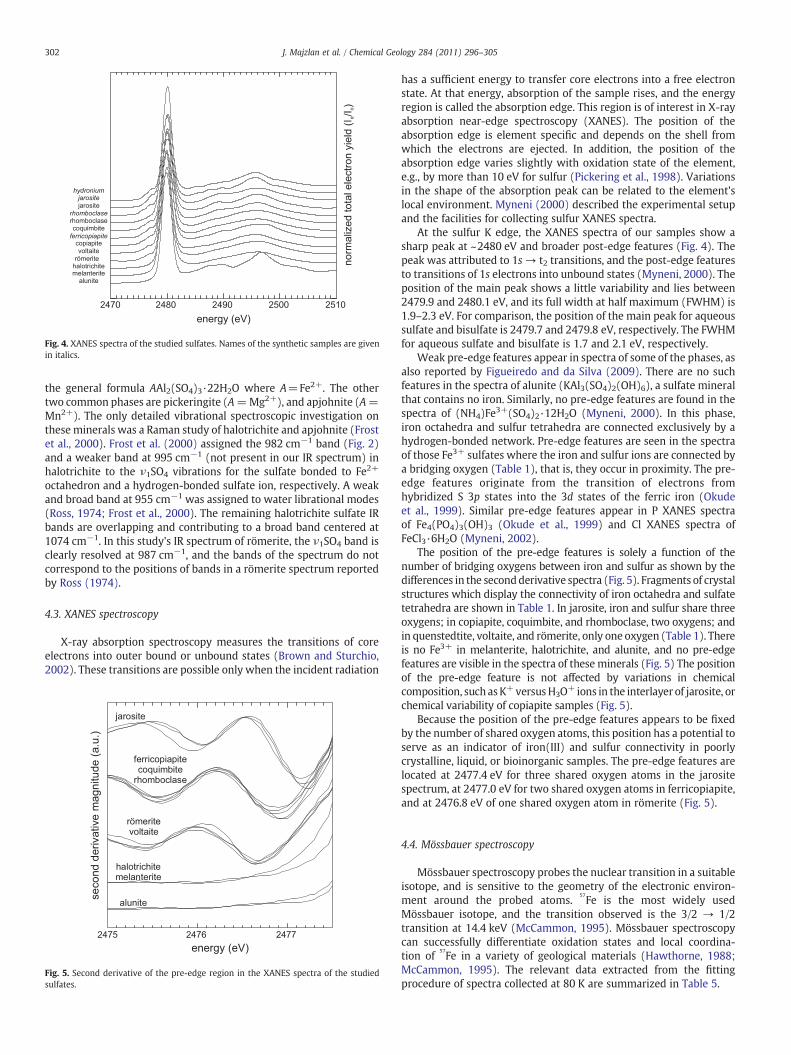
Fig. 4. XANES spectra of the studied sulfates. Names of the synthetic samples are givenin italics.
302 J. Majzlan et al. / Chemical Geology 284 (2011) 296–305
the general formula AAl2(SO4)3·22H2O where A=Fe2+. The othertwo common phases are pickeringite (A=Mg2+), and apjohnite (A=Mn2+). The only detailed vibrational spectroscopic investigation onthese minerals was a Raman study of halotrichite and apjohnite (Frostet al., 2000). Frost et al. (2000) assigned the 982 cm−1 band (Fig. 2)and a weaker band at 995 cm−1 (not present in our IR spectrum) inhalotrichite to the ν1SO4 vibrations for the sulfate bonded to Fe2+
octahedron and a hydrogen-bonded sulfate ion, respectively. A weakand broad band at 955 cm−1 was assigned to water librational modes(Ross, 1974; Frost et al., 2000). The remaining halotrichite sulfate IRbands are overlapping and contributing to a broad band centered at1074 cm−1. In this study's IR spectrum of römerite, the ν1SO4 band isclearly resolved at 987 cm−1, and the bands of the spectrum do notcorrespond to the positions of bands in a römerite spectrum reportedby Ross (1974).
4.3. XANES spectroscopy
X-ray absorption spectroscopy measures the transitions of coreelectrons into outer bound or unbound states (Brown and Sturchio,2002). These transitions are possible only when the incident radiation
Fig. 5. Second derivative of the pre-edge region in the XANES spectra of the studiedsulfates.
has a sufficient energy to transfer core electrons into a free electronstate. At that energy, absorption of the sample rises, and the energyregion is called the absorption edge. This region is of interest in X-rayabsorption near-edge spectroscopy (XANES). The position of theabsorption edge is element specific and depends on the shell fromwhich the electrons are ejected. In addition, the position of theabsorption edge varies slightly with oxidation state of the element,e.g., by more than 10 eV for sulfur (Pickering et al., 1998). Variationsin the shape of the absorption peak can be related to the element'slocal environment. Myneni (2000) described the experimental setupand the facilities for collecting sulfur XANES spectra.
At the sulfur K edge, the XANES spectra of our samples show asharp peak at ~2480 eV and broader post-edge features (Fig. 4). Thepeak was attributed to 1s→ t2 transitions, and the post-edge featuresto transitions of 1s electrons into unbound states (Myneni, 2000). Theposition of the main peak shows a little variability and lies between2479.9 and 2480.1 eV, and its full width at half maximum (FWHM) is1.9–2.3 eV. For comparison, the position of the main peak for aqueoussulfate and bisulfate is 2479.7 and 2479.8 eV, respectively. The FWHMfor aqueous sulfate and bisulfate is 1.7 and 2.1 eV, respectively.
Weak pre-edge features appear in spectra of some of the phases, asalso reported by Figueiredo and da Silva (2009). There are no suchfeatures in the spectra of alunite (KAl3(SO4)2(OH)6), a sulfate mineralthat contains no iron. Similarly, no pre-edge features are found in thespectra of (NH4)Fe3+(SO4)2·12H2O (Myneni, 2000). In this phase,iron octahedra and sulfur tetrahedra are connected exclusively by ahydrogen-bonded network. Pre-edge features are seen in the spectraof those Fe3+ sulfates where the iron and sulfur ions are connected bya bridging oxygen (Table 1), that is, they occur in proximity. The pre-edge features originate from the transition of electrons fromhybridized S 3p states into the 3d states of the ferric iron (Okudeet al., 1999). Similar pre-edge features appear in P XANES spectraof Fe4(PO4)3(OH)3 (Okude et al., 1999) and Cl XANES spectra ofFeCl3·6H2O (Myneni, 2002).
The position of the pre-edge features is solely a function of thenumber of bridging oxygens between iron and sulfur as shown by thedifferences in the secondderivative spectra (Fig. 5). Fragments of crystalstructures which display the connectivity of iron octahedra and sulfatetetrahedra are shown in Table 1. In jarosite, iron and sulfur share threeoxygens; in copiapite, coquimbite, and rhomboclase, two oxygens; andin quenstedtite, voltaite, and römerite, only one oxygen (Table 1). Thereis no Fe3+ in melanterite, halotrichite, and alunite, and no pre-edgefeatures are visible in the spectra of these minerals (Fig. 5) The positionof the pre-edge feature is not affected by variations in chemicalcomposition, such asK+versusH3O+ ions in the interlayer of jarosite, orchemical variability of copiapite samples (Fig. 5).
Because the position of the pre-edge features appears to be fixedby the number of shared oxygen atoms, this position has a potential toserve as an indicator of iron(III) and sulfur connectivity in poorlycrystalline, liquid, or bioinorganic samples. The pre-edge features arelocated at 2477.4 eV for three shared oxygen atoms in the jarositespectrum, at 2477.0 eV for two shared oxygen atoms in ferricopiapite,and at 2476.8 eV of one shared oxygen atom in römerite (Fig. 5).
4.4. Mössbauer spectroscopy
Mössbauer spectroscopy probes the nuclear transition in a suitableisotope, and is sensitive to the geometry of the electronic environ-ment around the probed atoms.
57Fe is the most widely used
Mössbauer isotope, and the transition observed is the 3/2 → 1/2transition at 14.4 keV (McCammon, 1995). Mössbauer spectroscopycan successfully differentiate oxidation states and local coordina-tion of
57Fe in a variety of geological materials (Hawthorne, 1988;
McCammon, 1995). The relevant data extracted from the fittingprocedure of spectra collected at 80 K are summarized in Table 5.

Table 5Mössbauer parameters for octahedrally coordinated Fe in the studied sulfate minerals at 80 K. δ is the isomer shift, ΔEQ is the quadrupole splitting, Γ is the line width, and A is thespectral area.
Phase, sample ID Fe(III) Fe(II)
δ(mms−1)
ΔEQ(mms−1)
Γ(mms−1)
A(%)
δ(mms−1)
ΔEQ(mms−1)
Γ(mms−1)
A(%)
Jarosite, IMJ-09 0.49 1.24 0.36 100Rhomboclase, IM-02 0.54 0.59 0.27 100Copiapite, IM-05 0.53 0.80 0.26 44 1.38 3.19 0.25 11
0.53 0.38 0.26 45Copiapite, 91RS210A 0.53 0.79 0.34 54 1.35 3.11 0.40 4
0.53 0.30 0.31 42Römerite, IM-10 0.52 0.38 0.63 56 1.38 3.49 0.30 29
0.59 0.17 0.50 15Voltaite, IMJ-05 0.59 0.26 0.36 44 1.42 2.69 0.45 56Voltaite, 91RS210A 0.59 0.26 0.36 45 1.42 2.68 0.46 55Voltaite, IMJ-06 0.59 0.27 0.35 42 1.41 2.96 0.29 21
1.41 2.52 0.42 37
Uncertainties are better than 0.05 mms−1 and areas better than 2%.
303J. Majzlan et al. / Chemical Geology 284 (2011) 296–305
4.4.1. Jarosite groupThe Mössbauer spectrum of natural jarosite (Fig. 6) exhibits a
characteristic ferric doublet with a high quadrupole splitting (Table 5).This large quadrupole splitting may indicate that the local environ-ment around Fe3+ is highly distorted and is in a good agreement withpreviously published values (Johnston, 1977; Leclerc, 1980).
Fig. 6. Mössbauer spectra of jarosite, copiapite, and rhomboclase.
4.4.2. Rhomboclase and copiapiteTheMössbauer spectrum of natural rhomboclase (Fig. 6) exhibits a
simple ferric high-spin doublet (isomer shifts 0.43 and 0.54 mm s−1
and quadrupole splittings 0.53 and 0.59 mm s−1 at RT and 80 K,respectively). These parameters are very similar to those for a syn-thetic sample that exhibits magnetic ordering between 20 and 5 K(spectra not shown here). The asymmetry observed in the spectrummeasured at 80 K is due to a texture effect that is eliminated in thespectrum measured at RT and at the magic angle of 54.7°. No signalattributable to ferrous iron can be discerned from the spectrum ofrhomboclase.
Copiapite exhibits a complex Mössbauer spectrum with individualcomponents resolved at 80 K (Fig. 6). The spectrum is dominated byferric components with a minor ferrous contribution (all high spinstate). Two ferric components are resolved in the spectrum and theirMössbauer parameters are listed in Table 5. The parameters andrelative abundance are very similar to a synthetic ferricopiapite (notshown). The two ferric sites in copiapite correspond to twocrystallographic positions for VIFe3+ in agreement with the structuralmodel of Fanfani et al. (1973). The ferrous component has a relativeintensity of 11.0% at 80 K. Assuming identical f-factors for all the sites,the relative spectral area can be converted straight-forwardly to arelative amount of ferrous iron in the sample (Table 3).
4.4.3. Voltaite and römeriteThe römerite Mössbauer spectra (Fig. 7) contain both ferrous and
ferric high-spin components. The ferrous component has an intensitythat is close to the ideal (33%) for one ferrous atom per unit cell(Table 5). The ferric component is very broad, making a unique solu-tion to the fitting problem difficult. Fits using two ferric components(Table 5) are satisfactory but not unique. The broadening of the ferriccomponent may be caused by variations in the local coordination. It isinteresting to compare the Mössbauer data to the structural informa-tion (Table 1). Both techniques indicate a single site for ferrous iron.
Both ferrous and ferric components in the Mössbauer spectra ofthe voltaite samples (Fig. 7 and Table 5) are high spin and aredominated by the ferrous components. The resolution of the spectrumincreases on lowering the temperature due to the stronger temper-ature dependence of the splitting of the ferrous lines. We note theslightly increased line width also of the ferrous component probablyindicating some variation in local coordination. The Mössbauerparameters for all voltaite samples are very similar and only thosefor two samples are given in Table 5. In addition, a minor ferrouscomponent in the sample IMJ-06 has an isomer shift of 1.40 mm s−1
and a quadrupole splitting of 2.99 mm s−1. Such a component has notbeen reported from other voltaite samples.
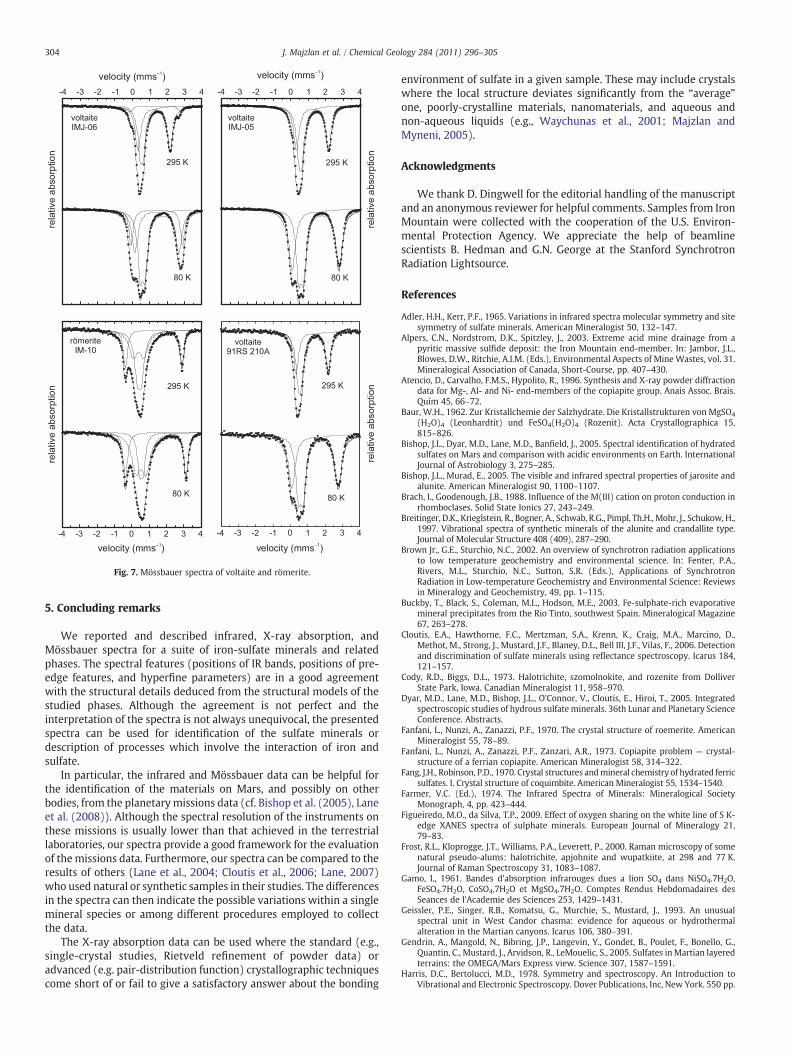
Fig. 7. Mössbauer spectra of voltaite and römerite.
304 J. Majzlan et al. / Chemical Geology 284 (2011) 296–305
5. Concluding remarks
We reported and described infrared, X-ray absorption, andMössbauer spectra for a suite of iron-sulfate minerals and relatedphases. The spectral features (positions of IR bands, positions of pre-edge features, and hyperfine parameters) are in a good agreementwith the structural details deduced from the structural models of thestudied phases. Although the agreement is not perfect and theinterpretation of the spectra is not always unequivocal, the presentedspectra can be used for identification of the sulfate minerals ordescription of processes which involve the interaction of iron andsulfate.
In particular, the infrared and Mössbauer data can be helpful forthe identification of the materials on Mars, and possibly on otherbodies, from the planetarymissions data (cf. Bishop et al. (2005), Laneet al. (2008)). Although the spectral resolution of the instruments onthese missions is usually lower than that achieved in the terrestriallaboratories, our spectra provide a good framework for the evaluationof the missions data. Furthermore, our spectra can be compared to theresults of others (Lane et al., 2004; Cloutis et al., 2006; Lane, 2007)who used natural or synthetic samples in their studies. The differencesin the spectra can then indicate the possible variations within a singlemineral species or among different procedures employed to collectthe data.
The X-ray absorption data can be used where the standard (e.g.,single-crystal studies, Rietveld refinement of powder data) oradvanced (e.g. pair-distribution function) crystallographic techniquescome short of or fail to give a satisfactory answer about the bonding
environment of sulfate in a given sample. These may include crystalswhere the local structure deviates significantly from the “average”one, poorly-crystalline materials, nanomaterials, and aqueous andnon-aqueous liquids (e.g., Waychunas et al., 2001; Majzlan andMyneni, 2005).
Acknowledgments
We thank D. Dingwell for the editorial handling of the manuscriptand an anonymous reviewer for helpful comments. Samples from IronMountain were collected with the cooperation of the U.S. Environ-mental Protection Agency. We appreciate the help of beamlinescientists B. Hedman and G.N. George at the Stanford SynchrotronRadiation Lightsource.
References
Adler, H.H., Kerr, P.F., 1965. Variations in infrared spectra molecular symmetry and sitesymmetry of sulfate minerals. American Mineralogist 50, 132–147.
Alpers, C.N., Nordstrom, D.K., Spitzley, J., 2003. Extreme acid mine drainage from apyritic massive sulfide deposit: the Iron Mountain end-member. In: Jambor, J.L.,Blowes, D.W., Ritchie, A.I.M. (Eds.), Environmental Aspects of Mine Wastes, vol. 31.Mineralogical Association of Canada, Short-Course, pp. 407–430.
Atencio, D., Carvalho, F.M.S., Hypolito, R., 1996. Synthesis and X-ray powder diffractiondata for Mg-, Al- and Ni- end-members of the copiapite group. Anais Assoc. Brais.Quím 45, 66–72.
Baur, W.H., 1962. Zur Kristallchemie der Salzhydrate. Die Kristallstrukturen von MgSO4
(H2O)4 (Leonhardtit) und FeSO4(H2O)4 (Rozenit). Acta Crystallographica 15,815–826.
Bishop, J.L., Dyar, M.D., Lane, M.D., Banfield, J., 2005. Spectral identification of hydratedsulfates on Mars and comparison with acidic environments on Earth. InternationalJournal of Astrobiology 3, 275–285.
Bishop, J.L., Murad, E., 2005. The visible and infrared spectral properties of jarosite andalunite. American Mineralogist 90, 1100–1107.
Brach, I., Goodenough, J.B., 1988. Influence of the M(III) cation on proton conduction inrhomboclases. Solid State Ionics 27, 243–249.
Breitinger, D.K., Krieglstein, R., Bogner, A., Schwab, R.G., Pimpl, Th.H., Mohr, J., Schukow,H.,1997. Vibrational spectra of synthetic minerals of the alunite and crandallite type.Journal of Molecular Structure 408 (409), 287–290.
Brown Jr., G.E., Sturchio, N.C., 2002. An overview of synchrotron radiation applicationsto low temperature geochemistry and environmental science. In: Fenter, P.A.,Rivers, M.L., Sturchio, N.C., Sutton, S.R. (Eds.), Applications of SynchrotronRadiation in Low-temperature Geochemistry and Environmental Science: Reviewsin Mineralogy and Geochemistry, 49, pp. 1–115.
Buckby, T., Black, S., Coleman, M.L., Hodson, M.E., 2003. Fe-sulphate-rich evaporativemineral precipitates from the Rio Tinto, southwest Spain. Mineralogical Magazine67, 263–278.
Cloutis, E.A., Hawthorne, F.C., Mertzman, S.A., Krenn, K., Craig, M.A., Marcino, D.,Methot, M., Strong, J., Mustard, J.F., Blaney, D.L., Bell III, J.F., Vilas, F., 2006. Detectionand discrimination of sulfate minerals using reflectance spectroscopy. Icarus 184,121–157.
Cody, R.D., Biggs, D.L., 1973. Halotrichite, szomolnokite, and rozenite from DolliverState Park, Iowa. Canadian Mineralogist 11, 958–970.
Dyar, M.D., Lane, M.D., Bishop, J.L., O'Connor, V., Cloutis, E., Hiroi, T., 2005. Integratedspectroscopic studies of hydrous sulfate minerals. 36th Lunar and Planetary ScienceConference. Abstracts.
Fanfani, L., Nunzi, A., Zanazzi, P.F., 1970. The crystal structure of roemerite. AmericanMineralogist 55, 78–89.
Fanfani, L., Nunzi, A., Zanazzi, P.F., Zanzari, A.R., 1973. Copiapite problem — crystal-structure of a ferrian copiapite. American Mineralogist 58, 314–322.
Fang, J.H., Robinson, P.D., 1970. Crystal structures andmineral chemistry of hydrated ferricsulfates. I. Crystal structure of coquimbite. American Mineralogist 55, 1534–1540.
Farmer, V.C. (Ed.), 1974. The Infrared Spectra of Minerals: Mineralogical SocietyMonograph, 4, pp. 423–444.
Figueiredo, M.O., da Silva, T.P., 2009. Effect of oxygen sharing on the white line of S K-edge XANES spectra of sulphate minerals. European Journal of Mineralogy 21,79–83.
Frost, R.L., Kloprogge, J.T., Williams, P.A., Leverett, P., 2000. Raman microscopy of somenatural pseudo-alums: halotrichite, apjohnite and wupatkiite, at 298 and 77 K.Journal of Raman Spectroscopy 31, 1083–1087.
Gamo, I., 1961. Bandes d'absorption infrarouges dues a lion SO4 dans NiSO4.7H2O,FeSO4.7H2O, CoSO4.7H2O et MgSO4.7H2O. Comptes Rendus Hebdomadaires desSeances de l'Academie des Sciences 253, 1429–1431.
Geissler, P.E., Singer, R.B., Komatsu, G., Murchie, S., Mustard, J., 1993. An unusualspectral unit in West Candor chasma: evidence for aqueous or hydrothermalalteration in the Martian canyons. Icarus 106, 380–391.
Gendrin, A., Mangold, N., Bibring, J.P., Langevin, Y., Gondet, B., Poulet, F., Bonello, G.,Quantin, C., Mustard, J., Arvidson, R., LeMouelic, S., 2005. Sulfates inMartian layeredterrains: the OMEGA/Mars Express view. Science 307, 1587–1591.
Harris, D.C., Bertolucci, M.D., 1978. Symmetry and spectroscopy. An Introduction toVibrational and Electronic Spectroscopy. Dover Publications, Inc, New York. 550 pp.

305J. Majzlan et al. / Chemical Geology 284 (2011) 296–305
Hawthorne, F.C., 1988. Mössbauer spectroscopy. In: Hawthorne, F.C. (Ed.), Spectro-scopic Methods in Mineralogy and Geology: Reviews in Mineralogy, pp. 255–340.
Hawthorne, F.C., Krivovichev, S.V., Burns, P.C., 2000. The crystal chemistry of sulfateminerals. In: Alpers, C.N., Jambor, J.L., Nordstrom, D.K. (Eds.), Sulfate Minerals —Crystallography, Geochemistry, and Environmental Significance: Reviews inMineralogy and Geochemistry, 40, pp. 1–112.
Hendricks, S.B., 1937. The crystal structure of alunite and the jarosites. AmericanMineralogist 22, 773–784.
Hunt, G.R., 1979. Near-infrared (1.3–2.4 μm) spectra of alteration minerals — potentialfor use in remote sensing. Geophysics 44, 1974–1986.
Jambor, J.L., Nordstrom, D.K., Alpers, C.N., 2000. Metal–sulfate salts from sulfidemineraloxidation. In: Alpers, C.N., Jambor, J.L., Nordstrom, D.K. (Eds.), Sulfate Minerals —
Crystallography, Geochemistry, and Environmental Significance: Reviews inMineralogy and Geochemistry, 40, pp. 303–350.
Johansson, G., 1962. On the crystal structure of FeOHSO4 and InOHSO4. Acta ChemicaScandinavica 16, 1234–1244.
Johnston, J.H., 1977. Jarosite and akaganeite fromWhite Island volcano, New Zealand—
an X-ray and Mössbauer study. Geochimica et Cosmochimica Acta 41, 539–544.Klingelhöfer, G., Morris, R.V., Bernhardt, B., Schroder, C., Rodionov, D.S., de Souza, P.A., Yen, A.,
Gellert,R., Evlanov,E.N., Zubkov,B., Foh, J., Bonnes,U., Kankeleit, E.,Gutlich, P.,Ming,D.W.,Renz, F., Wdowiak, T., Squyres, S.W., Arvidson, R.E., 2004. Jarosite and hematite atMeridiani Planum from Opportunity's Mössbauer spectrometer. Science 306,1740–1745.
Langevin, Y., Poulet, P., Bibring, J.-P., Gondet, B., 2005. Sulfates in the north polar regionof Mars detected by OMEGA/Mars Express. Science 307, 1584–1586.
Lane, M.D., 2007. Mid-infrared emission spectroscopy of sulfate and sulfate-bearingminerals. American Mineralogist 92, 1–18.
Lane, M.D., Bishop, J.L., Dyar, M.D., King, P.L., Parente, M., Hyde, B.C., 2008. Mineralogy ofthe Paso Robles soils on Mars. American Mineralogist 93, 728–739.
Lane, M.D., Dyar, M.D., Bishop, J.L., 2004. Spectroscopic evidence for hydrous iron sulfatein the Martian soil. Geophysical Research Letters 31. doi:10.1029/2004GL021231.
Larson, A.C., von Dreele, R.B., 1994. GSAS. General Structure Analysis System. LANSCE,MS-H805, Los Alamos, New Mexico.
Leclerc, A., 1980. Room-temperature Mössbauer analysis of jarosite-type compounds.Physics and Chemistry of Minerals 6, 327–334.
le Fur, Y., Coing-Boyat, J., Bassi, G., 1966. Structure des sulfates monohydrates,monocliniques, des metaux de transition, MSO4(H2O) (M = Mn, Fe, Co, Ni et Zn).Comptes Rendus Hebdomadaires des Seances de l'Academie des Sciences, Serie C,Sciences Chimiques 262, 632–635.
Long, G.J., Longworth, G., Battle, P., Cheetham, A.K., Thundathil, R.V., Beveridge, D., 1979.A study of anhydrous iron(III) sulfate by magnetic susceptibility, Mossbauer, andneutron diffraction techniques. Inorganic Chemistry 18, 624–632.
Majzlan, J., Botez, C., Stephens, P.W., 2005. The crystal structures of Fe2(SO4)3(H2O)5and the type specimen of lausenite. American Mineralogist 90, 411–416.
Majzlan, J., Michallik, R., 2007. The crystal structures, solid solutions and infraredspectra of copiapite-group minerals. Mineralogical Magazine 71, 557–573.
Majzlan, J., Myneni, S.C.B., 2005. Speciation of iron and sulfate in acid waters: aqueousclusters to mineral precipitates. Environmental Science & Technology 39, 188–194.
McCammon, C., 1995. Mössbauer spectroscopy of minerals. Mineral physics andcrystallography, A Handbook of physical constants. AGU Reference Shelf 2, 332–347.
Mereiter, K., 1972. Die Kristallstruktur des Voltaits, K2Fe2+5Fe3+3Al[SO4]12·18H2O.Tschermaks Mineralogische und Petrographische Mitteilungen 18, 185–202.
Mereiter, K., 1974. Die Kristallstruktur von Rhomboklas (H5O2)+(Fe(SO4)2(H2O)2).Tschermaks Mineralogische und Petrographische Mitteilungen 21, 216–232.
Miura, H., Niida, K., Hirama, T., 1994. Mikasaite, (Fe3+, Al)2(SO4)3, a new ferric sulphatemineral from Mikasa City, Hokkaido, Japan. Mineralogical Magazine 58, 649–653.
Montero-Sanchez, I.C., Brimhall, G.H., Alpers, C.N., Swayze, G.A., 2005. Characterizationof waste rock associated with acid drainage at the PennMine, California by ground-based visible to short-wave infrared reflectance spectroscopy assisted by digitalmapping. Chemical Geology 215, 453–472.
Morris, R.V., Klingenhöfer, G., Bernhardt, B., Schroder, C., Rodionov, D.S., de Souza, P.A.,Yen, A., Gellert, R., Evlanov, E.N., Foh, J., Kankeleit, E., Gutlich, P., Ming, D.W., Renz, F.,Wdowiak, T., Squyres, S.W., Arvidson, R.E., 2004. Mineralogy at Gusev Crater fromthe Mössbauer spectrometer on the Spirit Rover. Science 305, 833–836.
Myneni, S.C.B., 2000. X-ray and vibrational spectroscopy of sulfate in Earth materials.In: Alpers, C.N., Jambor, J.L., Nordstrom, D.K. (Eds.), Sulfate Minerals. Crystallog-raphy, Geochemistry, and Environmental Significance: Reviews in Mineralogy andGeochemistry, 40, pp. 113–172.
Myneni, S.C.B., 2002. Formation of stable chlorinated hydrocarbons in weathering plantmaterial. Science 295, 1039–1041.
Nielsen, U.G., Majzlan, J., Grey, C.P., 2008. Identification of local environments in defectjarosite (AFe3(SO4)2(OD)6, A=D3O, Na, K) samples by 2H MAS NMR spectroscopy.Chemistry of Materials 20, 2234–2241.
Nordstrom, D.K., Alpers, C.N., 1999. Negative pH, efflorescent mineralogy, andconsequences for environmental restoration at the Iron Mountain Superfund site,California. In: Smith, J.V. (Ed.), Geology, Mineralogy, and Human Welfare:Proceedings of the National Academy of Sciences, USA, 96, pp. 3455–3462.
Nordstrom, D.K., Alpers, C.N., Ptacek, C.J., Blowes, D.W., 2000. Negative pH andextremely acidic mine waters from Iron Mountain, California. EnvironmentalScience & Technology 34, 254–258.
Okude, N., Nagoshi, M., Noro, H., Baba, Y., Ymamoto, H., Sasaki, T.A., 1999. P and S K-edge XANES transition-metal phosphates and sulfates. Journal of ElectronSpectroscopy and Related Phenomena 101–103, 607–610.
Peterson, R.C., Roeder, P.L., You-Sheng, Zhang, 2003. The atomic structure of siderotil,(Fe, Cu)SO4·5H2O. Canadian Mineralogist 41, 671–676.
Pickering, I.J., Prince, R.C., Divers, T., George, G.N., 1998. Sulfur K-edge X-ray absorptionspectroscopy for determining the chemical speciation of sulfur in biologicalsystems. FEBS Letters 441, 11–14.
Posnjak, E., Merwin, H.E., 1922. The system, Fe2O3–SO3–H2O. Journal of the AmericanChemical Society 44, 1965–1994.
Powers, D.A., Rossman, G.R., Schugar, H.J., Gray, H.B., 1975. Magnetic-behavior andinfrared-spectra of jarosite, basic iron sulfate, and their chromate analogs. Journalof Solid State Chemistry 13, 1–13.
Quartieri, S., Triscari, M., Viani, A., 2000. Crystal structure of the hydrated sulphatepickeringite MgAl2(SO4)4·22H2O: X-ray powder diffraction study. EuropeanJournal of Mineralogy 12, 1131–1138.
Reddy, S.N., Rao, P.S., Ravikumar, R.V.S.S.N., Reddy, B.J., Reddy, Y.P., 2001. Spectralinvestigations on melanterite mineral from France. Spectrochimica Acta A 57,1283–1287.
Ripmeester, J.A., Ratcliffe, C.I., Dutrizac, J.E., Jambor, J.L., 1986. Hydronium ion in thealunite–jarosite group. Canadian Mineralogist 24, 435–447.
Robinson, P.D., Fang, J.H., 1973. Crystal structures and mineral chemistry of hydratedferric sulphates. III. The crystal structure of kornelite. American Mineralogist 58,535–539.
Ross, S.D., 1974. Sulphates and other oxy-anions of Group VI. In: Farmer, V.C. (Ed.), TheInfrared Spectra of Minerals: Mineralogical Society Monograph, 4, pp. 423–444.
Ryskin, Ya.I., 1974. The vibrations of protons in minerals: hydroxyl, water, andammonium. In: Farmer, V.C. (Ed.), The Infrared Spectra of Minerals: MineralogicalSociety Monograph, 4, pp. 137–181.
Sasaki, K., Konno, H., 2000. Morphology of jarosite-group compounds precipitated frombiologically and chemically oxidized Fe ions. Canadian Mineralogist 38, 45–56.
Serna, C.J., Cortina, C.P., Ramos, J.V.G., 1986. Infrared and Raman study of alunite–jarosite compounds. Spectrochimica Acta 42A, 729–734.
Stoffregen, R.E., Alpers, C.N., Jambor, J.L., 2000. Alunite–jarosite crystallography,thermodynamics, and geochronology. In: Alpers, C.N., Jambor, J.L., Nordstrom, D.K.(Eds.), Sulfate Minerals — Crystallography, Geochemistry, and EnvironmentalSignificance: Reviews in Mineralogy and Geochemistry, 40, pp. 453–479.
Stookey, L.L., 1970. Ferrozine — a new spectrophotometric reagent for iron. AnalyticalChemistry 42, 779–781.
Swayze, G.A., Smith, K.S., Clark, R.N., Sutley, S.J., Pearson, R.M., Vance, J.S., Hageman, P.L.,Briggs, P.H., Meier, A.L., Singleton, M.J., Roth, S., 2000. Using imaging spectroscopyto map acidic mine waste. Environmental Science & Technology 34, 47–54.
Townsend, T.E., 1987. Discrimination of iron alteration minerals in visible and near-infrared reflectance data. Journal of Geophysical Research 92 (B2), 1441–1454.
Tuovinen, O.H., Carlson, L., 1979. Jarosite in cultures of iron-oxidizing Thiobacilii.Journal of Geomicrobiology 1, 205–210.
Vilas, F., Jarvis, K.S., Gaffey, M.J., 1994. Iron alteration minerals in the visible and near-infrared spectra of low-albedo asteroids. Icarus 109, 274–283.
Waychunas, G.A., Myneni, S.C.B., Traina, S.J., Bigham, J.M., Fuller, C.C., Davis, J.A., 2001.Reanalysis of the schwertmannite structure and the incorporation of SO4
2− groups: anIR, XAS, WAXS and simulation study. Abstracts of the 11th Goldschmidt conference.
Wills, A.S., Harrison, A., 1996. Structure and magnetism of hydronium jarosite, a modelKagome antiferromagnet. Journal of the Chemical Society, Faraday Transactions 92,2161–2166.