Embed Size (px)
Citation preview
Vibrationally Resolved Absorption and Emission Spectra ofDithiophene in the Gas Phase and in Solution by First-PrincipleQuantum Mechanical CalculationsE. Stendardo,† F. Avila Ferrer,‡ F. Santoro,*,‡ and R. Improta*,†
†CNR−Consiglio Nazionale delle Ricerche, Istituto di Biostrutture e Biommagini (IBB-CNR), Via Mezzocannone 16, I-80136,Napoli, Italy‡CNR−Consiglio Nazionale delle Ricerche, Istituto di Chimica dei Composti Organo-Metallici (ICCOM-CNR), UOS di Pisa, Areadella Ricerca, via G. Moruzzi 1, I-56124 Pisa, Italy
*S Supporting Information
ABSTRACT: The absorption and emission spectra of dithiophene have been computed in different environments (gas phase,apolar, and polar solvents) and at different temperatures, including Duschinsky, temperature and solvent effects at full ab initiolevel, and considering the anharmonicity of the double well potential associated with the inter-ring torsional mode. Thecomputed spectra are in very good agreement with the experimental ones, allowing for a complete assignment of the mainvibrational features. Five different density functionals (BLYP, B3LYP, CAM-B3LYP, BHLYP, and PBE0) have been tested, andCAM-B3LYP and PBE0 are the most accurate.
1. INTRODUCTION
Polythiophenes have attracted considerable interest for theiruse and their potentialities in several applications in organicelectronics, solar cells, and nonlinear optics.1−3 A deeperunderstanding of the factors modulating their optical propertiesand the shape of their absorption and emission spectra is criticalfor interpreting the available experimental results,4−12 especiallythose concerning more complex supramolecular systems,13 andfor designing new materials with purposely tailored properties.In this respect, oligothiophenes have been extensively studiedas model for polythiophenes, and they have also been used inseveral electronic devices.2,3 Several interesting papers havebeen devoted to the computation of vibrationally resolvedoptical spectra of oligothiophenes, providing very usefulinformation on the chemical-physical effects ruling the observedline shape.14−24 On the other hand, most of the approachesapplied up to now14−18,22 rely on the use of some empiricalparameters (e.g., to include the effect of the temperature on thespectra) and/or neglect the Duschinsky effect. Besidesdecreasing the accuracy of the computed spectra, theselimitations can sometimes prevent a quantitative assignmentof the experimental spectra. Just to make an example, in thefollowing we show that without including the Duschinsky effectand considering the frequency shifts associated with theelectronic transition (i.e., that normal modes and frequenciesin the ground and in the excited state can be different), it is notpossible to firmly assign the vibrational modes contributing tothe different peaks of the low-temperature excitation spectrumof oligothiophenes.6,12 We have therefore re-examined theoptical spectra in solution of oligo-thiophenes, exploiting recentadvances in the calculation of vibrational spectra by time-independent methods44−54 and in the inclusion of solventeffects by continuum models, as the Polarizable ContinuumModel (PCM). The cornerstones of our approach will be as
follows: (i) complete characterization of the excited stateminima and vibrational frequencies at the TD-DFT level, (ii)inclusion of the Duschinsky effect, (iii) nonempirical treatmentof temperature effects, (iv) accurate treatment of the effect ofthe changes in the molecular planarity associated with theelectronic transition, (v) inclusion of solvent effect not only onthe transition energies but also on the ground and excitedequilibrium geometries and normal modes. As a first step wehere report a thorough study of the absorption and emissionspectra of dithiophene (T2, see Figure 1) in differentenvironments (gas phase, apolar solvent, polar solvent) andat different temperatures. The computed spectra are in very
Received: July 30, 2012Published: October 8, 2012
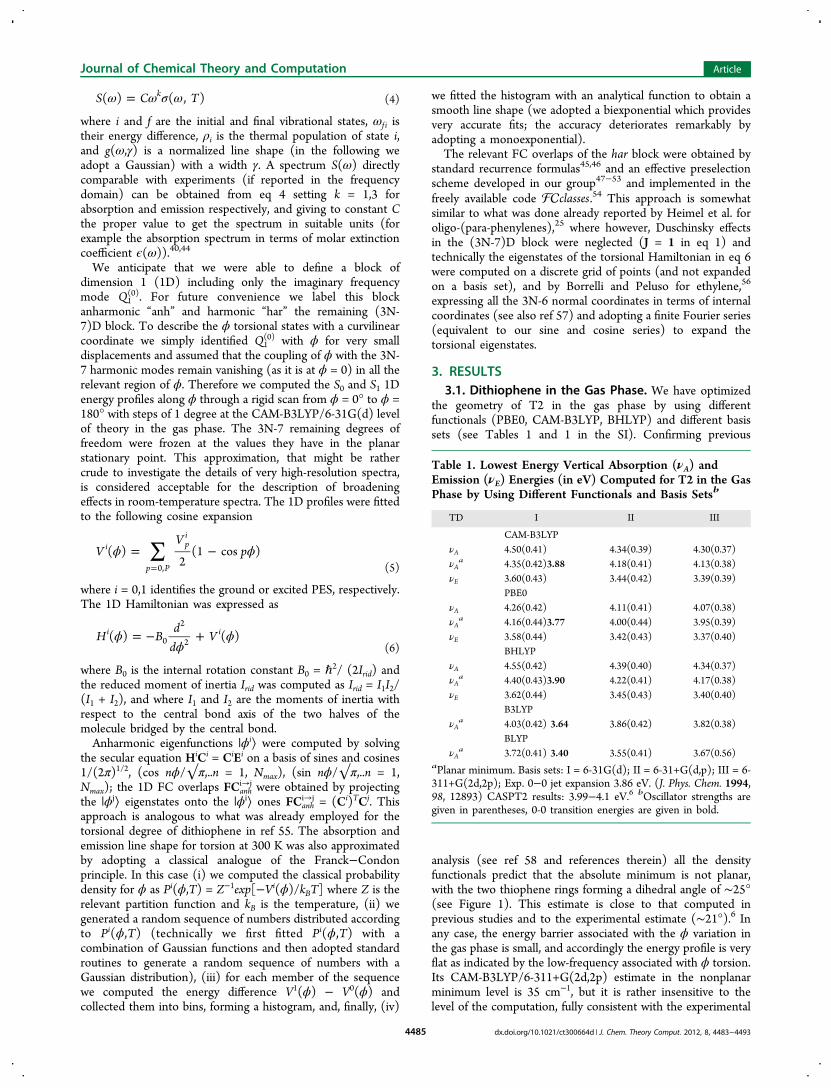
Figure 1. Schematic drawing and atom labeling of dithiophene. Thevariation in the bond lengths and in the bond angles associated withthe S0 → S1 electronic transition (CAM-B3LYP/6-31G(d) calcu-lations) is also shown.
Article
pubs.acs.org/JCTC
© 2012 American Chemical Society 4483 dx.doi.org/10.1021/ct300664d | J. Chem. Theory Comput. 2012, 8, 4483−4493
good agreement with the experimental ones, allowing for acomplete assignment of the main vibrational features. For whatconcerns the electronic methods, this study will also give theopportunity of testing the accuracy of different densityfunctionals (BLYP, B3LYP, CAM-B3LYP, BHLYP, andPBE0) in predicting the vibrational structure of the opticalspectra.This paper is organized as it follows. After discussing the
details of our vibronic calculations (Section 2), the first twosections (3.1 and 3.2) of the Results are devoted to thecomparison between the performances of the differentfunctionals/basis sets. The assignment of the high-resolutionabsorption and emission spectra is then performed in Section3.3, while solvent effects are discussed in Section 3.4. Section3.5, finally, is devoted to a detailed discussion of the double wellexisting on the lowest energy torsional mode on S0 and of theconsequent temperature effect on the spectra. Our concludingremarks are reported in Section 4.
2. COMPUTATIONAL DETAILS
2.1. Electronic Calculations. DFT calculations have beenemployed to compute ground state minima and vibrationalfrequencies, whereas for the S1 excited state we resorted toTime-Dependent (TD) DFT calculations, for which analyticgradients are available,26 followed by numerical calculation ofthe Hessian. We have compared the performances of 5 differentdensity functionals, namely the gradient corrected BLYPfunctional,27,28 hybrid functionals with different ratio of HFexchange, i.e. B3LYP (20% of HF exchange),29,28 PBE0 (25%of HF exchange),30 and BHLYP (50% of HF exchange)31 andthe long-range corrected CAM-B3LYP functional.32 In ourcalculations we have used five different basis sets, namely theminimal 6-31G(d) and more extended 6-31+G(d,p) and 6-311+G(2d,2p) standard bases and two large Dunning’scorrelation consistent basis sets augmented with diffusefunctions aug-cc-PVTZ and aug-cc-PVQZ.Bulk solvent effects have been included by the PCM model,33
resorting to the standard implementation of PCM/TD-DFT,based on the Linear Response theory (LR-PCM/TD-DFT),34
for which analytical gradient are available, for excited stategeometry optimizations35 and normal modes calculations, whiletransition energies have been computed also at the State-Specific (SS-PCM/TD-DFT) level.36−38 Excited state geometryoptimizations have been performed in the nonequilibrium(neq) time regime, in order to avoid the overestimation of thetransition intensity typical of LR-PCM calculations in theequilibrium time-regime (eq).36 In any case, we have performedsome test excited state geometry optimizations in hexane anddioxane; also at the the solvent eq level. The S1 frequenciesdiffer by less than 1 cm−1 from that obtained at the neq level,indicating that our results are not effected by the choice of thetime-regime used in the geometry optimizations. In equilibriumPCM calculations the 'static’ dielectric constants at roomtemperature have been used: namely 1.88 for hexane, 2.20 fordioxane, and 37.21 for dimethylformamide. In nonequilibriumcalculations the dielectric constants at optical frequency (ϵopt =n2, n is the refraction index) have been used, namely 1.89 forhexane, 2.02 for dioxane, and 2.04 for dimethylformamide. Theeffect of the temperature on the dielectric constants has notbeen considered.18
All the calculations have been performed by using theGuassian09 package.39
2.2. Calculation of the Vibronic Spectra. Due to thebrightness of the S0↔S1 transition, Franck−Condon (FC)approximation is adequate to the computation of the vibrationalstructure associated with the absorption and emission spectra.To perform such computations it was necessary to build up amodel of the S0 and S1 PES. As a starting point we definedharmonic Potential Energy Surfaces (PES) for S0 and S1,allowing for Duschinsky rotation of normal coordinates andadopting the so-called Adiabatic Hessian (AH) scheme.40,41 Tothat end we located S0 and S1 minima and computed the set ofnormal coordinates Q(i) and frequencies Ω(i) for both the states(i = 0,1 for S0 and S1 respectively). The Duschinsky relationholds
= +Q JQ K(0) (1)(1)
where J is the rotation matrix, and K is the vector of thedisplacements of equilibrium positions along modes Q(0).The S0 surface shows marked anharmonicity along the
central CC bond torsion ϕ. Therefore for S0 we characterizedboth the global nonplanar minimum and a low-energytransition state at planar configurations, computing theirstructures and Hessians. The planar stationary point exhibitsan imaginary frequency along the Q1
(0) mode corresponding to amotion along ϕ, and, to reliably describe temperature effects inabsorption and emission, it is necessary to undergo ananharmonic description of the ϕ vibrational states. Hazra andNooijen proposed a computational scheme to deal with double-well profiles, based on the calculation of a one-dimensional(1D) profile of the PES along the imaginary-frequency mode.42
This method is attractive inasmuch it can describe Duschinskymixings of the imaginary frequency mode with the othermodes, through the usage of an “intermediate” harmonic basisset. Unfortunately, a rigid scan along Q1
(0) Cartesian normalmode leads to an almost vanishing nonplanar minimum (morestable than the planar stationary point by ≈2 cm−1, while thetrue global minimum is ∼70 cm−1 more stable, see below) thatdoes not support any vibrational state. To properly describe thenonplanar minimum is therefore necessary to move to aninternal coordinate description and express the torsional stateswith a suitable basis set. This treatment is much moreaffordable if the Duschinsky matrix J assumes a block-diagonalform and the dimension of the block of the modes includingthe imaginary-frequency mode is small (e.g., 2 or 3). Wedefined a first square-block “A” by starting from Q1
(0) andindividuating iteratively all the modes Q1
(0) and Qj(1) in order
that all the S0 (S1) modes in the block are projected on the S1(S0) modes by more than 1-ϵ, where ϵ is a convenient smallnumber. Block ”B” contains the remaining modes. Strict block-diagonalization is then obtained by setting Jij = 0 if i ϵ A and j ϵB or vice versa, and the Duschinsky matrices of each block JCare reorthogonalized according to Lowdin JC = JC (JC
TJC)−1/2
with C = A,B.Once J is in block-diagonal form, the FC spectrum line shape
of the molecule σ(ω,T) at temperature T can be simplycomputed as a convolution of the two line shapes σA(ω,T) andσB(ω,T)
43
∑ ∑σ ω ρ ω ω γ= −T i f gFC( , ) ( , ) ( , )Ci f
i C fi2
(2)
∫σ ω σ ω ω σ ω ω= − ′ ′ ′T T T d( , ) ( , ) ( , )A B (3)
Journal of Chemical Theory and Computation Article
dx.doi.org/10.1021/ct300664d | J. Chem. Theory Comput. 2012, 8, 4483−44934484
ω ω σ ω=S C T( ) ( , )k(4)
where i and f are the initial and final vibrational states, ωf i istheir energy difference, ρi is the thermal population of state i,and g(ω,γ) is a normalized line shape (in the following weadopt a Gaussian) with a width γ. A spectrum S(ω) directlycomparable with experiments (if reported in the frequencydomain) can be obtained from eq 4 setting k = 1,3 forabsorption and emission respectively, and giving to constant Cthe proper value to get the spectrum in suitable units (forexample the absorption spectrum in terms of molar extinctioncoefficient ϵ(ω)).40,44
We anticipate that we were able to define a block ofdimension 1 (1D) including only the imaginary frequencymode Q1
(0). For future convenience we label this blockanharmonic “anh” and harmonic “har” the remaining (3N-7)D block. To describe the ϕ torsional states with a curvilinearcoordinate we simply identified Q1
(0) with ϕ for very smalldisplacements and assumed that the coupling of ϕ with the 3N-7 harmonic modes remain vanishing (as it is at ϕ = 0) in all therelevant region of ϕ. Therefore we computed the S0 and S1 1Denergy profiles along ϕ through a rigid scan from ϕ = 0° to ϕ =180° with steps of 1 degree at the CAM-B3LYP/6-31G(d) levelof theory in the gas phase. The 3N-7 remaining degrees offreedom were frozen at the values they have in the planarstationary point. This approximation, that might be rathercrude to investigate the details of very high-resolution spectra,is considered acceptable for the description of broadeningeffects in room-temperature spectra. The 1D profiles were fittedto the following cosine expansion
∑ϕ ϕ= −=
VV
p( )2
(1 cos )i
p P
pi
0, (5)
where i = 0,1 identifies the ground or excited PES, respectively.The 1D Hamiltonian was expressed as
ϕϕ
ϕ= − +H Bd
dV( ) ( )i i
0
2
2 (6)
where B0 is the internal rotation constant B0 = ℏ2/ (2Irid) andthe reduced moment of inertia Irid was computed as Irid = I1I2/(I1 + I2), and where I1 and I2 are the moments of inertia withrespect to the central bond axis of the two halves of themolecule bridged by the central bond.Anharmonic eigenfunctions |ϕi⟩ were computed by solving
the secular equation HiCi = CiEi on a basis of sines and cosines1/(2π)1/2, (cos nϕ/√π,..n = 1, Nmax), (sin nϕ/√π,..n = 1,Nmax); the 1D FC overlaps FCanh
i→j were obtained by projectingthe |ϕj⟩ eigenstates onto the |ϕi⟩ ones FCanh
i→j = (Ci)TCj. Thisapproach is analogous to what was already employed for thetorsional degree of dithiophene in ref 55. The absorption andemission line shape for torsion at 300 K was also approximatedby adopting a classical analogue of the Franck−Condonprinciple. In this case (i) we computed the classical probabilitydensity for ϕ as Pi(ϕ,T) = Z−1exp[−Vi(ϕ)/kBT] where Z is therelevant partition function and kB is the temperature, (ii) wegenerated a random sequence of numbers distributed accordingto Pi(ϕ,T) (technically we first fitted Pi(ϕ,T) with acombination of Gaussian functions and then adopted standardroutines to generate a random sequence of numbers with aGaussian distribution), (iii) for each member of the sequencewe computed the energy difference V1(ϕ) − V0(ϕ) andcollected them into bins, forming a histogram, and, finally, (iv)
we fitted the histogram with an analytical function to obtain asmooth line shape (we adopted a biexponential which providesvery accurate fits; the accuracy deteriorates remarkably byadopting a monoexponential).The relevant FC overlaps of the har block were obtained by
standard recurrence formulas45,46 and an effective preselectionscheme developed in our group47−53 and implemented in thefreely available code classes.54 This approach is somewhatsimilar to what was done already reported by Heimel et al. foroligo-(para-phenylenes),25 where however, Duschinsky effectsin the (3N-7)D block were neglected (J = 1 in eq 1) andtechnically the eigenstates of the torsional Hamiltonian in eq 6were computed on a discrete grid of points (and not expandedon a basis set), and by Borrelli and Peluso for ethylene,56
expressing all the 3N-6 normal coordinates in terms of internalcoordinates (see also ref 57) and adopting a finite Fourier series(equivalent to our sine and cosine series) to expand thetorsional eigenstates.
3. RESULTS3.1. Dithiophene in the Gas Phase. We have optimized
the geometry of T2 in the gas phase by using differentfunctionals (PBE0, CAM-B3LYP, BHLYP) and different basissets (see Tables 1 and 1 in the SI). Confirming previous
analysis (see ref 58 and references therein) all the densityfunctionals predict that the absolute minimum is not planar,with the two thiophene rings forming a dihedral angle of ∼25°(see Figure 1). This estimate is close to that computed inprevious studies and to the experimental estimate (∼21°).6 Inany case, the energy barrier associated with the ϕ variation inthe gas phase is small, and accordingly the energy profile is veryflat as indicated by the low-frequency associated with ϕ torsion.Its CAM-B3LYP/6-311+G(2d,2p) estimate in the nonplanarminimum level is 35 cm−1, but it is rather insensitive to thelevel of the computation, fully consistent with the experimental
Table 1. Lowest Energy Vertical Absorption (νA) andEmission (νE) Energies (in eV) Computed for T2 in the GasPhase by Using Different Functionals and Basis Setsb
TD I II III
CAM-B3LYPνA 4.50(0.41) 4.34(0.39) 4.30(0.37)νAa 4.35(0.42)3.88 4.18(0.41) 4.13(0.38)
νE 3.60(0.43) 3.44(0.42) 3.39(0.39)PBE0
νA 4.26(0.42) 4.11(0.41) 4.07(0.38)νAa 4.16(0.44)3.77 4.00(0.44) 3.95(0.39)
νE 3.58(0.44) 3.42(0.43) 3.37(0.40)BHLYP
νA 4.55(0.42) 4.39(0.40) 4.34(0.37)νAa 4.40(0.43)3.90 4.22(0.41) 4.17(0.38)
νE 3.62(0.44) 3.45(0.43) 3.40(0.40)B3LYP
νAa 4.03(0.42) 3.64 3.86(0.42) 3.82(0.38)
BLYPνAa 3.72(0.41) 3.40 3.55(0.41) 3.67(0.56)
aPlanar minimum. Basis sets: I = 6-31G(d); II = 6-31+G(d,p); III = 6-311+G(2d,2p); Exp. 0−0 jet expansion 3.86 eV. (J. Phys. Chem. 1994,98, 12893) CASPT2 results: 3.99−4.1 eV.6 bOscillator strengths aregiven in parentheses, 0-0 transition energies are given in bold.
Journal of Chemical Theory and Computation Article
dx.doi.org/10.1021/ct300664d | J. Chem. Theory Comput. 2012, 8, 4483−44934485
value measured in jet-cooled conditions (25 cm−1),6 consider-ing the error due to the use of the harmonic approximation.It has indeed been suggested that, when embedded in a
organic glass at very low temperature, T2 is planar already inthe S0 minimum.22,59 Our analysis of the temperaturedependence of the spectra, reported in the following sections,supports this hypothesis, though it is reasonable to assume thatthe shape of the PES along ϕ is much shallower than in S1.Therefore we have also optimized S0 under planarity
constraint, and, whenever not otherwise specified, the spectrahave been computed modeling the S0 PES as a quadratic withminimum at the S0 planar minimum. This latter is very close inenergy to the absolute minimum (the energy difference being<100 cm−1) and features only one very low imaginaryfrequency (see Table 1 in the SI).The most significant geometry shifts associated with the S0→
S1 (corresponding to a HOMO→LUMO excitation) electronictransition are given in Figure 1. In line with the bonding/antibonding character of the molecular orbitals (MOs) involvedin the transition, they involve the decrease of the C2C2′ bonddistance (suggesting a partial double-bond character on S1) andthe increase of the C2C3 and C2′C3 bond lengths. As alreadydiscussed, in S1 minimum T2 adopts a planar geometry with alarger frequency than in S0 (73 cm−1 according to CAM-B3LYP/6-311+G(2d,2p) calculations), associated with therotation around ϕ, in line with the partial double-bondcharacter of the C2C2′ bond.3.2. Optical Spectra in the Gas Phase: The Effect of
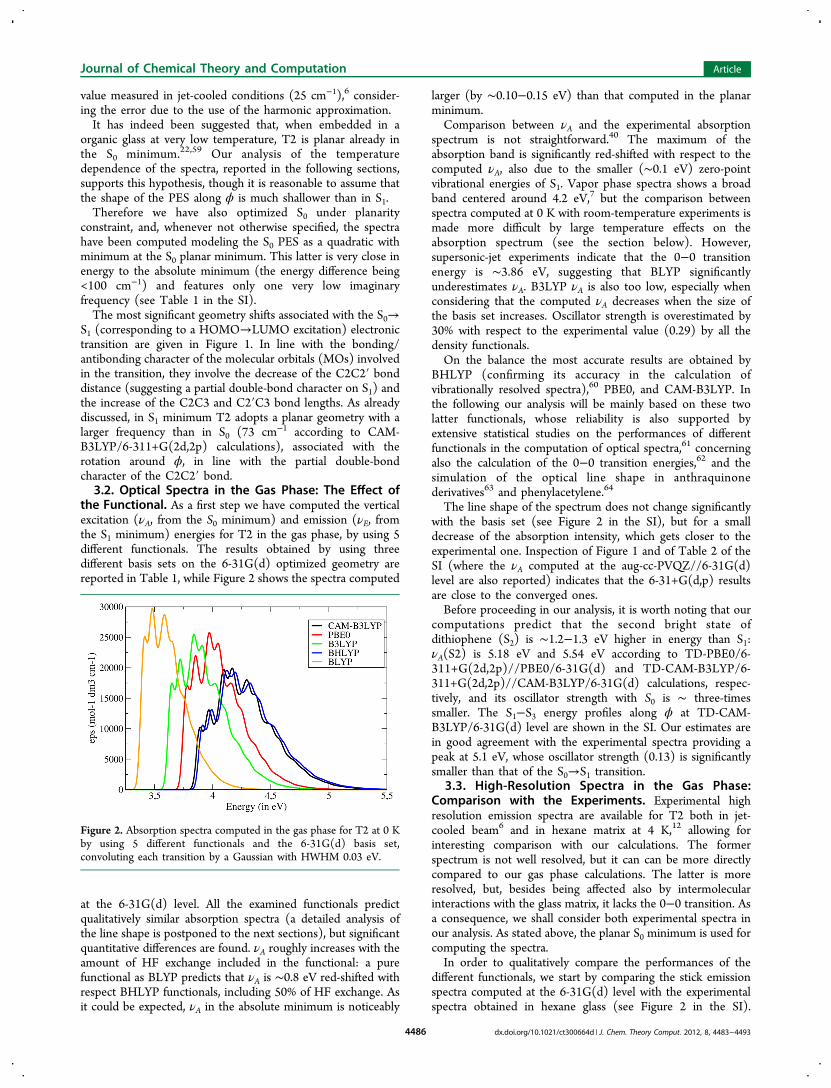
the Functional. As a first step we have computed the verticalexcitation (νA, from the S0 minimum) and emission (νE, fromthe S1 minimum) energies for T2 in the gas phase, by using 5different functionals. The results obtained by using threedifferent basis sets on the 6-31G(d) optimized geometry arereported in Table 1, while Figure 2 shows the spectra computed
at the 6-31G(d) level. All the examined functionals predictqualitatively similar absorption spectra (a detailed analysis ofthe line shape is postponed to the next sections), but significantquantitative differences are found. νA roughly increases with theamount of HF exchange included in the functional: a purefunctional as BLYP predicts that νA is ∼0.8 eV red-shifted withrespect BHLYP functionals, including 50% of HF exchange. Asit could be expected, νA in the absolute minimum is noticeably
larger (by ∼0.10−0.15 eV) than that computed in the planarminimum.Comparison between νA and the experimental absorption
spectrum is not straightforward.40 The maximum of theabsorption band is significantly red-shifted with respect to thecomputed νA, also due to the smaller (∼0.1 eV) zero-pointvibrational energies of S1. Vapor phase spectra shows a broadband centered around 4.2 eV,7 but the comparison betweenspectra computed at 0 K with room-temperature experiments ismade more difficult by large temperature effects on theabsorption spectrum (see the section below). However,supersonic-jet experiments indicate that the 0−0 transitionenergy is ∼3.86 eV, suggesting that BLYP significantlyunderestimates νA. B3LYP νA is also too low, especially whenconsidering that the computed νA decreases when the size ofthe basis set increases. Oscillator strength is overestimated by30% with respect to the experimental value (0.29) by all thedensity functionals.On the balance the most accurate results are obtained by
BHLYP (confirming its accuracy in the calculation ofvibrationally resolved spectra),60 PBE0, and CAM-B3LYP. Inthe following our analysis will be mainly based on these twolatter functionals, whose reliability is also supported byextensive statistical studies on the performances of differentfunctionals in the computation of optical spectra,61 concerningalso the calculation of the 0−0 transition energies,62 and thesimulation of the optical line shape in anthraquinonederivatives63 and phenylacetylene.64
The line shape of the spectrum does not change significantlywith the basis set (see Figure 2 in the SI), but for a smalldecrease of the absorption intensity, which gets closer to theexperimental one. Inspection of Figure 1 and of Table 2 of theSI (where the νA computed at the aug-cc-PVQZ//6-31G(d)level are also reported) indicates that the 6-31+G(d,p) resultsare close to the converged ones.Before proceeding in our analysis, it is worth noting that our
computations predict that the second bright state ofdithiophene (S2) is ∼1.2−1.3 eV higher in energy than S1:νA(S2) is 5.18 eV and 5.54 eV according to TD-PBE0/6-311+G(2d,2p)//PBE0/6-31G(d) and TD-CAM-B3LYP/6-311+G(2d,2p)//CAM-B3LYP/6-31G(d) calculations, respec-tively, and its oscillator strength with S0 is ∼ three-timessmaller. The S1−S3 energy profiles along ϕ at TD-CAM-B3LYP/6-31G(d) level are shown in the SI. Our estimates arein good agreement with the experimental spectra providing apeak at 5.1 eV, whose oscillator strength (0.13) is significantlysmaller than that of the S0→S1 transition.
3.3. High-Resolution Spectra in the Gas Phase:Comparison with the Experiments. Experimental highresolution emission spectra are available for T2 both in jet-cooled beam6 and in hexane matrix at 4 K,12 allowing forinteresting comparison with our calculations. The formerspectrum is not well resolved, but it can can be more directlycompared to our gas phase calculations. The latter is moreresolved, but, besides being affected also by intermolecularinteractions with the glass matrix, it lacks the 0−0 transition. Asa consequence, we shall consider both experimental spectra inour analysis. As stated above, the planar S0 minimum is used forcomputing the spectra.In order to qualitatively compare the performances of the
different functionals, we start by comparing the stick emissionspectra computed at the 6-31G(d) level with the experimentalspectra obtained in hexane glass (see Figure 2 in the SI).
Figure 2. Absorption spectra computed in the gas phase for T2 at 0 Kby using 5 different functionals and the 6-31G(d) basis set,convoluting each transition by a Gaussian with HWHM 0.03 eV.
Journal of Chemical Theory and Computation Article
dx.doi.org/10.1021/ct300664d | J. Chem. Theory Comput. 2012, 8, 4483−44934486
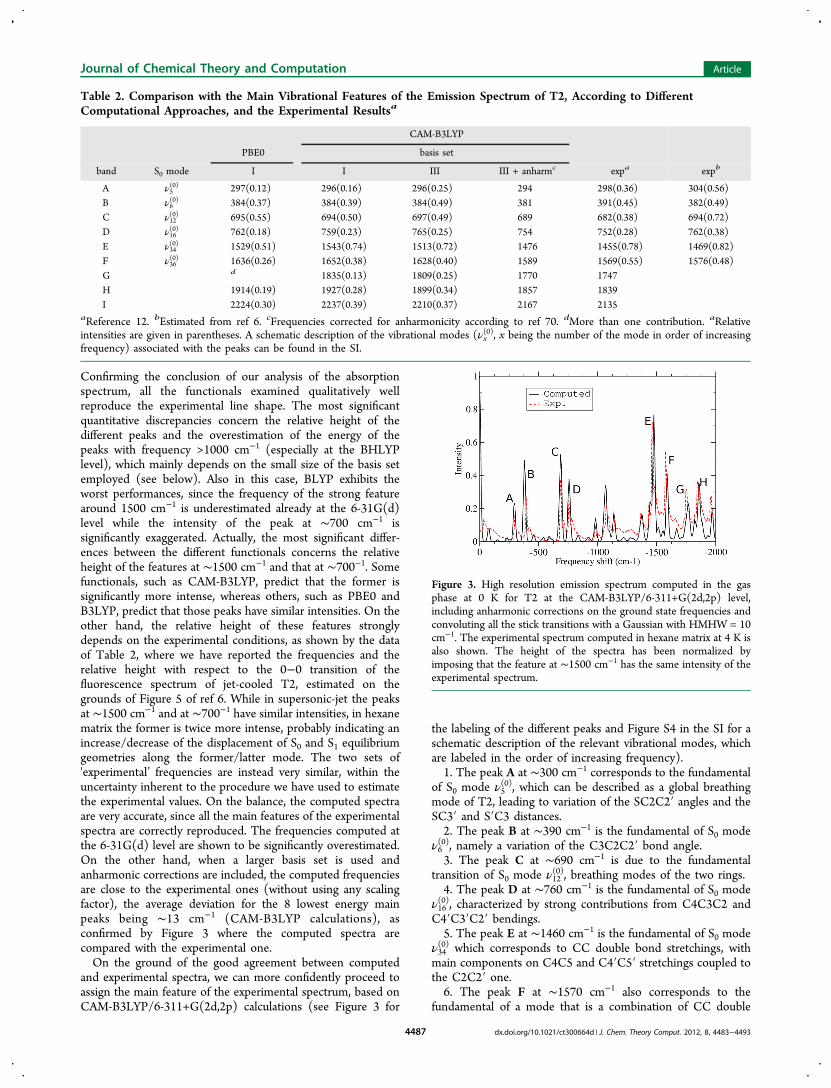
Confirming the conclusion of our analysis of the absorptionspectrum, all the functionals examined qualitatively wellreproduce the experimental line shape. The most significantquantitative discrepancies concern the relative height of thedifferent peaks and the overestimation of the energy of thepeaks with frequency >1000 cm−1 (especially at the BHLYPlevel), which mainly depends on the small size of the basis setemployed (see below). Also in this case, BLYP exhibits theworst performances, since the frequency of the strong featurearound 1500 cm−1 is underestimated already at the 6-31G(d)level while the intensity of the peak at ∼700 cm−1 issignificantly exaggerated. Actually, the most significant differ-ences between the different functionals concerns the relativeheight of the features at ∼1500 cm−1 and that at ∼700−1. Somefunctionals, such as CAM-B3LYP, predict that the former issignificantly more intense, whereas others, such as PBE0 andB3LYP, predict that those peaks have similar intensities. On theother hand, the relative height of these features stronglydepends on the experimental conditions, as shown by the dataof Table 2, where we have reported the frequencies and therelative height with respect to the 0−0 transition of thefluorescence spectrum of jet-cooled T2, estimated on thegrounds of Figure 5 of ref 6. While in supersonic-jet the peaksat ∼1500 cm−1 and at ∼700−1 have similar intensities, in hexanematrix the former is twice more intense, probably indicating anincrease/decrease of the displacement of S0 and S1 equilibriumgeometries along the former/latter mode. The two sets of'experimental’ frequencies are instead very similar, within theuncertainty inherent to the procedure we have used to estimatethe experimental values. On the balance, the computed spectraare very accurate, since all the main features of the experimentalspectra are correctly reproduced. The frequencies computed atthe 6-31G(d) level are shown to be significantly overestimated.On the other hand, when a larger basis set is used andanharmonic corrections are included, the computed frequenciesare close to the experimental ones (without using any scalingfactor), the average deviation for the 8 lowest energy mainpeaks being ∼13 cm−1 (CAM-B3LYP calculations), asconfirmed by Figure 3 where the computed spectra arecompared with the experimental one.On the ground of the good agreement between computed
and experimental spectra, we can more confidently proceed toassign the main feature of the experimental spectrum, based onCAM-B3LYP/6-311+G(2d,2p) calculations (see Figure 3 for
the labeling of the different peaks and Figure S4 in the SI for aschematic description of the relevant vibrational modes, whichare labeled in the order of increasing frequency).1. The peak A at ∼300 cm−1 corresponds to the fundamental
of S0 mode ν5(0), which can be described as a global breathing
mode of T2, leading to variation of the SC2C2′ angles and theSC3′ and S′C3 distances.2. The peak B at ∼390 cm−1 is the fundamental of S0 mode
ν6(0), namely a variation of the C3C2C2′ bond angle.3. The peak C at ∼690 cm−1 is due to the fundamental
transition of S0 mode ν12(0), breathing modes of the two rings.
4. The peak D at ∼760 cm−1 is the fundamental of S0 modeν16(0), characterized by strong contributions from C4C3C2 andC4′C3′C2′ bendings.5. The peak E at ∼1460 cm−1 is the fundamental of S0 mode
ν34(0) which corresponds to CC double bond stretchings, withmain components on C4C5 and C4′C5′ stretchings coupled tothe C2C2′ one.6. The peak F at ∼1570 cm−1 also corresponds to the
fundamental of a mode that is a combination of CC double
Table 2. Comparison with the Main Vibrational Features of the Emission Spectrum of T2, According to DifferentComputational Approaches, and the Experimental Resultsa
CAM-B3LYP
PBE0 basis set
band S0 mode I I III III + anharmc expa expb
A ν5(0) 297(0.12) 296(0.16) 296(0.25) 294 298(0.36) 304(0.56)
B ν6(0) 384(0.37) 384(0.39) 384(0.49) 381 391(0.45) 382(0.49)
C ν12(0) 695(0.55) 694(0.50) 697(0.49) 689 682(0.38) 694(0.72)
D ν16(0) 762(0.18) 759(0.23) 765(0.25) 754 752(0.28) 762(0.38)
E ν34(0) 1529(0.51) 1543(0.74) 1513(0.72) 1476 1455(0.78) 1469(0.82)
F ν36(0) 1636(0.26) 1652(0.38) 1628(0.40) 1589 1569(0.55) 1576(0.48)
G d 1835(0.13) 1809(0.25) 1770 1747H 1914(0.19) 1927(0.28) 1899(0.34) 1857 1839I 2224(0.30) 2237(0.39) 2210(0.37) 2167 2135
aReference 12. bEstimated from ref 6. cFrequencies corrected for anharmonicity according to ref 70. dMore than one contribution. aRelativeintensities are given in parentheses. A schematic description of the vibrational modes (νx
(0), x being the number of the mode in order of increasingfrequency) associated with the peaks can be found in the SI.
Figure 3. High resolution emission spectrum computed in the gasphase at 0 K for T2 at the CAM-B3LYP/6-311+G(2d,2p) level,including anharmonic corrections on the ground state frequencies andconvoluting all the stick transitions with a Gaussian with HMHW = 10cm−1. The experimental spectrum computed in hexane matrix at 4 K isalso shown. The height of the spectra has been normalized byimposing that the feature at ∼1500 cm−1 has the same intensity of theexperimental spectrum.
Journal of Chemical Theory and Computation Article
dx.doi.org/10.1021/ct300664d | J. Chem. Theory Comput. 2012, 8, 4483−44934487
bond stretchings (ν36(0)), but in this case C2C2′ stretching is
coupled to C3C2 and C3′C2′ bond stretchings.7. The peaks G, H, and I correspond to combination bands
with one quantum on normal mode ν34(0) and one quantum on
modes ν5(0), ν6
(0), and ν12(0), respectively.
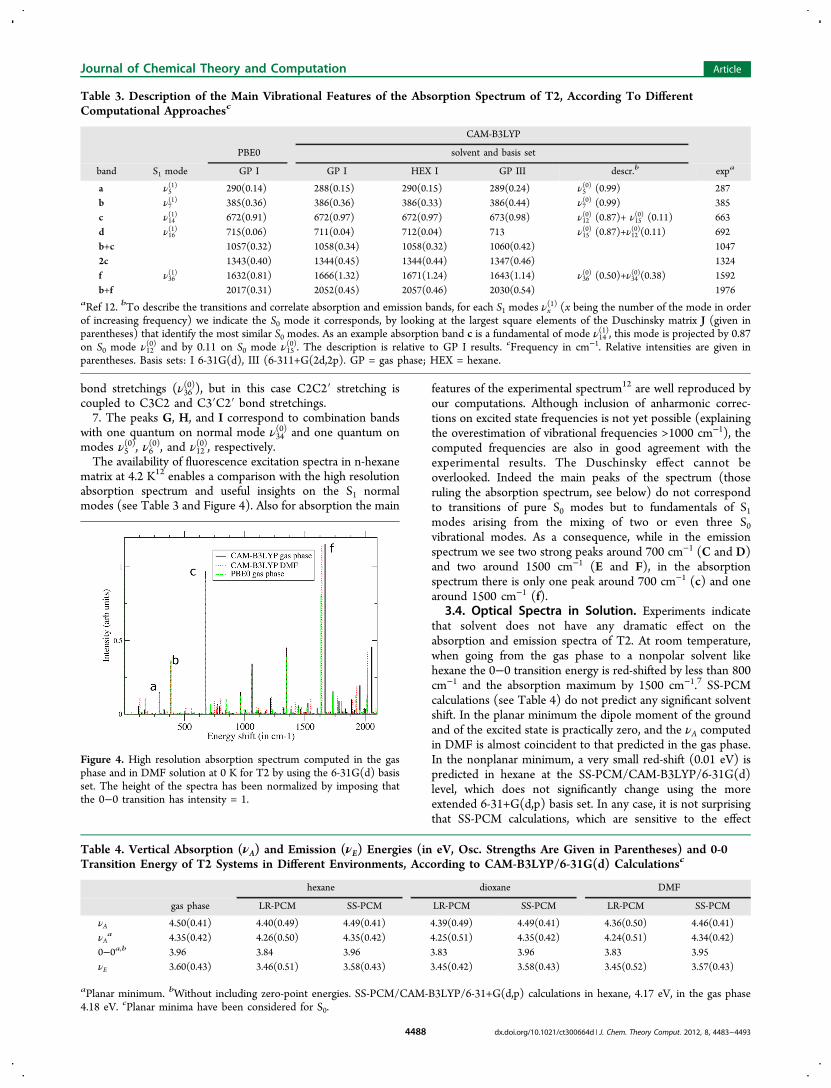
The availability of fluorescence excitation spectra in n-hexanematrix at 4.2 K12 enables a comparison with the high resolutionabsorption spectrum and useful insights on the S1 normalmodes (see Table 3 and Figure 4). Also for absorption the main
features of the experimental spectrum12 are well reproduced byour computations. Although inclusion of anharmonic correc-tions on excited state frequencies is not yet possible (explainingthe overestimation of vibrational frequencies >1000 cm−1), thecomputed frequencies are also in good agreement with theexperimental results. The Duschinsky effect cannot beoverlooked. Indeed the main peaks of the spectrum (thoseruling the absorption spectrum, see below) do not correspondto transitions of pure S0 modes but to fundamentals of S1modes arising from the mixing of two or even three S0vibrational modes. As a consequence, while in the emissionspectrum we see two strong peaks around 700 cm−1 (C and D)and two around 1500 cm−1 (E and F), in the absorptionspectrum there is only one peak around 700 cm−1 (c) and onearound 1500 cm−1 (f).
3.4. Optical Spectra in Solution. Experiments indicatethat solvent does not have any dramatic effect on theabsorption and emission spectra of T2. At room temperature,when going from the gas phase to a nonpolar solvent likehexane the 0−0 transition energy is red-shifted by less than 800cm−1 and the absorption maximum by 1500 cm−1.7 SS-PCMcalculations (see Table 4) do not predict any significant solventshift. In the planar minimum the dipole moment of the groundand of the excited state is practically zero, and the νA computedin DMF is almost coincident to that predicted in the gas phase.In the nonplanar minimum, a very small red-shift (0.01 eV) ispredicted in hexane at the SS-PCM/CAM-B3LYP/6-31G(d)level, which does not significantly change using the moreextended 6-31+G(d,p) basis set. In any case, it is not surprisingthat SS-PCM calculations, which are sensitive to the effect
Table 3. Description of the Main Vibrational Features of the Absorption Spectrum of T2, According To DifferentComputational Approachesc
CAM-B3LYP
PBE0 solvent and basis set
band S1 mode GP I GP I HEX I GP III descr.b expa
a ν5(1) 290(0.14) 288(0.15) 290(0.15) 289(0.24) ν5
(0) (0.99) 287b ν7
(1) 385(0.36) 386(0.36) 386(0.33) 386(0.44) ν7(0) (0.99) 385
c ν14(1) 672(0.91) 672(0.97) 672(0.97) 673(0.98) ν12
(0) (0.87)+ ν15(0) (0.11) 663
d ν16(1) 715(0.06) 711(0.04) 712(0.04) 713 ν15
(0) (0.87)+ν12(0)(0.11) 692
b+c 1057(0.32) 1058(0.34) 1058(0.32) 1060(0.42) 10472c 1343(0.40) 1344(0.45) 1344(0.44) 1347(0.46) 1324f ν36
(1) 1632(0.81) 1666(1.32) 1671(1.24) 1643(1.14) ν36(0) (0.50)+ν34
(0)(0.38) 1592b+f 2017(0.31) 2052(0.45) 2057(0.46) 2030(0.54) 1976
aRef 12. bTo describe the transitions and correlate absorption and emission bands, for each S1 modes νx(1) (x being the number of the mode in order
of increasing frequency) we indicate the S0 mode it corresponds, by looking at the largest square elements of the Duschinsky matrix J (given inparentheses) that identify the most similar S0 modes. As an example absorption band c is a fundamental of mode ν14
(1), this mode is projected by 0.87on S0 mode ν12
(0) and by 0.11 on S0 mode ν15(0). The description is relative to GP I results. cFrequency in cm−1. Relative intensities are given in
parentheses. Basis sets: I 6-31G(d), III (6-311+G(2d,2p). GP = gas phase; HEX = hexane.
Figure 4. High resolution absorption spectrum computed in the gasphase and in DMF solution at 0 K for T2 by using the 6-31G(d) basisset. The height of the spectra has been normalized by imposing thatthe 0−0 transition has intensity = 1.
Table 4. Vertical Absorption (νA) and Emission (νE) Energies (in eV, Osc. Strengths Are Given in Parentheses) and 0-0Transition Energy of T2 Systems in Different Environments, According to CAM-B3LYP/6-31G(d) Calculationsc
hexane dioxane DMF
gas phase LR-PCM SS-PCM LR-PCM SS-PCM LR-PCM SS-PCM
νA 4.50(0.41) 4.40(0.49) 4.49(0.41) 4.39(0.49) 4.49(0.41) 4.36(0.50) 4.46(0.41)νAa 4.35(0.42) 4.26(0.50) 4.35(0.42) 4.25(0.51) 4.35(0.42) 4.24(0.51) 4.34(0.42)
0−0a,b 3.96 3.84 3.96 3.83 3.96 3.83 3.95νE 3.60(0.43) 3.46(0.51) 3.58(0.43) 3.45(0.42) 3.58(0.43) 3.45(0.52) 3.57(0.43)
aPlanar minimum. bWithout including zero-point energies. SS-PCM/CAM-B3LYP/6-31+G(d,p) calculations in hexane, 4.17 eV, in the gas phase4.18 eV. cPlanar minima have been considered for S0.
Journal of Chemical Theory and Computation Article
dx.doi.org/10.1021/ct300664d | J. Chem. Theory Comput. 2012, 8, 4483−44934488
associated with the variation of the dipole moment,36 does notreproduce the observed small red-shift: the dipole moment shiftassociated with the electronic transition in T2 is very small. Forthe planar minimum is zero by symmetry, and the very smallchanges with respect to the gas phase are due to quadrupolareffects. No significant shift is therefore expected in polar solvent(for example when going from hexane to DMF), as confirmedby the experimental results in methanol.7
The transition energy could be affected by the polarizabilityof the embedding medium, and this effect is not expected to beaccurately reproduced by standard implementation of acontinuum model. Actually in LR-PCM calculations, solventshift is proportional to the transition intensity,36,67 and thisresult can be put in relation with the effect of the change in themolecular polarizability associated with the electronic tran-sition.67,68 Interestingly, LR-PCM/CAM-B3LYP calculationspredict that in hexane νA is red-shifted by ∼0.1 eV, in line withthe experimental results.The absorption and emission spectra computed in DMF at 0
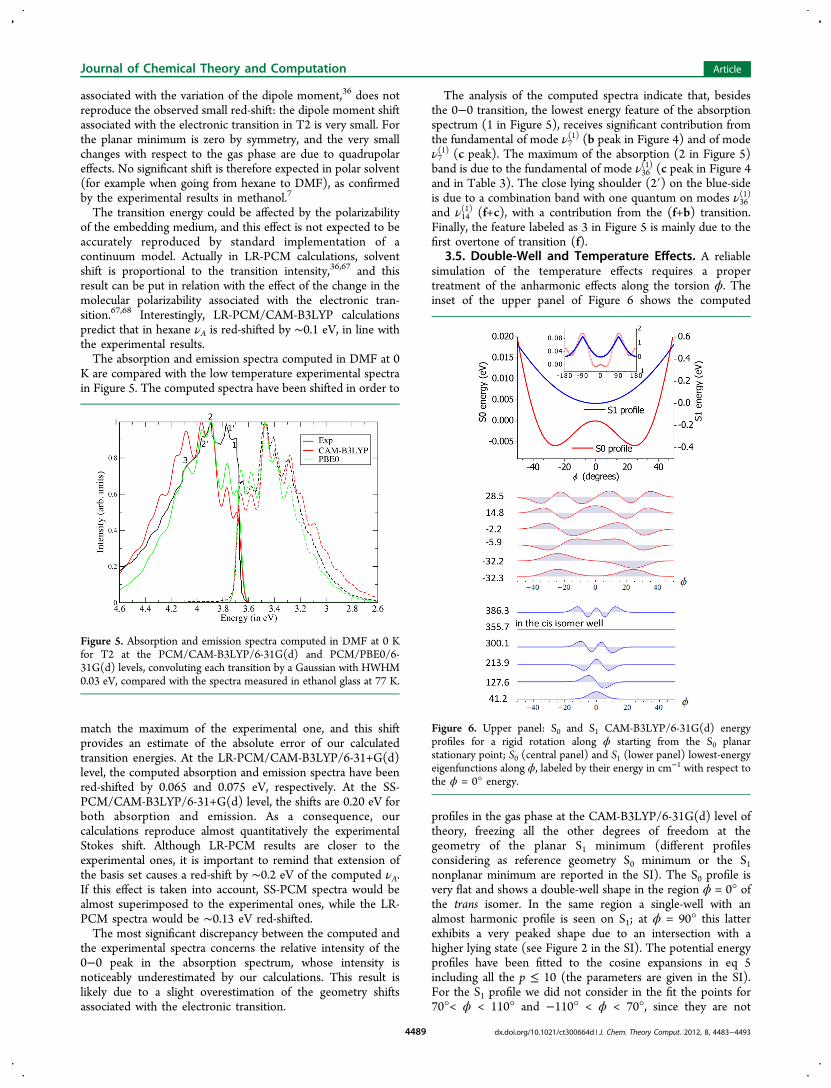
K are compared with the low temperature experimental spectrain Figure 5. The computed spectra have been shifted in order to
match the maximum of the experimental one, and this shiftprovides an estimate of the absolute error of our calculatedtransition energies. At the LR-PCM/CAM-B3LYP/6-31+G(d)level, the computed absorption and emission spectra have beenred-shifted by 0.065 and 0.075 eV, respectively. At the SS-PCM/CAM-B3LYP/6-31+G(d) level, the shifts are 0.20 eV forboth absorption and emission. As a consequence, ourcalculations reproduce almost quantitatively the experimentalStokes shift. Although LR-PCM results are closer to theexperimental ones, it is important to remind that extension ofthe basis set causes a red-shift by ∼0.2 eV of the computed νA.If this effect is taken into account, SS-PCM spectra would bealmost superimposed to the experimental ones, while the LR-PCM spectra would be ∼0.13 eV red-shifted.The most significant discrepancy between the computed and
the experimental spectra concerns the relative intensity of the0−0 peak in the absorption spectrum, whose intensity isnoticeably underestimated by our calculations. This result islikely due to a slight overestimation of the geometry shiftsassociated with the electronic transition.
The analysis of the computed spectra indicate that, besidesthe 0−0 transition, the lowest energy feature of the absorptionspectrum (1 in Figure 5), receives significant contribution fromthe fundamental of mode ν7
(1) (b peak in Figure 4) and of modeν7(1) (c peak). The maximum of the absorption (2 in Figure 5)band is due to the fundamental of mode ν36
(1) (c peak in Figure 4and in Table 3). The close lying shoulder (2′) on the blue-sideis due to a combination band with one quantum on modes ν36
(1)
and ν14(1) (f+c), with a contribution from the (f+b) transition.
Finally, the feature labeled as 3 in Figure 5 is mainly due to thefirst overtone of transition (f).
3.5. Double-Well and Temperature Effects. A reliablesimulation of the temperature effects requires a propertreatment of the anharmonic effects along the torsion ϕ. Theinset of the upper panel of Figure 6 shows the computed
profiles in the gas phase at the CAM-B3LYP/6-31G(d) level oftheory, freezing all the other degrees of freedom at thegeometry of the planar S1 minimum (different profilesconsidering as reference geometry S0 minimum or the S1nonplanar minimum are reported in the SI). The S0 profile isvery flat and shows a double-well shape in the region ϕ = 0° ofthe trans isomer. In the same region a single-well with analmost harmonic profile is seen on S1; at ϕ = 90° this latterexhibits a very peaked shape due to an intersection with ahigher lying state (see Figure 2 in the SI). The potential energyprofiles have been fitted to the cosine expansions in eq 5including all the p ≤ 10 (the parameters are given in the SI).For the S1 profile we did not consider in the fit the points for70°< ϕ < 110° and −110° < ϕ < 70°, since they are not
Figure 5. Absorption and emission spectra computed in DMF at 0 Kfor T2 at the PCM/CAM-B3LYP/6-31G(d) and PCM/PBE0/6-31G(d) levels, convoluting each transition by a Gaussian with HWHM0.03 eV, compared with the spectra measured in ethanol glass at 77 K.
Figure 6. Upper panel: S0 and S1 CAM-B3LYP/6-31G(d) energyprofiles for a rigid rotation along ϕ starting from the S0 planarstationary point; S0 (central panel) and S1 (lower panel) lowest-energyeigenfunctions along ϕ, labeled by their energy in cm−1 with respect tothe ϕ = 0° energy.
Journal of Chemical Theory and Computation Article
dx.doi.org/10.1021/ct300664d | J. Chem. Theory Comput. 2012, 8, 4483−44934489
relevant for the spectra computed here, but their inclusiondeteriorates the fit in the region of the bottom of the wells.On the ground of these fits we computed the energy
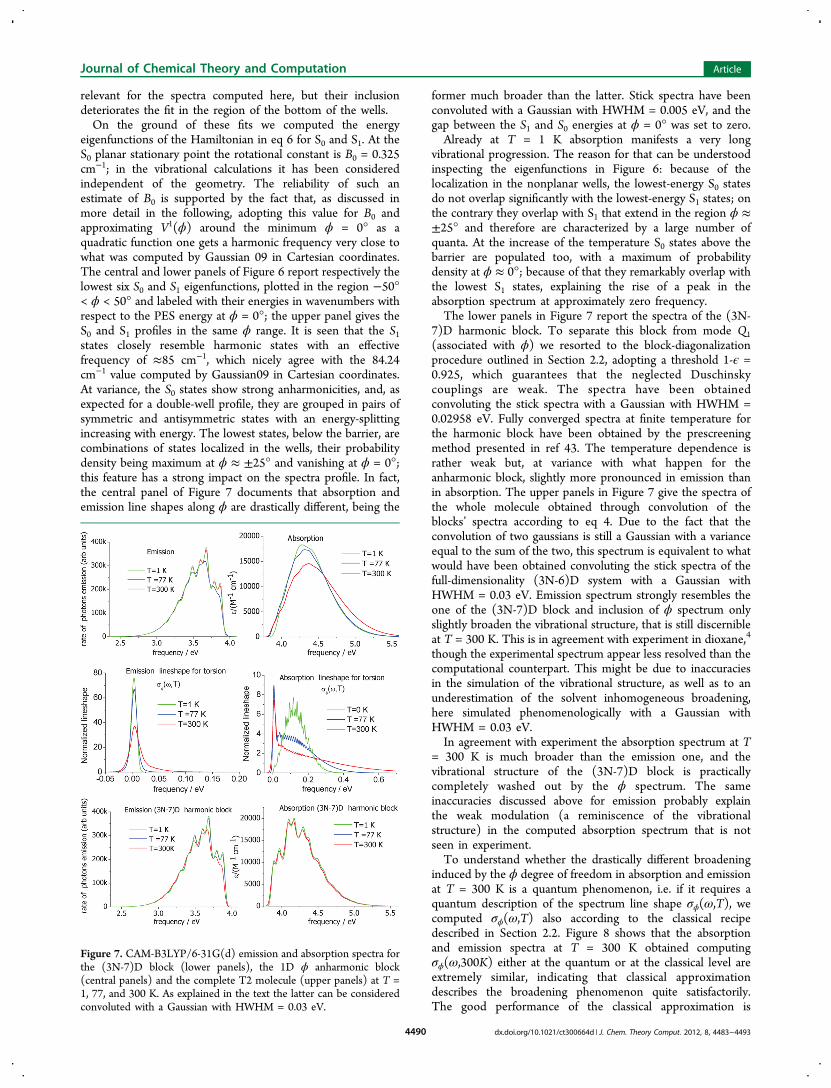
eigenfunctions of the Hamiltonian in eq 6 for S0 and S1. At theS0 planar stationary point the rotational constant is B0 = 0.325cm−1; in the vibrational calculations it has been consideredindependent of the geometry. The reliability of such anestimate of B0 is supported by the fact that, as discussed inmore detail in the following, adopting this value for B0 andapproximating V1(ϕ) around the minimum ϕ = 0° as aquadratic function one gets a harmonic frequency very close towhat was computed by Gaussian 09 in Cartesian coordinates.The central and lower panels of Figure 6 report respectively thelowest six S0 and S1 eigenfunctions, plotted in the region −50°< ϕ < 50° and labeled with their energies in wavenumbers withrespect to the PES energy at ϕ = 0°; the upper panel gives theS0 and S1 profiles in the same ϕ range. It is seen that the S1states closely resemble harmonic states with an effectivefrequency of ≈85 cm−1, which nicely agree with the 84.24cm−1 value computed by Gaussian09 in Cartesian coordinates.At variance, the S0 states show strong anharmonicities, and, asexpected for a double-well profile, they are grouped in pairs ofsymmetric and antisymmetric states with an energy-splittingincreasing with energy. The lowest states, below the barrier, arecombinations of states localized in the wells, their probabilitydensity being maximum at ϕ ≈ ±25° and vanishing at ϕ = 0°;this feature has a strong impact on the spectra profile. In fact,the central panel of Figure 7 documents that absorption andemission line shapes along ϕ are drastically different, being the
former much broader than the latter. Stick spectra have beenconvoluted with a Gaussian with HWHM = 0.005 eV, and thegap between the S1 and S0 energies at ϕ = 0° was set to zero.Already at T = 1 K absorption manifests a very long
vibrational progression. The reason for that can be understoodinspecting the eigenfunctions in Figure 6: because of thelocalization in the nonplanar wells, the lowest-energy S0 statesdo not overlap significantly with the lowest-energy S1 states; onthe contrary they overlap with S1 that extend in the region ϕ ≈±25° and therefore are characterized by a large number ofquanta. At the increase of the temperature S0 states above thebarrier are populated too, with a maximum of probabilitydensity at ϕ ≈ 0°; because of that they remarkably overlap withthe lowest S1 states, explaining the rise of a peak in theabsorption spectrum at approximately zero frequency.The lower panels in Figure 7 report the spectra of the (3N-
7)D harmonic block. To separate this block from mode Q1(associated with ϕ) we resorted to the block-diagonalizationprocedure outlined in Section 2.2, adopting a threshold 1-ϵ =0.925, which guarantees that the neglected Duschinskycouplings are weak. The spectra have been obtainedconvoluting the stick spectra with a Gaussian with HWHM =0.02958 eV. Fully converged spectra at finite temperature forthe harmonic block have been obtained by the prescreeningmethod presented in ref 43. The temperature dependence israther weak but, at variance with what happen for theanharmonic block, slightly more pronounced in emission thanin absorption. The upper panels in Figure 7 give the spectra ofthe whole molecule obtained through convolution of theblocks’ spectra according to eq 4. Due to the fact that theconvolution of two gaussians is still a Gaussian with a varianceequal to the sum of the two, this spectrum is equivalent to whatwould have been obtained convoluting the stick spectra of thefull-dimensionality (3N-6)D system with a Gaussian withHWHM = 0.03 eV. Emission spectrum strongly resembles theone of the (3N-7)D block and inclusion of ϕ spectrum onlyslightly broaden the vibrational structure, that is still discernibleat T = 300 K. This is in agreement with experiment in dioxane,4
though the experimental spectrum appear less resolved than thecomputational counterpart. This might be due to inaccuraciesin the simulation of the vibrational structure, as well as to anunderestimation of the solvent inhomogeneous broadening,here simulated phenomenologically with a Gaussian withHWHM = 0.03 eV.In agreement with experiment the absorption spectrum at T
= 300 K is much broader than the emission one, and thevibrational structure of the (3N-7)D block is practicallycompletely washed out by the ϕ spectrum. The sameinaccuracies discussed above for emission probably explainthe weak modulation (a reminiscence of the vibrationalstructure) in the computed absorption spectrum that is notseen in experiment.To understand whether the drastically different broadening
induced by the ϕ degree of freedom in absorption and emissionat T = 300 K is a quantum phenomenon, i.e. if it requires aquantum description of the spectrum line shape σϕ(ω,T), wecomputed σϕ(ω,T) also according to the classical recipedescribed in Section 2.2. Figure 8 shows that the absorptionand emission spectra at T = 300 K obtained computingσϕ(ω,300K) either at the quantum or at the classical level areextremely similar, indicating that classical approximationdescribes the broadening phenomenon quite satisfactorily.The good performance of the classical approximation is
Figure 7. CAM-B3LYP/6-31G(d) emission and absorption spectra forthe (3N-7)D block (lower panels), the 1D ϕ anharmonic block(central panels) and the complete T2 molecule (upper panels) at T =1, 77, and 300 K. As explained in the text the latter can be consideredconvoluted with a Gaussian with HWHM = 0.03 eV.
Journal of Chemical Theory and Computation Article
dx.doi.org/10.1021/ct300664d | J. Chem. Theory Comput. 2012, 8, 4483−44934490
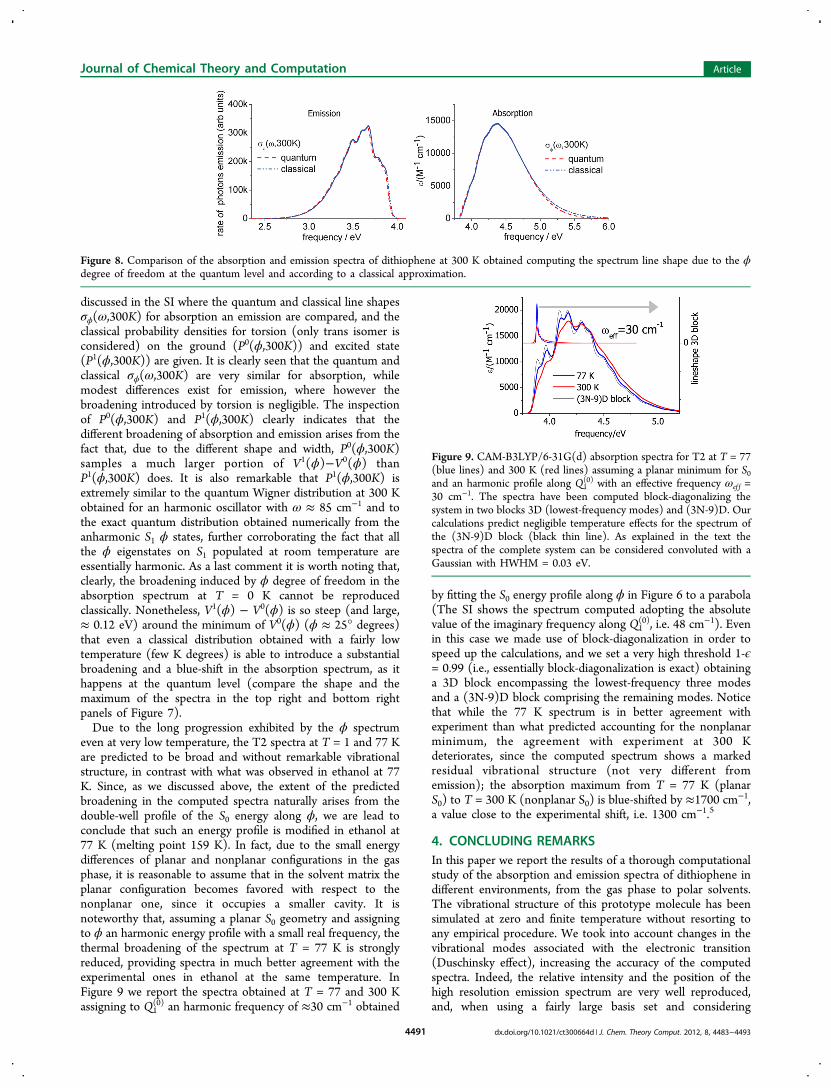
discussed in the SI where the quantum and classical line shapesσϕ(ω,300K) for absorption an emission are compared, and theclassical probability densities for torsion (only trans isomer isconsidered) on the ground (P0(ϕ,300K)) and excited state(P1(ϕ,300K)) are given. It is clearly seen that the quantum andclassical σϕ(ω,300K) are very similar for absorption, whilemodest differences exist for emission, where however thebroadening introduced by torsion is negligible. The inspectionof P0(ϕ,300K) and P1(ϕ,300K) clearly indicates that thedifferent broadening of absorption and emission arises from thefact that, due to the different shape and width, P0(ϕ,300K)samples a much larger portion of V1(ϕ)−V0(ϕ) thanP1(ϕ,300K) does. It is also remarkable that P1(ϕ,300K) isextremely similar to the quantum Wigner distribution at 300 Kobtained for an harmonic oscillator with ω ≈ 85 cm−1 and tothe exact quantum distribution obtained numerically from theanharmonic S1 ϕ states, further corroborating the fact that allthe ϕ eigenstates on S1 populated at room temperature areessentially harmonic. As a last comment it is worth noting that,clearly, the broadening induced by ϕ degree of freedom in theabsorption spectrum at T = 0 K cannot be reproducedclassically. Nonetheless, V1(ϕ) − V0(ϕ) is so steep (and large,≈ 0.12 eV) around the minimum of V0(ϕ) (ϕ ≈ 25° degrees)that even a classical distribution obtained with a fairly lowtemperature (few K degrees) is able to introduce a substantialbroadening and a blue-shift in the absorption spectrum, as ithappens at the quantum level (compare the shape and themaximum of the spectra in the top right and bottom rightpanels of Figure 7).Due to the long progression exhibited by the ϕ spectrum
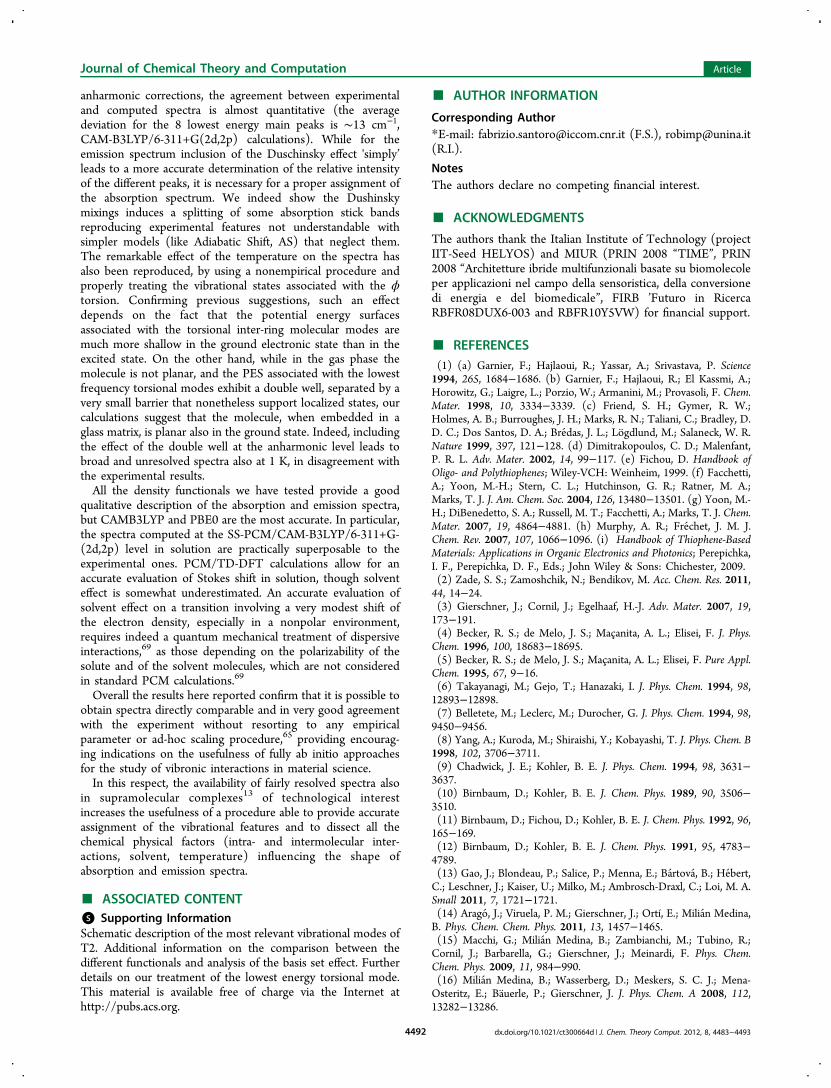
even at very low temperature, the T2 spectra at T = 1 and 77 Kare predicted to be broad and without remarkable vibrationalstructure, in contrast with what was observed in ethanol at 77K. Since, as we discussed above, the extent of the predictedbroadening in the computed spectra naturally arises from thedouble-well profile of the S0 energy along ϕ, we are lead toconclude that such an energy profile is modified in ethanol at77 K (melting point 159 K). In fact, due to the small energydifferences of planar and nonplanar configurations in the gasphase, it is reasonable to assume that in the solvent matrix theplanar configuration becomes favored with respect to thenonplanar one, since it occupies a smaller cavity. It isnoteworthy that, assuming a planar S0 geometry and assigningto ϕ an harmonic energy profile with a small real frequency, thethermal broadening of the spectrum at T = 77 K is stronglyreduced, providing spectra in much better agreement with theexperimental ones in ethanol at the same temperature. InFigure 9 we report the spectra obtained at T = 77 and 300 Kassigning to Q1
(0) an harmonic frequency of ≈30 cm−1 obtained
by fitting the S0 energy profile along ϕ in Figure 6 to a parabola(The SI shows the spectrum computed adopting the absolutevalue of the imaginary frequency along Q1
(0), i.e. 48 cm−1). Evenin this case we made use of block-diagonalization in order tospeed up the calculations, and we set a very high threshold 1-ϵ= 0.99 (i.e., essentially block-diagonalization is exact) obtaininga 3D block encompassing the lowest-frequency three modesand a (3N-9)D block comprising the remaining modes. Noticethat while the 77 K spectrum is in better agreement withexperiment than what predicted accounting for the nonplanarminimum, the agreement with experiment at 300 Kdeteriorates, since the computed spectrum shows a markedresidual vibrational structure (not very different fromemission); the absorption maximum from T = 77 K (planarS0) to T = 300 K (nonplanar S0) is blue-shifted by ≈1700 cm−1,a value close to the experimental shift, i.e. 1300 cm−1.5
4. CONCLUDING REMARKSIn this paper we report the results of a thorough computationalstudy of the absorption and emission spectra of dithiophene indifferent environments, from the gas phase to polar solvents.The vibrational structure of this prototype molecule has beensimulated at zero and finite temperature without resorting toany empirical procedure. We took into account changes in thevibrational modes associated with the electronic transition(Duschinsky effect), increasing the accuracy of the computedspectra. Indeed, the relative intensity and the position of thehigh resolution emission spectrum are very well reproduced,and, when using a fairly large basis set and considering
Figure 8. Comparison of the absorption and emission spectra of dithiophene at 300 K obtained computing the spectrum line shape due to the ϕdegree of freedom at the quantum level and according to a classical approximation.
Figure 9. CAM-B3LYP/6-31G(d) absorption spectra for T2 at T = 77(blue lines) and 300 K (red lines) assuming a planar minimum for S0and an harmonic profile along Q1
(0) with an effective frequency ωef f =30 cm−1. The spectra have been computed block-diagonalizing thesystem in two blocks 3D (lowest-frequency modes) and (3N-9)D. Ourcalculations predict negligible temperature effects for the spectrum ofthe (3N-9)D block (black thin line). As explained in the text thespectra of the complete system can be considered convoluted with aGaussian with HWHM = 0.03 eV.
Journal of Chemical Theory and Computation Article
dx.doi.org/10.1021/ct300664d | J. Chem. Theory Comput. 2012, 8, 4483−44934491
anharmonic corrections, the agreement between experimentaland computed spectra is almost quantitative (the averagedeviation for the 8 lowest energy main peaks is ∼13 cm−1,CAM-B3LYP/6-311+G(2d,2p) calculations). While for theemission spectrum inclusion of the Duschinsky effect 'simply’leads to a more accurate determination of the relative intensityof the different peaks, it is necessary for a proper assignment ofthe absorption spectrum. We indeed show the Dushinskymixings induces a splitting of some absorption stick bandsreproducing experimental features not understandable withsimpler models (like Adiabatic Shift, AS) that neglect them.The remarkable effect of the temperature on the spectra hasalso been reproduced, by using a nonempirical procedure andproperly treating the vibrational states associated with the ϕtorsion. Confirming previous suggestions, such an effectdepends on the fact that the potential energy surfacesassociated with the torsional inter-ring molecular modes aremuch more shallow in the ground electronic state than in theexcited state. On the other hand, while in the gas phase themolecule is not planar, and the PES associated with the lowestfrequency torsional modes exhibit a double well, separated by avery small barrier that nonetheless support localized states, ourcalculations suggest that the molecule, when embedded in aglass matrix, is planar also in the ground state. Indeed, includingthe effect of the double well at the anharmonic level leads tobroad and unresolved spectra also at 1 K, in disagreement withthe experimental results.All the density functionals we have tested provide a good
qualitative description of the absorption and emission spectra,but CAMB3LYP and PBE0 are the most accurate. In particular,the spectra computed at the SS-PCM/CAM-B3LYP/6-311+G-(2d,2p) level in solution are practically superposable to theexperimental ones. PCM/TD-DFT calculations allow for anaccurate evaluation of Stokes shift in solution, though solventeffect is somewhat underestimated. An accurate evaluation ofsolvent effect on a transition involving a very modest shift ofthe electron density, especially in a nonpolar environment,requires indeed a quantum mechanical treatment of dispersiveinteractions,69 as those depending on the polarizability of thesolute and of the solvent molecules, which are not consideredin standard PCM calculations.69
Overall the results here reported confirm that it is possible toobtain spectra directly comparable and in very good agreementwith the experiment without resorting to any empiricalparameter or ad-hoc scaling procedure,65 providing encourag-ing indications on the usefulness of fully ab initio approachesfor the study of vibronic interactions in material science.In this respect, the availability of fairly resolved spectra also
in supramolecular complexes13 of technological interestincreases the usefulness of a procedure able to provide accurateassignment of the vibrational features and to dissect all thechemical physical factors (intra- and intermolecular inter-actions, solvent, temperature) influencing the shape ofabsorption and emission spectra.
■ ASSOCIATED CONTENT*S Supporting InformationSchematic description of the most relevant vibrational modes ofT2. Additional information on the comparison between thedifferent functionals and analysis of the basis set effect. Furtherdetails on our treatment of the lowest energy torsional mode.This material is available free of charge via the Internet athttp://pubs.acs.org.
■ AUTHOR INFORMATION
Corresponding Author*E-mail: [email protected] (F.S.), [email protected](R.I.).
NotesThe authors declare no competing financial interest.
■ ACKNOWLEDGMENTS
The authors thank the Italian Institute of Technology (projectIIT-Seed HELYOS) and MIUR (PRIN 2008 “TIME”, PRIN2008 “Architetture ibride multifunzionali basate su biomolecoleper applicazioni nel campo della sensoristica, della conversionedi energia e del biomedicale”, FIRB ’Futuro in RicercaRBFR08DUX6-003 and RBFR10Y5VW) for financial support.
■ REFERENCES(1) (a) Garnier, F.; Hajlaoui, R.; Yassar, A.; Srivastava, P. Science1994, 265, 1684−1686. (b) Garnier, F.; Hajlaoui, R.; El Kassmi, A.;Horowitz, G.; Laigre, L.; Porzio, W.; Armanini, M.; Provasoli, F. Chem.Mater. 1998, 10, 3334−3339. (c) Friend, S. H.; Gymer, R. W.;Holmes, A. B.; Burroughes, J. H.; Marks, R. N.; Taliani, C.; Bradley, D.D. C.; Dos Santos, D. A.; Bredas, J. L.; Logdlund, M.; Salaneck, W. R.Nature 1999, 397, 121−128. (d) Dimitrakopoulos, C. D.; Malenfant,P. R. L. Adv. Mater. 2002, 14, 99−117. (e) Fichou, D. Handbook ofOligo- and Polythiophenes; Wiley-VCH: Weinheim, 1999. (f) Facchetti,A.; Yoon, M.-H.; Stern, C. L.; Hutchinson, G. R.; Ratner, M. A.;Marks, T. J. J. Am. Chem. Soc. 2004, 126, 13480−13501. (g) Yoon, M.-H.; DiBenedetto, S. A.; Russell, M. T.; Facchetti, A.; Marks, T. J. Chem.Mater. 2007, 19, 4864−4881. (h) Murphy, A. R.; Frechet, J. M. J.Chem. Rev. 2007, 107, 1066−1096. (i) Handbook of Thiophene-BasedMaterials: Applications in Organic Electronics and Photonics; Perepichka,I. F., Perepichka, D. F., Eds.; John Wiley & Sons: Chichester, 2009.(2) Zade, S. S.; Zamoshchik, N.; Bendikov, M. Acc. Chem. Res. 2011,44, 14−24.(3) Gierschner, J.; Cornil, J.; Egelhaaf, H.-J. Adv. Mater. 2007, 19,173−191.(4) Becker, R. S.; de Melo, J. S.; Macanita, A. L.; Elisei, F. J. Phys.Chem. 1996, 100, 18683−18695.(5) Becker, R. S.; de Melo, J. S.; Macanita, A. L.; Elisei, F. Pure Appl.Chem. 1995, 67, 9−16.(6) Takayanagi, M.; Gejo, T.; Hanazaki, I. J. Phys. Chem. 1994, 98,12893−12898.(7) Belletete, M.; Leclerc, M.; Durocher, G. J. Phys. Chem. 1994, 98,9450−9456.(8) Yang, A.; Kuroda, M.; Shiraishi, Y.; Kobayashi, T. J. Phys. Chem. B1998, 102, 3706−3711.(9) Chadwick, J. E.; Kohler, B. E. J. Phys. Chem. 1994, 98, 3631−3637.(10) Birnbaum, D.; Kohler, B. E. J. Chem. Phys. 1989, 90, 3506−3510.(11) Birnbaum, D.; Fichou, D.; Kohler, B. E. J. Chem. Phys. 1992, 96,165−169.(12) Birnbaum, D.; Kohler, B. E. J. Chem. Phys. 1991, 95, 4783−4789.(13) Gao, J.; Blondeau, P.; Salice, P.; Menna, E.; Bartova, B.; Hebert,C.; Leschner, J.; Kaiser, U.; Milko, M.; Ambrosch-Draxl, C.; Loi, M. A.Small 2011, 7, 1721−1721.(14) Arago, J.; Viruela, P. M.; Gierschner, J.; Ortí, E.; Milian Medina,B. Phys. Chem. Chem. Phys. 2011, 13, 1457−1465.(15) Macchi, G.; Milian Medina, B.; Zambianchi, M.; Tubino, R.;Cornil, J.; Barbarella, G.; Gierschner, J.; Meinardi, F. Phys. Chem.Chem. Phys. 2009, 11, 984−990.(16) Milian Medina, B.; Wasserberg, D.; Meskers, S. C. J.; Mena-Osteritz, E.; Bauerle, P.; Gierschner, J. J. Phys. Chem. A 2008, 112,13282−13286.
Journal of Chemical Theory and Computation Article
dx.doi.org/10.1021/ct300664d | J. Chem. Theory Comput. 2012, 8, 4483−44934492
(17) Milian Medina, B.; Van Vooren, A.; Brocorens, P.; Gierschner,J.; Shkunov, M.; Heeney, M.; McCulloch, I.; Lazzaroni, R.; Cornil, J.Chem. Mater. 2007, 19, 4949−4956.(18) Gierschner, J.; Mack, H.-G.; Egelhaaf, H.-J.; Schweizer, S.;Doser, B.; Oelkrug, D. Synth. Met. 2003, 138, 311−315.(19) Petelenz, P.; Andrzejak, M. J. Chem. Phys. 2000, 113, 11306−11314.(20) Zhao, Z.; Spano, F. C. J. Chem. Phys. 2005, 122, 114701−114711.(21) Spano, F. C.; Silvestri, L.; Spearman, P.; Raimondo, L.; Tavazzi,S. J. Chem. Phys. 2007, 127, 184703−184714.(22) Andrzejak, M.; Pawlikowski, M. T. J. Phys. Chem. A 2008, 112,13737−13744.(23) Vujanovich, E. C.; Bloom, J. W. G.; Wheeler, S. E. J. Phys. Chem.A 2012, 116, 2997−3003.(24) Negri, F.; Zgierski, M. Z. J. Chem. Phys. 1994, 100, 2571−2587.(25) Heimel, G.; Daghofer, M.; Gierschner, J.; List, E. J. W.;Grimsdale, A. C.; Mullen, K.; Beljonne, D.; Bredas, J.-L.; Zojer, E. J.Chem. Phys. 2005, 122, 54501−54511.(26) (a) Furche, F.; Ahlrichs, R. J. Chem. Phys. 2002, 117, 7433.(b) Caillie, C. V.; Amos, R. D. Chem. Phys. Lett. 1999, 308, 249;(c)ibidem 2000, 317, 159.(27) Becke, A. D. Phys. Rev. A 1988, 38, 3098−3100.(28) Lee, C.; Yang, W.; Parr, R. G. Phys. Rev. B 1988, 37, 785−789.(29) Becke, A. D. J. Chem. Phys. 1993, 98, 5648−5652.(30) Adamo, C.; Barone, V. J. Chem. Phys. 1999, 110, 6158−6169.(31) Becke, A. D. J. Chem. Phys. 1993, 98, 1372−1377.(32) Yanai, T.; Tew, D.; Handy, N. Chem. Phys. Lett. 2004, 393, 51−57.(33) Tomasi, J.; Mennucci, B.; Cammi, R. Chem. Rev. 2005, 105,2999−3093.(34) Cossi, M.; Barone, V. J. Chem. Phys. 2001, 115, 4708−4717.(35) Scalmani, G.; Frisch, M. J.; Mennucci, B.; Tomasi, J.; Cammi, R.;Barone, V. J. Chem. Phys. 2006, 124, 94107−94121.(36) Improta, R.; Barone, V.; Scalmani, G.; Frisch, M. J. J. Chem.Phys. 2006, 125, 54103−54111.(37) Improta, R.; Frisch, M. J.; Scalmani, G.; Barone, V. J. Chem.Phys. 2007, 127, 74504−74512.(38) (a) Improta, R. UV-Visible Absorption and Emission Energies inCondensed phase by PCM-TD-DFT methods. In ComputationalStrategies for Spectroscopy: from Small Molecules to Nanosystems; Barone,V., Ed.; John Wiley & Sons: Chichester, 2011; pp 39−76.(39) Frisch, M. J.; Trucks, G. W.; Schlegel, H. B.; Scuseria, G. E.;Robb, M. A.; Cheeseman, J. R.; Scalmani, G.; Barone, V.; Mennucci,B.; Petersson, G. A.; Nakatsuji, H.; Caricato, M.; Li, X.; Hratchian, H.P.; Izmaylov, A. F.; Bloino, J.; Zheng, G.; Sonnenberg, J. L.; Hada, M.;Ehara, M.; Toyota, K.; Fukuda, R.; Hasegawa, J.; Ishida, M.; Nakajima,T.; Honda, Y.; Kitao, O.; Nakai, H.; Vreven, T.; Montgomery, J. A., Jr.;Peralta, J. E.; Ogliaro, F.; Bearpark, M.; Heyd, J. J.; Brothers, E.; Kudin,K. N.; Staroverov, V. N.; Kobayashi, R.; Normand, J.; Raghavachari, K.;Rendell, A.; Burant, J. C.; Iyengar, S. S.; Tomasi, J.; Cossi, M.; Rega,N.; Millam, J. M.; Klene, M.; Knox, J. E.; Cross, J. B.; Bakken, V.;Adamo, C.; Jaramillo, J.; Gomperts, R.; Stratmann, R. E.; Yazyev, O.;Austin, A. J.; Cammi, R.; Pomelli, C.; Ochterski, J. W.; Martin, R. L.;Morokuma, K.; Zakrzewski, V. G.; Voth, G. A.; Salvador, P.;Dannenberg, J. J.; Dapprich, S.; Daniels, A. D.; Farkas, O.;Foresman, J. B.; Ortiz, J. V.; Cioslowski, J.; Fox, D. J. Gaussian 09,Revision A.2; Gaussian, Inc.: Wallingford, CT, 2009.(40) (a) Biczysko, M.; Bloino, J.; Santoro, F.; Barone, V. Time-Independent Approaches to Simulate Electronic Spectra Lineshapes:From Small Molecules to Macrosystems. In Computational Strategiesfor Spectroscopy: from Small Molecules to Nanosystems; Barone, V., Ed.;John Wiley & Sons: Chichester, 2011; pp 361−443. (b) Lami, A.;Santoro, F. Time-Dependent Approaches to Calculation of Steady-State Vibronic Spectra: From Fully Quantum to Classical Approaches.In Computational Strategies for Spectroscopy: from Small Molecules toNano Systems; Barone, V., Ed.; John Wiley & Sons: Chichester, 2011;pp 475−516.
(41) Avila Ferrer, F. J.; Santoro, F. Phys. Chem. Chem. Phys 2012, 14,13549−13560.(42) (a) Hazra, A.; Noiijen, M. J. Chem. Phys. 2005, 122, 204327.(b) Hazra, A.; Noiijen, M. Phys. Chem. Chem. Phys. 2005, 7, 1759.(43) Santoro, F.; Lami, A.; Improta, R.; Barone, V. J. Chem. Phys.2007, 126, 184102−184112.(44) Bloino, J.; Biczysko, M.; Santoro, F.; Barone, V. J. Chem. TheoryComput. 2010, 6, 1256−1274.(45) Kupka, H.; Cribb, P. H. J. Chem. Phys. 1986, 85, 1303−1315.(46) Peluso, A.; Santoro, F.; Del Re, G. Int. J. Quantum Chem. 1997,63, 233−244.(47) Santoro, F.; Improta, R.; Lami, A.; Bloino, J.; Barone, V. J. Chem.Phys. 2007, 126, 84509−84521; Ibid. 2007, 126, 169903−169903.(48) Santoro, F.; Improta, R.; Lami, A.; Bloino, J.; Barone, V. J. Chem.Phys. 2008, 128, 224311−224327.(49) Santoro, F.; Barone, V. Int. J. Quantum Chem. 2010, 110, 476−486.(50) Barone, V.; Bloino, J.; Biczysko, M.; Santoro, F. J. Chem. TheoryComput. 2009, 5, 540−554.(51) Picconi, D.; Lami, A.; Santoro, F. J. Chem. Phys. 2012, 136,244104−244121.(52) Improta, R.; Barone, V.; Santoro, F. Angew. Chem., Int. Ed. 2007,46, 405−408.(53) Improta, R.; Barone, V.; Santoro, F. J. Phys. Chem. B 2007, 111,14080−14082.(54) Santoro, F.; , classes a Fortran 77 code. Available at http://village.pi.iccom.cnr.it/Software (accessed October 15, 2012).(55) Beenken, W. J. D. Chem. Phys. 2008, 349, 250−255.(56) Borrelli, R.; Peluso, A. J. Chem. Phys. 2006, 125, 194308−194315.(57) Borrelli, R.; Peluso, A. J. Chem. Phys. 2006, 128, 44303−44309.(58) Andrzejak, M.; Witek, H. A. Theor. Chem. Acc. 2011, 129, 161−172.(59) Siegrist, T.; Kloc, C.; Laudise, R. A.; Katz, H. E.; Haddon, R. C.Adv. Mater. 1998, 10, 379−382.(60) Dierksen, M.; Grimme, S. J. Phys. Chem. A 2004, 108, 10225−10237.(61) Jacquemin, D.; Perpete, E. A.; Ciofini, I.; Adamo, C. Acc. Chem.Res. 2009, 42, 326−334.(62) Jacquemin, D.; Planchat, A.; Adamo, C.; Mennucci, B. J. Chem.Theory Comput. 2012, 8, 2359−2372.(63) Jacquemin, D.; Bremond, E.; Planchat, A.; Ciofini, I.; Adamo, C.J. Chem. Theory Comput. 2011, 7, 1882−1892.(64) Lopez, G. V.; Chang, C.-H.; Johnson, P. M.; Hall, G. E.; Sears,T. J.; Markiewicz, B.; Milan, M.; Teslja, A. J. Phys. Chem. A 2012, 116,6750−6758.(65) Avila Ferrer, F. J.; Improta, R.; Santoro, F.; Barone, V. Phys.Chem. Chem. Phys. 2011, 13, 17007−17012.(66) Lewis, J. D.; Malloy, T. B.; Chao, T. H.; Laane, J. J. Mol. Struct.1972, 12, 427−449.(67) (a) Cammi, R.; Corni, S.; Mennucci, B.; Tomasi, J. J. Chem.Phys. 2005, 122, 104513−104524. (b) Corni, S.; Cammi, R.;Mennucci, B.; Tomasi, J. J. Chem. Phys. 2005, 123, 134512−134521.(68) McRae, E. G. J. Phys. Chem. 1957, 61, 562−572.(69) (a) Weijo, V.; Mennucci, B.; Frediani, L. J. Chem. TheoryComput. 2010, 6, 3358−3364. (b) Amovilli, C.; Mennucci, B. J. Phys.Chem. B 1997, 101, 1051−1057. (c) Curutchet, C.; Orozco, M.;Luque, F. J.; Mennucci, B.; Tomasi, J. J. Comput. Chem. 2006, 27,1769−1780.(70) Barone, V. J. Chem. Phys. 2005, 122, 014108.
Journal of Chemical Theory and Computation Article
dx.doi.org/10.1021/ct300664d | J. Chem. Theory Comput. 2012, 8, 4483−44934493