Embed Size (px)
Citation preview
2010/2011 Victoria’s Mothers and Babies
Victoria’s Maternal, Perinatal, Child and Adolescent Mortality
The Consultative Council on Obstetric and Paediatric Mortality and Morbidity (CCOPMM)
CC
OP
MM
2010/2011 VIC
TOR
IA’S M
OTH
ER
S A
ND
BA
BIE
S
50th survey of perinatal deaths in Victoria

1
CHAIRMAN’S MESSAGE
This report marks the 50th anniversary of the Consultative Council on Obstetric and Paediatric Mortality and Morbidity (CCOPMM) annual survey of obstetric and paediatric deaths. This year’s annual report brings together the outcomes of all births in Victoria and the review of maternal, perinatal, child and adolescent deaths for the years 2010 and 2011.
A key function of the CCOPMM following the review and classification of all maternal, perinatal, child and adolescent deaths that occur in Victoria is to ascertain factors that may have contributed to these deaths. The council then makes recommendations that are aimed to reduce morbidity and mortality by improving clinical practice and systems. We trust that these recommendations will be carefully considered by all health professionals and administrators of the Victorian health system involved in the care of pregnant women, neonates, children and adolescents.
In particular, we draw your attention to the recommendations on:
early psychosocial assessment, management and referral for pregnant women, in particular screening for domestic violence and mental health disorders
management and referral of pregnant women who are obese, especially women residing in rural Victoria
prevention of peri-partum hypoxic deaths including appropriate fetal monitoring
the benefit of postmortem examination in the investigation of perinatal deaths, stillborn in particular
education for parents and caregivers around the risks of co-sleeping
proper recognition of the acute deterioration or serious illness in babies and children
‘energy drinks’ containing excess caffeine and other stimulants, which have been found to be associated with adverse health events, especially in children with underlying conditions for which stimulants are contraindicated
effective follow up for adolescents with mental health disorders to prevent suicide.
We note that the perinatal mortality rate for infants born to Aboriginal mothers remains 2.1 times greater than those of the non-Aboriginal population and this has not changed over the last decade.
Health services are reminded of their legal obligation to provide details of all births and maternal, perinatal, child and adolescent deaths to CCOPMM within 28 days. This is to ensure that there is timely collection of the necessary data to enable adequate review and reporting of these deaths. This data is of course protected and cannot be accessed by any external party.
I would also like to express my gratitude to the members of CCOPMM and the subcommittees for their generous support, their wise counsel and their attendance at the various meetings over the past year.
The quality of the work and output of CCOPMM is dependent on the dedicated staff of the Clinical Councils Unit and on behalf of CCOPMM I offer our sincere appreciation, especially for the additional work they have done to revise the format of this report and prepare its contents.
I commend this report to you.
Professor Jeremy JN Oats, MBBS, DM, FRCOG, FRANZCOG Chairman

2
CONTENTS
Chairman’s Message ............................................................................................................................. 1
List of Tables .......................................................................................................................................... 4
List of Figures ........................................................................................................................................ 9
1. Executive summary and recommendations ................................................................................. 11 1.1 Background ................................................................................................................... 11 1.2 Purpose .......................................................................................................................... 11 1.3 CCOPMM recommendations ........................................................................................ 12 1.4 Key findings ................................................................................................................... 28
2. Introduction ...................................................................................................................................... 39 2.1 Functions of the Consultative Council on Obstetric and Paediatric Mortality and
Morbidity .............................................................................................................................. 39 2.2 Members of CCOPMM and Subcommittees ............................................................... 40 2.3 The data collections ...................................................................................................... 41 2.4 Provision of data for statistical, research and public interest purposes ................ 42
3. Methods ............................................................................................................................................ 43 3.1 Definitions ...................................................................................................................... 43 3.2 Measures of obstetric and paediatric mortality ......................................................... 45 3.3 Data sources .................................................................................................................. 46 3.4 Data quality .................................................................................................................... 48 3.5 Data items ...................................................................................................................... 48 3.6 Methods of case investigation ..................................................................................... 49 3.7 Statistical methods ....................................................................................................... 51
4. Births in Victoria .............................................................................................................................. 52 4.1 Birth statistics ............................................................................................................... 52 4.2 Maternal characteristics ............................................................................................... 55 4.3 Organisational factors .................................................................................................. 62 4.4 Reproductive history .................................................................................................... 72 4.5 Labour and birth ............................................................................................................ 75 4.6 Infant factors ................................................................................................................. 88 4.7 Multiple births ................................................................................................................ 94 4.8 ABORIGINAL mothers and their babies ..................................................................... 98
5. Maternal deaths in Victoria 2010–2011 ........................................................................................ 103 5.1 Maternal mortality findings ........................................................................................ 103 5.2 Maternal morbidity findings ....................................................................................... 110
6. Perinatal mortality review 2010 and 2011 .................................................................................... 111 6.1 Perinatal mortality statistics ...................................................................................... 111 6.2 Causes of perinatal deaths 2010 and 2011 ............................................................... 135 6.3 Other characteristics of perinatal mortality ............................................................. 175 6.4 Perinatal autopsy service ........................................................................................... 181 6.5 Contributing factors in perinatal deaths ................................................................... 184 6.6 Recommended guidelines.......................................................................................... 186
7. Post-neonatal infant, child and adolescent death review 2010–2011 ...................................... 189 7.1 Introduction ................................................................................................................. 189 7.2 Trends in death rates for children aged < 5 years ................................................... 194 7.3 Infant mortality rate ..................................................................................................... 196 7.4 Most common cause of death by age group ............................................................ 199 7.5 Cause of death in post-neonatal infants, children and adolescents ..................... 204 7.6 Major causes of post-neonatal infant, child and adolescent deaths ..................... 206 7.7 Post-neonatal infant, child and adolescent deaths by age group ......................... 209
3
7.8 Causes of post-neonatal infant, child and adolescent deaths determined at birth ............................................................................................................................................ 211
7.9 Sudden unexpected death in infancy (including sudden infant death syndrome) ............................................................................................................................................ 217
7.10 Unintentional injury deaths ...................................................................................... 224 7.11 Acquired disease deaths .......................................................................................... 231 7.12 UndeTermined deaths .............................................................................................. 237 7.13 Intentional injury deaths........................................................................................... 239
8. Immunisation and vaccine-preventable diseases ...................................................................... 244
Appendices ......................................................................................................................................... 245 Appendix 1: Sudden infant death .................................................................................... 245 Appendix 2: Manual Birth report form 2009 ................................................................... 247 appendix 3: feedback form .............................................................................................. 248
ENDNOTES ......................................................................................................................................... 250
4
LIST OF TABLES
Table 1.1: Total births in Victoria, 2010 and 2011 28 Table 1.2: Crude birth rate, Victoria 2010 and 2011 29 Table 1.3: Maternal mortality ratios by triennia, Victoria 1997–2011 32 Table 1.4a: Unadjusted perinatal mortality in Victoria, 2010 34 Table 1.4b: Unadjusted perinatal mortality in Victoria, 2011 34 Table 4.1: Total births in Victoria, 2010 and 2011 52 Table 4.2: Crude birth rate, Victoria 2010 and 2011 53 Table 4.3: Trends in births, confinements and live births per 1,000 EFRPa aged 15–44 years,
Victoria 1985 to 2011 54 Table 4.4: Maternal age group, confinements 2010 and 2011 55 Table 4.5: Trends in maternal age group, % of confinements 1985 to 2011 55 Table 4.6: Trends in confinements, Department of Health regions, 1990 to 2010 56 Table 4.7: Marital status, confinements 2010 and 2011 57 Table 4.8: Trends in marital status, confinements 1990–2010 (%) 57 Table 4.9: Maternal place of birth, confinements 2010 and 2011 57 Table 4.10: Ten most common countries of birth, for women born in non-English speaking
countries, confinements in 1990, 2000 and 2010 58 Table 4.11: Maternal BMI, confinements 2010 and 2011 58 Table 4.12: Proportion of women reporting any smoking during first 20 weeks of pregnancy,
Victoria 2010 and 2011 59 Table 4.13: Number of cigarettes smoked per day in the second half of pregnancy, all
confinements 2010 and 2011 59 Table 4.14a: Number of cigarettes smoked per day in the second half of pregnancy by maternal
age group, all confinements in Victoria 2010 (%) 60 Table 4.14b: Number of cigarettes smoked per day in the second half of pregnancy by
metropolitan or rural residence, all confinements in Victoria 2010 (%) 60 Table 4.14c: Number of cigarettes smoked per day in the second half of pregnancy by maternal
age group, all confinements in Victoria 2011 (%) 60 Table 4.14d: Number of cigarettes smoked per day in the second half of pregnancy by
metropolitan or rural residence, all confinements in Victoria 2011 (%) 61 Table 4.15a: IRSD quintile and maternal age, confinements 2010 (%) 61 Table 4.15b: IRSD quintile and maternal age, confinements 2011 (%) 61 Table 4.16a: IRSD quintile and place of residence, confinements 2010 (%) 62 Table 4.16b: IRSD quintile and place of residence, confinements 2011 (%) 62 Table 4.17: Admission status, confinements 2010 and 2011 62 Table 4.18: Trends in admission status, confinements 2000 to 2011 (%) 62 Table 4.19: Postnatal length of stay, confinements 2010 and 2011 64 Table 4.20: Postnatal length of stay by type of birth, confinements 2010 and 2011 65 Table 4.21: Postnatal length of stay by admission status, confinements 2010 and 2011 65 Table 4.22: Trends in median postnatal length of stay (days) by type of birth, confinements
1985 to 2011 66 Table 4.23: Actual place of birth, confinements 2009, 2010 and 2011 67 Table 4.24: Place of birth for women who initially intended to give birth in a birth centre, 2010
and 2011 67 Table 4.25a: Place of birth by maternal age group for women who initially planned to give birth
in a birth centre, 2010 68 Table 4.25b: Place of birth by maternal age group for women who initially planned to give birth
in a birth centre, 2011 68 Table 4.26: Onset of labour for planned birth centre confinements by actual place of birth, 2010
and 2011 69 Table 4.27: Method of birth for planned birth centre confinements by actual place of birth, 2010
and 2011 69 Table 4.28: Age of women planning home confinements, 2010 and 2011 70 Table 4.29a: Place of birth for planned home confinements by maternal age, 2010 70 Table 4.29b: Place of birth for planned home confinements by maternal age, 2011 70 Table 4.30: Time of change in plan for women who planned home confinements and gave birth
in hospital, 2010 and 2011 70

5
Table 4.31: Trend in number of women achieving planned home confinements, 1985 to 2011 71 Table 4.32a: Method of birth for planned home confinements by actual place of birth, 2010 71 Table 4.32b: Method of birth for planned home confinements by actual place of birth, 2011 71 Table 4.33: Gravidity, confinements 2010 and 2011 72 Table 4.34: Parity prior to the index birth, confinements 2010 and 2011 73 Table 4.35: Trends in parity, confinements 1990 to 2011 (%) 73 Table 4.36: Number of previous caesarean sections, of women who had one or more prior birth,
2000 to 2011 74 Table 4.37: Trends in gestation, confinements 1990 to 2011 (%) 75 Table 4.38: Onset of labour, confinements 2010 and 2011 75 Table 4.39: Fetal monitoring in labour (of women who experienced labour), 2010 and 2011 78 Table 4.40: Method of birth, confinements 2009, 2010 and 2011 78 Table 4.41a: Method of birth by onset of labour, confinements 2010 79 Table 4.41b: Method of birth by onset of labour, confinements 2011 80 Table 4.42a: Method of birth by admission status, confinements 2010 80 Table 4.42b: Method of birth by admission status, confinements 2011 80 Table 4.43a: Method of birth by presentation, confinements 2010 82 Table 4.43b: Method of birth by presentation, confinements 2011 82 Table 4.44: Trends in method of birth for breech presentation at term, singleton confinements,
1985 to 2011 (%) 83 Table 4.45: Analgesia used by women who experienced labour, confinements 2010 and 2011 83 Table 4.46a: Type of anaesthesia for operative vaginal birth, confinements 2010 and 2011 83 Table 4.47: Type of anaesthesia for caesarean birth, confinements 2010 and 2011 84 Table 4.48a: 3rd and 4th degree lacerations following vaginal birth by admission type and
parity, confinements 2010 84 Table 4.48b: 3rd and 4th degree lacerations following vaginal birth by admission type and
parity, confinements 2011 84 Table 4.49a: Episiotomy following vaginal birth by admission type and parity, confinements
2010 84 Table 4.49b: Episiotomy following vaginal birth by admission type and parity, confinements
2011 85 Table 4.50a: Estimated blood loss by parity, confinements 2010 85 Table 4.50b: Estimated blood loss by parity, confinements 2011 85 Table 4.51: Women given prophylactic oxytocics in the third stage of labour, 2010 and 2011 86 Table 4.52: Initiation of breastfeeding (women with a live birth), 2010 and 2011 86 Table 4.53a: Term, live-born babies whose mothers initiated breastfeeding given formula in
hospital, 2010 87 Table 4.53b: Term, live-born babies whose mothers initiated breastfeeding given formula in
hospital, 2011 87 Table 4.54a: Term, live-born babies whose mothers initiated breastfeeding having their last
feed before discharge entirely and directly from the breast, 2010 87 Table 4.54b: Term, live-born babies whose mothers initiated breastfeeding having their last
feed before discharge entirely and directly from the breast, 2011 87 Table 4.55: Sex of infants born in 2010 and 2011 88 Table 4.56: Trends in preterm and post-term births, 1985 to 2011 (%) 88 Table 4.57a: Size of maternity service (annual births) for birth at various gestations
(completed weeks) 2010 89 Table 4.57b: Size of maternity service (annual births) for birth at various gestations
(completed weeks) 2011 89 Table 4.58a: Type of birth by gestation, births 2010 90 Table 4.58b: Type of birth by gestation, births 2011 90 Table 4.59: Birth weight categories, births 2010 and 2011 91 Table 4.60: Trends in birth weight categories, births 2000 to 2011 (%) 91 Table 4.61a: Type of birth by birth weight category, births 2010 92 Table 4.61b: Type of birth by birth weight category, births 2011 93 Table 4.62: Apgar score at five minutes, 2010 and 2011 (live births only) 93 Table 4.63: Method of resuscitation used, 2010 and 2011 (live births only) 94 Table 4.64: Multiple births, 2010 and 2011 94 Table 4.65: Trends in multiple births, 1990 to 2011 95
6
Table 4.66a: Multiple birth by maternal age group, confinements 2010 (% of mothers in each age group) 95
Table 4.66b: Multiple births by maternal age group, confinements 2011 (% of mothers in each age group) 96
Table 4.67a: Gestation by plurality, 2010 96 Table 4.67b: Gestation by plurality, 2011 96 Table 4.68a: Method of birth for singleton and twin births, 2010 97 Table 4.68b: Method of birth for singleton and twin births, 2011 97 Table 4.69: Trends in births and confinements to Aboriginal women, 1985 to 2011 98 Table 4.70a: Maternal age by Aboriginal status, confinements 2010 98 Table 4.70b: Maternal age by Aboriginal status, confinements 2011 98 Table 4.71a: Method of birth by maternal Aboriginal status, confinements 2010 99 Table 4.71b: Method of birth by maternal Aboriginal status, confinements 2011 99 Table 4.72a: Onset of labour by maternal Aboriginal status, confinements 2010 99 Table 4.72b: Onset of labour by maternal Aboriginal status, confinements 2011 99 Table 4.73a: Birth weight by maternal Aboriginal status, births 2010 100 Table 4.73b: Birth weight by maternal Aboriginal status, births 2011 100 Table 4.74a: Birth weight by maternal and baby Aboriginal status, births 2010 101 Table 4.74b: Birth weight by maternal and baby Aboriginal status, births 2011 101 Table 4.75a: Gestation by maternal Aboriginal status, births 2010 101 Table 4.75b: Gestation by maternal Aboriginal status, births 2011 102 Table 4.76a: Gestation by maternal and baby Aboriginal status, births 2010 102 Table 4.76b: Gestation by maternal and baby Aboriginal status, births 2011 102 Table 5.1: Maternal mortality ratios in Victoria 1988–2011 (per 100,000 confinements) 105 Table 5.2: Maternal mortality ratios by triennia, Victoria and Australia 1988–2011 106 Table 5.3a: Causes of maternal deaths, Victoria 2010 107 Table 5.3b: Causes of maternal deaths, Victoria 2011 108 Table 6.1: Perinatal mortality rates in Victoria 2010 112 Table 6.2: Perinatal mortality rates in Victoria 2011 112 Table 6.3: Perinatal deaths and crude and adjusted mortality rates in Victoria 2007–2011 114 Table 6.4: Different definitions of perinatal mortality 116 Table 6.5: PMR by maternal state or territory of usual residence, ABS 2007–2011 117 Table 6.6: PMR by state or territory of death, AIHW 2007–2011 117 Table 6.7: PMR500 in Victoria 2005–2011 (birth weight ≥ 500 g) 118 Table 6.8: Perinatal mortality rates for international comparison, Victoria 2005–2011 119 Table 6.9a: Gestational age and adjusted PMR, Victoria 2010 121 Table 6.9b: Gestational age and adjusted PMR, Victoria 2011 122 Table 6.10a: Birth weight and adjusted PMR, Victoria 2010 123 Table 6.10b: Birth weight and adjusted PMR, Victoria 2011 124 Table 6.11a: Adjusted PMRa in singleton and multiple births, Victoria 2010 125 Table 6.11b: Adjusted PMRa in singleton and multiple births, Victoria 2011 125 Table 6.12: Adjusted stillbirth, neonatal death and PMR, by plurality, Victoria 2005–2011 126 Table 6.13a: Perinatal mortality by maternal place of birth, Victoria 2010 127 Table 6.13b: Perinatal mortality by maternal place of birth, Victoria 2011 128 Table 6.14: Aboriginal and non-Aboriginal adjusted perinatal mortality, by triennia, Victoria
2001–2011 129 Table 6.15a: Perinatal deaths, Victoria 2010, by PSANZ PDC major categories and type 136 Table 6.15b: Perinatal deaths, Victoria 2011, by PSANZ PDC major categories and type 138 Table 6.16: Perinatal deaths, Victoria 2010 and 2011, by PSANZ PDC expanded categories and
type 142 Table 6.18a: Perinatal deaths in singleton and multiple births by cause (PSANZ PDC) Victoria
2010 156 Table 6.18b: Perinatal deaths in singleton and multiple births by cause (PSANZ PDC), Victoria
2011 157 Table 6.19: Perinatal deaths by PSANZ PDC and Aboriginal status, Victoria 2003-2011 158 Table 6.20: Perinatal deaths as a result of terminations of pregnancy, Victoria 2010 and 2011
159 Table 6.21a: Perinatal deaths, Victoria 2010, by PSANZ PDC and gestational age 160 Table 6.21b: Perinatal deaths, Victoria 2011, by PSANZ PDC and gestational age 162 Table 6.22a: Stillbirths, Victoria 2010, by PSANZ PDC and gestational age 164
7
Table 6.22b: Stillbirths, Victoria 2011, by PSANZ PDC and gestational age 166 Table 6.23a: Neonatal deaths, Victoria 2010, by PSANZ PDC and gestational age 168 Table 6.23b: Neonatal deaths, Victoria 2011, by PSANZ PDC and gestational age 170 Table 6.24a: Neonatal deaths, Victoria 2010, by PSANZ NDC and gestational age 171 Table 6.24b: Neonatal deaths, Victoria 2010, by PSANZ NDC, expanded categories
and gestational age 172 Table 6.25a: Neonatal deaths, Victoria 2011, by PSANZ NDC and gestational age 173 Table 6.25b: 174 Neonatal deaths, Victoria 2011, by PSANZ NDC, expanded categories and gestational age 174 Table 6.26: Trends in maternal and infant characteristics relating to perinatal deaths (PND),
Victoria 2007-2011 (%) 175 Table 6.27a: Time of fetal death in stillbirths (by gestational age), Victoria 2010 177 Table 6.27b: Time of fetal death in stillbirths (by gestational age), Victoria 2011 178 Table 6.28: Age at time of death of neonates, Victoria 2010 179 Table 6.29: Age at time of death of neonates, Victoria 2011 179 Table 6.30: Perinatal deaths with birth weight < 400 g at ≥ 20 weeks gestation, Victoria 2010 and
2011 180 Table 6.31: Perinatal deaths, by PSANZ PDC and type (birth weight < 400 g at ≥ 20 weeks
gestation), Victoria 2010 and 2011 180 Table 6.32a: Perinatal autopsy rates, Victoria 2010 182 Table 6.32b: Perinatal autopsy rates, Victoria 2011 182 Table 6.29: Placental pathology, Victoria 2010 and 2011 184 Table 6.30: Contributing factors in perinatal deaths (birth weight ≥ 500 g), Victoria 2010 and
2011 185 Table 7.1a: Infant, child and adolescent deaths (0–17 years), age at death by gender, Victoria
2010 192 Table 7.1b: Infant, child and adolescent deaths (0–17 years), age at death by gender, Victoria
2011 192 Table 7.2a: Infant, child and adolescent deaths (0–17 years), death rates for age group by
gender, Victoria 2010 193 Table 7.2b: Infant, child and adolescent deaths (0–17 years), death rates for age group by
gender, Victoria 2011 193 Table 7.3: Under-5 mortality rate (probability of dying by age 5 per 1,000 live births),
OECD member countries with GDP over $20,000, 1960-2012 a. 195 Table 7.4: Neonatal, post-neonatal infant and infant mortality rates, Victoria 2000–2011 196 Table 7.5: Comparison of infant mortality rates (per 1,000 live births) of 34 OECD countriesa
,1960-2012 198 Table 7.6a: Rank cause of death, post-neonatal infants (28–364 days), Victoria 2010 199 Table 7.6b: Rank cause of death, post-neonatal infants (28–364 days), Victoria 2011 199 Table 7.7a: Rank cause of death, children aged 1 to 4 years, Victoria 2010 200 Table 7.7b: Rank cause of death, children aged 1 to 4 years, Victoria 2011 200 Table 7.8a: Rank cause of death, children aged 5–9 years, Victoria 2010 201 Table 7.8b: Rank cause of death, children aged 5–9 years, Victoria 2011 201 Table 7.9a: Rank cause of death, children aged 10–14 years, Victoria 2010 202 Table 7.9b: Rank cause of death, children aged 10–14 years, Victoria 2011 202 Table 7.10a: Rank cause of death, adolescents aged 15–17 years, Victoria 2010 203 Table 7.10b: Rank cause of death, adolescents aged 15–17 years, Victoria 2011 203 Table 7.11a: Cause of death by age group, 28 days to 17 years, Victoria 2010 204 Table 7.11b: Cause of death by age group, 28 days to 17 years, Victoria 2011 205 Table 7.12a: Deaths from congenital anomaly by age group, Victoria 2010 213 Table 7.12b: Deaths from congenital anomaly by age group, Victoria 2011 215 Table 7.13: SUDI deaths: cause of death, Victoria 2004–2011 219 Table 7.14: Selected features of the 41 infants categorised as SIDS II,a Victoria 2010–2011 220 Table 7.15a: Selected features of the 26 unexplained SUDI deaths, 2010a 221 Table 7.15b: Selected features of the 23 unexplained SUDI deaths, 2011a 222 Table 7.16a: Mode of travel in motor vehicle accident fatalities by age group, Victoria 2010 226 Table 7.16b: Mode of travel in motor vehicle accident fatalities by age group, Victoria 2011 227 Table 7.17a: Location of drowning fatalities by age group, Victoria 2010 229 Table 7.17b: Location of drowning fatalities by age group, Victoria 2011 229 Table 7.18: Fire fatalities by age group, Victoria 2011 230

8
Table 7.19a: Deaths from asphyxia and other types of injury, by age group, Victoria 2010 230 Table 7.19b: Deaths from asphyxia, train and other types of injury, by age group, Victoria 2011
231 Table 7.20a: Deaths from infection by age group, Victoria 2010 234 Table 7.20b: Deaths from infection by age group, Victoria 2011 234 Table 7.21a: Deaths from malignancy by age group, Victoria 2010 235 Table 7.21b: Deaths from malignancy by age group, Victoria 2011 236 Table 7.22a: Deaths from other acquired disease by age group, Victoria 2010 236 Table 7.22b: Deaths from other acquired disease by age group, Victoria 2011 237 Table 7.23a: Deaths from undetermined cause by age group, Victoria 2010 238 Table 7.23b: Deaths from undetermined cause by age group, Victoria 2011 238 Table 7.24a: Deaths from intentional trauma by age group, Victoria 2010 240 Table 7.24b: Deaths from intentional trauma by age group, Victoria 2011 241 Table 7.25a: Deaths from completed suicide: age at death by gender, Victoria 2010 241 Table 7.25b: Deaths from completed suicide: age at death by gender, Victoria 2011 242
9
LIST OF FIGURES
Figure 3.1 CCOPMM case review process 50 Figure 4.1: Trends in maternal age group, confinements 1985 to 2011 (%) 56 Figure 4.2a: Admission for the birth as a public patient by maternal age group, confinements
2010 (%) 63 Figure 4.2b: Admission for the birth as a public patient by maternal age group, confinements
2011 (%) 63 Figure 4.3: Trends in postnatal length of stay, confinements 1985 to 2011 (%) 64 Figure 4.4a: Postnatal length of stay by admission status, confinements 2010 (%) 66 Figure 4.4b: Postnatal length of stay by admission status, confinements 2011 (%) 66 Figure 4.5: Trends in onset of labour, confinements 1990 to 2011 (%) 76 Figure 4.6a: Onset of labour by admission status, confinements 2010 (%) 76 Figure 4.6b: Onset of labour by admission status, confinements 2011 (%) 77 Figure 4.7: Trends in method of birth, all confinements, 1985 to 2011 79 Figure 4.8a: Method of birth by admission status, confinements 2010 (%) 81 Figure 4.8b: Method of birth by admission status, confinements 2011 (%) 81 Figure 4.9: Trends in preterm and post-term birth, 1985 to 2011 (%) 88 Figure 4.10: Trends in major birth weight categories, births 1985 to 2011 (%) 92 Figure 5.1 Mortality ratios by triennia, Victoria and Australia, 1988-2011 104 Figure 6.1: Perinatal mortality rates in Victoria 2000–2011 (crude and adjusted) 115 Figure 6.2: PMR500 in Victoria 1999–2011 119 Figure 6.3: Trends in PMR1,000 for international comparison, Victoria, 1975–2011 120 Figure 6.4: Adjusted perinatal mortality by Aboriginal status, Victoria 2001–2011 130 Figure 6.5: Total perinatal mortality ratio (gestation standardised, excluding all terminations of
pregnancy and deaths due to congenital anomalies) using five years of pooled data in Victorian public hospitals, 2006–10 131
Figure 6.6: Total perinatal mortality ratio (gestation standardised, excluding all terminations of pregnancy and deaths due to congenital anomalies) using five years of pooled data in Victorian public hospitals, 2007–11 132
Figure 6.7: Perinatal mortality ratio for babies born at 32 weeks or more (gestation standardised, excluding all terminations of pregnancy and deaths due to congenital anomalies) using five years of pooled data in Victorian public hospitals, 2006–10 133
Figure 6.8: Perinatal mortality ratio for babies born at 32 weeks or more (gestation standardised, excluding all terminations of pregnancy and deaths due to congenital anomalies) using five years of pooled data in Victorian public hospitals, 2007–11 134
Figure 6.9a: Causes of perinatal death (%), PSANZ PDC, Victoria 2010 137 Figure 6.9b: Causes of stillbirth (%), PSANZ PDC, Victoria 2010 137 Figure 6.9c: Causes of neonatal death (%), PSANZ PDC, Victoria 2010 137 Figure 6.9d: Causes of perinatal death (%), PSANZ PDC, Victoria 2011 139 Figure 6.9e: Causes of stillbirths (%), PSANZ PDC, Victoria 2011 139 Figure 6.9f: Causes of neonatal death (%), PSANZ PDC, Victoria 2011 139 Figure 6.10a: Causes of perinatal death (unadjusted), PSANZ PDC, Victoria 2010 161 Figure 6.10b: Causes of perinatal death (adjusted), PSANZ PDC, Victoria 2010 161 Figure 6.10c: Causes of perinatal death (unadjusted), PSANZ PDC, Victoria 2011 163 Figure 6.10d: Causes of perinatal death (adjusted), PSANZ PDC, Victoria 2011 163 Figure 6.11a: Causes of stillbirth (unadjusted), PSANZ PDC, Victoria 2010 165 Figure 6.11b: Causes of stillbirth (adjusted), PSANZ PDC, Victoria 2010 165 Figure 6.11c: Causes of stillbirth (unadjusted), PSANZ PDC, Victoria 2011 167 Figure 6.11d: Causes of stillbirth (adjusted), PSANZ PDC, Victoria 2011 167 Figure 6.12a: Causes of neonatal deaths, PSANZ PDC, Victoria 2010 169 Figure 6.12b: Causes of neonatal deaths, PSANZ PDC, Victoria 2011 170 Figure 6.13: Perinatal autopsy rates, Victoria 2000 - 2011 183 Figure 7.1a: Cases included in the review of post-neonatal infant, child and adolescent deaths
in 2010a 190 Figure 7.1b: Cases included in the review of post-neonatal infant, child and adolescent deaths
in 2011 a 191 Figure 7.2: Trends in death ratesa b for children < 5 years, Victoria 2000–2011 194 Figure 7.3: Infant mortality rate, Victoria 2000–2011 196
10
Figure 7.4: Rates of major cause of death of post-neonatal infants and children 28 days to 14 years, 1985–2011a 206
Figure 7.5a: Post-neonatal infant and child deaths (28 days to 14 years) by major cause, Victoria 1997–2011 207
Figure 7.5b: Post-neonatal infant, child and adolescenta,b deaths by major cause, Victoria 1997–2011 208
Figure 7.6a: Rates of death by age group, Victoria, 1985–2011ab 209 Figure 7.6b: Rates of death by age group, (excluding 28–364 days) Victoria 1985–2011 ab 209 Figure 7.7: Post-neonatal infant, child and adolescent deaths by age group, Victoria 1997–2011a
210 Figure 7.8a: Causes of death determined at birth: post-neonatal infants and children
(28 days to 14 years), Victoria 1997–2011 211 Figure 7.8b: Causes of death determined at birth: post-neonatal infants, children
and adolescents,a,b Victoria 1997–2011 212 Figure 7.9: Sudden unexpected death in infants, Victoria 1985–2011a,b 217 Figure 7.10a: Sudden unexpected deaths of infants, Victoria 2010 218 Figure 7.10b: Sudden unexpected deaths of infants, Victoria 2011 218 Figure 7.11a: Rates of unintentional injury deaths, 28 days to 14 years, Victoria 1985–2011a 224 Figure 7.11b: Rates of unintentional injury deaths (excluding motor vehicle accidents), 28 days
to 14 years, Victoria 1985–2011 a 225 Figure 7.12a: Unintentional injury deaths: post-neonatal infants and children (28 days to 14
years), Victoria 1997–2011 225 Figure 7.12b: Unintentional injury deaths: post-neonatal infants, children and adolescents,a,b
Victoria 1997–2011 226 Figure 7.13a: Motor vehicle accident fatalities: post-neonatal infants and children
(28 days to 14 years), Victoria 1997–2011a 227 Figure 7.13b: Motor vehicle accident fatalities: post-neonatal infants, children and
adolescents,a,b Victoria 1997–2011c 228 Figure 7.14: Drowning fatalities: post-neonatal infants, children and adolescentsa,b Victoria
1997–2011 229 Figure 7.15a: Acquired disease and undetermined deaths: post-neonatal infants and children
(28 days to 14 years), Victoria 1997–2011 232 Figure 7.15b: Acquired disease deaths: post-neonatal infants, children and adolescents,a,b
Victoria 1997–2011 233 Figure 7.16a: Intentional trauma and suicide deaths: post-neonatal infants and children
(28 days to 14 years), Victoria 1997–2011 239 Figure 7.16b: Intentional trauma and suicide deaths: post-neonatal infants, children
and adolescents,a,b Victoria 1997–2011 240
11
1. EXECUTIVE SUMMARY AND RECOMMENDATIONS
1.1 BACKGROUND
CCOPMM was established in 1962 under the Health Act 1958 and now functions under the Public Health and Wellbeing Act 2008 (the Act). The CCOPMM is the advisory body to the Minister for Health on maternal, perinatal and paediatric mortality and morbidity.
The CCOPMM has statutory responsibility for the Victorian Perinatal Data Collection (VPDC) and the Victorian Congenital Anomalies Register (VCAR), formerly known as the Victorian Birth Defects Register. The data collections are managed by the Clinical Councils Unit within the Health Service Programs Branch of the Victorian Department of Health.
CCOPMM is also responsible for the collection and review of all maternal deaths, all perinatal deaths (stillbirths and neonatal deaths) from 20 weeks gestation (or 400 g birth weight if gestation is not known) and all infant and child deaths up to (but not including) the 18th birthday.
Mortality case review
A case file is created when a death certificate is received from the Registry of Births, Deaths and Marriages. Information is then sought from multiple sources including the VPDC, hospital case records, individual doctors and midwives, pathology services, coronial services and the Newborn Emergency Transport Service (NETS).
All deaths are classified according to national standards, such as the Perinatal Society of Australia and New Zealand (PSANZ) Perinatal Mortality Classification System (for perinatal deaths) by obstetric and paediatric epidemiologists. Complex or contentious mortality cases are referred to the specialist subcommittees of CCOPMM for review. The subcommittees consider preventable or contributing factors, classify the deaths and develop clinical and system improvement recommendations for public dissemination.
1.2 PURPOSE
This executive summary communicates the key points and recommendations arising from CCOPMM’s review of births and deaths in Victoria in 2010 and 2011. The executive summary has been produced as a standalone document and as a component of the full report. The full report contains the detailed summary and comparative statistics resulting from the analysis of birth outcome data and mortality review. The full report is available at <www.health.vic.gov.au/ccopmm/>.
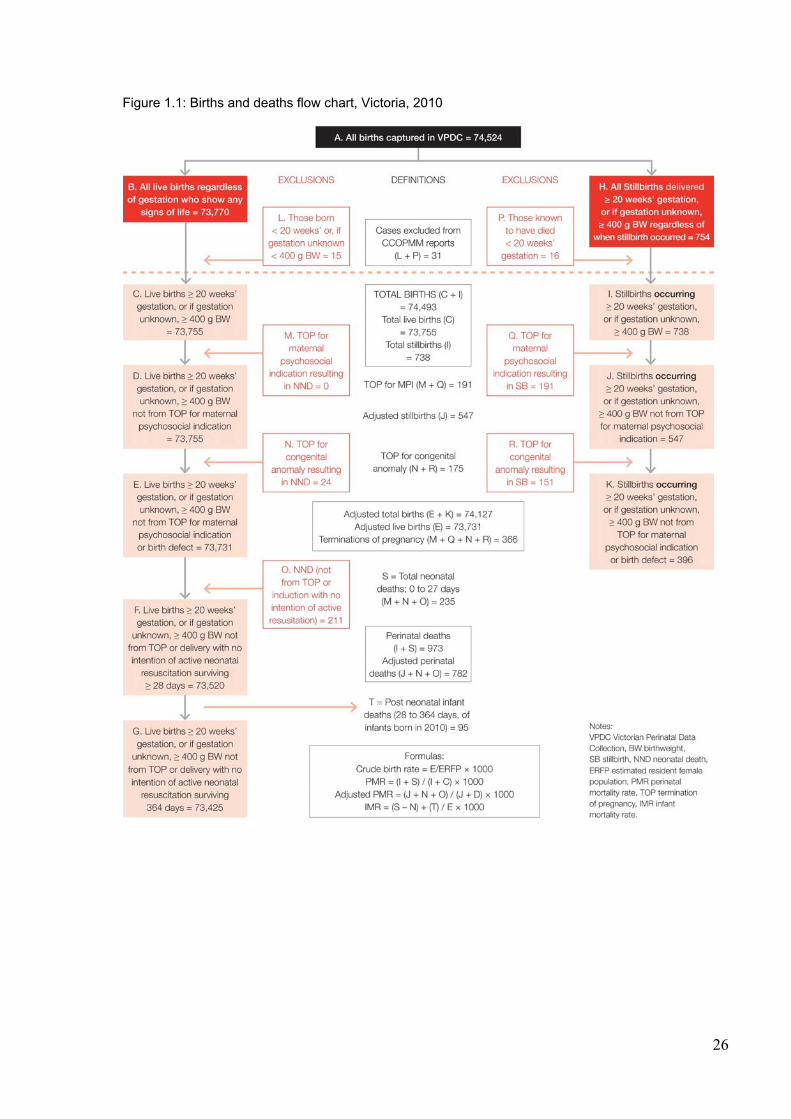
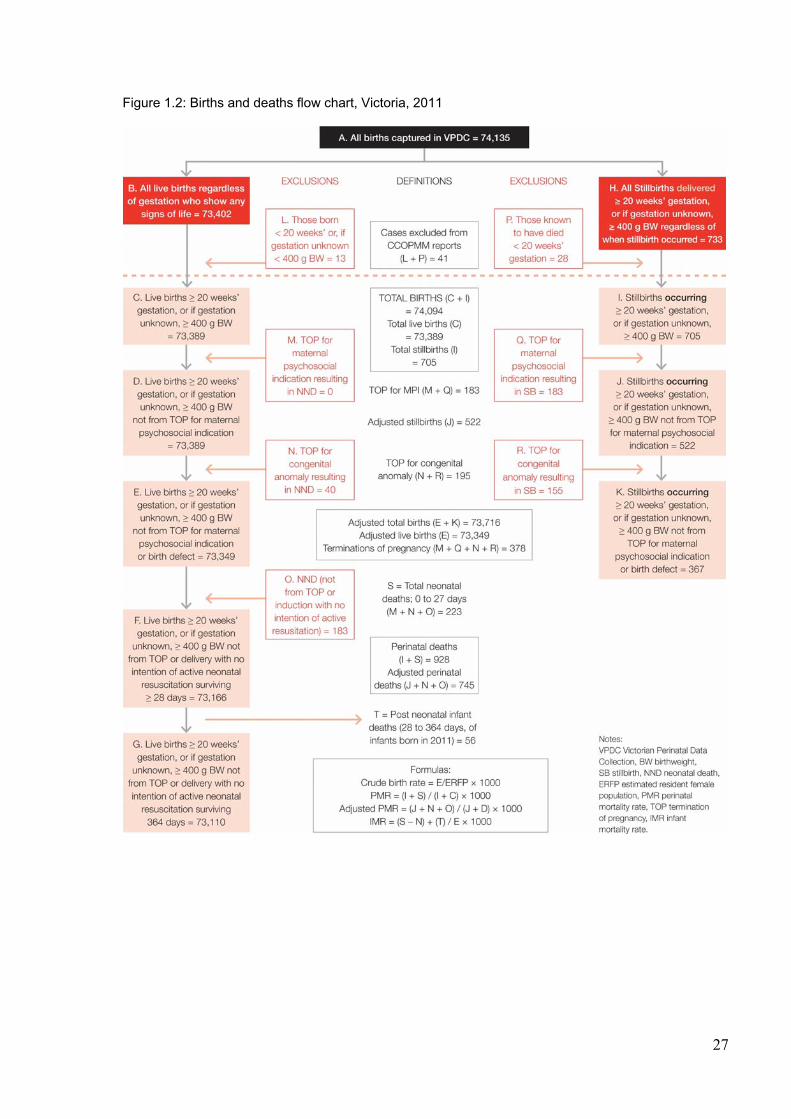
The definitions and methods used in the full report are provided in Chapter 3. This section should be accessed when interpreting the findings. The births and deaths flowcharts provided in Figures 1.1 and 1.2 outline the scope of the data collections and the case inclusions and exclusions used for statistical reporting.
The CCOPMM is committed to ensuring that the annual report is a useful tool for obstetricians, paediatricians, midwives, health services and researchers in monitoring the care and outcomes for mothers, babies, children and adolescents. To this end we welcome your feedback via a short survey which can be found at the back of the full report or online at <www.health.vic.gov.au/ccopmm/>.
12
1.3 CCOPMM RECOMMENDATIONS
Clinical recommendations from the CCOPMM Maternal Mortality and Morbidity Subcommittee 2010 and 2011
Antenatal
Health services must ensure they assess their capacity to meet the clinical needs of pregnant women with a high Body Mass Index (BMI), in accordance with the statewide Maternity and Newborn Clinical Network Obesity guideline1 and Department of Health requirements regarding access to specialist clinics and elective surgery2 3. Where required, referral and/or safe transfer of care should be made to a health service with adequate capacity. Accordingly, health services should implement policies for the management and referral of pregnant women with a high BMI and provide clinical education and support.4
Women with a high BMI should be carefully reviewed for additional risk factors at the initial antenatal visit. This assessment should be well documented.4
Psychosocial factors should be assessed in early pregnancy and again in the third trimester. Mental health disorders disclosed or identified during pregnancy should be followed by effective pathways to treatment and services. Health services should develop locally relevant protocols to manage and refer women with mental health disorders. 5 6
Health services should provide access to regular clinical education to ensure clinicians are capable of responding effectively to disclosures of domestic violence in pregnant women.
Assessment and management of domestic violence in pregnant women should be conducted in a safe and secure manner, using appropriate skills and tools.
Clinicians should be familiar with the local resources and services for domestic violence that can be accessed in urgent circumstances, such as local safe houses or the Strong Women Workers in their community.
Complications
Non-obstetric causes such as intra-abdominal haemorrhage (for example, ruptured splenic artery aneurysm, ruptured liver) should be considered when a pregnant woman presents with severe abdominal pain, particularly if administration of narcotic analgesia is required.
Pre-eclampsia with associated risk of intra-cerebral haemorrhage should be considered for women with hypertension in the post-partum period. Blood pressure should be managed to reduce this risk.
Suspicion of a possible placenta accreta may be evidenced by an anterior placenta encroaching on the lower uterine segment, regardless of ultrasound or MRI results. Women with accreta who have had a previous caesarean section may require a hysterectomy if complete and simple separation of the placenta does not occur following the current caesarean section.
Amniotic fluid embolism (AFE) can escalate rapidly and be difficult to recognise. Wherever AFE is suspected, senior medical staff should be involved as quickly as possible to improve clinical outcomes.
Health services should have protocols and regular clinical education on blood transfusions, particularly where substantial quantities are required. They should also meet current safety and quality standards for blood transfusions.
13
Labour and birth
The third stage of labour should be managed out of water to enable correct estimation of blood loss. Estimation of blood loss can be affected by the dilution of water, ambient lighting, bath colour, pool liner colour and the experience of birth attendants.2
Research should be conducted into factors that affect the estimation of blood loss during and after water births.
Pregnant women undergoing general anaesthesia should have adequate cardiovascular monitoring during and after anaesthesia and comprehensive records should be kept.
Postnatal
An extended postnatal stay should be considered for women with pre-existing medical conditions, such as heart disease, to identify risks of post-partum complications.7
Clinical recommendations from the CCOPMM Stillbirth Subcommittee and Neonatal Mortality and Morbidity Subcommittee 2010 and 2011
Antenatal care
Health services must ensure they assess their capacity to meet the clinical needs of pregnant women with a high BMI, in accordance with the statewide Maternity and Newborn Clinical Network Obesity guideline8 and Department of Health requirements regarding access to specialist clinics and elective surgery.9, 10 Where required, referral and/or safe transfer of care should be made to a health service with adequate capacity. Accordingly, health services should implement policies for the management and referral of pregnant women with a high BMI and provide clinical education and support.11
Women with a high BMI should be carefully reviewed for additional risk factors at the initial
antenatal visit. This assessment should be well documented.8, 11
Health services are encouraged to improve their reporting of maternal height and weight to enable more robust analysis of the relationship between maternal BMI and perinatal outcomes.
Improving access to early antenatal care in vulnerable populations, for example refugee
women, should be a priority for clinicians and health services.
Health services should have a structured and documented process to follow up on pregnant women who regularly ‘do not attend’ (DNA) antenatal appointments to ensure vulnerable or higher risk women receive appropriate care.
Reduced fetal movements
Pregnant women should be informed that the healthy fetus does not reduce the frequency of movement towards the end of pregnancy 12Clinicians should educate pregnant women to report signs of decreased fetal movements.
Decreased fetal movements reported by pregnant women should be managed using current
best practice guidelines. 12
14
Women who report decreased fetal movement should be assessed for the presence of other risk factors associated with stillbirth. This includes fetal growth restriction (FGR), hypertension, diabetes, advanced maternal age. Women with decreased fetal movements in combination with other risk factors should be managed as high risk.
If the cardiotocograph (CTG) trace is normal, clinicians should base further management of
reduced fetal movements on review of the full clinical history and findings, such as metabolic and hypertensive disorders, or abnormal fetal growth.12
Fetal growth
Clinicians should measure the symphyseal-fundal (S-F) height with a tape measure at each antenatal visit as it is considered more reliable and consistent than abdominal palpation alone for the detection of intrauterine growth restriction. This is most relevant for inexperienced clinicians or when multiple clinicians are involved in the antenatal care.13
Health services should develop and implement policies and procedures to support clinical decisions regarding appropriate fetal growth using S-F height measurement.9
The use of centile charts supports the management of growth restriction and is recommended for all pregnancies.
When managing women with suspected FGR, clinicians must seek advice from a senior clinician regarding the modality and frequency of fetal surveillance and the timing of delivery.
Clinicians should exercise increased vigilance in assessment of fetal growth in women with large uterine fibroids, and consider ultrasound assessment due to the difficulties associated with fetal growth assessment in these women. An ultrasound for suspected macrosomia should be performed by around 35–36 weeks gestation.
High-risk pregnancies
Serial anti-D titre measurement should be performed if elevated anti-D titres are detected that are not due to antenatal prophylaxis. These should be performed at four-weekly intervals initially up to 28 weeks, then fortnightly until delivery.14 Referral to a maternal-fetal specialist is recommended if the anti-D titre is greater than or equal to 1:32 or if there is an increase in titre of two or more dilutions.
15
Pregnant women with anti-Kell antibodies require specialist obstetric consultation. Clinicians should consider close specialist observation for women with very low first trimester
PAPP-A results16 (<0.4 MoM) and a chromosomally normal fetus as this may be a marker for later pregnancy complications, such as intra-uterine growth restriction (IUGR), extreme prematurity, preeclampsia and stillbirth.14
Emergency department clinicians should be aware that gastroenteritis symptoms can mimic the symptoms of preeclampsia/Haemolysis Elevated Liver enzymes and Low Platelets (HELLP) in pregnant women. 17 18
Prior to considering other causes, clinicians should exclude pre-eclampsia in pregnant women who present with symptoms of headache, visual disturbances, epigastric pain and vomiting.
Prior to commencing induction of labour, clinicians should ensure sufficient human and clinical resources are available to support timely and safe induction of labour and birth, particularly for women with a high-risk pregnancy.
Women at high risk of diabetes should be screened for diabetes in early pregnancy.19
15
Women with high-risk pregnancies (for example previous caesarean section, macrosomic baby or obstructed labour) who opt for home birth should be offered information based on peer reviewed research on the safety and risks of birthing at home. This is particularly important where immediate emergency access or retrieval is likely to be delayed and/or limited.
Women with a breech presentation who wish to birth at home should be referred to specialist care to discuss safety options and back up retrieval in an emergency 20
Women with evidence of preterm pre-labour rupture of membranes (PPROM) should be prescribed antibiotics (erythromycin) for 10 days.21
Intra-partum management
Clinicians and maternity services that provide intra-partum care should implement the Royal Australian and New Zealand College of Obstetricians and Gynaecologists (RANZCOG) Intrapartum fetal surveillance clinical guidelines (3rd edition). Clinicians who provide intra-partum care require regular training in CTG monitoring to maintain competency and confidence.4
The primary midwife should document a clear antenatal plan for intra-partum transfer for all
planned home births.
Where fetal compromise is suspected, a tocolytic and fluid bolus should be considered until delivery can be expedited by emergency caesarean section.4 This is also recommended for uterine hyperstimulation (tachysystole or hypertonus associated with fetal heart rate changes), particularly in women undergoing a trial of labour after a previous caesarean section (TOLAC/VBAC).
Once a decision has been made for an emergency caesarean section, the baby must be continuously monitored by auscultation or CTG until the surgical procedure has commenced (knife to skin).
Clinicians should adhere to the RANZCOG recommendations regarding CTG monitoring in second stage of labour.3 Cord pH and/or lactate should be assessed following instrumental or operative delivery for suspected fetal compromise. Health services should consider the routine collection of cord pH/ lactate and provide access to clinical education on its practice.
Women with a fetal death in utero should be encouraged to proceed with an induced labour and vaginal birth with the appropriate level of support, as opposed to an elective caesarean section, where there are no contra-indications for vaginal birth.22
Clinicians need to inform women who request expedited delivery by elective caesarean section following fetal death in utero, that future pregnancies following caesarean delivery are associated with significantly higher risks of abnormal placentation (placenta praevia, placenta accrete/percreta).22
In women with a high BMI, a Fetal Scalp Electrode (FSE) should be applied when external CTG cannot be reliably interpreted. This is particularly important in the second stage of labour.
Local resources such as theatre and anaesthetic staff should be available when undertaking complex vaginal births, such as rotational/mid cavity forceps, twin and breech births. Improved outcomes may be more easily achieved if these deliveries are undertaken in theatre.
Phone calls from women about fetal wellbeing throughout the pregnancy or in labour should be logged and documented. This information should be readily available to all clinicians taking individual calls.23 If a woman makes three calls within a short timeframe, for example, 24 to 36
16
hours, she should be advised to present to the health service to be assessed as soon as possible.
Clinicians should take precautionary measures to ensure emergency caesarean section is not delayed in women taking anticoagulant therapy. These measures include assessing heparin activity using activated partial thromboplastin time (aPTT), activated clotting time (aCT) or anti-Factor Xa level, and subsequent reversal of anticoagulation with protamine sulphate if required. Urgent delivery is warranted in cases of major placental abruption.
Neonatal resuscitation
Following delivery of the compromised baby requiring resuscitation with intravenous therapy, umbilical vein cannulation is the first option.24
Clinicians should always have a self-inflating bag available at every birth in the event of resuscitation equipment failure.
Pigtail catheters are the preferred device for thoracic drainage (air or fluid). Safe insertion of pigtail catheters, particularly in very preterm babies, should be performed by a senior clinician experienced in the procedure. Health services should ensure relevant protocols are in place and access to clinical training is available in the procedure.
Adrenaline should be administered via the endo-tracheal tube (ETT) if venous access is not immediately available.24
An information sheet on the markers of serious illness in infancy is provided in the My Health and Development Record (baby health record given to parents prior to discharge). Parents should be made aware of this information prior to discharge.25
A baby whose weight drops below 2.5 kg while in hospital should be seen by a paediatrician and demonstrate weight gain prior to discharge.
Following up investigations and procedures
Following the insertion of an umbilical vein catheter (UVC), the baby should have a lateral and antero-posterior x-ray to confirm the UVC position.26 If the UVC position is incorrect it should be removed and alternative access established.
If unable to intubate the baby, ventilation with bag and mask should be continued until further clinical support arrives. Clinicians should document the pressures being used with a T-piece device. This is important in deciding when to intubate as increasing pressures are a guide to changing management.
Investigation of perinatal deaths
Health services that provide maternity care should classify and review all perinatal deaths that occur in their service using the PSANZ Clinical practice guidelines for perinatal mortality audit.27
All parents of a baby who is stillborn or dies in the neonatal period should be offered the opportunity for their baby to have postmortem examination, even if this is limited to external examination, measurements, radiographic examination, formal documentation and photographs.
Following a stillbirth or neonatal death in the delivery room or birth of a high-risk infant, the placenta should be sent for examination by a perinatal/paediatric pathologist. Placental histopathology examination should be performed by the pathology service doing the autopsy.27
Examination of the placenta by an experienced pathologist is an essential component of the investigation of perinatal deaths whether or not the baby has a postmortem.
17
The placenta should be kept for 24 hours after all emergency and expedited deliveries to allow further examination should deterioration in the baby’s condition occur.
When a newborn baby is being transferred by the NETS, the placenta should also be transported so that pathology investigations can be carried out at the specialist health service. Clinicians are reminded that the placenta must not be placed in formalin.27
A Kleihauer test or flow cytometry to detect feto-maternal haemorrhage should be performed as soon as possible after the detection of fetal death in utero.27
Maternity services should support access for clinical staff to participate in the IMproving Perinatal Mortality Review and Outcomes Via Education (IMPROVE) workshops, via <www.stillbirthalliance.org.au/education.htm> to reinforce clinicians’ understanding, and implementation of the PSANZ guidelines.27
Clinical and systems recommendations from Child and Adolescent Subcommittee 2010 and 2011
Acute deterioration
Clinicians should be attentive to symptoms and signs that suggest deterioration in a child, and listen carefully and respond to parents’ concerns of deterioration. The admission diagnosis should be reviewed in cases that are not straightforward. Abnormal test results should be considered further in the context of the illness, not simply accepted as false positives. A second opinion should be sought when a child’s signs and symptoms do not improve in the expected timeframe or where parents express concerns their child is more unwell than considered on assessment.
Health services should have a system to deal with children whose condition is deteriorating. This may include a Medical Emergency Team (MET) system, where expert help in the management of a seriously ill child can be summoned based on age-related vital signs. Such criteria are outlined in <http://www.rch.org.au/clinicalguide/guideline_index/MET_Criteria_Call_777_for_help/>.
Drug errors in hospital wards and emergency departments
Drugs dosage errors (prescribing, dispensing and administering) in hospitals and other health care settings are common and can lead to significant morbidity28 29 and, rarely, mortality.30 All drugs should be administered with care with special attention given to less common or rarely used drugs or those with serious side effects.
Precautions should be in place for rarely used, potentially toxic drugs. This should include involvement of a clinical pharmacist in the prescription, preparation and dispensing of the drug, and sub-specialist paediatric advice where appropriate.
Drug dosage errors can be minimised with checking procedures, recording children’s weight and mg/kg or mcg/kg dose on the medication order form, involving clinical pharmacists and, ultimately, by electronic prescribing.
Surveillance and investigation of drug dosage errors should be performed with outcomes and recommendations disseminated, implemented and evaluated.
Drug dosage errors were found to occur during resuscitation in emergency departments, inpatient settings and out of hospital. Mistakes are more likely to occur, for example, drug calculations, ten-fold errors, when clinicians operate under heightened conditions of stress, such as during resuscitation.
18
Guidelines and resources are available to enable staff to easily locate correct doses of resuscitation drugs based on the child’s weight (if known) or age. These resources clearly outline the drug dose, for example, in ml, to be administered and avoid the need for any calculation.
These resources should be available in wards and emergency departments and clinicians should be familiar with their use. The Royal Children’s Hospital Emergency drug dose guideline is one such resource, available at: <http://www.rch.org.au/clinicalguide/guideline_index/Emergency_Drug_Doses/>.
Severe bacterial sepsis management
Children with severe bacterial sepsis should be managed at a hospital that can identify and manage acute deterioration. Clinicians should have the necessary support in place to manage any deterioration in children with severe bacterial sepsis. They should prepare to transfer the child if necessary, preferably early in the admission.
Assessment of sick neonates, infants and children in an emergency department
Emergency departments should ensure experienced clinicians are available in the department to adequately assess sick neonates and have access to paediatricians.
Clinicians in emergency departments should be able to access information on acceptable ranges of vital signs in children. This will enable them to identify abnormal parameters of heart rate, respiratory rate and blood pressure. Ranges of these measurements can be found at: <http://www.rch.org.au/clinicalguide/guideline_index/Emergency_Drug_Doses/>.
Review of growth parameters is important for the assessment of neonates, infants and children in emergency departments.
Together with relevant clinical signs, raised intracranial pressure can be better recognised by plotting serial infant head circumference, as it can show abnormal head growth.
Administering antibiotics and deferring a lumbar puncture in children with suspected meningitis does not significantly diminish the detection of pathogenic organisms with polymerase chain reaction (PCR) and other molecular techniques. Empirically treating children with signs or symptoms of raised intracranial pressure, impaired conscious state, hypoxaemia, apnoea, coagulopathy or severe sepsis, with antibiotics is the safest course of action.
Obstructive sleep apnoea
Children with obstructive sleep apnoea are at risk of pulmonary hypertension. Delayed management of severe obstructive sleep apnoea can lead to death. Any child with significant apnoea during sleep should be assessed urgently and treated.
Public health services must ensure they meet the requirements of the Department of Health regarding access to specialist clinics and elective surgery and the management of urgent referrals.31 32 Clinicians’ private rooms and private health services should consider systems to implement the principles applied to public health services to identify and manage urgent referrals for children in need of tonsillectomy and adenoidectomy.
Diagnosis of congenital heart disease
Antenatal ultrasound is important for diagnosis of congenital heart disease. Clinicians who perform and interpret antenatal ultrasounds should have appropriate qualifications and experience to detect congenital heart disease.
Health services should consider the routine use of pulse oximetry to screen for critical heart anomalies in all babies prior to discharge from the birth hospital, consistent with recent evidence. 33 34
19
Suicide
Children and adolescents with significant mental health issues should be followed up if they fail to attend appointments. Systems should be in place to detect those who fail to attend booked appointments.
Root cause analysis/audits following adverse events in paediatric care
A root cause analysis, audit or case review should be undertaken by independent clinicians following a serious adverse event or death in a health care setting. Findings and recommendations should then be widely disseminated, with support provided to implement recommendations and evaluate the impact and outcome of any changes.
Anaphylaxis
The early administration of adrenaline is essential in the management of anaphylaxis. Deaths due to anaphylaxis are more likely in the event of a:
failure to carry an adrenaline auto-injector or sufficient auto-injectors
failure to recognise the symptoms of anaphylaxis (often confusing the symptoms with those of severe asthma), leading to a delay in administering adrenaline via auto-injector
failure to give adrenaline via auto-injector for fear of having the wrong diagnosis.
Children with anaphylaxis and their families, carers and teachers need to have ongoing education in the avoidance of triggers and the recognition and emergency management of anaphylaxis.
Children with a history of both asthma and anaphylaxis are at greater risk of death during an episode of anaphylaxis. 35 3637 If caregivers are unable to differentiate the signs and symptoms of the diseases, they should administer the adrenaline auto-injector in addition to the emergency asthma management plan in the treatment of presumed severe asthma.
Asthma
Deaths continue to occur from asthma with multiple recommendations on asthma made by CCOPMM over the last 20 years.
A regular review of a child or adolescent's written asthma plan should occur. This should review their asthma control, medications and adherence, asthma beliefs and understanding of emergency care. All the child’s carers must be able to follow the plan. Extra support should be provided to vulnerable children, adolescents and their families.
Pulmonary embolism (PE) and use of the oral contraceptive pill (OCP)
Before OCP is prescribed for girls, clinicians should clearly inform them of the risks and recognition of deep vein thrombosis (DVT) and pulmonary embolism (PE). This is particularly important for girls with other risk factors, for example, smoking, obesity, family history of DVT. Clinicians should consider alternative forms of contraception if significant risks exist and be vigilant to the signs and symptoms of DVT and PE.
Hirschsprung’s disease
A negative rectal biopsy does not completely rule out the diagnosis of Hirschsprung’s disease, especially where there is ultra-short segment Hirschsprung’s disease. Careful monitoring and review of infants with symptoms consistent with Hirschsprung’s disease should be undertaken. Where symptoms persist, the possibility of a false negative biopsy should be considered. Hirschsprung’s disease should always be suspected with severe constipation even after a normal rectal biopsy.
20
Metabolic diseases
Children with undifferentiated illness, slow development or failure to thrive will, very rarely, be found to have an inborn error of metabolism or other rare disorder. Suggestive features of metabolic disease include hypoglycaemia, metabolic acidosis, high blood lactate, high serum ammonia or unusual smelling urine. Specialist advice should be sought in cases of undifferentiated illness, slow development or failure to thrive where a diagnosis cannot be made.
Down Syndrome
Serious cardiac disease can be missed on physical examination. An echocardiogram should be performed by a paediatric cardiologist before four weeks of age. Health screening guidelines for children with Down syndrome are available at: <http://www.rch.org.au/genmed/clinical_resources/Screening_for_children_with_Down_Syndrome/>.
Sudden Unexpected Deaths in Infants (SUDI)
Of the 49 Sudden Unexplained Deaths in Infants (SUDI) in 2010 and 2011, 25 were co-sleeping in a bed, on a couch or in an adult’s arms at the time of their death. The Department of Education and Early Childhood Development, in consultation with the Department of Health, is revising their guidance on safe sleeping following recommendations from the State Coroner.
Co-sleeping, particularly for infants who were small for gestational age and/or born prematurely, is considered unsafe. Co-sleeping appears to be especially dangerous when the co-sleeper is affected by sedating drugs (legal or illegal) or alcohol, is a smoker or where the sleep surface is unsafe (for example, sofa or armchair).38
CCOPMM has a modified version of the Sids and Kids recommendations on safe sleeping (How to Sleep your Baby Safely)39:
1. Sleep baby on the back from birth, not on the tummy or side.
2. Sleep baby in a safe cot that meets the Australian Standard (AS2172 in September 2013) with a
firm mattress that is the right size for the cot and is not tilted or elevated.
3. Sleep baby in a one-piece sleeper or a light-weight sleeping bag of the correct size that has a fitted
neck, and armholes or sleeves, and no hood - and with nothing else in the cot (no sheet, blanket,
doona, sheepskin, pillow or soft toy).
4. Keep baby smoke free before birth and after; the risk is increased even if a caregiver goes outside
to smoke.
5. Sleep baby in his or her own cot in the same room as an adult caregiver for the first 6 to 12
months.
6. Breastfeed baby if you can.
7. Offer your baby a dummy to go to sleep for the first 6 to 12 months only. Don't force your baby to
take the dummy, don’t use a neck cord, don't put anything sweet on the dummy, and don't offer it
during awake time.
Unascertained deaths
Arrhythmias
Families of a child who dies suddenly and unexpectedly and where no cause can be found from the investigation at the scene of death or at autopsy should be referred to a paediatric
21
cardiologist to rule out inherited conditions associated with arrhythmia. Testing is currently expensive, but if a gene mutation is detected, cascade screening is possible for extended family members.
Energy drinks
Excess caffeine intake (such as that found in some ‘energy drinks’) has been associated with adverse health events40, especially in children with underlying conditions for which stimulants are contraindicated.35
‘Energy drinks’ have no therapeutic benefit. They commonly include caffeine and other ingredients (such as guarana and herbal sources of caffeine), the effects of which are not well understood and are not adequately regulated.41
The consumption of caffeinated ‘energy drinks’ by children and teenagers, especially combined with alcohol, should be strongly discouraged. Together with other health groups,42 43
the CCOPMM supports tighter regulation of caffeinated ‘energy drinks’ and public health warnings about the risks of these beverages.
Injury
Drowning
Thirteen infants and children drowned in Victoria in 2010 and 2011. The CCOPMM continues to see cases where children have drowned in baths or outside the home in buckets, pools, dams and other bodies of water.
A common problem is momentary distraction or lack of supervision by a responsible adult. Infants and young children should never be left alone in a bathtub and bath seating aids should not be used as substitutes for supervision.
In some cases of death by drowning reviewed by CCOPMM, there were adults in proximity but each thought the other was caring for the child. Responsible adults should maintain communication to confirm who is undertaking the supervision at any given time.
Ongoing education should be provided by health care professionals to parents about the necessity to supervise children in bath tubs and around water at all times.
The Royal Life Saving Society of Australia has developed The Keep Watch Home Pool Safety Campaign, a public safety program consisting of four key actions. When in place, these act as prevention measures to the likelihood of dangerous situations arising. The four actions are:
Supervise Restrict Access Water Awareness Resuscitate
A number of fact sheets are available from:
<http://www.lifesavingvictoria.com.au/www/html/1629-home-pool-safety.asp?intSiteID=1>.
The Royal Life Saving Society describes supervision as constant visual contact, being within arms’ reach of the children. Supervision should be ‘active’ – all of the adult’s attention (older children or siblings are not appropriate supervisors), all of the time, without distractions (such as telephones, doorbells or breaks). It is useful to designate a single adult to be responsible for children for supervision near water, with this responsibility ‘handed on’ as required, so at all times there is a designated adult supervising children with their total attention.

22
Vehicle-related deaths
Infants and children should not be left unsupervised in, or playing around, unlocked or inadequately secured vehicles. Such behaviour can result in:
run/roll over deaths if the hand/parking brake is disengaged
heat-related deaths, even within short periods or on days of moderately warm ambient temperature (>25 C).
Parents should continue to be educated about the dangers of death from heat stroke if children are left in cars. Cars should be left locked and keys kept in a safe place to prevent children from gaining access to a car to play in. See <http://www.kidsafevic.com.au/images/stories/pdfs/hotcars.pdf>.
The number of driveway deaths has given rise to education campaigns (for example, Driveway Safety Campaign)44 that highlight that:
1. Children should always be supervised when cars are moving in a driveway.
2. The driveway should be treated like a road, not an extension of a children’s playing area, and where possible be physically separated by fences.
3. Drivers should check and see that there are no children in the drive area prior to leaving and recognise that all cars have blind spots. The Driveway Safety Campaign reminds drivers never to reverse unless they know where the children are.
Ingestion of medication
All medication, including medication for use by parents and others, should be securely contained in a relevant childproof container, locked up and kept away from children. Medication should not be removed until it is about to be taken.
Recognising serious illness in babies
In November 2011, the Victorian child health record (blue book) was replaced with the My health and development record for all newborn babies, which is an A5 format, bright green, personalised, ring-bound book.
The My health and development record contains information on recognising serious illness in infants, however for information on the recognition of serious illness in older children parents should be encouraged to use the Raising Children Network, which is a national, online, evidence-based parenting resource providing information from newborn to adolescence. Information for parents on recognising serious illness in their babies and young children can be found at <www.raisingchildren.net.au/>.
23
Signs of severe illness in infants
Symptoms and signs suggesting that infants younger than six months old may need admission to hospital can be remembered as ABC – Uncommon: 45
Activity
sleepy – does not wake fully and cry strongly
low activity – moves arms and legs less than normal
low intake – < 50.0% of normal feeds in last 24 hours
Breathing
retraction – moderate or severe chest retraction
Circulation
pallor – sudden onset of persistent generalised pallor
Uncommon
bilious vomiting, grunting, apnoea, fitting
Signs of severe sepsis in children
The features of severe sepsis are non-specific and may include:
fever or hypothermia pallor poor peripheral perfusion (check colour, temperature and capillary refill of hands and feet) tachycardia tachypnoea impaired consciousness hypotension (this may only appear in the terminal stages of sepsis or may only be evident
as postural hypotension). Practitioners should be alert for these features, be aware of the age-specific norms of heart rate, respiratory rate and blood pressure, and pay attention to trends in repeated observations (for example a rising heart rate).
Guide to paediatric resuscitation and clinical practice guidelines
A simple guide to paediatric resuscitation can be downloaded from: < www.rch.org.au/clinicalguide/guideline_index/Resuscitation/>. It is also presented in a small format suitable to attach to an ID badge or keep in a wallet (follow the link to ‘ID badge size resuscitation card’).
Children with signs of shock who require 40 mL/Kg fluid replacement and still have hypotension, poor peripheral perfusion or acidosis should be discussed with a senior emergency or intensive care consultant. In many such children an inotrope or vasopressor (such as noradrenaline) is required. Call PETS (03) 9345 7007 or 1300 137 650.
Guidelines for the management of many acute illnesses in babies and children can be found at The Royal Children’s Hospital clinical practice guideline website: <www.rch.org.au/clinicalguide/>.
24
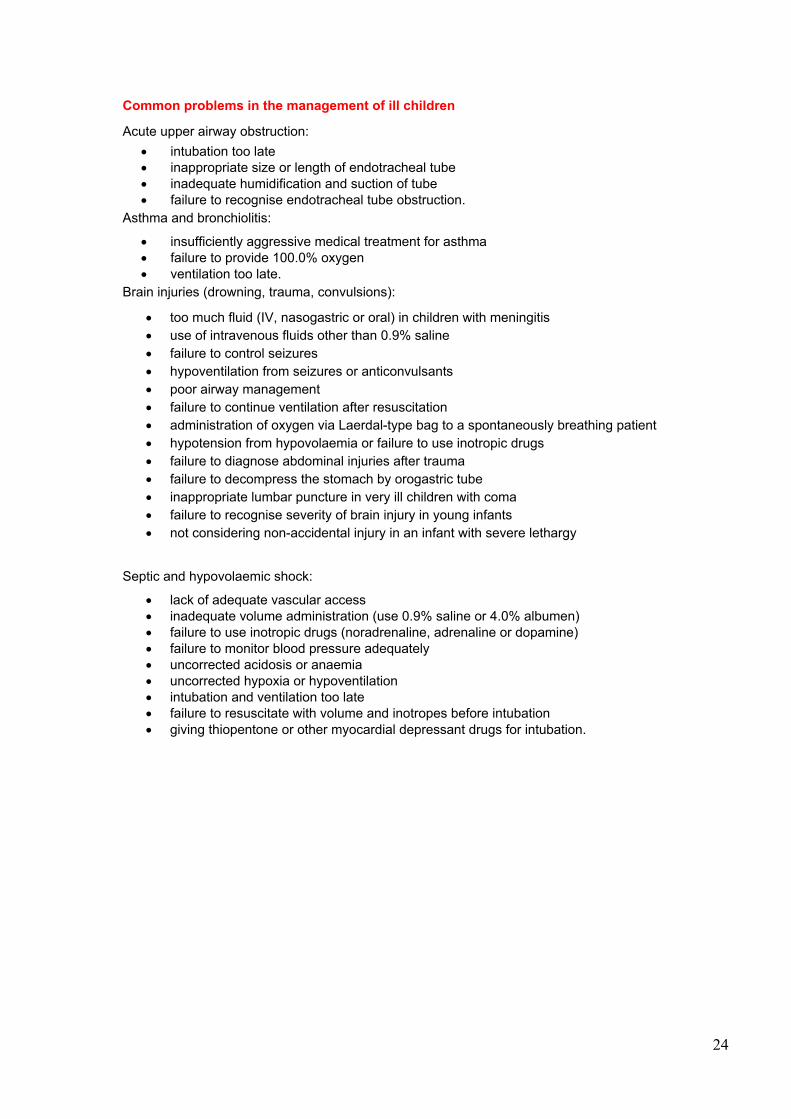
Common problems in the management of ill children
Acute upper airway obstruction:
intubation too late inappropriate size or length of endotracheal tube inadequate humidification and suction of tube failure to recognise endotracheal tube obstruction.
Asthma and bronchiolitis:
insufficiently aggressive medical treatment for asthma failure to provide 100.0% oxygen ventilation too late.
Brain injuries (drowning, trauma, convulsions):
too much fluid (IV, nasogastric or oral) in children with meningitis use of intravenous fluids other than 0.9% saline failure to control seizures hypoventilation from seizures or anticonvulsants poor airway management failure to continue ventilation after resuscitation administration of oxygen via Laerdal-type bag to a spontaneously breathing patient hypotension from hypovolaemia or failure to use inotropic drugs failure to diagnose abdominal injuries after trauma failure to decompress the stomach by orogastric tube inappropriate lumbar puncture in very ill children with coma failure to recognise severity of brain injury in young infants not considering non-accidental injury in an infant with severe lethargy
Septic and hypovolaemic shock:
lack of adequate vascular access inadequate volume administration (use 0.9% saline or 4.0% albumen) failure to use inotropic drugs (noradrenaline, adrenaline or dopamine) failure to monitor blood pressure adequately uncorrected acidosis or anaemia uncorrected hypoxia or hypoventilation intubation and ventilation too late failure to resuscitate with volume and inotropes before intubation giving thiopentone or other myocardial depressant drugs for intubation.
25
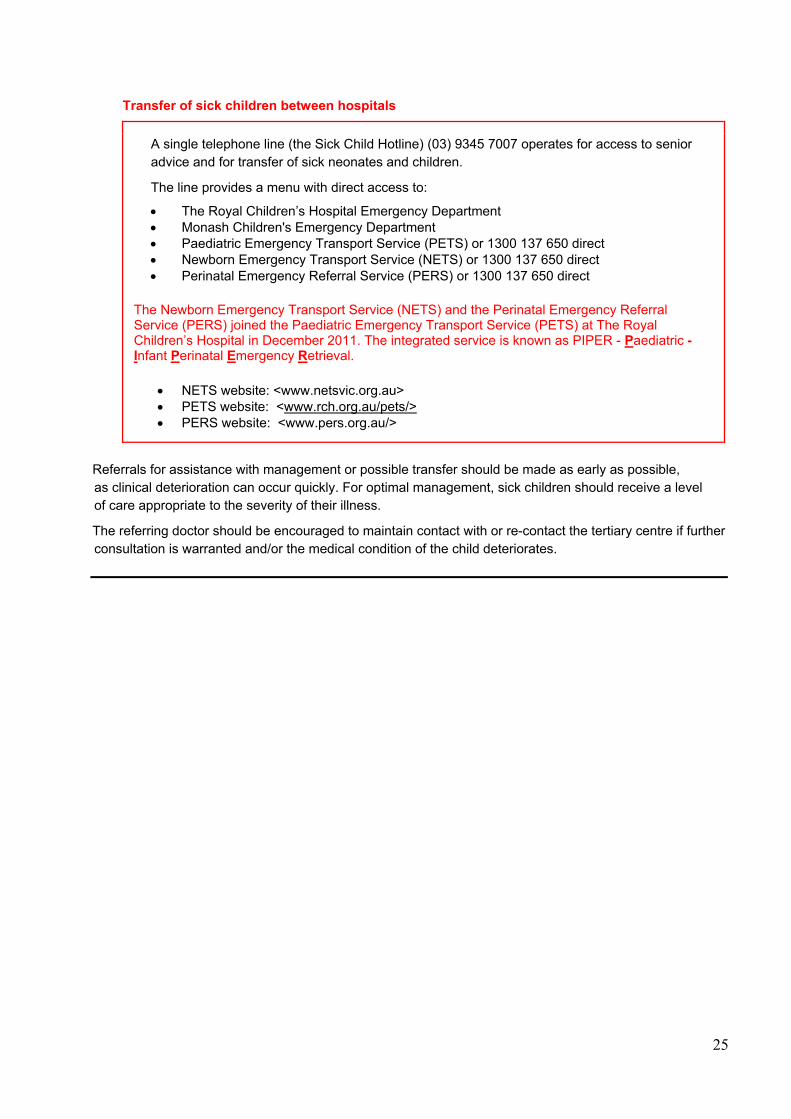
Transfer of sick children between hospitals
A single telephone line (the Sick Child Hotline) (03) 9345 7007 operates for access to senior advice and for transfer of sick neonates and children.
The line provides a menu with direct access to:
The Royal Children’s Hospital Emergency Department Monash Children's Emergency Department Paediatric Emergency Transport Service (PETS) or 1300 137 650 direct Newborn Emergency Transport Service (NETS) or 1300 137 650 direct Perinatal Emergency Referral Service (PERS) or 1300 137 650 direct
The Newborn Emergency Transport Service (NETS) and the Perinatal Emergency Referral Service (PERS) joined the Paediatric Emergency Transport Service (PETS) at The Royal Children’s Hospital in December 2011. The integrated service is known as PIPER - Paediatric -Infant Perinatal Emergency Retrieval.
NETS website: <www.netsvic.org.au> PETS website: <www.rch.org.au/pets/> PERS website: <www.pers.org.au/>
Referrals for assistance with management or possible transfer should be made as early as possible, as clinical deterioration can occur quickly. For optimal management, sick children should receive a level of care appropriate to the severity of their illness.
The referring doctor should be encouraged to maintain contact with or re-contact the tertiary centre if further consultation is warranted and/or the medical condition of the child deteriorates.
26
Figure 1.1: Births and deaths flow chart, Victoria, 2010
27
Figure 1.2: Births and deaths flow chart, Victoria, 2011
28
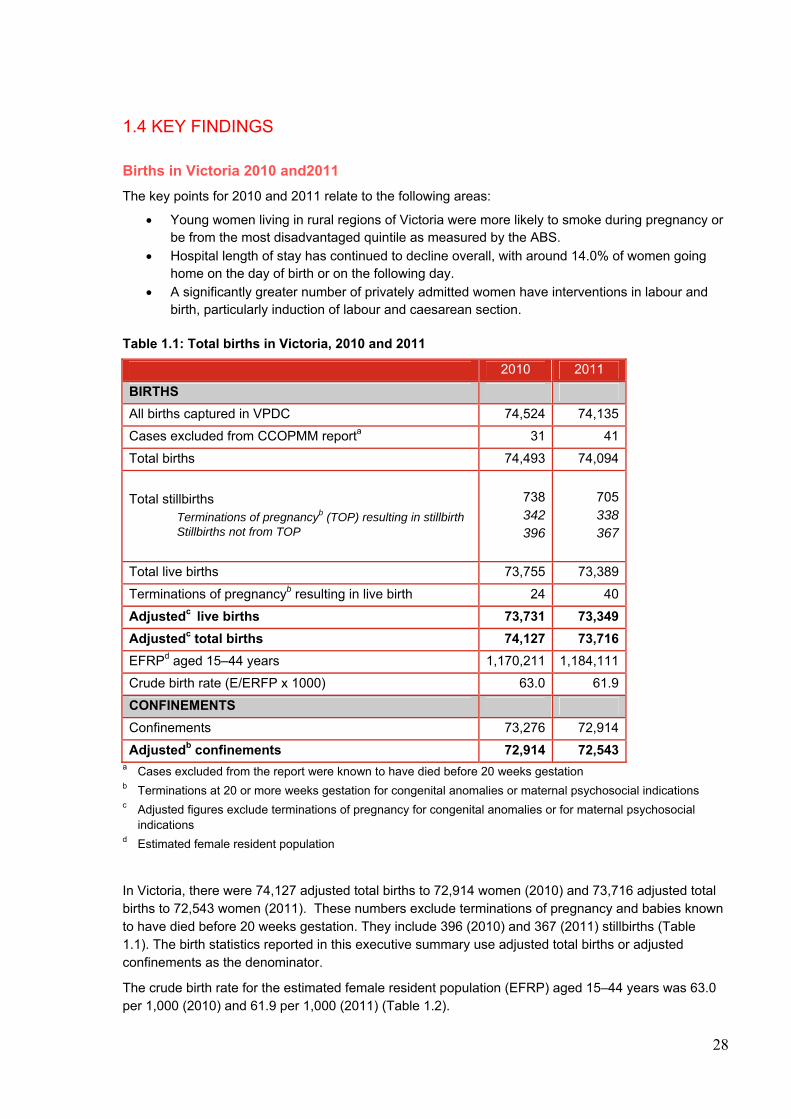
1.4 KEY FINDINGS
Births in Victoria 2010 and2011
The key points for 2010 and 2011 relate to the following areas:
Young women living in rural regions of Victoria were more likely to smoke during pregnancy or be from the most disadvantaged quintile as measured by the ABS.
Hospital length of stay has continued to decline overall, with around 14.0% of women going home on the day of birth or on the following day.
A significantly greater number of privately admitted women have interventions in labour and birth, particularly induction of labour and caesarean section.
Table 1.1: Total births in Victoria, 2010 and 2011
2010 2011
BIRTHS
All births captured in VPDC 74,524 74,135
Cases excluded from CCOPMM reporta 31 41
Total births 74,493 74,094
Total stillbirths Terminations of pregnancyb (TOP) resulting in stillbirth Stillbirths not from TOP
738342396
705 338 367
Total live births 73,755 73,389
Terminations of pregnancyb resulting in live birth 24 40
Adjustedc live births 73,731 73,349
Adjustedc total births 74,127 73,716
EFRPd aged 15–44 years 1,170,211 1,184,111
Crude birth rate (E/ERFP x 1000) 63.0 61.9
CONFINEMENTS
Confinements 73,276 72,914
Adjustedb confinements 72,914 72,543 a Cases excluded from the report were known to have died before 20 weeks gestation b Terminations at 20 or more weeks gestation for congenital anomalies or maternal psychosocial indications c Adjusted figures exclude terminations of pregnancy for congenital anomalies or for maternal psychosocial
indications d Estimated female resident population
In Victoria, there were 74,127 adjusted total births to 72,914 women (2010) and 73,716 adjusted total births to 72,543 women (2011). These numbers exclude terminations of pregnancy and babies known to have died before 20 weeks gestation. They include 396 (2010) and 367 (2011) stillbirths (Table 1.1). The birth statistics reported in this executive summary use adjusted total births or adjusted confinements as the denominator.
The crude birth rate for the estimated female resident population (EFRP) aged 15–44 years was 63.0 per 1,000 (2010) and 61.9 per 1,000 (2011) (Table 1.2).
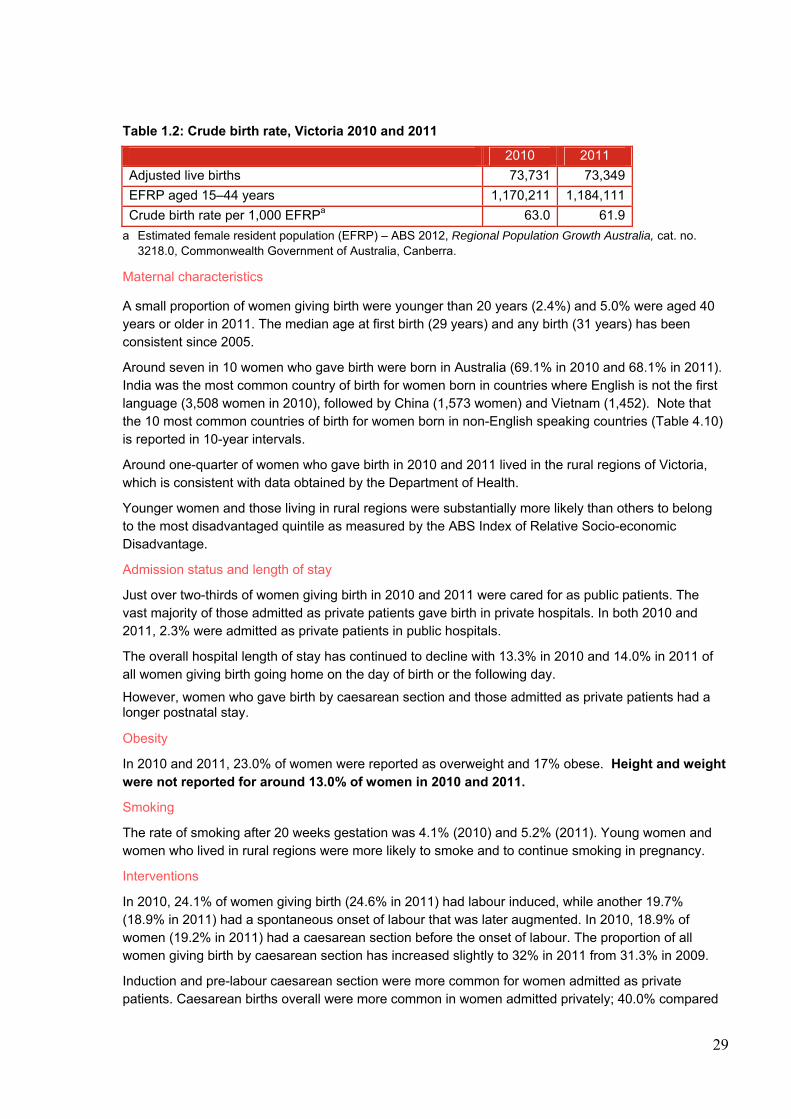
29
Table 1.2: Crude birth rate, Victoria 2010 and 2011
2010 2011
Adjusted live births 73,731 73,349
EFRP aged 15–44 years 1,170,211 1,184,111
Crude birth rate per 1,000 EFRPa 63.0 61.9
a Estimated female resident population (EFRP) – ABS 2012, Regional Population Growth Australia, cat. no. 3218.0, Commonwealth Government of Australia, Canberra.
Maternal characteristics
A small proportion of women giving birth were younger than 20 years (2.4%) and 5.0% were aged 40 years or older in 2011. The median age at first birth (29 years) and any birth (31 years) has been consistent since 2005.
Around seven in 10 women who gave birth were born in Australia (69.1% in 2010 and 68.1% in 2011). India was the most common country of birth for women born in countries where English is not the first language (3,508 women in 2010), followed by China (1,573 women) and Vietnam (1,452). Note that the 10 most common countries of birth for women born in non-English speaking countries (Table 4.10) is reported in 10-year intervals.
Around one-quarter of women who gave birth in 2010 and 2011 lived in the rural regions of Victoria, which is consistent with data obtained by the Department of Health.
Younger women and those living in rural regions were substantially more likely than others to belong to the most disadvantaged quintile as measured by the ABS Index of Relative Socio-economic Disadvantage.
Admission status and length of stay
Just over two-thirds of women giving birth in 2010 and 2011 were cared for as public patients. The vast majority of those admitted as private patients gave birth in private hospitals. In both 2010 and 2011, 2.3% were admitted as private patients in public hospitals.
The overall hospital length of stay has continued to decline with 13.3% in 2010 and 14.0% in 2011 of all women giving birth going home on the day of birth or the following day.
However, women who gave birth by caesarean section and those admitted as private patients had a longer postnatal stay.
Obesity
In 2010 and 2011, 23.0% of women were reported as overweight and 17% obese. Height and weight were not reported for around 13.0% of women in 2010 and 2011.
Smoking
The rate of smoking after 20 weeks gestation was 4.1% (2010) and 5.2% (2011). Young women and women who lived in rural regions were more likely to smoke and to continue smoking in pregnancy.
Interventions
In 2010, 24.1% of women giving birth (24.6% in 2011) had labour induced, while another 19.7% (18.9% in 2011) had a spontaneous onset of labour that was later augmented. In 2010, 18.9% of women (19.2% in 2011) had a caesarean section before the onset of labour. The proportion of all women giving birth by caesarean section has increased slightly to 32% in 2011 from 31.3% in 2009.
Induction and pre-labour caesarean section were more common for women admitted as private patients. Caesarean births overall were more common in women admitted privately; 40.0% compared
30
with 28.0% of women admitted as public patients. Instrumental vaginal births were also more common in women admitted as private patients.
Epidural analgesia to relieve pain in labour was used by 29.0% of all women who experienced labour in 2010 (28.0% in 2011). Just over half of all instrumental vaginal births were performed under epidural or spinal anaesthesia. Around one-third used local anaesthetic to the perineum only or no anaesthesia. The vast majority of caesarean sections were carried out under epidural or spinal anaesthesia, with 6% using a general anaesthetic. Third and fourth degree perineal lacerations were more commonly reported for first births and in women admitted as public patients. Episiotomy was performed more frequently in women admitted as private patients and first births. One-quarter of women having a first birth had a blood loss of 500 mL or more in 2011. This includes 1.5% who lost 1,500 mL or more. Fewer than 2.0% of women were not given a prophylactic oxytocic in the third stage of labour. Breastfeeding Ninety-four per cent of women initiated breastfeeding. More than one-quarter of term babies whose mother initiated breastfeeding also had infant formula in hospital, whether by bottle, cup, gavage or other means. This was more common in private hospitals (in 2011, 36.3% in private hospitals compared with 24.8% in public hospitals). Giving formula in hospital is known to be associated with early weaning.46 Of the mothers who had a live birth at 37 or more weeks gestation and who attempted to breastfeed or express breast milk, 79.0% were successfully breastfeeding at discharge, that is, they gave the last feed directly and entirely from the breast. This was more often achieved in public than private hospitals (80.9% in public hospitals and 75.3% in private hospitals in 2011). Preterm and post-term The proportion of babies born before 37 weeks gestation has remained consistent at around 8.0%. The proportion born at 42 or more weeks gestation is very low and has fallen to 1.0% in 2011.
Multiple birth Twins made up a slightly smaller proportion of all births than in 2009. Triplets and quadruplets remained very rare. Twins were more common in older mothers. Twins were more likely than singletons to be born before 37 weeks gestation.
Aboriginal Victorians The proportion of women giving birth who are Aboriginal has continued to increase (1.3% of all women giving birth in 2011). Their babies were more likely than others to be born preterm and to have low birth weight. Since 2009, Aboriginal status of the baby is collected as well as that of the mother. This results in approximately 400 additional Aboriginal babies being identified compared to asking only about maternal Aboriginal status.
In the three-year triennium 2009–2011, the risk of perinatal mortality was two times higher for infants born to Aboriginal women compared to non-Aboriginal infants. This risk has remain unchanged since the previous triennium 2007-2009 (a rolling average includes the first year of the previous triennium).
31
Home birth
A small proportion of women planned to give birth at home under the care of a private midwife (0.4% of all confinements were privately planned home births). Only 0.1% of all confinements occurred through a public hospital home birth program. Birth centres were the place of birth for 1.2% of confinements in 2010 and 2011.
Maternal deaths 2010 and 2011
The key points for 2010 and 2011 relate to the following areas:
The maternal mortality rate was 9.5 per 100,000 in the 2006–08 triennium and 8.3 per 100,000 births for the 2009–11 triennium.
Clinicians and health services should adequately assess pregnant women for psychosocial factors and mental health disorders early in pregnancy and again in late pregnancy. Suicide continues to be a cause of death in women within or around the first year of birth. Health services should have effective pathways to refer or manage women with mental health disorders or risk factors.
Domestic violence continues to be a theme in the cause of death for women within or around the first year of birth. Clinicians should routinely ask women about domestic violence in a secure and safe manner, using appropriate skills. Health services should ensure clinicians have access to ongoing education on domestic violence screening and effective pathways for referral and management when domestic violence is disclosed.
The number of cases associated with post-partum haemorrhage or thrombo-embolic disease has declined.
Health services should ensure they have protocols for the adequate management or referral of pregnant women who are obese, particularly for women residing in rural areas.
2010
There were 10 maternal deaths in 2010 (three direct deaths, three indirect deaths, three incidental deaths and one late indirect maternal death). The maternal mortality ratio (MMR)47 for 2010 was 8.2 per 100,000 confinements. The causes of direct maternal deaths were:
pulmonary thromboembolism in the setting of morbid obesity catastrophic haemorrhage from placenta increta massive intraventricular haemorrhage in the setting of pre-eclampsia.
The causes of indirect deaths were:
ruptured splenic artery embolism Type A aortic dissection in pregnancy suicide.
The three incidental deaths were: stab injuries to chest asphyxia (neck compression) undetermined.
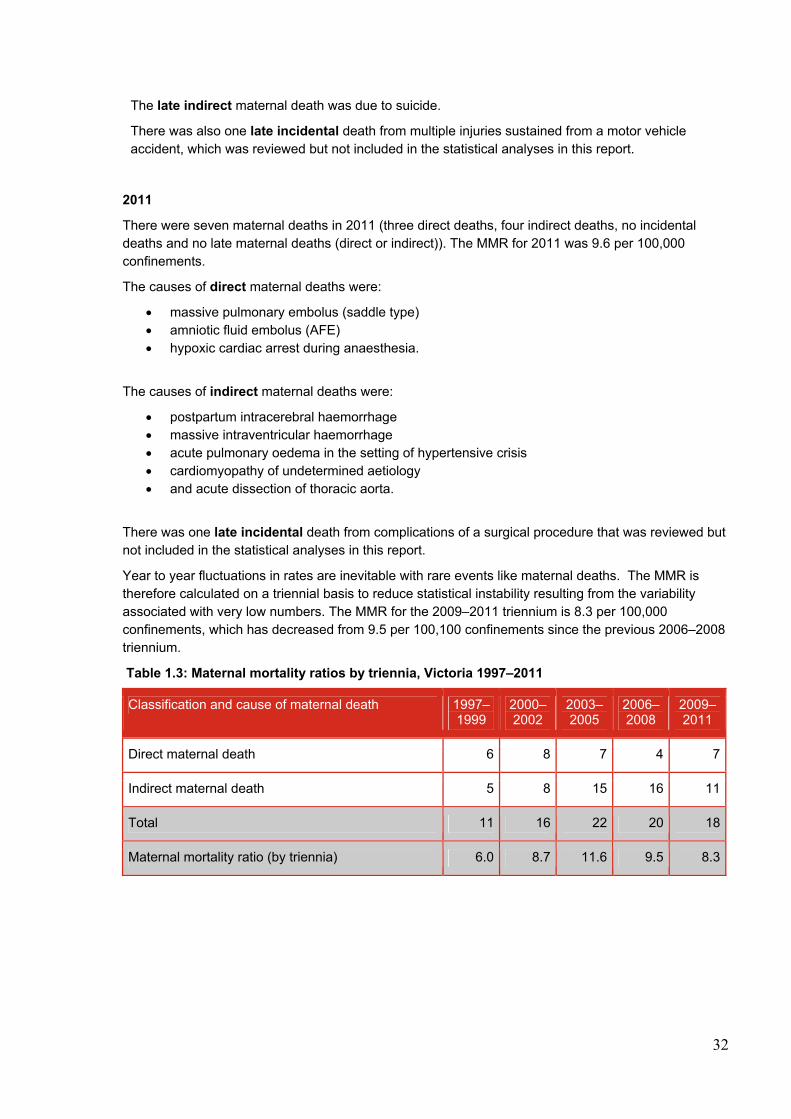
32
The late indirect maternal death was due to suicide.
There was also one late incidental death from multiple injuries sustained from a motor vehicle accident, which was reviewed but not included in the statistical analyses in this report.
2011
There were seven maternal deaths in 2011 (three direct deaths, four indirect deaths, no incidental deaths and no late maternal deaths (direct or indirect)). The MMR for 2011 was 9.6 per 100,000 confinements.
The causes of direct maternal deaths were:
massive pulmonary embolus (saddle type) amniotic fluid embolus (AFE) hypoxic cardiac arrest during anaesthesia.
The causes of indirect maternal deaths were:
postpartum intracerebral haemorrhage massive intraventricular haemorrhage acute pulmonary oedema in the setting of hypertensive crisis cardiomyopathy of undetermined aetiology and acute dissection of thoracic aorta.
There was one late incidental death from complications of a surgical procedure that was reviewed but not included in the statistical analyses in this report.
Year to year fluctuations in rates are inevitable with rare events like maternal deaths. The MMR is therefore calculated on a triennial basis to reduce statistical instability resulting from the variability associated with very low numbers. The MMR for the 2009–2011 triennium is 8.3 per 100,000 confinements, which has decreased from 9.5 per 100,100 confinements since the previous 2006–2008 triennium.
Table 1.3: Maternal mortality ratios by triennia, Victoria 1997–2011
Classification and cause of maternal death 1997–1999
2000–2002
2003–2005
2006–2008
2009–2011
Direct maternal death 6 8 7 4 7
Indirect maternal death 5 8 15 16 11
Total 11 16 22 20 18
Maternal mortality ratio (by triennia) 6.0 8.7 11.6 9.5 8.3
33
Perinatal deaths 2010 and 2011
The key points for 2010 and 2011 relate to the following areas:
The perinatal mortality rate (PMR) has decreased from 13.6 per 1,000 births in 2009 to 12.5 per 1,000 births in 2011. When adjusted for terminations of pregnancy for maternal psychosocial reasons, the 2011 PMR is 10.1 per 1,000 births. When compared with the PMR of the other Australian States and Territories (according to the Australian Institute of Health and Welfare (AIHW) definition used for maternity reporting), Victoria’s rates of 13.3 in 2010 and 12.9 in 2011 does not take into account the differing rates of terminations of pregnancy for psychosocial indications in the other jurisdictions.
Sixteen stillbirths of normally formed infants at or after 37 weeks gestation were ascribed to peripartum hypoxia, which is mostly avoidable. Following review of all of these stillbirths by the CCOPMM stillbirth subcommittee, 13 (81.3%) were considered to have had sub-optimal care factors that were likely to have contributed to the death.
Thirty-one neonatal deaths of normally formed infants at or after 37 weeks gestation were ascribed to peripartum hypoxia. Following review of all of these cases by the CCOPMM neonatal mortality and morbidity subcommittee, 20 (64.5%) were considered to have had sub-optimal care factors that were likely to have contributed to the death.
Importantly, the majority of perinatal deaths ascribed to peripartum hypoxia are neonatal deaths.
‘Unexplained antepartum death’ was the third most frequent cause of perinatal death in both 2010 and 2011. There were 120 (12.3%) stillbirths in this category in 2010 and 119 stillbirths 12.8% in 2011. Postmortem examination was conducted in 50 (41.7%) of these stillbirths in 2010 and 72 (60.5%) of these stillbirths in 2011. This represents a significant increase in postmortem examination in 2011. The placenta was examined histologically in 110 (91.7%) in 2010 and 109 stillbirths (91.6%) in 2011.
Expert perinatal autopsy is a very important component in the investigation of perinatal death and has been reported to provide significant additional information in 26–51% of stillbirths. Therefore, a proportion of the stillbirths for whom classification in this category occurred in the absence of a postmortem examination and/or placental histology, should be considered as under-investigated (rather than unexplained). An increase in the rates of postmortem examination will contribute to the accuracy of classification in the third largest cause of perinatal deaths.
Of the 74,493 births in 2010 (74,094 in 2011), 738 were stillborn (705 in 2011) and of the 73,755 live births (73,389 in 2011), 252 infants died within 28 days of life (241 in 2011).
The PMR was 13.1 per 1,000 births in 2010 (12.5 per 1,000 births in 2011) compared with 13.6 for 2009. After excluding terminations of pregnancy for maternal psychosocial indications, the adjusted .was 10.5 per 1,000 births in 2010 (10.1 per 1,000 births in 2011) compared with 10.7 per 1,000 births in 2009. Adjusted PMRs exclude terminations of pregnancy for maternal psychosocial indications to allow for better interpretation of the PMR as a public health indicator and for comparison with other jurisdictions.
The stillbirth rate was 9.9 per 1,000 births in 2010 (9.5 per 1,000 births in 2011) compared with 10.5 per 1,000 births in 2009. Terminations of pregnancy for maternal psychosocial indications comprised 25.9% of stillbirths in 2010 (26% in 2011). When adjusted for these terminations, the stillbirth rate was 7.4 per 1,000 births in 2010 (7.1 per 1,000 births in 2011). The other leading causes of stillbirth for both 2010 and 2011 were terminations for congenital anomalies (20.5% in 2010 and 22.0% in 2011) and unexplained stillbirth (16.3% in 2010 and 16.9% in 2011).
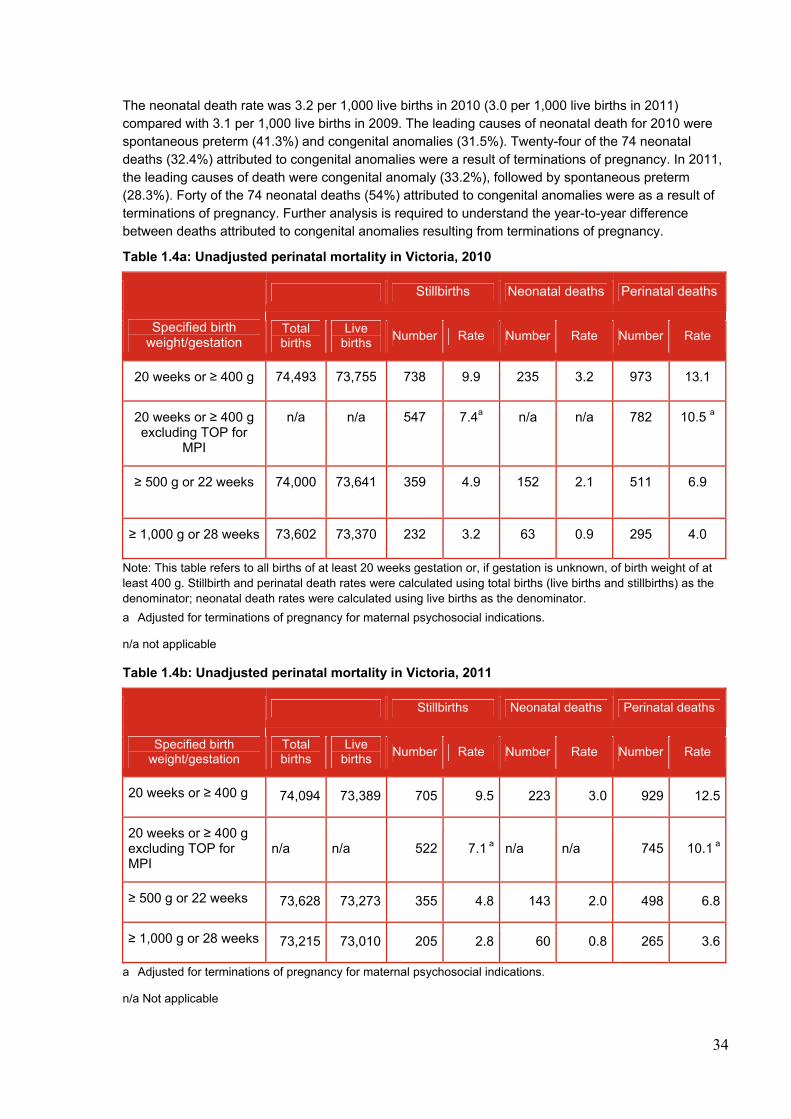
34
The neonatal death rate was 3.2 per 1,000 live births in 2010 (3.0 per 1,000 live births in 2011) compared with 3.1 per 1,000 live births in 2009. The leading causes of neonatal death for 2010 were spontaneous preterm (41.3%) and congenital anomalies (31.5%). Twenty-four of the 74 neonatal deaths (32.4%) attributed to congenital anomalies were a result of terminations of pregnancy. In 2011, the leading causes of death were congenital anomaly (33.2%), followed by spontaneous preterm (28.3%). Forty of the 74 neonatal deaths (54%) attributed to congenital anomalies were as a result of terminations of pregnancy. Further analysis is required to understand the year-to-year difference between deaths attributed to congenital anomalies resulting from terminations of pregnancy.
Table 1.4a: Unadjusted perinatal mortality in Victoria, 2010
Specified birth weight/gestation
Stillbirths Neonatal deaths Perinatal deaths
Total births
Live births
Number Rate Number Rate Number Rate
20 weeks or ≥ 400 g 74,493 73,755 738 9.9 235 3.2 973 13.1
20 weeks or ≥ 400 g excluding TOP for
MPI
n/a n/a 547 7.4a n/a n/a 782 10.5 a
≥ 500 g or 22 weeks 74,000 73,641
359 4.9 152 2.1 511 6.9
≥ 1,000 g or 28 weeks 73,602 73,370 232 3.2 63 0.9 295 4.0
Note: This table refers to all births of at least 20 weeks gestation or, if gestation is unknown, of birth weight of at least 400 g. Stillbirth and perinatal death rates were calculated using total births (live births and stillbirths) as the denominator; neonatal death rates were calculated using live births as the denominator.
a Adjusted for terminations of pregnancy for maternal psychosocial indications.
n/a not applicable
Table 1.4b: Unadjusted perinatal mortality in Victoria, 2011
Specified birth weight/gestation
Stillbirths Neonatal deaths Perinatal deaths
Total births
Live births
Number Rate Number Rate Number Rate
20 weeks or ≥ 400 g 74,094 73,389 705 9.5 223 3.0 929 12.5
20 weeks or ≥ 400 g excluding TOP for MPI
n/a n/a 522 7.1 a n/a n/a 745 10.1 a
≥ 500 g or 22 weeks 73,628 73,273 355 4.8 143 2.0 498 6.8
≥ 1,000 g or 28 weeks 73,215 73,010 205 2.8 60 0.8 265 3.6
a Adjusted for terminations of pregnancy for maternal psychosocial indications.
n/a Not applicable
35
The adjusted PMR for multiple births was 37.7 per 1,000 in 2010 (39.3 per 1,000 in 2011) compared with 9.7 per 1,000 singleton births (9.2 per 1,000 singleton births in 2011). This represents a four-fold increase in risk of perinatal death for women with a multiple pregnancy.
The neonatal mortality rate (NMR) (17.7 per 1,000 multiple births in 2010 and 17.6 per 1,000 multiple births in 2011) was 6.5 times higher in 2010 (6.7 in 2011) than singleton live births (2.7 per 1,000 births in 2010 and 2.6 per 1,000 births in 2011).
The risk of perinatal mortality48 in the Aboriginal49 population has decreased since the years 2001 to 2003. In the three years from 2009 to 2011, the risk of perinatal mortality was two times higher (RR 2.1, CI 1.6–2.8) for Aboriginal women relative to non-Aboriginal women (adjusted PMR of 21.2 per 1,000 births for Aboriginal women compared with 10.4 per 1,000 births to non-Aboriginal women). During 2009 to 2011, the NMR (5.8 per 1,000 live births) was 1.9 times higher than for non-Aboriginal births.
In 2010, there were 261 (253 in 2011) perinatal deaths.50 These were classified according to the PSANZ PDC, which identifies maternal or fetal antecedents to death. A summary of results against each major PDC category is presented below.
Congenital anomaly
Congenital anomalies accounted for 26.8% of deaths in 2010 (27.3% in 2011). In 2010, chromosomal anomalies accounted for 86 deaths (56 in 2011), multiple anomalies for 35 deaths (42 in 2011), central nervous system anomalies for 49 deaths (59 in 2011) and cardiovascular anomalies for 31 deaths (41 in 2011).
Perinatal infection
Thirteen deaths (1.3% in 2010 and 1.8% in 2011) were due to infection, five were neonatal deaths (six in 2011). The most common specified infective organisms over the two years were cytomegalovirus (n = 6), Group B streptococcus (n = 6), Escherichia coli (n = 5) and parvovirus (n = 3).
Hypertension
Maternal hypertension was the cause of 26 deaths (2.7%) in 2010 and 16 deaths (1.7%) in 2011. There were 19 stillbirths (12 in 2011) and seven neonatal deaths (four in 2011). The majority occurred in mothers with pre-eclampsia.
Antepartum haemorrhage (APH)
There were 54 deaths due to antepartum haemorrhage in 2010 (61 in 2011). Of these, 45 were due to placental abruption (48 in 2011). Vasa praevia, placenta praevia and other APH featured in the other deaths.
Maternal conditions
In 2010, 18 deaths (28 in 2011) were attributed to diabetes/gestational diabetes, maternal injury, antiphospholipid syndrome, maternal sepsis, obstetric cholestasis and other specified maternal conditions.
Specific perinatal conditions
Twin-to-twin transfusion syndrome accounted for the majority of deaths in this group (20 deaths in 2010 and 19 deaths in 2011). Other common causes include antepartum cord complications, fetomaternal haemorrhage, uterine anomalies, idiopathic hydrops and birth trauma.
Hypoxic peripartum death
In 2010, there were 33 deaths (22 in 2011) associated with peripartum hypoxia. Eighteen of these
36
deaths had evidence of non-reassuring fetal status (15 in 2011). Four deaths in 2010 followed uterine rupture and three were associated with an unspecified intrapartum complication. In 2011, one death followed cord prolapse and one was associated with an unspecified intrapartum complication.
In 2010 and 2011, 16 stillbirths of normally formed infants at or after 37 weeks gestation were ascribed to peripartum hypoxia, which is mostly preventable. Following review of all of these stillbirths by the CCOPMM stillbirth subcommittee, 13 (81.3%) were considered to have had sub-optimal care factors that were likely to have contributed to the death.
In 2010 and 2011, thirty-one neonatal deaths of normally formed infants at or after 37 weeks gestation were ascribed to peripartum hypoxia. Following review of all of these cases by the CCOPMM neonatal mortality and morbidity subcommittee, 20 (64.5%) were considered to have had sub-optimal care factors that were likely to have contributed to the death.
Importantly, the majority of perinatal deaths ascribed to peripartum hypoxia are neonatal deaths.
Fetal growth restriction
FGR was the main cause of death for 54 cases in 2010, 53 stillbirths and 1 neonatal death. In 2011, there were 65 cases, 55 resulting in stillbirths and 10 neonatal deaths.
Spontaneous preterm birth
In 2010, there were 151 perinatal deaths associated with spontaneous preterm birth, comprising normally formed and appropriately grown babies before 37 weeks gestation. Of these, 54 stillbirths and 97 were neonatal deaths. Of all deaths in this category, 94.0% were between 20 and 27 weeks gestation. Of all perinatal deaths associated with spontaneous preterm birth, 35.8% were associated with membrane rupture of 24 hours or more.
In 2011, there were 102 perinatal deaths associated with spontaneous preterm birth, 39 stillbirths and 63 neonatal deaths. One hundred per cent were between 20 and 27 weeks gestation. Of all perinatal deaths associated with spontaneous preterm birth, 26.5% were associated with membrane rupture of 24 hours or more.
Unexplained antepartum death
Unexplained antepartum death was the third most frequent cause of perinatal death in both 2010 and 2011. There were 120 (12.3%) stillbirths in this category in 2010 and 119 stillbirths 12.8% in 2011. Postmortem examination was conducted in 50 (41.7%) of these stillbirths in 2010 and 72 (60.5%) of these stillbirths in 2011. This represents a significant increase in postmortem examination in 2011. The placenta was examined histologically in 110 (91.7%) in 2010 and 109 stillbirths (91.6%) in 2011.
Expert perinatal autopsy is a very important component in the investigation of perinatal death and has been reported to provide significant additional information in 26.0–51.0% of stillbirths. Therefore, a proportion of the stillbirths for whom classification in this category occurred in the absence of a postmortem examination and/or placental histology should be considered as under-investigated (rather than unexplained). An increase in the rates of postmortem examination will contribute to the accuracy of classification in the third largest cause of perinatal deaths.
No obstetric antecedent
No obstetric antecedent was identified in four neonatal deaths in 2010 and four neonatal deaths in 2011. Specified causes included SIDS and postnatally acquired infection. Two neonatal deaths in 2011 were attributed to the latter.
Deaths of post-neonatal infants, children and adolescents 2010 and 2011
The key points for 2010 and 2011 relate to the following areas:
37
There have been decreases in deaths in all age groups 28 days to 14 years since CCOPMM reporting began in 1985.
Since 1985, there have been decreases in all major categories of deaths (determined at birth, SIDS/SUDI, unintentional injury and acquired disease), except in undetermined causes of death (a new category of death from 2002) and intentional injury (where numbers have stayed relatively stable on low numbers).
Victoria compares well with other Australian jurisdictions in rates of death across all age categories. 51
Although the rates of under-five mortality52 and infant mortality53 54 have decreased, the rate of decrease in Victoria is slower than other comparable OECD countries.
Inadequate recognition of acute deterioration or serious illness, such as severe bacterial sepsis and non-aggressive treatment of asthma in infants and children. In the cases reviewed, this is often due to a lack of paediatric involvement in the assessment of children in acute health settings, such as emergency departments.
Suicide following inadequate follow up of adolescents with significant mental health issues who failed to attend appointments.
Sudden unexplained deaths in infants (SUDI) associated with the sharing of a sleep surface (co-sleeping). Co-sleeping with infants, especially young infants aged less than 12 weeks, those small for gestational age or ex-premature infants is considered unsafe. Co-sleeping appears to be especially dangerous when the co-sleeper is affected by sedating drugs (legal or illegal) or alcohol, is a smoker or where the sleep surface is unsafe (for example, sofas or armchair).55
Unintentional injury, such as drowning, vehicle-related deaths and ingestion of medications. Common themes arising from the review of these cases revealed momentary distraction or lack of supervision by a responsible adult or misunderstanding between one or more responsible adults about who the lead supervisor was at the time of the death. Children continue to die from being left in a vehicle, even for short periods on hotter days or on moderately warm days (>25°C).
‘Energy drinks’ containing excess caffeine and other stimulants, which have been found to be associated with adverse health events, especially in children with underlying conditions for which stimulants are contraindicated.
2010
There were 257 deaths of children aged 28 days to 17 years in 2010, 93 post-neonatal infant deaths and 164 deaths in children aged 1–17 years. The leading causes of death across the age group 28 days to 17 years in 2010 were:
• congenital anomalies (68 deaths) • malignancy (42 deaths) • conditions determined at birth (23 deaths) • SUDI (21) • motor vehicle accidents (19 deaths) • undetermined deaths (18 deaths) • suicide (15 deaths).
There were 93 post-neonatal infant deaths: 36 (39.0%) as a consequence of congenital anomalies, 21 (23.0%) from sudden infant death syndrome (SIDS), and19 (20.0%) from other conditions determined at birth (for example prematurity, birth asphyxia).
Twenty-one post-neonatal infants died from SIDS. (In addition, one neonate died from SIDS in 2010).
38
The number of deaths from SIDS has fallen from 128 in 1985.
The infant mortality rate (IMR) was 4.2 per 1,000 live births.
Forty-nine children aged 1–4 years died. The death rate for children aged 1–4 years was 17.6 per 100,000 population. The leading causes of death for this age group were malignancy and congenital anomalies (both 20.0%).
Forty-one children aged 5–9 years died. The death rate for children aged 5–9 years was 12.6 per 100,000 population. The leading causes of death for this age group were malignancy (39.0%) and congenital anomalies (27.0%).
Twenty-six children aged 10–14 years died. The death rate for children aged 10–14 years was 7.9 per 100,000 population. The leading causes of death for this age group were malignancy (23.0%) and congenital anomalies, motor vehicle accidents and suicide (each 15.0%).
Forty-eight adolescents aged 15–17 years died. The death rate for adolescents aged 15–17 years was 23.0 per 100,000 population. The leading causes of death for this age group were suicide (23.0%) and malignancy (19.0%).
2011
There were 217 deaths of children aged 28 days to 17 years in 2011, 60 post-neonatal infant deaths and 157 deaths in children aged 1–17 years. The leading causes of death across the age group 28 days to 17 years in 2011 were:
congenital anomalies (46 deaths) malignancy (32 deaths) motor vehicle accidents (31 deaths) sudden unexpected death in infancy (19 deaths) undetermined deaths (17 deaths) conditions determined at birth and suicide ( each15 deaths).
There were 60 post-neonatal infant deaths: 23 (38.0%) as a consequence of congenital anomalies, 19 (32.0%) from SIDS and nine (15.0%) from other conditions determined at birth (for example prematurity, birth asphyxia).
Nineteen post-neonatal infants died from SIDS. (In addition, two neonates died from SIDS in 2011). The number of deaths from SIDS has fallen from 128 in 1985.
The infant mortality rate was 3.3 per 1,000 live births.
Forty-nine children aged 1–4 years died. The death rate for children aged 1–4 years was 17.4 per 100,000 population. The leading causes of death for this age group were congenital anomalies and motor vehicle accidents (both 20.0%).
Thirty-one children aged 5–9 years died. The death rate for children aged 5–9 years was 9.3 per 100,000 population. The leading causes of death for this age group were malignancy (39.0%) and motor vehicle accidents (23.0%).
Twenty-six children aged 10–14 years died. The death rate for children aged 10–14 years was 7.9 per 100,000 population. The leading causes of death for this age group were congenital anomalies (23.0%) and malignancy (15.0%).
Fifty-one adolescents aged 15–17 years died. The death rate for adolescents aged 15–17 years was 24.5 per 100,000 population. The leading causes of death for this age group were suicide (26.0%) and motor vehicle accidents (24.0%).
39
2. INTRODUCTION
2.1 FUNCTIONS OF THE CONSULTATIVE COUNCIL ON OBSTETRIC AND PAEDIATRIC MORTALITY AND MORBIDITY
The Consultative Council on Obstetric and Paediatric Mortality and Morbidity (CCOPMM) was established in 1962 under the Health Act 1958 and now functions under the Public Health and Wellbeing Act 2008 (the Act). CCOPMM is the advisory body to the Minister for Health on maternal, perinatal and paediatric mortality and morbidity. The primary role of CCOPMM is to review all maternal, perinatal and paediatric deaths in Victoria in order to consider the clinical features of each case, assess preventability and make recommendations to the health system arising from the review of cases and best available evidence. CCOPMM works closely with the Victorian Department of Health in its role to advise on strategies to reduce avoidable mortality and morbidity.
CCOPMM consists of 12 members appointed by the Minister (see section 2.2) and four substantive subcommittees:
• Maternal Mortality and Morbidity Subcommittee
• Stillbirth Subcommittee
• Neonatal Mortality and Morbidity Subcommittee
• Child and Adolescent Mortality and Morbidity Subcommittee
Information provided to CCOPMM is privileged by legislation and not accessible by any third party, including the courts. Provisions for the release of data and information for research purposes and in the public interest are contained within the Act, however CCOPMM is restricted in how, and to whom, data may be supplied.
Under the Act, the functions of CCOPMM are to:
a) Conduct study, research and analysis into the incidence and causes in Victoria of maternal deaths, stillbirths and the deaths of children;
b) Conduct study, research and analysis into the incidence and causes of obstetric and paediatric morbidity;
c) Conduct a perinatal data collection unit for the purpose of –
i. collecting, studying, researching and interpreting information on and in relation to births in Victoria;
ii. identifying and monitoring trends in respect of perinatal health including congenital anomalies and disabilities;
iii. providing information to the Secretary on the requirements for and the planning of neonatal care units;
iv. providing information for research into the epidemiology of perinatal health including congenital anomalies and disabilities; and
v. establishing and maintaining a register of congenital anomalies and disabilities.
d) Provide to health service providers –
i. information on obstetrics and paediatrics; and
ii. strategies to improve obstetric and paediatric care.
e) Consider, investigate and report on any other matters in respect of obstetric and paediatric mortality and morbidity referred to the Council by the Minister or the Secretary;
f) Liaise with any other Consultative Council (whether or not prescribed) on any matter relevant to the functions of the Council;
g) Publish an annual report on the research and activities of the Council;

40
h) Perform any other prescribed function; and
i) Collect information for the purpose of performing its functions as outlined in the Act.
CCOPMM is supported by the Clinical Councils Unit (CCU) within the Health Service Performance and Programs Division of the Department of Health. The CCU manages and supports the work programs of CCOPMM and two other ministerial consultative councils: the Victorian Consultative Council on Anaesthetic Mortality and Morbidity (VCCAMM) and the Victorian Surgical Consultative Council (VSCC).
2.2 MEMBERS OF CCOPMM AND SUBCOMMITTEES
2010 Council Professor JJN Oats (Chairperson) Professor M Permezel Dr P McDougall Dr V Billson Dr M Biro Mr N Thomas Professor P Monagle Professor E Wallace Ms J Jenkin Professor R Doherty Professor T Nolan Dr R Grenfell
2011 Council Professor JJN Oats (Chairperson) Professor M Permezel Dr P McDougall Dr V Billson Dr M Biro Mr N Thomas Professor P Monagle Professor E Wallace Ms J Jenkin Professor R Doherty Professor T Nolan Dr R Grenfell
Stillbirth Subcommittee Professor JJN Oats (Chairperson) Dr L Begg Dr V Billson Dr M Biro Dr F Cullinane Ms P Hickey Professor M Permezel Associate Professor G Teale Dr C Tippett Associate Prof A Trivedi Professor E Wallace
Stillbirth Subcommittee Professor JJN Oats (Chairperson) Dr L Begg Dr V Billson Dr M Biro Dr F Cullinane Ms P Hickey Professor M Permezel Associate Professor G Teale Dr C Tippett Associate Prof A Trivedi Professor E Wallace
Neonatal Mortality and Morbidity Subcommittee Professor JJN Oats (Chairperson) Dr V Billson Dr F Cullinane Dr P Henschke (Feb – June 2010) Dr S Jacobs Associate Professor C Kuschel Dr P McDougall Ms A McLean Dr S Parsons Dr A Ramsden Dr A Shub Dr M Stewart Dr M Tarrant Associate Professor S Walker
Neonatal Mortality and Morbidity Subcommittee Professor JJN Oats (Chairperson) Dr V Billson Dr F Cullinane Dr E Carse (from Oct 2011) Dr S Jacobs Associate Professor C Kuschel Dr P McDougall Ms A McLean Dr S Parsons Dr A Ramsden (Feb – Oct 2011) Dr A Shub Dr M Stewart Dr M Tarrant Associate Professor S Walker
41
Dr A Watkins (July – Dec 2010) Dr S Fraser (from Sept 2010)
Dr A Watkins Dr S Fraser
Child & Adolescent Mortality and Morbidity Subcommittee Professor T Nolan (Chairperson) Professor R Doherty Professor T Duke Dr S Goldfeld (resigned October 2010) Dr R Lester Dr M Lynch (resigned March 2010) Assoc Professor D MacGregor (from April 2010) Professor JJN Oats, Dr J Proimos (from December 2010) Dr C.M. Rose Professor S Sawyer Professor F Shann Professor M South Dr P Wearne Dr H van Doorn
Child & Adolescent Mortality and Morbidity Subcommittee Professor T Nolan (Chairperson) Professor R Doherty Professor T Duke Dr R Lester Assoc Professor D MacGregor Professor JJN Oats Dr J Proimos Dr C.M. Rose Professor S Sawyer Professor F Shann Professor M South Dr P Wearne Dr H van Doorn
Maternal Mortality and Morbidity Subcommittee Professor JJN Oats (Chairperson) Dr V Billson Dr F Cullinane Associate Professor L Kornman Dr M Lynch Professor M Permezel Ms W Pollock Dr A Ross Dr C Walker Professor E Wallace
Maternal Mortality and Morbidity Subcommittee Professor JJN Oats (Chairperson) Dr V Billson Dr F Cullinane Associate Professor L Kornman Dr M Lynch Professor M Permezel Ms W Pollock Dr A Ross Dr C Walker Professor E Wallace
2.3 THE DATA COLLECTIONS
CCOPMM has statutory responsibility for the Victorian Perinatal Data Collection (VPDC) and the Victorian Congenital Anomalies Register (VCAR), formerly known as the Victorian Birth Anomalies Register (VBDR). The Victorian Department of Health has responsibility for the management of the data collections.
The collections enable the analysis of information in relation to the health of mothers, babies and children in order to contribute to improvements in their health. Information is collected on obstetric conditions, procedures and outcomes, and neonatal morbidity and congenital anomalies relating to every birth in Victoria of at least 20 weeks gestation, or if gestation is unknown, at least 400 g birth weight.
Data collected contributes to:
research and study on the incidence and causes in Victoria of maternal deaths, stillbirths and the deaths of children
research and study on the incidence and causes of obstetric and paediatric morbidity research on and in relation to births in Victoria research into perinatal health, including birth congenital anomalies and disabilities research on any other matters in respect of obstetric and paediatric mortality and morbidity
referred to the Council by the Minister or the Secretary of the Victorian Department of Health.
42
The Victorian Perinatal Data Collection
The VPDC was established in 1982 under the Heath Act 1958 and consists of clinical outcome data on all Victorian births. Information on the data collected is provided at <http://www.health.vic.gov.au/ccopmm/vpdc/index.htm>.
The Victorian Congenital Anomalies Register
CCOPMM maintains a register of congenital anomalies to provide information for surveillance, research and planning purposes.
The VCAR includes suspected or confirmed congenital anomalies notified via the VPDC and/or
voluntarily notified from multiple sources for births and in children up to 8 years of age. Anyone can
notify the VCAR via the CCOPMM website. Further information on the VCAR is at
<www.health.vic.gov.au/ccopmm>.
2.4 PROVISION OF DATA FOR STATISTICAL, RESEARCH AND PUBLIC INTEREST PURPOSES
CCOPMM supports research that is strategic and targeted at priority areas requiring further evidence. Regulation 10 of the Public Health and Wellbeing Regulations 2009 sets out the circumstances in which CCOPMM is authorised to release data for research purposes. All research requests involving CCOPMM-held data must be submitted to CCOPMM for approval. Research proposals must conform to the National Health and Medical Research Council’s National Statement on Ethical Conduct in Human Research (2007) and a properly constituted Victorian Human Research Ethics Committee must give approval prior to CCOPMM consideration.
In the public interest, CCOPMM is also authorised to provide information to authorities and interested parties specified under section 41 of the Act.
Further information regarding data and research requests is at the CCOPMM website. The online data request form is available at <www.health.vic.gov.au/ccopmm/forms.htm>.
All correspondence relating to the CCOPMM data collections should be addressed to:
Clinical Councils Unit Department of Health GPO Box 4923 Melbourne 3001
Email enquiries can be made to: [email protected]

43
3. METHODS
3.1 DEFINITIONS
Child death
Child death refers to the death of a child occurring after and including the 1st birthday and up to, but not including, the 18th birthday (1–17 years).
Confinements
Confinements refer to the number of women who gave birth to one or more live births and/or stillbirths (regardless of plurality) with a pregnancy of 20 weeks gestation or more.
Congenital anomaly, formerly birth anomaly
A congenital anomaly is any anomaly of prenatal origin, arising from conception or occurring before the end of pregnancy. This includes structural, functional, genetic, chromosomal and biochemical anomalies.
Crude birth rate
The crude birth rate is measured by the number of live births (see definition above) per 1,000 estimated female resident population aged 14–44 years for a given calendar year.
Estimated resident population
The estimated resident population (ERP) is an Australian Bureau of Statistics (ABS) measure of the population based on the concept of residence and refers to all people, regardless of nationality or citizenship, who usually live in Australia, with the exception of foreign diplomatic personnel and their families.
Infant death
Infant death refers to the death of a live-born infant occurring within one year of birth. Infant death can be divided into neonatal death referring to the death of a live-born infant less than 28 days after birth, of at least 20 weeks gestation or, if gestation is unknown, weighing at least 400 g, and post-neonatal infant death, referring to the death of an infant between 28 days and 364 days.
Late maternal death
Late maternal death refers to the death of a woman after 42 days but within a year of the birth or termination of the pregnancy. The death may be due to direct, indirect or incidental causes, however indirect and incidental late maternal deaths are not included in the maternal mortality ratio.
Live birth
A live birth is the birth of a child who, after delivery, breathes or shows any evidence of life such as a heartbeat.
Maternal death
For classification of cause of death
For classification purposes, maternal death refers to the death of a woman while pregnant or within 42 days of the end of the pregnancy, irrespective of the cause of death.56 This definition allows for classification of maternal deaths based on direct, indirect or incidental causes, as follows:
• direct – the death is considered to be due to a complication of the pregnancy (for example, haemorrhage from placenta praevia)
• indirect – the death is considered to be due to a pre-existing or newly diagnosed condition
44
aggravated by the physiological or pathological changes of pregnancy (for example, deterioration in pre-existing heart disease or diabetes). Deaths consequent on psychiatric disease are usually categorised as indirect, except for puerperal psychosis, which is classified as direct
• incidental – the death is considered unrelated to pregnancy (for example, passenger in motor vehicle accident).
For calculating the maternal mortality ratio
The World Health Organization (WHO) defines maternal death as ‘the death of a woman during pregnancy, childbirth or in the 42 days of the puerperium, irrespective of the duration and site of the pregnancy, from any cause related to, or aggravated by, the pregnancy or its management’. This WHO definition allows for identification of maternal deaths as either direct or indirect only. It includes deaths from abortion and ectopic pregnancy, however excludes incidental deaths from causes unrelated to pregnancy, such as deaths from injury or malignancy. The WHO definition is used by CCOPMM to calculate the maternal mortality ratio.
Perinatal death
Perinatal deaths refer to stillbirths and live births with only brief survival and are grouped on the assumption that similar factors are associated with these losses.57 CCOPMM defines perinatal death to include stillbirth and neonatal deaths within 28 days of birth of infants of gestation ≥ 20 weeks gestation or if gestation is unknown of birth weight ≥ 400 g.
For national statistics, CCOPMM also reports on perinatal deaths of infants with a birth weight of ≥500 g or, if the birth weight is unknown, infants of ≥ 22 weeks gestation. This definition has certain advantages because it excludes from the calculation those mostly pre-viable live births of < 500 g and also the majority of cases where the pregnancy was terminated for fetal or maternal indications.
For international comparison and as recommended by WHO, only fetuses and infants of at least 1,000 g birth weight, or where birth weight is unavailable, the corresponding gestational age (28 weeks) or body length (35 cm crown–heel) are included in the perinatal mortality ratio.
Post-neonatal infant, child and adolescent deaths
These deaths are classified under the following categories:
• determined at birth • SUDI, including SIDS • unintentional injury • acquired disease • intentional injury • undetermined.
Standardised mortality ratio
This is a risk ratio where the observed mortality pattern in a group is compared with what would have been expected if the variable-specific mortality rates had been the same as the specified reference population. Indirect standardisation adjusts for differences in the distribution of the variable of interest (for example, age) between the study and reference population.
Stillbirth
A stillbirth is defined as the birth of an infant of at least 20 weeks gestation or, if gestation is unknown, weighing at least 400 g, who shows no signs of life at birth.
Sudden unexpected deaths in infancy (SUDI)
This group of deaths includes all infants (under 1 year of age) who die suddenly and unexpectedly after they are placed for sleeping. SUDI can be classified into explained SUDI and unexplained SUDI and can include deaths related to:
45
• unexplained
– SIDS is the sudden unexpected death of an infant < 1 year of age, with onset of the fatal episode apparently occurring during sleep
– unclassified sudden infant death (USID), with or without autopsy
– undetermined
• explained
– suffocation while sleeping (including asphyxiation by bedclothes and overlaying)
– infection, metabolic disorders, congenital anomalies, genetic conditions
– other – for example non-accidental injury.
Some international definitions of SUDI include unexpected events such as unintentional injury (for example, motor vehicle accidents). CCOPMM does not include unintentional injuries in its SUDI definitions, but details of unintentional injury in infants are listed elsewhere in the report. SUDI deaths where a cause of death is identified (usually at autopsy) are included in the ‘explained’ category and are also included within other appropriate categories (for example, birth congenital anomalies or genetic conditions, infection) elsewhere in the report (see Appendix1) for further definition of SIDS). Unexplained SUDI deaths are classified according to the Krous definition (see Appendix 1).
3.2 MEASURES OF OBSTETRIC AND PAEDIATRIC MORTALITY
Maternal mortality ratio (MMR)
The MMR58 is defined as follows:
Maternal mortality ratio = number of direct and indirect maternal deaths x 100,000
(total number of confinements)
Confinements is the number of pregnancies of 20 weeks gestation or more resulting in live birth or stillbirth (regardless of plurality).
Note that maternal deaths in early pregnancy from direct or indirect causes are included in the numerator for the MMR even though the denominator does not include pregnancies that end before 20 weeks gestation because the available data on the number of these pregnancies are unreliable.
Perinatal mortality rate (PMR)
The PMR is calculated as stillbirths and neonatal deaths per 1,000 total births (stillbirths and live births). For CCOPMM statistics, the rate refers to all births of at least 20 weeks gestation or, if gestation is unknown, of birth weight of at least 400 g. However, for purposes of continuity, PMR of infants of ≥ 500 g or, where the birth weight is unknown, of at least 22 weeks gestation, is also presented (PMR500). For international comparisons, the rate refers to all births of at least 1,000 g birth weight or, when the birth weight is unknown, of at least 28 weeks gestation and neonatal deaths occurring within seven days of birth (recommended by WHO).
Perinatal mortality rate = (number of stillbirths + neonatal deaths) x 1,000
total (stillbirths + live births)
Neonatal mortality rate (NMR)
The NMR is calculated per 1,000 live births of at least 20 weeks gestation or, if gestation is unknown, of birth weight at least 400 g.
46
Neonatal mortality rate = number of neonatal deaths x 1,000
total live births
Stillbirth rate
Stillbirth rate = number of stillbirths x 1,000
total (stillbirths + live births)
Infant mortality rate (IMR)
The IMR is calculated as the number of infant deaths divided by the number of total (Victorian-born) live births for the index year (reported as the rate per 1,000 live births). The live births are limited to those infants ≥ 20 weeks gestation or, if the gestation is unknown, of birth weight ≥ 400 g.
Deaths during the neonatal period of infants born as the result of termination of pregnancy for congenital anomaly or other reasons, such as CMV or maternal conditions, are excluded from the IMR calculation.
Infant mortality rate = (number of infant deaths) x 1,000
total live births
3.3 DATA SOURCES
Differences from previous reports
Data presented in this report may differ slightly from data presented in previous reports due to new information becoming available. The implementation of electronic transfer of birth data from the majority of health services that provide maternity care commenced in 2009 and included the addition of a number of new data items.
Victorian Perinatal Data Collection
Data is collected from hospitals, birth centres and homebirth practitioners via an electronic extract of their clinical and patient administrative systems submitted to the department via a secure data exchange. Where data cannot be submitted electronically, data may be supplied via the paper-based birth report form (see Appendix 2) until such time electronic submission is possible and as negotiated with the department.
Victorian Congenital Anomalies Register (VCAR)
Data in the VCAR is obtained from multiple sources including the VPDC (birth notifications), hospital sources, perinatal death certificates, autopsy reports, cytogenetics reports, maternal and child health nurses, other professionals and other people such as parents.
The VCAR has been updated from hospital inpatient listings of children with a congenital anomaly from The Royal Children’s Hospital (RCH) since 1982. Listings of all children born since 1982 who have visited the RCH Cardiology Unit and Genetic Health Services Victoria, either as an inpatient or outpatient, also contribute to the VCAR. This procedure has also been adopted for Monash Medical Centre where the inpatient listings date back to 1992. More recently, inpatient listings from The Royal Women’s Hospital, the Mercy Hospital for Women and other Victorian public health services have contributed to the congenital anomalies data collection.
47
Sources of mortality data
CCOPMM is grateful for the cooperation of obstetricians, neonatologists, paediatricians, midwives, general practitioners and medical records personnel in the provision of relevant information on each case.
A key document in the notification process is the confidential medical report (CMR) on perinatal death. For stillbirth notifications, the CMR must include results of antenatal tests for fetal wellbeing (for example, glucose tolerance test, cardiotocography, ultrasound assessment). For neonatal death, a separate obstetric summary should be provided for full consideration of the clinical circumstances surrounding the death.
CCOPMM recognises that there is often room for improvement in the completion of this information and requests that the perinatal death certificate and the CMR be reviewed for completeness by the most senior clinician involved.
Institutions should ensure that they are using current versions of the medical certificate of cause of perinatal death and CMR on perinatal death forms. These can be obtained from the Victorian Registry of Births, Deaths and Marriages or submitted online at the registry website.
Notices supplied under section 39 of the Act authorise CCOPMM to access relevant clinical information to assist in the review and classification of cases and to improve the case review process.
Information provided to CCOPMM is confidential and cannot be accessed by third parties, including the courts. CCOPMM does not reveal in any of its reports the identity of any individual person or practitioner. Provision of information to CCOPMM does not breach the regulations contained within the Information Privacy Act 2000. Further information on the Act and the Information Privacy Act 2000 may be accessed at <www.legislation.vic.gov.au>.
Registration of perinatal deaths
The Victorian Registry of Births, Deaths and Marriages notifies CCOPMM of all perinatal deaths registered in Victoria. The legal requirements for registration are contained within the Births, Deaths and Marriages Registration Act 1996.
For the purpose of registration, the Births, Deaths and Marriages Registration Act states that a stillborn child is any child born at a gestation of at least 20 weeks, who did not, at any time after being born, breathe or show any signs of life. Where the duration of pregnancy is not reliably known, this applies to any fetus weighing 400 g or more.
A live birth is the birth of an infant, regardless of maturity or birth weight, who breathes or shows any other signs of life after being born. If death subsequently occurs within 28 days, a perinatal death certificate is required. For statistical purposes, infants of less than 20 weeks gestation are not included in perinatal mortality calculations by CCOPMM.
Registration of maternal deaths
Australian jurisdictions do not legally require notification of maternal mortality and variation in ascertainment occurs across Australia.
CCOPMM endeavours to ensure maximum ascertainment of deaths by the establishment of formal notification mechanisms with the office of the State Coroner and the State Registrar of Births, Deaths and Marriages. CCOPMM automatically receives notification of maternal deaths from the coroner’s online medical deposition form for women known to be currently or recently pregnant. The Victorian adult death certificate also includes a ‘pregnancy tick box’, drawing the attention of the certifying physician to the possibility that the case may be a maternal death. A similar data element identifying
48
pregnancy status is included in the Australian and New Zealand Intensive Care Society database of intensive care unit admissions.
3.4 DATA QUALITY
Data submitted to the VPDC is checked for completeness and accuracy. Inconsistent or incomplete data is rectified by sending a query to the hospital of birth, birth centre or home birth practitioner. Extensive data cleaning is carried out once all data for the calendar year has been submitted.
Validation activities to assess, maintain and improve the quality of data provided to the VPDC by hospitals are an integral part of the work of the Department of Health. This complements and extends the checks built into the data submission system.
Validation of number of births reported to the VPDC
Each year a validation is undertaken to ensure all births are reported. The validation compares the number of births that are reported to the VPDC with the number of births recorded at each hospital in the state. The most recent study (of births in 2008) showed that 99.5% of all births in Victorian hospitals were reported to the VPDC without prompting, while the remainder were submitted after the validation process identified their omission.
Statewide validation of perinatal data
Projects designed to determine the accuracy and completeness of VPDC data are undertaken periodically. These projects compare the data in the VPDC dataset with that recorded in the medical record. A 2014 validation study is currently underway.
Education and Liaison Program
The CCU employs a liaison midwife to engage with midwives providing data to the VPDC for guidance on completion and item definition. This role also provides information on the use of CCOPMM-held data to ultimately improve data accuracy. Presentations are also provided to undergraduate and postgraduate midwifery students.
3.5 DATA ITEMS
The data collected from the birth report includes limited socio-demographic details, information on maternal medical conditions, obstetric conditions, procedures, management of labour and birth, neonatal characteristics and morbidity and congenital anomalies relating to every birth in Victoria of at least 20 weeks gestation or, if gestation is unknown, at least 400 g birth weight.
The VPDC contributes to the National Perinatal Minimum Data Set (PMDS) managed by the University of New South Wales' National Perinatal Statistics Unit (NPESU). The NPESU produces an annual report on Australia’s mothers and babies on behalf of the Australian Institute of Health and Welfare, using the PMDS. The VPDC contains additional items to enable more detailed analysis on the health of mothers and babies in Victoria.
The Victorian Perinatal Data Collection manual, first edition, v. 2.1 (2010), provides comprehensive information for hospitals and agencies, including data definitions and reporting requirements for all service types. The manual is available on the department’s website at <www.health.vic.gov.au/ccopmm/vpdc/index.htm>.
49
3.6 METHODS OF CASE INVESTIGATION
Coding cause of death
CCOPMM compiles a case file on each maternal, perinatal, post-neonatal infant, child and adolescent death. The case material is considered by the Chairperson of the CCOPMM, a consultant obstetrician/perinatal epidemiologist (perinatal deaths), a paediatrician/paediatric epidemiologist (post-neonatal infant, child and adolescent deaths) and a research midwife. Selected cases are referred to the specialist subcommittees if preventable factors are suspected (for example, term perinatal death from intrapartum asphyxia) or if other specific concerns are identified (Figure 2.1). Deaths that are considered likely to be unavoidable (for example, lethal congenital anomalies or death following spontaneous birth of extremely preterm infants) are not usually referred to the subcommittees.
All perinatal cases are considered, classified and coded according to the perinatal death classification and neonatal death classifications of the Perinatal Society of Australia and New Zealand.
All post-neonatal infant, child and adolescent deaths are coded using the International Statistical Classification of Diseases and Health related problems, 10th revision, Australian modification (6th Edition). They are also classified into the categories used in this report.
CCOPMM first undertook a complete survey of all deaths in Victoria of children up to and including the age of 14 years in 1985. The cause of death classification system used in that survey was adapted from the Scottish post-perinatal infant mortality survey 1981–82. Since 2005, CCOPMM has reported on the deaths of all children and adolescents aged up to and including 15–17 years using its own classification of cause of death.
In many cases, CCOPMM has multiple sources of information available regarding children (including health, welfare and education records) and may not limit the cause of death classification to cause of death recorded in postmortem reports or death certificates alone. Prior to classification, CCOPMM obtains as much relevant information that is currently available. At the time of classifying a death, CCOPMM considers all available information and, accordingly, CCOPMM’s classification for a particular death may vary from the ICD-10 classification. In some cases, new information may become available at a later time that leads to a change in the classification assigned to a particular death or group of deaths.
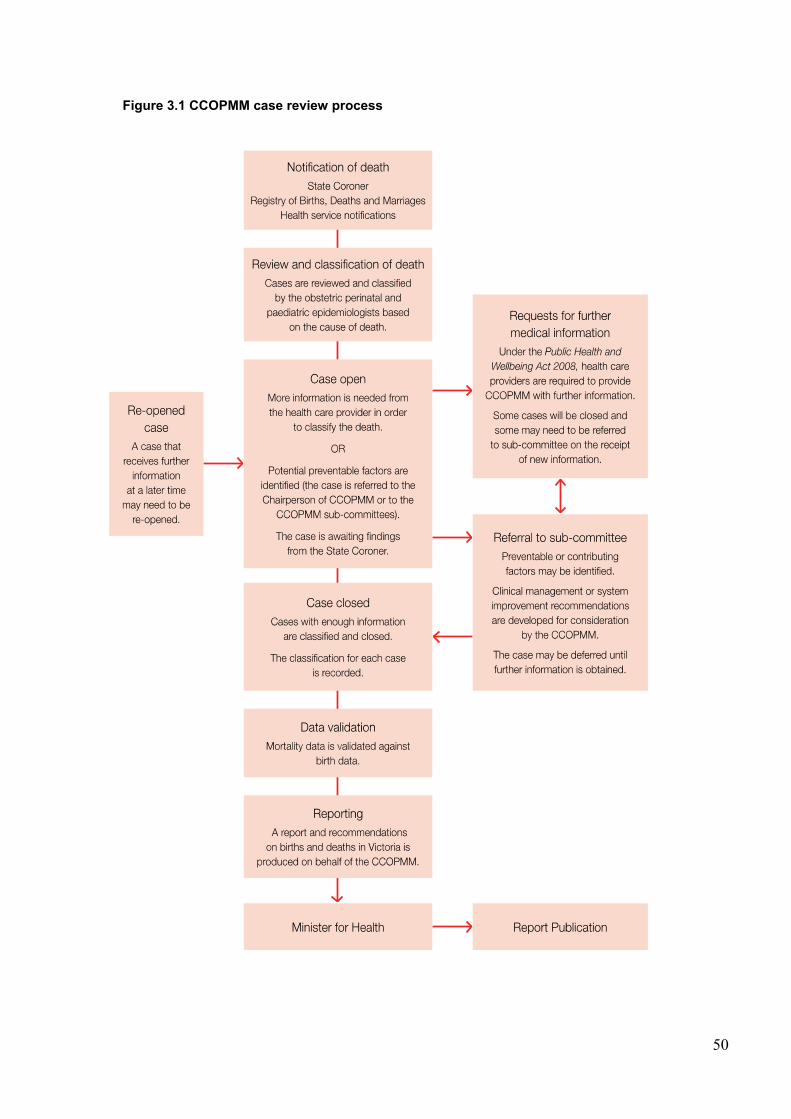
50
Figure 3.1 CCOPMM case review process
51
3.7 STATISTICAL METHODS
Reporting and analysis periods
Data is analysed and reported by calendar year. Depending on when the death occurred, the date of birth or the date of death is used as the marker for inclusion of the case in the data set for the reporting year.
Deaths of Victorian residents that occur in other jurisdictions are noted and reviewed but not included in the mortality rates. Deaths of non-residents that occur in Victoria are not included unless the birth occurred in Victoria.
Perinatal deaths
CCOPMM reports on perinatal deaths for births occurring in Victoria, by calendar year of the birth.
Maternal, post-neonatal infant, child and adolescent deaths
CCOPMM reports on maternal, post-neonatal infant, child and adolescent deaths, by calendar year of the death, where the person was a resident and died in Victoria.
Analysis
The analysis for this report was conducted using Microsoft Access and an SPSS 20.0 syntax file. Mortality rates (defined in section 3.4) were calculated using Excel 2010. Rates are expressed per 1,000 population unless otherwise stated. Relative risk and confidence intervals (CI) were calculated using STATA (version 11, College Station Texas USA).
Categories may be aggregated or multiple years of data combined to avoid small numbers and to provide more reliable statistics. Where reported numbers are low, pooled data has been presented as three-year rolling averages to stabilise the rates and provide a trend over time.
Due to the rounding of percentages, some percentage totals may not add up to 100. However, the total is still displayed in the table as 100. The table will also have a note to indicate where this occurs.
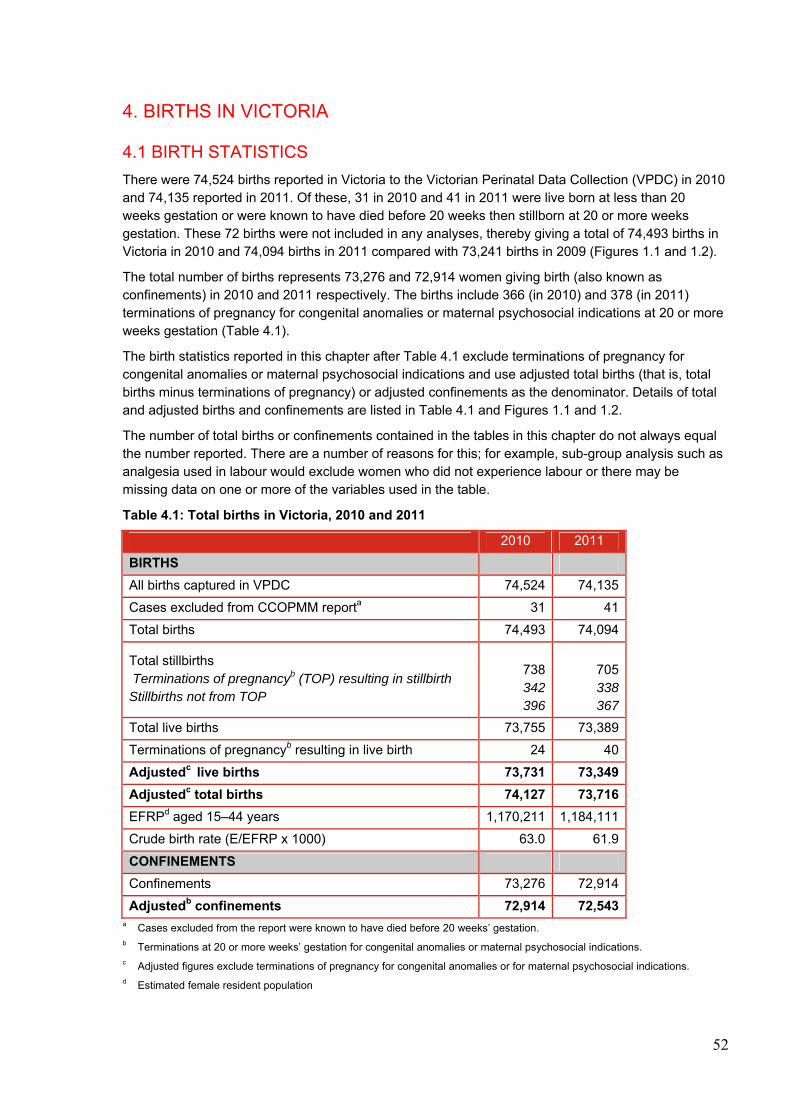
52
4. BIRTHS IN VICTORIA
4.1 BIRTH STATISTICS
There were 74,524 births reported in Victoria to the Victorian Perinatal Data Collection (VPDC) in 2010 and 74,135 reported in 2011. Of these, 31 in 2010 and 41 in 2011 were live born at less than 20 weeks gestation or were known to have died before 20 weeks then stillborn at 20 or more weeks gestation. These 72 births were not included in any analyses, thereby giving a total of 74,493 births in Victoria in 2010 and 74,094 births in 2011 compared with 73,241 births in 2009 (Figures 1.1 and 1.2).
The total number of births represents 73,276 and 72,914 women giving birth (also known as confinements) in 2010 and 2011 respectively. The births include 366 (in 2010) and 378 (in 2011) terminations of pregnancy for congenital anomalies or maternal psychosocial indications at 20 or more weeks gestation (Table 4.1).
The birth statistics reported in this chapter after Table 4.1 exclude terminations of pregnancy for congenital anomalies or maternal psychosocial indications and use adjusted total births (that is, total births minus terminations of pregnancy) or adjusted confinements as the denominator. Details of total and adjusted births and confinements are listed in Table 4.1 and Figures 1.1 and 1.2.
The number of total births or confinements contained in the tables in this chapter do not always equal the number reported. There are a number of reasons for this; for example, sub-group analysis such as analgesia used in labour would exclude women who did not experience labour or there may be missing data on one or more of the variables used in the table.
Table 4.1: Total births in Victoria, 2010 and 2011
2010 2011
BIRTHS
All births captured in VPDC 74,524 74,135
Cases excluded from CCOPMM reporta 31 41
Total births 74,493 74,094
Total stillbirths Terminations of pregnancyb (TOP) resulting in stillbirth Stillbirths not from TOP
738342396
705 338 367
Total live births 73,755 73,389
Terminations of pregnancyb resulting in live birth 24 40
Adjustedc live births 73,731 73,349
Adjustedc total births 74,127 73,716
EFRPd aged 15–44 years 1,170,211 1,184,111
Crude birth rate (E/EFRP x 1000) 63.0 61.9
CONFINEMENTS
Confinements 73,276 72,914
Adjustedb confinements 72,914 72,543 a Cases excluded from the report were known to have died before 20 weeks’ gestation. b Terminations at 20 or more weeks’ gestation for congenital anomalies or maternal psychosocial indications. c Adjusted figures exclude terminations of pregnancy for congenital anomalies or for maternal psychosocial indications. d Estimated female resident population
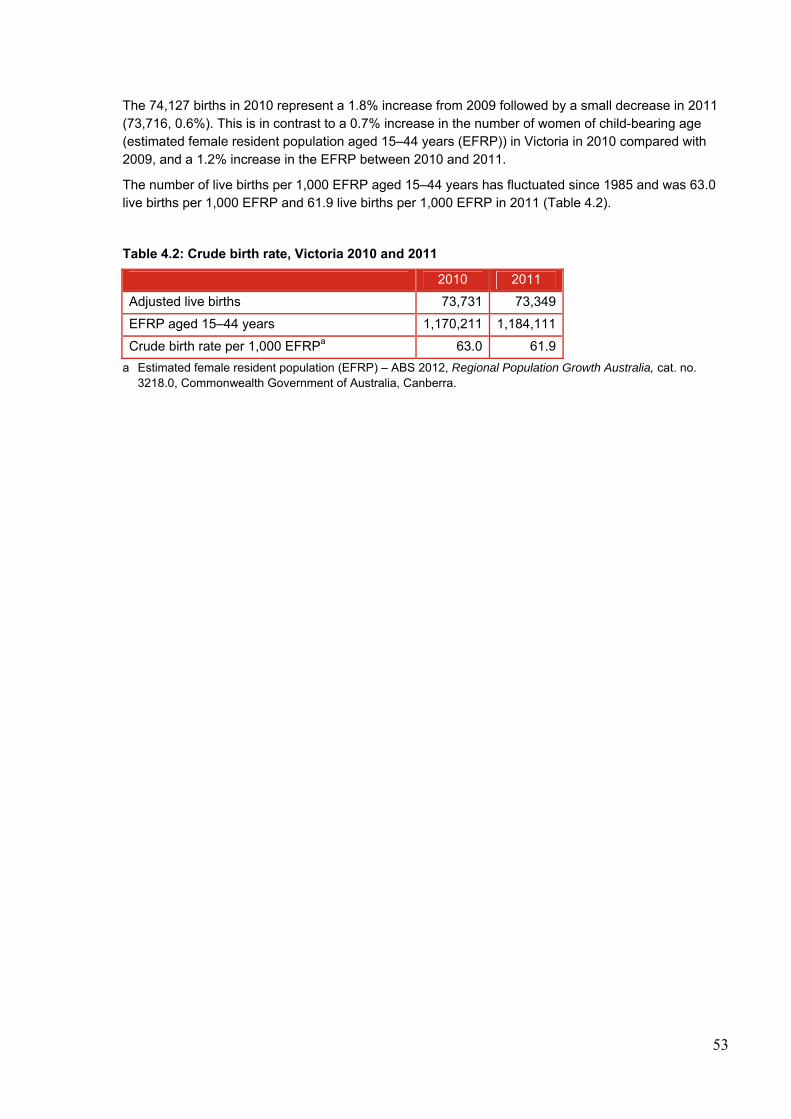
53
The 74,127 births in 2010 represent a 1.8% increase from 2009 followed by a small decrease in 2011 (73,716, 0.6%). This is in contrast to a 0.7% increase in the number of women of child-bearing age (estimated female resident population aged 15–44 years (EFRP)) in Victoria in 2010 compared with 2009, and a 1.2% increase in the EFRP between 2010 and 2011.
The number of live births per 1,000 EFRP aged 15–44 years has fluctuated since 1985 and was 63.0 live births per 1,000 EFRP and 61.9 live births per 1,000 EFRP in 2011 (Table 4.2).
Table 4.2: Crude birth rate, Victoria 2010 and 2011
2010 2011
Adjusted live births 73,731 73,349
EFRP aged 15–44 years 1,170,211 1,184,111
Crude birth rate per 1,000 EFRPa 63.0 61.9
a Estimated female resident population (EFRP) – ABS 2012, Regional Population Growth Australia, cat. no. 3218.0, Commonwealth Government of Australia, Canberra.
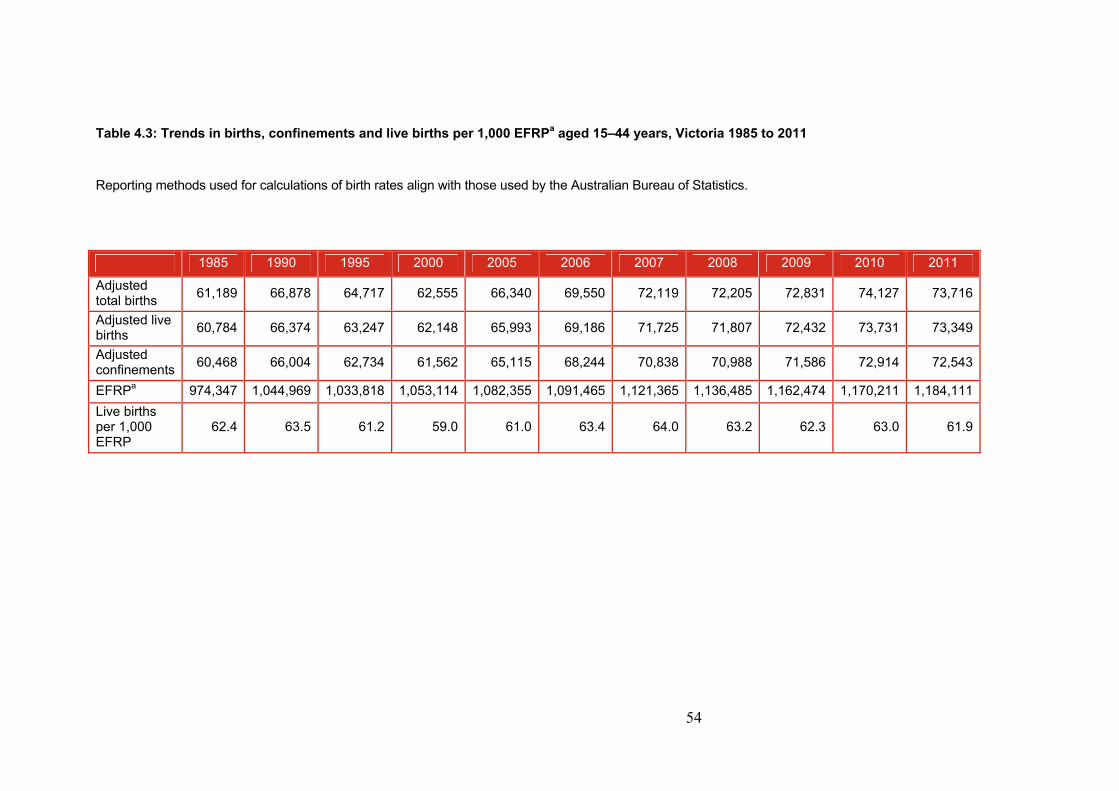
54
Table 4.3: Trends in births, confinements and live births per 1,000 EFRPa aged 15–44 years, Victoria 1985 to 2011
Reporting methods used for calculations of birth rates align with those used by the Australian Bureau of Statistics.
1985 1990 1995 2000 2005 2006 2007 2008 2009 2010 2011
Adjusted total births
61,189 66,878 64,717 62,555 66,340 69,550 72,119 72,205 72,831 74,127 73,716
Adjusted live births
60,784 66,374 63,247 62,148 65,993 69,186 71,725 71,807 72,432 73,731 73,349
Adjusted confinements
60,468 66,004 62,734 61,562 65,115 68,244 70,838 70,988 71,586 72,914 72,543
EFRPa 974,347 1,044,969 1,033,818 1,053,114 1,082,355 1,091,465 1,121,365 1,136,485 1,162,474 1,170,211 1,184,111
Live births per 1,000 EFRP
62.4 63.5 61.2 59.0 61.0 63.4 64.0 63.2 62.3 63.0 61.9
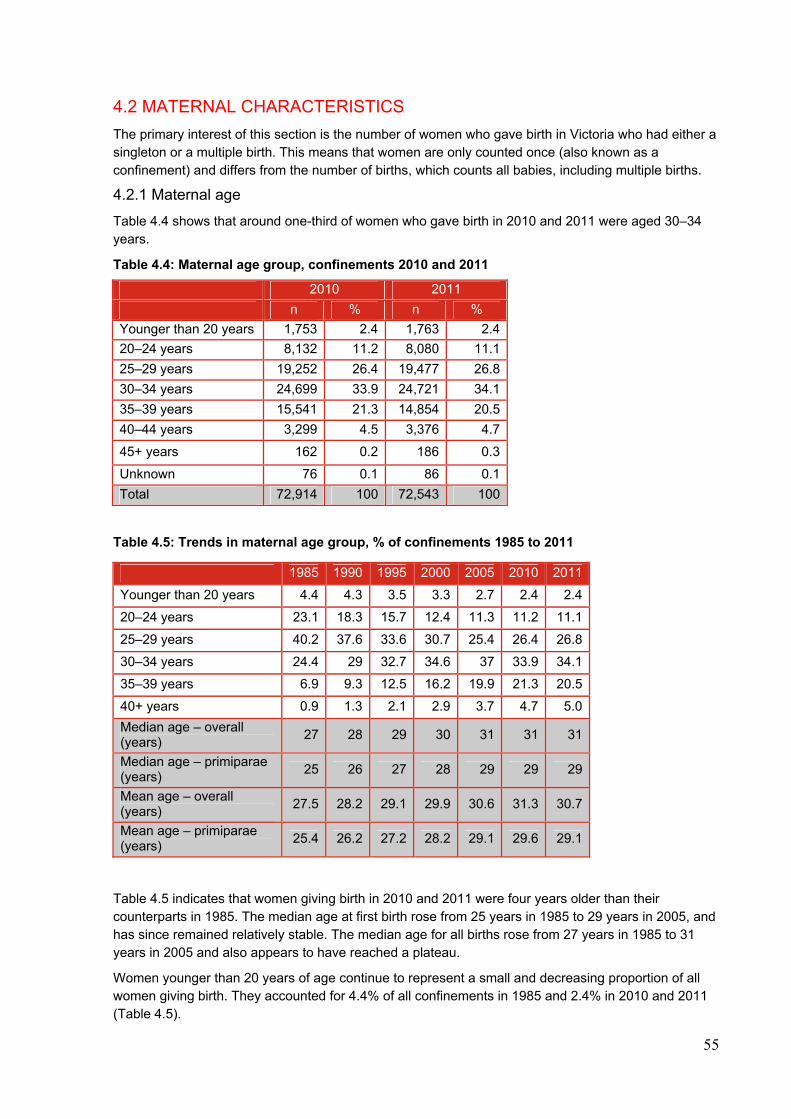
55
4.2 MATERNAL CHARACTERISTICS
The primary interest of this section is the number of women who gave birth in Victoria who had either a singleton or a multiple birth. This means that women are only counted once (also known as a confinement) and differs from the number of births, which counts all babies, including multiple births.
4.2.1 Maternal age
Table 4.4 shows that around one-third of women who gave birth in 2010 and 2011 were aged 30–34 years.
Table 4.4: Maternal age group, confinements 2010 and 2011
Table 4.5: Trends in maternal age group, % of confinements 1985 to 2011
Table 4.5 indicates that women giving birth in 2010 and 2011 were four years older than their counterparts in 1985. The median age at first birth rose from 25 years in 1985 to 29 years in 2005, and has since remained relatively stable. The median age for all births rose from 27 years in 1985 to 31 years in 2005 and also appears to have reached a plateau.
Women younger than 20 years of age continue to represent a small and decreasing proportion of all women giving birth. They accounted for 4.4% of all confinements in 1985 and 2.4% in 2010 and 2011 (Table 4.5).
2010 2011
n % n %
Younger than 20 years 1,753 2.4 1,763 2.4
20–24 years 8,132 11.2 8,080 11.1
25–29 years 19,252 26.4 19,477 26.8
30–34 years 24,699 33.9 24,721 34.1
35–39 years 15,541 21.3 14,854 20.5
40–44 years 3,299 4.5 3,376 4.7
45+ years 162 0.2 186 0.3
Unknown 76 0.1 86 0.1
Total 72,914 100 72,543 100
1985 1990 1995 2000 2005 2010 2011
Younger than 20 years 4.4 4.3 3.5 3.3 2.7 2.4 2.4
20–24 years 23.1 18.3 15.7 12.4 11.3 11.2 11.1
25–29 years 40.2 37.6 33.6 30.7 25.4 26.4 26.8
30–34 years 24.4 29 32.7 34.6 37 33.9 34.1
35–39 years 6.9 9.3 12.5 16.2 19.9 21.3 20.5
40+ years 0.9 1.3 2.1 2.9 3.7 4.7 5.0
Median age – overall (years)
27 28 29 30 31 31 31
Median age – primiparae (years)
25 26 27 28 29 29 29
Mean age – overall (years)
27.5 28.2 29.1 29.9 30.6 31.3 30.7
Mean age – primiparae (years)
25.4 26.2 27.2 28.2 29.1 29.6 29.1
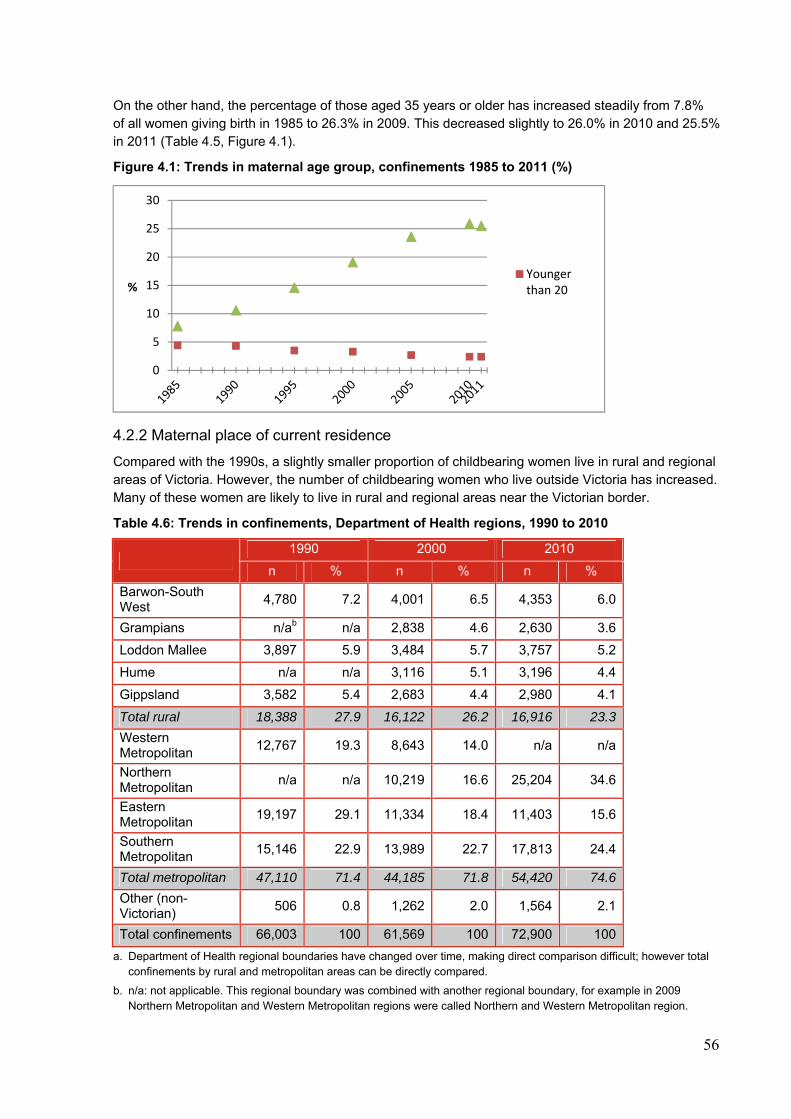
56
On the other hand, the percentage of those aged 35 years or older has increased steadily from 7.8% of all women giving birth in 1985 to 26.3% in 2009. This decreased slightly to 26.0% in 2010 and 25.5% in 2011 (Table 4.5, Figure 4.1).
Figure 4.1: Trends in maternal age group, confinements 1985 to 2011 (%)
4.2.2 Maternal place of current residence
Compared with the 1990s, a slightly smaller proportion of childbearing women live in rural and regional areas of Victoria. However, the number of childbearing women who live outside Victoria has increased. Many of these women are likely to live in rural and regional areas near the Victorian border.
Table 4.6: Trends in confinements, Department of Health regions, 1990 to 2010
1990 2000 2010
n % n % n %
Barwon-South West
4,780 7.2 4,001 6.5 4,353 6.0
Grampians n/ab n/a 2,838 4.6 2,630 3.6
Loddon Mallee 3,897 5.9 3,484 5.7 3,757 5.2
Hume n/a n/a 3,116 5.1 3,196 4.4
Gippsland 3,582 5.4 2,683 4.4 2,980 4.1
Total rural 18,388 27.9 16,122 26.2 16,916 23.3
Western Metropolitan
12,767 19.3 8,643 14.0 n/a n/a
Northern Metropolitan
n/a n/a 10,219 16.6 25,204 34.6
Eastern Metropolitan
19,197 29.1 11,334 18.4 11,403 15.6
Southern Metropolitan
15,146 22.9 13,989 22.7 17,813 24.4
Total metropolitan 47,110 71.4 44,185 71.8 54,420 74.6
Other (non-Victorian)
506 0.8 1,262 2.0 1,564 2.1
Total confinements 66,003 100 61,569 100 72,900 100
a. Department of Health regional boundaries have changed over time, making direct comparison difficult; however total confinements by rural and metropolitan areas can be directly compared.
b. n/a: not applicable. This regional boundary was combined with another regional boundary, for example in 2009 Northern Metropolitan and Western Metropolitan regions were called Northern and Western Metropolitan region.
0
5
10
15
20
25
30
%Youngerthan 20
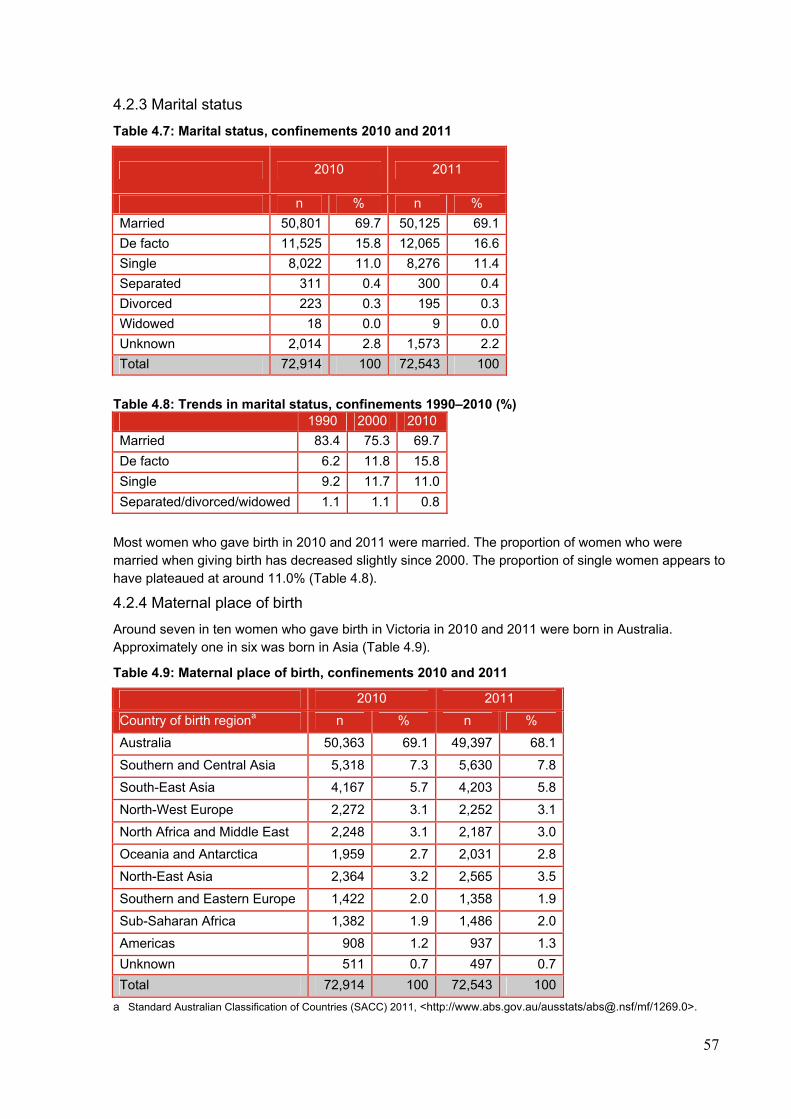
57
4.2.3 Marital status
Table 4.7: Marital status, confinements 2010 and 2011
2010 2011
n % n %
Married 50,801 69.7 50,125 69.1
De facto 11,525 15.8 12,065 16.6
Single 8,022 11.0 8,276 11.4
Separated 311 0.4 300 0.4
Divorced 223 0.3 195 0.3
Widowed 18 0.0 9 0.0
Unknown 2,014 2.8 1,573 2.2
Total 72,914 100 72,543 100
Table 4.8: Trends in marital status, confinements 1990–2010 (%)
1990 2000 2010
Married 83.4 75.3 69.7
De facto 6.2 11.8 15.8
Single 9.2 11.7 11.0
Separated/divorced/widowed 1.1 1.1 0.8
Most women who gave birth in 2010 and 2011 were married. The proportion of women who were married when giving birth has decreased slightly since 2000. The proportion of single women appears to have plateaued at around 11.0% (Table 4.8).
4.2.4 Maternal place of birth
Around seven in ten women who gave birth in Victoria in 2010 and 2011 were born in Australia. Approximately one in six was born in Asia (Table 4.9).
Table 4.9: Maternal place of birth, confinements 2010 and 2011
2010 2011
Country of birth regiona n % n %
Australia 50,363 69.1 49,397 68.1
Southern and Central Asia 5,318 7.3 5,630 7.8
South-East Asia 4,167 5.7 4,203 5.8
North-West Europe 2,272 3.1 2,252 3.1
North Africa and Middle East 2,248 3.1 2,187 3.0
Oceania and Antarctica 1,959 2.7 2,031 2.8
North-East Asia 2,364 3.2 2,565 3.5
Southern and Eastern Europe 1,422 2.0 1,358 1.9
Sub-Saharan Africa 1,382 1.9 1,486 2.0
Americas 908 1.2 937 1.3
Unknown 511 0.7 497 0.7
Total 72,914 100 72,543 100
a Standard Australian Classification of Countries (SACC) 2011, <http://www.abs.gov.au/ausstats/[email protected]/mf/1269.0>.
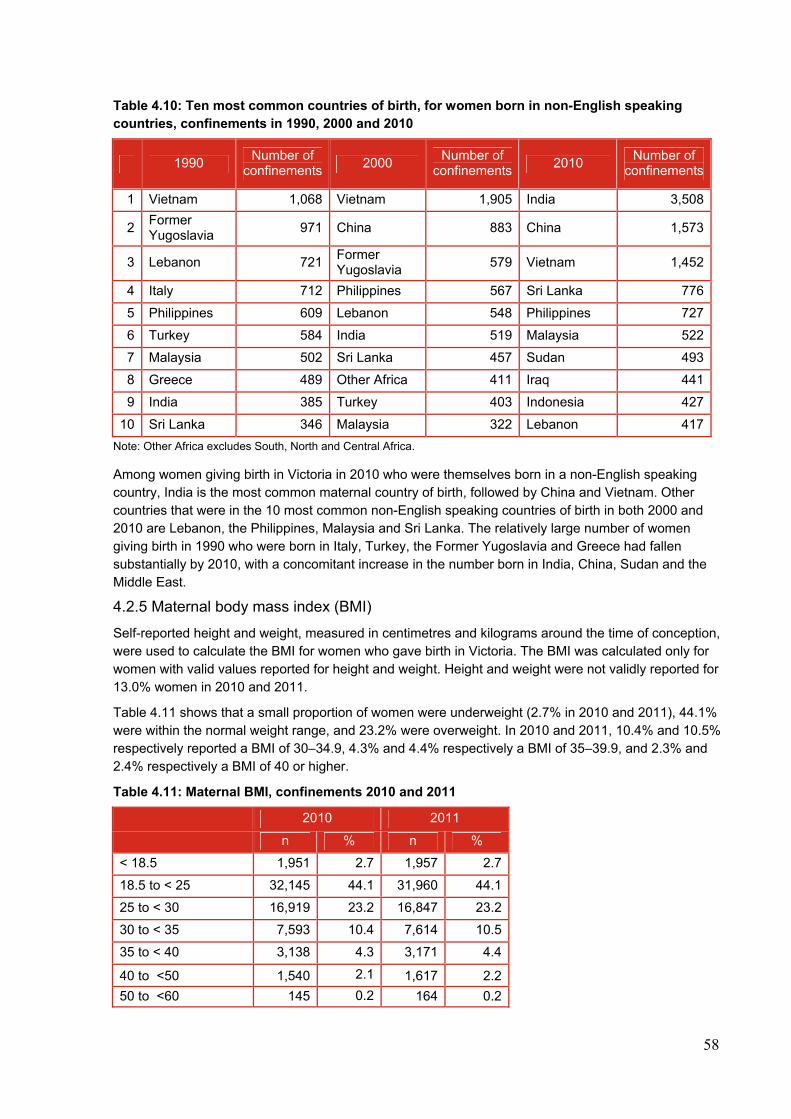
58
Table 4.10: Ten most common countries of birth, for women born in non-English speaking countries, confinements in 1990, 2000 and 2010
1990 Number of
confinements 2000
Number of confinements
2010 Number of
confinements
1 Vietnam 1,068 Vietnam 1,905 India 3,508
2 Former Yugoslavia
971 China 883 China 1,573
3 Lebanon 721 Former Yugoslavia
579 Vietnam 1,452
4 Italy 712 Philippines 567 Sri Lanka 776
5 Philippines 609 Lebanon 548 Philippines 727
6 Turkey 584 India 519 Malaysia 522
7 Malaysia 502 Sri Lanka 457 Sudan 493
8 Greece 489 Other Africa 411 Iraq 441
9 India 385 Turkey 403 Indonesia 427
10 Sri Lanka 346 Malaysia 322 Lebanon 417
Note: Other Africa excludes South, North and Central Africa.
Among women giving birth in Victoria in 2010 who were themselves born in a non-English speaking country, India is the most common maternal country of birth, followed by China and Vietnam. Other countries that were in the 10 most common non-English speaking countries of birth in both 2000 and 2010 are Lebanon, the Philippines, Malaysia and Sri Lanka. The relatively large number of women giving birth in 1990 who were born in Italy, Turkey, the Former Yugoslavia and Greece had fallen substantially by 2010, with a concomitant increase in the number born in India, China, Sudan and the Middle East.
4.2.5 Maternal body mass index (BMI)
Self-reported height and weight, measured in centimetres and kilograms around the time of conception, were used to calculate the BMI for women who gave birth in Victoria. The BMI was calculated only for women with valid values reported for height and weight. Height and weight were not validly reported for 13.0% women in 2010 and 2011.
Table 4.11 shows that a small proportion of women were underweight (2.7% in 2010 and 2011), 44.1% were within the normal weight range, and 23.2% were overweight. In 2010 and 2011, 10.4% and 10.5% respectively reported a BMI of 30–34.9, 4.3% and 4.4% respectively a BMI of 35–39.9, and 2.3% and 2.4% respectively a BMI of 40 or higher.
Table 4.11: Maternal BMI, confinements 2010 and 2011
2010 2011
n % n %
< 18.5 1,951 2.7 1,957 2.7
18.5 to < 25 32,145 44.1 31,960 44.1
25 to < 30 16,919 23.2 16,847 23.2
30 to < 35 7,593 10.4 7,614 10.5
35 to < 40 3,138 4.3 3,171 4.4
40 to <50 1,540 2.1 1,617 2.2
50 to <60 145 0.2 164 0.2
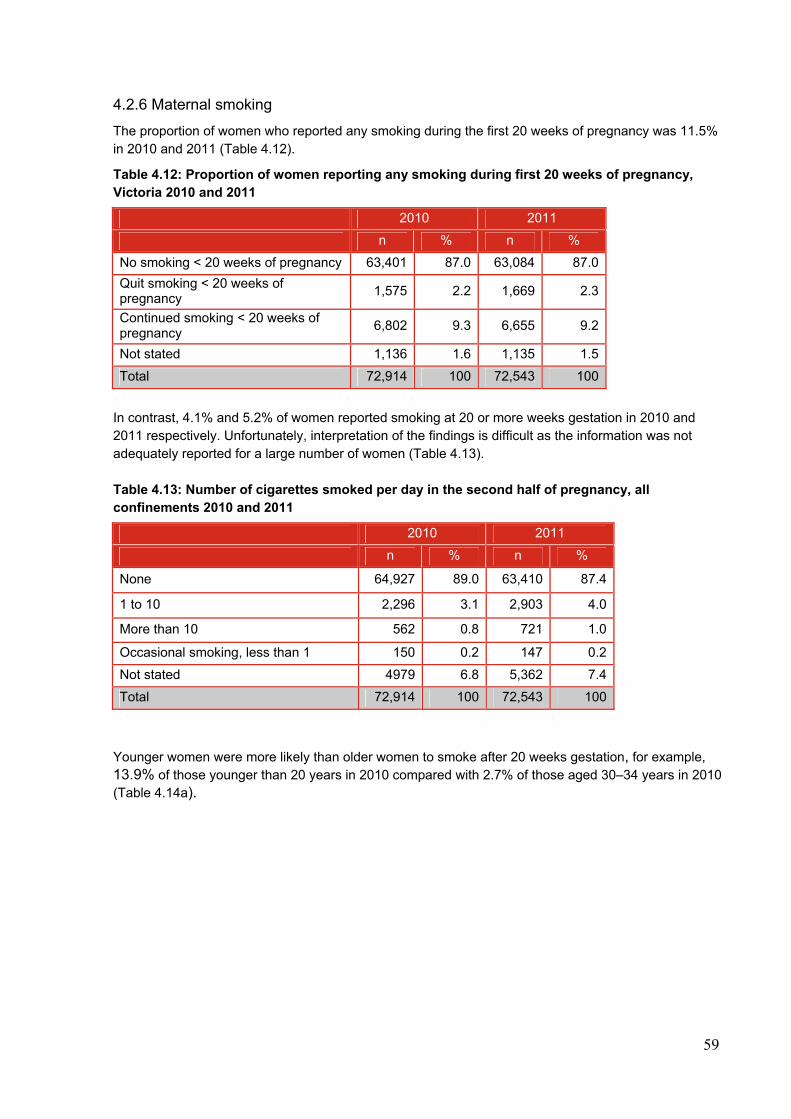
59
4.2.6 Maternal smoking
The proportion of women who reported any smoking during the first 20 weeks of pregnancy was 11.5% in 2010 and 2011 (Table 4.12).
Table 4.12: Proportion of women reporting any smoking during first 20 weeks of pregnancy, Victoria 2010 and 2011
2010 2011
n % n %
No smoking < 20 weeks of pregnancy 63,401 87.0 63,084 87.0
Quit smoking < 20 weeks of pregnancy
1,575 2.2 1,669 2.3
Continued smoking < 20 weeks of pregnancy
6,802 9.3 6,655 9.2
Not stated 1,136 1.6 1,135 1.5
Total 72,914 100 72,543 100
In contrast, 4.1% and 5.2% of women reported smoking at 20 or more weeks gestation in 2010 and 2011 respectively. Unfortunately, interpretation of the findings is difficult as the information was not adequately reported for a large number of women (Table 4.13). Table 4.13: Number of cigarettes smoked per day in the second half of pregnancy, all confinements 2010 and 2011
2010 2011
n % n %
None 64,927 89.0 63,410 87.4
1 to 10 2,296 3.1 2,903 4.0
More than 10 562 0.8 721 1.0
Occasional smoking, less than 1 150 0.2 147 0.2
Not stated 4979 6.8 5,362 7.4
Total 72,914 100 72,543 100
Younger women were more likely than older women to smoke after 20 weeks gestation, for example, 13.9% of those younger than 20 years in 2010 compared with 2.7% of those aged 30–34 years in 2010 (Table 4.14a).
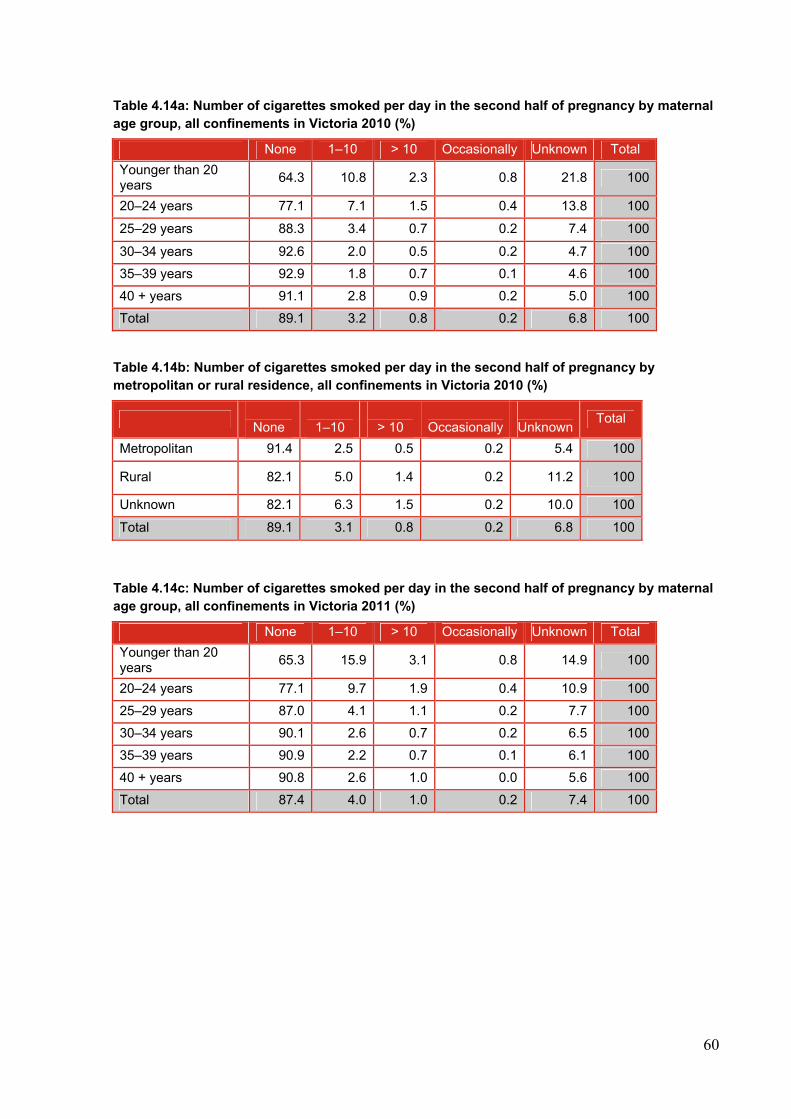
60
Table 4.14a: Number of cigarettes smoked per day in the second half of pregnancy by maternal age group, all confinements in Victoria 2010 (%)
None 1–10 > 10 Occasionally Unknown Total
Younger than 20 years
64.3 10.8 2.3 0.8 21.8 100
20–24 years 77.1 7.1 1.5 0.4 13.8 100
25–29 years 88.3 3.4 0.7 0.2 7.4 100
30–34 years 92.6 2.0 0.5 0.2 4.7 100
35–39 years 92.9 1.8 0.7 0.1 4.6 100
40 + years 91.1 2.8 0.9 0.2 5.0 100
Total 89.1 3.2 0.8 0.2 6.8 100
Table 4.14b: Number of cigarettes smoked per day in the second half of pregnancy by metropolitan or rural residence, all confinements in Victoria 2010 (%)
None
1–10
> 10
Occasionally
Unknown Total
Metropolitan 91.4 2.5 0.5 0.2 5.4 100
Rural 82.1 5.0 1.4 0.2 11.2 100
Unknown 82.1 6.3 1.5 0.2 10.0 100
Total 89.1 3.1 0.8 0.2 6.8 100
Table 4.14c: Number of cigarettes smoked per day in the second half of pregnancy by maternal age group, all confinements in Victoria 2011 (%)
None 1–10 > 10 Occasionally Unknown Total
Younger than 20 years
65.3 15.9 3.1 0.8 14.9 100
20–24 years 77.1 9.7 1.9 0.4 10.9 100
25–29 years 87.0 4.1 1.1 0.2 7.7 100
30–34 years 90.1 2.6 0.7 0.2 6.5 100
35–39 years 90.9 2.2 0.7 0.1 6.1 100
40 + years 90.8 2.6 1.0 0.0 5.6 100
Total 87.4 4.0 1.0 0.2 7.4 100
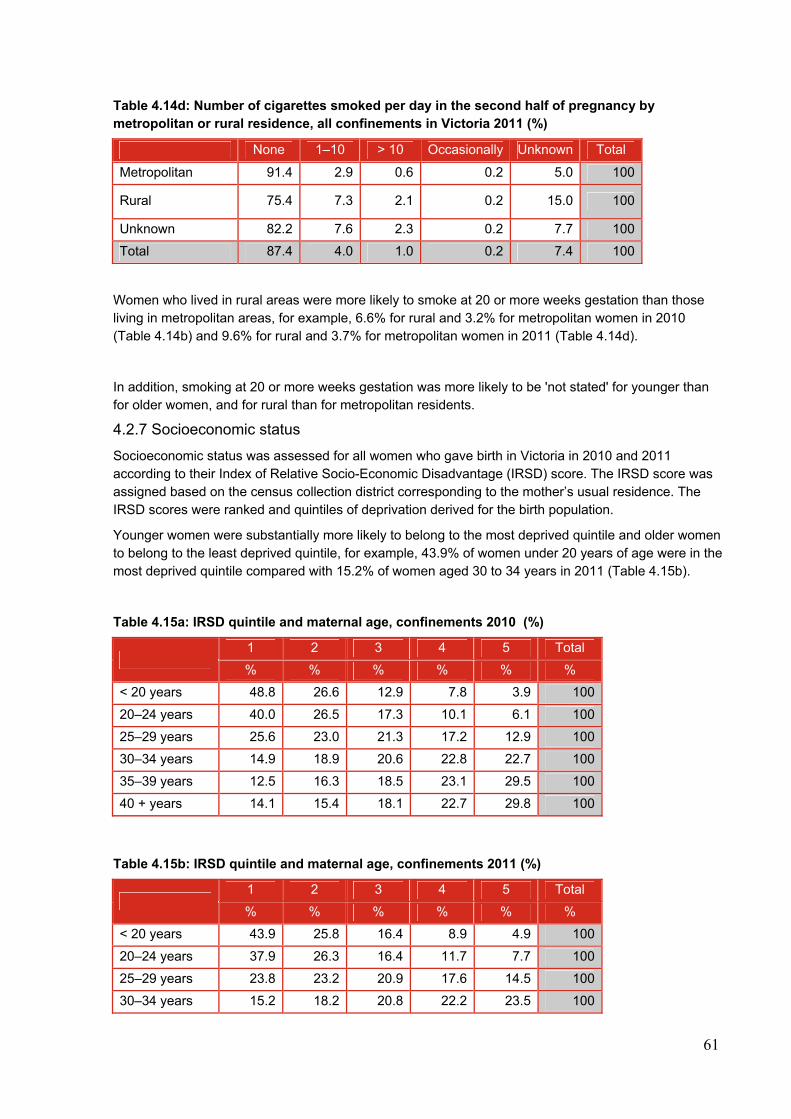
61
Table 4.14d: Number of cigarettes smoked per day in the second half of pregnancy by metropolitan or rural residence, all confinements in Victoria 2011 (%)
None 1–10 > 10 Occasionally Unknown Total
Metropolitan 91.4 2.9 0.6 0.2 5.0 100
Rural 75.4 7.3 2.1 0.2 15.0 100
Unknown 82.2 7.6 2.3 0.2 7.7 100
Total 87.4 4.0 1.0 0.2 7.4 100
Women who lived in rural areas were more likely to smoke at 20 or more weeks gestation than those living in metropolitan areas, for example, 6.6% for rural and 3.2% for metropolitan women in 2010 (Table 4.14b) and 9.6% for rural and 3.7% for metropolitan women in 2011 (Table 4.14d).
In addition, smoking at 20 or more weeks gestation was more likely to be 'not stated' for younger than for older women, and for rural than for metropolitan residents.
4.2.7 Socioeconomic status
Socioeconomic status was assessed for all women who gave birth in Victoria in 2010 and 2011 according to their Index of Relative Socio-Economic Disadvantage (IRSD) score. The IRSD score was assigned based on the census collection district corresponding to the mother’s usual residence. The IRSD scores were ranked and quintiles of deprivation derived for the birth population.
Younger women were substantially more likely to belong to the most deprived quintile and older women to belong to the least deprived quintile, for example, 43.9% of women under 20 years of age were in the most deprived quintile compared with 15.2% of women aged 30 to 34 years in 2011 (Table 4.15b).
Table 4.15a: IRSD quintile and maternal age, confinements 2010 (%)
1 2 3 4 5 Total
% % % % % %
< 20 years 48.8 26.6 12.9 7.8 3.9 100
20–24 years 40.0 26.5 17.3 10.1 6.1 100
25–29 years 25.6 23.0 21.3 17.2 12.9 100
30–34 years 14.9 18.9 20.6 22.8 22.7 100
35–39 years 12.5 16.3 18.5 23.1 29.5 100
40 + years 14.1 15.4 18.1 22.7 29.8 100
Table 4.15b: IRSD quintile and maternal age, confinements 2011 (%)
1 2 3 4 5 Total
% % % % % %
< 20 years 43.9 25.8 16.4 8.9 4.9 100
20–24 years 37.9 26.3 16.4 11.7 7.7 100
25–29 years 23.8 23.2 20.9 17.6 14.5 100
30–34 years 15.2 18.2 20.8 22.2 23.5 100
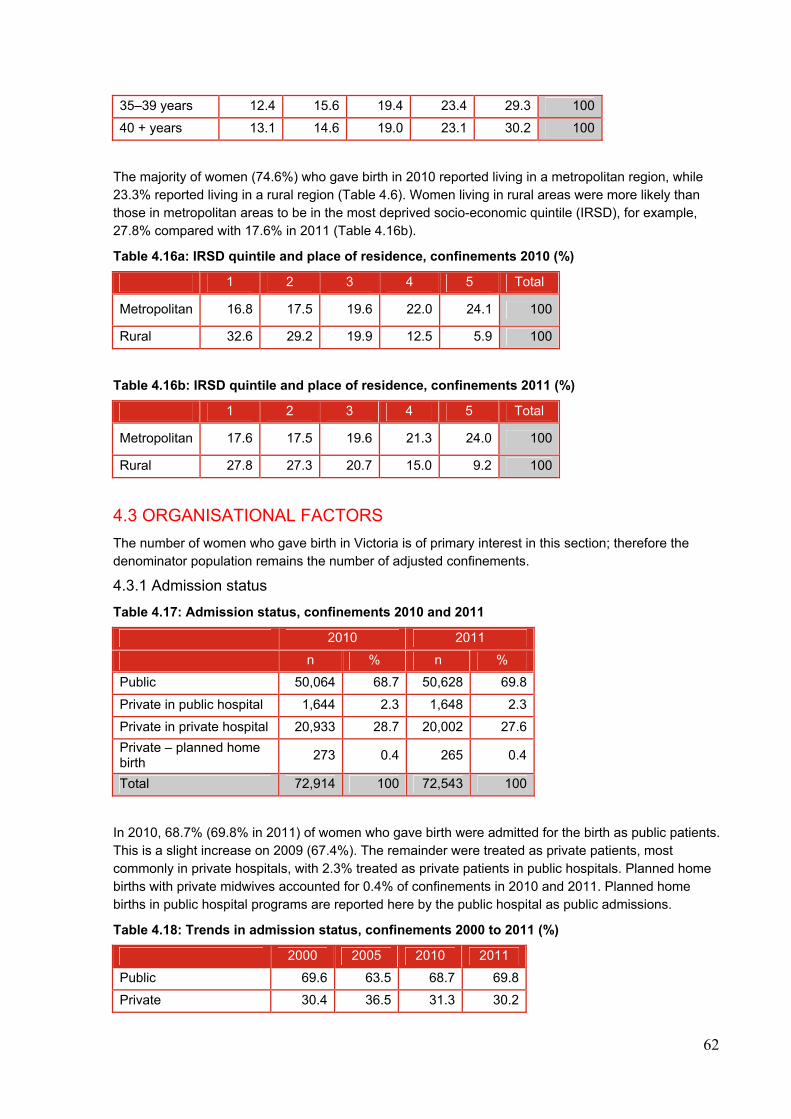
62
35–39 years 12.4 15.6 19.4 23.4 29.3 100
40 + years 13.1 14.6 19.0 23.1 30.2 100
The majority of women (74.6%) who gave birth in 2010 reported living in a metropolitan region, while 23.3% reported living in a rural region (Table 4.6). Women living in rural areas were more likely than those in metropolitan areas to be in the most deprived socio-economic quintile (IRSD), for example, 27.8% compared with 17.6% in 2011 (Table 4.16b).
Table 4.16a: IRSD quintile and place of residence, confinements 2010 (%)
1 2 3 4 5 Total
Metropolitan 16.8 17.5 19.6 22.0 24.1 100
Rural 32.6 29.2 19.9 12.5 5.9 100
Table 4.16b: IRSD quintile and place of residence, confinements 2011 (%)
1 2 3 4 5 Total
Metropolitan 17.6 17.5 19.6 21.3 24.0 100
Rural 27.8 27.3 20.7 15.0 9.2 100
4.3 ORGANISATIONAL FACTORS
The number of women who gave birth in Victoria is of primary interest in this section; therefore the denominator population remains the number of adjusted confinements.
4.3.1 Admission status
Table 4.17: Admission status, confinements 2010 and 2011
2010 2011
n % n %
Public 50,064 68.7 50,628 69.8
Private in public hospital 1,644 2.3 1,648 2.3
Private in private hospital 20,933 28.7 20,002 27.6
Private – planned home birth
273 0.4 265 0.4
Total 72,914 100 72,543 100
In 2010, 68.7% (69.8% in 2011) of women who gave birth were admitted for the birth as public patients. This is a slight increase on 2009 (67.4%). The remainder were treated as private patients, most commonly in private hospitals, with 2.3% treated as private patients in public hospitals. Planned home births with private midwives accounted for 0.4% of confinements in 2010 and 2011. Planned home births in public hospital programs are reported here by the public hospital as public admissions.
Table 4.18: Trends in admission status, confinements 2000 to 2011 (%)
2000 2005 2010 2011
Public 69.6 63.5 68.7 69.8
Private 30.4 36.5 31.3 30.2
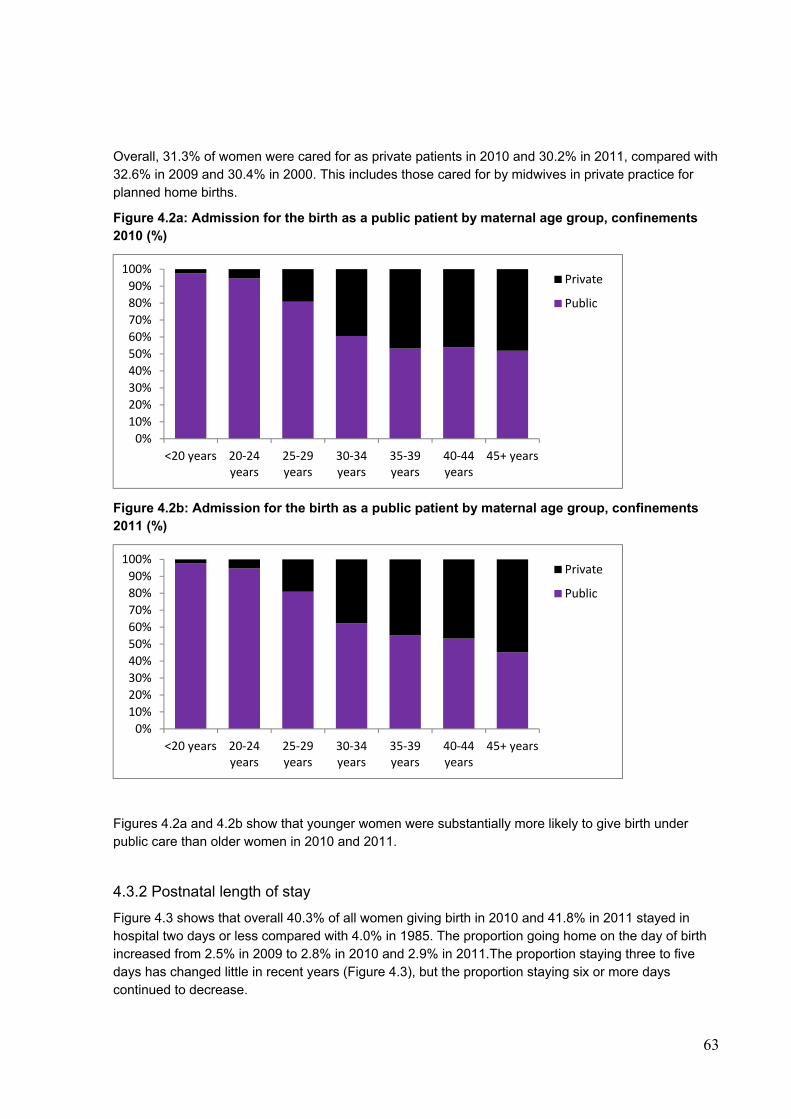
63
Overall, 31.3% of women were cared for as private patients in 2010 and 30.2% in 2011, compared with 32.6% in 2009 and 30.4% in 2000. This includes those cared for by midwives in private practice for planned home births.
Figure 4.2a: Admission for the birth as a public patient by maternal age group, confinements 2010 (%)
Figure 4.2b: Admission for the birth as a public patient by maternal age group, confinements 2011 (%)
Figures 4.2a and 4.2b show that younger women were substantially more likely to give birth under public care than older women in 2010 and 2011.
4.3.2 Postnatal length of stay
Figure 4.3 shows that overall 40.3% of all women giving birth in 2010 and 41.8% in 2011 stayed in hospital two days or less compared with 4.0% in 1985. The proportion going home on the day of birth increased from 2.5% in 2009 to 2.8% in 2010 and 2.9% in 2011.The proportion staying three to five days has changed little in recent years (Figure 4.3), but the proportion staying six or more days continued to decrease.
0%
10%
20%
30%
40%
50%
60%
70%
80%
90%
100%
<20 years 20‐24years
25‐29years
30‐34years
35‐39years
40‐44years
45+ years
Private
Public
0%
10%
20%
30%
40%
50%
60%
70%
80%
90%
100%
<20 years 20‐24years
25‐29years
30‐34years
35‐39years
40‐44years
45+ years
Private
Public
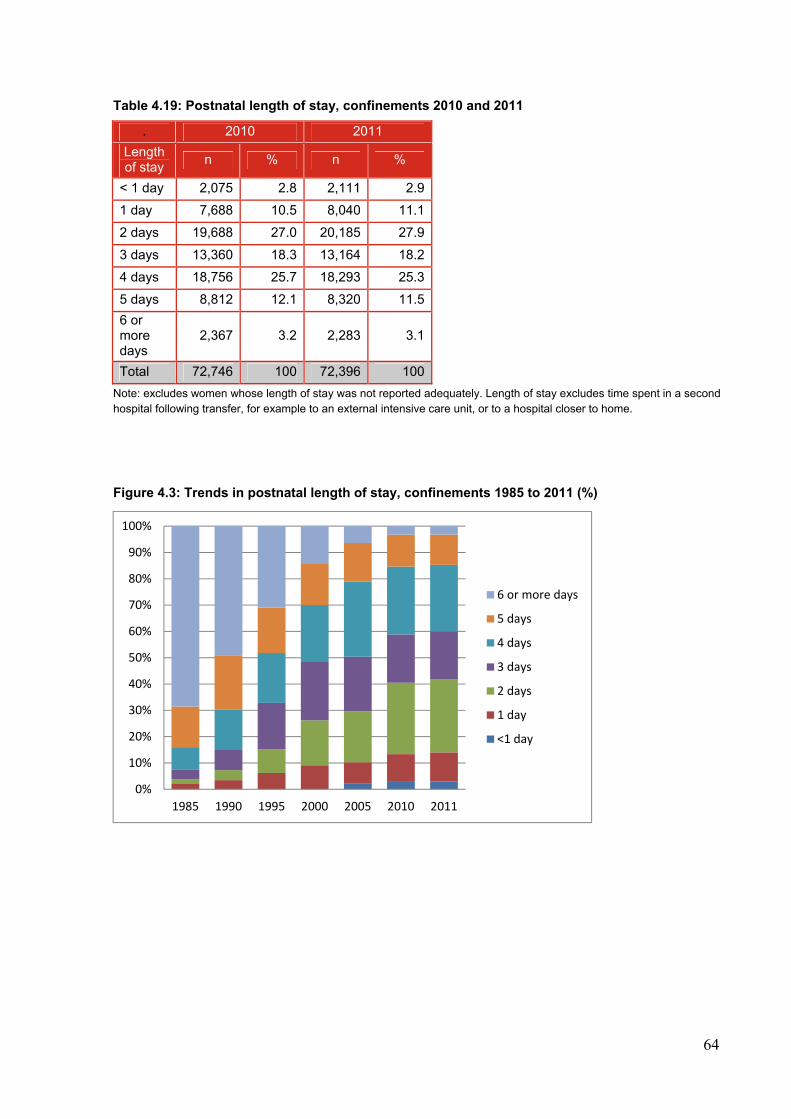
64
Table 4.19: Postnatal length of stay, confinements 2010 and 2011
. 2010 2011
Length of stay
n % n %
< 1 day 2,075 2.8 2,111 2.9
1 day 7,688 10.5 8,040 11.1
2 days 19,688 27.0 20,185 27.9
3 days 13,360 18.3 13,164 18.2
4 days 18,756 25.7 18,293 25.3
5 days 8,812 12.1 8,320 11.5
6 or more days
2,367 3.2 2,283 3.1
Total 72,746 100 72,396 100
Note: excludes women whose length of stay was not reported adequately. Length of stay excludes time spent in a second hospital following transfer, for example to an external intensive care unit, or to a hospital closer to home.
Figure 4.3: Trends in postnatal length of stay, confinements 1985 to 2011 (%)
0%
10%
20%
30%
40%
50%
60%
70%
80%
90%
100%
1985 1990 1995 2000 2005 2010 2011
6 or more days
5 days
4 days
3 days
2 days
1 day
<1 day
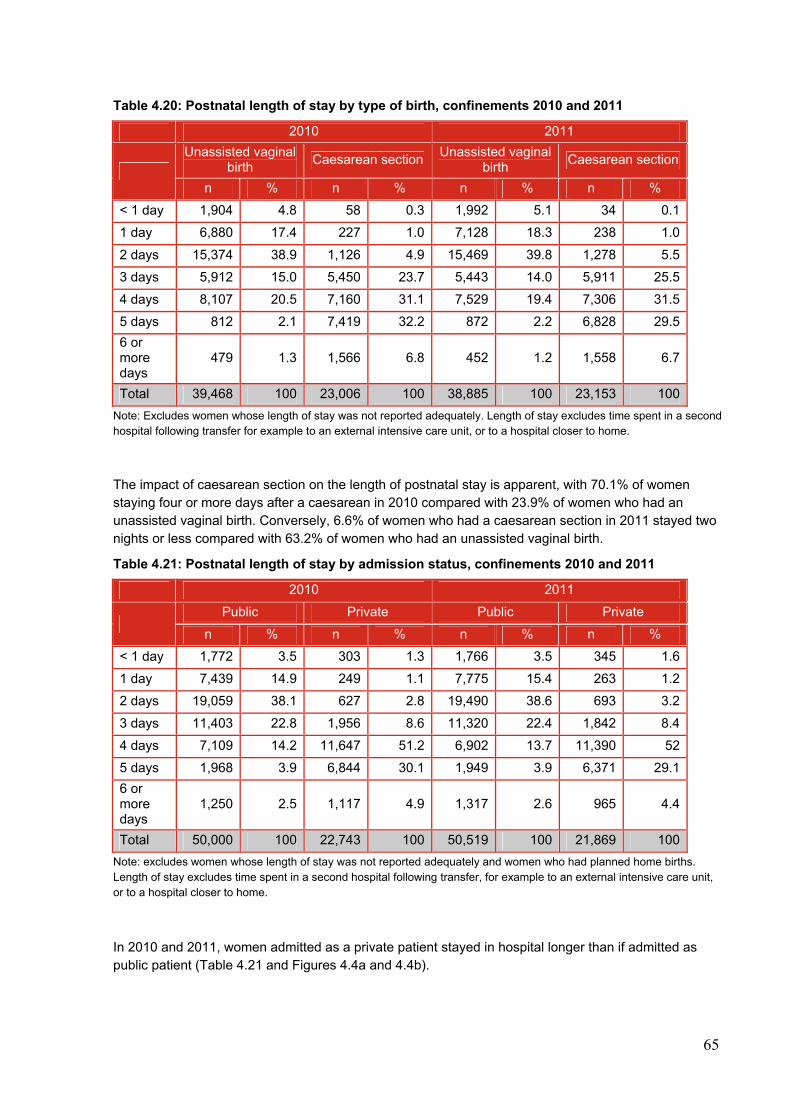
65
Table 4.20: Postnatal length of stay by type of birth, confinements 2010 and 2011
2010 2011
Unassisted vaginal birth
Caesarean section Unassisted vaginal
birth Caesarean section
n % n % n % n %
< 1 day 1,904 4.8 58 0.3 1,992 5.1 34 0.1
1 day 6,880 17.4 227 1.0 7,128 18.3 238 1.0
2 days 15,374 38.9 1,126 4.9 15,469 39.8 1,278 5.5
3 days 5,912 15.0 5,450 23.7 5,443 14.0 5,911 25.5
4 days 8,107 20.5 7,160 31.1 7,529 19.4 7,306 31.5
5 days 812 2.1 7,419 32.2 872 2.2 6,828 29.5
6 or more days
479 1.3 1,566 6.8 452 1.2 1,558 6.7
Total 39,468 100 23,006 100 38,885 100 23,153 100
Note: Excludes women whose length of stay was not reported adequately. Length of stay excludes time spent in a second hospital following transfer for example to an external intensive care unit, or to a hospital closer to home.
The impact of caesarean section on the length of postnatal stay is apparent, with 70.1% of women staying four or more days after a caesarean in 2010 compared with 23.9% of women who had an unassisted vaginal birth. Conversely, 6.6% of women who had a caesarean section in 2011 stayed two nights or less compared with 63.2% of women who had an unassisted vaginal birth.
Table 4.21: Postnatal length of stay by admission status, confinements 2010 and 2011
2010 2011
Public Private Public Private
n % n % n % n %
< 1 day 1,772 3.5 303 1.3 1,766 3.5 345 1.6
1 day 7,439 14.9 249 1.1 7,775 15.4 263 1.2
2 days 19,059 38.1 627 2.8 19,490 38.6 693 3.2
3 days 11,403 22.8 1,956 8.6 11,320 22.4 1,842 8.4
4 days 7,109 14.2 11,647 51.2 6,902 13.7 11,390 52
5 days 1,968 3.9 6,844 30.1 1,949 3.9 6,371 29.1
6 or more days
1,250 2.5 1,117 4.9 1,317 2.6 965 4.4
Total 50,000 100 22,743 100 50,519 100 21,869 100
Note: excludes women whose length of stay was not reported adequately and women who had planned home births. Length of stay excludes time spent in a second hospital following transfer, for example to an external intensive care unit, or to a hospital closer to home.
In 2010 and 2011, women admitted as a private patient stayed in hospital longer than if admitted as public patient (Table 4.21 and Figures 4.4a and 4.4b).
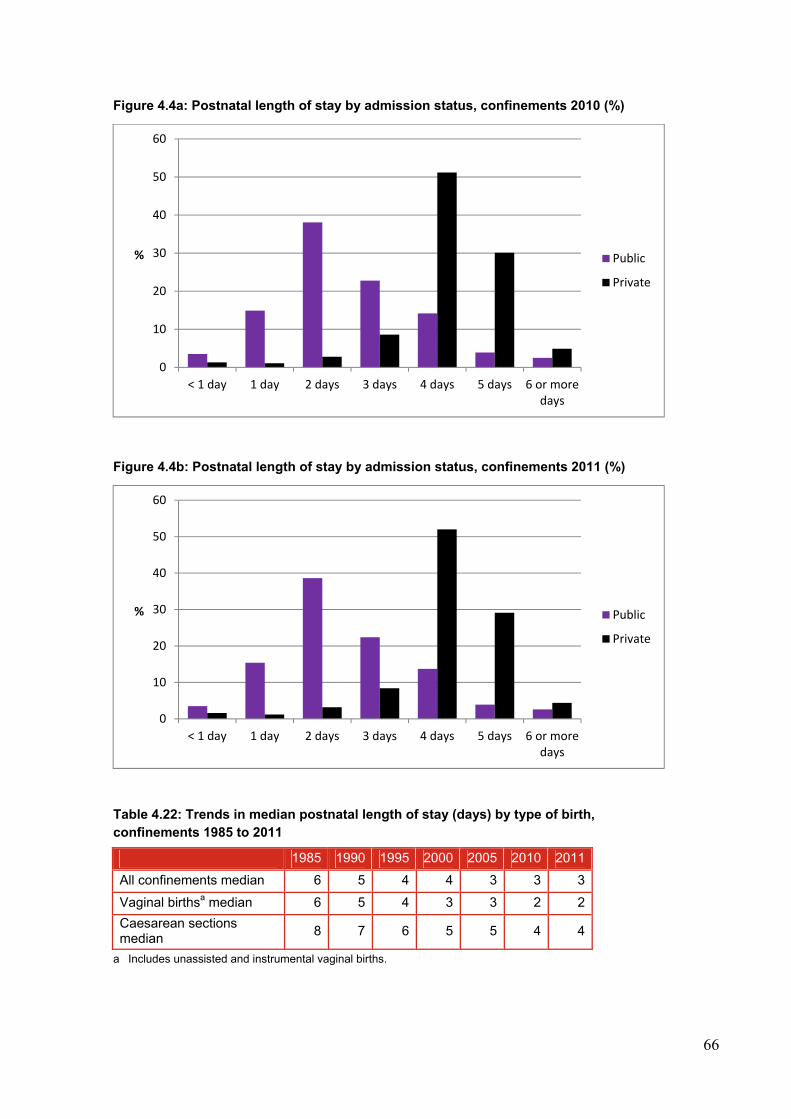
66
Figure 4.4a: Postnatal length of stay by admission status, confinements 2010 (%)
Figure 4.4b: Postnatal length of stay by admission status, confinements 2011 (%)
Table 4.22: Trends in median postnatal length of stay (days) by type of birth, confinements 1985 to 2011
1985 1990 1995 2000 2005 2010 2011
All confinements median 6 5 4 4 3 3 3
Vaginal birthsa median 6 5 4 3 3 2 2
Caesarean sections median
8 7 6 5 5 4 4
a Includes unassisted and instrumental vaginal births.
0
10
20
30
40
50
60
< 1 day 1 day 2 days 3 days 4 days 5 days 6 or moredays
% Public
Private
0
10
20
30
40
50
60
< 1 day 1 day 2 days 3 days 4 days 5 days 6 or moredays
% Public
Private
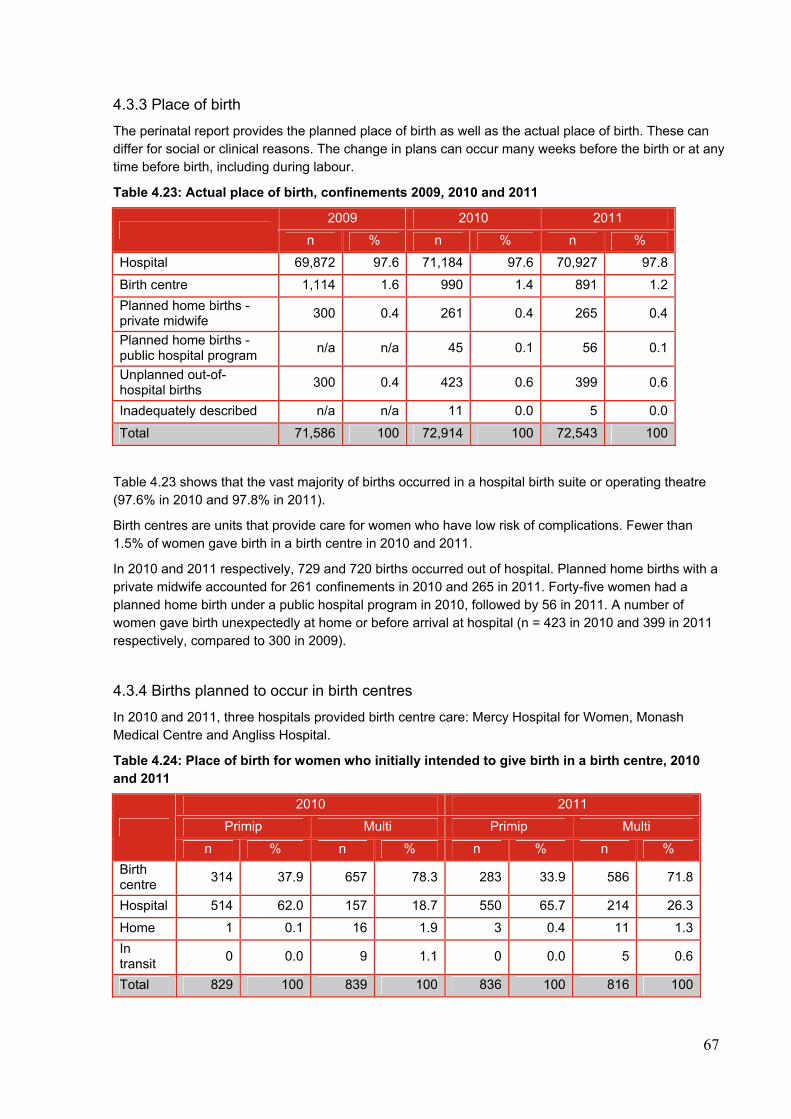
67
4.3.3 Place of birth
The perinatal report provides the planned place of birth as well as the actual place of birth. These can differ for social or clinical reasons. The change in plans can occur many weeks before the birth or at any time before birth, including during labour.
Table 4.23: Actual place of birth, confinements 2009, 2010 and 2011
2009 2010 2011
n % n % n %
Hospital 69,872 97.6 71,184 97.6 70,927 97.8
Birth centre 1,114 1.6 990 1.4 891 1.2
Planned home births - private midwife
300 0.4 261 0.4 265 0.4
Planned home births - public hospital program
n/a n/a 45 0.1 56 0.1
Unplanned out-of-hospital births
300 0.4 423 0.6 399 0.6
Inadequately described n/a n/a 11 0.0 5 0.0
Total 71,586 100 72,914 100 72,543 100
Table 4.23 shows that the vast majority of births occurred in a hospital birth suite or operating theatre (97.6% in 2010 and 97.8% in 2011).
Birth centres are units that provide care for women who have low risk of complications. Fewer than 1.5% of women gave birth in a birth centre in 2010 and 2011.
In 2010 and 2011 respectively, 729 and 720 births occurred out of hospital. Planned home births with a private midwife accounted for 261 confinements in 2010 and 265 in 2011. Forty-five women had a planned home birth under a public hospital program in 2010, followed by 56 in 2011. A number of women gave birth unexpectedly at home or before arrival at hospital (n = 423 in 2010 and 399 in 2011 respectively, compared to 300 in 2009).
4.3.4 Births planned to occur in birth centres
In 2010 and 2011, three hospitals provided birth centre care: Mercy Hospital for Women, Monash Medical Centre and Angliss Hospital.
Table 4.24: Place of birth for women who initially intended to give birth in a birth centre, 2010 and 2011
2010 2011
Primip Multi Primip Multi
n % n % n % n %
Birth centre
314 37.9 657 78.3 283 33.9 586 71.8
Hospital 514 62.0 157 18.7 550 65.7 214 26.3
Home 1 0.1 16 1.9 3 0.4 11 1.3
In transit
0 0.0 9 1.1 0 0.0 5 0.6
Total 829 100 839 100 836 100 816 100
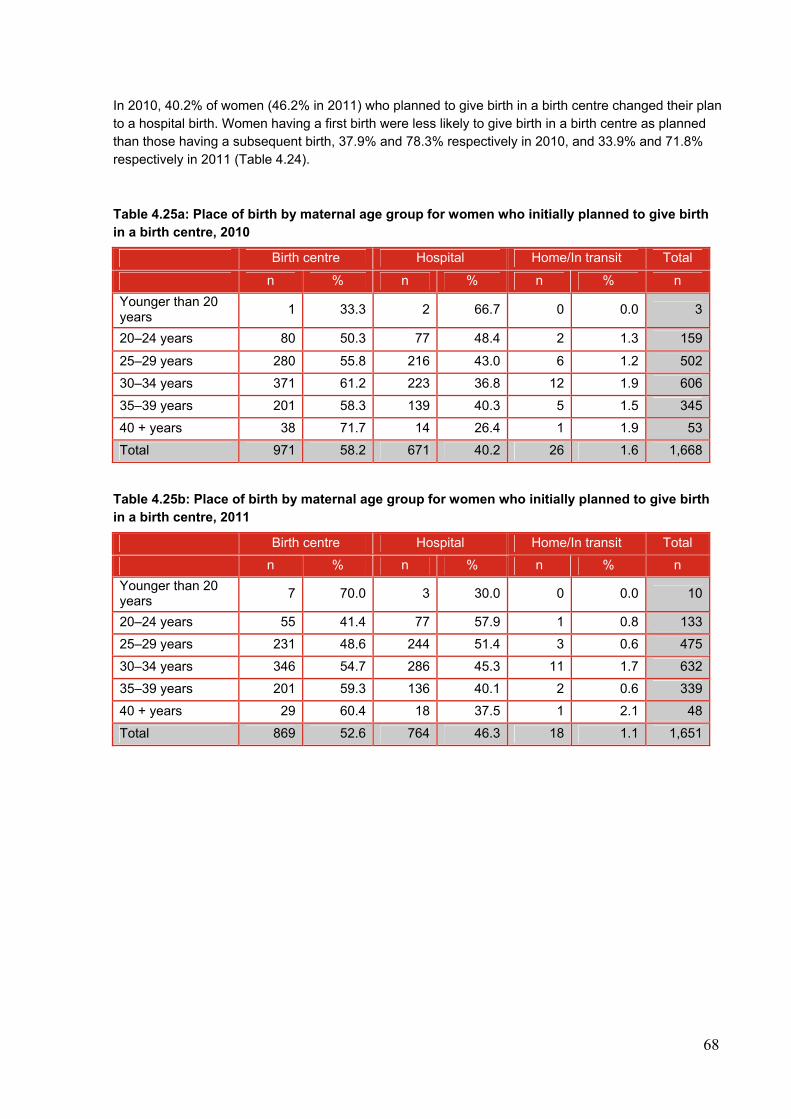
68
In 2010, 40.2% of women (46.2% in 2011) who planned to give birth in a birth centre changed their plan to a hospital birth. Women having a first birth were less likely to give birth in a birth centre as planned than those having a subsequent birth, 37.9% and 78.3% respectively in 2010, and 33.9% and 71.8% respectively in 2011 (Table 4.24).
Table 4.25a: Place of birth by maternal age group for women who initially planned to give birth in a birth centre, 2010
Birth centre Hospital Home/In transit Total
n % n % n % n
Younger than 20 years
1 33.3 2 66.7 0 0.0 3
20–24 years 80 50.3 77 48.4 2 1.3 159
25–29 years 280 55.8 216 43.0 6 1.2 502
30–34 years 371 61.2 223 36.8 12 1.9 606
35–39 years 201 58.3 139 40.3 5 1.5 345
40 + years 38 71.7 14 26.4 1 1.9 53
Total 971 58.2 671 40.2 26 1.6 1,668
Table 4.25b: Place of birth by maternal age group for women who initially planned to give birth in a birth centre, 2011
Birth centre Hospital Home/In transit Total
n % n % n % n
Younger than 20 years
7 70.0 3 30.0 0 0.0 10
20–24 years 55 41.4 77 57.9 1 0.8 133
25–29 years 231 48.6 244 51.4 3 0.6 475
30–34 years 346 54.7 286 45.3 11 1.7 632
35–39 years 201 59.3 136 40.1 2 0.6 339
40 + years 29 60.4 18 37.5 1 2.1 48
Total 869 52.6 764 46.3 18 1.1 1,651
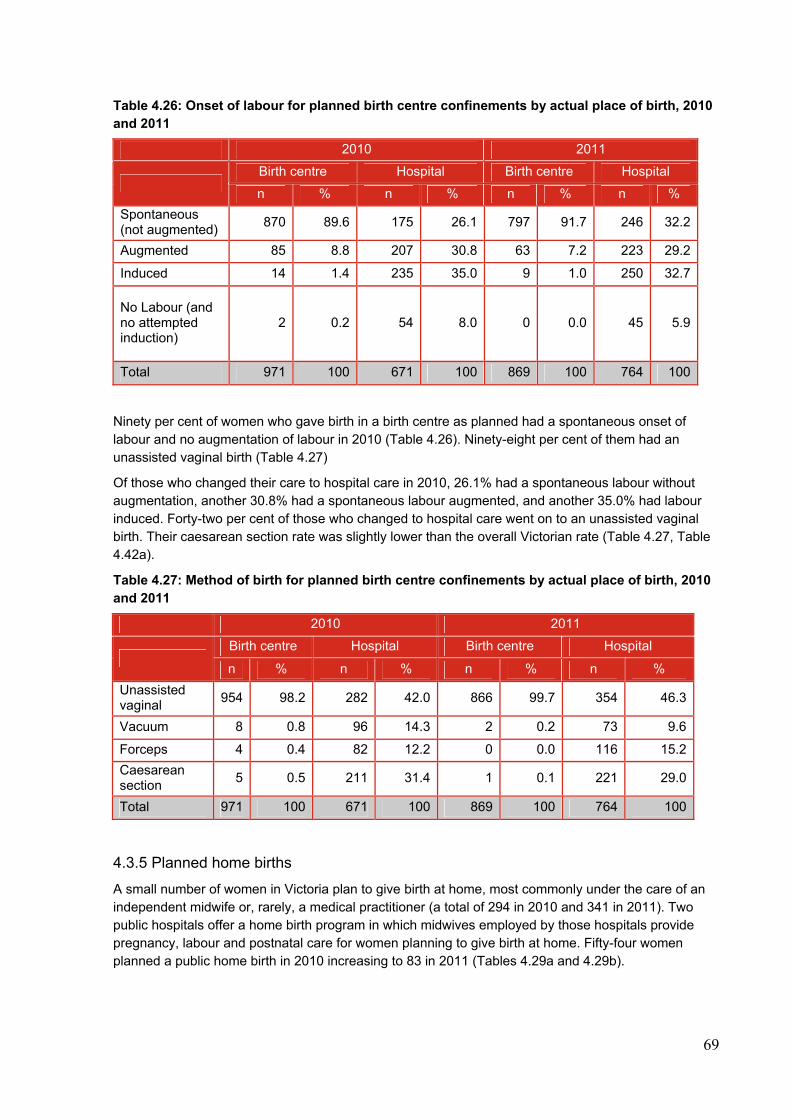
69
Table 4.26: Onset of labour for planned birth centre confinements by actual place of birth, 2010 and 2011
2010 2011
Birth centre Hospital Birth centre Hospital
n % n % n % n %
Spontaneous (not augmented)
870 89.6 175 26.1 797 91.7 246 32.2
Augmented 85 8.8 207 30.8 63 7.2 223 29.2
Induced 14 1.4 235 35.0 9 1.0 250 32.7
No Labour (and no attempted induction)
2 0.2 54 8.0 0 0.0 45 5.9
Total 971 100 671 100 869 100 764 100
Ninety per cent of women who gave birth in a birth centre as planned had a spontaneous onset of labour and no augmentation of labour in 2010 (Table 4.26). Ninety-eight per cent of them had an unassisted vaginal birth (Table 4.27)
Of those who changed their care to hospital care in 2010, 26.1% had a spontaneous labour without augmentation, another 30.8% had a spontaneous labour augmented, and another 35.0% had labour induced. Forty-two per cent of those who changed to hospital care went on to an unassisted vaginal birth. Their caesarean section rate was slightly lower than the overall Victorian rate (Table 4.27, Table 4.42a).
Table 4.27: Method of birth for planned birth centre confinements by actual place of birth, 2010 and 2011
2010 2011
Birth centre Hospital Birth centre Hospital
n % n % n % n %
Unassisted vaginal
954 98.2 282 42.0 866 99.7 354 46.3
Vacuum 8 0.8 96 14.3 2 0.2 73 9.6
Forceps 4 0.4 82 12.2 0 0.0 116 15.2
Caesarean section
5 0.5 211 31.4 1 0.1 221 29.0
Total 971 100 671 100 869 100 764 100
4.3.5 Planned home births
A small number of women in Victoria plan to give birth at home, most commonly under the care of an independent midwife or, rarely, a medical practitioner (a total of 294 in 2010 and 341 in 2011). Two public hospitals offer a home birth program in which midwives employed by those hospitals provide pregnancy, labour and postnatal care for women planning to give birth at home. Fifty-four women planned a public home birth in 2010 increasing to 83 in 2011 (Tables 4.29a and 4.29b).
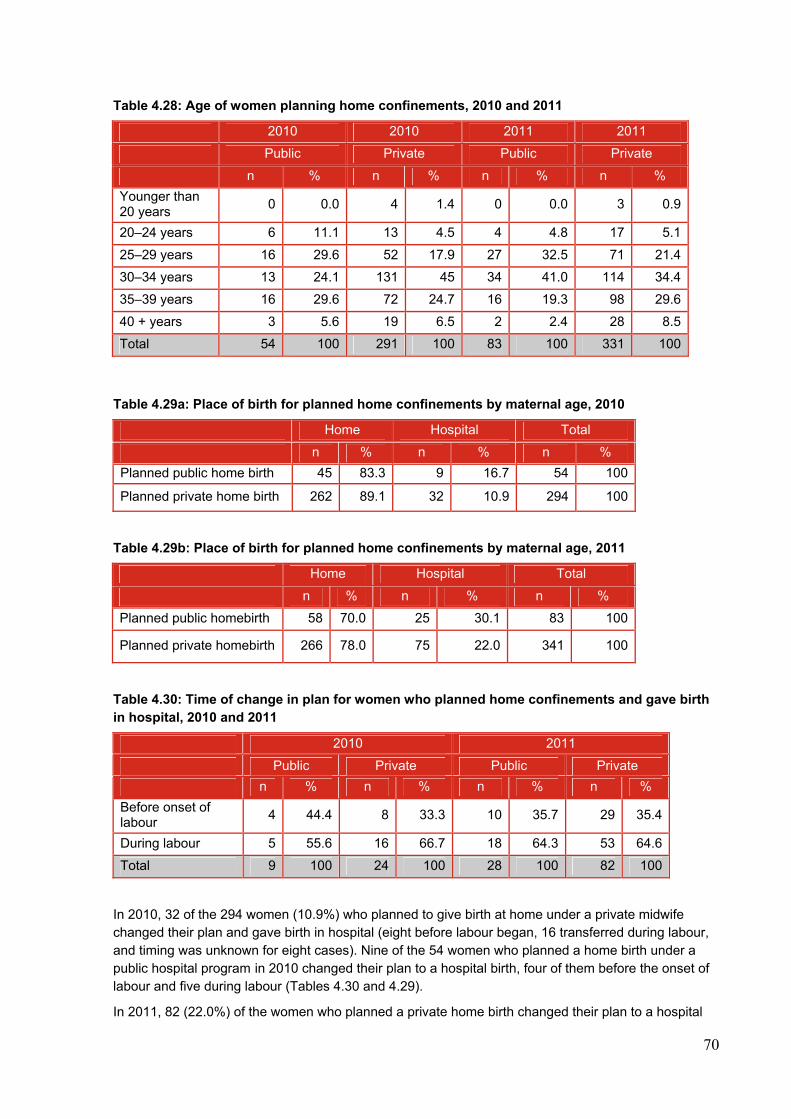
70
Table 4.28: Age of women planning home confinements, 2010 and 2011
2010 2010 2011 2011
Public Private Public Private
n % n % n % n %
Younger than 20 years
0 0.0 4 1.4 0 0.0 3 0.9
20–24 years 6 11.1 13 4.5 4 4.8 17 5.1
25–29 years 16 29.6 52 17.9 27 32.5 71 21.4
30–34 years 13 24.1 131 45 34 41.0 114 34.4
35–39 years 16 29.6 72 24.7 16 19.3 98 29.6
40 + years 3 5.6 19 6.5 2 2.4 28 8.5
Total 54 100 291 100 83 100 331 100
Table 4.29a: Place of birth for planned home confinements by maternal age, 2010
Home Hospital Total
n % n % n %
Planned public home birth 45 83.3 9 16.7 54 100
Planned private home birth 262 89.1 32 10.9 294 100
Table 4.29b: Place of birth for planned home confinements by maternal age, 2011
Home Hospital Total
n % n % n %
Planned public homebirth 58 70.0 25 30.1 83 100
Planned private homebirth 266 78.0 75 22.0 341 100
Table 4.30: Time of change in plan for women who planned home confinements and gave birth in hospital, 2010 and 2011
2010 2011
Public Private Public Private
n % n % n % n %
Before onset of labour
4 44.4 8 33.3 10 35.7 29 35.4
During labour 5 55.6 16 66.7 18 64.3 53 64.6
Total 9 100 24 100 28 100 82 100
In 2010, 32 of the 294 women (10.9%) who planned to give birth at home under a private midwife changed their plan and gave birth in hospital (eight before labour began, 16 transferred during labour, and timing was unknown for eight cases). Nine of the 54 women who planned a home birth under a public hospital program in 2010 changed their plan to a hospital birth, four of them before the onset of labour and five during labour (Tables 4.30 and 4.29).
In 2011, 82 (22.0%) of the women who planned a private home birth changed their plan to a hospital
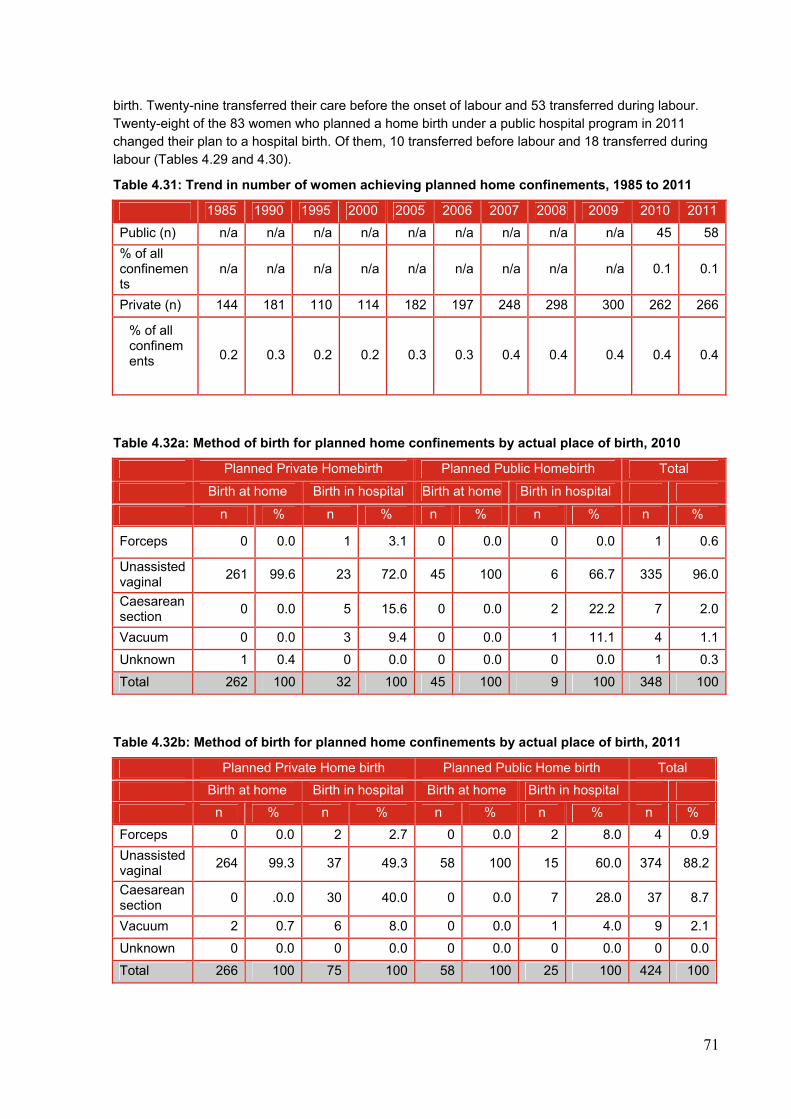
71
birth. Twenty-nine transferred their care before the onset of labour and 53 transferred during labour. Twenty-eight of the 83 women who planned a home birth under a public hospital program in 2011 changed their plan to a hospital birth. Of them, 10 transferred before labour and 18 transferred during labour (Tables 4.29 and 4.30).
Table 4.31: Trend in number of women achieving planned home confinements, 1985 to 2011
1985 1990 1995 2000 2005 2006 2007 2008 2009 2010 2011
Public (n) n/a n/a n/a n/a n/a n/a n/a n/a n/a 45 58
% of all confinements
n/a n/a n/a n/a n/a n/a n/a n/a n/a 0.1 0.1
Private (n) 144 181 110 114 182 197 248 298 300 262 266
0.2 0.3 0.2 0.2 0.3 0.3 0.4 0.4 0.4 0.4 0.4
Table 4.32a: Method of birth for planned home confinements by actual place of birth, 2010
Planned Private Homebirth Planned Public Homebirth Total
Birth at home Birth in hospital Birth at home Birth in hospital
n % n % n % n % n %
Forceps 0 0.0 1 3.1 0 0.0 0 0.0 1 0.6
Unassisted vaginal
261 99.6 23 72.0 45 100 6 66.7 335 96.0
Caesarean section
0 0.0 5 15.6 0 0.0 2 22.2 7 2.0
Vacuum 0 0.0 3 9.4 0 0.0 1 11.1 4 1.1
Unknown 1 0.4 0 0.0 0 0.0 0 0.0 1 0.3
Total 262 100 32 100 45 100 9 100 348 100
Table 4.32b: Method of birth for planned home confinements by actual place of birth, 2011
Planned Private Home birth Planned Public Home birth Total
Birth at home Birth in hospital Birth at home Birth in hospital
n % n % n % n % n %
Forceps 0 0.0 2 2.7 0 0.0 2 8.0 4 0.9
Unassisted vaginal
264 99.3 37 49.3 58 100 15 60.0 374 88.2
Caesarean section
0 .0.0 30 40.0 0 0.0 7 28.0 37 8.7
Vacuum 2 0.7 6 8.0 0 0.0 1 4.0 9 2.1
Unknown 0 0.0 0 0.0 0 0.0 0 0.0 0 0.0
Total 266 100 75 100 58 100 25 100 424 100
% of all confinements
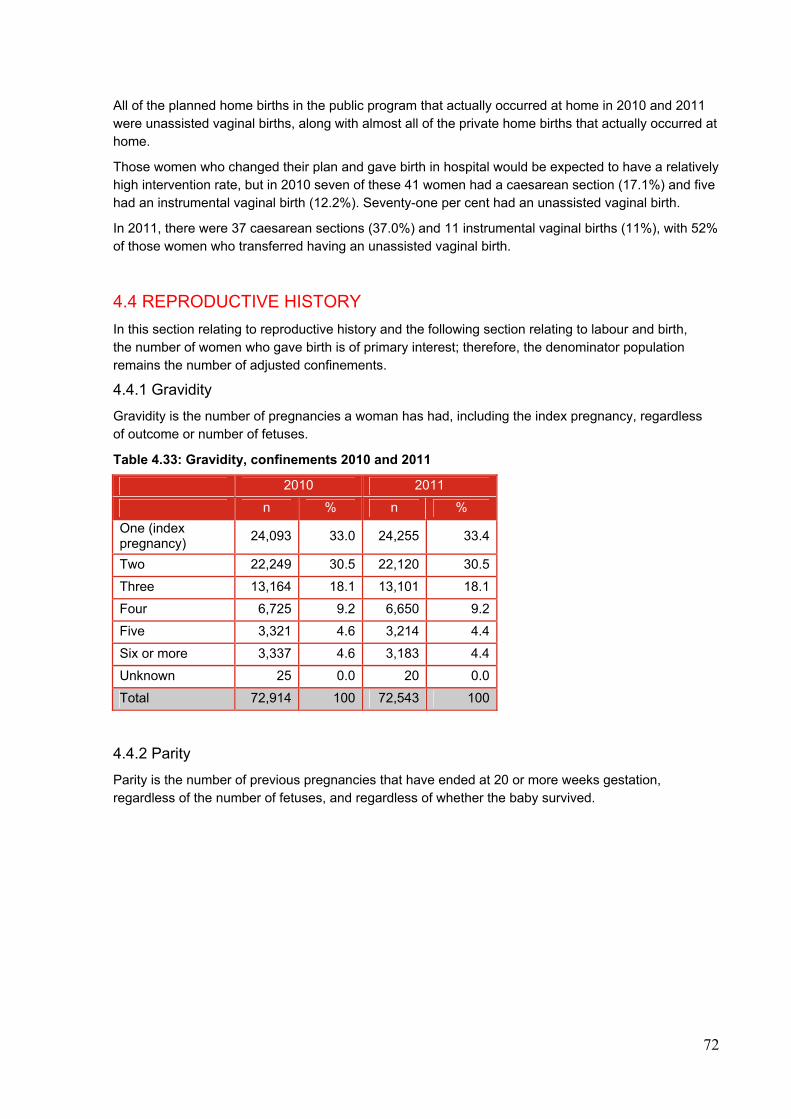
72
All of the planned home births in the public program that actually occurred at home in 2010 and 2011 were unassisted vaginal births, along with almost all of the private home births that actually occurred at home.
Those women who changed their plan and gave birth in hospital would be expected to have a relatively high intervention rate, but in 2010 seven of these 41 women had a caesarean section (17.1%) and five had an instrumental vaginal birth (12.2%). Seventy-one per cent had an unassisted vaginal birth.
In 2011, there were 37 caesarean sections (37.0%) and 11 instrumental vaginal births (11%), with 52% of those women who transferred having an unassisted vaginal birth.
4.4 REPRODUCTIVE HISTORY
In this section relating to reproductive history and the following section relating to labour and birth, the number of women who gave birth is of primary interest; therefore, the denominator population remains the number of adjusted confinements.
4.4.1 Gravidity
Gravidity is the number of pregnancies a woman has had, including the index pregnancy, regardless of outcome or number of fetuses.
Table 4.33: Gravidity, confinements 2010 and 2011
2010 2011
n % n %
One (index pregnancy)
24,093 33.0 24,255 33.4
Two 22,249 30.5 22,120 30.5
Three 13,164 18.1 13,101 18.1
Four 6,725 9.2 6,650 9.2
Five 3,321 4.6 3,214 4.4
Six or more 3,337 4.6 3,183 4.4
Unknown 25 0.0 20 0.0
Total 72,914 100 72,543 100
4.4.2 Parity
Parity is the number of previous pregnancies that have ended at 20 or more weeks gestation, regardless of the number of fetuses, and regardless of whether the baby survived.
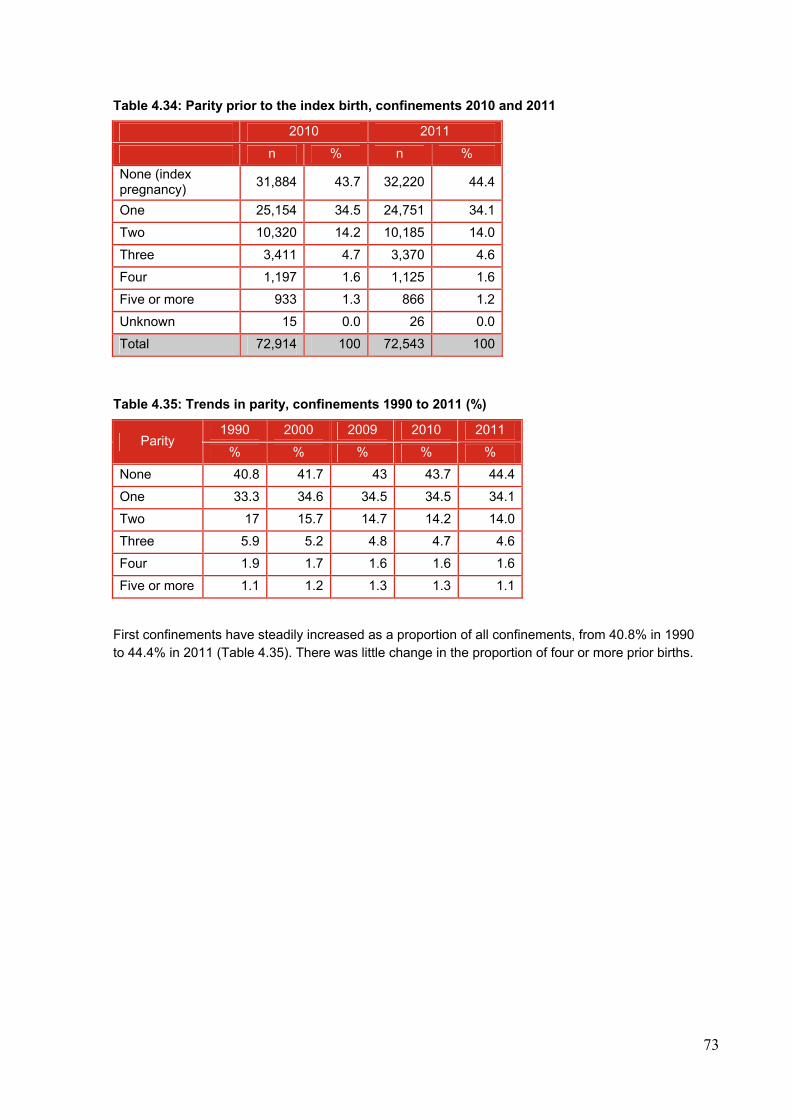
73
Table 4.34: Parity prior to the index birth, confinements 2010 and 2011
2010 2011
n % n %
None (index pregnancy)
31,884 43.7 32,220 44.4
One 25,154 34.5 24,751 34.1
Two 10,320 14.2 10,185 14.0
Three 3,411 4.7 3,370 4.6
Four 1,197 1.6 1,125 1.6
Five or more 933 1.3 866 1.2
Unknown 15 0.0 26 0.0
Total 72,914 100 72,543 100
Table 4.35: Trends in parity, confinements 1990 to 2011 (%)
Parity 1990 2000 2009 2010 2011
% % % % %
None 40.8 41.7 43 43.7 44.4
One 33.3 34.6 34.5 34.5 34.1
Two 17 15.7 14.7 14.2 14.0
Three 5.9 5.2 4.8 4.7 4.6
Four 1.9 1.7 1.6 1.6 1.6
Five or more 1.1 1.2 1.3 1.3 1.1
First confinements have steadily increased as a proportion of all confinements, from 40.8% in 1990 to 44.4% in 2011 (Table 4.35). There was little change in the proportion of four or more prior births.
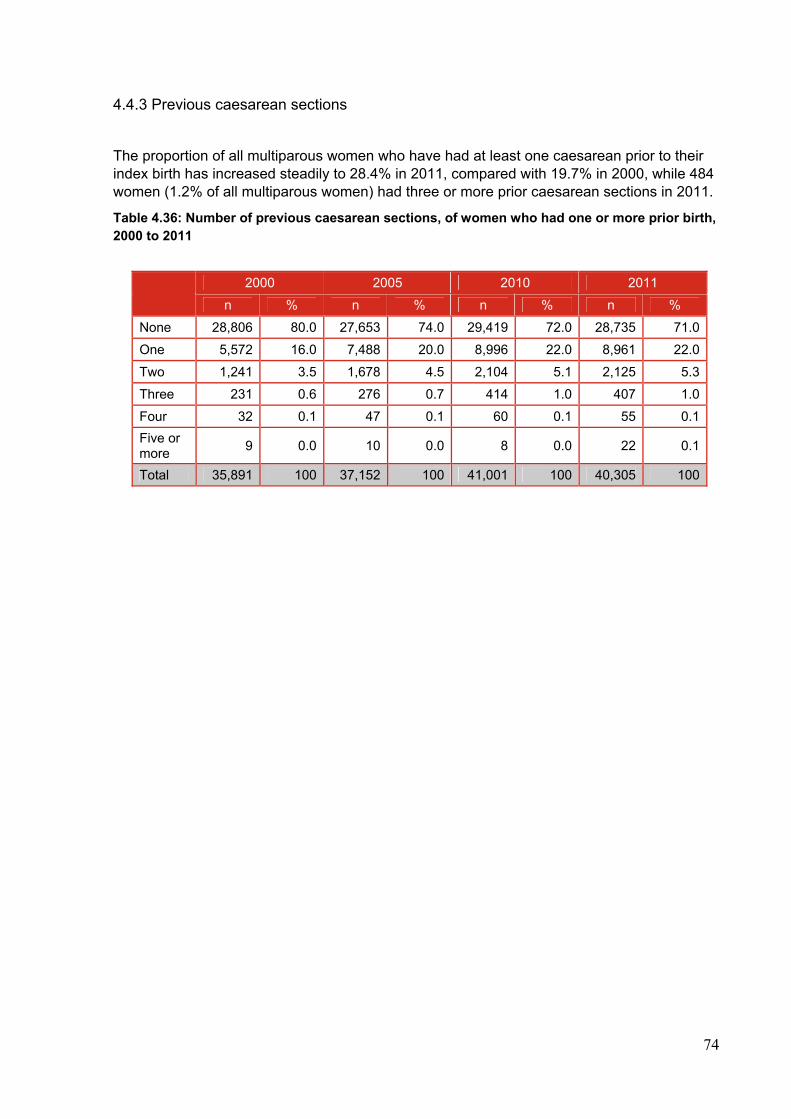
74
4.4.3 Previous caesarean sections
The proportion of all multiparous women who have had at least one caesarean prior to their index birth has increased steadily to 28.4% in 2011, compared with 19.7% in 2000, while 484 women (1.2% of all multiparous women) had three or more prior caesarean sections in 2011.
Table 4.36: Number of previous caesarean sections, of women who had one or more prior birth, 2000 to 2011
2000 2005 2010 2011
n % n % n % n %
None 28,806 80.0 27,653 74.0 29,419 72.0 28,735 71.0
One 5,572 16.0 7,488 20.0 8,996 22.0 8,961 22.0
Two 1,241 3.5 1,678 4.5 2,104 5.1 2,125 5.3
Three 231 0.6 276 0.7 414 1.0 407 1.0
Four 32 0.1 47 0.1 60 0.1 55 0.1
Five or more
9 0.0 10 0.0 8 0.0 22 0.1
Total 35,891 100 37,152 100 41,001 100 40,305 100
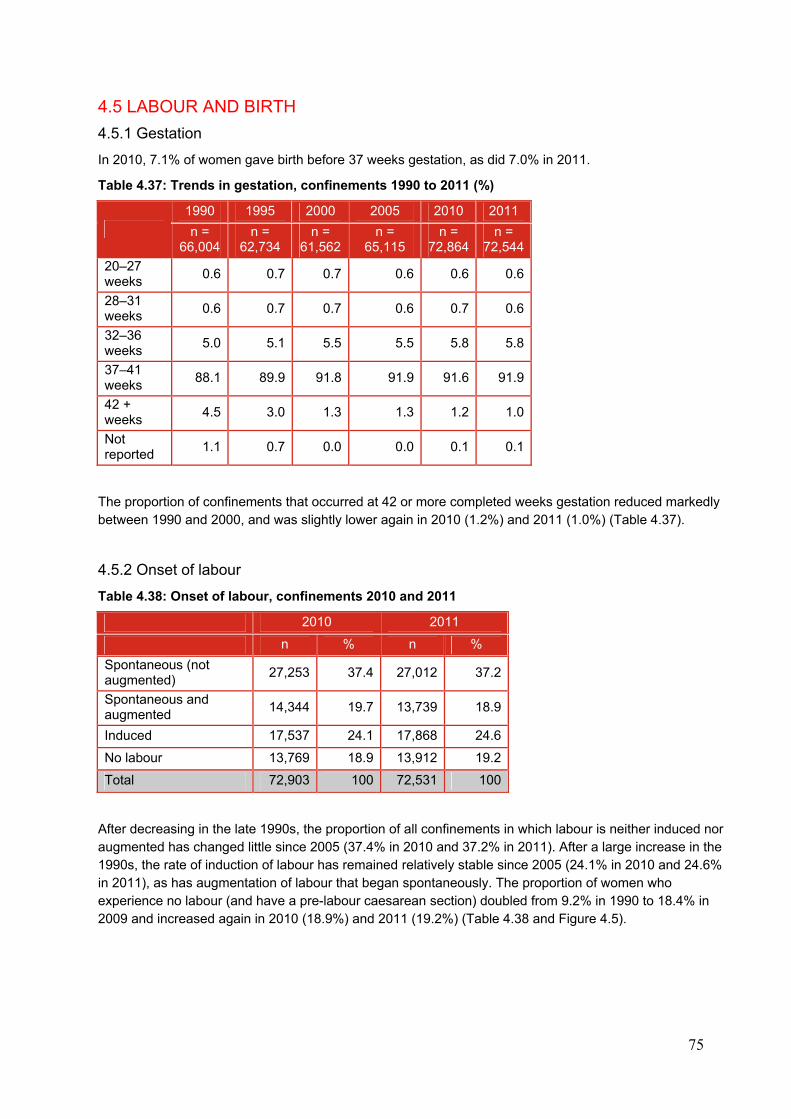
75
4.5 LABOUR AND BIRTH
4.5.1 Gestation
In 2010, 7.1% of women gave birth before 37 weeks gestation, as did 7.0% in 2011.
Table 4.37: Trends in gestation, confinements 1990 to 2011 (%)
1990 1995 2000 2005 2010 2011
n = 66,004
n = 62,734
n = 61,562
n = 65,115
n = 72,864
n = 72,544
20–27 weeks
0.6 0.7 0.7 0.6 0.6 0.6
28–31 weeks
0.6 0.7 0.7 0.6 0.7 0.6
32–36 weeks
5.0 5.1 5.5 5.5 5.8 5.8
37–41 weeks
88.1 89.9 91.8 91.9 91.6 91.9
42 + weeks
4.5 3.0 1.3 1.3 1.2 1.0
Not reported
1.1 0.7 0.0 0.0 0.1 0.1
The proportion of confinements that occurred at 42 or more completed weeks gestation reduced markedly between 1990 and 2000, and was slightly lower again in 2010 (1.2%) and 2011 (1.0%) (Table 4.37).
4.5.2 Onset of labour
Table 4.38: Onset of labour, confinements 2010 and 2011
2010 2011
n % n %
Spontaneous (not augmented)
27,253 37.4 27,012 37.2
Spontaneous and augmented
14,344 19.7 13,739 18.9
Induced 17,537 24.1 17,868 24.6
No labour 13,769 18.9 13,912 19.2
Total 72,903 100 72,531 100
After decreasing in the late 1990s, the proportion of all confinements in which labour is neither induced nor augmented has changed little since 2005 (37.4% in 2010 and 37.2% in 2011). After a large increase in the 1990s, the rate of induction of labour has remained relatively stable since 2005 (24.1% in 2010 and 24.6% in 2011), as has augmentation of labour that began spontaneously. The proportion of women who experience no labour (and have a pre-labour caesarean section) doubled from 9.2% in 1990 to 18.4% in 2009 and increased again in 2010 (18.9%) and 2011 (19.2%) (Table 4.38 and Figure 4.5).
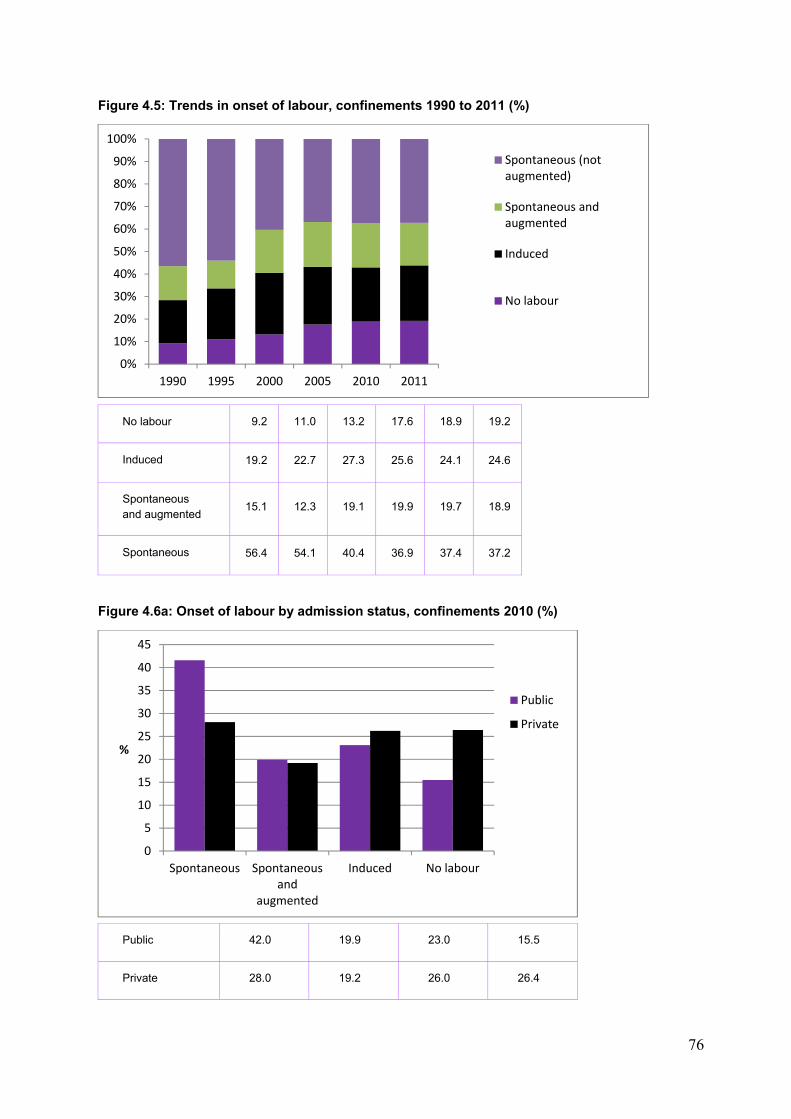
76
Figure 4.5: Trends in onset of labour, confinements 1990 to 2011 (%)
No labour 9.2 11.0 13.2 17.6 18.9 19.2
Induced 19.2 22.7 27.3 25.6 24.1 24.6
Spontaneous and augmented
15.1 12.3 19.1 19.9 19.7 18.9
Spontaneous 56.4 54.1 40.4 36.9 37.4 37.2
Figure 4.6a: Onset of labour by admission status, confinements 2010 (%)
Public 42.0 19.9 23.0 15.5
Private 28.0 19.2 26.0 26.4
0%
10%
20%
30%
40%
50%
60%
70%
80%
90%
100%
1990 1995 2000 2005 2010 2011
Spontaneous (notaugmented)
Spontaneous andaugmented
Induced
No labour
0
5
10
15
20
25
30
35
40
45
Spontaneous Spontaneousand
augmented
Induced No labour
%
Public
Private
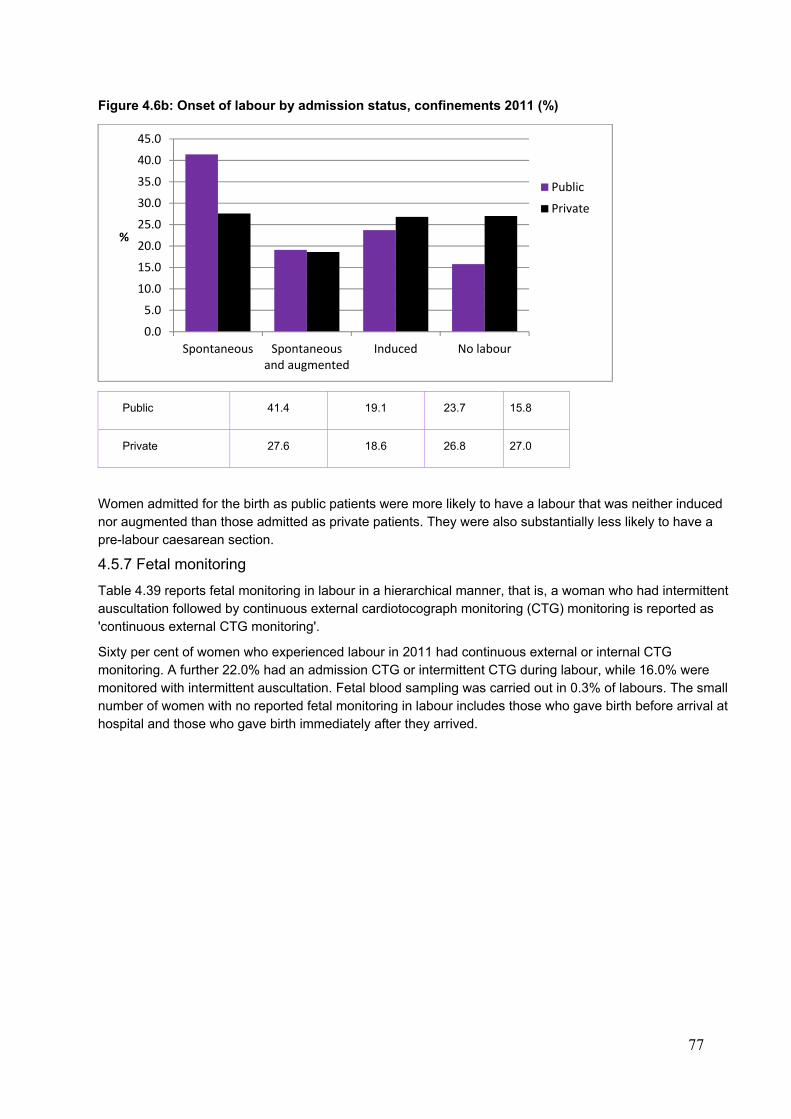
77
Figure 4.6b: Onset of labour by admission status, confinements 2011 (%)
Public 41.4 19.1 23.7 15.8
Private 27.6 18.6 26.8 27.0
Women admitted for the birth as public patients were more likely to have a labour that was neither induced nor augmented than those admitted as private patients. They were also substantially less likely to have a pre-labour caesarean section.
4.5.7 Fetal monitoring
Table 4.39 reports fetal monitoring in labour in a hierarchical manner, that is, a woman who had intermittent auscultation followed by continuous external cardiotocograph monitoring (CTG) monitoring is reported as 'continuous external CTG monitoring'.
Sixty per cent of women who experienced labour in 2011 had continuous external or internal CTG monitoring. A further 22.0% had an admission CTG or intermittent CTG during labour, while 16.0% were monitored with intermittent auscultation. Fetal blood sampling was carried out in 0.3% of labours. The small number of women with no reported fetal monitoring in labour includes those who gave birth before arrival at hospital and those who gave birth immediately after they arrived.
0.0
5.0
10.0
15.0
20.0
25.0
30.0
35.0
40.0
45.0
Spontaneous Spontaneousand augmented
Induced No labour
%
Public
Private
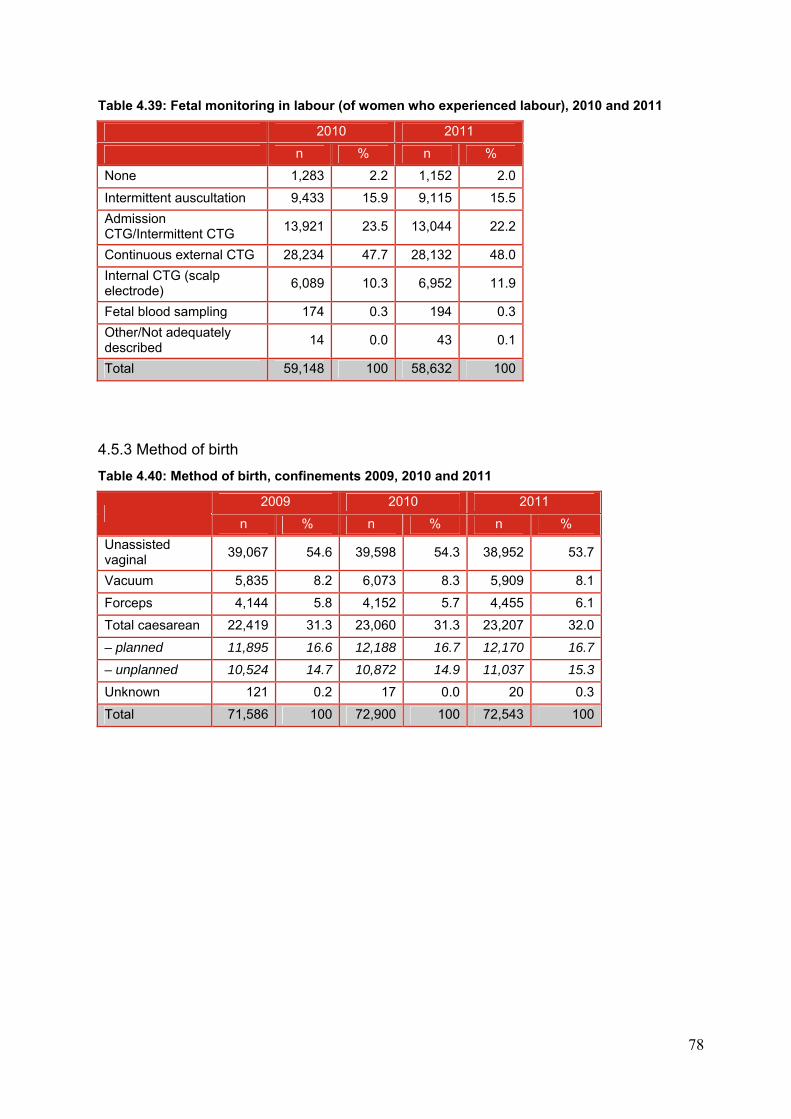
78
Table 4.39: Fetal monitoring in labour (of women who experienced labour), 2010 and 2011
2010 2011
n % n %
None 1,283 2.2 1,152 2.0
Intermittent auscultation 9,433 15.9 9,115 15.5
Admission CTG/Intermittent CTG
13,921 23.5 13,044 22.2
Continuous external CTG 28,234 47.7 28,132 48.0
Internal CTG (scalp electrode)
6,089 10.3 6,952 11.9
Fetal blood sampling 174 0.3 194 0.3
Other/Not adequately described
14 0.0 43 0.1
Total 59,148 100 58,632 100
4.5.3 Method of birth
Table 4.40: Method of birth, confinements 2009, 2010 and 2011
2009 2010 2011
n % n % n %
Unassisted vaginal
39,067 54.6 39,598 54.3 38,952 53.7
Vacuum 5,835 8.2 6,073 8.3 5,909 8.1
Forceps 4,144 5.8 4,152 5.7 4,455 6.1
Total caesarean 22,419 31.3 23,060 31.3 23,207 32.0
– planned 11,895 16.6 12,188 16.7 12,170 16.7
– unplanned 10,524 14.7 10,872 14.9 11,037 15.3
Unknown 121 0.2 17 0.0 20 0.3
Total 71,586 100 72,900 100 72,543 100
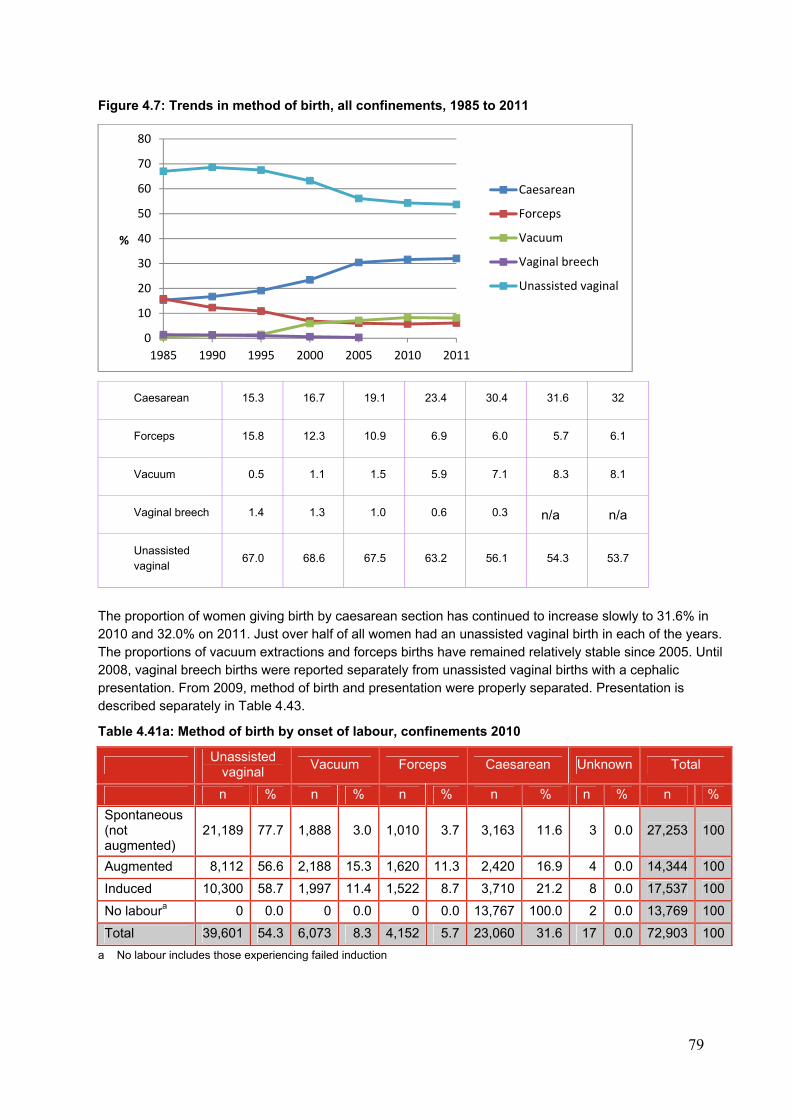
79
Figure 4.7: Trends in method of birth, all confinements, 1985 to 2011
Caesarean 15.3 16.7 19.1 23.4 30.4 31.6 32
Forceps 15.8 12.3 10.9 6.9 6.0 5.7 6.1
Vacuum 0.5 1.1 1.5 5.9 7.1 8.3 8.1
Vaginal breech 1.4 1.3 1.0 0.6 0.3 n/a n/a
Unassisted vaginal
67.0 68.6 67.5 63.2 56.1 54.3 53.7
The proportion of women giving birth by caesarean section has continued to increase slowly to 31.6% in 2010 and 32.0% on 2011. Just over half of all women had an unassisted vaginal birth in each of the years. The proportions of vacuum extractions and forceps births have remained relatively stable since 2005. Until 2008, vaginal breech births were reported separately from unassisted vaginal births with a cephalic presentation. From 2009, method of birth and presentation were properly separated. Presentation is described separately in Table 4.43.
Table 4.41a: Method of birth by onset of labour, confinements 2010
Unassisted
vaginal Vacuum Forceps Caesarean Unknown Total
n % n % n % n % n % n %
Spontaneous (not augmented)
21,189 77.7 1,888 3.0 1,010 3.7 3,163 11.6 3 0.0 27,253 100
Augmented 8,112 56.6 2,188 15.3 1,620 11.3 2,420 16.9 4 0.0 14,344 100
Induced 10,300 58.7 1,997 11.4 1,522 8.7 3,710 21.2 8 0.0 17,537 100
No laboura 0 0.0 0 0.0 0 0.0 13,767 100.0 2 0.0 13,769 100
Total 39,601 54.3 6,073 8.3 4,152 5.7 23,060 31.6 17 0.0 72,903 100
a No labour includes those experiencing failed induction
0
10
20
30
40
50
60
70
80
1985 1990 1995 2000 2005 2010 2011
%
Caesarean
Forceps
Vacuum
Vaginal breech
Unassisted vaginal
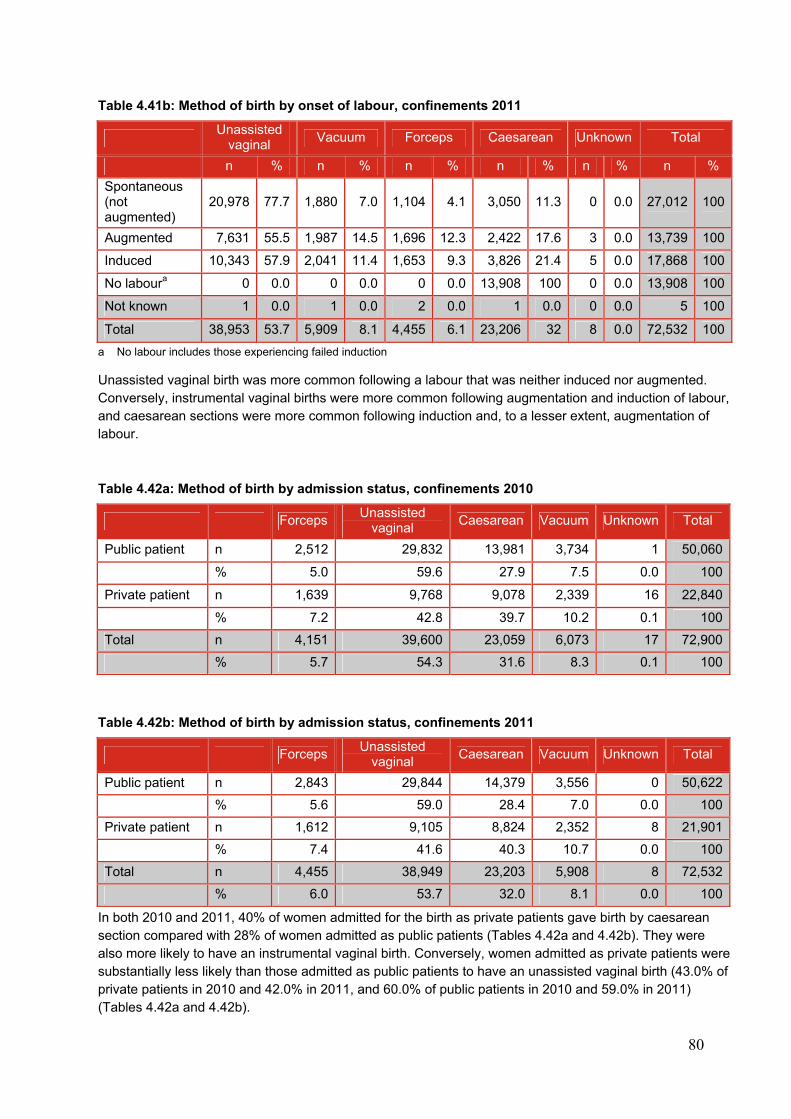
80
Table 4.41b: Method of birth by onset of labour, confinements 2011
Unassisted
vaginal Vacuum Forceps Caesarean Unknown Total
n % n % n % n % n % n %
Spontaneous (not augmented)
20,978 77.7 1,880 7.0 1,104 4.1 3,050 11.3 0 0.0 27,012 100
Augmented 7,631 55.5 1,987 14.5 1,696 12.3 2,422 17.6 3 0.0 13,739 100
Induced 10,343 57.9 2,041 11.4 1,653 9.3 3,826 21.4 5 0.0 17,868 100
No laboura 0 0.0 0 0.0 0 0.0 13,908 100 0 0.0 13,908 100
Not known 1 0.0 1 0.0 2 0.0 1 0.0 0 0.0 5 100
Total 38,953 53.7 5,909 8.1 4,455 6.1 23,206 32 8 0.0 72,532 100
a No labour includes those experiencing failed induction
Unassisted vaginal birth was more common following a labour that was neither induced nor augmented. Conversely, instrumental vaginal births were more common following augmentation and induction of labour, and caesarean sections were more common following induction and, to a lesser extent, augmentation of labour.
Table 4.42a: Method of birth by admission status, confinements 2010
ForcepsUnassisted
vaginal Caesarean Vacuum Unknown Total
Public patient n 2,512 29,832 13,981 3,734 1 50,060
% 5.0 59.6 27.9 7.5 0.0 100
Private patient n 1,639 9,768 9,078 2,339 16 22,840
% 7.2 42.8 39.7 10.2 0.1 100
Total n 4,151 39,600 23,059 6,073 17 72,900
% 5.7 54.3 31.6 8.3 0.1 100
Table 4.42b: Method of birth by admission status, confinements 2011
ForcepsUnassisted
vaginal Caesarean Vacuum Unknown Total
Public patient n 2,843 29,844 14,379 3,556 0 50,622
% 5.6 59.0 28.4 7.0 0.0 100
Private patient n 1,612 9,105 8,824 2,352 8 21,901
% 7.4 41.6 40.3 10.7 0.0 100
Total n 4,455 38,949 23,203 5,908 8 72,532
% 6.0 53.7 32.0 8.1 0.0 100
In both 2010 and 2011, 40% of women admitted for the birth as private patients gave birth by caesarean section compared with 28% of women admitted as public patients (Tables 4.42a and 4.42b). They were also more likely to have an instrumental vaginal birth. Conversely, women admitted as private patients were substantially less likely than those admitted as public patients to have an unassisted vaginal birth (43.0% of private patients in 2010 and 42.0% in 2011, and 60.0% of public patients in 2010 and 59.0% in 2011) (Tables 4.42a and 4.42b).
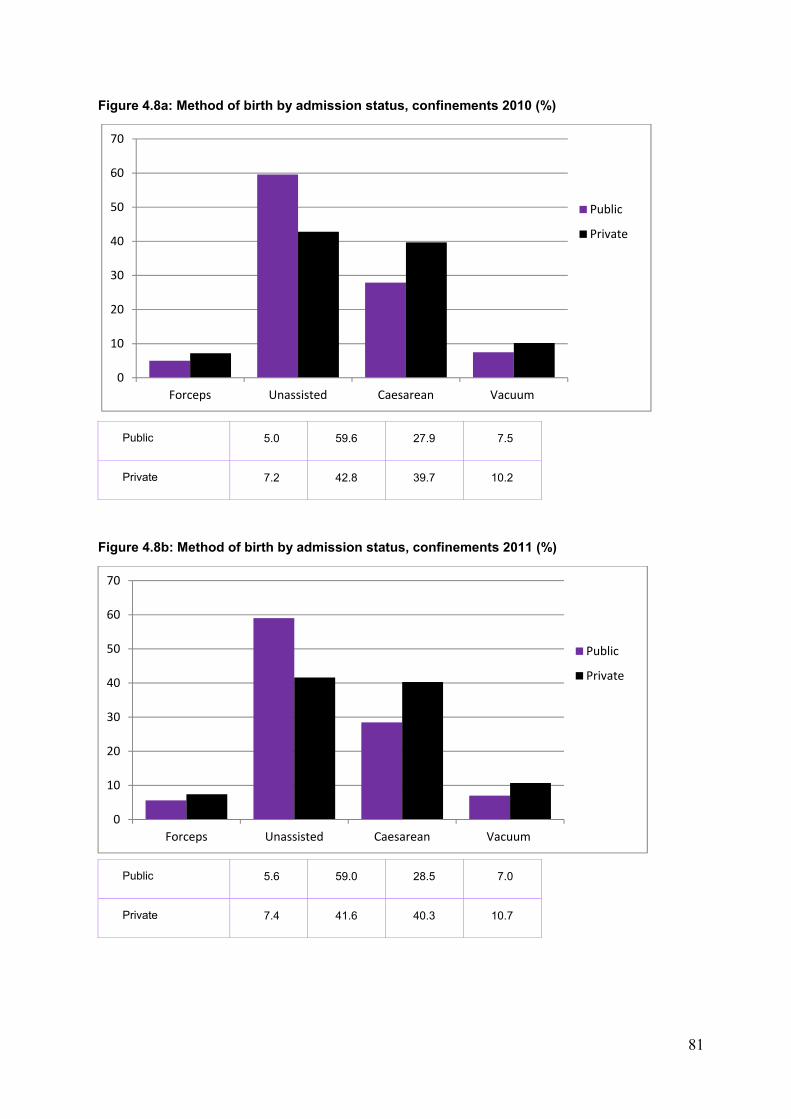
81
Figure 4.8a: Method of birth by admission status, confinements 2010 (%)
Public 5.0 59.6 27.9 7.5
Private 7.2 42.8 39.7 10.2
Figure 4.8b: Method of birth by admission status, confinements 2011 (%)
Public 5.6 59.0 28.5 7.0
Private 7.4 41.6 40.3 10.7
0
10
20
30
40
50
60
70
Forceps Unassisted Caesarean Vacuum
Public
Private
0
10
20
30
40
50
60
70
Forceps Unassisted Caesarean Vacuum
Public
Private
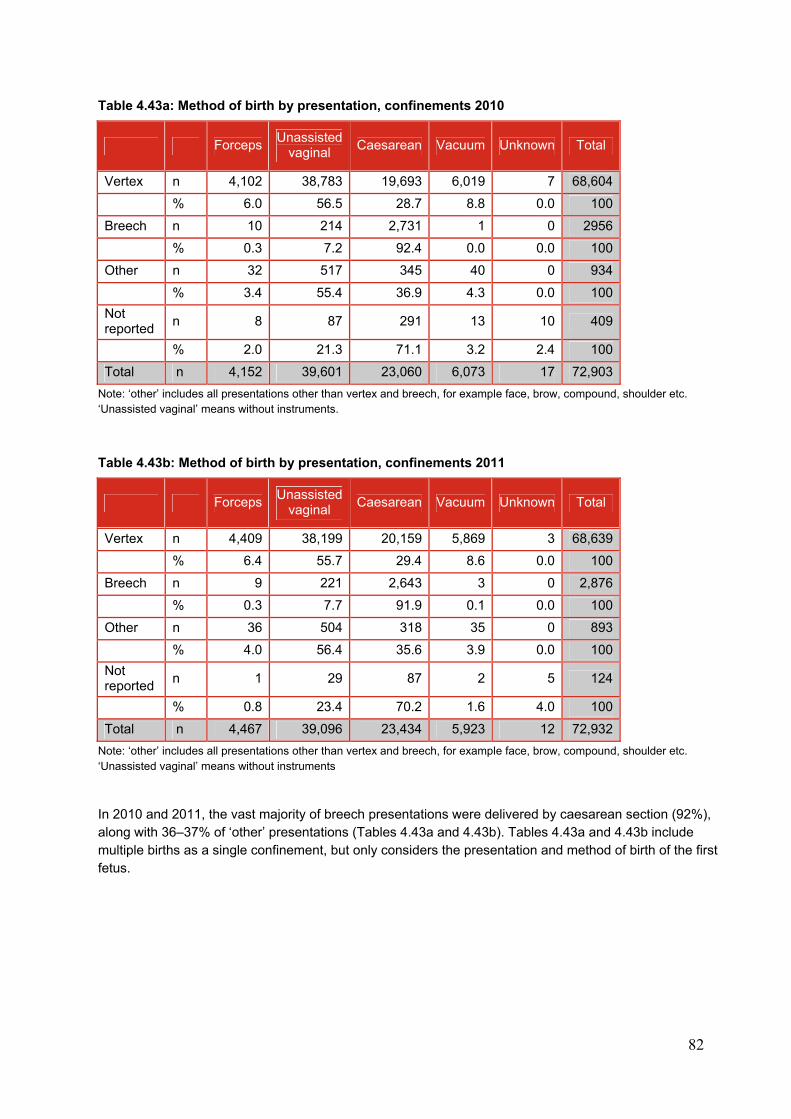
82
Table 4.43a: Method of birth by presentation, confinements 2010
Forceps Unassisted
vaginal Caesarean Vacuum Unknown Total
Vertex n 4,102 38,783 19,693 6,019 7 68,604
% 6.0 56.5 28.7 8.8 0.0 100
Breech n 10 214 2,731 1 0 2956
% 0.3 7.2 92.4 0.0 0.0 100
Other n 32 517 345 40 0 934
% 3.4 55.4 36.9 4.3 0.0 100
Not reported
n 8 87 291 13 10 409
% 2.0 21.3 71.1 3.2 2.4 100
Total n 4,152 39,601 23,060 6,073 17 72,903
Note: ‘other’ includes all presentations other than vertex and breech, for example face, brow, compound, shoulder etc. ‘Unassisted vaginal’ means without instruments.
Table 4.43b: Method of birth by presentation, confinements 2011
Forceps Unassisted
vaginal Caesarean Vacuum Unknown Total
Vertex n 4,409 38,199 20,159 5,869 3 68,639
% 6.4 55.7 29.4 8.6 0.0 100
Breech n 9 221 2,643 3 0 2,876
% 0.3 7.7 91.9 0.1 0.0 100
Other n 36 504 318 35 0 893
% 4.0 56.4 35.6 3.9 0.0 100
Not reported
n 1 29 87 2 5 124
% 0.8 23.4 70.2 1.6 4.0 100
Total n 4,467 39,096 23,434 5,923 12 72,932
Note: ‘other’ includes all presentations other than vertex and breech, for example face, brow, compound, shoulder etc. ‘Unassisted vaginal’ means without instruments
In 2010 and 2011, the vast majority of breech presentations were delivered by caesarean section (92%), along with 36–37% of ‘other’ presentations (Tables 4.43a and 4.43b). Tables 4.43a and 4.43b include multiple births as a single confinement, but only considers the presentation and method of birth of the first fetus.
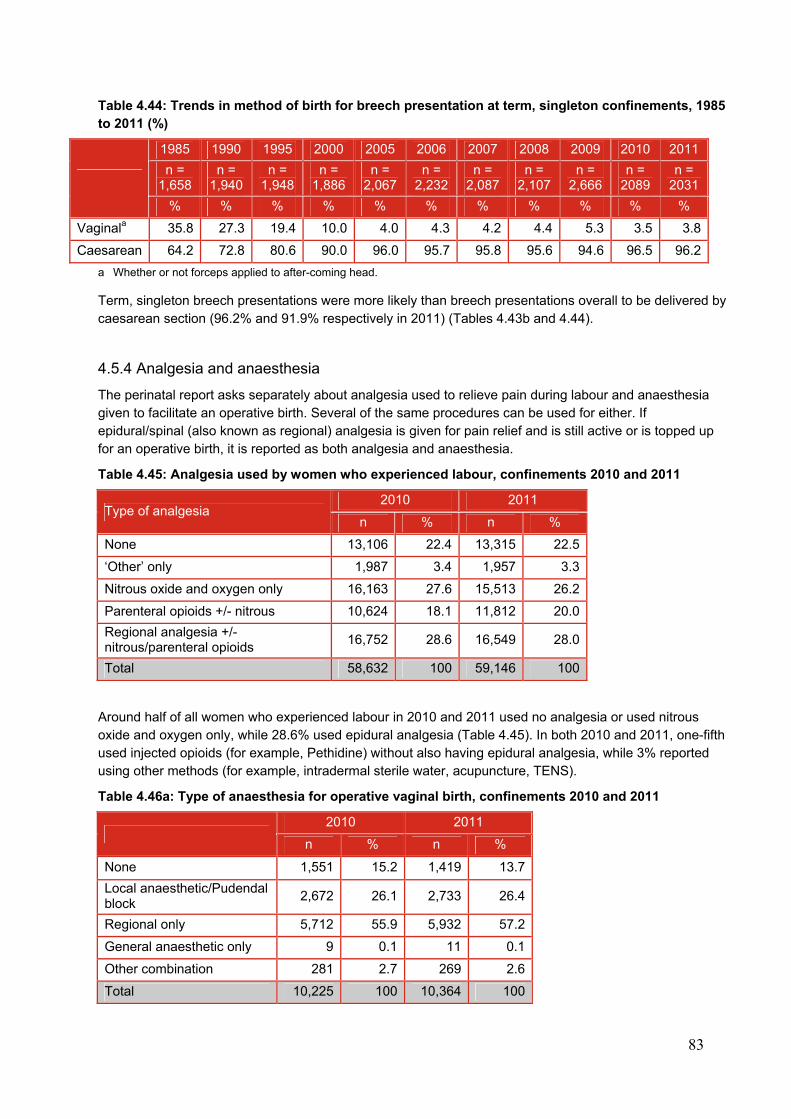
83
Table 4.44: Trends in method of birth for breech presentation at term, singleton confinements, 1985 to 2011 (%)
1985 1990 1995 2000 2005 2006 2007 2008 2009 2010 2011
n = 1,658
n = 1,940
n = 1,948
n = 1,886
n = 2,067
n = 2,232
n = 2,087
n = 2,107
n = 2,666
n = 2089
n = 2031
% % % % % % % % % % %
Vaginala 35.8 27.3 19.4 10.0 4.0 4.3 4.2 4.4 5.3 3.5 3.8
Caesarean 64.2 72.8 80.6 90.0 96.0 95.7 95.8 95.6 94.6 96.5 96.2
a Whether or not forceps applied to after-coming head.
Term, singleton breech presentations were more likely than breech presentations overall to be delivered by caesarean section (96.2% and 91.9% respectively in 2011) (Tables 4.43b and 4.44).
4.5.4 Analgesia and anaesthesia
The perinatal report asks separately about analgesia used to relieve pain during labour and anaesthesia given to facilitate an operative birth. Several of the same procedures can be used for either. If epidural/spinal (also known as regional) analgesia is given for pain relief and is still active or is topped up for an operative birth, it is reported as both analgesia and anaesthesia.
Table 4.45: Analgesia used by women who experienced labour, confinements 2010 and 2011
Type of analgesia 2010 2011
n % n %
None 13,106 22.4 13,315 22.5
‘Other’ only 1,987 3.4 1,957 3.3
Nitrous oxide and oxygen only 16,163 27.6 15,513 26.2
Parenteral opioids +/- nitrous 10,624 18.1 11,812 20.0
Regional analgesia +/- nitrous/parenteral opioids
16,752 28.6 16,549 28.0
Total 58,632 100 59,146 100
Around half of all women who experienced labour in 2010 and 2011 used no analgesia or used nitrous oxide and oxygen only, while 28.6% used epidural analgesia (Table 4.45). In both 2010 and 2011, one-fifth used injected opioids (for example, Pethidine) without also having epidural analgesia, while 3% reported using other methods (for example, intradermal sterile water, acupuncture, TENS).
Table 4.46a: Type of anaesthesia for operative vaginal birth, confinements 2010 and 2011
2010 2011
n % n %
None 1,551 15.2 1,419 13.7
Local anaesthetic/Pudendal block
2,672 26.1 2,733 26.4
Regional only 5,712 55.9 5,932 57.2
General anaesthetic only 9 0.1 11 0.1
Other combination 281 2.7 269 2.6
Total 10,225 100 10,364 100
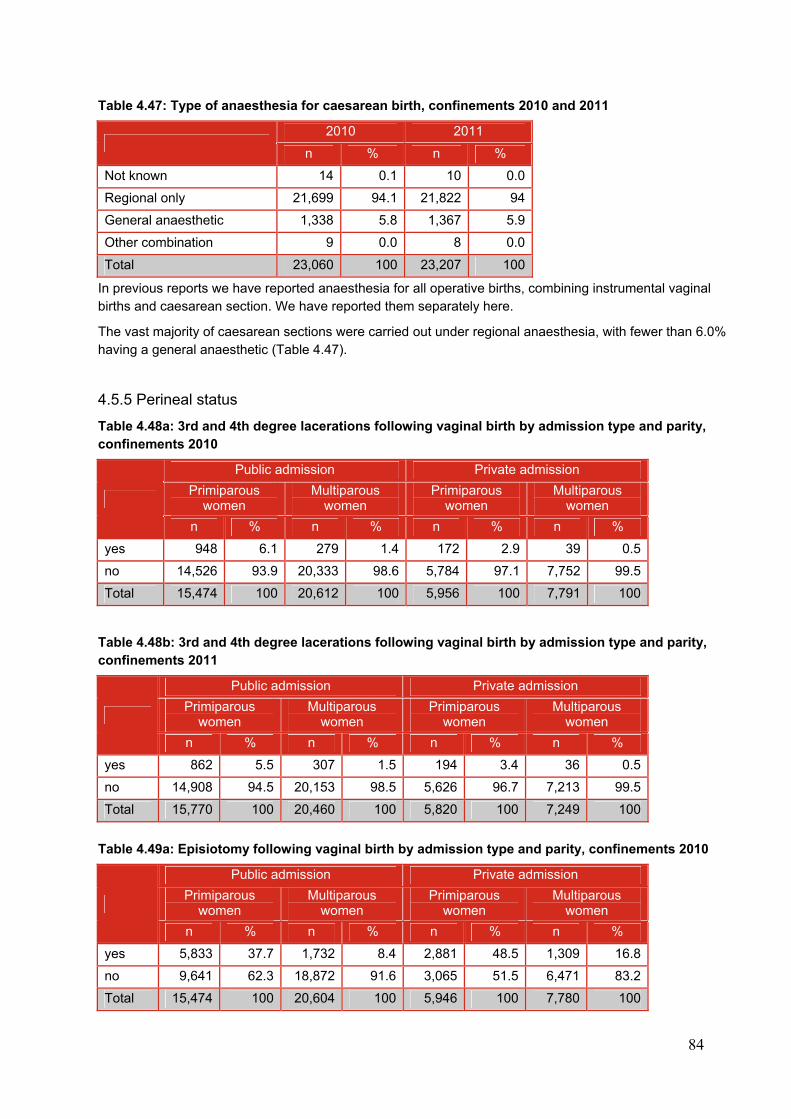
84
Table 4.47: Type of anaesthesia for caesarean birth, confinements 2010 and 2011
2010 2011
n % n %
Not known 14 0.1 10 0.0
Regional only 21,699 94.1 21,822 94
General anaesthetic 1,338 5.8 1,367 5.9
Other combination 9 0.0 8 0.0
Total 23,060 100 23,207 100
In previous reports we have reported anaesthesia for all operative births, combining instrumental vaginal births and caesarean section. We have reported them separately here.
The vast majority of caesarean sections were carried out under regional anaesthesia, with fewer than 6.0% having a general anaesthetic (Table 4.47).
4.5.5 Perineal status
Table 4.48a: 3rd and 4th degree lacerations following vaginal birth by admission type and parity, confinements 2010
Public admission Private admission
Primiparous women
Multiparous women
Primiparous women
Multiparous women
n % n % n % n %
yes 948 6.1 279 1.4 172 2.9 39 0.5
no 14,526 93.9 20,333 98.6 5,784 97.1 7,752 99.5
Total 15,474 100 20,612 100 5,956 100 7,791 100
Table 4.48b: 3rd and 4th degree lacerations following vaginal birth by admission type and parity, confinements 2011
Public admission Private admission
Primiparous women
Multiparous women
Primiparous women
Multiparous women
n % n % n % n %
yes 862 5.5 307 1.5 194 3.4 36 0.5
no 14,908 94.5 20,153 98.5 5,626 96.7 7,213 99.5
Total 15,770 100 20,460 100 5,820 100 7,249 100
Table 4.49a: Episiotomy following vaginal birth by admission type and parity, confinements 2010
Public admission Private admission
Primiparous women
Multiparous women
Primiparous women
Multiparous women
n % n % n % n %
yes 5,833 37.7 1,732 8.4 2,881 48.5 1,309 16.8
no 9,641 62.3 18,872 91.6 3,065 51.5 6,471 83.2
Total 15,474 100 20,604 100 5,946 100 7,780 100
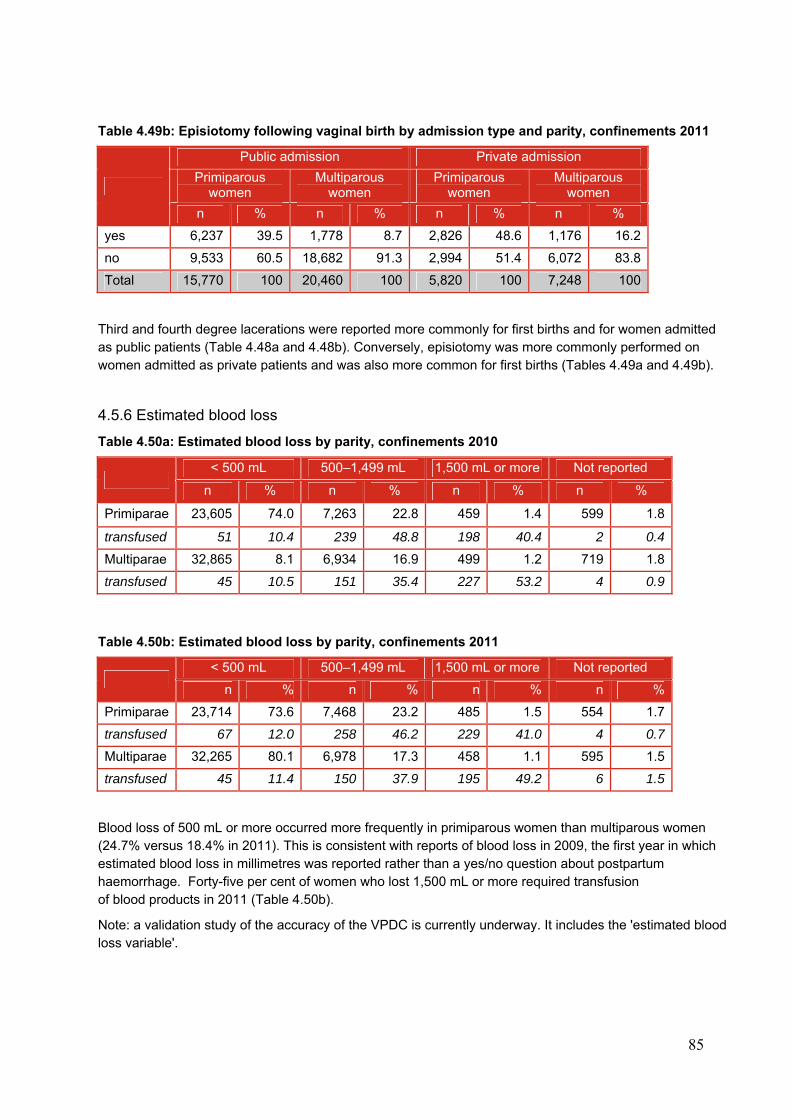
85
Table 4.49b: Episiotomy following vaginal birth by admission type and parity, confinements 2011
Public admission Private admission
Primiparous women
Multiparous women
Primiparous women
Multiparous women
n % n % n % n %
yes 6,237 39.5 1,778 8.7 2,826 48.6 1,176 16.2
no 9,533 60.5 18,682 91.3 2,994 51.4 6,072 83.8
Total 15,770 100 20,460 100 5,820 100 7,248 100
Third and fourth degree lacerations were reported more commonly for first births and for women admitted as public patients (Table 4.48a and 4.48b). Conversely, episiotomy was more commonly performed on women admitted as private patients and was also more common for first births (Tables 4.49a and 4.49b).
4.5.6 Estimated blood loss
Table 4.50a: Estimated blood loss by parity, confinements 2010
< 500 mL 500–1,499 mL 1,500 mL or more Not reported
n % n % n % n %
Primiparae 23,605 74.0 7,263 22.8 459 1.4 599 1.8
transfused 51 10.4 239 48.8 198 40.4 2 0.4
Multiparae 32,865 8.1 6,934 16.9 499 1.2 719 1.8
transfused 45 10.5 151 35.4 227 53.2 4 0.9
Table 4.50b: Estimated blood loss by parity, confinements 2011
< 500 mL 500–1,499 mL 1,500 mL or more Not reported
n % n % n % n %
Primiparae 23,714 73.6 7,468 23.2 485 1.5 554 1.7
transfused 67 12.0 258 46.2 229 41.0 4 0.7
Multiparae 32,265 80.1 6,978 17.3 458 1.1 595 1.5
transfused 45 11.4 150 37.9 195 49.2 6 1.5
Blood loss of 500 mL or more occurred more frequently in primiparous women than multiparous women (24.7% versus 18.4% in 2011). This is consistent with reports of blood loss in 2009, the first year in which estimated blood loss in millimetres was reported rather than a yes/no question about postpartum haemorrhage. Forty-five per cent of women who lost 1,500 mL or more required transfusion of blood products in 2011 (Table 4.50b).
Note: a validation study of the accuracy of the VPDC is currently underway. It includes the 'estimated blood loss variable'.
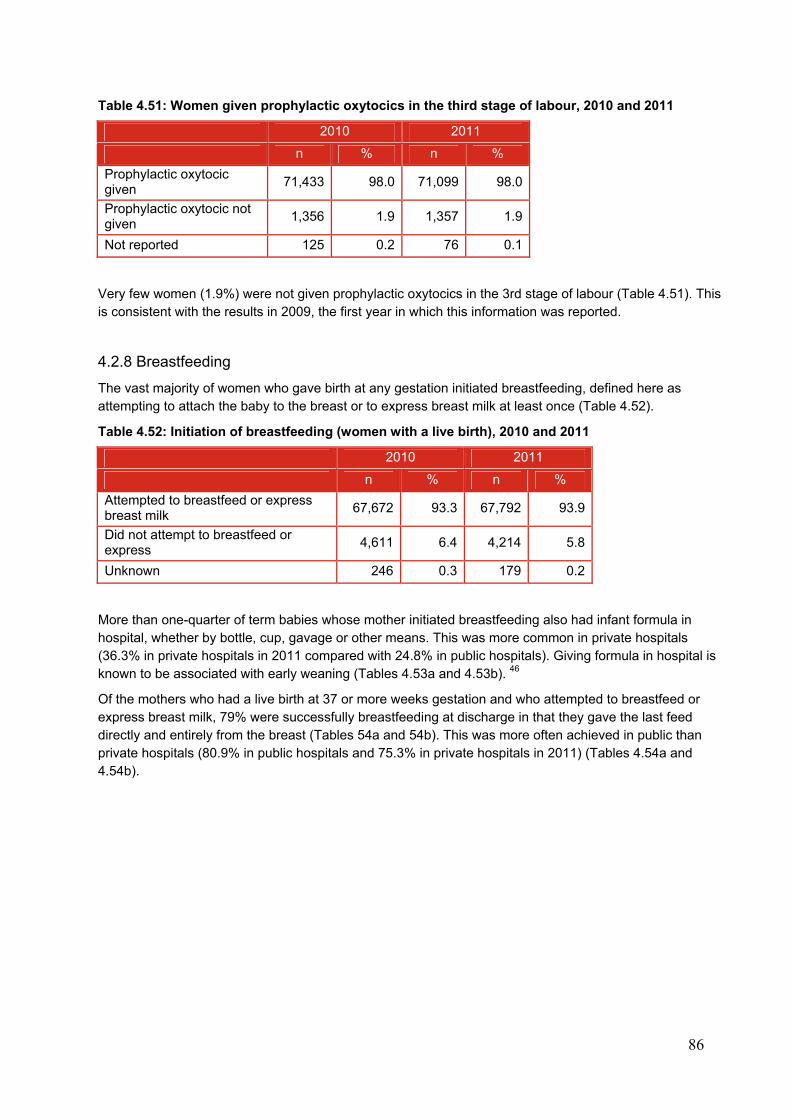
86
Table 4.51: Women given prophylactic oxytocics in the third stage of labour, 2010 and 2011
2010 2011
n % n %
Prophylactic oxytocic given
71,433 98.0 71,099 98.0
Prophylactic oxytocic not given
1,356 1.9 1,357 1.9
Not reported 125 0.2 76 0.1
Very few women (1.9%) were not given prophylactic oxytocics in the 3rd stage of labour (Table 4.51). This is consistent with the results in 2009, the first year in which this information was reported.
4.2.8 Breastfeeding
The vast majority of women who gave birth at any gestation initiated breastfeeding, defined here as attempting to attach the baby to the breast or to express breast milk at least once (Table 4.52).
Table 4.52: Initiation of breastfeeding (women with a live birth), 2010 and 2011
2010 2011
n % n %
Attempted to breastfeed or express breast milk
67,672 93.3 67,792 93.9
Did not attempt to breastfeed or express
4,611 6.4 4,214 5.8
Unknown 246 0.3 179 0.2
More than one-quarter of term babies whose mother initiated breastfeeding also had infant formula in hospital, whether by bottle, cup, gavage or other means. This was more common in private hospitals (36.3% in private hospitals in 2011 compared with 24.8% in public hospitals). Giving formula in hospital is known to be associated with early weaning (Tables 4.53a and 4.53b). 46
Of the mothers who had a live birth at 37 or more weeks gestation and who attempted to breastfeed or express breast milk, 79% were successfully breastfeeding at discharge in that they gave the last feed directly and entirely from the breast (Tables 54a and 54b). This was more often achieved in public than private hospitals (80.9% in public hospitals and 75.3% in private hospitals in 2011) (Tables 4.54a and 4.54b).
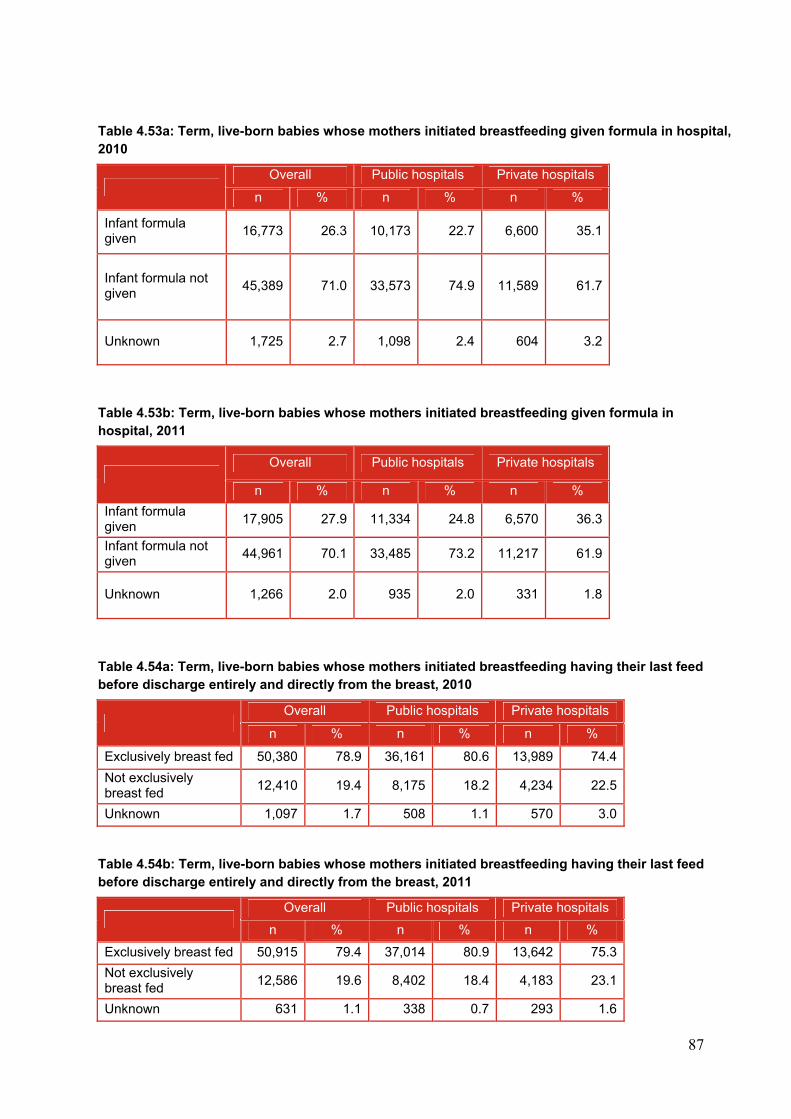
87
Table 4.53a: Term, live-born babies whose mothers initiated breastfeeding given formula in hospital, 2010
Overall Public hospitals Private hospitals
n % n % n %
Infant formula given
16,773 26.3 10,173 22.7 6,600 35.1
Infant formula not given
45,389 71.0 33,573 74.9 11,589 61.7
Unknown 1,725 2.7 1,098 2.4 604 3.2
Table 4.53b: Term, live-born babies whose mothers initiated breastfeeding given formula in hospital, 2011
Overall Public hospitals Private hospitals
n % n % n %
Infant formula given
17,905 27.9 11,334 24.8 6,570 36.3
Infant formula not given
44,961 70.1 33,485 73.2 11,217 61.9
Unknown 1,266 2.0 935 2.0 331 1.8
Table 4.54a: Term, live-born babies whose mothers initiated breastfeeding having their last feed before discharge entirely and directly from the breast, 2010
Overall Public hospitals Private hospitals
n % n % n %
Exclusively breast fed 50,380 78.9 36,161 80.6 13,989 74.4
Not exclusively breast fed
12,410 19.4 8,175 18.2 4,234 22.5
Unknown 1,097 1.7 508 1.1 570 3.0
Table 4.54b: Term, live-born babies whose mothers initiated breastfeeding having their last feed before discharge entirely and directly from the breast, 2011
Overall Public hospitals Private hospitals
n % n % n %
Exclusively breast fed 50,915 79.4 37,014 80.9 13,642 75.3
Not exclusively breast fed
12,586 19.6 8,402 18.4 4,183 23.1
Unknown 631 1.1 338 0.7 293 1.6
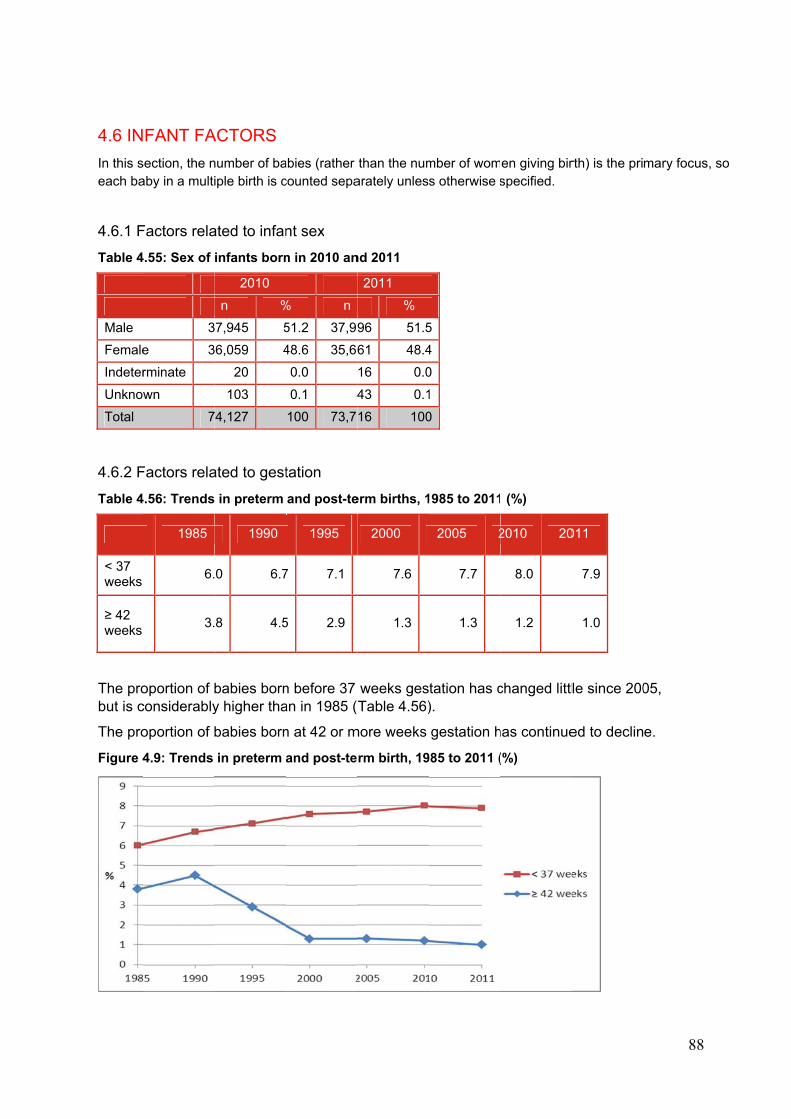
4.6 IN
In this seach ba
4.6.1 F
Table 4
Male
Female
Indeter
Unknow
Total
4.6.2 F
Table 4
< 37 weeks
≥ 42 weeks
The probut is c
The pro
Figure 4
FANT FA
section, the naby in a multi
Factors rela
4.55: Sex of
3
e 3
rminate
wn
7
Factors rela
4.56: Trends
1985
6.
3.
oportion of bconsiderably
oportion of b
4.9: Trends
ACTORS
number of baiple birth is c
ated to infan
infants born
2010
n %
37,945 5
36,059 4
20
103
74,127
ated to gest
in preterm
1990
0 6.7
8 4.5
babies borny higher tha
babies born
in preterm
abies (rather counted sepa
nt sex
n in 2010 an
% n
51.2 37,99
48.6 35,66
0.0
0.1 4
100 73,7
tation
and post-te
1995
7 7.1
5 2.9
n before 37 an in 1985 (
n at 42 or m
and post-te
than the numarately unles
nd 2011
2011
%
96 51.5
61 48.4
16 0.0
43 0.1
16 100
erm births, 1
2000
7.6
1.3
weeks gesTable 4.56)
more weeks
rm birth, 19
mber of woms otherwise s
5
4
0
1
0
1985 to 2011
2005 2
7.7
1.3
tation has c).
gestation h
985 to 2011 (
en giving birspecified.
(%)
2010 20
8.0
1.2
changed littl
has continue
(%)
rth) is the pri
011
7.9
1.0
le since 200
ed to declin
88
mary focus,
05,
e.
so
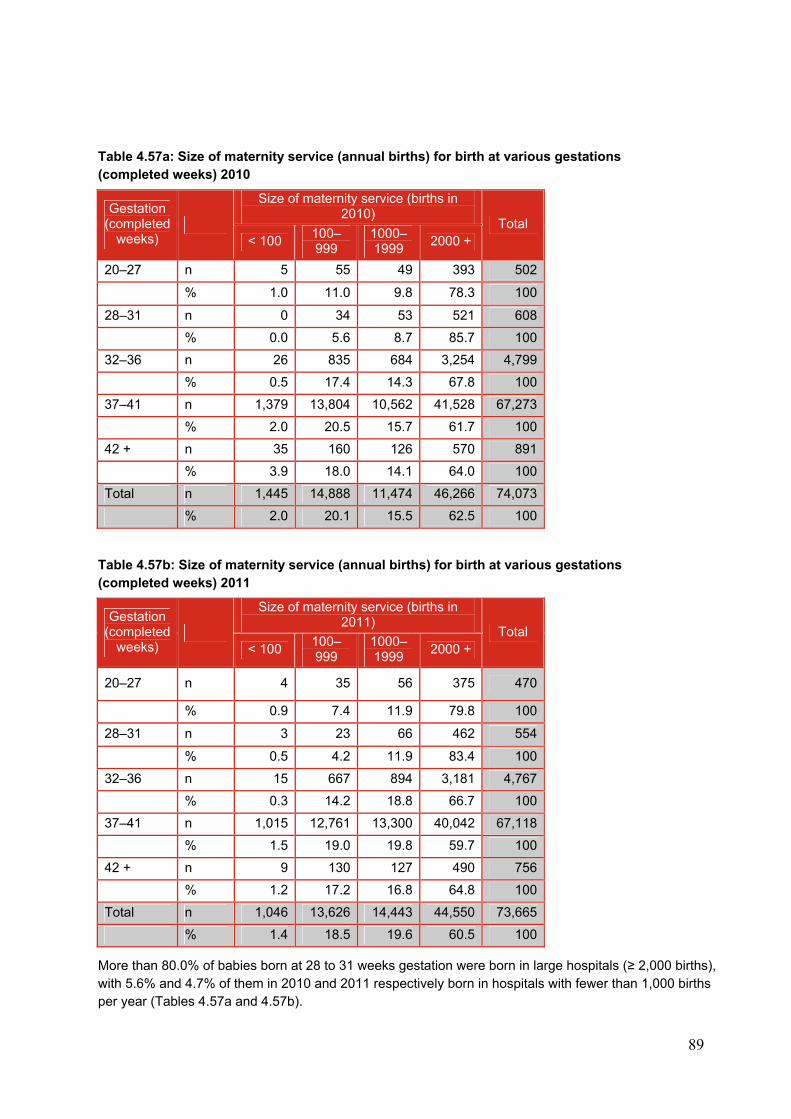
89
Table 4.57a: Size of maternity service (annual births) for birth at various gestations (completed weeks) 2010
Gestation (completed
weeks)
Size of maternity service (births in 2010)
Total < 100
100–999
1000–1999
2000 +
20–27 n 5 55 49 393 502
% 1.0 11.0 9.8 78.3 100
28–31 n 0 34 53 521 608
% 0.0 5.6 8.7 85.7 100
32–36 n 26 835 684 3,254 4,799
% 0.5 17.4 14.3 67.8 100
37–41 n 1,379 13,804 10,562 41,528 67,273
% 2.0 20.5 15.7 61.7 100
42 + n 35 160 126 570 891
% 3.9 18.0 14.1 64.0 100
Total n 1,445 14,888 11,474 46,266 74,073
% 2.0 20.1 15.5 62.5 100
Table 4.57b: Size of maternity service (annual births) for birth at various gestations (completed weeks) 2011
Gestation (completed
weeks)
Size of maternity service (births in 2011)
Total < 100
100–999
1000–1999
2000 +
20–27 n 4 35 56 375 470
% 0.9 7.4 11.9 79.8 100
28–31 n 3 23 66 462 554
% 0.5 4.2 11.9 83.4 100
32–36 n 15 667 894 3,181 4,767
% 0.3 14.2 18.8 66.7 100
37–41 n 1,015 12,761 13,300 40,042 67,118
% 1.5 19.0 19.8 59.7 100
42 + n 9 130 127 490 756
% 1.2 17.2 16.8 64.8 100
Total n 1,046 13,626 14,443 44,550 73,665
% 1.4 18.5 19.6 60.5 100
More than 80.0% of babies born at 28 to 31 weeks gestation were born in large hospitals (≥ 2,000 births), with 5.6% and 4.7% of them in 2010 and 2011 respectively born in hospitals with fewer than 1,000 births per year (Tables 4.57a and 4.57b).
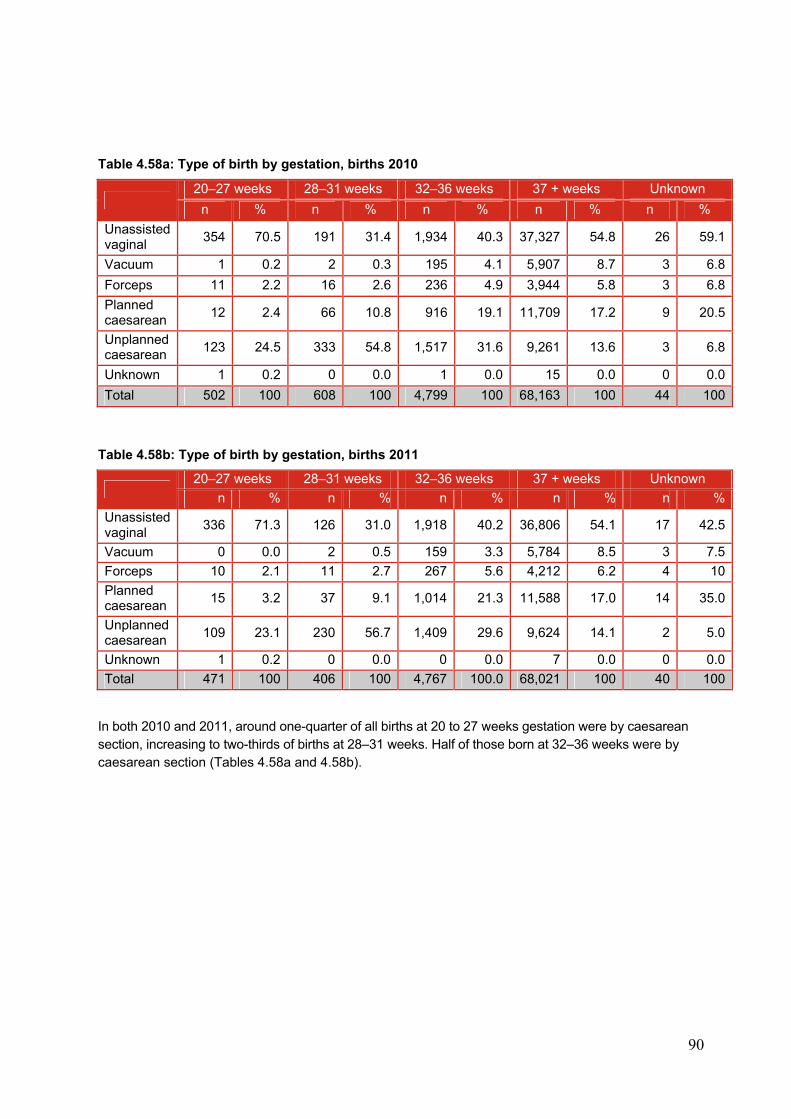
90
Table 4.58a: Type of birth by gestation, births 2010
20–27 weeks 28–31 weeks 32–36 weeks 37 + weeks Unknown
n % n % n % n % n %
Unassisted vaginal
354 70.5 191 31.4 1,934 40.3 37,327 54.8 26 59.1
Vacuum 1 0.2 2 0.3 195 4.1 5,907 8.7 3 6.8
Forceps 11 2.2 16 2.6 236 4.9 3,944 5.8 3 6.8
Planned caesarean
12 2.4 66 10.8 916 19.1 11,709 17.2 9 20.5
Unplanned caesarean
123 24.5 333 54.8 1,517 31.6 9,261 13.6 3 6.8
Unknown 1 0.2 0 0.0 1 0.0 15 0.0 0 0.0
Total 502 100 608 100 4,799 100 68,163 100 44 100
Table 4.58b: Type of birth by gestation, births 2011
20–27 weeks 28–31 weeks 32–36 weeks 37 + weeks Unknown
n % n % n % n % n %
Unassisted vaginal
336 71.3 126 31.0 1,918 40.2 36,806 54.1 17 42.5
Vacuum 0 0.0 2 0.5 159 3.3 5,784 8.5 3 7.5
Forceps 10 2.1 11 2.7 267 5.6 4,212 6.2 4 10
Planned caesarean
15 3.2 37 9.1 1,014 21.3 11,588 17.0 14 35.0
Unplanned caesarean
109 23.1 230 56.7 1,409 29.6 9,624 14.1 2 5.0
Unknown 1 0.2 0 0.0 0 0.0 7 0.0 0 0.0
Total 471 100 406 100 4,767 100.0 68,021 100 40 100
In both 2010 and 2011, around one-quarter of all births at 20 to 27 weeks gestation were by caesarean section, increasing to two-thirds of births at 28–31 weeks. Half of those born at 32–36 weeks were by caesarean section (Tables 4.58a and 4.58b).
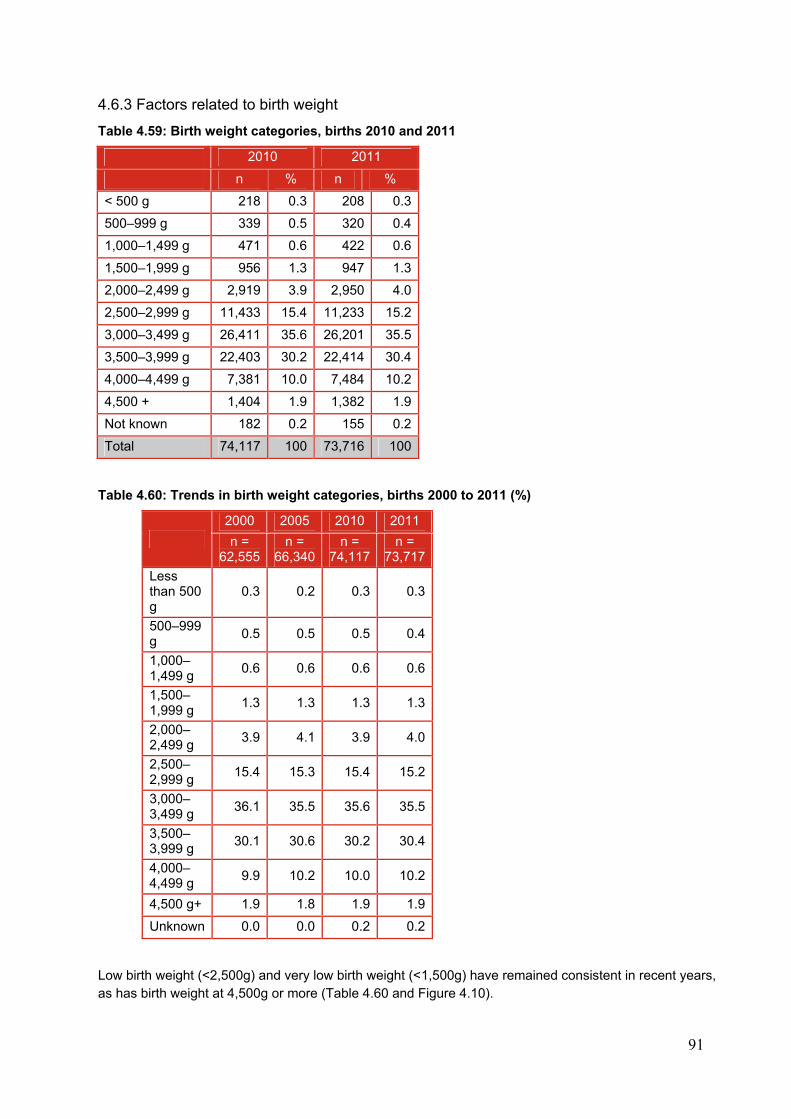
91
4.6.3 Factors related to birth weight
Table 4.59: Birth weight categories, births 2010 and 2011
2010 2011
n % n %
< 500 g 218 0.3 208 0.3
500–999 g 339 0.5 320 0.4
1,000–1,499 g 471 0.6 422 0.6
1,500–1,999 g 956 1.3 947 1.3
2,000–2,499 g 2,919 3.9 2,950 4.0
2,500–2,999 g 11,433 15.4 11,233 15.2
3,000–3,499 g 26,411 35.6 26,201 35.5
3,500–3,999 g 22,403 30.2 22,414 30.4
4,000–4,499 g 7,381 10.0 7,484 10.2
4,500 + 1,404 1.9 1,382 1.9
Not known 182 0.2 155 0.2
Total 74,117 100 73,716 100
Table 4.60: Trends in birth weight categories, births 2000 to 2011 (%)
2000 2005 2010 2011
n = 62,555
n = 66,340
n = 74,117
n = 73,717
Less than 500 g
0.3 0.2 0.3 0.3
500–999 g
0.5 0.5 0.5 0.4
1,000–1,499 g
0.6 0.6 0.6 0.6
1,500–1,999 g
1.3 1.3 1.3 1.3
2,000–2,499 g
3.9 4.1 3.9 4.0
2,500–2,999 g
15.4 15.3 15.4 15.2
3,000–3,499 g
36.1 35.5 35.6 35.5
3,500–3,999 g
30.1 30.6 30.2 30.4
4,000–4,499 g
9.9 10.2 10.0 10.2
4,500 g+ 1.9 1.8 1.9 1.9
Unknown 0.0 0.0 0.2 0.2
Low birth weight (<2,500g) and very low birth weight (<1,500g) have remained consistent in recent years, as has birth weight at 4,500g or more (Table 4.60 and Figure 4.10).
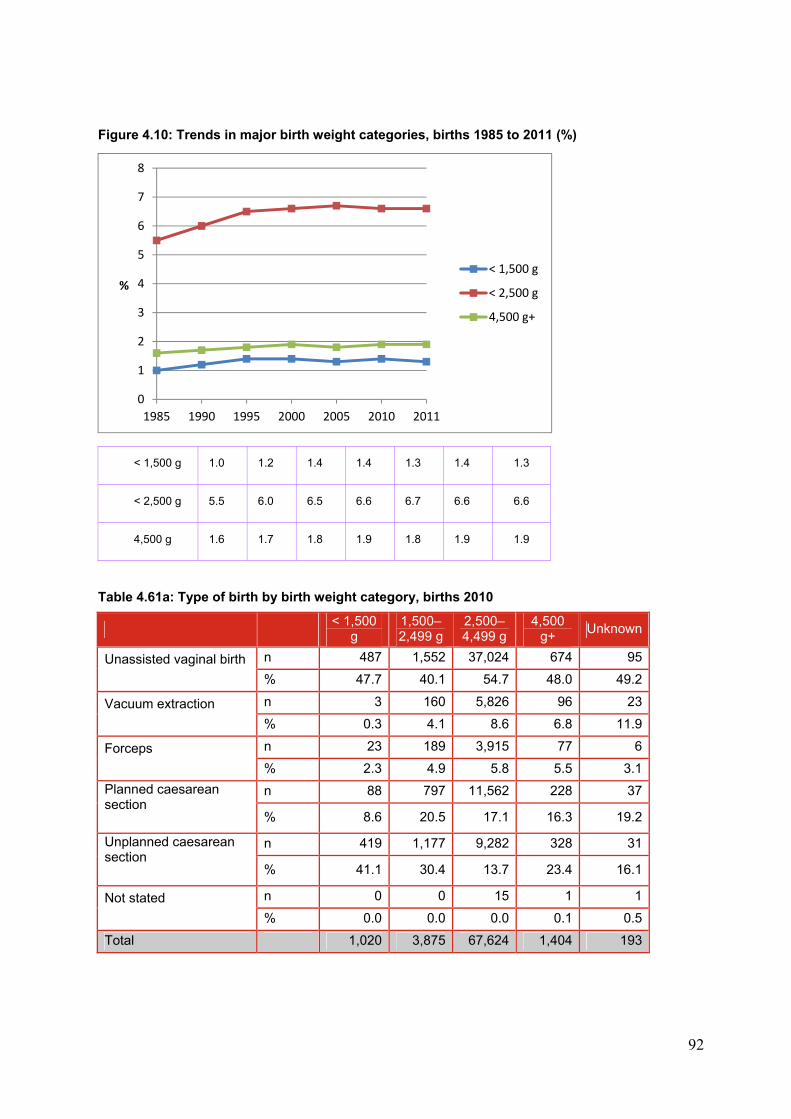
92
Figure 4.10: Trends in major birth weight categories, births 1985 to 2011 (%)
< 1,500 g 1.0 1.2 1.4 1.4 1.3 1.4 1.3
< 2,500 g 5.5 6.0 6.5 6.6 6.7 6.6 6.6
4,500 g 1.6 1.7 1.8 1.9 1.8 1.9 1.9
Table 4.61a: Type of birth by birth weight category, births 2010
< 1,500
g 1,500–2,499 g
2,500–4,499 g
4,500 g+
Unknown
Unassisted vaginal birth
n 487 1,552 37,024 674 95
% 47.7 40.1 54.7 48.0 49.2
Vacuum extraction
n 3 160 5,826 96 23
% 0.3 4.1 8.6 6.8 11.9
Forceps
n 23 189 3,915 77 6
% 2.3 4.9 5.8 5.5 3.1
Planned caesarean section
n 88 797 11,562 228 37
% 8.6 20.5 17.1 16.3 19.2
Unplanned caesarean section
n 419 1,177 9,282 328 31
% 41.1 30.4 13.7 23.4 16.1
Not stated
n 0 0 15 1 1
% 0.0 0.0 0.0 0.1 0.5
Total 1,020 3,875 67,624 1,404 193
0
1
2
3
4
5
6
7
8
1985 1990 1995 2000 2005 2010 2011
%
< 1,500 g
< 2,500 g
4,500 g+
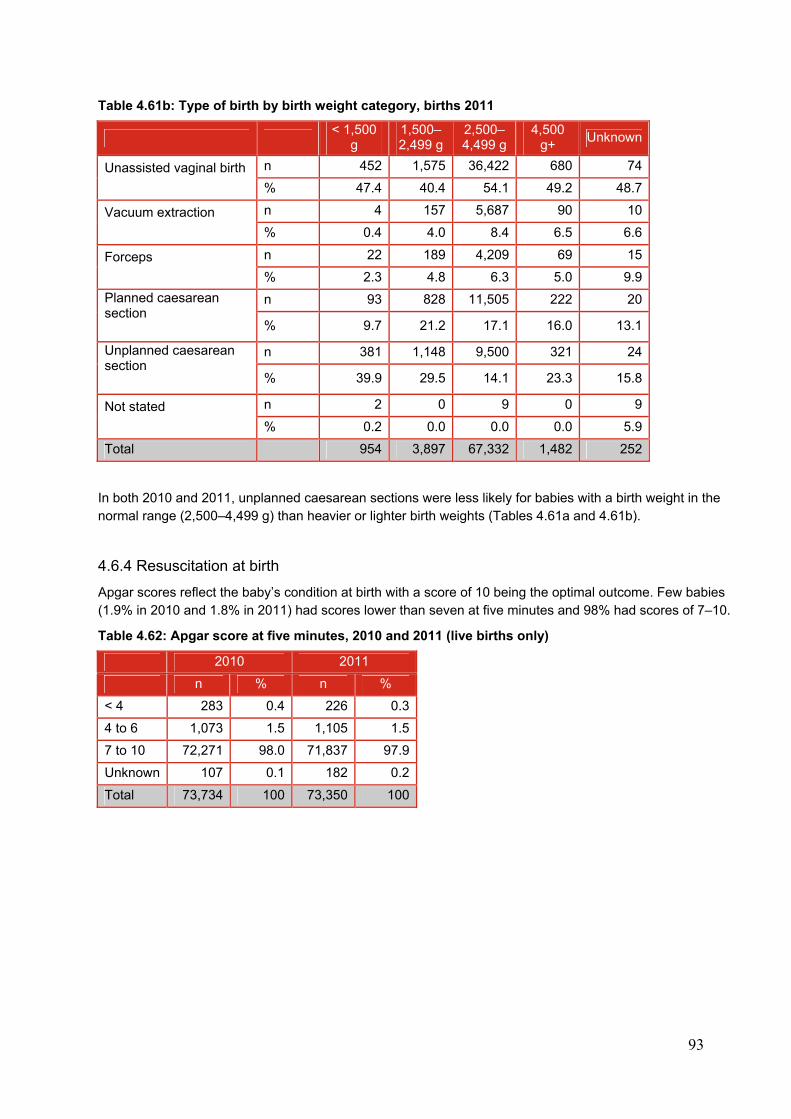
93
Table 4.61b: Type of birth by birth weight category, births 2011
< 1,500
g 1,500–2,499 g
2,500–4,499 g
4,500 g+
Unknown
Unassisted vaginal birth
n 452 1,575 36,422 680 74
% 47.4 40.4 54.1 49.2 48.7
Vacuum extraction
n 4 157 5,687 90 10
% 0.4 4.0 8.4 6.5 6.6
Forceps
n 22 189 4,209 69 15
% 2.3 4.8 6.3 5.0 9.9
Planned caesarean section
n 93 828 11,505 222 20
% 9.7 21.2 17.1 16.0 13.1
Unplanned caesarean section
n 381 1,148 9,500 321 24
% 39.9 29.5 14.1 23.3 15.8
Not stated
n 2 0 9 0 9
% 0.2 0.0 0.0 0.0 5.9
Total 954 3,897 67,332 1,482 252
In both 2010 and 2011, unplanned caesarean sections were less likely for babies with a birth weight in the normal range (2,500–4,499 g) than heavier or lighter birth weights (Tables 4.61a and 4.61b).
4.6.4 Resuscitation at birth
Apgar scores reflect the baby’s condition at birth with a score of 10 being the optimal outcome. Few babies (1.9% in 2010 and 1.8% in 2011) had scores lower than seven at five minutes and 98% had scores of 7–10.
Table 4.62: Apgar score at five minutes, 2010 and 2011 (live births only)
2010 2011
n % n %
< 4 283 0.4 226 0.3
4 to 6 1,073 1.5 1,105 1.5
7 to 10 72,271 98.0 71,837 97.9
Unknown 107 0.1 182 0.2
Total 73,734 100 73,350 100
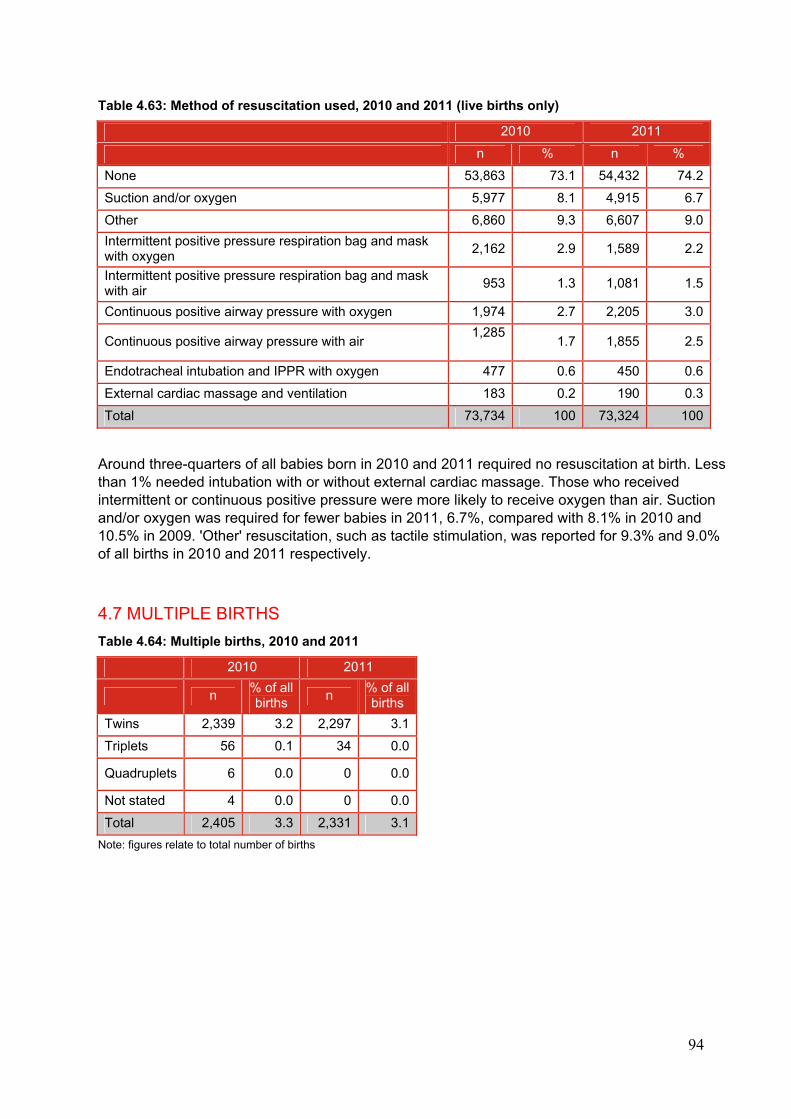
94
Table 4.63: Method of resuscitation used, 2010 and 2011 (live births only)
2010 2011
n % n %
None 53,863 73.1 54,432 74.2
Suction and/or oxygen 5,977 8.1 4,915 6.7
Other 6,860 9.3 6,607 9.0
Intermittent positive pressure respiration bag and mask with oxygen
2,162 2.9 1,589 2.2
Intermittent positive pressure respiration bag and mask with air
953 1.3 1,081 1.5
Continuous positive airway pressure with oxygen 1,974 2.7 2,205 3.0
Continuous positive airway pressure with air 1,285
1.7 1,855 2.5
Endotracheal intubation and IPPR with oxygen 477 0.6 450 0.6
External cardiac massage and ventilation 183 0.2 190 0.3
Total 73,734 100 73,324 100
Around three-quarters of all babies born in 2010 and 2011 required no resuscitation at birth. Less than 1% needed intubation with or without external cardiac massage. Those who received intermittent or continuous positive pressure were more likely to receive oxygen than air. Suction and/or oxygen was required for fewer babies in 2011, 6.7%, compared with 8.1% in 2010 and 10.5% in 2009. 'Other' resuscitation, such as tactile stimulation, was reported for 9.3% and 9.0% of all births in 2010 and 2011 respectively.
4.7 MULTIPLE BIRTHS
Table 4.64: Multiple births, 2010 and 2011
2010 2011
n % of all births
n % of all births
Twins 2,339 3.2 2,297 3.1
Triplets 56 0.1 34 0.0
Quadruplets 6 0.0 0 0.0
Not stated 4 0.0 0 0.0
Total 2,405 3.3 2,331 3.1
Note: figures relate to total number of births
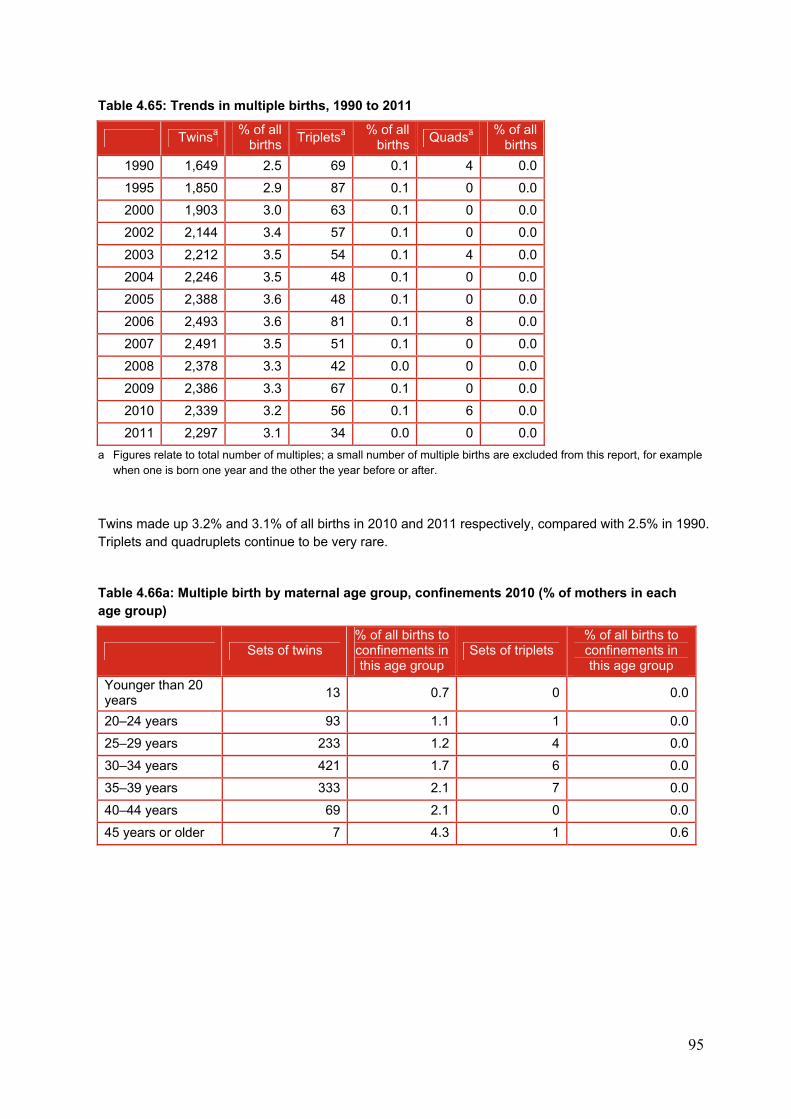
95
Table 4.65: Trends in multiple births, 1990 to 2011
Twinsa % of all
births Tripletsa
% of all births
Quadsa % of all
births
1990 1,649 2.5 69 0.1 4 0.0
1995 1,850 2.9 87 0.1 0 0.0
2000 1,903 3.0 63 0.1 0 0.0
2002 2,144 3.4 57 0.1 0 0.0
2003 2,212 3.5 54 0.1 4 0.0
2004 2,246 3.5 48 0.1 0 0.0
2005 2,388 3.6 48 0.1 0 0.0
2006 2,493 3.6 81 0.1 8 0.0
2007 2,491 3.5 51 0.1 0 0.0
2008 2,378 3.3 42 0.0 0 0.0
2009 2,386 3.3 67 0.1 0 0.0
2010 2,339 3.2 56 0.1 6 0.0
2011 2,297 3.1 34 0.0 0 0.0
a Figures relate to total number of multiples; a small number of multiple births are excluded from this report, for example when one is born one year and the other the year before or after.
Twins made up 3.2% and 3.1% of all births in 2010 and 2011 respectively, compared with 2.5% in 1990. Triplets and quadruplets continue to be very rare.
Table 4.66a: Multiple birth by maternal age group, confinements 2010 (% of mothers in each age group)
Sets of twins % of all births to confinements in this age group
Sets of triplets % of all births to confinements in this age group
Younger than 20 years
13 0.7 0 0.0
20–24 years 93 1.1 1 0.0
25–29 years 233 1.2 4 0.0
30–34 years 421 1.7 6 0.0
35–39 years 333 2.1 7 0.0
40–44 years 69 2.1 0 0.0
45 years or older 7 4.3 1 0.6
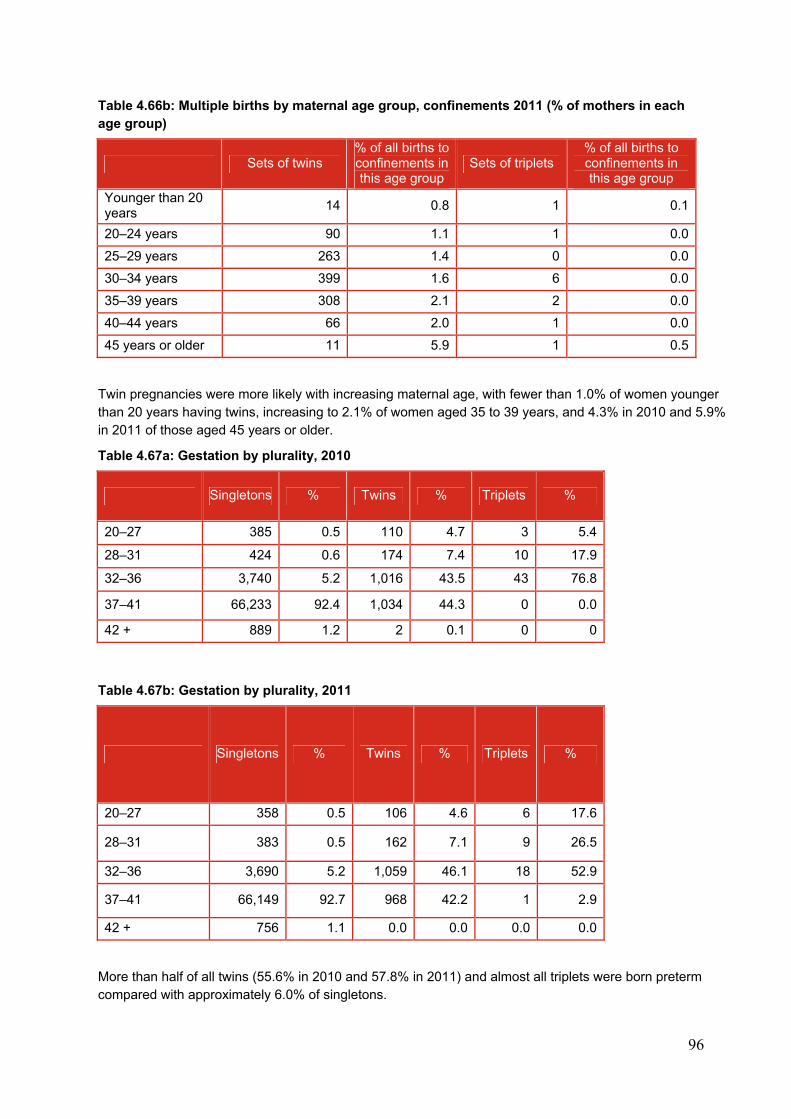
96
Table 4.66b: Multiple births by maternal age group, confinements 2011 (% of mothers in each age group)
Sets of twins % of all births to confinements in this age group
Sets of triplets % of all births to confinements in this age group
Younger than 20 years
14 0.8 1 0.1
20–24 years 90 1.1 1 0.0
25–29 years 263 1.4 0 0.0
30–34 years 399 1.6 6 0.0
35–39 years 308 2.1 2 0.0
40–44 years 66 2.0 1 0.0
45 years or older 11 5.9 1 0.5
Twin pregnancies were more likely with increasing maternal age, with fewer than 1.0% of women younger than 20 years having twins, increasing to 2.1% of women aged 35 to 39 years, and 4.3% in 2010 and 5.9% in 2011 of those aged 45 years or older.
Table 4.67a: Gestation by plurality, 2010
Singletons % Twins % Triplets %
20–27 385 0.5 110 4.7 3 5.4
28–31 424 0.6 174 7.4 10 17.9
32–36 3,740 5.2 1,016 43.5 43 76.8
37–41 66,233 92.4 1,034 44.3 0 0.0
42 + 889 1.2 2 0.1 0 0
Table 4.67b: Gestation by plurality, 2011
Singletons % Twins % Triplets %
20–27 358 0.5 106 4.6 6 17.6
28–31 383 0.5 162 7.1 9 26.5
32–36 3,690 5.2 1,059 46.1 18 52.9
37–41 66,149 92.7 968 42.2 1 2.9
42 + 756 1.1 0.0 0.0 0.0 0.0
More than half of all twins (55.6% in 2010 and 57.8% in 2011) and almost all triplets were born preterm compared with approximately 6.0% of singletons.
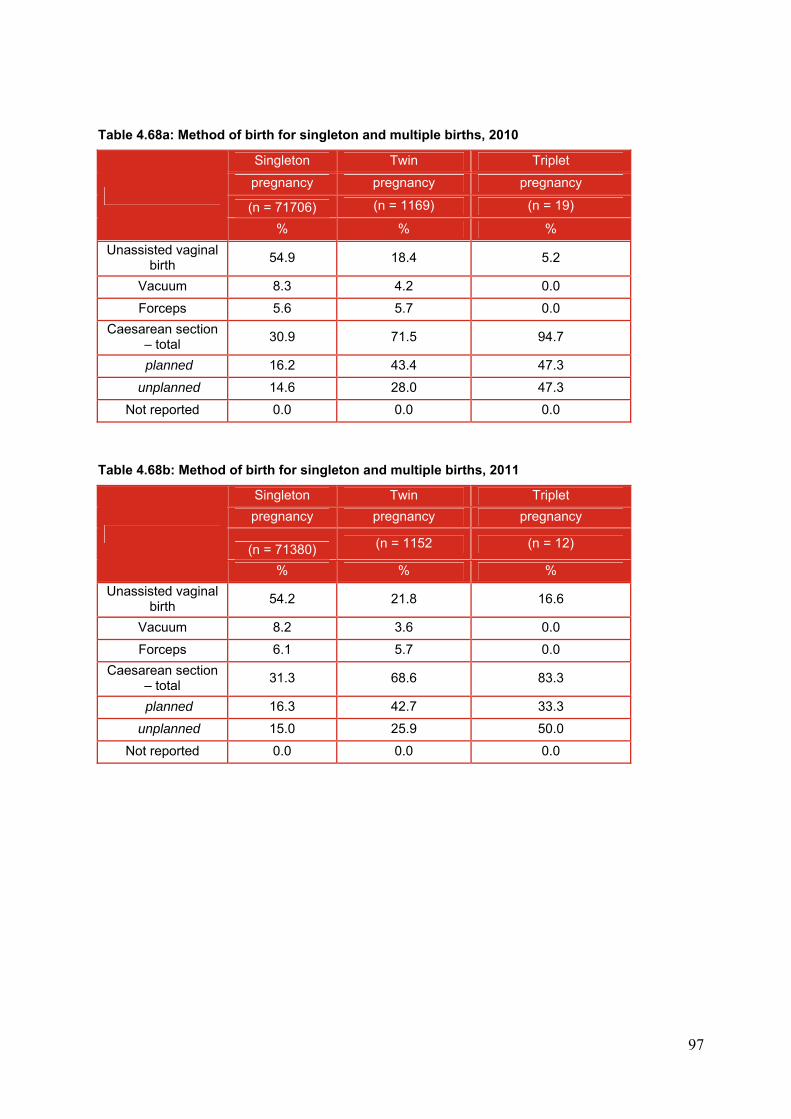
97
Table 4.68a: Method of birth for singleton and multiple births, 2010
Singleton Twin Triplet
pregnancy pregnancy pregnancy
(n = 71706) (n = 1169) (n = 19)
% % %
Unassisted vaginal birth
54.9 18.4 5.2
Vacuum 8.3 4.2 0.0
Forceps 5.6 5.7 0.0
Caesarean section – total
30.9 71.5 94.7
planned 16.2 43.4 47.3
unplanned 14.6 28.0 47.3
Not reported 0.0 0.0 0.0
Table 4.68b: Method of birth for singleton and multiple births, 2011
Singleton Twin Triplet
pregnancy pregnancy pregnancy
(n = 71380) (n = 1152 (n = 12)
% % %
Unassisted vaginal birth
54.2 21.8 16.6
Vacuum 8.2 3.6 0.0
Forceps 6.1 5.7 0.0
Caesarean section – total
31.3 68.6 83.3
planned 16.3 42.7 33.3
unplanned 15.0 25.9 50.0
Not reported 0.0 0.0 0.0
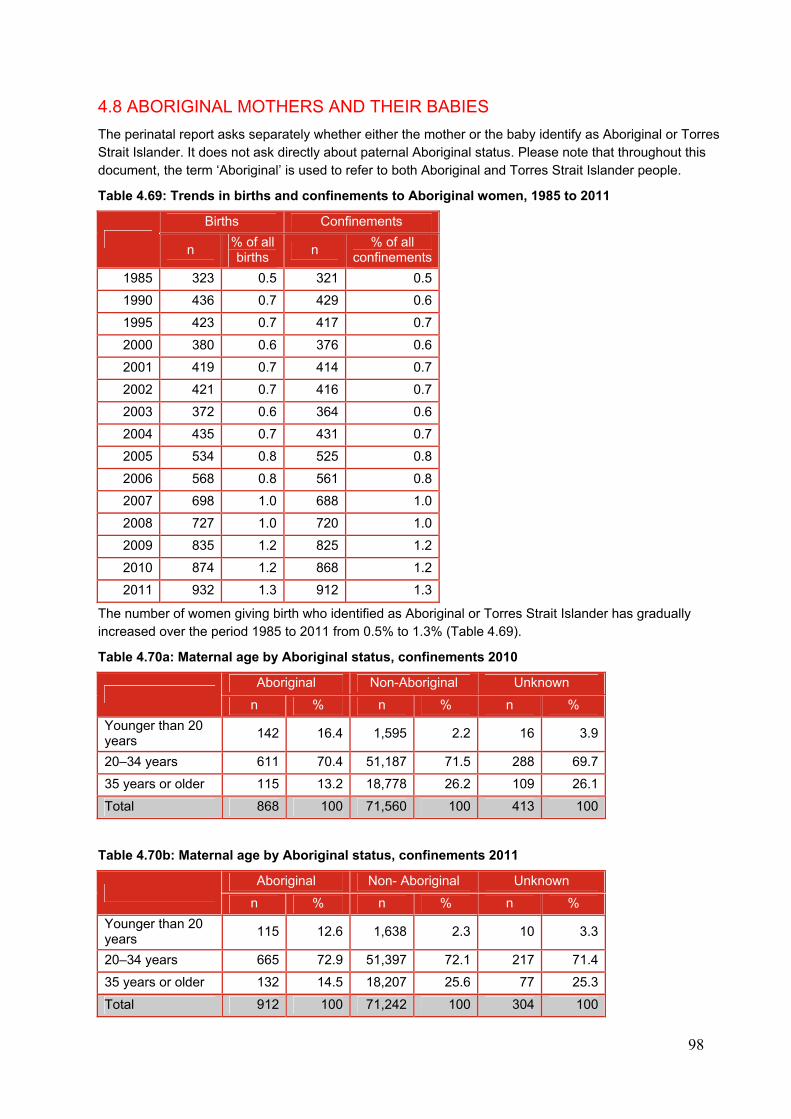
98
4.8 ABORIGINAL MOTHERS AND THEIR BABIES
The perinatal report asks separately whether either the mother or the baby identify as Aboriginal or Torres Strait Islander. It does not ask directly about paternal Aboriginal status. Please note that throughout this document, the term ‘Aboriginal’ is used to refer to both Aboriginal and Torres Strait Islander people.
Table 4.69: Trends in births and confinements to Aboriginal women, 1985 to 2011
Births Confinements
n % of all births
n % of all
confinements
1985 323 0.5 321 0.5
1990 436 0.7 429 0.6
1995 423 0.7 417 0.7
2000 380 0.6 376 0.6
2001 419 0.7 414 0.7
2002 421 0.7 416 0.7
2003 372 0.6 364 0.6
2004 435 0.7 431 0.7
2005 534 0.8 525 0.8
2006 568 0.8 561 0.8
2007 698 1.0 688 1.0
2008 727 1.0 720 1.0
2009 835 1.2 825 1.2
2010 874 1.2 868 1.2
2011 932 1.3 912 1.3
The number of women giving birth who identified as Aboriginal or Torres Strait Islander has gradually increased over the period 1985 to 2011 from 0.5% to 1.3% (Table 4.69).
Table 4.70a: Maternal age by Aboriginal status, confinements 2010
Aboriginal Non-Aboriginal Unknown
n % n % n %
Younger than 20 years
142 16.4 1,595 2.2 16 3.9
20–34 years 611 70.4 51,187 71.5 288 69.7
35 years or older 115 13.2 18,778 26.2 109 26.1
Total 868 100 71,560 100 413 100
Table 4.70b: Maternal age by Aboriginal status, confinements 2011
Aboriginal Non- Aboriginal Unknown
n % n % n %
Younger than 20 years
115 12.6 1,638 2.3 10 3.3
20–34 years 665 72.9 51,397 72.1 217 71.4
35 years or older 132 14.5 18,207 25.6 77 25.3
Total 912 100 71,242 100 304 100
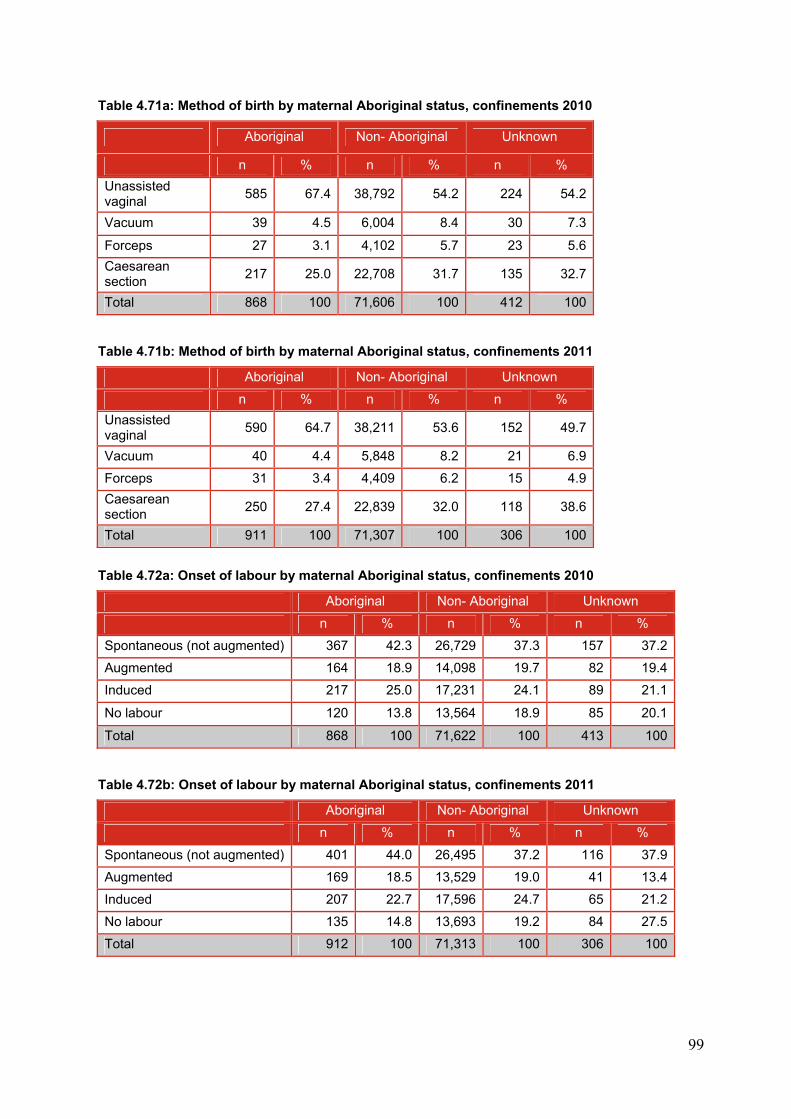
99
Table 4.71a: Method of birth by maternal Aboriginal status, confinements 2010
Aboriginal Non- Aboriginal Unknown
n % n % n %
Unassisted vaginal
585 67.4 38,792 54.2 224 54.2
Vacuum 39 4.5 6,004 8.4 30 7.3
Forceps 27 3.1 4,102 5.7 23 5.6
Caesarean section
217 25.0 22,708 31.7 135 32.7
Total 868 100 71,606 100 412 100
Table 4.71b: Method of birth by maternal Aboriginal status, confinements 2011
Aboriginal Non- Aboriginal Unknown
n % n % n %
Unassisted vaginal
590 64.7 38,211 53.6 152 49.7
Vacuum 40 4.4 5,848 8.2 21 6.9
Forceps 31 3.4 4,409 6.2 15 4.9
Caesarean section
250 27.4 22,839 32.0 118 38.6
Total 911 100 71,307 100 306 100
Table 4.72a: Onset of labour by maternal Aboriginal status, confinements 2010
Aboriginal Non- Aboriginal Unknown
n % n % n %
Spontaneous (not augmented) 367 42.3 26,729 37.3 157 37.2
Augmented 164 18.9 14,098 19.7 82 19.4
Induced 217 25.0 17,231 24.1 89 21.1
No labour 120 13.8 13,564 18.9 85 20.1
Total 868 100 71,622 100 413 100
Table 4.72b: Onset of labour by maternal Aboriginal status, confinements 2011
Aboriginal Non- Aboriginal Unknown
n % n % n %
Spontaneous (not augmented) 401 44.0 26,495 37.2 116 37.9
Augmented 169 18.5 13,529 19.0 41 13.4
Induced 207 22.7 17,596 24.7 65 21.2
No labour 135 14.8 13,693 19.2 84 27.5
Total 912 100 71,313 100 306 100
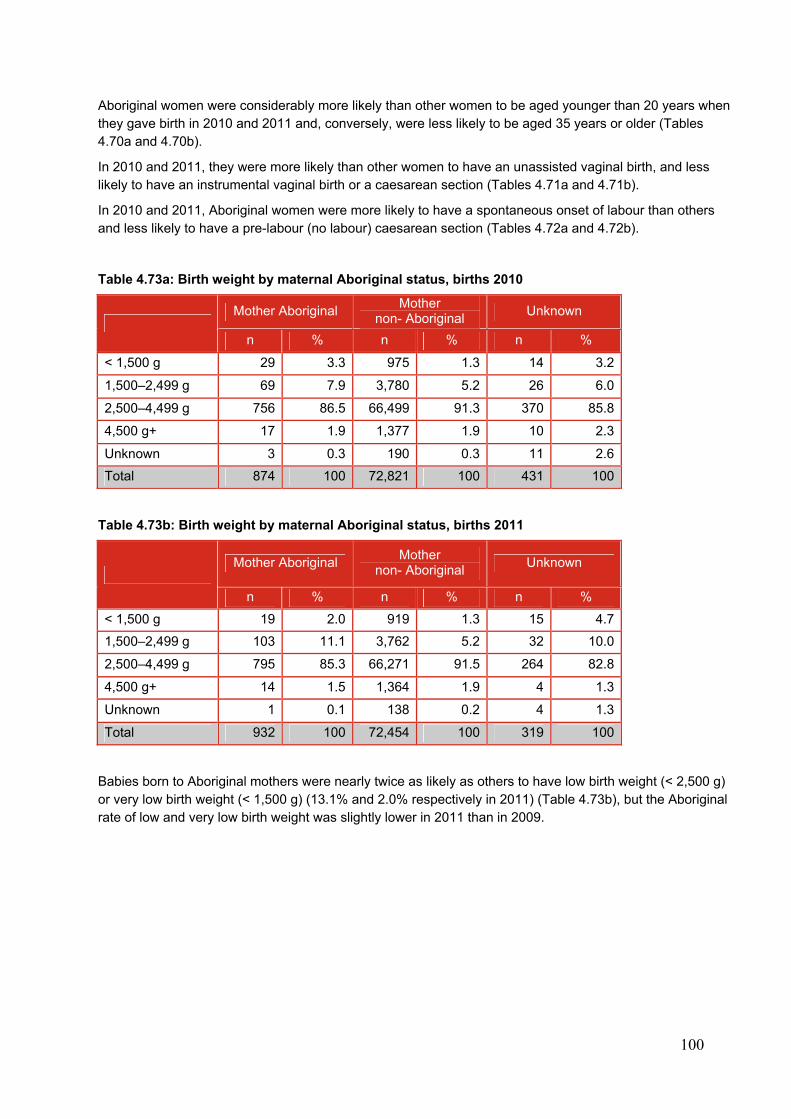
100
Aboriginal women were considerably more likely than other women to be aged younger than 20 years when they gave birth in 2010 and 2011 and, conversely, were less likely to be aged 35 years or older (Tables 4.70a and 4.70b).
In 2010 and 2011, they were more likely than other women to have an unassisted vaginal birth, and less likely to have an instrumental vaginal birth or a caesarean section (Tables 4.71a and 4.71b).
In 2010 and 2011, Aboriginal women were more likely to have a spontaneous onset of labour than others and less likely to have a pre-labour (no labour) caesarean section (Tables 4.72a and 4.72b).
Table 4.73a: Birth weight by maternal Aboriginal status, births 2010
Mother Aboriginal
Mother non- Aboriginal
Unknown
n % n % n %
< 1,500 g 29 3.3 975 1.3 14 3.2
1,500–2,499 g 69 7.9 3,780 5.2 26 6.0
2,500–4,499 g 756 86.5 66,499 91.3 370 85.8
4,500 g+ 17 1.9 1,377 1.9 10 2.3
Unknown 3 0.3 190 0.3 11 2.6
Total 874 100 72,821 100 431 100
Table 4.73b: Birth weight by maternal Aboriginal status, births 2011
Mother Aboriginal
Mother non- Aboriginal
Unknown
n % n % n %
< 1,500 g 19 2.0 919 1.3 15 4.7
1,500–2,499 g 103 11.1 3,762 5.2 32 10.0
2,500–4,499 g 795 85.3 66,271 91.5 264 82.8
4,500 g+ 14 1.5 1,364 1.9 4 1.3
Unknown 1 0.1 138 0.2 4 1.3
Total 932 100 72,454 100 319 100
Babies born to Aboriginal mothers were nearly twice as likely as others to have low birth weight (< 2,500 g) or very low birth weight (< 1,500 g) (13.1% and 2.0% respectively in 2011) (Table 4.73b), but the Aboriginal rate of low and very low birth weight was slightly lower in 2011 than in 2009.
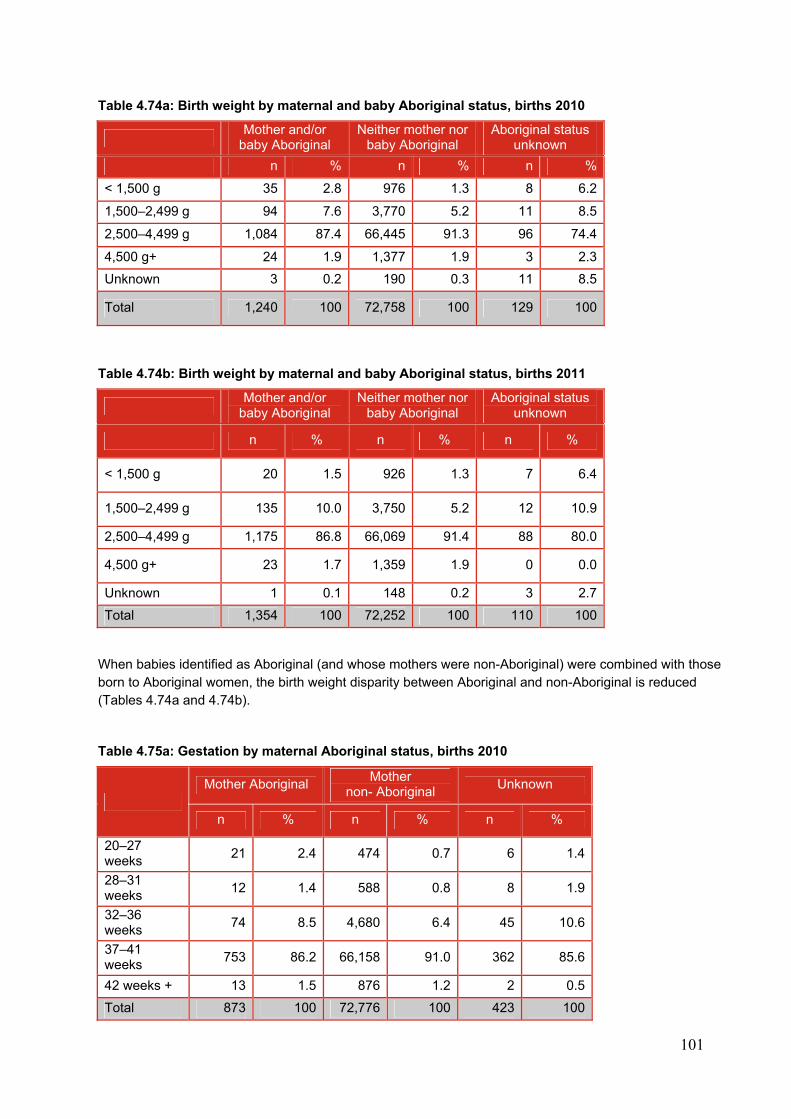
101
Table 4.74a: Birth weight by maternal and baby Aboriginal status, births 2010
Mother and/or
baby Aboriginal Neither mother nor
baby Aboriginal Aboriginal status
unknown
n % n % n %
< 1,500 g 35 2.8 976 1.3 8 6.2
1,500–2,499 g 94 7.6 3,770 5.2 11 8.5
2,500–4,499 g 1,084 87.4 66,445 91.3 96 74.4
4,500 g+ 24 1.9 1,377 1.9 3 2.3
Unknown 3 0.2 190 0.3 11 8.5
Total 1,240 100 72,758 100 129 100
Table 4.74b: Birth weight by maternal and baby Aboriginal status, births 2011
Mother and/or
baby Aboriginal Neither mother nor
baby Aboriginal Aboriginal status
unknown
n % n % n %
< 1,500 g 20 1.5 926 1.3 7 6.4
1,500–2,499 g 135 10.0 3,750 5.2 12 10.9
2,500–4,499 g 1,175 86.8 66,069 91.4 88 80.0
4,500 g+ 23 1.7 1,359 1.9 0 0.0
Unknown 1 0.1 148 0.2 3 2.7
Total 1,354 100 72,252 100 110 100
When babies identified as Aboriginal (and whose mothers were non-Aboriginal) were combined with those born to Aboriginal women, the birth weight disparity between Aboriginal and non-Aboriginal is reduced (Tables 4.74a and 4.74b).
Table 4.75a: Gestation by maternal Aboriginal status, births 2010
Mother Aboriginal
Mother non- Aboriginal
Unknown
n % n % n %
20–27 weeks
21 2.4 474 0.7 6 1.4
28–31 weeks
12 1.4 588 0.8 8 1.9
32–36 weeks
74 8.5 4,680 6.4 45 10.6
37–41 weeks
753 86.2 66,158 91.0 362 85.6
42 weeks + 13 1.5 876 1.2 2 0.5
Total 873 100 72,776 100 423 100
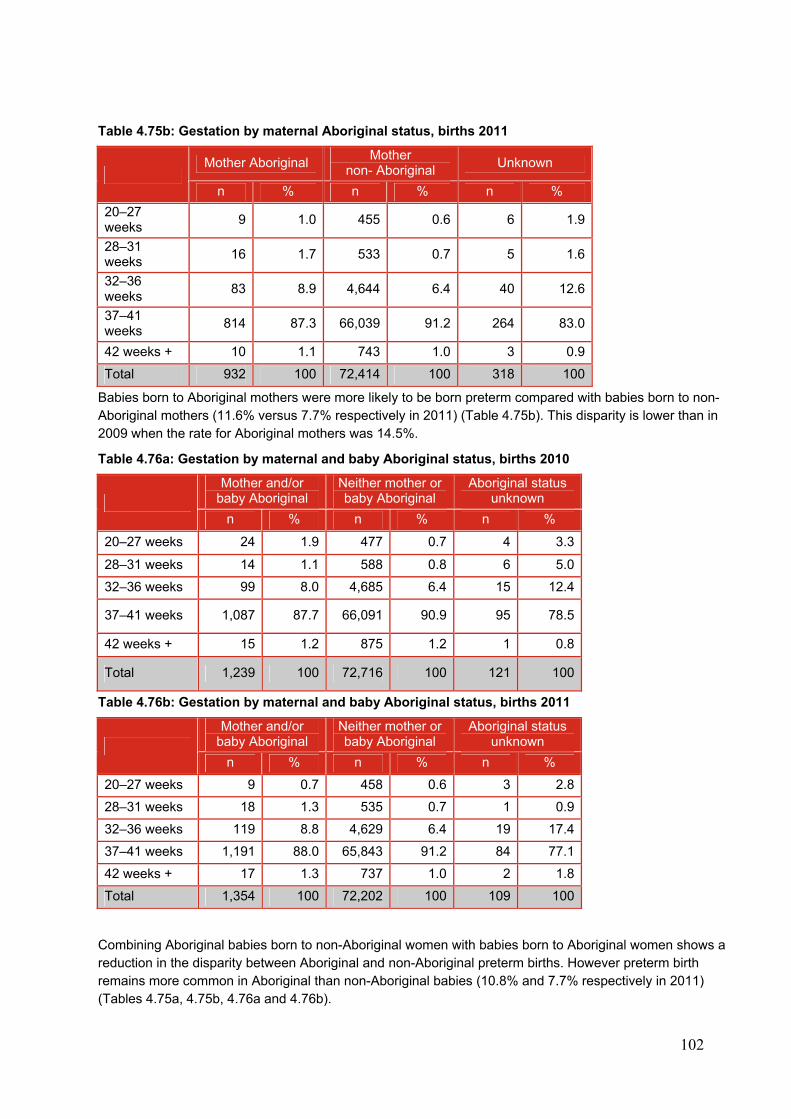
102
Table 4.75b: Gestation by maternal Aboriginal status, births 2011
Mother Aboriginal
Mother non- Aboriginal
Unknown
n % n % n %
20–27 weeks
9 1.0 455 0.6 6 1.9
28–31 weeks
16 1.7 533 0.7 5 1.6
32–36 weeks
83 8.9 4,644 6.4 40 12.6
37–41 weeks
814 87.3 66,039 91.2 264 83.0
42 weeks + 10 1.1 743 1.0 3 0.9
Total 932 100 72,414 100 318 100
Babies born to Aboriginal mothers were more likely to be born preterm compared with babies born to non-Aboriginal mothers (11.6% versus 7.7% respectively in 2011) (Table 4.75b). This disparity is lower than in 2009 when the rate for Aboriginal mothers was 14.5%.
Table 4.76a: Gestation by maternal and baby Aboriginal status, births 2010
Mother and/or baby Aboriginal
Neither mother or baby Aboriginal
Aboriginal status unknown
n % n % n %
20–27 weeks 24 1.9 477 0.7 4 3.3
28–31 weeks 14 1.1 588 0.8 6 5.0
32–36 weeks 99 8.0 4,685 6.4 15 12.4
37–41 weeks 1,087 87.7 66,091 90.9 95 78.5
42 weeks + 15 1.2 875 1.2 1 0.8
Total 1,239 100 72,716 100 121 100
Table 4.76b: Gestation by maternal and baby Aboriginal status, births 2011
Mother and/or baby Aboriginal
Neither mother or baby Aboriginal
Aboriginal status unknown
n % n % n %
20–27 weeks 9 0.7 458 0.6 3 2.8
28–31 weeks 18 1.3 535 0.7 1 0.9
32–36 weeks 119 8.8 4,629 6.4 19 17.4
37–41 weeks 1,191 88.0 65,843 91.2 84 77.1
42 weeks + 17 1.3 737 1.0 2 1.8
Total 1,354 100 72,202 100 109 100
Combining Aboriginal babies born to non-Aboriginal women with babies born to Aboriginal women shows a reduction in the disparity between Aboriginal and non-Aboriginal preterm births. However preterm birth remains more common in Aboriginal than non-Aboriginal babies (10.8% and 7.7% respectively in 2011) (Tables 4.75a, 4.75b, 4.76a and 4.76b).
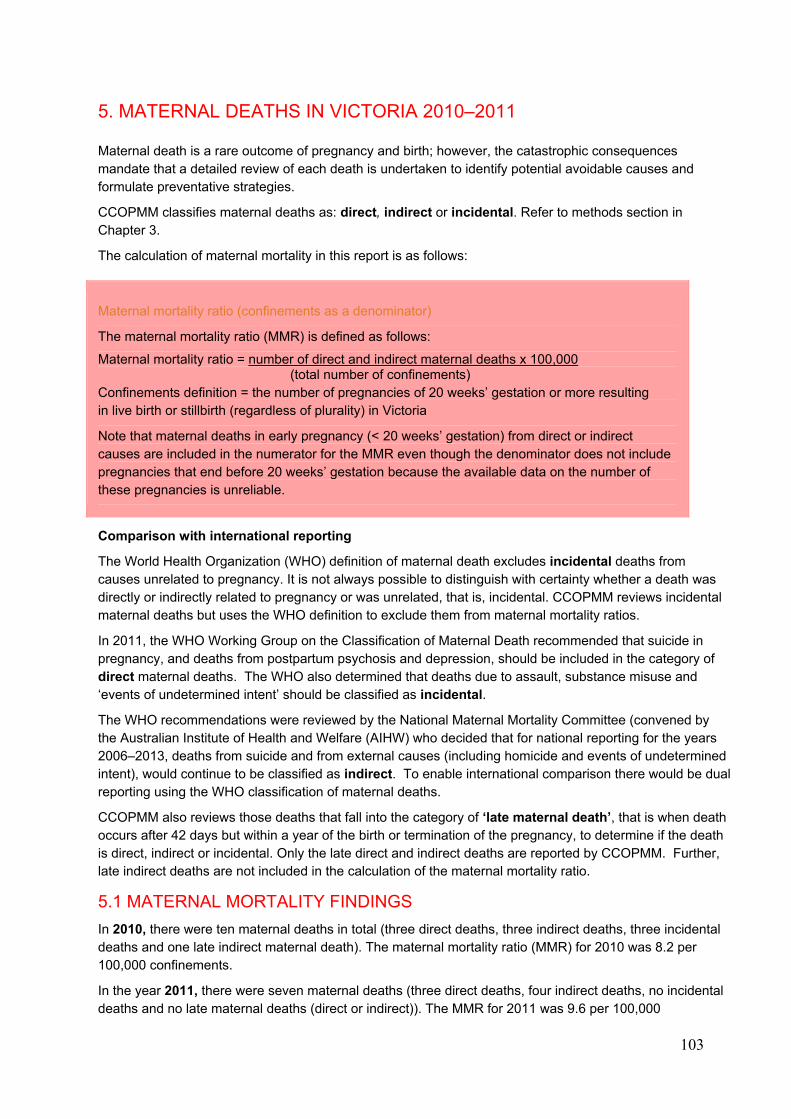
103
5. MATERNAL DEATHS IN VICTORIA 2010–2011
Maternal death is a rare outcome of pregnancy and birth; however, the catastrophic consequences mandate that a detailed review of each death is undertaken to identify potential avoidable causes and formulate preventative strategies.
CCOPMM classifies maternal deaths as: direct, indirect or incidental. Refer to methods section in Chapter 3.
The calculation of maternal mortality in this report is as follows:
Comparison with international reporting
The World Health Organization (WHO) definition of maternal death excludes incidental deaths from causes unrelated to pregnancy. It is not always possible to distinguish with certainty whether a death was directly or indirectly related to pregnancy or was unrelated, that is, incidental. CCOPMM reviews incidental maternal deaths but uses the WHO definition to exclude them from maternal mortality ratios.
In 2011, the WHO Working Group on the Classification of Maternal Death recommended that suicide in pregnancy, and deaths from postpartum psychosis and depression, should be included in the category of direct maternal deaths. The WHO also determined that deaths due to assault, substance misuse and ‘events of undetermined intent’ should be classified as incidental.
The WHO recommendations were reviewed by the National Maternal Mortality Committee (convened by the Australian Institute of Health and Welfare (AIHW) who decided that for national reporting for the years 2006–2013, deaths from suicide and from external causes (including homicide and events of undetermined intent), would continue to be classified as indirect. To enable international comparison there would be dual reporting using the WHO classification of maternal deaths.
CCOPMM also reviews those deaths that fall into the category of ‘late maternal death’, that is when death occurs after 42 days but within a year of the birth or termination of the pregnancy, to determine if the death is direct, indirect or incidental. Only the late direct and indirect deaths are reported by CCOPMM. Further, late indirect deaths are not included in the calculation of the maternal mortality ratio.
5.1 MATERNAL MORTALITY FINDINGS
In 2010, there were ten maternal deaths in total (three direct deaths, three indirect deaths, three incidental deaths and one late indirect maternal death). The maternal mortality ratio (MMR) for 2010 was 8.2 per 100,000 confinements.
In the year 2011, there were seven maternal deaths (three direct deaths, four indirect deaths, no incidental deaths and no late maternal deaths (direct or indirect)). The MMR for 2011 was 9.6 per 100,000
Maternal mortality ratio (confinements as a denominator)
The maternal mortality ratio (MMR) is defined as follows:
Maternal mortality ratio = number of direct and indirect maternal deaths x 100,000 (total number of confinements) Confinements definition = the number of pregnancies of 20 weeks’ gestation or more resulting in live birth or stillbirth (regardless of plurality) in Victoria
Note that maternal deaths in early pregnancy (< 20 weeks’ gestation) from direct or indirect causes are included in the numerator for the MMR even though the denominator does not include pregnancies that end before 20 weeks’ gestation because the available data on the number of these pregnancies is unreliable.
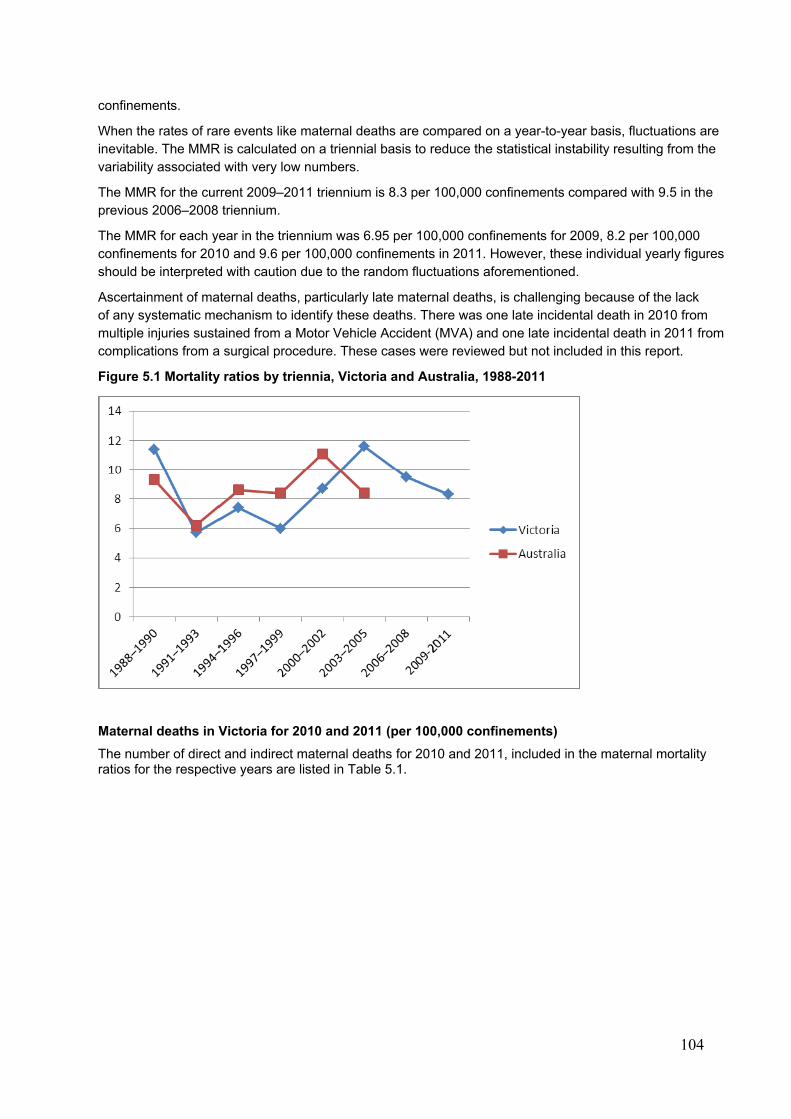
104
confinements.
When the rates of rare events like maternal deaths are compared on a year-to-year basis, fluctuations are inevitable. The MMR is calculated on a triennial basis to reduce the statistical instability resulting from the variability associated with very low numbers.
The MMR for the current 2009–2011 triennium is 8.3 per 100,000 confinements compared with 9.5 in the previous 2006–2008 triennium.
The MMR for each year in the triennium was 6.95 per 100,000 confinements for 2009, 8.2 per 100,000 confinements for 2010 and 9.6 per 100,000 confinements in 2011. However, these individual yearly figures should be interpreted with caution due to the random fluctuations aforementioned.
Ascertainment of maternal deaths, particularly late maternal deaths, is challenging because of the lack of any systematic mechanism to identify these deaths. There was one late incidental death in 2010 from multiple injuries sustained from a Motor Vehicle Accident (MVA) and one late incidental death in 2011 from complications from a surgical procedure. These cases were reviewed but not included in this report.
Figure 5.1 Mortality ratios by triennia, Victoria and Australia, 1988-2011
Maternal deaths in Victoria for 2010 and 2011 (per 100,000 confinements)
The number of direct and indirect maternal deaths for 2010 and 2011, included in the maternal mortality ratios for the respective years are listed in Table 5.1.

105
Table 5.1: Maternal mortality ratios in Victoria 1988–2011 (per 100,000 confinements)
Year Direct deaths Indirect deaths Confinementsa Maternal t lit ti b
1988 3 5 62,854 12.7
1989 2 3 63,419 7.9
1990 6 3 66,004 13.6
1991 1 3 64,338 6.2
1992 2 2 65,404 6.1
1993 3 0 63,795 4.7
1994 2 3 63,983 7.8
1995 4 3 62,734 11.2
1996 2 0 62,028 3.2
1997 2 2 61,312 6.5
1998 2 1 61,071 4.9
1999 2 2 61,588 6.5
2000 2 2 61,571 6.5
2001 1 4 61,108 8.2
2002 5 2 62,023 11.3
2003 0 3 62,403 4.8
2004 4 8 62,543 19.2
2005 3 4 65,429 10.7
2006 1 6 68,547 10.2
2007 1 9 71,190 14.0
2008 2 1 71,323 4.2
2009 1 4 71,986 6.95
2010 3 3 73,275 8.2
2011 3 4 72,915 9.6
a Includes confinements related to termination of pregnancy.
b Per 100,000 confinements. Ratio calculated using direct and indirect deaths.
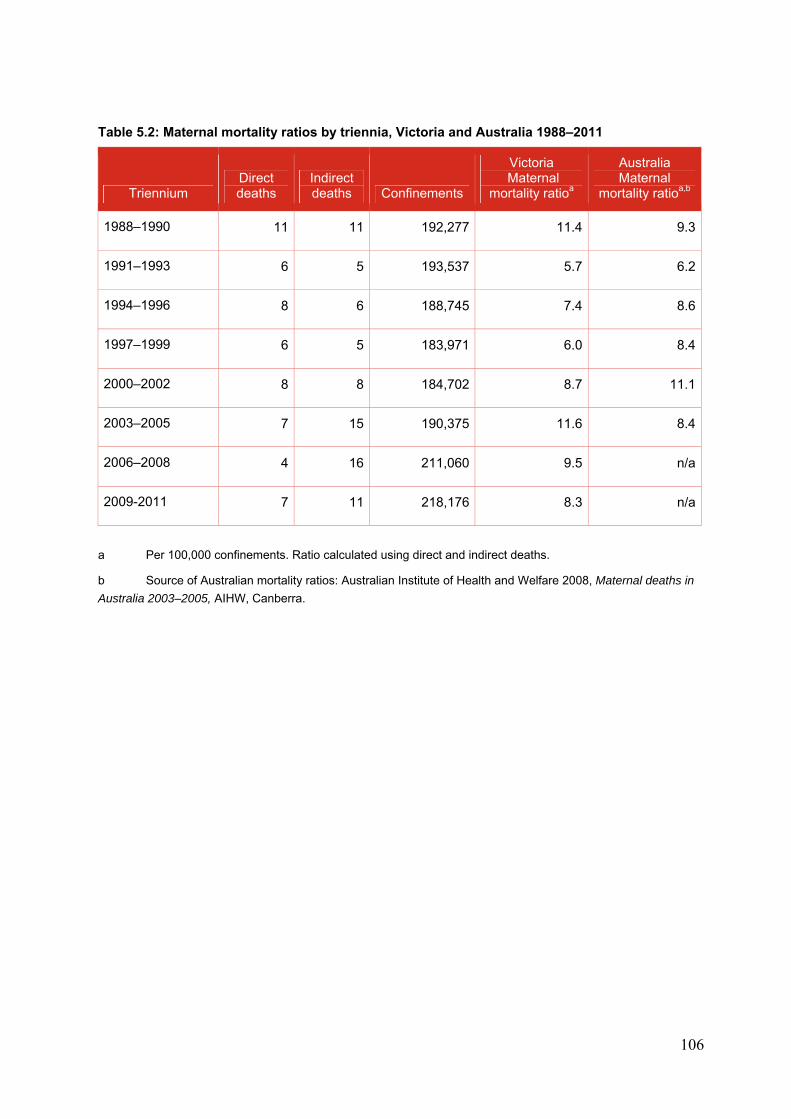
106
Table 5.2: Maternal mortality ratios by triennia, Victoria and Australia 1988–2011
Triennium Direct deaths
Indirect deaths Confinements
Victoria Maternal
mortality ratioa
Australia Maternal
mortality ratioa,b
1988–1990 11 11 192,277 11.4 9.3
1991–1993 6 5 193,537 5.7 6.2
1994–1996 8 6 188,745 7.4 8.6
1997–1999 6 5 183,971 6.0 8.4
2000–2002 8 8 184,702 8.7 11.1
2003–2005 7 15 190,375 11.6 8.4
2006–2008 4 16 211,060 9.5 n/a
2009-2011 7 11 218,176 8.3 n/a
a Per 100,000 confinements. Ratio calculated using direct and indirect deaths.
b Source of Australian mortality ratios: Australian Institute of Health and Welfare 2008, Maternal deaths in
Australia 2003–2005, AIHW, Canberra.
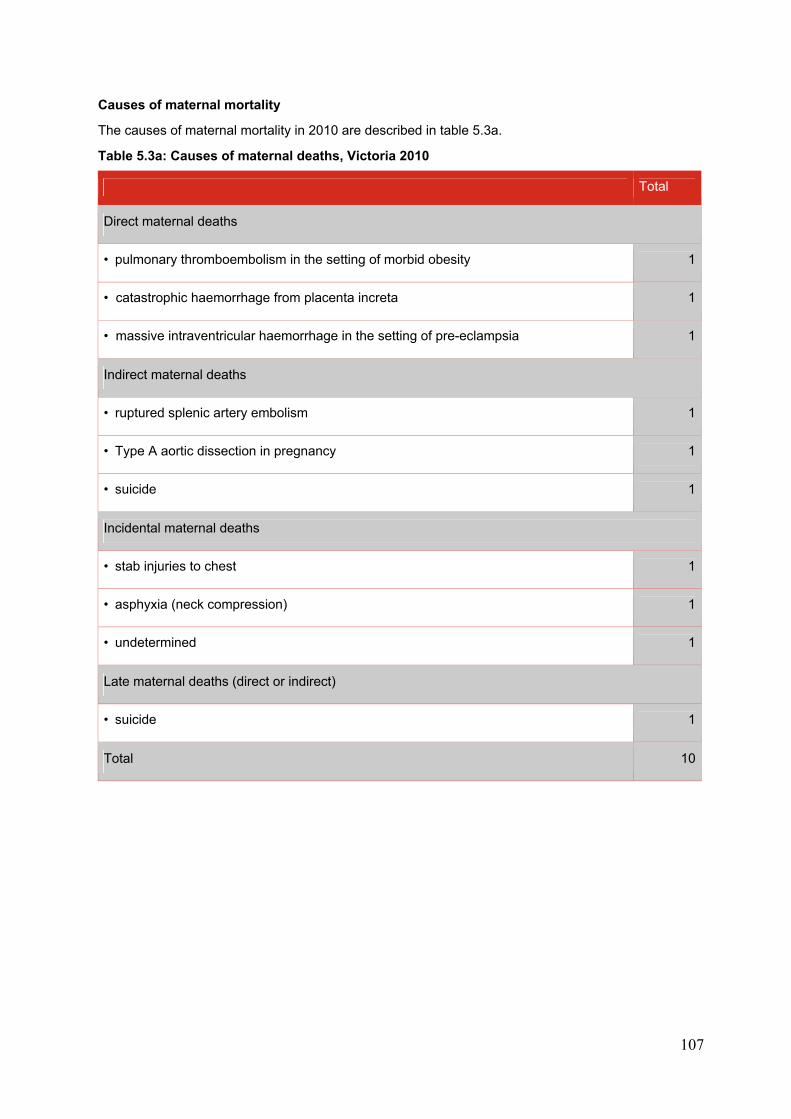
107
Causes of maternal mortality
The causes of maternal mortality in 2010 are described in table 5.3a.
Table 5.3a: Causes of maternal deaths, Victoria 2010
Total
Direct maternal deaths
• pulmonary thromboembolism in the setting of morbid obesity 1
• catastrophic haemorrhage from placenta increta 1
• massive intraventricular haemorrhage in the setting of pre-eclampsia 1
Indirect maternal deaths
• ruptured splenic artery embolism 1
• Type A aortic dissection in pregnancy 1
• suicide 1
Incidental maternal deaths
• stab injuries to chest 1
• asphyxia (neck compression) 1
• undetermined 1
Late maternal deaths (direct or indirect)
• suicide 1
Total 10
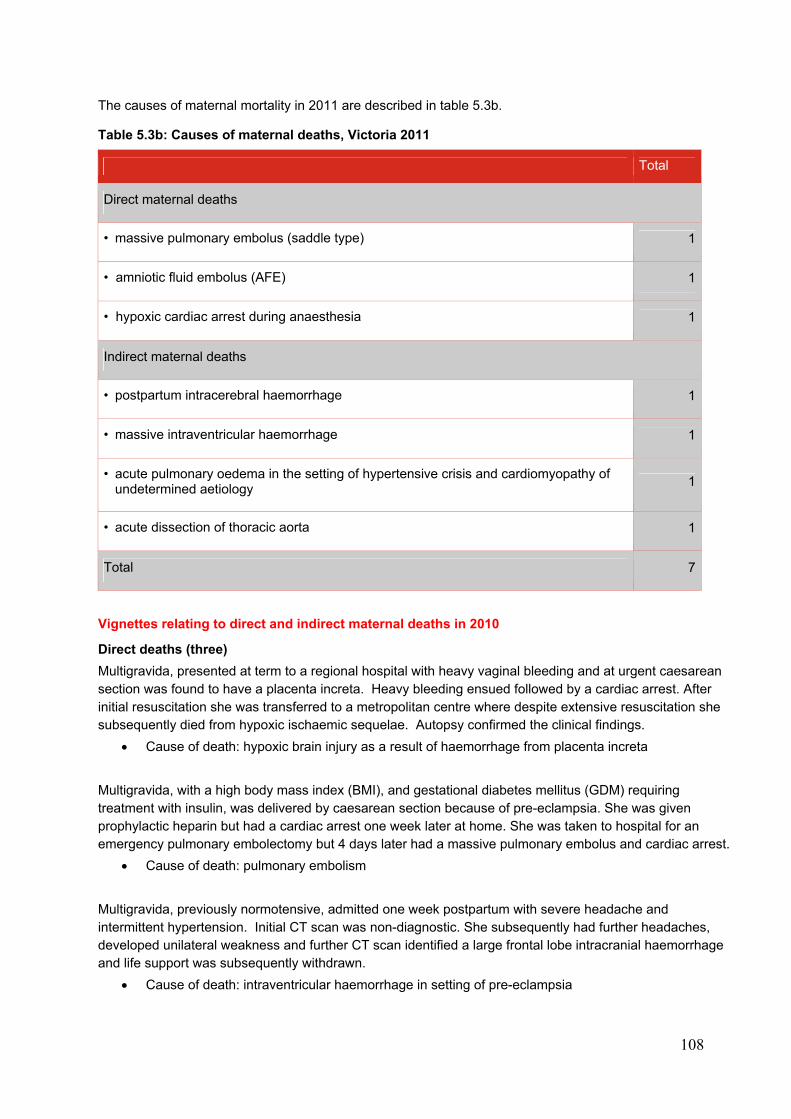
108
The causes of maternal mortality in 2011 are described in table 5.3b.
Table 5.3b: Causes of maternal deaths, Victoria 2011
Total
Direct maternal deaths
• massive pulmonary embolus (saddle type) 1
• amniotic fluid embolus (AFE) 1
• hypoxic cardiac arrest during anaesthesia 1
Indirect maternal deaths
• postpartum intracerebral haemorrhage 1
• massive intraventricular haemorrhage 1
• acute pulmonary oedema in the setting of hypertensive crisis and cardiomyopathy of undetermined aetiology
1
• acute dissection of thoracic aorta 1
Total 7
Vignettes relating to direct and indirect maternal deaths in 2010
Direct deaths (three)
Multigravida, presented at term to a regional hospital with heavy vaginal bleeding and at urgent caesarean section was found to have a placenta increta. Heavy bleeding ensued followed by a cardiac arrest. After initial resuscitation she was transferred to a metropolitan centre where despite extensive resuscitation she subsequently died from hypoxic ischaemic sequelae. Autopsy confirmed the clinical findings.
Cause of death: hypoxic brain injury as a result of haemorrhage from placenta increta
Multigravida, with a high body mass index (BMI), and gestational diabetes mellitus (GDM) requiring treatment with insulin, was delivered by caesarean section because of pre-eclampsia. She was given prophylactic heparin but had a cardiac arrest one week later at home. She was taken to hospital for an emergency pulmonary embolectomy but 4 days later had a massive pulmonary embolus and cardiac arrest.
Cause of death: pulmonary embolism
Multigravida, previously normotensive, admitted one week postpartum with severe headache and intermittent hypertension. Initial CT scan was non-diagnostic. She subsequently had further headaches, developed unilateral weakness and further CT scan identified a large frontal lobe intracranial haemorrhage and life support was subsequently withdrawn.
Cause of death: intraventricular haemorrhage in setting of pre-eclampsia
109
Indirect deaths (three)
Primigravida, presented to hospital in early third trimester, with severe left sided abdominal pain that settled. Two days later she collapsed at home and suffered a cardiac arrest on arrival to hospital. She was delivered by perimortem caesarean section (the baby died shortly after birth) that revealed a ruptured splenic artery aneurysm.
Cause of death: ruptured splenic artery aneurysm
Previously well primigravida presented in early third trimester with chest pain. Type A aortic dissection was diagnosed and she was delivered by caesarean section and simultaneously underwent repair of the ascending aorta. She subsequently developed coagulopathy and cerebral infarction and life support was withdrawn.
Cause of death: Type A aortic dissection
Multigravida, in mid-pregnancy committed suicide. Although there was no documented history of psychiatric illness, there was a history of domestic violence.
Cause of death: Suicide
Vignettes relating to direct and indirect maternal deaths in 2011
Direct deaths (three)
Primigravida,presented early in third trimester with an episode of shortness of breath and chest pain that was investigated without a cause being found. One week later collapsed at home and was found to be deceased on arrival at hospital. Autopsy revealed a large saddle embolus.
Cause of death: pulmonary embolism
Primigravida, induced at term for pre-existing hypertension. Shortly after delivery this woman suffered a major postpartum haemorrhage. She was transferred to the operating theatre where despite aggressive resuscitation and hysterectomy she suffered a fatal cardiac arrest. At autopsy evidence of amniotic fluid embolism was identified.
Cause of death: amniotic fluid embolism
Multigravida, with a high BMI suffered a cardiac arrest in the recovery unit following a second trimester termination of pregnancy. Following transfer to ICU at another hospital, global cerebral ischaemia was identified and further treatment was withdrawn.
Cause of death: hypoxic cardiac arrest during general anaesthesia
Indirect deaths (four)
Primigravida, four days postpartum lost consciousness after complaining of headache. CT scan on admission showed a non-operable intracerebral haemorrhage.
Cause of death: postpartum intracerebral angiopathy
Primigravida presented one-week post caesarean section with severe headache and rapid deterioration in conscious state. MRI confirmed large intracerebral haemorrhage and brainstem death was confirmed two weeks later. Autopsy did not identify the cause of the haemorrhage.
Cause of death: intracerebral haemorrhage
110
Multiparous woman with past history of rheumatic fever, pre-eclampsia and pulmonary oedema postpartum in her last pregnancy, however echocardiography did not identify valvular disease. A week after induction for mild pre-eclampsia, she collapsed at home after becoming short of breath with pulmonary oedema and was unable to be resuscitated on arrival in the ED.
Cause of death: Cardiomyopathy
Primiparous normal pregnancy apart from flu-like illness one week prior, found dead at home a few hours after a routine antenatal visit mid-pregnancy. Autopsy revealed cardiac tamponade secondary to an aortic dissection.
Cause of death: acute thoracic aortic dissection
5.2 MATERNAL MORBIDITY FINDINGS
The CCOPMM Maternal Mortality and Morbidity Sub-Committee reviews maternal deaths and serious maternal morbidity. Despite the small number of deaths that occur each year in Victoria, continued surveillance is essential. The Maternal Mortality and Morbidity Sub-Committee considers it important to review severe acute morbidity cases to consider potential preventability.
Since 2009, the majority of maternity services in Victoria have participated in the NHMRC-funded Australasian Maternity Outcomes Surveillance System (AMOSS) study that monitors rare obstetric disorders and events to improve knowledge and management of such conditions. Further details can be obtained through the AMOSS website <www.amoss.com.au>.
Following a successful pilot project, CCOPMM is exploring options to commence surveillance of selected maternal admissions to ICU of women who are, or who were recently, pregnant.
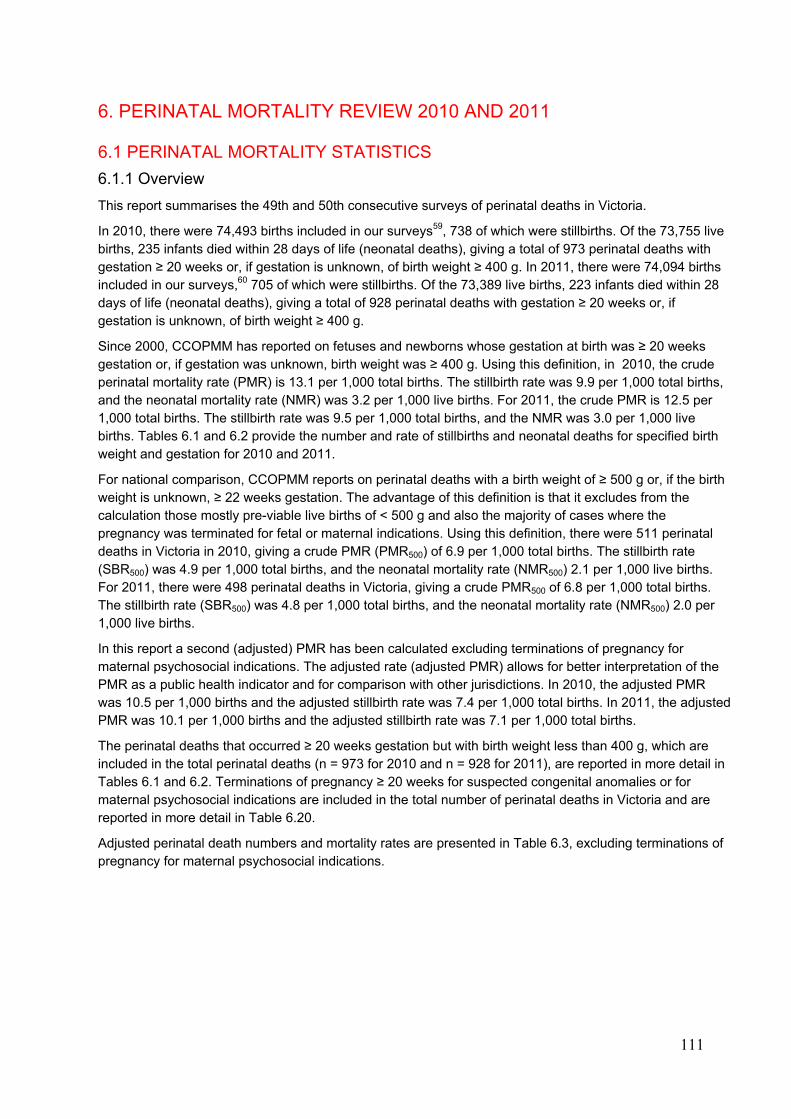
111
6. PERINATAL MORTALITY REVIEW 2010 AND 2011
6.1 PERINATAL MORTALITY STATISTICS
6.1.1 Overview
This report summarises the 49th and 50th consecutive surveys of perinatal deaths in Victoria.
In 2010, there were 74,493 births included in our surveys59, 738 of which were stillbirths. Of the 73,755 live births, 235 infants died within 28 days of life (neonatal deaths), giving a total of 973 perinatal deaths with gestation ≥ 20 weeks or, if gestation is unknown, of birth weight ≥ 400 g. In 2011, there were 74,094 births included in our surveys,60 705 of which were stillbirths. Of the 73,389 live births, 223 infants died within 28 days of life (neonatal deaths), giving a total of 928 perinatal deaths with gestation ≥ 20 weeks or, if gestation is unknown, of birth weight ≥ 400 g.
Since 2000, CCOPMM has reported on fetuses and newborns whose gestation at birth was ≥ 20 weeks gestation or, if gestation was unknown, birth weight was ≥ 400 g. Using this definition, in 2010, the crude perinatal mortality rate (PMR) is 13.1 per 1,000 total births. The stillbirth rate was 9.9 per 1,000 total births, and the neonatal mortality rate (NMR) was 3.2 per 1,000 live births. For 2011, the crude PMR is 12.5 per 1,000 total births. The stillbirth rate was 9.5 per 1,000 total births, and the NMR was 3.0 per 1,000 live births. Tables 6.1 and 6.2 provide the number and rate of stillbirths and neonatal deaths for specified birth weight and gestation for 2010 and 2011.
For national comparison, CCOPMM reports on perinatal deaths with a birth weight of ≥ 500 g or, if the birth weight is unknown, ≥ 22 weeks gestation. The advantage of this definition is that it excludes from the calculation those mostly pre-viable live births of < 500 g and also the majority of cases where the pregnancy was terminated for fetal or maternal indications. Using this definition, there were 511 perinatal deaths in Victoria in 2010, giving a crude PMR (PMR500) of 6.9 per 1,000 total births. The stillbirth rate (SBR500) was 4.9 per 1,000 total births, and the neonatal mortality rate (NMR500) 2.1 per 1,000 live births. For 2011, there were 498 perinatal deaths in Victoria, giving a crude PMR500 of 6.8 per 1,000 total births. The stillbirth rate (SBR500) was 4.8 per 1,000 total births, and the neonatal mortality rate (NMR500) 2.0 per 1,000 live births.
In this report a second (adjusted) PMR has been calculated excluding terminations of pregnancy for maternal psychosocial indications. The adjusted rate (adjusted PMR) allows for better interpretation of the PMR as a public health indicator and for comparison with other jurisdictions. In 2010, the adjusted PMR was 10.5 per 1,000 births and the adjusted stillbirth rate was 7.4 per 1,000 total births. In 2011, the adjusted PMR was 10.1 per 1,000 births and the adjusted stillbirth rate was 7.1 per 1,000 total births.
The perinatal deaths that occurred ≥ 20 weeks gestation but with birth weight less than 400 g, which are included in the total perinatal deaths (n = 973 for 2010 and n = 928 for 2011), are reported in more detail in Tables 6.1 and 6.2. Terminations of pregnancy ≥ 20 weeks for suspected congenital anomalies or for maternal psychosocial indications are included in the total number of perinatal deaths in Victoria and are reported in more detail in Table 6.20.
Adjusted perinatal death numbers and mortality rates are presented in Table 6.3, excluding terminations of pregnancy for maternal psychosocial indications.
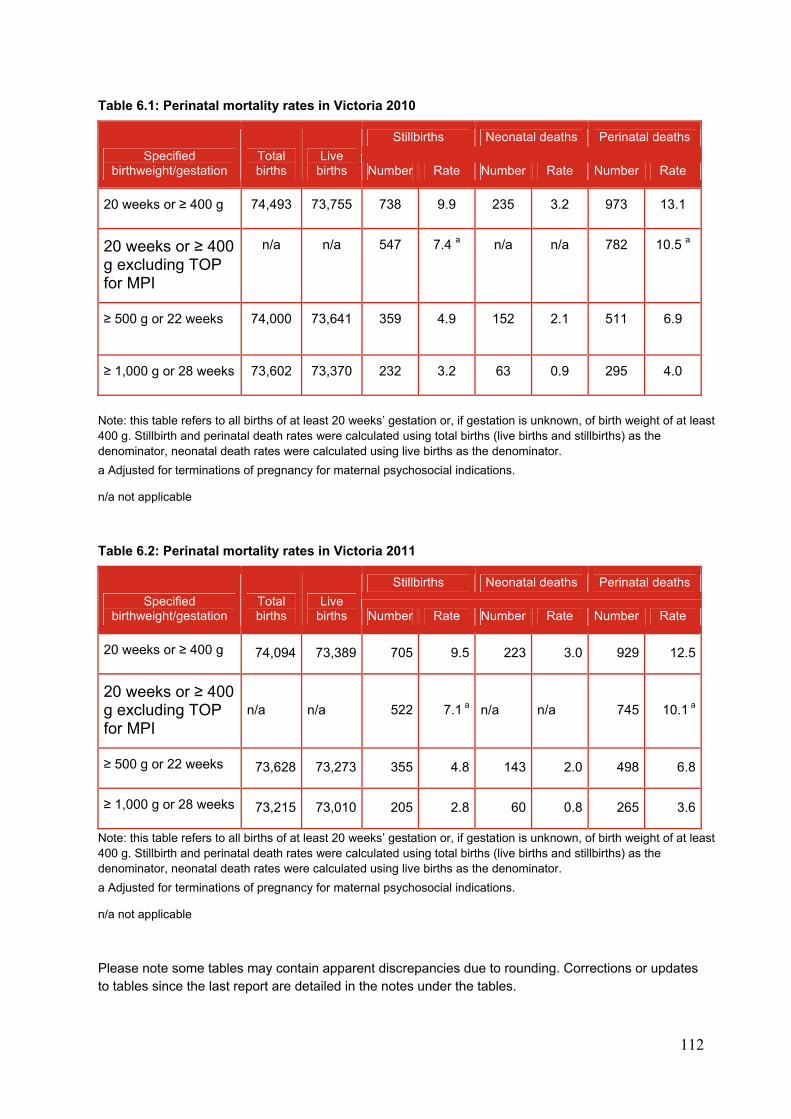
112
Table 6.1: Perinatal mortality rates in Victoria 2010
Specified birthweight/gestation
Total births
Live births
Stillbirths Neonatal deaths Perinatal deaths
Number Rate Number Rate Number Rate
20 weeks or ≥ 400 g 74,493 73,755 738 9.9 235 3.2 973 13.1
20 weeks or ≥ 400 g excluding TOP for MPI
n/a n/a 547 7.4 a n/a n/a 782 10.5 a
≥ 500 g or 22 weeks 74,000 73,641
359 4.9 152 2.1 511 6.9
≥ 1,000 g or 28 weeks 73,602 73,370 232 3.2 63 0.9 295 4.0
Note: this table refers to all births of at least 20 weeks’ gestation or, if gestation is unknown, of birth weight of at least 400 g. Stillbirth and perinatal death rates were calculated using total births (live births and stillbirths) as the denominator, neonatal death rates were calculated using live births as the denominator.
a Adjusted for terminations of pregnancy for maternal psychosocial indications.
n/a not applicable
Table 6.2: Perinatal mortality rates in Victoria 2011
Specified birthweight/gestation
Total births
Live births
Stillbirths Neonatal deaths Perinatal deaths
Number Rate Number Rate Number Rate
20 weeks or ≥ 400 g 74,094 73,389 705 9.5 223 3.0 929 12.5
20 weeks or ≥ 400 g excluding TOP for MPI
n/a n/a 522 7.1 a n/a n/a 745 10.1 a
≥ 500 g or 22 weeks 73,628 73,273 355 4.8 143 2.0 498 6.8
≥ 1,000 g or 28 weeks 73,215 73,010 205 2.8 60 0.8 265 3.6
Note: this table refers to all births of at least 20 weeks’ gestation or, if gestation is unknown, of birth weight of at least 400 g. Stillbirth and perinatal death rates were calculated using total births (live births and stillbirths) as the denominator, neonatal death rates were calculated using live births as the denominator.
a Adjusted for terminations of pregnancy for maternal psychosocial indications.
n/a not applicable
Please note some tables may contain apparent discrepancies due to rounding. Corrections or updates to tables since the last report are detailed in the notes under the tables.
113
6.1.2 Perinatal deaths excluded from survey
For 2010, the following 31 infants were excluded from the statistical calculations presented in this report:
In 16 cases, the infants were stillborn ≥ 20 weeks gestation; however, fetal demise was known to have occurred prior to 20 weeks gestation.
Fifteen were deaths of pre-viable infants of less than 20 weeks gestation, but who showed signs of life after birth and who were therefore registered as live births and neonatal deaths. Eight infants had been spontaneous preterm births, and one infant died as a result of twin-to-twin transfusion. Six infants had congenital anomalies and the pregnancy was terminated in four of these cases.
Out-of-state usual residents:
One neonatal death to a mother usually resident in Victoria that occurred in Western Australia was noted but not included in the analyses for this report.61
For 2011, the following 41 infants were excluded from the statistical calculations presented in this report:
In 28 cases, the infants were stillborn ≥ 20 weeks gestation; however, fetal demise was known to have occurred prior to 20 weeks gestation.
Thirteen were deaths of pre-viable infants of less than 20 weeks gestation, but who showed signs of life after birth and who were therefore registered as live births and neonatal deaths. Eight infants had been spontaneous preterm births and one infant died as a result of placental abruption. Four infants had congenital anomalies and the pregnancy was terminated in all of these cases.
Out-of-state usual residents:
Three neonatal deaths to mothers usually resident in Victoria that occurred in South Australia62 (2) and overseas (1) were noted but not included in the analyses for this report.
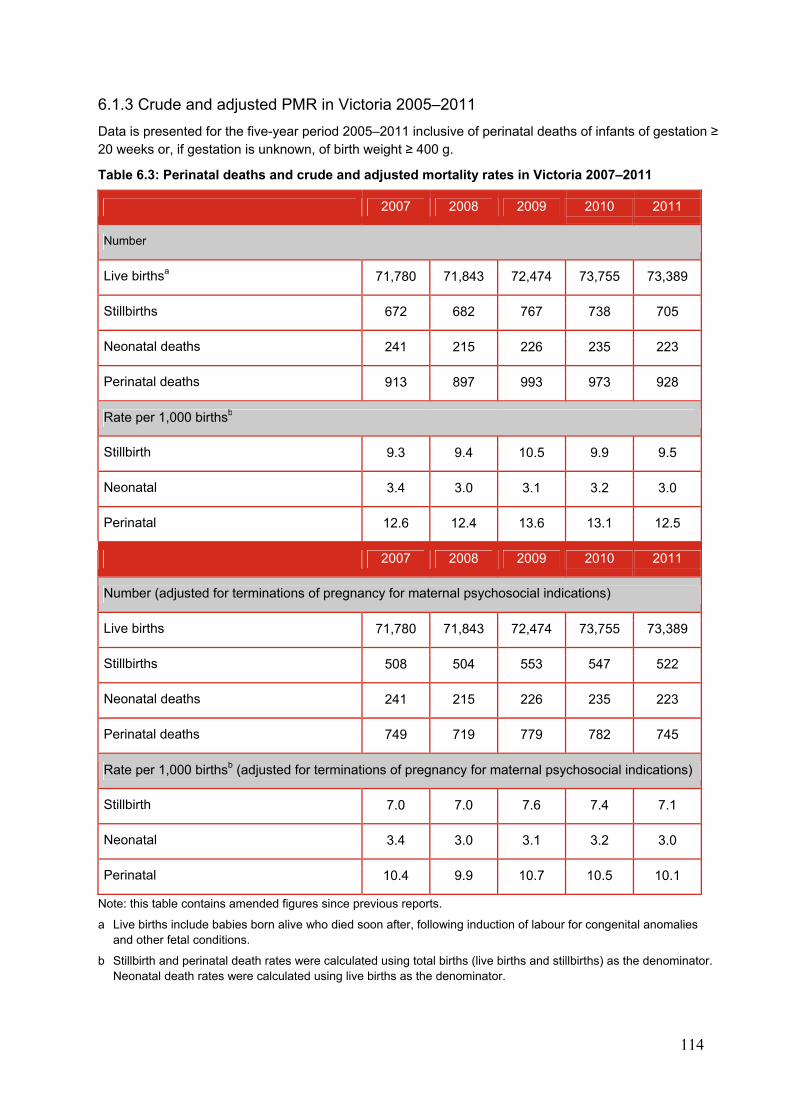
114
6.1.3 Crude and adjusted PMR in Victoria 2005–2011
Data is presented for the five-year period 2005–2011 inclusive of perinatal deaths of infants of gestation ≥ 20 weeks or, if gestation is unknown, of birth weight ≥ 400 g.
Table 6.3: Perinatal deaths and crude and adjusted mortality rates in Victoria 2007–2011
2007 2008 2009 2010 2011
Number
Live birthsa 71,780 71,843 72,474 73,755 73,389
Stillbirths 672 682 767 738 705
Neonatal deaths 241 215 226 235 223
Perinatal deaths 913 897 993 973 928
Rate per 1,000 birthsb
Stillbirth 9.3 9.4 10.5 9.9 9.5
Neonatal 3.4 3.0 3.1 3.2 3.0
Perinatal 12.6 12.4 13.6 13.1 12.5
2007 2008 2009 2010 2011
Number (adjusted for terminations of pregnancy for maternal psychosocial indications)
Live births 71,780 71,843 72,474 73,755 73,389
Stillbirths 508 504 553 547 522
Neonatal deaths 241 215 226 235 223
Perinatal deaths 749 719 779 782 745
Rate per 1,000 birthsb (adjusted for terminations of pregnancy for maternal psychosocial indications)
Stillbirth 7.0 7.0 7.6 7.4 7.1
Neonatal 3.4 3.0 3.1 3.2 3.0
Perinatal 10.4 9.9 10.7 10.5 10.1
Note: this table contains amended figures since previous reports.
a Live births include babies born alive who died soon after, following induction of labour for congenital anomalies and other fetal conditions.
b Stillbirth and perinatal death rates were calculated using total births (live births and stillbirths) as the denominator. Neonatal death rates were calculated using live births as the denominator.
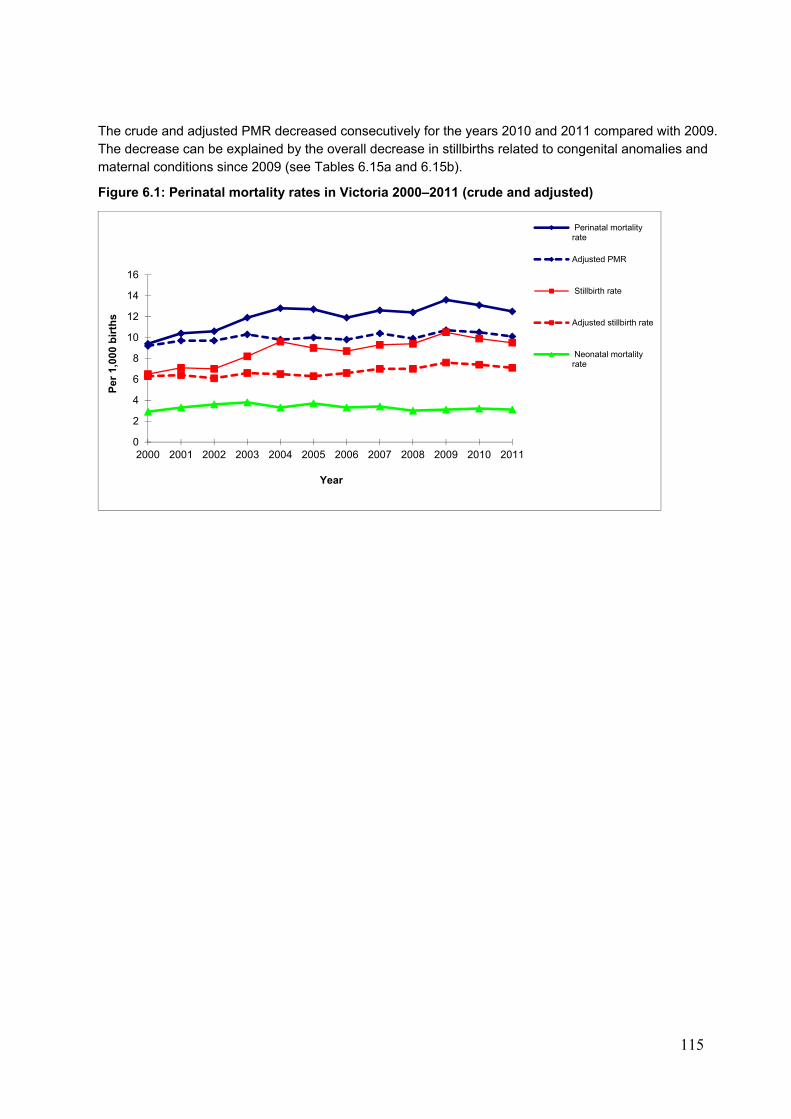
115
The crude and adjusted PMR decreased consecutively for the years 2010 and 2011 compared with 2009. The decrease can be explained by the overall decrease in stillbirths related to congenital anomalies and maternal conditions since 2009 (see Tables 6.15a and 6.15b).
Figure 6.1: Perinatal mortality rates in Victoria 2000–2011 (crude and adjusted)
0
2
4
6
8
10
12
14
16
2000 2001 2002 2003 2004 2005 2006 2007 2008 2009 2010 2011
Per
1,0
00 b
irth
s
Year
Perinatal mortalityrate
Adjusted PMR
Stillbirth rate
Adjusted stillbirth rate
Neonatal mortalityrate
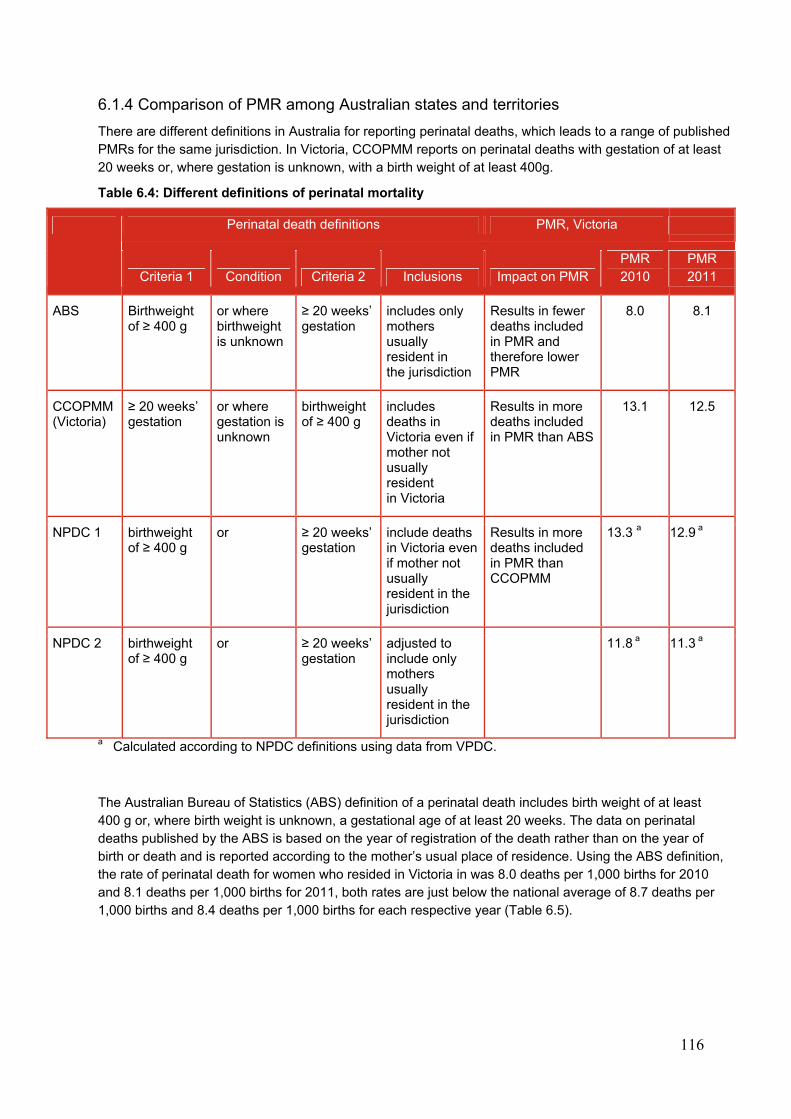
116
6.1.4 Comparison of PMR among Australian states and territories
There are different definitions in Australia for reporting perinatal deaths, which leads to a range of published PMRs for the same jurisdiction. In Victoria, CCOPMM reports on perinatal deaths with gestation of at least 20 weeks or, where gestation is unknown, with a birth weight of at least 400g.
Table 6.4: Different definitions of perinatal mortality
Perinatal death definitions PMR, Victoria
Criteria 1 Condition Criteria 2 Inclusions Impact on PMR PMR 2010
PMR 2011
ABS Birthweight of ≥ 400 g
or where birthweight is unknown
≥ 20 weeks’ gestation
includes only mothers usually resident in the jurisdiction
Results in fewer deaths included in PMR and therefore lower PMR
8.0 8.1
CCOPMM (Victoria)
≥ 20 weeks’ gestation
or where gestation is unknown
birthweight of ≥ 400 g
includes deaths in Victoria even if mother not usually resident in Victoria
Results in more deaths included in PMR than ABS
13.1 12.5
NPDC 1 birthweight of ≥ 400 g
or ≥ 20 weeks’ gestation
include deaths in Victoria even if mother not usually resident in the jurisdiction
Results in more deaths included in PMR than CCOPMM
13.3 a 12.9 a
NPDC 2 birthweight of ≥ 400 g
or ≥ 20 weeks’ gestation
adjusted to include only mothers usually resident in the jurisdiction
11.8 a 11.3 a
a Calculated according to NPDC definitions using data from VPDC.
The Australian Bureau of Statistics (ABS) definition of a perinatal death includes birth weight of at least 400 g or, where birth weight is unknown, a gestational age of at least 20 weeks. The data on perinatal deaths published by the ABS is based on the year of registration of the death rather than on the year of birth or death and is reported according to the mother’s usual place of residence. Using the ABS definition, the rate of perinatal death for women who resided in Victoria in was 8.0 deaths per 1,000 births for 2010 and 8.1 deaths per 1,000 births for 2011, both rates are just below the national average of 8.7 deaths per 1,000 births and 8.4 deaths per 1,000 births for each respective year (Table 6.5).
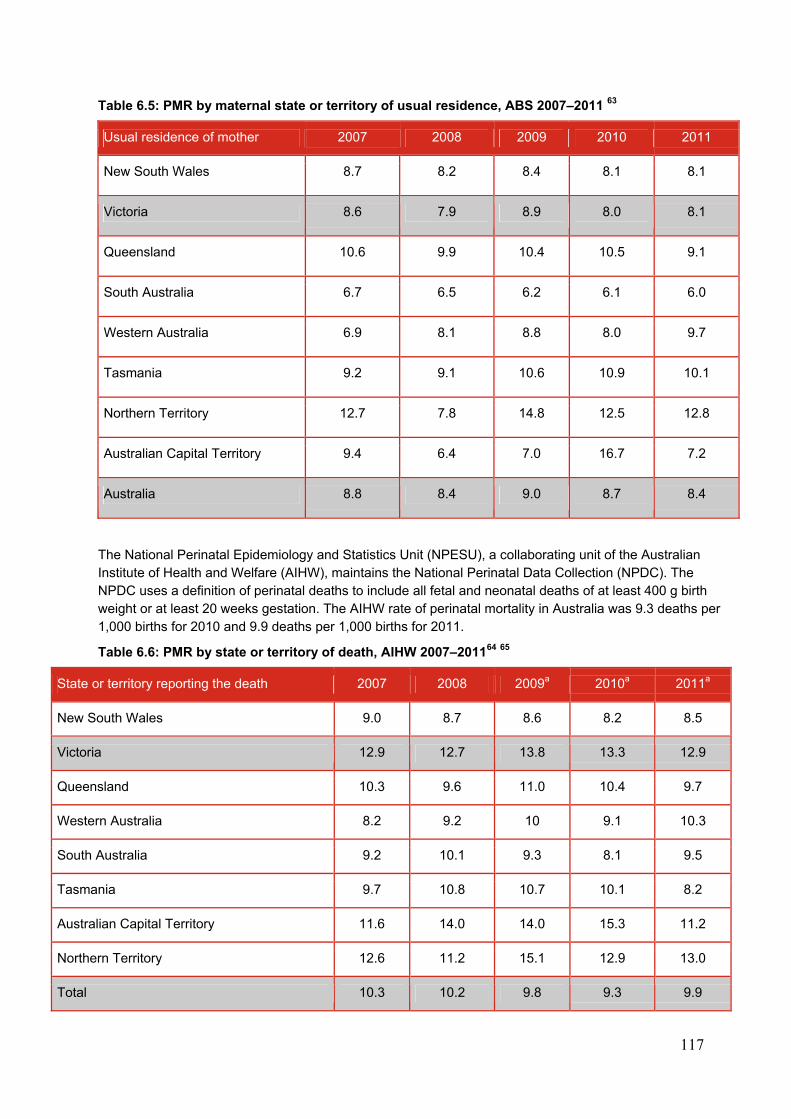
117
Table 6.5: PMR by maternal state or territory of usual residence, ABS 2007–2011 63
Usual residence of mother 2007 2008 2009 2010 2011
New South Wales 8.7 8.2 8.4 8.1 8.1
Victoria 8.6 7.9 8.9 8.0 8.1
Queensland 10.6 9.9 10.4 10.5 9.1
South Australia 6.7 6.5 6.2 6.1 6.0
Western Australia 6.9 8.1 8.8 8.0 9.7
Tasmania 9.2 9.1 10.6 10.9 10.1
Northern Territory 12.7 7.8 14.8 12.5 12.8
Australian Capital Territory 9.4 6.4 7.0 16.7 7.2
Australia 8.8 8.4 9.0 8.7 8.4
The National Perinatal Epidemiology and Statistics Unit (NPESU), a collaborating unit of the Australian Institute of Health and Welfare (AIHW), maintains the National Perinatal Data Collection (NPDC). The NPDC uses a definition of perinatal deaths to include all fetal and neonatal deaths of at least 400 g birth weight or at least 20 weeks gestation. The AIHW rate of perinatal mortality in Australia was 9.3 deaths per 1,000 births for 2010 and 9.9 deaths per 1,000 births for 2011.
Table 6.6: PMR by state or territory of death, AIHW 2007–201164 65
State or territory reporting the death 2007 2008 2009a 2010a 2011a
New South Wales 9.0 8.7 8.6 8.2 8.5
Victoria 12.9 12.7 13.8 13.3 12.9
Queensland 10.3 9.6 11.0 10.4 9.7
Western Australia 8.2 9.2 10 9.1 10.3
South Australia 9.2 10.1 9.3 8.1 9.5
Tasmania 9.7 10.8 10.7 10.1 8.2
Australian Capital Territory 11.6 14.0 14.0 15.3 11.2
Northern Territory 12.6 11.2 15.1 12.9 13.0
Total 10.3 10.2 9.8 9.3 9.9
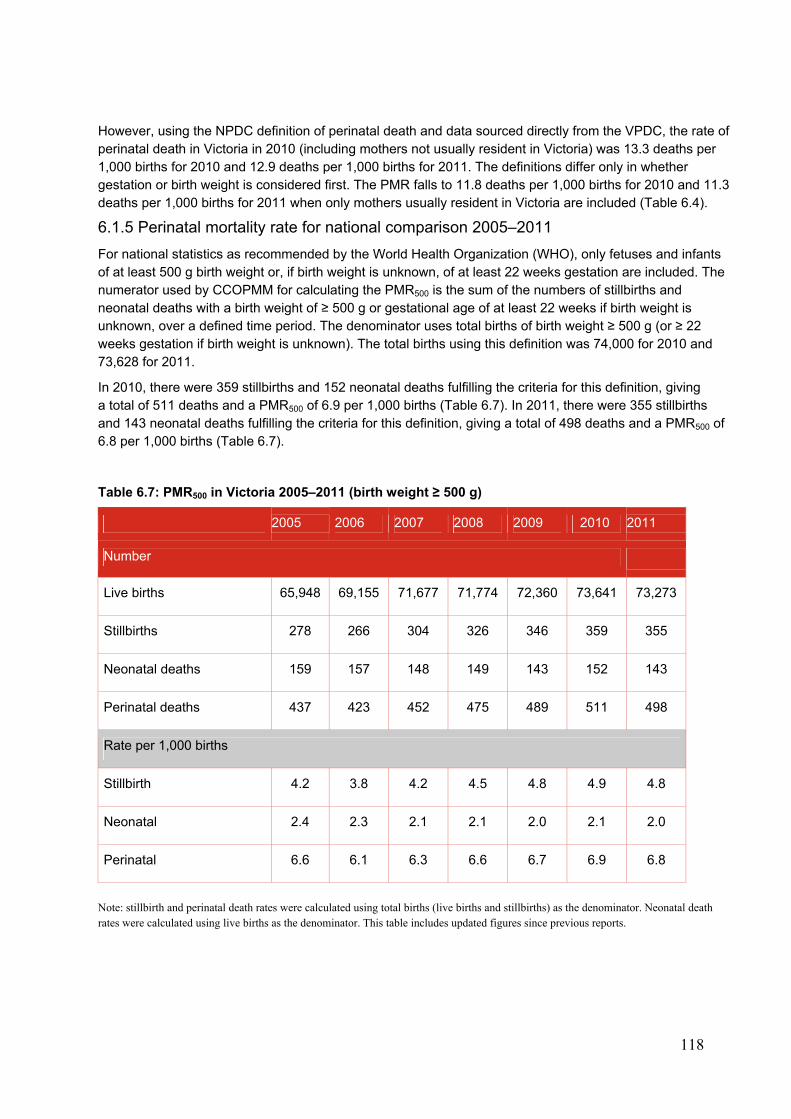
118
However, using the NPDC definition of perinatal death and data sourced directly from the VPDC, the rate of perinatal death in Victoria in 2010 (including mothers not usually resident in Victoria) was 13.3 deaths per 1,000 births for 2010 and 12.9 deaths per 1,000 births for 2011. The definitions differ only in whether gestation or birth weight is considered first. The PMR falls to 11.8 deaths per 1,000 births for 2010 and 11.3 deaths per 1,000 births for 2011 when only mothers usually resident in Victoria are included (Table 6.4).
6.1.5 Perinatal mortality rate for national comparison 2005–2011
For national statistics as recommended by the World Health Organization (WHO), only fetuses and infants of at least 500 g birth weight or, if birth weight is unknown, of at least 22 weeks gestation are included. The numerator used by CCOPMM for calculating the PMR500 is the sum of the numbers of stillbirths and neonatal deaths with a birth weight of ≥ 500 g or gestational age of at least 22 weeks if birth weight is unknown, over a defined time period. The denominator uses total births of birth weight ≥ 500 g (or ≥ 22 weeks gestation if birth weight is unknown). The total births using this definition was 74,000 for 2010 and 73,628 for 2011.
In 2010, there were 359 stillbirths and 152 neonatal deaths fulfilling the criteria for this definition, giving a total of 511 deaths and a PMR500 of 6.9 per 1,000 births (Table 6.7). In 2011, there were 355 stillbirths and 143 neonatal deaths fulfilling the criteria for this definition, giving a total of 498 deaths and a PMR500 of 6.8 per 1,000 births (Table 6.7).
Table 6.7: PMR500 in Victoria 2005–2011 (birth weight ≥ 500 g)
2005 2006 2007 2008 2009 2010 2011
Number
Live births 65,948 69,155 71,677 71,774 72,360 73,641 73,273
Stillbirths 278 266 304 326 346 359 355
Neonatal deaths 159 157 148 149 143 152 143
Perinatal deaths 437 423 452 475 489 511 498
Rate per 1,000 births
Stillbirth 4.2 3.8 4.2 4.5 4.8 4.9 4.8
Neonatal 2.4 2.3 2.1 2.1 2.0 2.1 2.0
Perinatal 6.6 6.1 6.3 6.6 6.7 6.9 6.8
Note: stillbirth and perinatal death rates were calculated using total births (live births and stillbirths) as the denominator. Neonatal death rates were calculated using live births as the denominator. This table includes updated figures since previous reports.

119
Figure 6.2: PMR500 in Victoria 1999–2011
6.1.6 Perinatal mortality for International comparisons (PMR1,000)
For the purposes of international comparison, the WHO recommends publication of mortality rates in which the numerator and denominator are restricted to fetuses and infants of birth weight 1,000 g or over or, if birth weight is unavailable, 28 weeks gestation and over.
Table 6.8: Perinatal mortality rates for international comparison, Victoria 2005–2011
2005 2006 2007 2008 2009 2010 2011
Stillbirth rate 2.8 2.5 2.6 3.0 2.8 3.2 2.8
Early neonatal mortality rate 0.8 0.8 0.8 0.7 1.1 0.9 0.8
Perinatal mortality rate 3.6 3.3 3.4 4.0 3.9 4.0 3.6
Note: stillbirth and perinatal death rates were calculated using all births (live births and stillbirths). Neonatal death rates were calculated using all live births. Rate per 1,000 births (birthweight ≥ 1,000 g or gestation ≥ 28 weeks. Neonatal deaths occurred during the first seven days of life (0–6 days).
Figure 6.3 shows the trends in PMR1,000 for international comparison from 1975 to 2011. In 1975, the PMR1,000 (birth weight 1,000 g or, if birth weight unknown, gestation at least 28 weeks) was 12.3 per 1,000 births compared with 4.0 per 1,000 births in 2010 and 3.6 per 1,000 births in 2011.
0.0
1.0
2.0
3.0
4.0
5.0
6.0
7.0
8.0
1999 2001 2003 2005 2007 2009 2011
Per 1,000 birth
Stillbirth rate
Neonatal mortality rate
Perinatal mortality rate
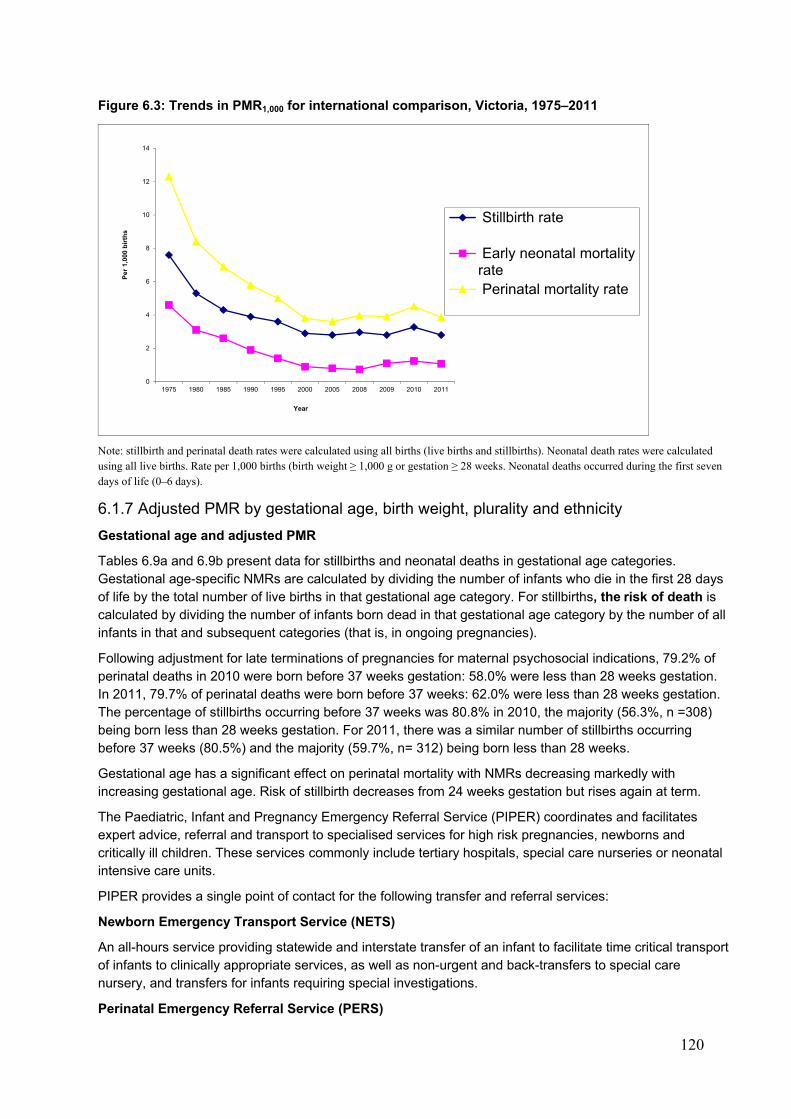
120
Figure 6.3: Trends in PMR1,000 for international comparison, Victoria, 1975–2011
Note: stillbirth and perinatal death rates were calculated using all births (live births and stillbirths). Neonatal death rates were calculated using all live births. Rate per 1,000 births (birth weight ≥ 1,000 g or gestation ≥ 28 weeks. Neonatal deaths occurred during the first seven days of life (0–6 days).
6.1.7 Adjusted PMR by gestational age, birth weight, plurality and ethnicity
Gestational age and adjusted PMR
Tables 6.9a and 6.9b present data for stillbirths and neonatal deaths in gestational age categories. Gestational age-specific NMRs are calculated by dividing the number of infants who die in the first 28 days of life by the total number of live births in that gestational age category. For stillbirths, the risk of death is calculated by dividing the number of infants born dead in that gestational age category by the number of all infants in that and subsequent categories (that is, in ongoing pregnancies).
Following adjustment for late terminations of pregnancies for maternal psychosocial indications, 79.2% of perinatal deaths in 2010 were born before 37 weeks gestation: 58.0% were less than 28 weeks gestation. In 2011, 79.7% of perinatal deaths were born before 37 weeks: 62.0% were less than 28 weeks gestation. The percentage of stillbirths occurring before 37 weeks was 80.8% in 2010, the majority (56.3%, n =308) being born less than 28 weeks gestation. For 2011, there was a similar number of stillbirths occurring before 37 weeks (80.5%) and the majority (59.7%, n= 312) being born less than 28 weeks.
Gestational age has a significant effect on perinatal mortality with NMRs decreasing markedly with increasing gestational age. Risk of stillbirth decreases from 24 weeks gestation but rises again at term.
The Paediatric, Infant and Pregnancy Emergency Referral Service (PIPER) coordinates and facilitates expert advice, referral and transport to specialised services for high risk pregnancies, newborns and critically ill children. These services commonly include tertiary hospitals, special care nurseries or neonatal intensive care units.
PIPER provides a single point of contact for the following transfer and referral services:
Newborn Emergency Transport Service (NETS)
An all-hours service providing statewide and interstate transfer of an infant to facilitate time critical transport of infants to clinically appropriate services, as well as non-urgent and back-transfers to special care nursery, and transfers for infants requiring special investigations.
Perinatal Emergency Referral Service (PERS)
0
2
4
6
8
10
12
14
1975 1980 1985 1990 1995 2000 2005 2008 2009 2010 2011
Per
1,0
00 b
irth
s
Year
Stillbirth rate
Early neonatal mortalityrate Perinatal mortality rate
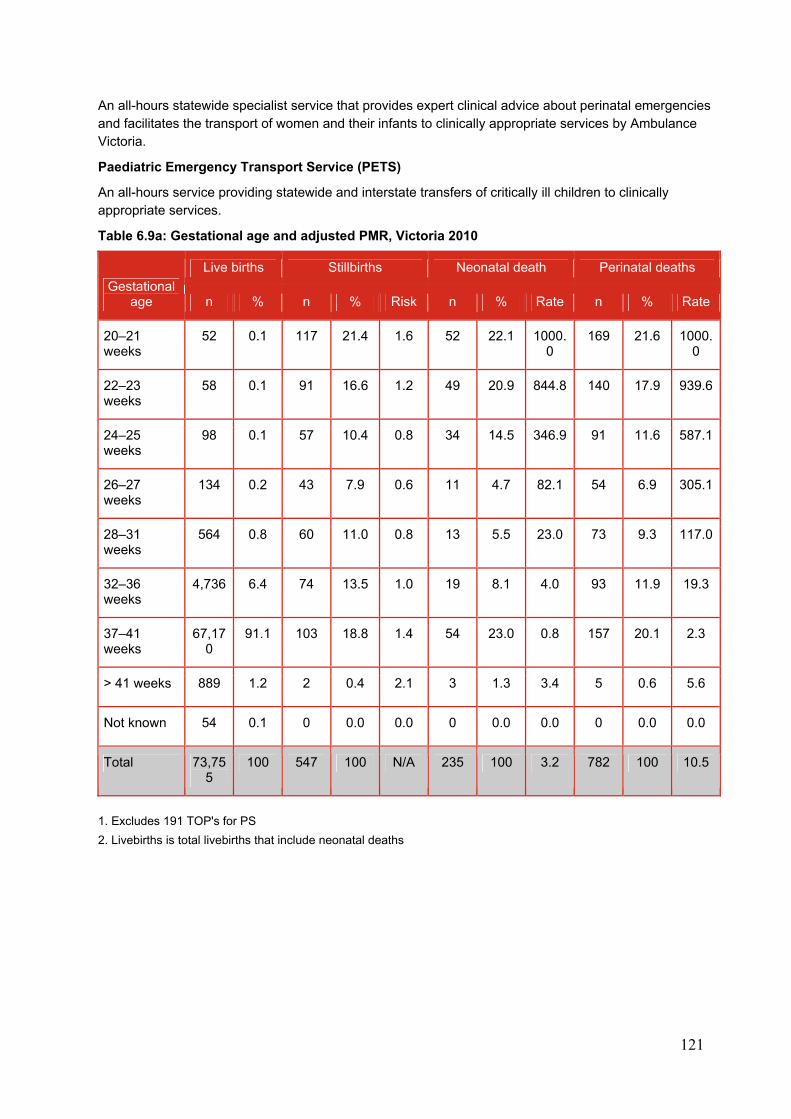
121
An all-hours statewide specialist service that provides expert clinical advice about perinatal emergencies and facilitates the transport of women and their infants to clinically appropriate services by Ambulance Victoria.
Paediatric Emergency Transport Service (PETS)
An all-hours service providing statewide and interstate transfers of critically ill children to clinically appropriate services.
Table 6.9a: Gestational age and adjusted PMR, Victoria 2010
Gestational age
Live births Stillbirths Neonatal death Perinatal deaths
n % n % Risk n % Rate n % Rate
20–21 weeks
52 0.1 117 21.4 1.6 52 22.1 1000.0
169 21.6 1000.0
22–23 weeks
58 0.1 91 16.6 1.2 49 20.9 844.8 140 17.9 939.6
24–25 weeks
98 0.1 57 10.4 0.8 34 14.5 346.9 91 11.6 587.1
26–27 weeks
134 0.2 43 7.9 0.6 11 4.7 82.1 54 6.9 305.1
28–31 weeks
564 0.8 60 11.0 0.8 13 5.5 23.0 73 9.3 117.0
32–36 weeks
4,736 6.4 74 13.5 1.0 19 8.1 4.0 93 11.9 19.3
37–41 weeks
67,170
91.1 103 18.8 1.4 54 23.0 0.8 157 20.1 2.3
> 41 weeks 889 1.2 2 0.4 2.1 3 1.3 3.4 5 0.6 5.6
Not known 54 0.1 0 0.0 0.0 0 0.0 0.0 0 0.0 0.0
Total 73,755
100 547 100 N/A 235 100 3.2 782 100 10.5
1. Excludes 191 TOP's for PS
2. Livebirths is total livebirths that include neonatal deaths
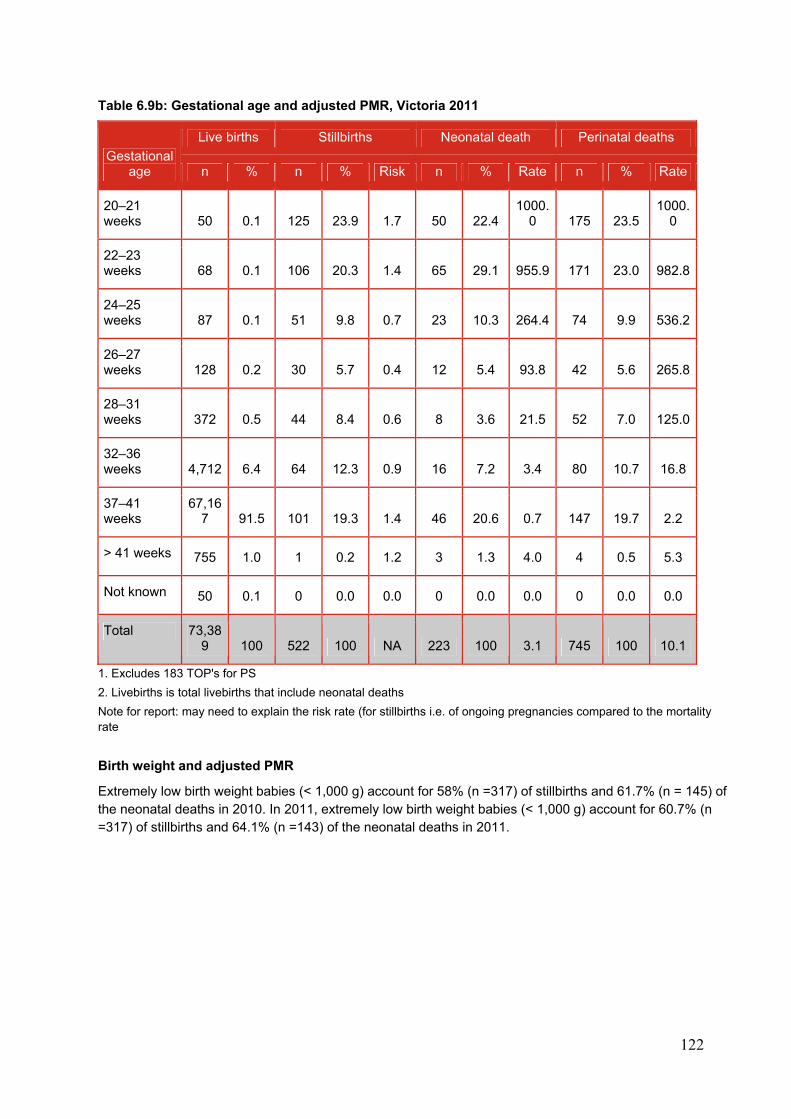
122
Table 6.9b: Gestational age and adjusted PMR, Victoria 2011
Gestational age
Live births Stillbirths Neonatal death Perinatal deaths
n % n % Risk n % Rate n % Rate
20–21 weeks 50 0.1 125 23.9 1.7 50 22.4
1000.0 175 23.5
1000.0
22–23 weeks 68 0.1 106 20.3 1.4 65 29.1 955.9 171 23.0 982.8
24–25 weeks 87 0.1 51 9.8 0.7 23 10.3 264.4 74 9.9 536.2
26–27 weeks 128 0.2 30 5.7 0.4 12 5.4 93.8 42 5.6 265.8
28–31 weeks 372 0.5 44 8.4 0.6 8 3.6 21.5 52 7.0 125.0
32–36 weeks 4,712 6.4 64 12.3 0.9 16 7.2 3.4 80 10.7 16.8
37–41 weeks
67,167 91.5 101 19.3 1.4 46 20.6 0.7 147 19.7 2.2
> 41 weeks 755 1.0 1 0.2 1.2 3 1.3 4.0 4 0.5 5.3
Not known 50 0.1 0 0.0 0.0 0 0.0 0.0 0 0.0 0.0
Total 73,389 100 522 100 NA 223 100 3.1 745 100 10.1
1. Excludes 183 TOP's for PS
2. Livebirths is total livebirths that include neonatal deaths
Note for report: may need to explain the risk rate (for stillbirths i.e. of ongoing pregnancies compared to the mortality rate
Birth weight and adjusted PMR
Extremely low birth weight babies (< 1,000 g) account for 58% (n =317) of stillbirths and 61.7% (n = 145) of the neonatal deaths in 2010. In 2011, extremely low birth weight babies (< 1,000 g) account for 60.7% (n =317) of stillbirths and 64.1% (n =143) of the neonatal deaths in 2011.
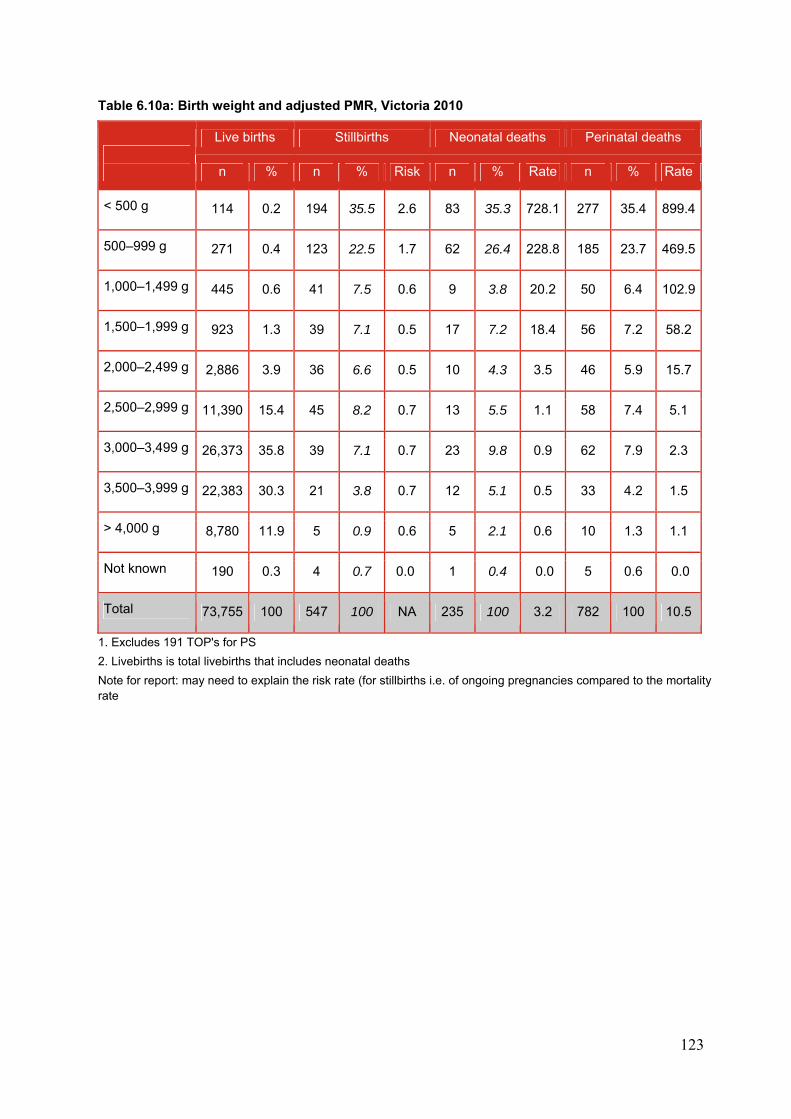
123
Table 6.10a: Birth weight and adjusted PMR, Victoria 2010
Live births Stillbirths Neonatal deaths Perinatal deaths
n % n % Risk n % Rate n % Rate
< 500 g 114 0.2 194 35.5 2.6 83 35.3 728.1 277 35.4 899.4
500–999 g 271 0.4 123 22.5 1.7 62 26.4 228.8 185 23.7 469.5
1,000–1,499 g 445 0.6 41 7.5 0.6 9 3.8 20.2 50 6.4 102.9
1,500–1,999 g 923 1.3 39 7.1 0.5 17 7.2 18.4 56 7.2 58.2
2,000–2,499 g 2,886 3.9 36 6.6 0.5 10 4.3 3.5 46 5.9 15.7
2,500–2,999 g 11,390 15.4 45 8.2 0.7 13 5.5 1.1 58 7.4 5.1
3,000–3,499 g 26,373 35.8 39 7.1 0.7 23 9.8 0.9 62 7.9 2.3
3,500–3,999 g 22,383 30.3 21 3.8 0.7 12 5.1 0.5 33 4.2 1.5
> 4,000 g 8,780 11.9 5 0.9 0.6 5 2.1 0.6 10 1.3 1.1
Not known 190 0.3 4 0.7 0.0 1 0.4 0.0 5 0.6 0.0
Total 73,755 100 547 100 NA 235 100 3.2 782 100 10.5
1. Excludes 191 TOP's for PS
2. Livebirths is total livebirths that includes neonatal deaths
Note for report: may need to explain the risk rate (for stillbirths i.e. of ongoing pregnancies compared to the mortality rate
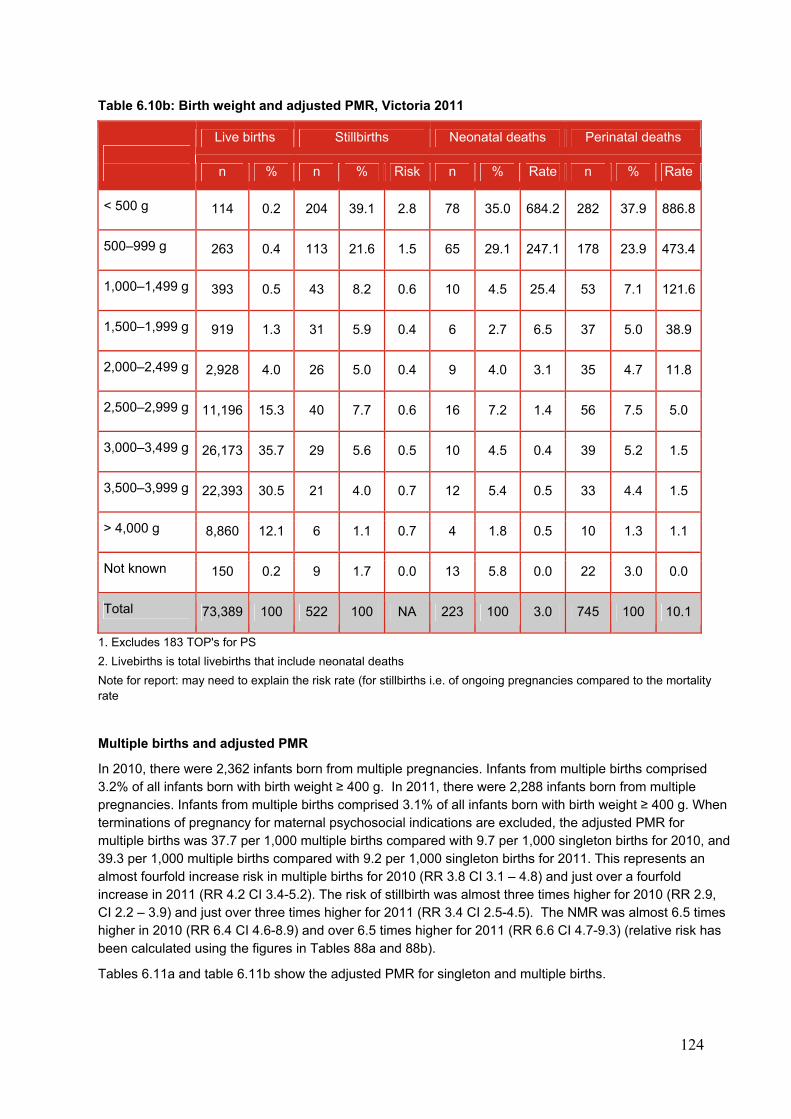
124
Table 6.10b: Birth weight and adjusted PMR, Victoria 2011
Live births Stillbirths Neonatal deaths Perinatal deaths
n % n % Risk n % Rate n % Rate
< 500 g 114 0.2 204 39.1 2.8 78 35.0 684.2 282 37.9 886.8
500–999 g 263 0.4 113 21.6 1.5 65 29.1 247.1 178 23.9 473.4
1,000–1,499 g 393 0.5 43 8.2 0.6 10 4.5 25.4 53 7.1 121.6
1,500–1,999 g 919 1.3 31 5.9 0.4 6 2.7 6.5 37 5.0 38.9
2,000–2,499 g 2,928 4.0 26 5.0 0.4 9 4.0 3.1 35 4.7 11.8
2,500–2,999 g 11,196 15.3 40 7.7 0.6 16 7.2 1.4 56 7.5 5.0
3,000–3,499 g 26,173 35.7 29 5.6 0.5 10 4.5 0.4 39 5.2 1.5
3,500–3,999 g 22,393 30.5 21 4.0 0.7 12 5.4 0.5 33 4.4 1.5
> 4,000 g 8,860 12.1 6 1.1 0.7 4 1.8 0.5 10 1.3 1.1
Not known 150 0.2 9 1.7 0.0 13 5.8 0.0 22 3.0 0.0
Total 73,389 100 522 100 NA 223 100 3.0 745 100 10.1
1. Excludes 183 TOP's for PS
2. Livebirths is total livebirths that include neonatal deaths
Note for report: may need to explain the risk rate (for stillbirths i.e. of ongoing pregnancies compared to the mortality rate
Multiple births and adjusted PMR
In 2010, there were 2,362 infants born from multiple pregnancies. Infants from multiple births comprised 3.2% of all infants born with birth weight ≥ 400 g. In 2011, there were 2,288 infants born from multiple pregnancies. Infants from multiple births comprised 3.1% of all infants born with birth weight ≥ 400 g. When terminations of pregnancy for maternal psychosocial indications are excluded, the adjusted PMR for multiple births was 37.7 per 1,000 multiple births compared with 9.7 per 1,000 singleton births for 2010, and 39.3 per 1,000 multiple births compared with 9.2 per 1,000 singleton births for 2011. This represents an almost fourfold increase risk in multiple births for 2010 (RR 3.8 CI 3.1 – 4.8) and just over a fourfold increase in 2011 (RR 4.2 CI 3.4-5.2). The risk of stillbirth was almost three times higher for 2010 (RR 2.9, CI 2.2 – 3.9) and just over three times higher for 2011 (RR 3.4 CI 2.5-4.5). The NMR was almost 6.5 times higher in 2010 (RR 6.4 CI 4.6-8.9) and over 6.5 times higher for 2011 (RR 6.6 CI 4.7-9.3) (relative risk has been calculated using the figures in Tables 88a and 88b).
Tables 6.11a and table 6.11b show the adjusted PMR for singleton and multiple births.
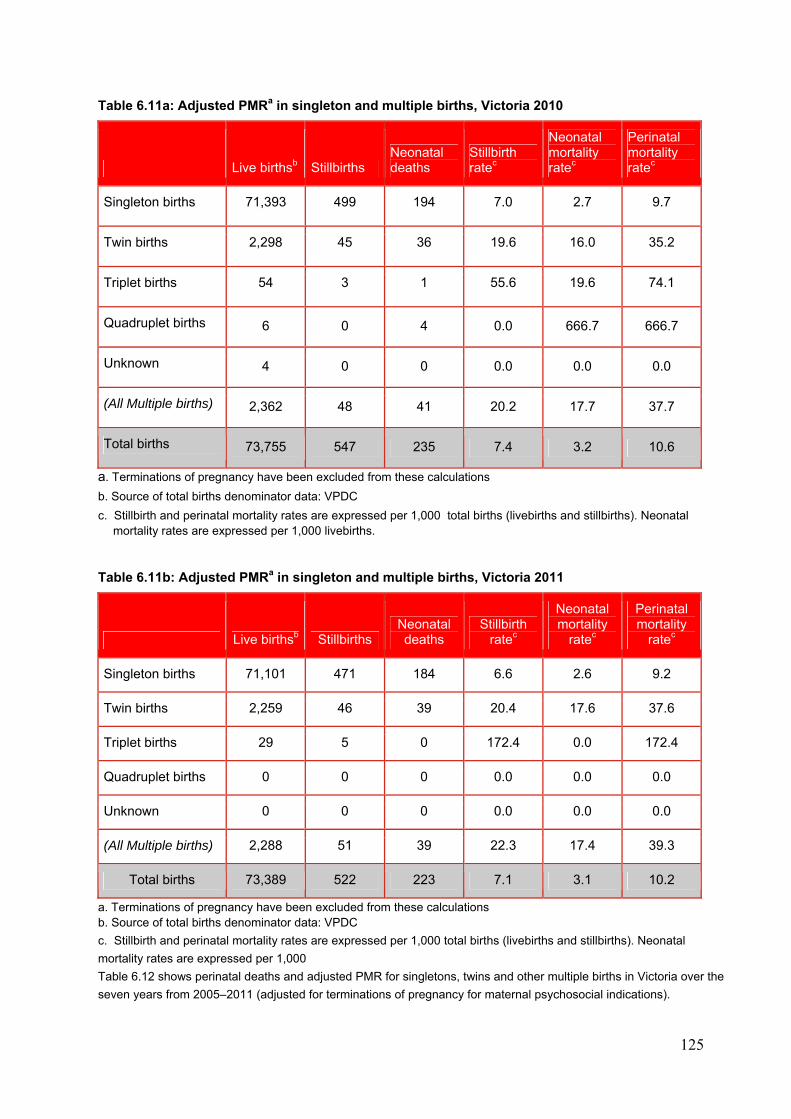
125
Table 6.11a: Adjusted PMRa in singleton and multiple births, Victoria 2010
Live birthsb Stillbirths Neonatal deaths
Stillbirth ratec
Neonatal mortality ratec
Perinatal mortality ratec
Singleton births 71,393 499 194 7.0 2.7 9.7
Twin births 2,298 45 36 19.6 16.0 35.2
Triplet births 54 3 1 55.6 19.6 74.1
Quadruplet births 6 0 4 0.0 666.7 666.7
Unknown 4 0 0 0.0 0.0 0.0
(All Multiple births) 2,362 48 41 20.2 17.7 37.7
Total births 73,755 547 235 7.4 3.2 10.6
a. Terminations of pregnancy have been excluded from these calculations
b. Source of total births denominator data: VPDC
c. Stillbirth and perinatal mortality rates are expressed per 1,000 total births (livebirths and stillbirths). Neonatal mortality rates are expressed per 1,000 livebirths.
Table 6.11b: Adjusted PMRa in singleton and multiple births, Victoria 2011
Live birthsb Stillbirths Neonatal deaths
Stillbirth ratec
Neonatal mortality
ratec
Perinatal mortality
ratec
Singleton births 71,101 471 184 6.6 2.6 9.2
Twin births 2,259 46 39 20.4 17.6 37.6
Triplet births 29 5 0 172.4 0.0 172.4
Quadruplet births 0 0 0 0.0 0.0 0.0
Unknown 0 0 0 0.0 0.0 0.0
(All Multiple births) 2,288 51 39 22.3 17.4 39.3
Total births 73,389 522 223 7.1 3.1 10.2
a. Terminations of pregnancy have been excluded from these calculations b. Source of total births denominator data: VPDC
c. Stillbirth and perinatal mortality rates are expressed per 1,000 total births (livebirths and stillbirths). Neonatal
mortality rates are expressed per 1,000
Table 6.12 shows perinatal deaths and adjusted PMR for singletons, twins and other multiple births in Victoria over the
seven years from 2005–2011 (adjusted for terminations of pregnancy for maternal psychosocial indications).
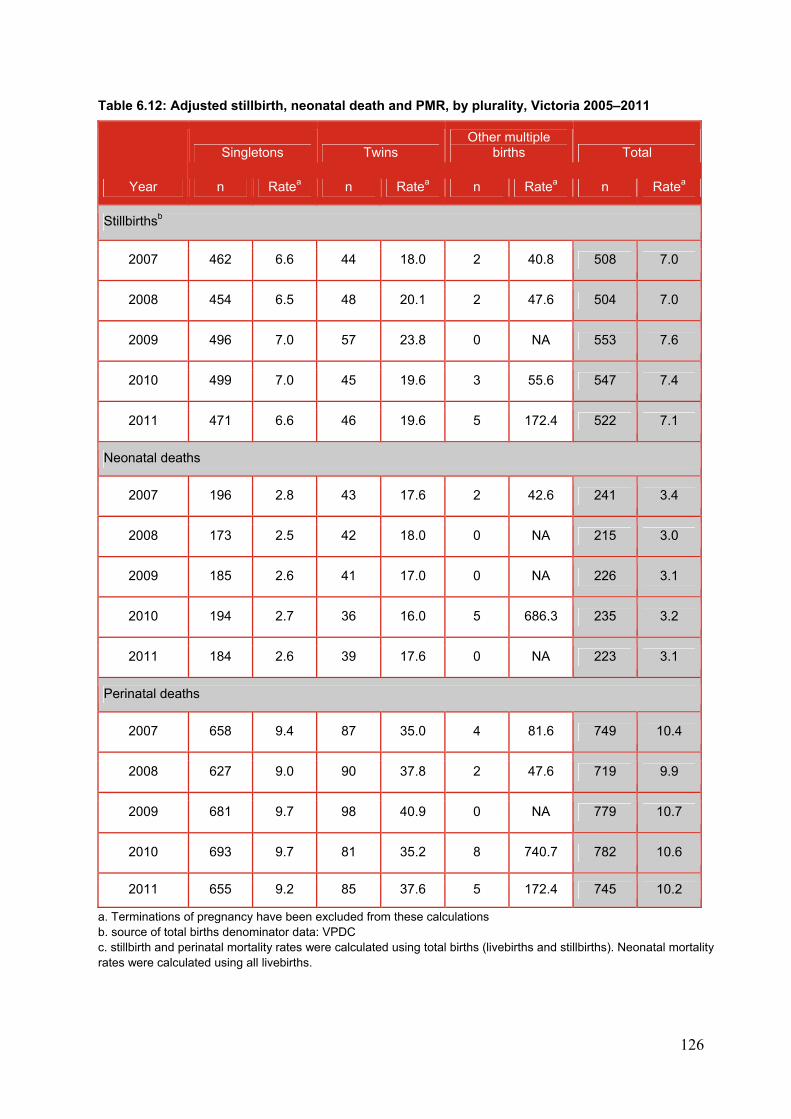
126
Table 6.12: Adjusted stillbirth, neonatal death and PMR, by plurality, Victoria 2005–2011
Year
Singletons Twins Other multiple
births Total
n Ratea n Ratea n Ratea n Ratea
Stillbirthsb
2007 462 6.6 44 18.0 2 40.8 508 7.0
2008 454 6.5 48 20.1 2 47.6 504 7.0
2009 496 7.0 57 23.8 0 NA 553 7.6
2010 499 7.0 45 19.6 3 55.6 547 7.4
2011 471 6.6 46 19.6 5 172.4 522 7.1
Neonatal deaths
2007 196 2.8 43 17.6 2 42.6 241 3.4
2008 173 2.5 42 18.0 0 NA 215 3.0
2009 185 2.6 41 17.0 0 NA 226 3.1
2010 194 2.7 36 16.0 5 686.3 235 3.2
2011 184 2.6 39 17.6 0 NA 223 3.1
Perinatal deaths
2007 658 9.4 87 35.0 4 81.6 749 10.4
2008 627 9.0 90 37.8 2 47.6 719 9.9
2009 681 9.7 98 40.9 0 NA 779 10.7
2010 693 9.7 81 35.2 8 740.7 782 10.6
2011 655 9.2 85 37.6 5 172.4 745 10.2
a. Terminations of pregnancy have been excluded from these calculations b. source of total births denominator data: VPDC c. stillbirth and perinatal mortality rates were calculated using total births (livebirths and stillbirths). Neonatal mortality rates were calculated using all livebirths.
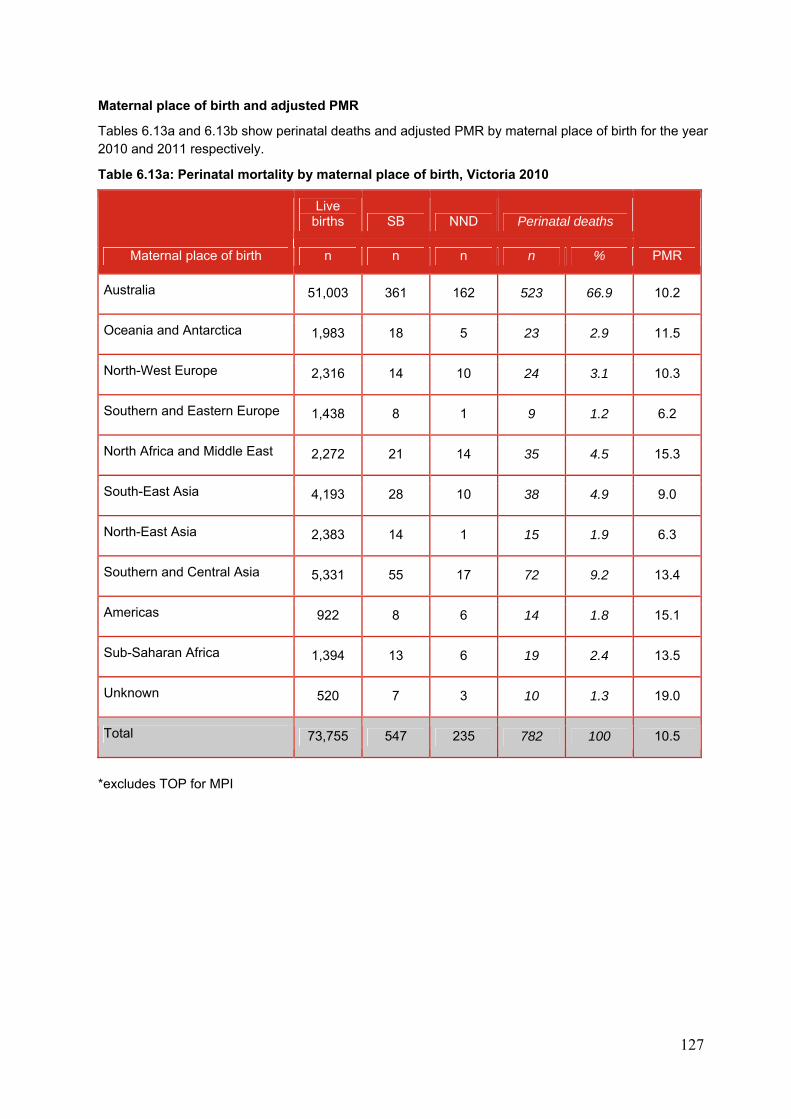
127
Maternal place of birth and adjusted PMR
Tables 6.13a and 6.13b show perinatal deaths and adjusted PMR by maternal place of birth for the year 2010 and 2011 respectively.
Table 6.13a: Perinatal mortality by maternal place of birth, Victoria 2010
Maternal place of birth
Live births SB NND Perinatal deaths
PMR n n n n %
Australia 51,003 361 162 523 66.9 10.2
Oceania and Antarctica 1,983 18 5 23 2.9 11.5
North-West Europe 2,316 14 10 24 3.1 10.3
Southern and Eastern Europe 1,438 8 1 9 1.2 6.2
North Africa and Middle East 2,272 21 14 35 4.5 15.3
South-East Asia 4,193 28 10 38 4.9 9.0
North-East Asia 2,383 14 1 15 1.9 6.3
Southern and Central Asia 5,331 55 17 72 9.2 13.4
Americas 922 8 6 14 1.8 15.1
Sub-Saharan Africa 1,394 13 6 19 2.4 13.5
Unknown 520 7 3 10 1.3 19.0
Total 73,755 547 235 782 100 10.5
*excludes TOP for MPI
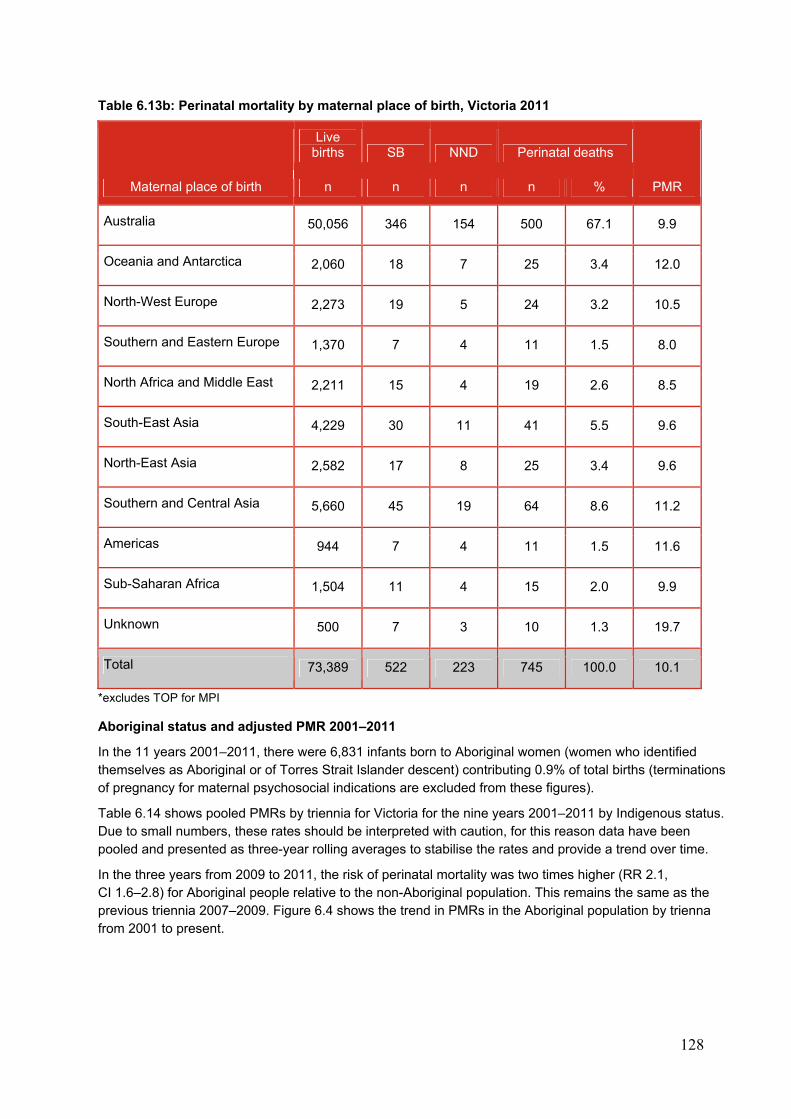
128
Table 6.13b: Perinatal mortality by maternal place of birth, Victoria 2011
Maternal place of birth
Live births SB NND Perinatal deaths
PMR n n n n %
Australia 50,056 346 154 500 67.1 9.9
Oceania and Antarctica 2,060 18 7 25 3.4 12.0
North-West Europe 2,273 19 5 24 3.2 10.5
Southern and Eastern Europe 1,370 7 4 11 1.5 8.0
North Africa and Middle East 2,211 15 4 19 2.6 8.5
South-East Asia 4,229 30 11 41 5.5 9.6
North-East Asia 2,582 17 8 25 3.4 9.6
Southern and Central Asia 5,660 45 19 64 8.6 11.2
Americas 944 7 4 11 1.5 11.6
Sub-Saharan Africa 1,504 11 4 15 2.0 9.9
Unknown 500 7 3 10 1.3 19.7
Total 73,389 522 223 745 100.0 10.1
*excludes TOP for MPI
Aboriginal status and adjusted PMR 2001–2011
In the 11 years 2001–2011, there were 6,831 infants born to Aboriginal women (women who identified themselves as Aboriginal or of Torres Strait Islander descent) contributing 0.9% of total births (terminations of pregnancy for maternal psychosocial indications are excluded from these figures).
Table 6.14 shows pooled PMRs by triennia for Victoria for the nine years 2001–2011 by Indigenous status. Due to small numbers, these rates should be interpreted with caution, for this reason data have been pooled and presented as three-year rolling averages to stabilise the rates and provide a trend over time.
In the three years from 2009 to 2011, the risk of perinatal mortality was two times higher (RR 2.1, CI 1.6–2.8) for Aboriginal people relative to the non-Aboriginal population. This remains the same as the previous triennia 2007–2009. Figure 6.4 shows the trend in PMRs in the Aboriginal population by trienna from 2001 to present.
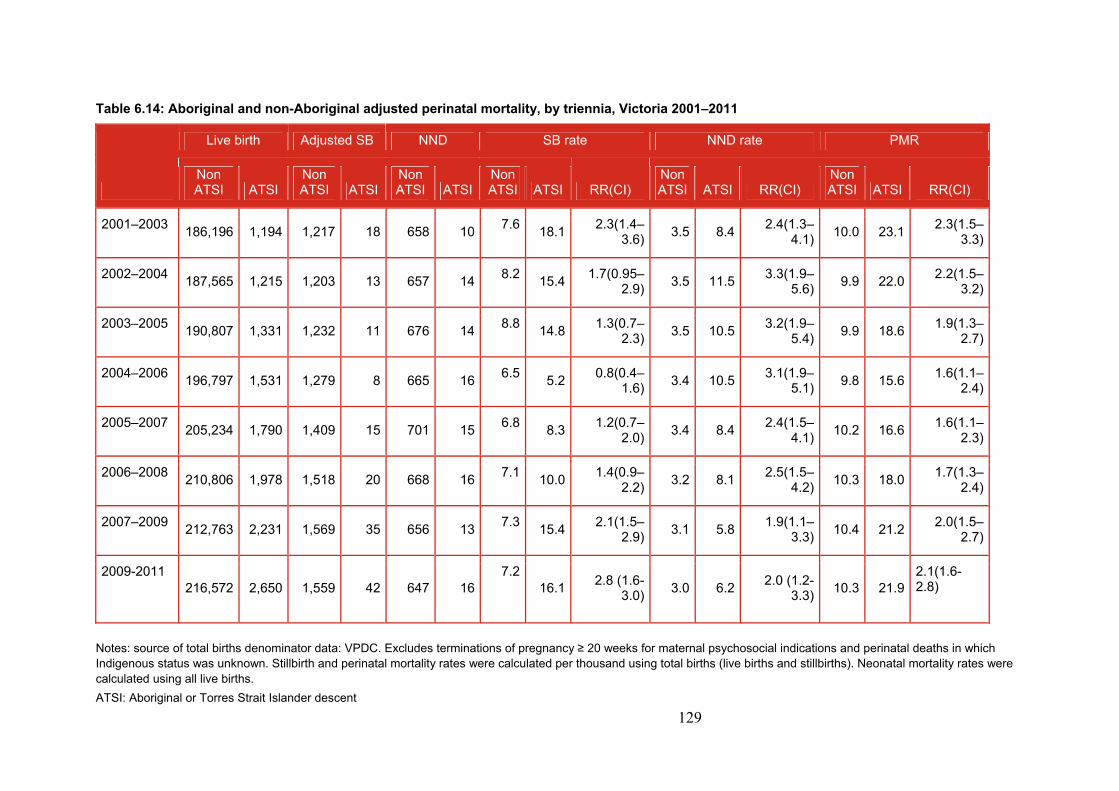
129
Table 6.14: Aboriginal and non-Aboriginal adjusted perinatal mortality, by triennia, Victoria 2001–2011
Live birth Adjusted SB NND SB rate NND rate PMR
Non ATSI ATSI
Non ATSI ATSI
Non ATSI ATSI
Non ATSI ATSI RR(CI)
Non ATSI ATSI RR(CI)
Non ATSI ATSI RR(CI)
2001–2003 186,196 1,194 1,217 18 658 10
7.618.1
2.3(1.4–3.6)
3.5 8.42.4(1.3–
4.1)10.0 23.1
2.3(1.5–3.3)
2002–2004 187,565 1,215 1,203 13 657 14
8.215.4
1.7(0.95–2.9)
3.5 11.53.3(1.9–
5.6)9.9 22.0
2.2(1.5–3.2)
2003–2005 190,807 1,331 1,232 11 676 14
8.814.8
1.3(0.7–2.3)
3.5 10.53.2(1.9–
5.4)9.9 18.6
1.9(1.3–2.7)
2004–2006 196,797 1,531 1,279 8 665 16
6.55.2
0.8(0.4–1.6)
3.4 10.53.1(1.9–
5.1)9.8 15.6
1.6(1.1–2.4)
2005–2007 205,234 1,790 1,409 15 701 15
6.88.3
1.2(0.7–2.0)
3.4 8.42.4(1.5–
4.1)10.2 16.6
1.6(1.1–2.3)
2006–2008 210,806 1,978 1,518 20 668 16
7.110.0
1.4(0.9–2.2)
3.2 8.12.5(1.5–
4.2)10.3 18.0
1.7(1.3–2.4)
2007–2009 212,763 2,231 1,569 35 656 13
7.315.4
2.1(1.5–2.9)
3.1 5.81.9(1.1–
3.3)10.4 21.2
2.0(1.5–2.7)
2009-2011 216,572 2,650 1,559 42 647 16
7.216.1
2.8 (1.6-3.0)
3.0 6.22.0 (1.2-
3.3)10.3 21.9
2.1(1.6-2.8)
Notes: source of total births denominator data: VPDC. Excludes terminations of pregnancy ≥ 20 weeks for maternal psychosocial indications and perinatal deaths in which Indigenous status was unknown. Stillbirth and perinatal mortality rates were calculated per thousand using total births (live births and stillbirths). Neonatal mortality rates were calculated using all live births.
ATSI: Aboriginal or Torres Strait Islander descent

130
Figure 6.4: Adjusted perinatal mortality by Aboriginal status, Victoria 2001–2011
6.1.8 Standardised perinatal mortality ratio for statewide public hospitals
The gestation standardised perinatal mortality ratio (GSPMR) is a partially risk-adjusted calculation, enabling hospitals with higher proportions of low gestation infants (and therefore higher likelihood of perinatal mortality) to be validly compared with hospitals with a different casemix.
The GSPMR is included in the suite of perinatal service performance indicators published annually by the Department of Health.66 The indicator is included to provide a broad comparative measure of PMRs across hospitals and to identify variations and outliers. Pooling the data over five-year periods adds stability to the data and reduces the risk of over-interpretation of chance fluctuations.
This indicator enables identification of those public hospitals where:
outcome meets the statewide reference standard
a more detailed evaluation is merited because of a consistently high GSPMR.
A second result is provided for each hospital recording the GSPMR for those babies born at 32 weeks or more gestation. The rationale for providing both rates is to better reflect clinical performance for non-tertiary hospitals that would not normally care for babies born before 32 weeks gestation.
The GSPMR calculation excludes terminations of pregnancy, deaths due to congenital anomalies and fetus papyraceus. With the commencement of electronic reporting of VPDC data in 2009 there may be some variation to data compared with that reported in previous years. In particular, discharge status of the baby is missing for 192 cases who were liveborn. These mortality ratios were calculated assuming those 192 babies survived the first 28 days.
In interpreting these ratios, conclusions cannot be drawn about avoidability of any of these deaths.
0.0
5.0
10.0
15.0
20.0
25.0
SB rate
NND rate
PMR
SB rate ATSI
NND rate ATSI
PMR ATSI
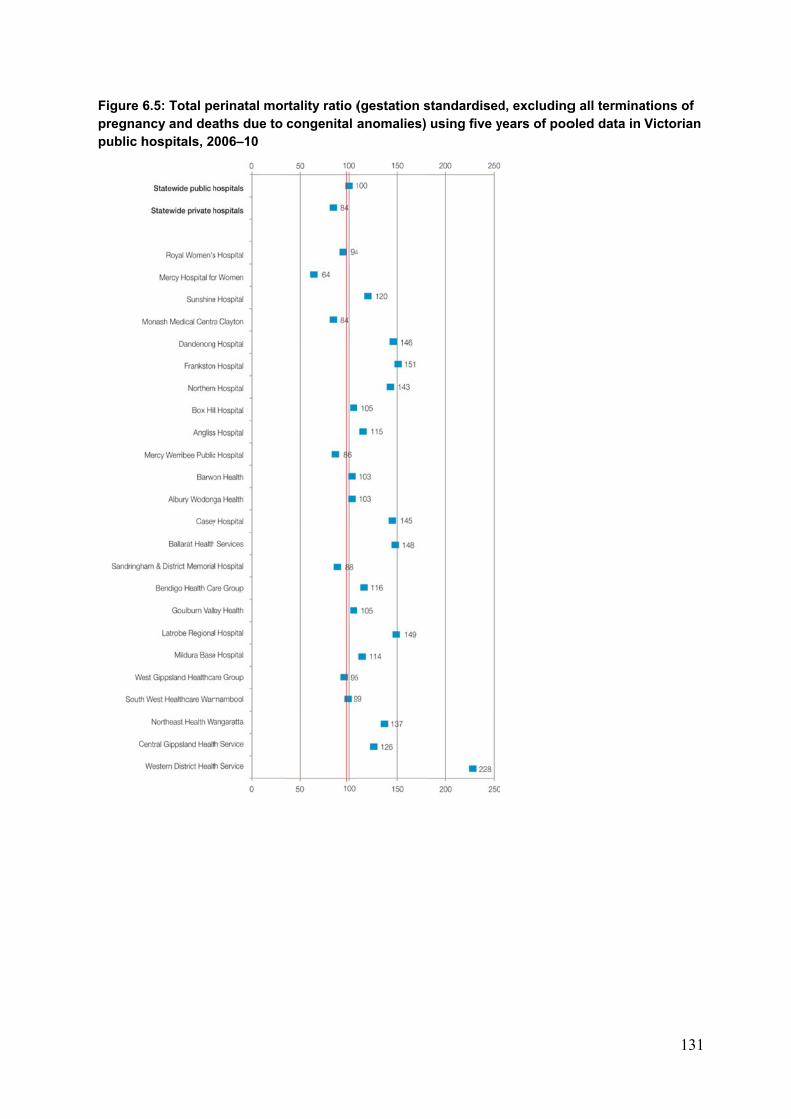
Figure 6pregnapublic h
6.5: Total pency and deahospitals, 2
erinatal moraths due to 006–10
rtality ratio (congenital a
(gestation sanomalies)
standardisedusing five y
d, excludingyears of poo
g all terminaoled data in
131
ations of Victorian
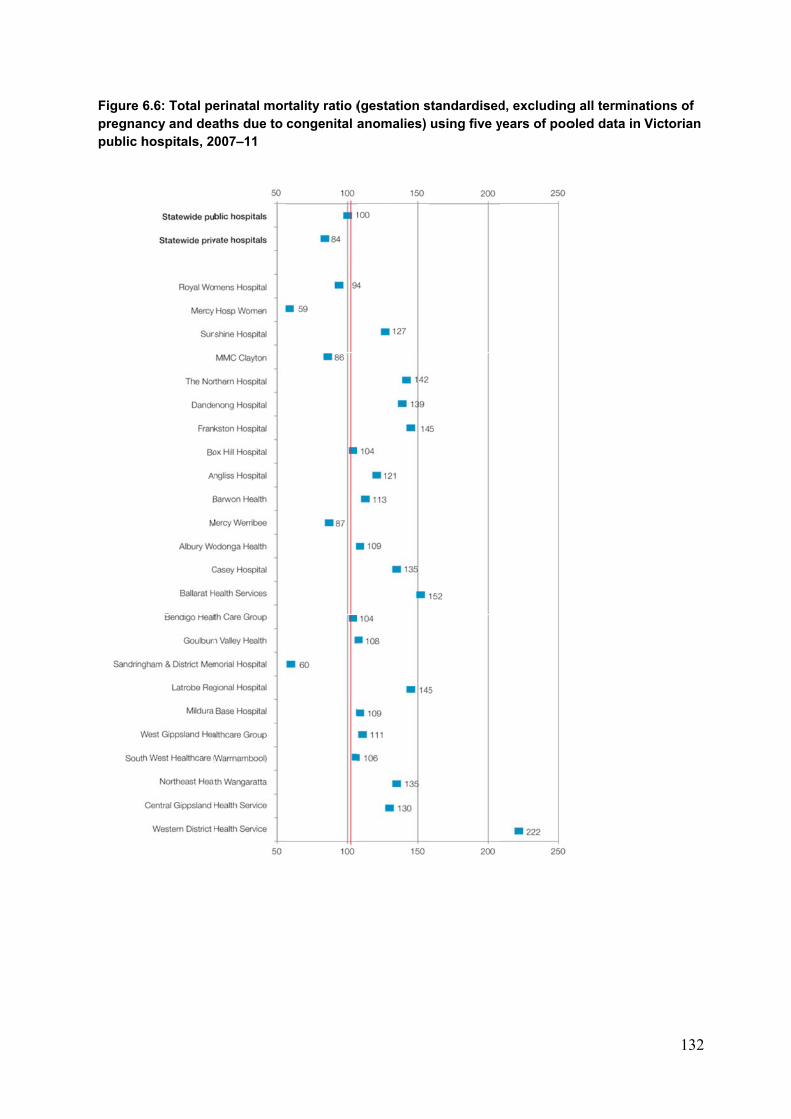
Figure 6pregnapublic h
6.6: Total pency and deahospitals, 2
erinatal moraths due to 007–11
rtality ratio (congenital a
(gestation sanomalies)
standardisedusing five y
d, excludingyears of poo
g all terminaoled data in
132
ations of Victorian
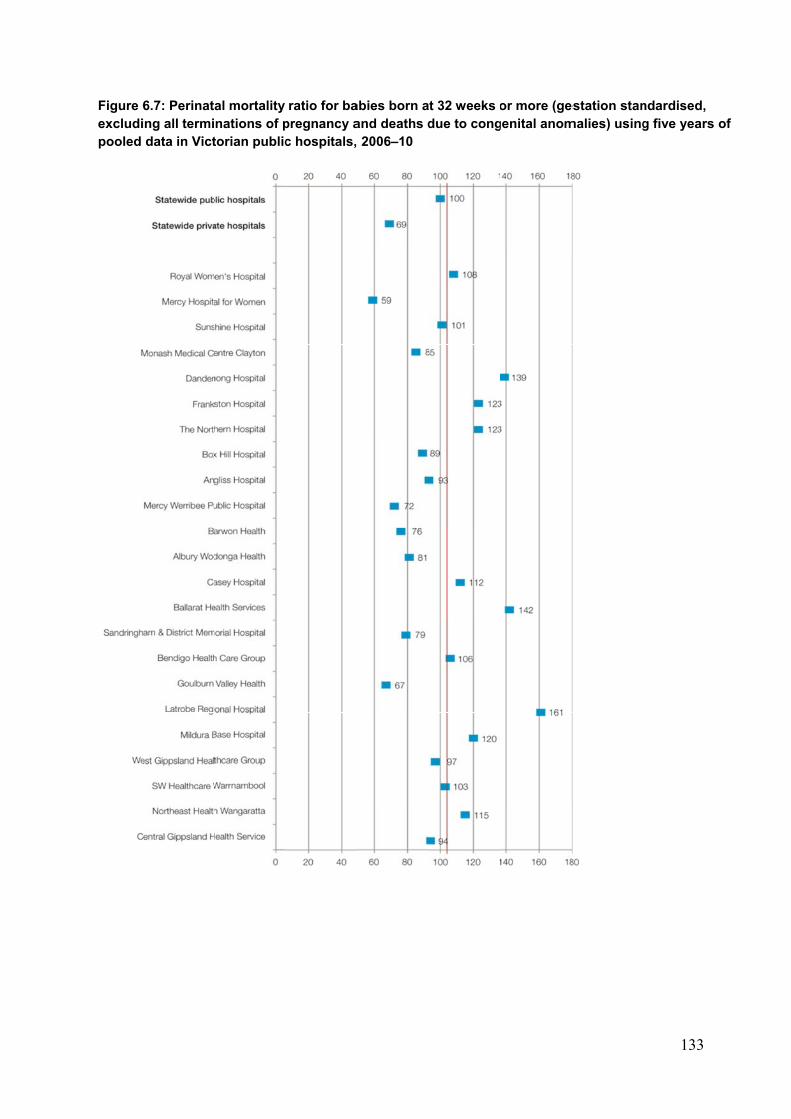
Figure 6excludipooled
6.7: Perinating all termidata in Vict
al mortality nations of ptorian public
ratio for bapregnancy ac hospitals,
abies born aand deaths d 2006–10
t 32 weeks odue to cong
or more (gegenital anom
estation stanmalies) using
133
ndardised, g five years of
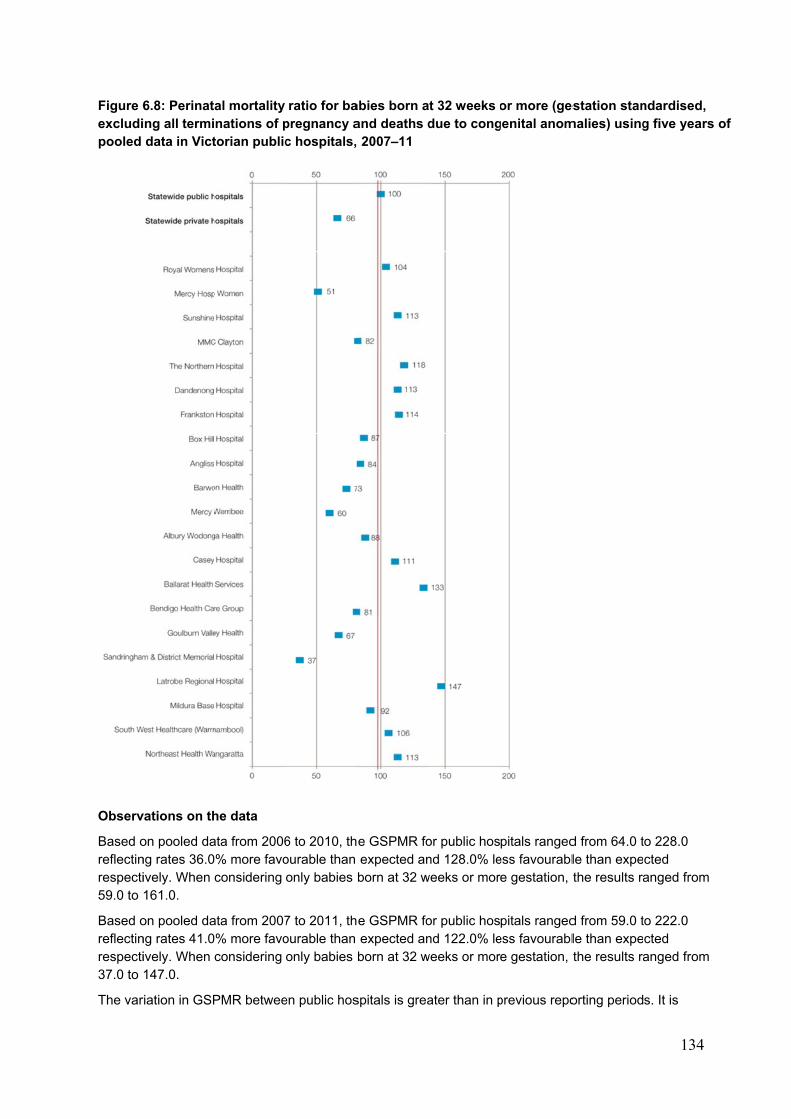
Figure 6excludipooled
Observ
Based oreflectinrespecti59.0 to
Based oreflectinrespecti37.0 to
The var
6.8: Perinating all termidata in Vict
vations on th
on pooled dang rates 36.0ively. When 161.0.
on pooled dang rates 41.0ively. When 147.0.
riation in GSP
al mortality nations of ptorian public
he data
ata from 2006% more favoconsidering
ata from 2007% more favoconsidering
PMR betwee
ratio for bapregnancy ac hospitals,
6 to 2010, thourable than only babies b
7 to 2011, thourable than only babies b
en public hos
abies born aand deaths d 2007–11
e GSPMR foexpected anborn at 32 w
e GSPMR foexpected anborn at 32 w
spitals is grea
t 32 weeks odue to cong
or public hosnd 128.0% le
weeks or mor
or public hosnd 122.0% le
weeks or mor
ater than in p
or more (gegenital anom
pitals rangedess favourable gestation,
pitals rangedess favourable gestation,
previous repo
estation stanmalies) using
d from 64.0 tle than expethe results ra
d from 59.0 tle than expethe results ra
orting period
134
ndardised, g five years
to 228.0 cted anged from
to 222.0 cted anged from
s. It is
of
135
expected that tertiary hospitals will achieve more favourable than average results.
Hospitals should ensure a multidisciplinary review of all perinatal deaths is undertaken to allow for identification of avoidable and contributory factors.
6.2 CAUSES OF PERINATAL DEATHS 2010 AND 2011
Perinatal deaths are classified according to the Perinatal Society of Australia and New Zealand (PSANZ) classification systems. The two classification systems are: the PSANZ perinatal death classification (PDC); and the PSANZ neonatal death classification (NDC) – April 2009 version. These classifications are now being used by most states and territories in Australia. Guidelines for classifications can be accessed through <www.psanz.com.au>.
6.2.1 Perinatal deaths by PSANZ PDC
Tables 6.15a and 6.15b show the number, proportion and rate (per 1,000) of stillbirths, neonatal deaths and perinatal deaths by PSANZ PDC (major categories) for 2010 and 2011 respectively. The following table reports on the PSANZ perinatal death classification (PDC) which is the maternal/fetal antecedent to death, whereas the PSANZ neonatal death classification (NDC) is the major medical condition from which the neonate died.

136
Table 6.15a: Perinatal deaths, Victoria 2010, by PSANZ PDC major categories and type
Cause of death Stillbirths (Fetal
deaths) Neonatal deaths Total (Perinatal)
PSANZ PDC 2010 % Ratec 2010 % Ratec n % Ratec
1. Congenital abnormalitya
187 25.3 2.5 74 31.5 1.0 261 26.8 3.5
2. Infection 8 1.1 0.1 5 2.1 0.1 13 1.3 0.2
3. Hypertension 19 2.6 0.3 7 3.0 0.1 26 2.7 0.3
4. Antepartum haemorrhage
38 5.1 0.5 16 6.8 0.2 54 5.5 0.7
5. Maternal conditionsb 206 27.9 2.8 3 1.3 0.0 209 21.5 2.8
6. Specific perinatal conditions
39 5.3 0.5 9 3.8 0.1 48 4.9 0.6
7. Hypoxic peripartum death
14 1.9 0.2 19 8.1 0.3 33 3.4 0.4
8. Fetal growth restriction (FGR)
53 7.2 0.7 1 0.4 0.0 54 5.5 0.7
9. Spontaneous preterm 54 7.3 0.7 97 41.3 1.3 151 15.5 2.0
10. Unexplained antepartum death
120 16.3 1.6 0 0.0 0.0 120 12.3 1.6
11. No obstetric antecedent
0 0.0 0.0 4 1.7 0.1 4 0.4 0.1
Total 738 100 9.9 235 100 3.2 973 100 13.1
a. Congenital abnormality includes terminations of pregnancy ≥20 weeks (151 stillbirths and 24 neonates) b. Maternal conditions includes terminations of pregnancy ≥20 weeks for psychosocial indications (191 stillbirths) c. Stillbirth and perinatal death rates were calculated using total births (livebirths and stillbirths) as the denominator. Neonatal death rates were calculated using livebirths as the denominator.
Figure 6.9a shows the major causes of perinatal death by PSANZ PDC for 2010 as congenital anomaly (26.8%), followed by maternal conditions (21.4%) and spontaneous preterm (15.5%). Figure 6.9a also indicates the proportion of perinatal deaths due to congenital anomaly and maternal psychosocial indications that resulted in late termination of pregnancy (TOP).
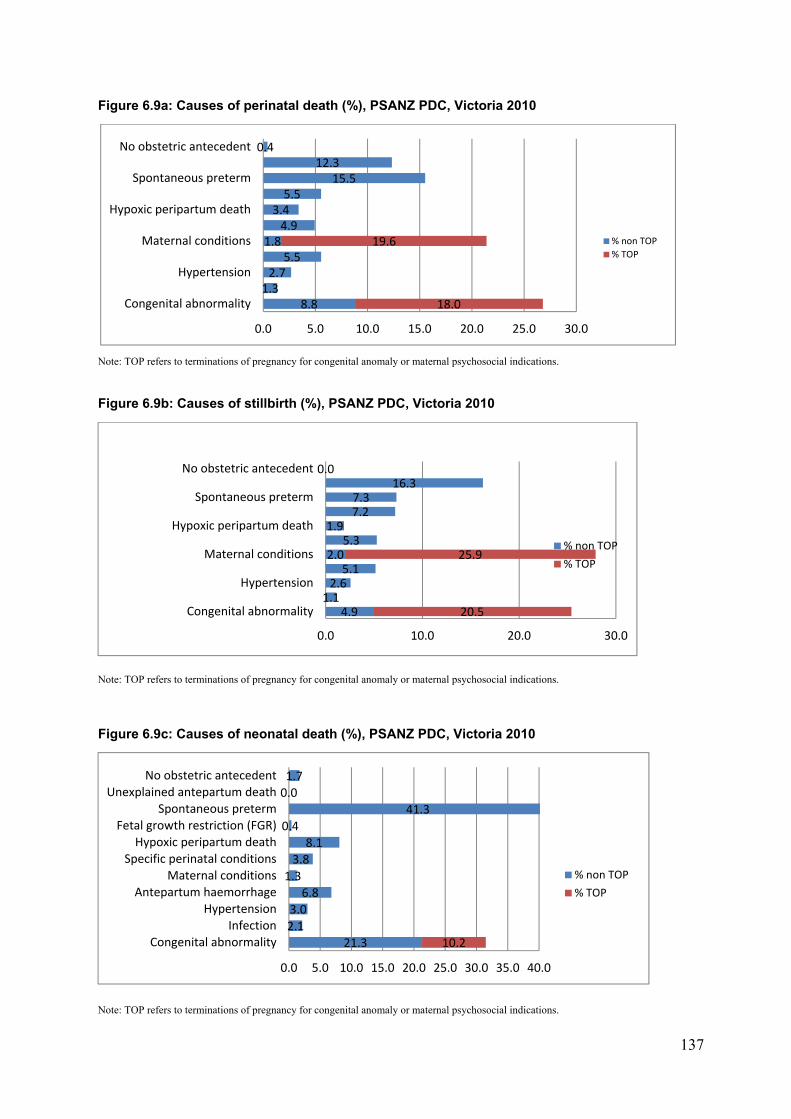
137
Figure 6.9a: Causes of perinatal death (%), PSANZ PDC, Victoria 2010
Note: TOP refers to terminations of pregnancy for congenital anomaly or maternal psychosocial indications.
Figure 6.9b: Causes of stillbirth (%), PSANZ PDC, Victoria 2010
Note: TOP refers to terminations of pregnancy for congenital anomaly or maternal psychosocial indications.
Figure 6.9c: Causes of neonatal death (%), PSANZ PDC, Victoria 2010
Note: TOP refers to terminations of pregnancy for congenital anomaly or maternal psychosocial indications.
8.81.32.7
5.51.8
4.93.45.5
15.512.3
0.4
18.0
19.6
0.0 5.0 10.0 15.0 20.0 25.0 30.0
Congenital abnormality
Hypertension
Maternal conditions
Hypoxic peripartum death
Spontaneous preterm
No obstetric antecedent
% non TOP
% TOP
4.91.12.65.1
2.05.3
1.97.27.3
16.30.0
20.5
25.9
0.0 10.0 20.0 30.0
Congenital abnormality
Hypertension
Maternal conditions
Hypoxic peripartum death
Spontaneous preterm
No obstetric antecedent
% non TOP
% TOP
21.3
2.1
3.0
6.8
1.3
3.8
8.1
0.4
41.3
0.0
1.7
10.2
0.0 5.0 10.0 15.0 20.0 25.0 30.0 35.0 40.0
Congenital abnormality
Infection
Hypertension
Antepartum haemorrhage
Maternal conditions
Specific perinatal conditions
Hypoxic peripartum death
Fetal growth restriction (FGR)
Spontaneous preterm
Unexplained antepartum death
No obstetric antecedent
% non TOP
% TOP
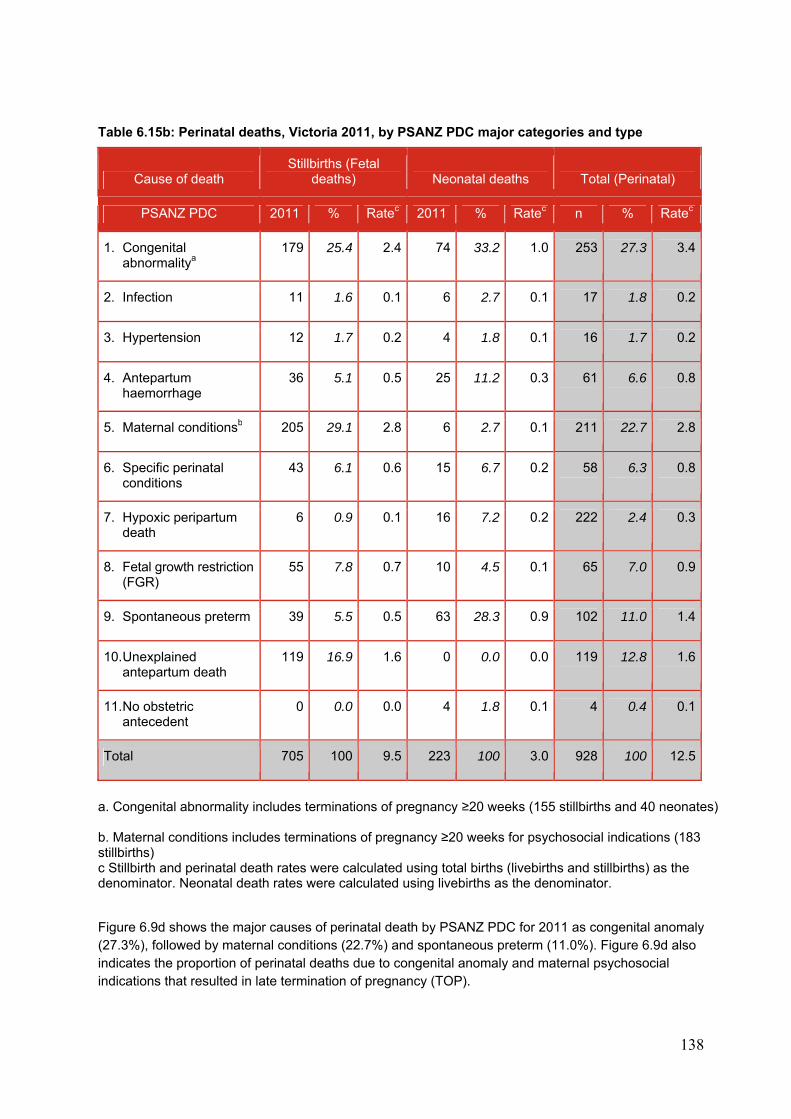
138
Table 6.15b: Perinatal deaths, Victoria 2011, by PSANZ PDC major categories and type
Cause of death Stillbirths (Fetal
deaths) Neonatal deaths Total (Perinatal)
PSANZ PDC 2011 % Ratec 2011 % Ratec n % Ratec
1. Congenital abnormalitya
179 25.4 2.4 74 33.2 1.0 253 27.3 3.4
2. Infection 11 1.6 0.1 6 2.7 0.1 17 1.8 0.2
3. Hypertension 12 1.7 0.2 4 1.8 0.1 16 1.7 0.2
4. Antepartum haemorrhage
36 5.1 0.5 25 11.2 0.3 61 6.6 0.8
5. Maternal conditionsb 205 29.1 2.8 6 2.7 0.1 211 22.7 2.8
6. Specific perinatal conditions
43 6.1 0.6 15 6.7 0.2 58 6.3 0.8
7. Hypoxic peripartum death
6 0.9 0.1 16 7.2 0.2 222 2.4 0.3
8. Fetal growth restriction (FGR)
55 7.8 0.7 10 4.5 0.1 65 7.0 0.9
9. Spontaneous preterm 39 5.5 0.5 63 28.3 0.9 102 11.0 1.4
10. Unexplained antepartum death
119 16.9 1.6 0 0.0 0.0 119 12.8 1.6
11. No obstetric antecedent
0 0.0 0.0 4 1.8 0.1 4 0.4 0.1
Total 705 100 9.5 223 100 3.0 928 100 12.5
a. Congenital abnormality includes terminations of pregnancy ≥20 weeks (155 stillbirths and 40 neonates) b. Maternal conditions includes terminations of pregnancy ≥20 weeks for psychosocial indications (183 stillbirths) c Stillbirth and perinatal death rates were calculated using total births (livebirths and stillbirths) as the denominator. Neonatal death rates were calculated using livebirths as the denominator.
Figure 6.9d shows the major causes of perinatal death by PSANZ PDC for 2011 as congenital anomaly (27.3%), followed by maternal conditions (22.7%) and spontaneous preterm (11.0%). Figure 6.9d also indicates the proportion of perinatal deaths due to congenital anomaly and maternal psychosocial indications that resulted in late termination of pregnancy (TOP).
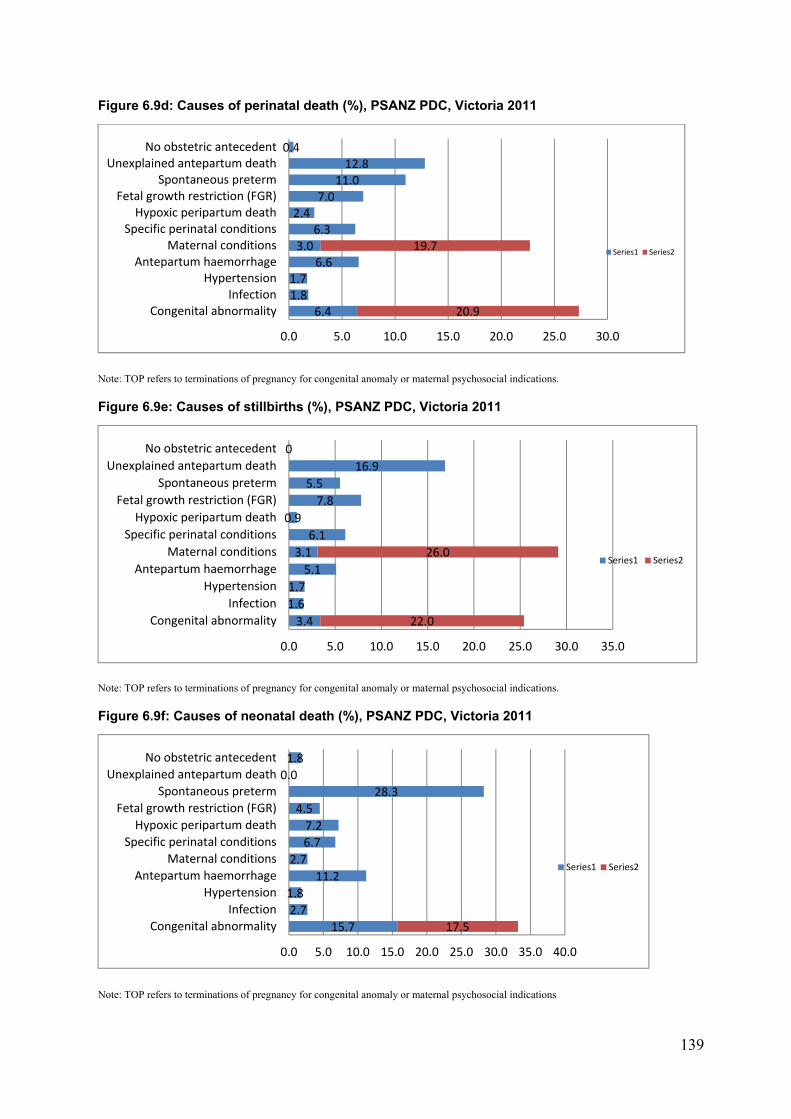
139
Figure 6.9d: Causes of perinatal death (%), PSANZ PDC, Victoria 2011
Note: TOP refers to terminations of pregnancy for congenital anomaly or maternal psychosocial indications.
Figure 6.9e: Causes of stillbirths (%), PSANZ PDC, Victoria 2011
Note: TOP refers to terminations of pregnancy for congenital anomaly or maternal psychosocial indications.
Figure 6.9f: Causes of neonatal death (%), PSANZ PDC, Victoria 2011
Note: TOP refers to terminations of pregnancy for congenital anomaly or maternal psychosocial indications
6.41.81.7
6.63.0
6.32.4
7.011.012.8
0.4
20.9
19.7
0.0 5.0 10.0 15.0 20.0 25.0 30.0
Congenital abnormalityInfection
HypertensionAntepartum haemorrhage
Maternal conditionsSpecific perinatal conditionsHypoxic peripartum death
Fetal growth restriction (FGR)Spontaneous preterm
Unexplained antepartum deathNo obstetric antecedent
Series1 Series2
3.4
1.6
1.7
5.1
3.1
6.1
0.9
7.8
5.5
16.9
0
22.0
26.0
0.0 5.0 10.0 15.0 20.0 25.0 30.0 35.0
Congenital abnormality
Infection
Hypertension
Antepartum haemorrhage
Maternal conditions
Specific perinatal conditions
Hypoxic peripartum death
Fetal growth restriction (FGR)
Spontaneous preterm
Unexplained antepartum death
No obstetric antecedent
Series1 Series2
15.7
2.7
1.8
11.2
2.7
6.7
7.2
4.5
28.3
0.0
1.8
17.5
0.0 5.0 10.0 15.0 20.0 25.0 30.0 35.0 40.0
Congenital abnormality
Infection
Hypertension
Antepartum haemorrhage
Maternal conditions
Specific perinatal conditions
Hypoxic peripartum death
Fetal growth restriction (FGR)
Spontaneous preterm
Unexplained antepartum death
No obstetric antecedent
Series1 Series2
140
6.2.2 Causes of perinatal death by PDC subcategory for 2010 and 2011
Table 6.16 presents stillbirths, neonatal deaths and perinatal deaths in Victoria for 2010 and 2011 by PSANZ PDC sub-categories. Perinatal deaths were classified according to the PSANZ PDC, which identifies maternal/fetal antecedents to perinatal death. A summary of each major PDC category is presented below.
In 2010, congenital anomalies accounted for 26.8% (n = 261) of all perinatal deaths, the most common cause of death. The sub-categories of congenital anomaly are presented in Table 6.16. Chromosomal anomaly was the most common sub-category (n = 86).
In 2011, congenital anomalies accounted for 27.3% (n = 253) of all perinatal deaths, the most common cause of death. Chromosomal anomaly was the most common sub-category (n = 56).
In 2010, 13 perinatal deaths (1.3%) were due to perinatal infection. The most common specified infective organism was Escherichia coli (n = 3) followed by group B streptococcus (n = 2).
In 2011, 17 perinatal deaths (1.8%) were due to perinatal infection. The most common specified infective organism was cytomegalovirus (n = 5) followed by group B streptococcus (n = 4).
In 2010, 26 perinatal deaths (2.7%) were due to maternal hypertension with twenty-two of these due to pre-eclampsia.
In 2011, 16 perinatal deaths (1.7%) were attributed to maternal hypertension with ten of these due to pre-eclampsia.
In 2010, 54 (5.5%) of perinatal deaths were due to to antepartum haemorrhage. Abruption was the most common sub-category (n = 46).
In 2011, 61 (6.6%) of perinatal deaths were due to antepartum haemorrhage. Abruption was the most common sub-category (n = 48) and there were no deaths due to vasa praevia.
In 2010, 18 perinatal deaths (1.8%) were due to other maternal conditions with diabetes accounting for almost half of these deaths (n = 7).
In 2011, 28 perinatal deaths (2.9%) were due to other maternal conditions. Five of these deaths were attributed to diabetes and five were attributed to antiphospholipid syndrome.
In 2010, 48 perinatal deaths (4.9%) were due to specific perinatal conditions, the most common of which was twin-to-twin transfusion syndrome (n = 20). Six perinatal deaths were due to fetomaternal haemorrhage.
In 2011, 58 perinatal deaths (6.3%) were due to specific perinatal conditions, the most common of which was twin to twin transfusion syndrome (n= 19). Eight perinatal deaths were due to fetomaternal haemorrhage.
In 2010, 33 perinatal deaths (3.4%) were attributed to peripartum hypoxia. Nineteen (57.6%) of these deaths were neonatal deaths. Eighteen of the 33 deaths (54.5%) had evidence of non-reassuring fetal status in the absence of another intrapartum complication. Four deaths (12.1%) occurred following uterine rupture.
In 2011, 22 deaths (2.3%) were attributed to peripartum hypoxia. Sixteen (72.7%) of these deaths were neonatal deaths. Fifteen of the 22 deaths (68.1%) had evidence of non-reassuring fetal status in the absence of another intrapartum complication. No deaths were attributed to uterine rupture.
In 2010, 54 perinatal deaths (5.5%) were due to fetal growth restriction (FGR). Only one of these deaths was a neonatal death. The placenta was known to have been examined histologically in 49 of these deaths (90.8%).
In 2011, 65 perinatal deaths (7.0%) were due to FGR. Ten of these deaths were neonatal deaths. The placenta was known to have been examined histologically in 53 of these deaths (81.5%).
141
In 2010, spontaneous preterm birth was the cause of 151 (15.5%) perinatal deaths in 2010, 54 stillbirths and 97 neonatal deaths. Of these, 38.5% were associated with membrane rupture of 24 hours or more (Table 6.16).
In 2011, spontaneous preterm birth was the cause of 102 (11.0%) perinatal deaths in 2011, 39 stillbirths and 63 neonatal deaths. Of these deaths, 26.5% were associated with membrane rupture of 24 hours or more (Table 6.16).
Unexplained antepartum death was the third most frequent cause of perinatal death in 2010 and 2011 accounting for 120 deaths (12.3%) in 2010 and 119 deaths (12.8%) in 2011. Postmortem examination was conducted in 41.7% in 2010 and 60% in 2011. In 2010, the placenta was examined histologically in 110 deaths (91.7%) and no placental pathology was identified in 68 of these (61.8%). In 2011, the placenta was examined histologically in 110 deaths (92.4%) and no placenta pathology was identified in 61 (55.5%) of these deaths.
No obstetric antecedent
No obstetric antecedent was identified in four neonatal deaths in 2010 and four neonatal deaths in 2011. Specified causes included SIDS and postnatally acquired infection. Two neonatal deaths in 2011 were attributed to the latter.
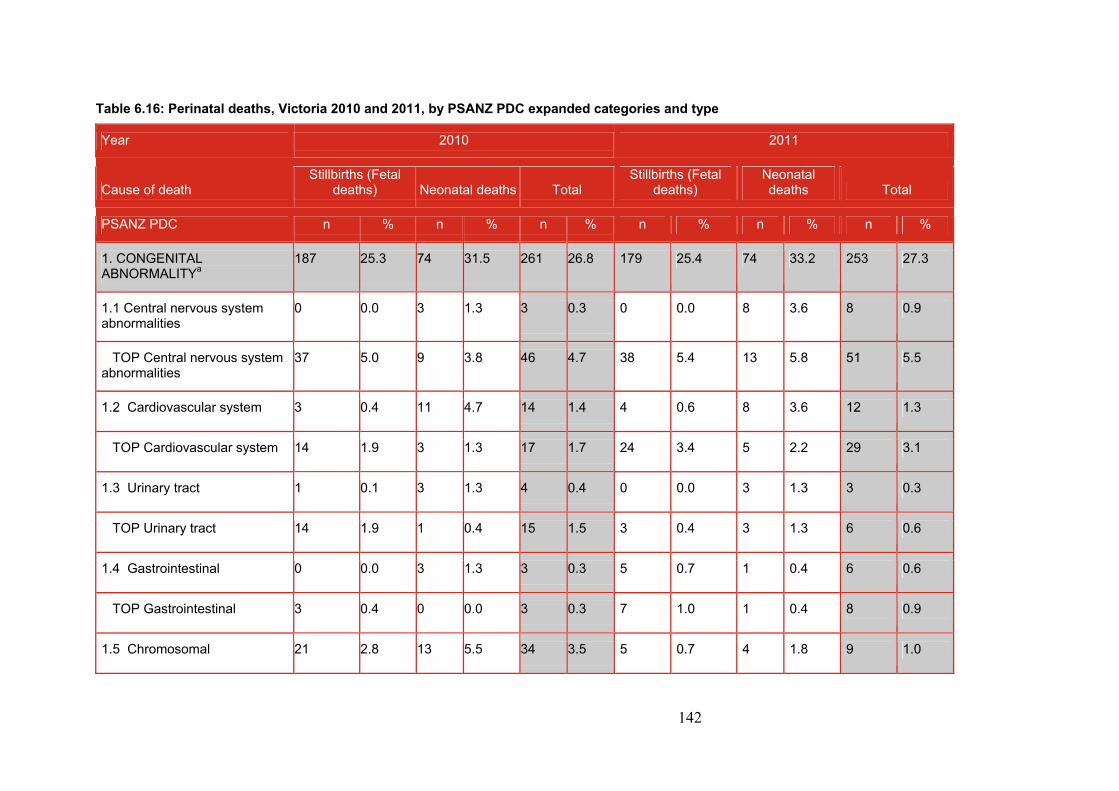
142
Table 6.16: Perinatal deaths, Victoria 2010 and 2011, by PSANZ PDC expanded categories and type
Year 2010 2011
Cause of death Stillbirths (Fetal
deaths) Neonatal deaths Total Stillbirths (Fetal
deaths) Neonatal deaths Total
PSANZ PDC n % n % n % n % n % n %
1. CONGENITAL ABNORMALITYa
187 25.3 74 31.5 261 26.8 179 25.4 74 33.2 253 27.3
1.1 Central nervous system abnormalities
0 0.0 3 1.3 3 0.3 0 0.0 8 3.6 8 0.9
TOP Central nervous system abnormalities
37 5.0 9 3.8 46 4.7 38 5.4 13 5.8 51 5.5
1.2 Cardiovascular system 3 0.4 11 4.7 14 1.4 4 0.6 8 3.6 12 1.3
TOP Cardiovascular system 14 1.9 3 1.3 17 1.7 24 3.4 5 2.2 29 3.1
1.3 Urinary tract 1 0.1 3 1.3 4 0.4 0 0.0 3 1.3 3 0.3
TOP Urinary tract 14 1.9 1 0.4 15 1.5 3 0.4 3 1.3 6 0.6
1.4 Gastrointestinal 0 0.0 3 1.3 3 0.3 5 0.7 1 0.4 6 0.6
TOP Gastrointestinal 3 0.4 0 0.0 3 0.3 7 1.0 1 0.4 8 0.9
1.5 Chromosomal 21 2.8 13 5.5 34 3.5 5 0.7 4 1.8 9 1.0
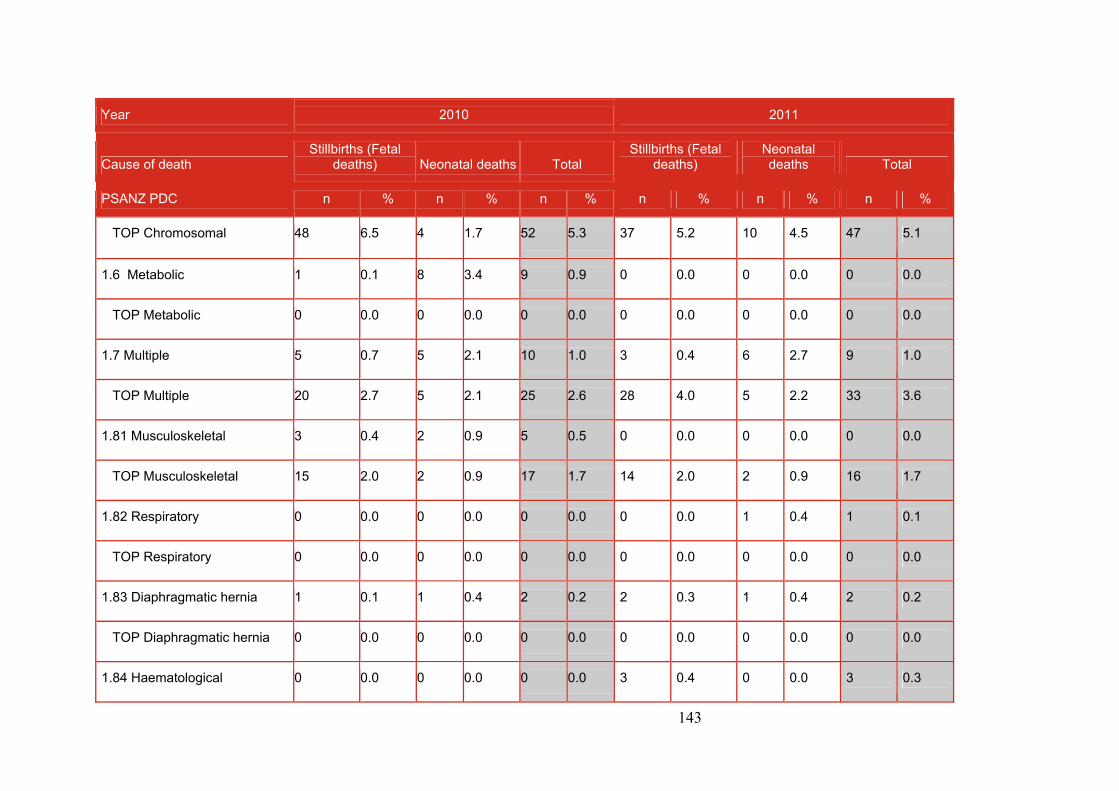
143
Year 2010 2011
Cause of death Stillbirths (Fetal
deaths) Neonatal deaths Total Stillbirths (Fetal
deaths) Neonatal deaths Total
PSANZ PDC n % n % n % n % n % n %
TOP Chromosomal 48 6.5 4 1.7 52 5.3 37 5.2 10 4.5 47 5.1
1.6 Metabolic 1 0.1 8 3.4 9 0.9 0 0.0 0 0.0 0 0.0
TOP Metabolic 0 0.0 0 0.0 0 0.0 0 0.0 0 0.0 0 0.0
1.7 Multiple 5 0.7 5 2.1 10 1.0 3 0.4 6 2.7 9 1.0
TOP Multiple 20 2.7 5 2.1 25 2.6 28 4.0 5 2.2 33 3.6
1.81 Musculoskeletal 3 0.4 2 0.9 5 0.5 0 0.0 0 0.0 0 0.0
TOP Musculoskeletal 15 2.0 2 0.9 17 1.7 14 2.0 2 0.9 16 1.7
1.82 Respiratory 0 0.0 0 0.0 0 0.0 0 0.0 1 0.4 1 0.1
TOP Respiratory 0 0.0 0 0.0 0 0.0 0 0.0 0 0.0 0 0.0
1.83 Diaphragmatic hernia 1 0.1 1 0.4 2 0.2 2 0.3 1 0.4 2 0.2
TOP Diaphragmatic hernia 0 0.0 0 0.0 0 0.0 0 0.0 0 0.0 0 0.0
1.84 Haematological 0 0.0 0 0.0 0 0.0 3 0.4 0 0.0 3 0.3
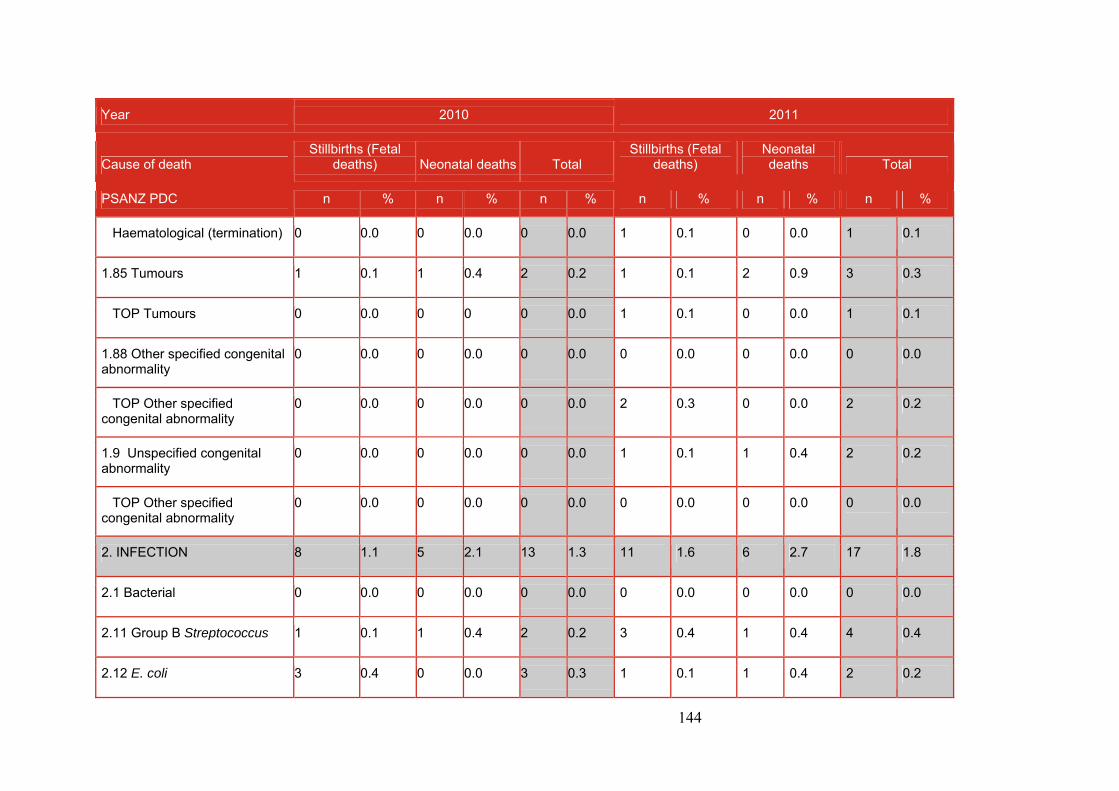
144
Year 2010 2011
Cause of death Stillbirths (Fetal
deaths) Neonatal deaths Total Stillbirths (Fetal
deaths) Neonatal deaths Total
PSANZ PDC n % n % n % n % n % n %
Haematological (termination) 0 0.0 0 0.0 0 0.0 1 0.1 0 0.0 1 0.1
1.85 Tumours 1 0.1 1 0.4 2 0.2 1 0.1 2 0.9 3 0.3
TOP Tumours 0 0.0 0 0 0 0.0 1 0.1 0 0.0 1 0.1
1.88 Other specified congenital abnormality
0 0.0 0 0.0 0 0.0 0 0.0 0 0.0 0 0.0
TOP Other specified congenital abnormality
0 0.0 0 0.0 0 0.0 2 0.3 0 0.0 2 0.2
1.9 Unspecified congenital abnormality
0 0.0 0 0.0 0 0.0 1 0.1 1 0.4 2 0.2
TOP Other specified congenital abnormality
0 0.0 0 0.0 0 0.0 0 0.0 0 0.0 0 0.0
2. INFECTION 8 1.1 5 2.1 13 1.3 11 1.6 6 2.7 17 1.8
2.1 Bacterial 0 0.0 0 0.0 0 0.0 0 0.0 0 0.0 0 0.0
2.11 Group B Streptococcus 1 0.1 1 0.4 2 0.2 3 0.4 1 0.4 4 0.4
2.12 E. coli 3 0.4 0 0.0 3 0.3 1 0.1 1 0.4 2 0.2
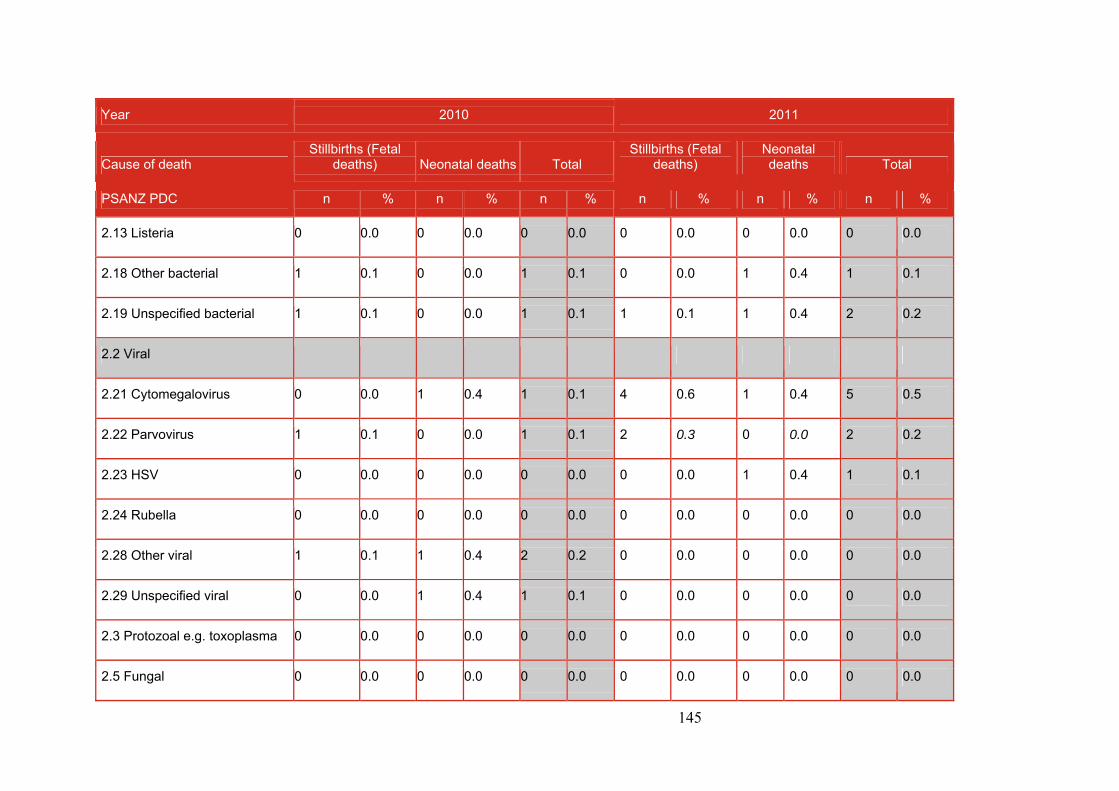
145
Year 2010 2011
Cause of death Stillbirths (Fetal
deaths) Neonatal deaths Total Stillbirths (Fetal
deaths) Neonatal deaths Total
PSANZ PDC n % n % n % n % n % n %
2.13 Listeria 0 0.0 0 0.0 0 0.0 0 0.0 0 0.0 0 0.0
2.18 Other bacterial 1 0.1 0 0.0 1 0.1 0 0.0 1 0.4 1 0.1
2.19 Unspecified bacterial 1 0.1 0 0.0 1 0.1 1 0.1 1 0.4 2 0.2
2.2 Viral
2.21 Cytomegalovirus 0 0.0 1 0.4 1 0.1 4 0.6 1 0.4 5 0.5
2.22 Parvovirus 1 0.1 0 0.0 1 0.1 2 0.3 0 0.0 2 0.2
2.23 HSV 0 0.0 0 0.0 0 0.0 0 0.0 1 0.4 1 0.1
2.24 Rubella 0 0.0 0 0.0 0 0.0 0 0.0 0 0.0 0 0.0
2.28 Other viral 1 0.1 1 0.4 2 0.2 0 0.0 0 0.0 0 0.0
2.29 Unspecified viral 0 0.0 1 0.4 1 0.1 0 0.0 0 0.0 0 0.0
2.3 Protozoal e.g. toxoplasma 0 0.0 0 0.0 0 0.0 0 0.0 0 0.0 0 0.0
2.5 Fungal 0 0.0 0 0.0 0 0.0 0 0.0 0 0.0 0 0.0
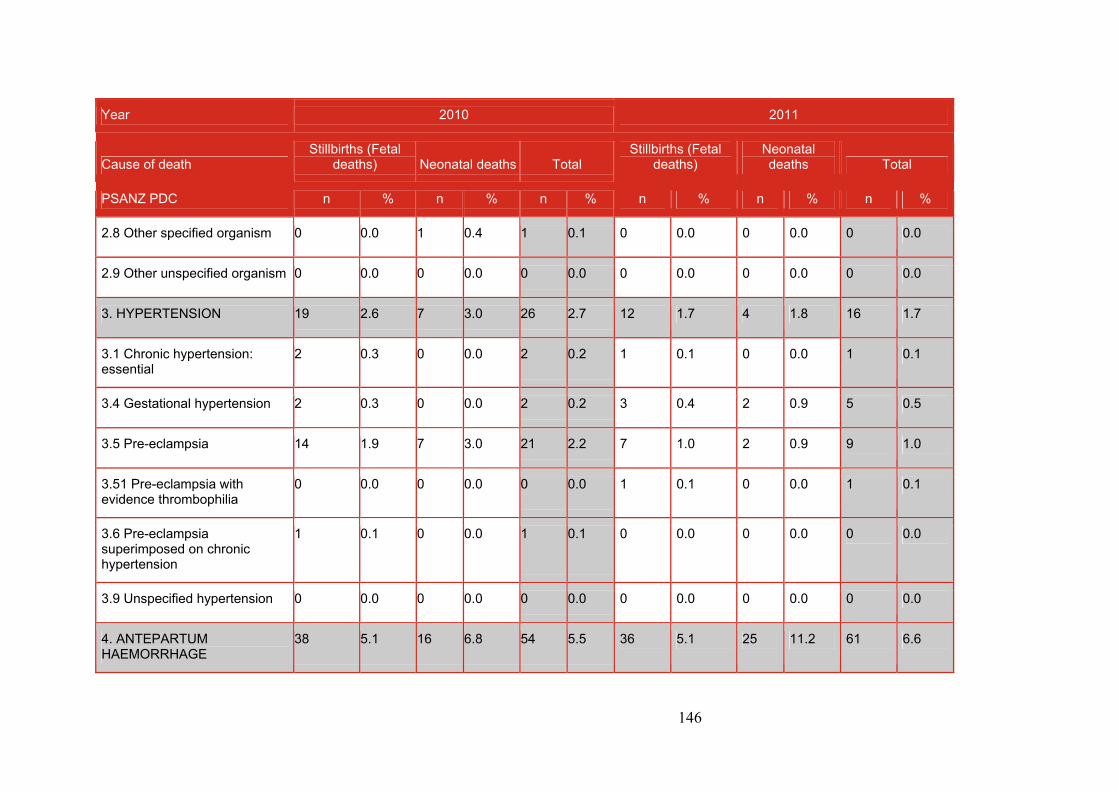
146
Year 2010 2011
Cause of death Stillbirths (Fetal
deaths) Neonatal deaths Total Stillbirths (Fetal
deaths) Neonatal deaths Total
PSANZ PDC n % n % n % n % n % n %
2.8 Other specified organism 0 0.0 1 0.4 1 0.1 0 0.0 0 0.0 0 0.0
2.9 Other unspecified organism 0 0.0 0 0.0 0 0.0 0 0.0 0 0.0 0 0.0
3. HYPERTENSION 19 2.6 7 3.0 26 2.7 12 1.7 4 1.8 16 1.7
3.1 Chronic hypertension: essential
2 0.3 0 0.0 2 0.2 1 0.1 0 0.0 1 0.1
3.4 Gestational hypertension 2 0.3 0 0.0 2 0.2 3 0.4 2 0.9 5 0.5
3.5 Pre-eclampsia 14 1.9 7 3.0 21 2.2 7 1.0 2 0.9 9 1.0
3.51 Pre-eclampsia with evidence thrombophilia
0 0.0 0 0.0 0 0.0 1 0.1 0 0.0 1 0.1
3.6 Pre-eclampsia superimposed on chronic hypertension
1 0.1 0 0.0 1 0.1 0 0.0 0 0.0 0 0.0
3.9 Unspecified hypertension 0 0.0 0 0.0 0 0.0 0 0.0 0 0.0 0 0.0
4. ANTEPARTUM HAEMORRHAGE
38 5.1 16 6.8 54 5.5 36 5.1 25 11.2 61 6.6
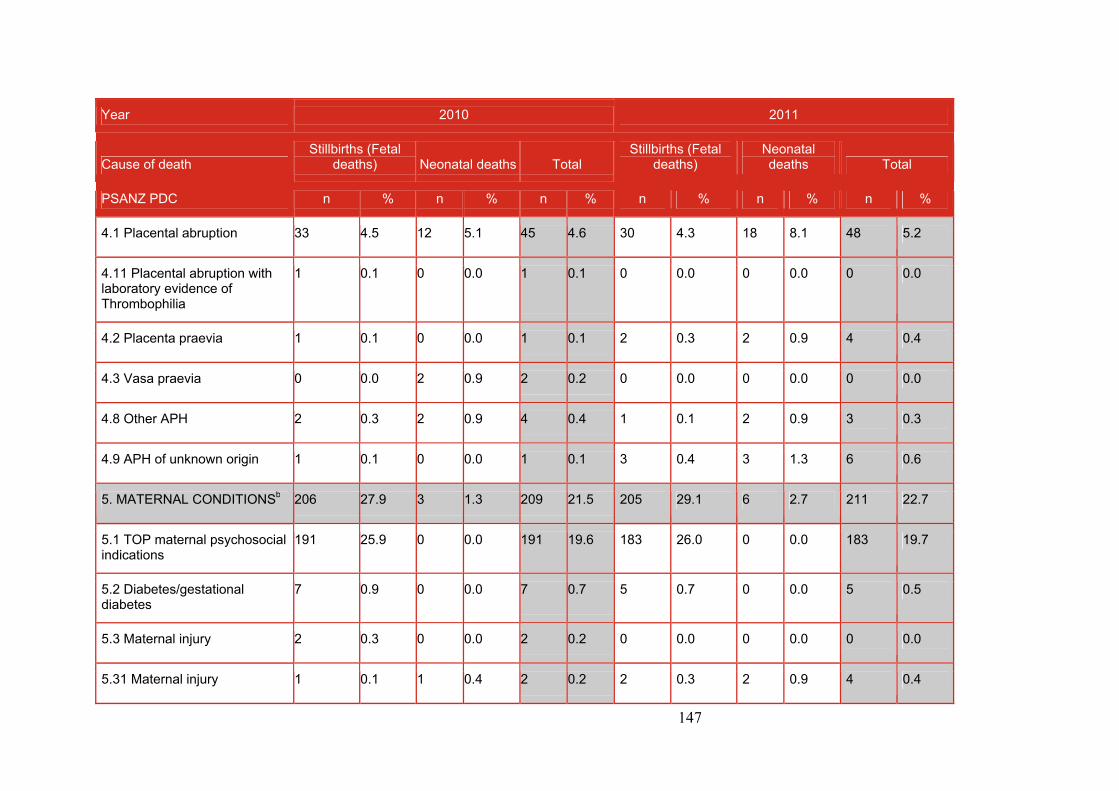
147
Year 2010 2011
Cause of death Stillbirths (Fetal
deaths) Neonatal deaths Total Stillbirths (Fetal
deaths) Neonatal deaths Total
PSANZ PDC n % n % n % n % n % n %
4.1 Placental abruption 33 4.5 12 5.1 45 4.6 30 4.3 18 8.1 48 5.2
4.11 Placental abruption with laboratory evidence of Thrombophilia
1 0.1 0 0.0 1 0.1 0 0.0 0 0.0 0 0.0
4.2 Placenta praevia 1 0.1 0 0.0 1 0.1 2 0.3 2 0.9 4 0.4
4.3 Vasa praevia 0 0.0 2 0.9 2 0.2 0 0.0 0 0.0 0 0.0
4.8 Other APH 2 0.3 2 0.9 4 0.4 1 0.1 2 0.9 3 0.3
4.9 APH of unknown origin 1 0.1 0 0.0 1 0.1 3 0.4 3 1.3 6 0.6
5. MATERNAL CONDITIONSb 206 27.9 3 1.3 209 21.5 205 29.1 6 2.7 211 22.7
5.1 TOP maternal psychosocial indications
191 25.9 0 0.0 191 19.6 183 26.0 0 0.0 183 19.7
5.2 Diabetes/gestational diabetes
7 0.9 0 0.0 7 0.7 5 0.7 0 0.0 5 0.5
5.3 Maternal injury 2 0.3 0 0.0 2 0.2 0 0.0 0 0.0 0 0.0
5.31 Maternal injury 1 0.1 1 0.4 2 0.2 2 0.3 2 0.9 4 0.4
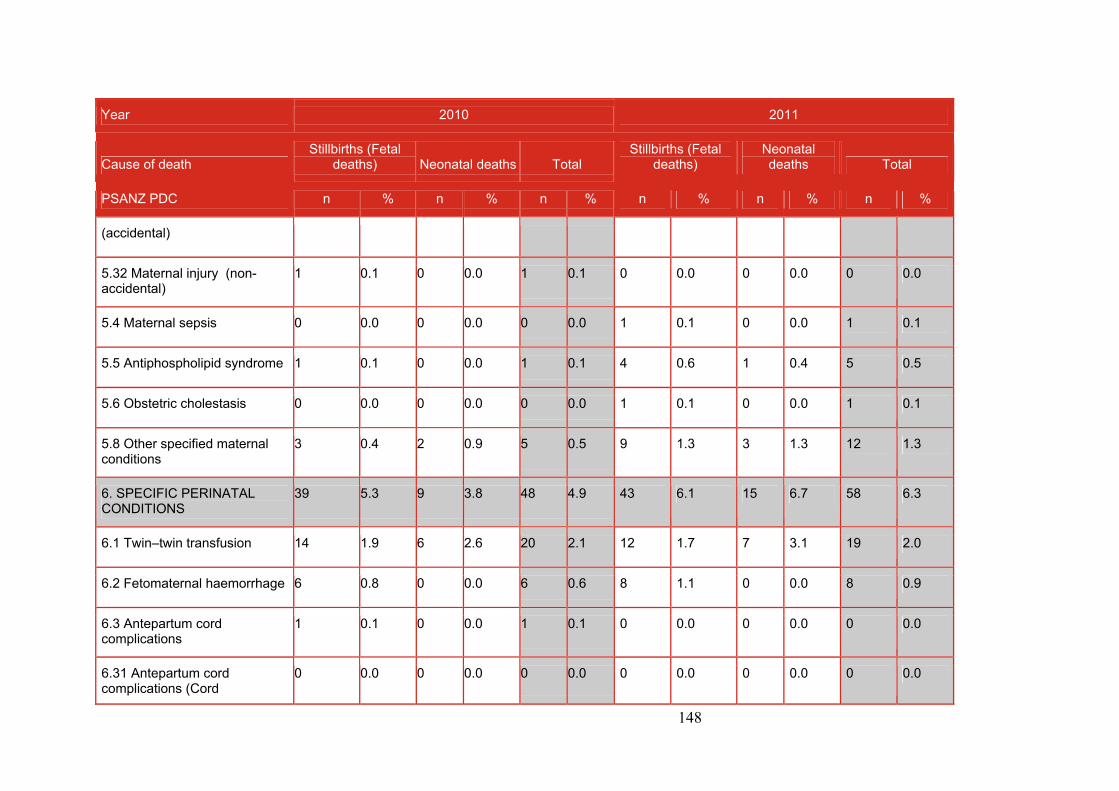
148
Year 2010 2011
Cause of death Stillbirths (Fetal
deaths) Neonatal deaths Total Stillbirths (Fetal
deaths) Neonatal deaths Total
PSANZ PDC n % n % n % n % n % n %
(accidental)
5.32 Maternal injury (non-accidental)
1 0.1 0 0.0 1 0.1 0 0.0 0 0.0 0 0.0
5.4 Maternal sepsis 0 0.0 0 0.0 0 0.0 1 0.1 0 0.0 1 0.1
5.5 Antiphospholipid syndrome 1 0.1 0 0.0 1 0.1 4 0.6 1 0.4 5 0.5
5.6 Obstetric cholestasis 0 0.0 0 0.0 0 0.0 1 0.1 0 0.0 1 0.1
5.8 Other specified maternal conditions
3 0.4 2 0.9 5 0.5 9 1.3 3 1.3 12 1.3
6. SPECIFIC PERINATAL CONDITIONS
39 5.3 9 3.8 48 4.9 43 6.1 15 6.7 58 6.3
6.1 Twin–twin transfusion 14 1.9 6 2.6 20 2.1 12 1.7 7 3.1 19 2.0
6.2 Fetomaternal haemorrhage 6 0.8 0 0.0 6 0.6 8 1.1 0 0.0 8 0.9
6.3 Antepartum cord complications
1 0.1 0 0.0 1 0.1 0 0.0 0 0.0 0 0.0
6.31 Antepartum cord complications (Cord
0 0.0 0 0.0 0 0.0 0 0.0 0 0.0 0 0.0
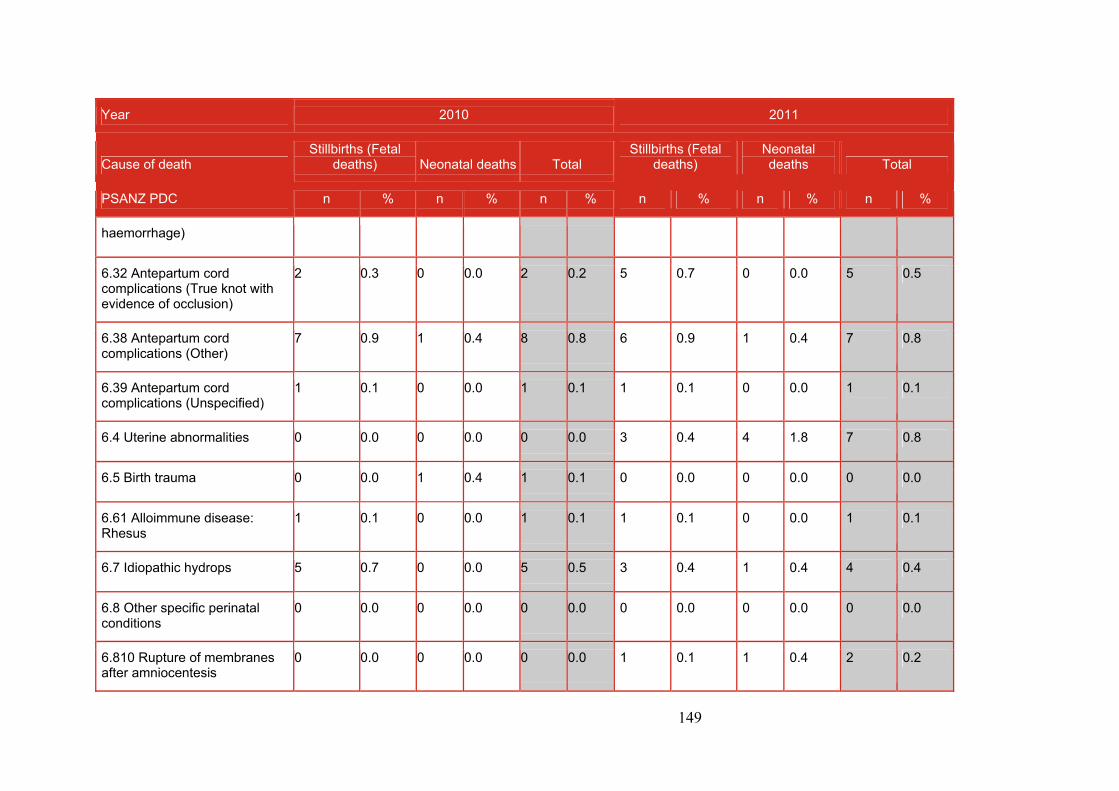
149
Year 2010 2011
Cause of death Stillbirths (Fetal
deaths) Neonatal deaths Total Stillbirths (Fetal
deaths) Neonatal deaths Total
PSANZ PDC n % n % n % n % n % n %
haemorrhage)
6.32 Antepartum cord complications (True knot with evidence of occlusion)
2 0.3 0 0.0 2 0.2 5 0.7 0 0.0 5 0.5
6.38 Antepartum cord complications (Other)
7 0.9 1 0.4 8 0.8 6 0.9 1 0.4 7 0.8
6.39 Antepartum cord complications (Unspecified)
1 0.1 0 0.0 1 0.1 1 0.1 0 0.0 1 0.1
6.4 Uterine abnormalities 0 0.0 0 0.0 0 0.0 3 0.4 4 1.8 7 0.8
6.5 Birth trauma 0 0.0 1 0.4 1 0.1 0 0.0 0 0.0 0 0.0
6.61 Alloimmune disease: Rhesus
1 0.1 0 0.0 1 0.1 1 0.1 0 0.0 1 0.1
6.7 Idiopathic hydrops 5 0.7 0 0.0 5 0.5 3 0.4 1 0.4 4 0.4
6.8 Other specific perinatal conditions
0 0.0 0 0.0 0 0.0 0 0.0 0 0.0 0 0.0
6.810 Rupture of membranes after amniocentesis
0 0.0 0 0.0 0 0.0 1 0.1 1 0.4 2 0.2
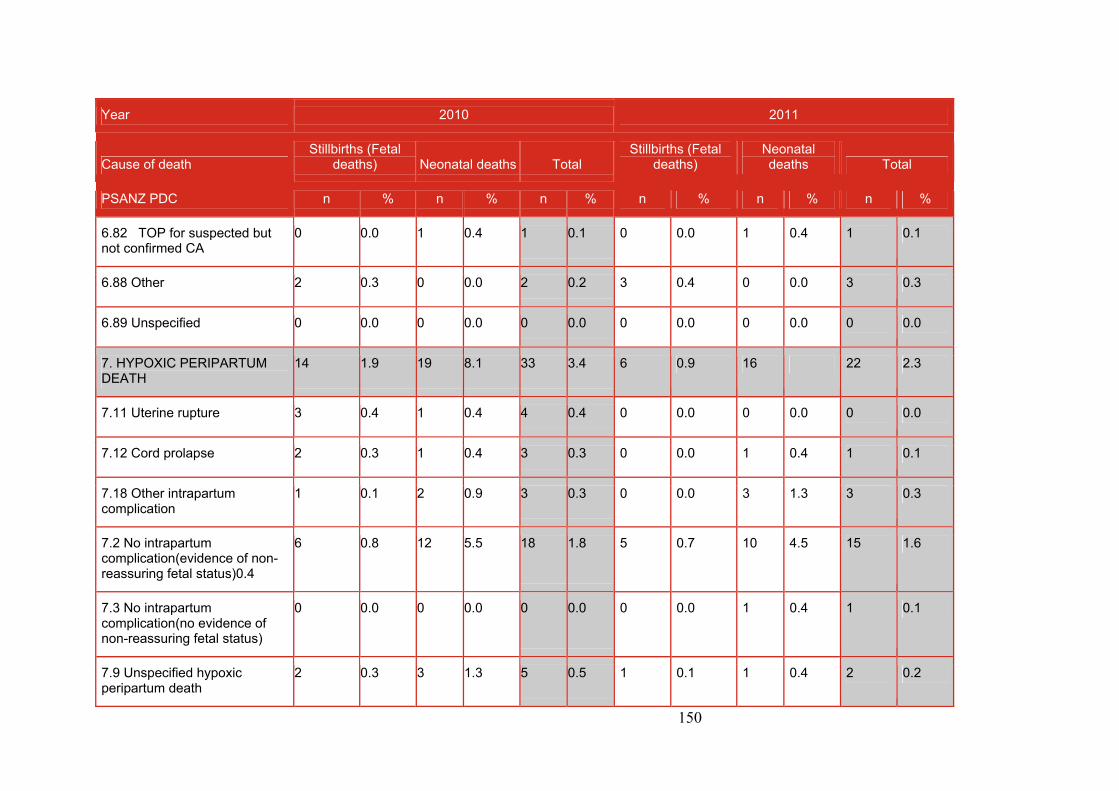
150
Year 2010 2011
Cause of death Stillbirths (Fetal
deaths) Neonatal deaths Total Stillbirths (Fetal
deaths) Neonatal deaths Total
PSANZ PDC n % n % n % n % n % n %
6.82 TOP for suspected but not confirmed CA
0 0.0 1 0.4 1 0.1 0 0.0 1 0.4 1 0.1
6.88 Other 2 0.3 0 0.0 2 0.2 3 0.4 0 0.0 3 0.3
6.89 Unspecified 0 0.0 0 0.0 0 0.0 0 0.0 0 0.0 0 0.0
7. HYPOXIC PERIPARTUM DEATH
14 1.9 19 8.1 33 3.4 6 0.9 16 22 2.3
7.11 Uterine rupture 3 0.4 1 0.4 4 0.4 0 0.0 0 0.0 0 0.0
7.12 Cord prolapse 2 0.3 1 0.4 3 0.3 0 0.0 1 0.4 1 0.1
7.18 Other intrapartum complication
1 0.1 2 0.9 3 0.3 0 0.0 3 1.3 3 0.3
7.2 No intrapartum complication(evidence of non-reassuring fetal status)0.4
6 0.8 12 5.5 18 1.8 5 0.7 10 4.5 15 1.6
7.3 No intrapartum complication(no evidence of non-reassuring fetal status)
0 0.0 0 0.0 0 0.0 0 0.0 1 0.4 1 0.1
7.9 Unspecified hypoxic peripartum death
2 0.3 3 1.3 5 0.5 1 0.1 1 0.4 2 0.2

151
Year 2010 2011
Cause of death Stillbirths (Fetal
deaths) Neonatal deaths Total Stillbirths (Fetal
deaths) Neonatal deaths Total
PSANZ PDC n % n % n % n % n % n %
8. FETAL GROWTH RESTRICTION(FGR)
53 7.2 1 0.4 54 5.5 55 7.8 10 4.5 65 7.0
8.1 Evidence of uteroplacental insufficiency
28 3.8 0 0.0 28 2.9 25 3.5 3 1.3 28 3.0
8.2 With chronic villitis 4 0.5 0 0.0 4 0.4 2 0.3 0 0.0 2 0.2
8.3 No placental pathology 13 1.8 0 0.0 13 1.3 10 1.4 2 0.9 12 1.3
8.4 No examination of placenta 4 0.5 0 0.0 4 0.4 2 0.3 3 1.3 5 0.5
8.8 Other specified placental pathology
4 0.5 0 0.0 4 0.4 10 1.4 1 0.4 11 1.2
8.9 Unspecified or not known whether placenta examined
0 0.0 1 0.4 1 0.1 6 0.9 1 0.4 7 0.8
9. SPONTANEOUS PRETERM 54 7.3 97 41.3 151 15.5 39 5.5 63 28.3 102 11.0
9.10 Spontaneous preterm with intact membranes or membrane rupture <24hrs before delivery
9.11 Chorioamnionitis (placental histology)
12 1.6 18 7.7 30 3.1 5 0.7 22 9.9 27 2.9
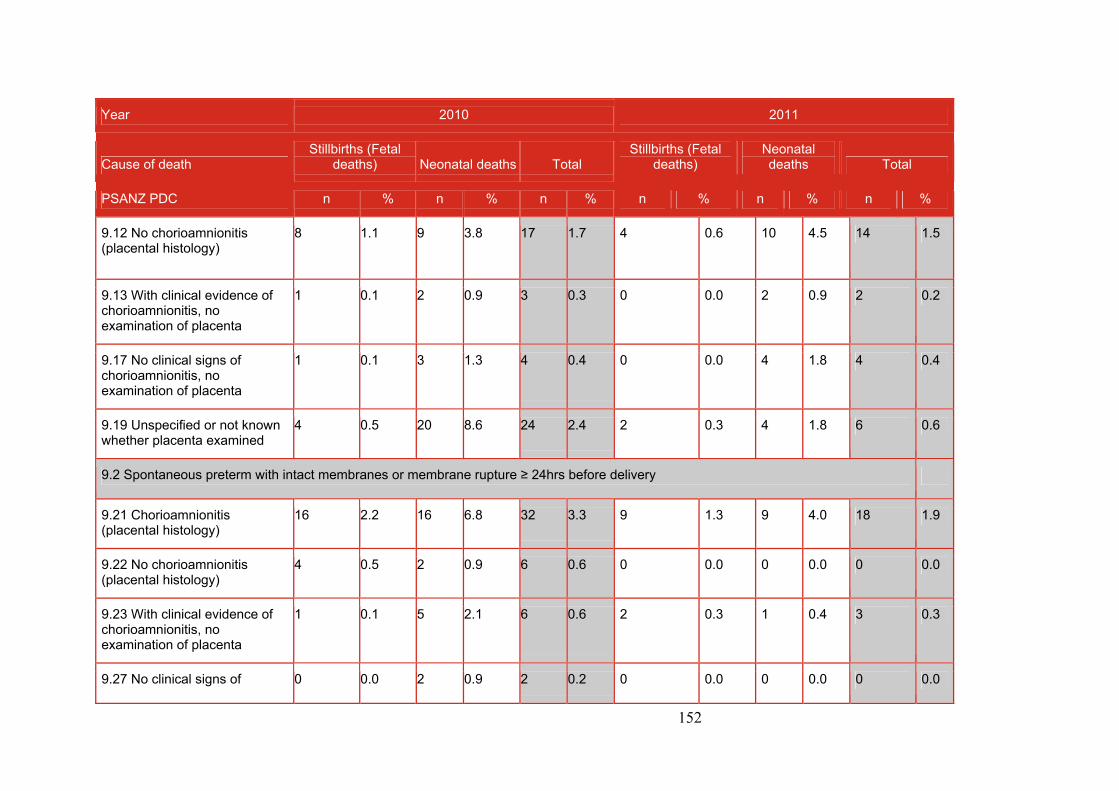
152
Year 2010 2011
Cause of death Stillbirths (Fetal
deaths) Neonatal deaths Total Stillbirths (Fetal
deaths) Neonatal deaths Total
PSANZ PDC n % n % n % n % n % n %
9.12 No chorioamnionitis (placental histology)
8 1.1 9 3.8 17 1.7 4 0.6 10 4.5 14 1.5
9.13 With clinical evidence of chorioamnionitis, no examination of placenta
1 0.1 2 0.9 3 0.3 0 0.0 2 0.9 2 0.2
9.17 No clinical signs of chorioamnionitis, no examination of placenta
1 0.1 3 1.3 4 0.4 0 0.0 4 1.8 4 0.4
9.19 Unspecified or not known whether placenta examined
4 0.5 20 8.6 24 2.4 2 0.3 4 1.8 6 0.6
9.2 Spontaneous preterm with intact membranes or membrane rupture ≥ 24hrs before delivery
9.21 Chorioamnionitis (placental histology)
16 2.2 16 6.8 32 3.3 9 1.3 9 4.0 18 1.9
9.22 No chorioamnionitis (placental histology)
4 0.5 2 0.9 6 0.6 0 0.0 0 0.0 0 0.0
9.23 With clinical evidence of chorioamnionitis, no examination of placenta
1 0.1 5 2.1 6 0.6 2 0.3 1 0.4 3 0.3
9.27 No clinical signs of 0 0.0 2 0.9 2 0.2 0 0.0 0 0.0 0 0.0
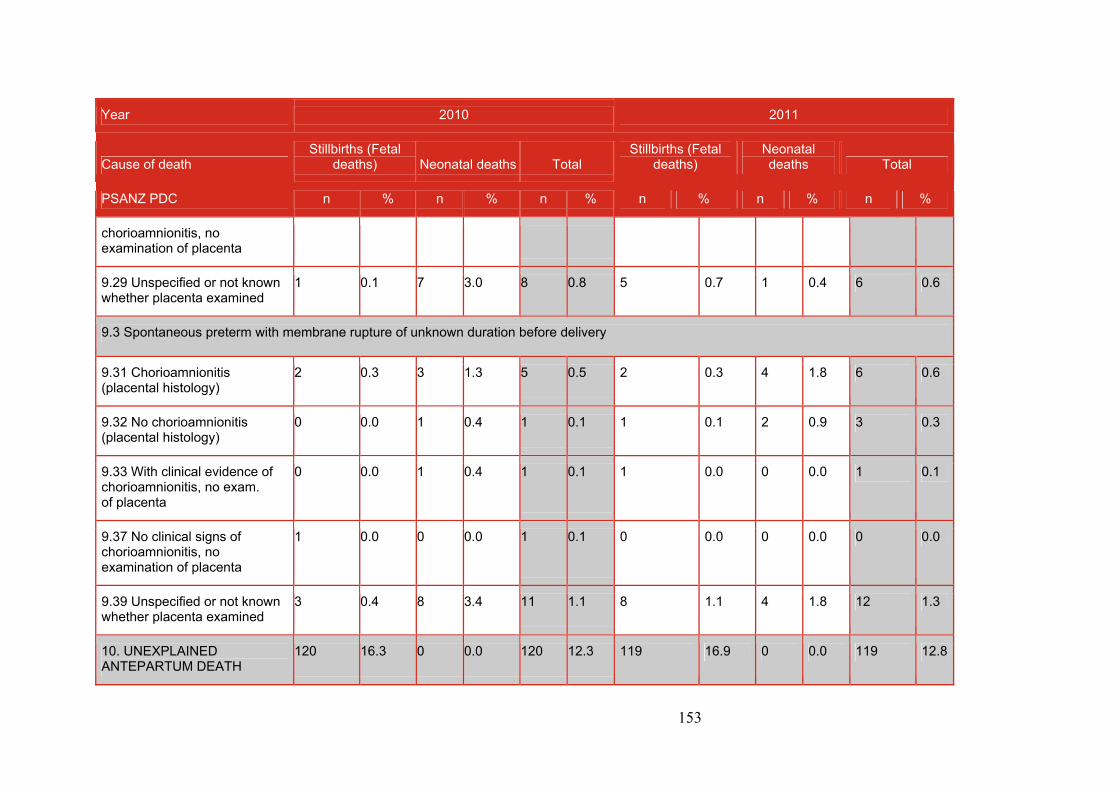
153
Year 2010 2011
Cause of death Stillbirths (Fetal
deaths) Neonatal deaths Total Stillbirths (Fetal
deaths) Neonatal deaths Total
PSANZ PDC n % n % n % n % n % n %
chorioamnionitis, no examination of placenta
9.29 Unspecified or not known whether placenta examined
1 0.1 7 3.0 8 0.8 5 0.7 1 0.4 6 0.6
9.3 Spontaneous preterm with membrane rupture of unknown duration before delivery
9.31 Chorioamnionitis (placental histology)
2 0.3 3 1.3 5 0.5 2 0.3 4 1.8 6 0.6
9.32 No chorioamnionitis (placental histology)
0 0.0 1 0.4 1 0.1 1 0.1 2 0.9 3 0.3
9.33 With clinical evidence of chorioamnionitis, no exam. of placenta
0 0.0 1 0.4 1 0.1 1 0.0 0 0.0 1 0.1
9.37 No clinical signs of chorioamnionitis, no examination of placenta
1 0.0 0 0.0 1 0.1 0 0.0 0 0.0 0 0.0
9.39 Unspecified or not known whether placenta examined
3 0.4 8 3.4 11 1.1 8 1.1 4 1.8 12 1.3
10. UNEXPLAINED ANTEPARTUM DEATH
120 16.3 0 0.0 120 12.3 119 16.9 0 0.0 119 12.8
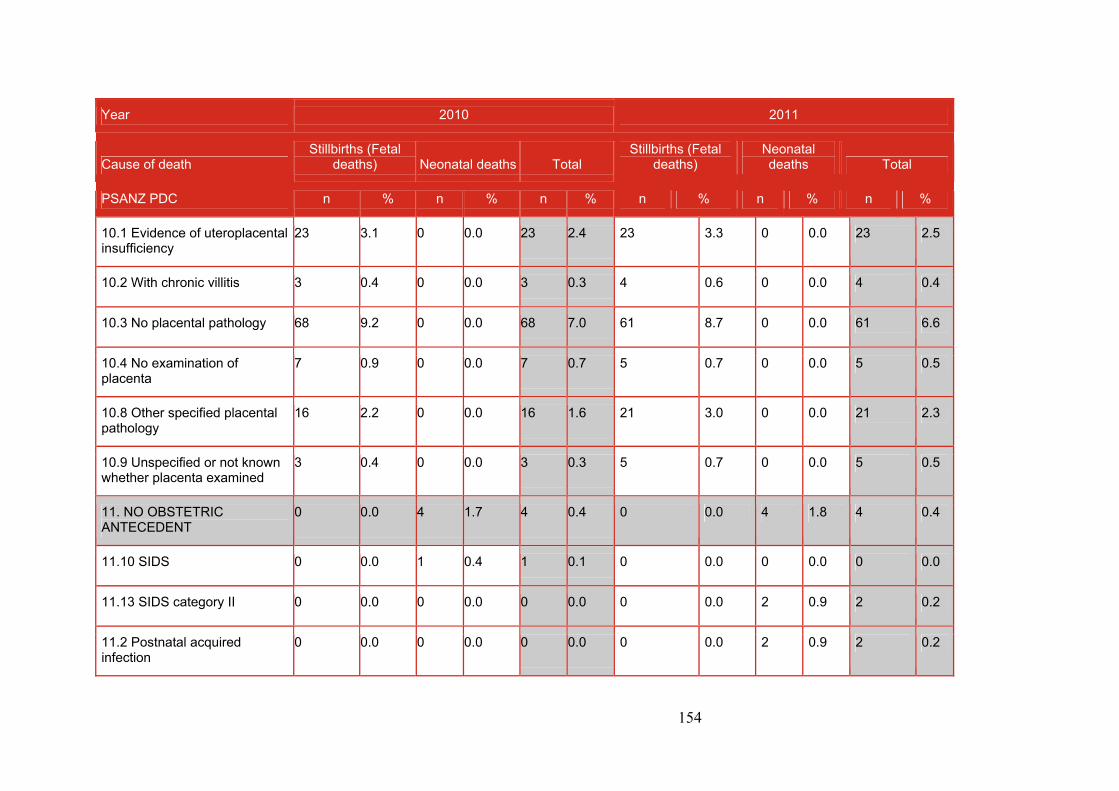
154
Year 2010 2011
Cause of death Stillbirths (Fetal
deaths) Neonatal deaths Total Stillbirths (Fetal
deaths) Neonatal deaths Total
PSANZ PDC n % n % n % n % n % n %
10.1 Evidence of uteroplacental insufficiency
23 3.1 0 0.0 23 2.4 23 3.3 0 0.0 23 2.5
10.2 With chronic villitis 3 0.4 0 0.0 3 0.3 4 0.6 0 0.0 4 0.4
10.3 No placental pathology 68 9.2 0 0.0 68 7.0 61 8.7 0 0.0 61 6.6
10.4 No examination of placenta
7 0.9 0 0.0 7 0.7 5 0.7 0 0.0 5 0.5
10.8 Other specified placental pathology
16 2.2 0 0.0 16 1.6 21 3.0 0 0.0 21 2.3
10.9 Unspecified or not known whether placenta examined
3 0.4 0 0.0 3 0.3 5 0.7 0 0.0 5 0.5
11. NO OBSTETRIC ANTECEDENT
0 0.0 4 1.7 4 0.4 0 0.0 4 1.8 4 0.4
11.10 SIDS 0 0.0 1 0.4 1 0.1 0 0.0 0 0.0 0 0.0
11.13 SIDS category II 0 0.0 0 0.0 0 0.0 0 0.0 2 0.9 2 0.2
11.2 Postnatal acquired infection
0 0.0 0 0.0 0 0.0 0 0.0 2 0.9 2 0.2
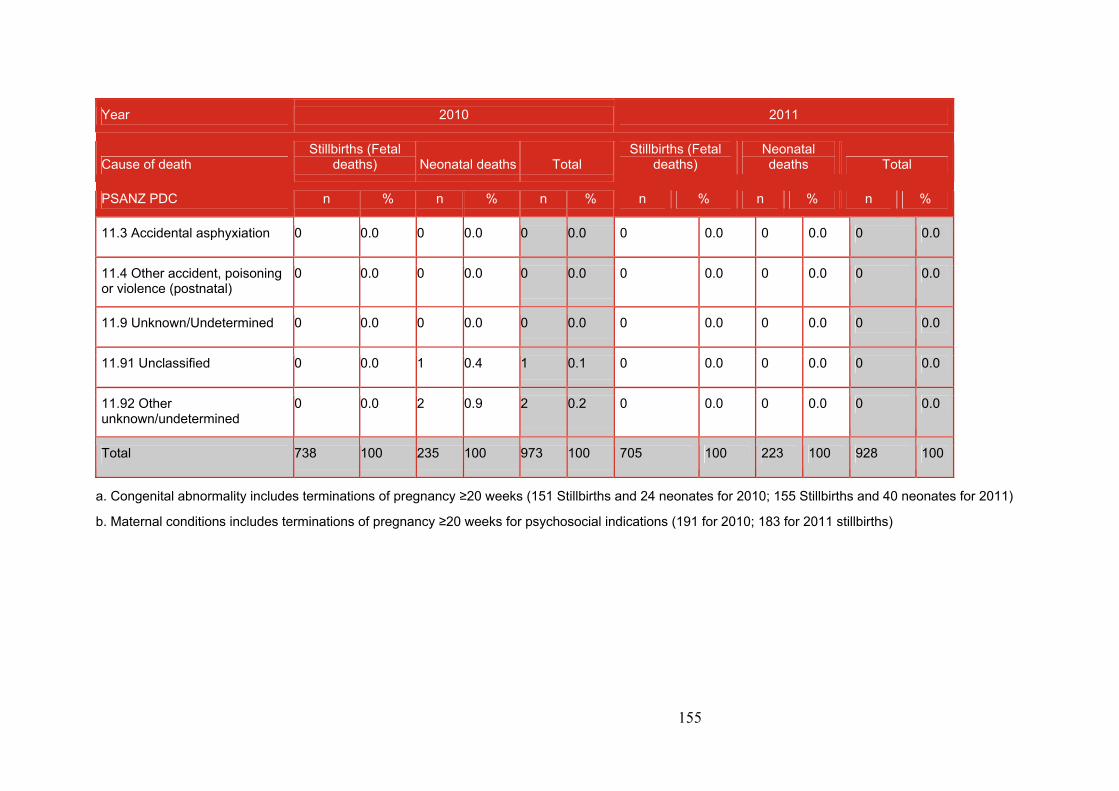
155
Year 2010 2011
Cause of death Stillbirths (Fetal
deaths) Neonatal deaths Total Stillbirths (Fetal
deaths) Neonatal deaths Total
PSANZ PDC n % n % n % n % n % n %
11.3 Accidental asphyxiation 0 0.0 0 0.0 0 0.0 0 0.0 0 0.0 0 0.0
11.4 Other accident, poisoning or violence (postnatal)
0 0.0 0 0.0 0 0.0 0 0.0 0 0.0 0 0.0
11.9 Unknown/Undetermined 0 0.0 0 0.0 0 0.0 0 0.0 0 0.0 0 0.0
11.91 Unclassified 0 0.0 1 0.4 1 0.1 0 0.0 0 0.0 0 0.0
11.92 Other unknown/undetermined
0 0.0 2 0.9 2 0.2 0 0.0 0 0.0 0 0.0
Total 738 100 235 100 973 100 705 100 223 100 928 100
a. Congenital abnormality includes terminations of pregnancy ≥20 weeks (151 Stillbirths and 24 neonates for 2010; 155 Stillbirths and 40 neonates for 2011)
b. Maternal conditions includes terminations of pregnancy ≥20 weeks for psychosocial indications (191 for 2010; 183 for 2011 stillbirths)
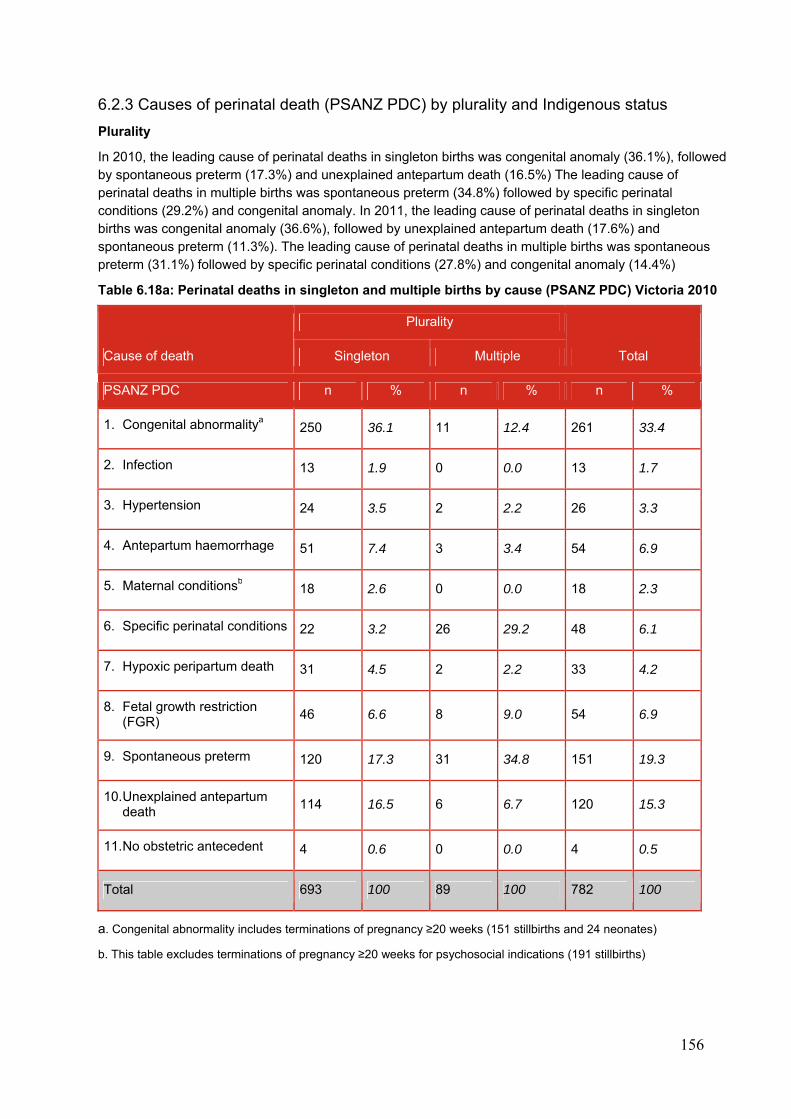
156
6.2.3 Causes of perinatal death (PSANZ PDC) by plurality and Indigenous status
Plurality
In 2010, the leading cause of perinatal deaths in singleton births was congenital anomaly (36.1%), followed by spontaneous preterm (17.3%) and unexplained antepartum death (16.5%) The leading cause of perinatal deaths in multiple births was spontaneous preterm (34.8%) followed by specific perinatal conditions (29.2%) and congenital anomaly. In 2011, the leading cause of perinatal deaths in singleton births was congenital anomaly (36.6%), followed by unexplained antepartum death (17.6%) and spontaneous preterm (11.3%). The leading cause of perinatal deaths in multiple births was spontaneous preterm (31.1%) followed by specific perinatal conditions (27.8%) and congenital anomaly (14.4%)
Table 6.18a: Perinatal deaths in singleton and multiple births by cause (PSANZ PDC) Victoria 2010
Cause of death
Plurality
Total Singleton Multiple
PSANZ PDC n % n % n %
1. Congenital abnormalitya 250 36.1 11 12.4 261 33.4
2. Infection 13 1.9 0 0.0 13 1.7
3. Hypertension 24 3.5 2 2.2 26 3.3
4. Antepartum haemorrhage 51 7.4 3 3.4 54 6.9
5. Maternal conditionsb 18 2.6 0 0.0 18 2.3
6. Specific perinatal conditions 22 3.2 26 29.2 48 6.1
7. Hypoxic peripartum death 31 4.5 2 2.2 33 4.2
8. Fetal growth restriction (FGR)
46 6.6 8 9.0 54 6.9
9. Spontaneous preterm 120 17.3 31 34.8 151 19.3
10. Unexplained antepartum death
114 16.5 6 6.7 120 15.3
11. No obstetric antecedent 4 0.6 0 0.0 4 0.5
Total 693 100 89 100 782 100
a. Congenital abnormality includes terminations of pregnancy ≥20 weeks (151 stillbirths and 24 neonates)
b. This table excludes terminations of pregnancy ≥20 weeks for psychosocial indications (191 stillbirths)
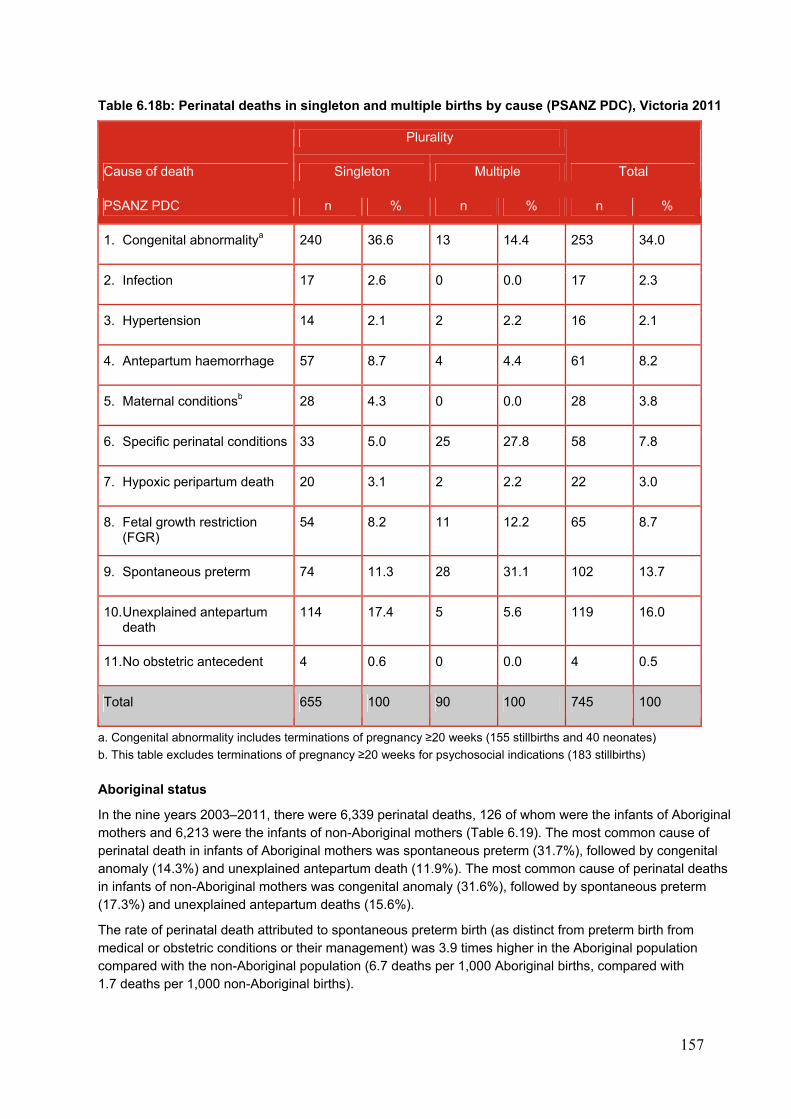
157
Table 6.18b: Perinatal deaths in singleton and multiple births by cause (PSANZ PDC), Victoria 2011
Cause of death
Plurality
Total Singleton Multiple
PSANZ PDC n % n % n %
1. Congenital abnormalitya 240 36.6 13 14.4 253 34.0
2. Infection 17 2.6 0 0.0 17 2.3
3. Hypertension 14 2.1 2 2.2 16 2.1
4. Antepartum haemorrhage 57 8.7 4 4.4 61 8.2
5. Maternal conditionsb 28 4.3 0 0.0 28 3.8
6. Specific perinatal conditions 33 5.0 25 27.8 58 7.8
7. Hypoxic peripartum death 20 3.1 2 2.2 22 3.0
8. Fetal growth restriction (FGR)
54 8.2 11 12.2 65 8.7
9. Spontaneous preterm 74 11.3 28 31.1 102 13.7
10. Unexplained antepartum death
114 17.4 5 5.6 119 16.0
11. No obstetric antecedent 4 0.6 0 0.0 4 0.5
Total 655 100 90 100 745 100
a. Congenital abnormality includes terminations of pregnancy ≥20 weeks (155 stillbirths and 40 neonates)
b. This table excludes terminations of pregnancy ≥20 weeks for psychosocial indications (183 stillbirths)
Aboriginal status
In the nine years 2003–2011, there were 6,339 perinatal deaths, 126 of whom were the infants of Aboriginal mothers and 6,213 were the infants of non-Aboriginal mothers (Table 6.19). The most common cause of perinatal death in infants of Aboriginal mothers was spontaneous preterm (31.7%), followed by congenital anomaly (14.3%) and unexplained antepartum death (11.9%). The most common cause of perinatal deaths in infants of non-Aboriginal mothers was congenital anomaly (31.6%), followed by spontaneous preterm (17.3%) and unexplained antepartum deaths (15.6%).
The rate of perinatal death attributed to spontaneous preterm birth (as distinct from preterm birth from medical or obstetric conditions or their management) was 3.9 times higher in the Aboriginal population compared with the non-Aboriginal population (6.7 deaths per 1,000 Aboriginal births, compared with 1.7 deaths per 1,000 non-Aboriginal births).
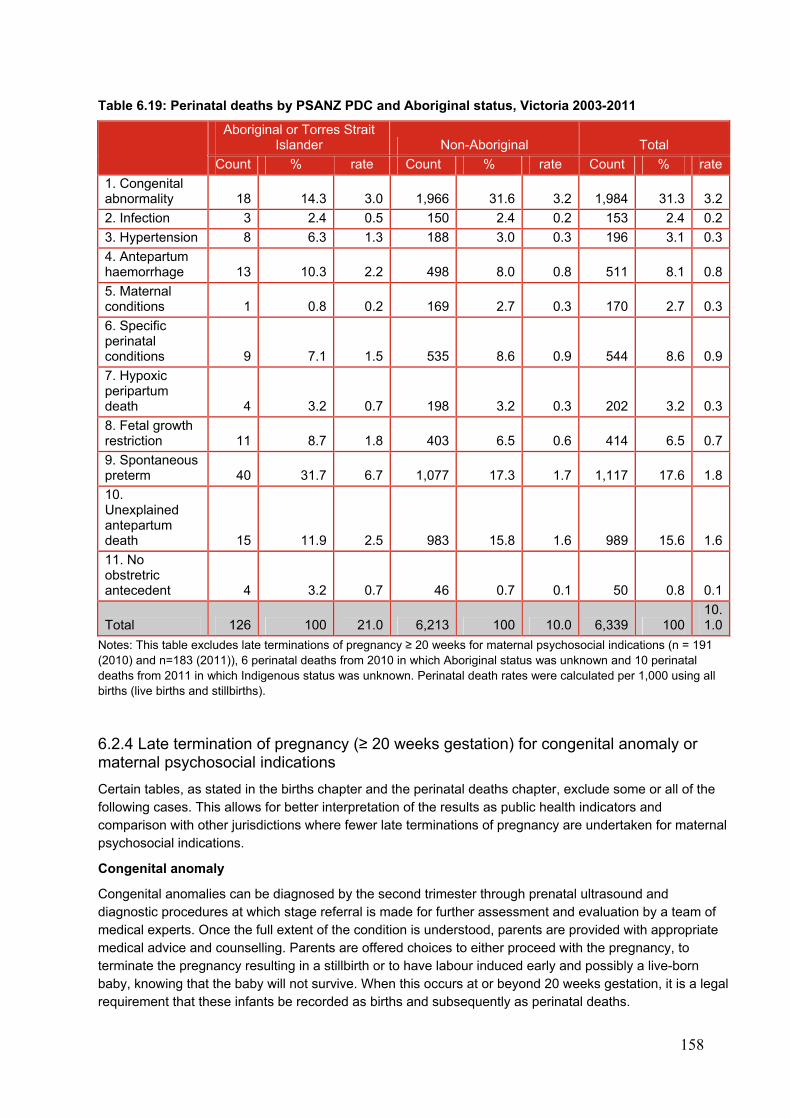
158
Table 6.19: Perinatal deaths by PSANZ PDC and Aboriginal status, Victoria 2003-2011
Aboriginal or Torres Strait Islander Non-Aboriginal Total
Count % rate Count % rate Count % rate
1. Congenital abnormality 18 14.3 3.0 1,966 31.6 3.2 1,984 31.3 3.2
2. Infection 3 2.4 0.5 150 2.4 0.2 153 2.4 0.2
3. Hypertension 8 6.3 1.3 188 3.0 0.3 196 3.1 0.3
4. Antepartum haemorrhage 13 10.3 2.2 498 8.0 0.8 511 8.1 0.8
5. Maternal conditions 1 0.8 0.2 169 2.7 0.3 170 2.7 0.3
6. Specific perinatal conditions 9 7.1 1.5 535 8.6 0.9 544 8.6 0.9
7. Hypoxic peripartum death 4 3.2 0.7 198 3.2 0.3 202 3.2 0.3
8. Fetal growth restriction 11 8.7 1.8 403 6.5 0.6 414 6.5 0.7
9. Spontaneous preterm 40 31.7 6.7 1,077 17.3 1.7 1,117 17.6 1.8
10. Unexplained antepartum death 15 11.9 2.5 983 15.8 1.6 989 15.6 1.6
11. No obstretric antecedent 4 3.2 0.7 46 0.7 0.1 50 0.8 0.1
Total 126 100 21.0 6,213 100 10.0 6,339 10010.1.0
Notes: This table excludes late terminations of pregnancy ≥ 20 weeks for maternal psychosocial indications (n = 191 (2010) and n=183 (2011)), 6 perinatal deaths from 2010 in which Aboriginal status was unknown and 10 perinatal deaths from 2011 in which Indigenous status was unknown. Perinatal death rates were calculated per 1,000 using all births (live births and stillbirths).
6.2.4 Late termination of pregnancy (≥ 20 weeks gestation) for congenital anomaly or maternal psychosocial indications
Certain tables, as stated in the births chapter and the perinatal deaths chapter, exclude some or all of the following cases. This allows for better interpretation of the results as public health indicators and comparison with other jurisdictions where fewer late terminations of pregnancy are undertaken for maternal psychosocial indications.
Congenital anomaly
Congenital anomalies can be diagnosed by the second trimester through prenatal ultrasound and diagnostic procedures at which stage referral is made for further assessment and evaluation by a team of medical experts. Once the full extent of the condition is understood, parents are provided with appropriate medical advice and counselling. Parents are offered choices to either proceed with the pregnancy, to terminate the pregnancy resulting in a stillbirth or to have labour induced early and possibly a live-born baby, knowing that the baby will not survive. When this occurs at or beyond 20 weeks gestation, it is a legal requirement that these infants be recorded as births and subsequently as perinatal deaths.
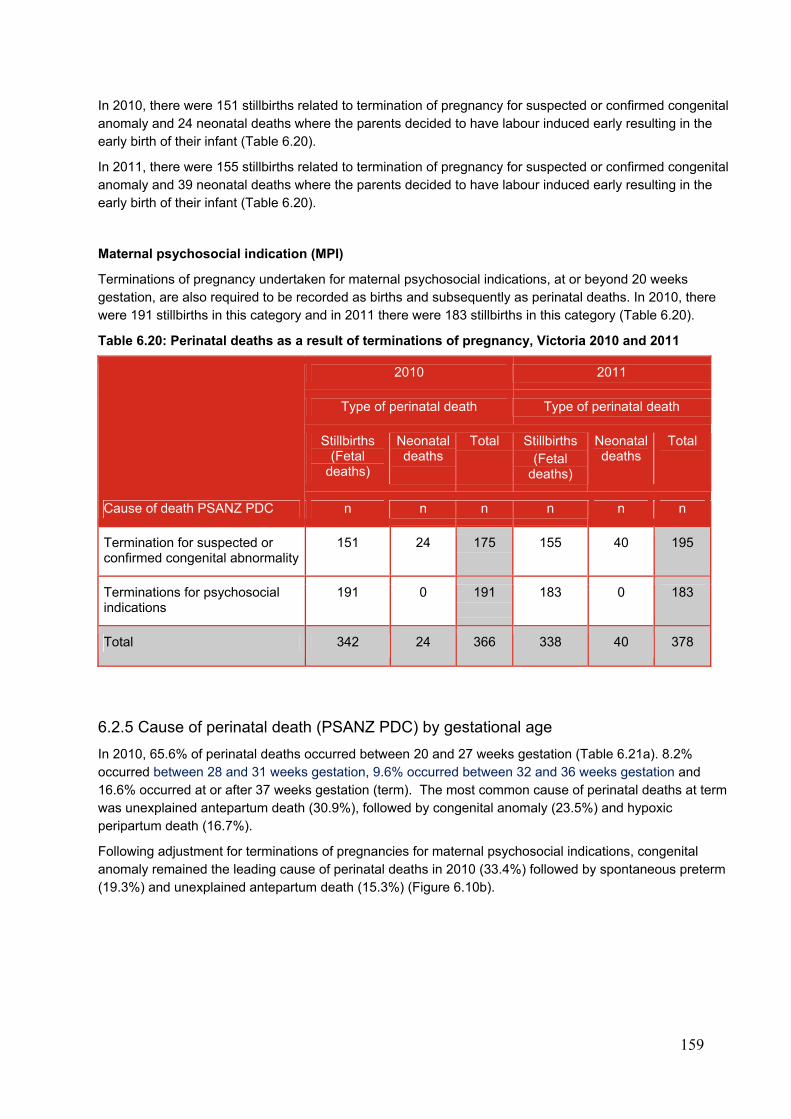
159
In 2010, there were 151 stillbirths related to termination of pregnancy for suspected or confirmed congenital anomaly and 24 neonatal deaths where the parents decided to have labour induced early resulting in the early birth of their infant (Table 6.20).
In 2011, there were 155 stillbirths related to termination of pregnancy for suspected or confirmed congenital anomaly and 39 neonatal deaths where the parents decided to have labour induced early resulting in the early birth of their infant (Table 6.20).
Maternal psychosocial indication (MPI)
Terminations of pregnancy undertaken for maternal psychosocial indications, at or beyond 20 weeks gestation, are also required to be recorded as births and subsequently as perinatal deaths. In 2010, there were 191 stillbirths in this category and in 2011 there were 183 stillbirths in this category (Table 6.20).
Table 6.20: Perinatal deaths as a result of terminations of pregnancy, Victoria 2010 and 2011
Cause of death PSANZ PDC
2010 2011
Type of perinatal death Type of perinatal death
Stillbirths (Fetal
deaths)
Neonatal deaths
Total Stillbirths (Fetal
deaths)
Neonatal deaths
Total
n n n n n n
Termination for suspected or confirmed congenital abnormality
151 24 175 155 40 195
Terminations for psychosocial indications
191 0 191 183 0 183
Total 342 24 366 338 40 378
6.2.5 Cause of perinatal death (PSANZ PDC) by gestational age
In 2010, 65.6% of perinatal deaths occurred between 20 and 27 weeks gestation (Table 6.21a). 8.2% occurred between 28 and 31 weeks gestation, 9.6% occurred between 32 and 36 weeks gestation and 16.6% occurred at or after 37 weeks gestation (term). The most common cause of perinatal deaths at term was unexplained antepartum death (30.9%), followed by congenital anomaly (23.5%) and hypoxic peripartum death (16.7%).
Following adjustment for terminations of pregnancies for maternal psychosocial indications, congenital anomaly remained the leading cause of perinatal deaths in 2010 (33.4%) followed by spontaneous preterm (19.3%) and unexplained antepartum death (15.3%) (Figure 6.10b).
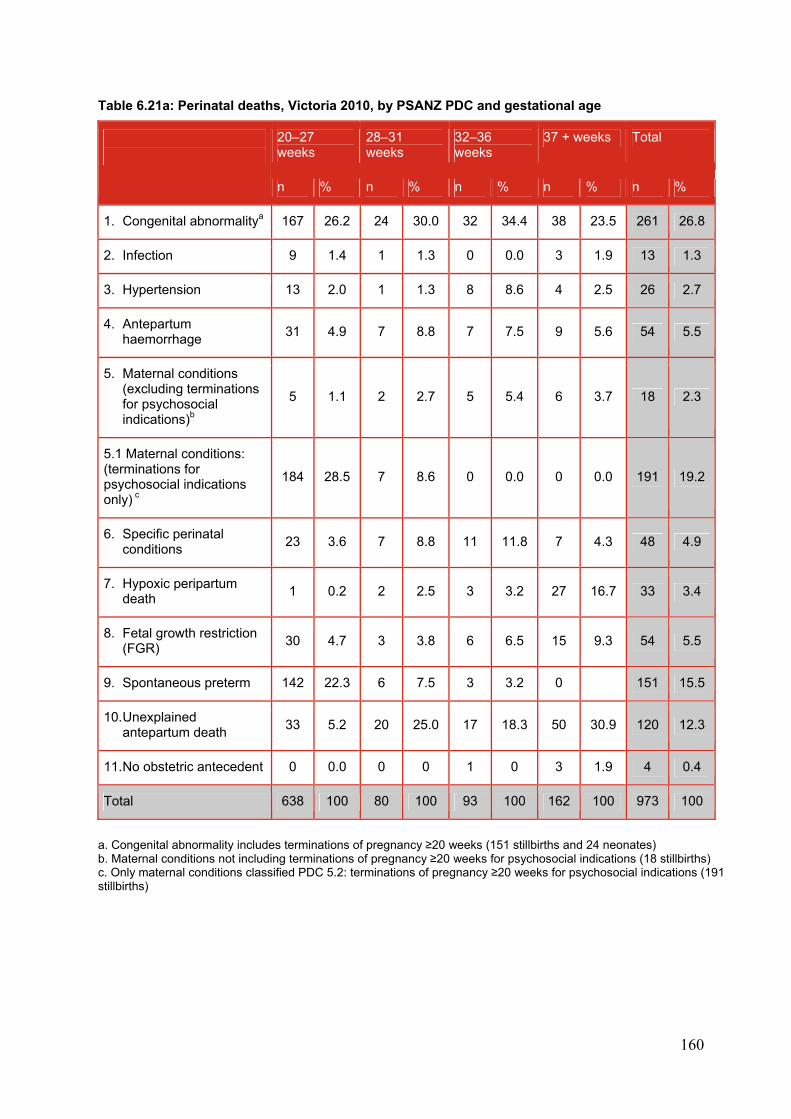
160
Table 6.21a: Perinatal deaths, Victoria 2010, by PSANZ PDC and gestational age
20–27 weeks
28–31 weeks
32–36 weeks
37 + weeks Total
n % n % n % n % n %
1. Congenital abnormalitya 167 26.2 24 30.0 32 34.4 38 23.5 261 26.8
2. Infection 9 1.4 1 1.3 0 0.0 3 1.9 13 1.3
3. Hypertension 13 2.0 1 1.3 8 8.6 4 2.5 26 2.7
4. Antepartum haemorrhage
31 4.9 7 8.8 7 7.5 9 5.6 54 5.5
5. Maternal conditions (excluding terminations for psychosocial indications)b
5 1.1 2 2.7 5 5.4 6 3.7 18 2.3
5.1 Maternal conditions: (terminations for psychosocial indications only) c
184 28.5 7 8.6 0 0.0 0 0.0 191 19.2
6. Specific perinatal conditions
23 3.6 7 8.8 11 11.8 7 4.3 48 4.9
7. Hypoxic peripartum death
1 0.2 2 2.5 3 3.2 27 16.7 33 3.4
8. Fetal growth restriction (FGR)
30 4.7 3 3.8 6 6.5 15 9.3 54 5.5
9. Spontaneous preterm 142 22.3 6 7.5 3 3.2 0 151 15.5
10. Unexplained antepartum death
33 5.2 20 25.0 17 18.3 50 30.9 120 12.3
11. No obstetric antecedent 0 0.0 0 0 1 0 3 1.9 4 0.4
Total 638 100 80 100 93 100 162 100 973 100
a. Congenital abnormality includes terminations of pregnancy ≥20 weeks (151 stillbirths and 24 neonates) b. Maternal conditions not including terminations of pregnancy ≥20 weeks for psychosocial indications (18 stillbirths) c. Only maternal conditions classified PDC 5.2: terminations of pregnancy ≥20 weeks for psychosocial indications (191 stillbirths)

161
Figure 6.10a: Causes of perinatal death (unadjusted), PSANZ PDC, Victoria 2010
Figure 6.10b: Causes of perinatal death (adjusted), PSANZ PDC, Victoria 2010
In 2011, 68.3% of perinatal deaths occurred between 20 and 27 weeks gestation (Table 6.21b), 6.7% occurred between 28 and 31 weeks gestation, 8.6% occurred between 32 and 36 weeks gestation and 16.4% occurred at or after 37 weeks gestation (term). The commonest cause of perinatal deaths at term was unexplained antepartum death (34.2%), followed by congenital anomaly (17.8%) and hypoxic peripartum death (12.5%). Following adjustment for terminations of pregnancies for maternal psychosocial indications, congenital anomaly remained the leading cause of perinatal deaths in 2011 (34.0%), followed by unexplained antepartum death (16.1%) and spontaneous preterm (13.7%) (Figure 6.10d).
26.8%
1.3%2.7%5.5%
21.5%4.9%
3.4%5.5%
15.5%
12.3%0.4% Congenital abnormalityInfectionHypertensionAntepartum haemorrhageMaternal conditionsSpecific perinatal conditionsHypoxic peripartum deathFetal growth restriction (FGR)Spontaneous pretermUnexplained antepartum deathNo obstetric antecedent
33.4%
1.7%3.3%
6.9%2.3%6.1%4.2%
6.9%
19.3%
15.3%0.5% Congenital abnormality
Infection
Hypertension
Antepartum haemorrhage
Maternal conditions
Specific perinatal conditions
Hypoxic peripartum death
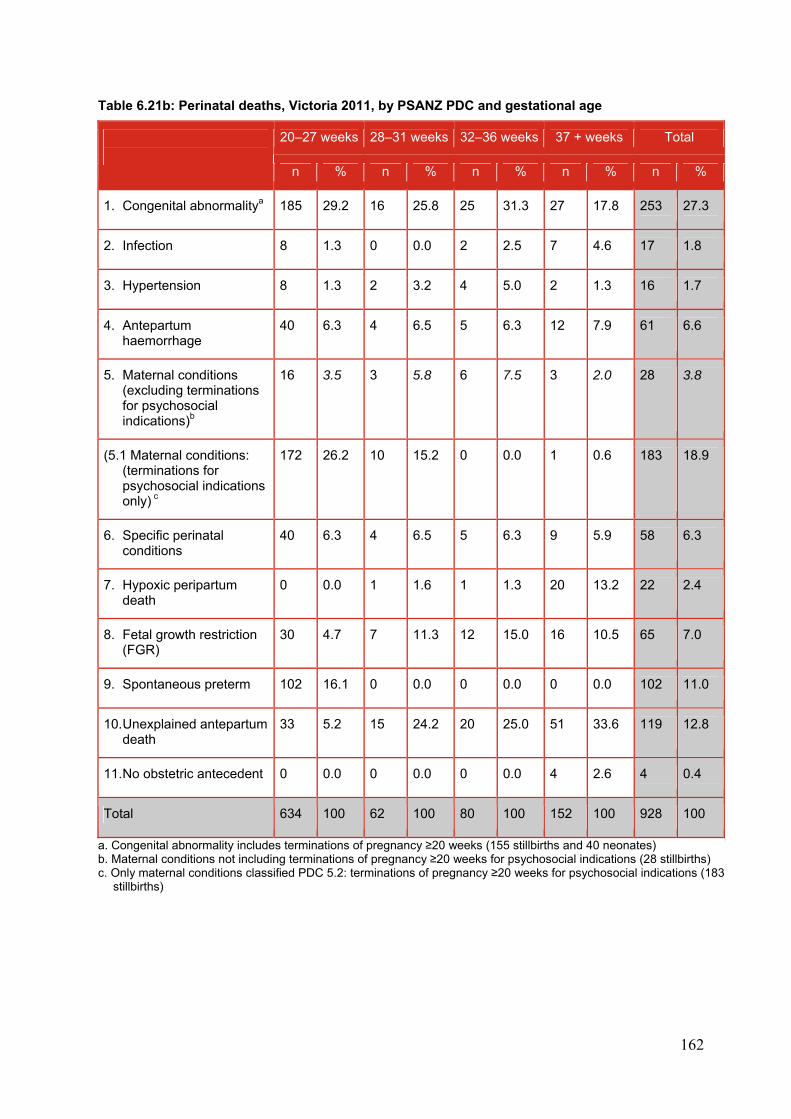
162
Table 6.21b: Perinatal deaths, Victoria 2011, by PSANZ PDC and gestational age
20–27 weeks 28–31 weeks 32–36 weeks 37 + weeks Total
n % n % n % n % n %
1. Congenital abnormalitya 185 29.2 16 25.8 25 31.3 27 17.8 253 27.3
2. Infection 8 1.3 0 0.0 2 2.5 7 4.6 17 1.8
3. Hypertension 8 1.3 2 3.2 4 5.0 2 1.3 16 1.7
4. Antepartum haemorrhage
40 6.3 4 6.5 5 6.3 12 7.9 61 6.6
5. Maternal conditions (excluding terminations for psychosocial indications)b
16 3.5 3 5.8 6 7.5 3 2.0 28 3.8
(5.1 Maternal conditions: (terminations for psychosocial indications only) c
172 26.2 10 15.2 0 0.0 1 0.6 183 18.9
6. Specific perinatal conditions
40 6.3 4 6.5 5 6.3 9 5.9 58 6.3
7. Hypoxic peripartum death
0 0.0 1 1.6 1 1.3 20 13.2 22 2.4
8. Fetal growth restriction (FGR)
30 4.7 7 11.3 12 15.0 16 10.5 65 7.0
9. Spontaneous preterm 102 16.1 0 0.0 0 0.0 0 0.0 102 11.0
10. Unexplained antepartum death
33 5.2 15 24.2 20 25.0 51 33.6 119 12.8
11. No obstetric antecedent 0 0.0 0 0.0 0 0.0 4 2.6 4 0.4
Total 634 100 62 100 80 100 152 100 928 100
a. Congenital abnormality includes terminations of pregnancy ≥20 weeks (155 stillbirths and 40 neonates) b. Maternal conditions not including terminations of pregnancy ≥20 weeks for psychosocial indications (28 stillbirths) c. Only maternal conditions classified PDC 5.2: terminations of pregnancy ≥20 weeks for psychosocial indications (183
stillbirths)
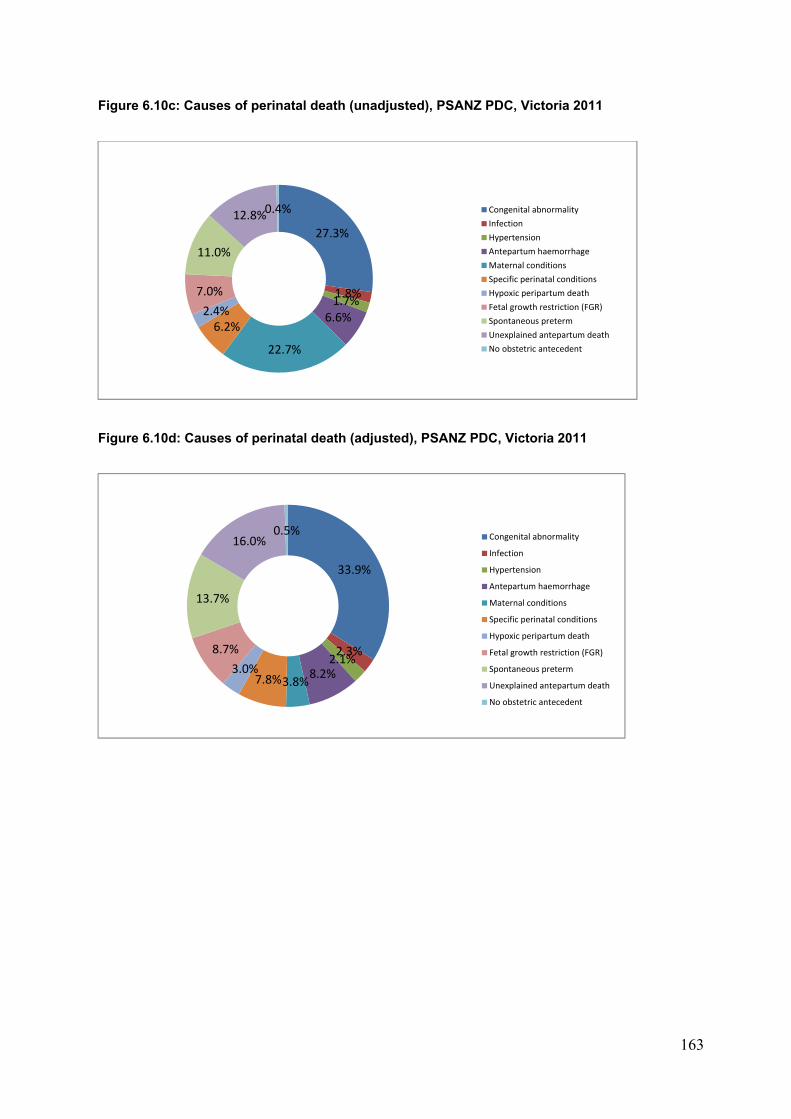
163
Figure 6.10c: Causes of perinatal death (unadjusted), PSANZ PDC, Victoria 2011
Figure 6.10d: Causes of perinatal death (adjusted), PSANZ PDC, Victoria 2011
27.3%
1.8%1.7%
6.6%
22.7%
6.2%2.4%
7.0%
11.0%
12.8%0.4%Congenital abnormality
Infection
Hypertension
Antepartum haemorrhage
Maternal conditions
Specific perinatal conditions
Hypoxic peripartum death
Fetal growth restriction (FGR)
Spontaneous preterm
Unexplained antepartum death
No obstetric antecedent
33.9%
2.3%2.1%
8.2%3.8%7.8%
3.0%
8.7%
13.7%
16.0%0.5%
Congenital abnormality
Infection
Hypertension
Antepartum haemorrhage
Maternal conditions
Specific perinatal conditions
Hypoxic peripartum death
Fetal growth restriction (FGR)
Spontaneous preterm
Unexplained antepartum death
No obstetric antecedent
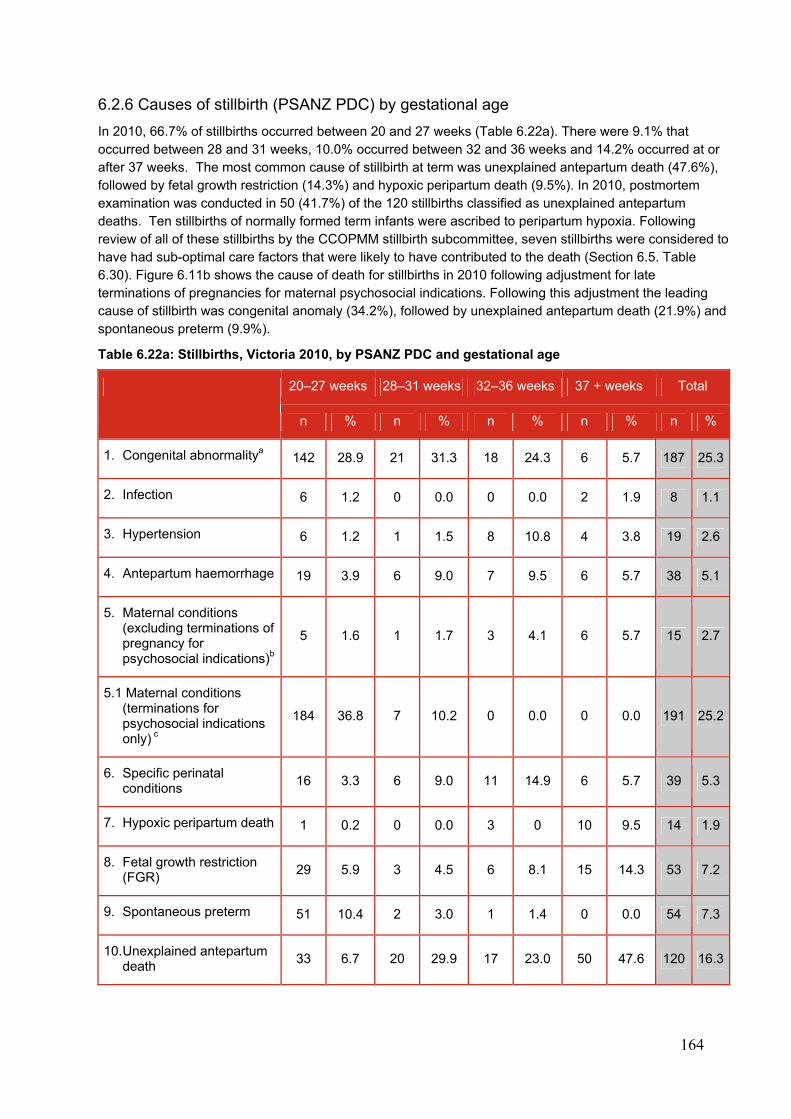
164
6.2.6 Causes of stillbirth (PSANZ PDC) by gestational age
In 2010, 66.7% of stillbirths occurred between 20 and 27 weeks (Table 6.22a). There were 9.1% that occurred between 28 and 31 weeks, 10.0% occurred between 32 and 36 weeks and 14.2% occurred at or after 37 weeks. The most common cause of stillbirth at term was unexplained antepartum death (47.6%), followed by fetal growth restriction (14.3%) and hypoxic peripartum death (9.5%). In 2010, postmortem examination was conducted in 50 (41.7%) of the 120 stillbirths classified as unexplained antepartum deaths. Ten stillbirths of normally formed term infants were ascribed to peripartum hypoxia. Following review of all of these stillbirths by the CCOPMM stillbirth subcommittee, seven stillbirths were considered to have had sub-optimal care factors that were likely to have contributed to the death (Section 6.5. Table 6.30). Figure 6.11b shows the cause of death for stillbirths in 2010 following adjustment for late terminations of pregnancies for maternal psychosocial indications. Following this adjustment the leading cause of stillbirth was congenital anomaly (34.2%), followed by unexplained antepartum death (21.9%) and spontaneous preterm (9.9%).
Table 6.22a: Stillbirths, Victoria 2010, by PSANZ PDC and gestational age
20–27 weeks 28–31 weeks 32–36 weeks 37 + weeks Total
n % n % n % n % n %
1. Congenital abnormalitya 142 28.9 21 31.3 18 24.3 6 5.7 187 25.3
2. Infection 6 1.2 0 0.0 0 0.0 2 1.9 8 1.1
3. Hypertension 6 1.2 1 1.5 8 10.8 4 3.8 19 2.6
4. Antepartum haemorrhage 19 3.9 6 9.0 7 9.5 6 5.7 38 5.1
5. Maternal conditions (excluding terminations of pregnancy for psychosocial indications)b
5 1.6 1 1.7 3 4.1 6 5.7 15 2.7
5.1 Maternal conditions (terminations for psychosocial indications only) c
184 36.8 7 10.2 0 0.0 0 0.0 191 25.2
6. Specific perinatal conditions
16 3.3 6 9.0 11 14.9 6 5.7 39 5.3
7. Hypoxic peripartum death 1 0.2 0 0.0 3 0 10 9.5 14 1.9
8. Fetal growth restriction (FGR)
29 5.9 3 4.5 6 8.1 15 14.3 53 7.2
9. Spontaneous preterm 51 10.4 2 3.0 1 1.4 0 0.0 54 7.3
10. Unexplained antepartum death
33 6.7 20 29.9 17 23.0 50 47.6 120 16.3
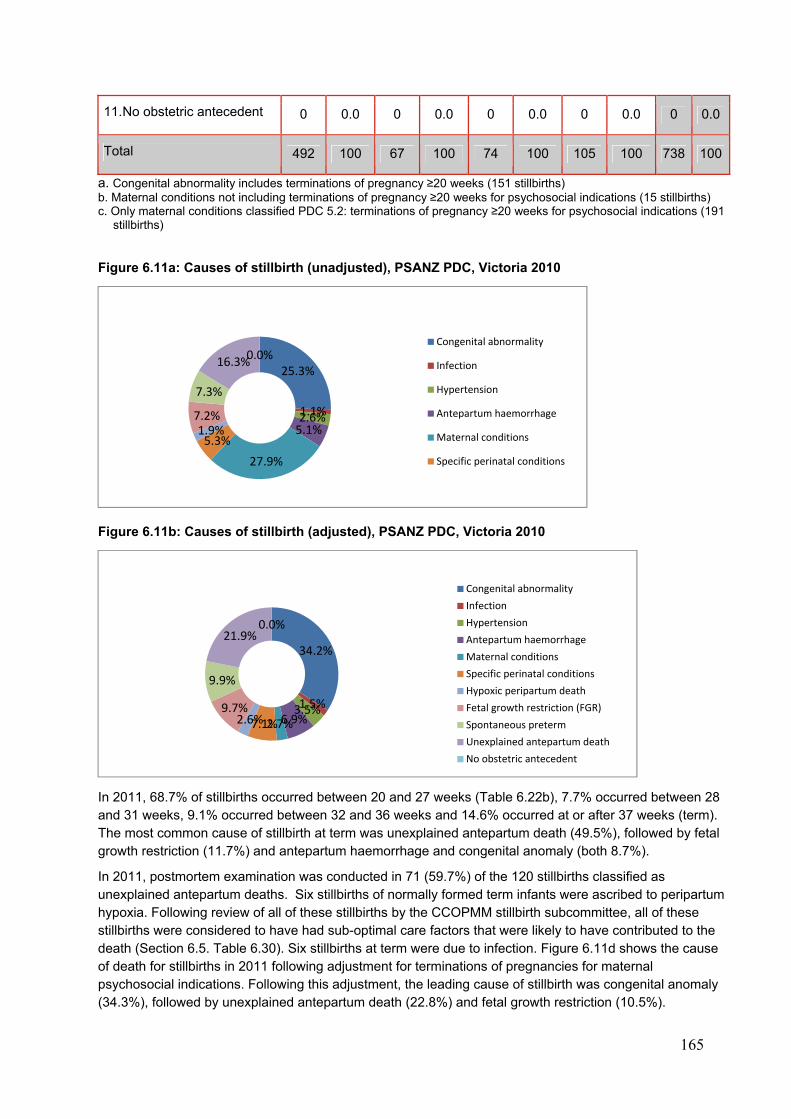
165
11. No obstetric antecedent 0 0.0 0 0.0 0 0.0 0 0.0 0 0.0
Total 492 100 67 100 74 100 105 100 738 100
a. Congenital abnormality includes terminations of pregnancy ≥20 weeks (151 stillbirths) b. Maternal conditions not including terminations of pregnancy ≥20 weeks for psychosocial indications (15 stillbirths) c. Only maternal conditions classified PDC 5.2: terminations of pregnancy ≥20 weeks for psychosocial indications (191
stillbirths)
Figure 6.11a: Causes of stillbirth (unadjusted), PSANZ PDC, Victoria 2010
Figure 6.11b: Causes of stillbirth (adjusted), PSANZ PDC, Victoria 2010
In 2011, 68.7% of stillbirths occurred between 20 and 27 weeks (Table 6.22b), 7.7% occurred between 28 and 31 weeks, 9.1% occurred between 32 and 36 weeks and 14.6% occurred at or after 37 weeks (term). The most common cause of stillbirth at term was unexplained antepartum death (49.5%), followed by fetal growth restriction (11.7%) and antepartum haemorrhage and congenital anomaly (both 8.7%).
In 2011, postmortem examination was conducted in 71 (59.7%) of the 120 stillbirths classified as unexplained antepartum deaths. Six stillbirths of normally formed term infants were ascribed to peripartum hypoxia. Following review of all of these stillbirths by the CCOPMM stillbirth subcommittee, all of these stillbirths were considered to have had sub-optimal care factors that were likely to have contributed to the death (Section 6.5. Table 6.30). Six stillbirths at term were due to infection. Figure 6.11d shows the cause of death for stillbirths in 2011 following adjustment for terminations of pregnancies for maternal psychosocial indications. Following this adjustment, the leading cause of stillbirth was congenital anomaly (34.3%), followed by unexplained antepartum death (22.8%) and fetal growth restriction (10.5%).
25.3%
1.1%2.6%5.1%
27.9%
5.3%1.9%7.2%
7.3%
16.3%0.0%
Congenital abnormality
Infection
Hypertension
Antepartum haemorrhage
Maternal conditions
Specific perinatal conditions
34.2%
1.5%3.5%6.9%2.7%7.1%2.6%
9.7%
9.9%
21.9%0.0%
Congenital abnormality
Infection
Hypertension
Antepartum haemorrhage
Maternal conditions
Specific perinatal conditions
Hypoxic peripartum death
Fetal growth restriction (FGR)
Spontaneous preterm
Unexplained antepartum death
No obstetric antecedent
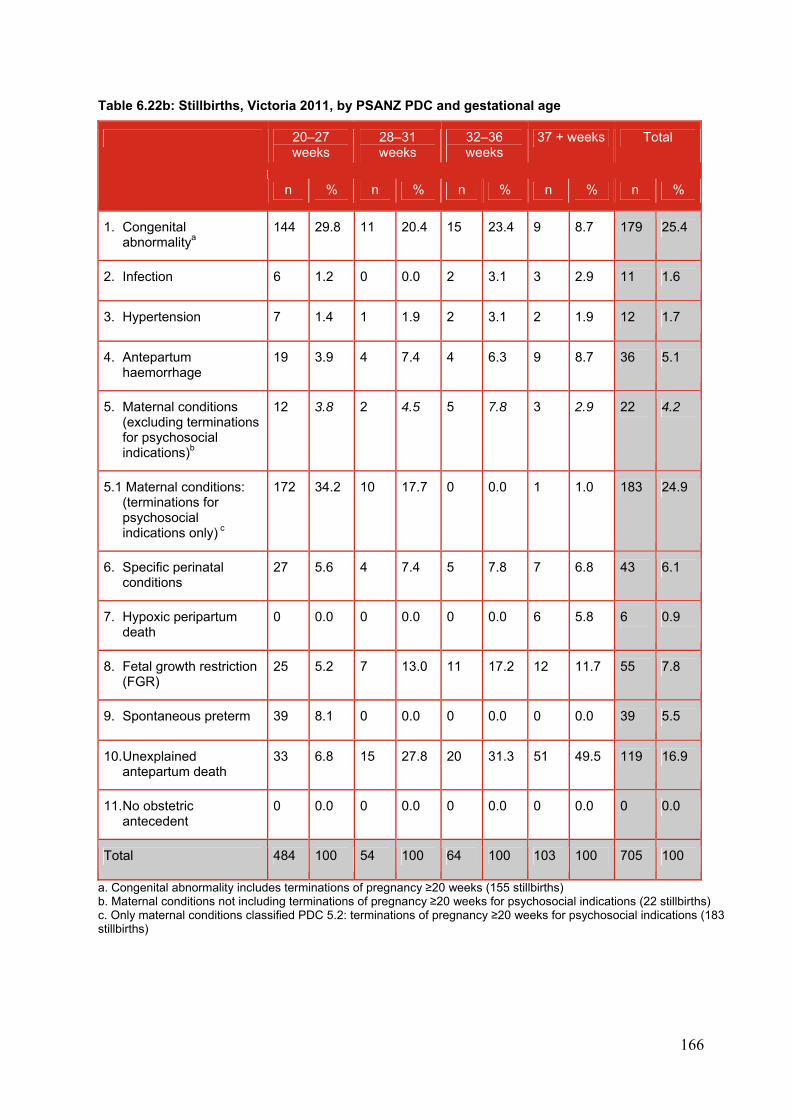
166
Table 6.22b: Stillbirths, Victoria 2011, by PSANZ PDC and gestational age
20–27 weeks
28–31 weeks
32–36 weeks
37 + weeks Total
n % n % n % n % n %
1. Congenital abnormalitya
144 29.8 11 20.4 15 23.4 9 8.7 179 25.4
2. Infection 6 1.2 0 0.0 2 3.1 3 2.9 11 1.6
3. Hypertension 7 1.4 1 1.9 2 3.1 2 1.9 12 1.7
4. Antepartum haemorrhage
19 3.9 4 7.4 4 6.3 9 8.7 36 5.1
5. Maternal conditions (excluding terminations for psychosocial indications)b
12 3.8 2 4.5 5 7.8 3 2.9 22 4.2
5.1 Maternal conditions: (terminations for psychosocial indications only) c
172 34.2 10 17.7 0 0.0 1 1.0 183 24.9
6. Specific perinatal conditions
27 5.6 4 7.4 5 7.8 7 6.8 43 6.1
7. Hypoxic peripartum death
0 0.0 0 0.0 0 0.0 6 5.8 6 0.9
8. Fetal growth restriction (FGR)
25 5.2 7 13.0 11 17.2 12 11.7 55 7.8
9. Spontaneous preterm 39 8.1 0 0.0 0 0.0 0 0.0 39 5.5
10. Unexplained antepartum death
33 6.8 15 27.8 20 31.3 51 49.5 119 16.9
11. No obstetric antecedent
0 0.0 0 0.0 0 0.0 0 0.0 0 0.0
Total 484 100 54 100 64 100 103 100 705 100
a. Congenital abnormality includes terminations of pregnancy ≥20 weeks (155 stillbirths) b. Maternal conditions not including terminations of pregnancy ≥20 weeks for psychosocial indications (22 stillbirths) c. Only maternal conditions classified PDC 5.2: terminations of pregnancy ≥20 weeks for psychosocial indications (183 stillbirths)
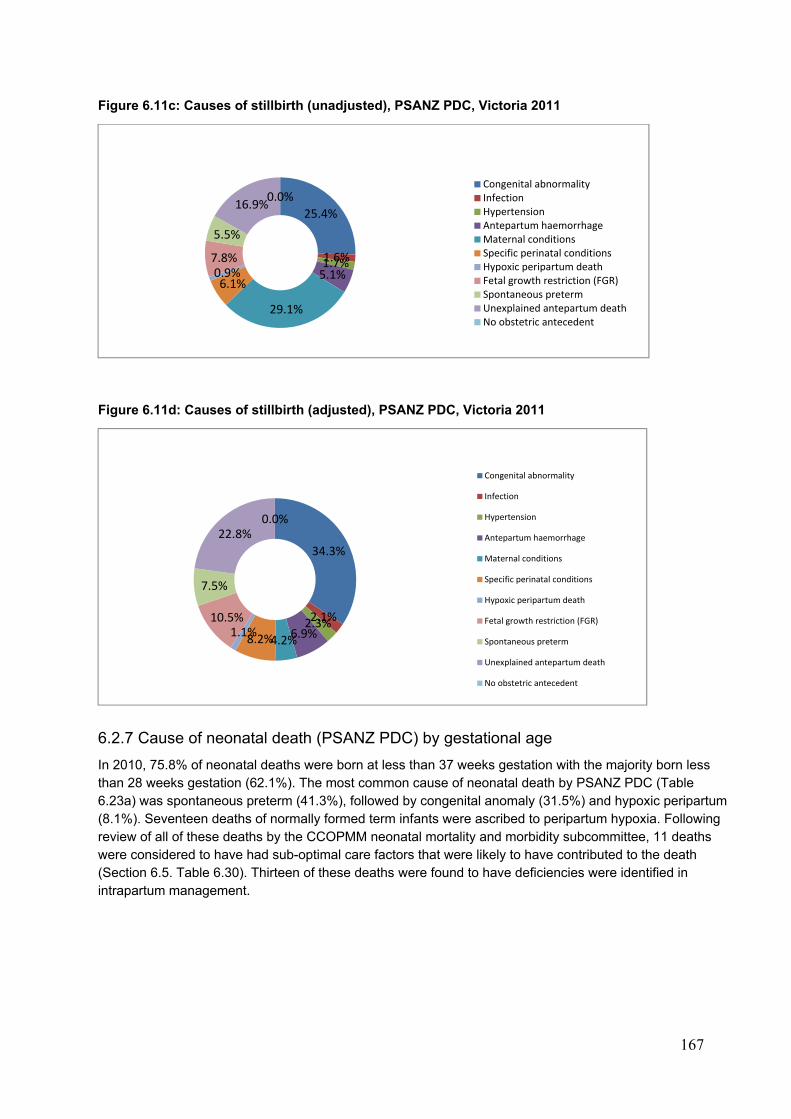
167
Figure 6.11c: Causes of stillbirth (unadjusted), PSANZ PDC, Victoria 2011
Figure 6.11d: Causes of stillbirth (adjusted), PSANZ PDC, Victoria 2011
6.2.7 Cause of neonatal death (PSANZ PDC) by gestational age
In 2010, 75.8% of neonatal deaths were born at less than 37 weeks gestation with the majority born less than 28 weeks gestation (62.1%). The most common cause of neonatal death by PSANZ PDC (Table 6.23a) was spontaneous preterm (41.3%), followed by congenital anomaly (31.5%) and hypoxic peripartum (8.1%). Seventeen deaths of normally formed term infants were ascribed to peripartum hypoxia. Following review of all of these deaths by the CCOPMM neonatal mortality and morbidity subcommittee, 11 deaths were considered to have had sub-optimal care factors that were likely to have contributed to the death (Section 6.5. Table 6.30). Thirteen of these deaths were found to have deficiencies were identified in intrapartum management.
25.4%
1.6%1.7%5.1%
29.1%
6.1%0.9%7.8%
5.5%
16.9%0.0%
Congenital abnormalityInfectionHypertensionAntepartum haemorrhageMaternal conditionsSpecific perinatal conditionsHypoxic peripartum deathFetal growth restriction (FGR)Spontaneous pretermUnexplained antepartum deathNo obstetric antecedent
34.3%
2.1%2.3%6.9%4.2%8.2%
1.1%10.5%
7.5%
22.8%0.0%
Congenital abnormality
Infection
Hypertension
Antepartum haemorrhage
Maternal conditions
Specific perinatal conditions
Hypoxic peripartum death
Fetal growth restriction (FGR)
Spontaneous preterm
Unexplained antepartum death
No obstetric antecedent
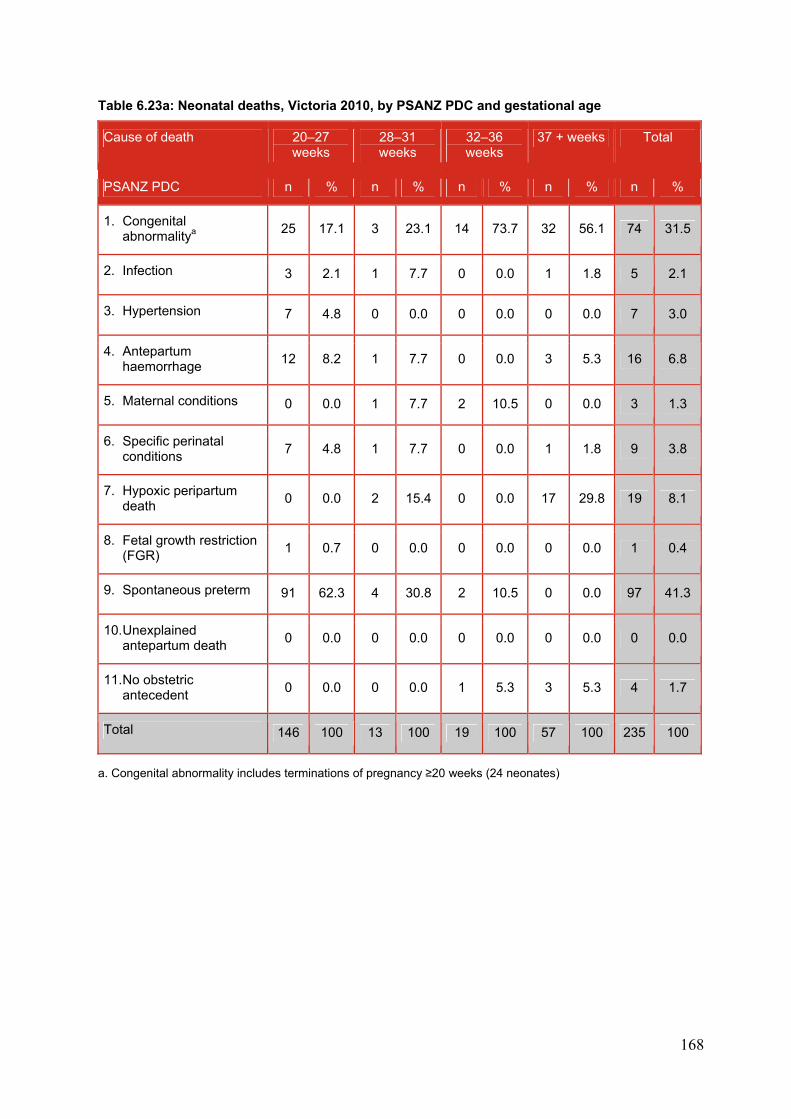
168
Table 6.23a: Neonatal deaths, Victoria 2010, by PSANZ PDC and gestational age
Cause of death 20–27 weeks
28–31 weeks
32–36 weeks
37 + weeks Total
PSANZ PDC n % n % n % n % n %
1. Congenital abnormalitya
25 17.1 3 23.1 14 73.7 32 56.1 74 31.5
2. Infection 3 2.1 1 7.7 0 0.0 1 1.8 5 2.1
3. Hypertension 7 4.8 0 0.0 0 0.0 0 0.0 7 3.0
4. Antepartum haemorrhage
12 8.2 1 7.7 0 0.0 3 5.3 16 6.8
5. Maternal conditions 0 0.0 1 7.7 2 10.5 0 0.0 3 1.3
6. Specific perinatal conditions
7 4.8 1 7.7 0 0.0 1 1.8 9 3.8
7. Hypoxic peripartum death
0 0.0 2 15.4 0 0.0 17 29.8 19 8.1
8. Fetal growth restriction (FGR)
1 0.7 0 0.0 0 0.0 0 0.0 1 0.4
9. Spontaneous preterm 91 62.3 4 30.8 2 10.5 0 0.0 97 41.3
10. Unexplained antepartum death
0 0.0 0 0.0 0 0.0 0 0.0 0 0.0
11. No obstetric antecedent
0 0.0 0 0.0 1 5.3 3 5.3 4 1.7
Total 146 100 13 100 19 100 57 100 235 100
a. Congenital abnormality includes terminations of pregnancy ≥20 weeks (24 neonates)
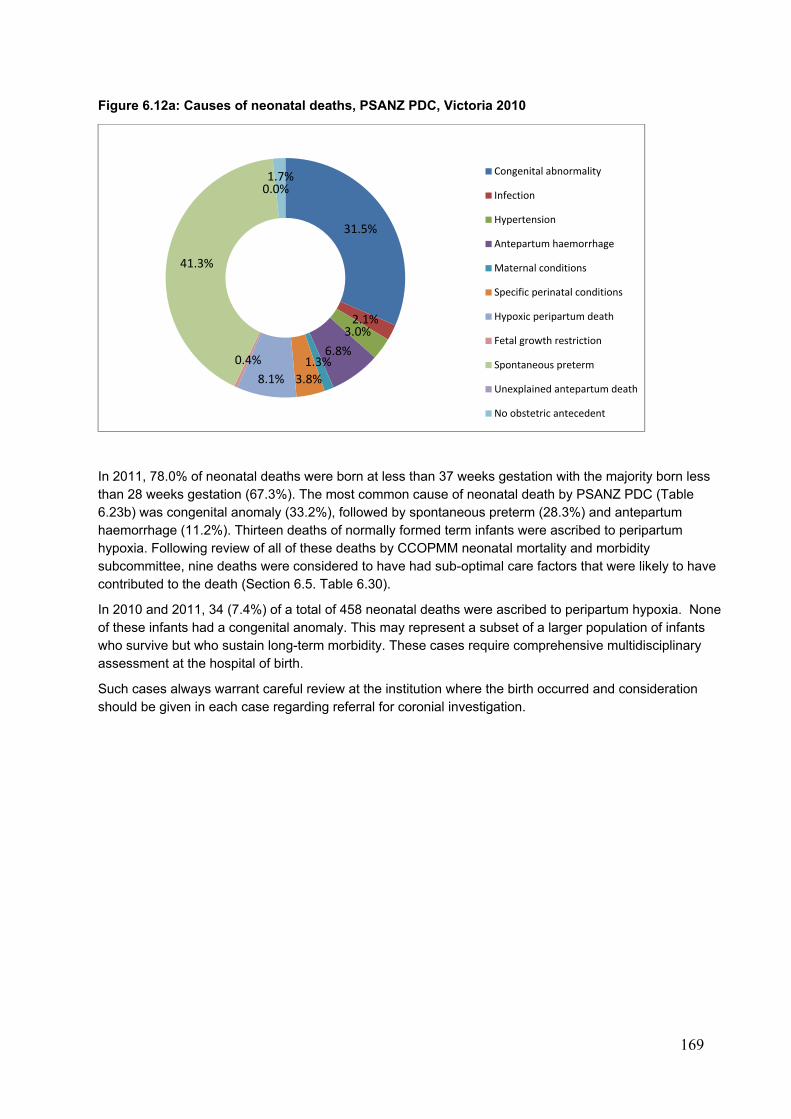
169
Figure 6.12a: Causes of neonatal deaths, PSANZ PDC, Victoria 2010
In 2011, 78.0% of neonatal deaths were born at less than 37 weeks gestation with the majority born less than 28 weeks gestation (67.3%). The most common cause of neonatal death by PSANZ PDC (Table 6.23b) was congenital anomaly (33.2%), followed by spontaneous preterm (28.3%) and antepartum haemorrhage (11.2%). Thirteen deaths of normally formed term infants were ascribed to peripartum hypoxia. Following review of all of these deaths by CCOPMM neonatal mortality and morbidity subcommittee, nine deaths were considered to have had sub-optimal care factors that were likely to have contributed to the death (Section 6.5. Table 6.30).
In 2010 and 2011, 34 (7.4%) of a total of 458 neonatal deaths were ascribed to peripartum hypoxia. None of these infants had a congenital anomaly. This may represent a subset of a larger population of infants who survive but who sustain long-term morbidity. These cases require comprehensive multidisciplinary assessment at the hospital of birth.
Such cases always warrant careful review at the institution where the birth occurred and consideration should be given in each case regarding referral for coronial investigation.
31.5%
2.1%3.0%
6.8%1.3%
3.8%8.1%
0.4%
41.3%
0.0%1.7% Congenital abnormality
Infection
Hypertension
Antepartum haemorrhage
Maternal conditions
Specific perinatal conditions
Hypoxic peripartum death
Fetal growth restriction
Spontaneous preterm
Unexplained antepartum death
No obstetric antecedent
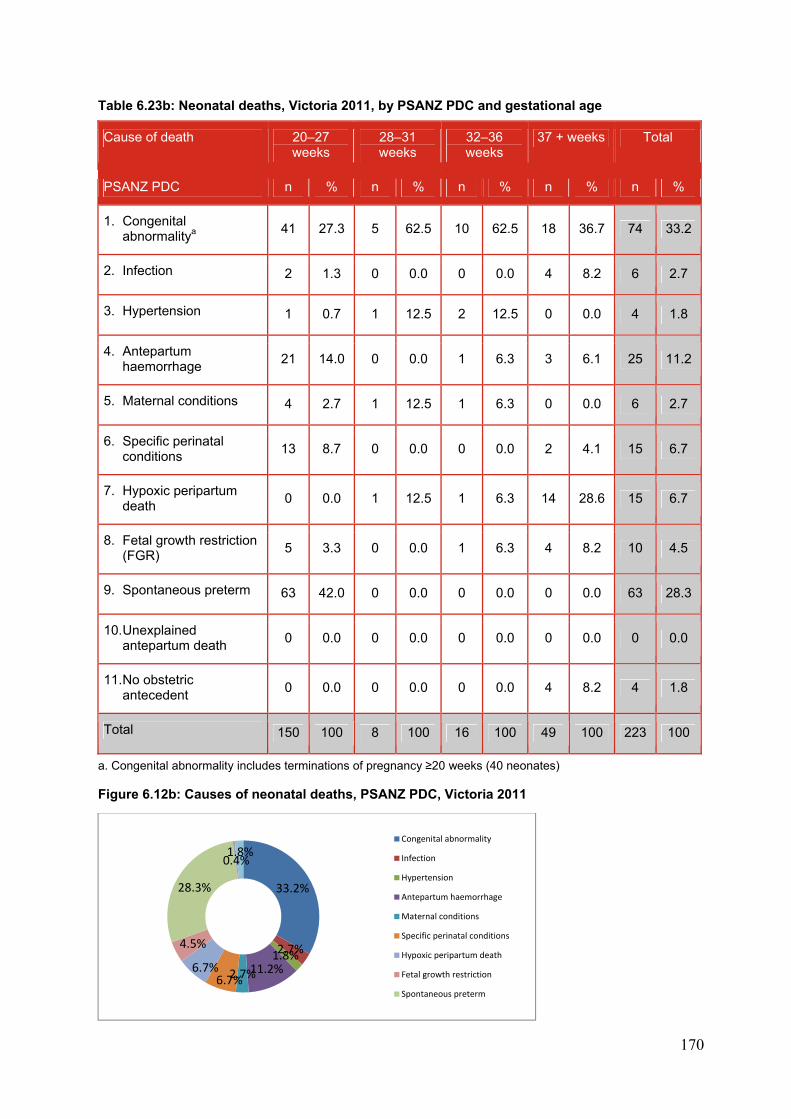
170
Table 6.23b: Neonatal deaths, Victoria 2011, by PSANZ PDC and gestational age
Cause of death 20–27 weeks
28–31 weeks
32–36 weeks
37 + weeks Total
PSANZ PDC n % n % n % n % n %
1. Congenital abnormalitya
41 27.3 5 62.5 10 62.5 18 36.7 74 33.2
2. Infection 2 1.3 0 0.0 0 0.0 4 8.2 6 2.7
3. Hypertension 1 0.7 1 12.5 2 12.5 0 0.0 4 1.8
4. Antepartum haemorrhage
21 14.0 0 0.0 1 6.3 3 6.1 25 11.2
5. Maternal conditions 4 2.7 1 12.5 1 6.3 0 0.0 6 2.7
6. Specific perinatal conditions
13 8.7 0 0.0 0 0.0 2 4.1 15 6.7
7. Hypoxic peripartum death
0 0.0 1 12.5 1 6.3 14 28.6 15 6.7
8. Fetal growth restriction (FGR)
5 3.3 0 0.0 1 6.3 4 8.2 10 4.5
9. Spontaneous preterm 63 42.0 0 0.0 0 0.0 0 0.0 63 28.3
10. Unexplained antepartum death
0 0.0 0 0.0 0 0.0 0 0.0 0 0.0
11. No obstetric antecedent
0 0.0 0 0.0 0 0.0 4 8.2 4 1.8
Total 150 100 8 100 16 100 49 100 223 100
a. Congenital abnormality includes terminations of pregnancy ≥20 weeks (40 neonates)
Figure 6.12b: Causes of neonatal deaths, PSANZ PDC, Victoria 2011
33.2%
2.7%1.8%11.2%2.7%6.7%
6.7%
4.5%
28.3%
0.4%1.8%
Congenital abnormality
Infection
Hypertension
Antepartum haemorrhage
Maternal conditions
Specific perinatal conditions
Hypoxic peripartum death
Fetal growth restriction
Spontaneous preterm
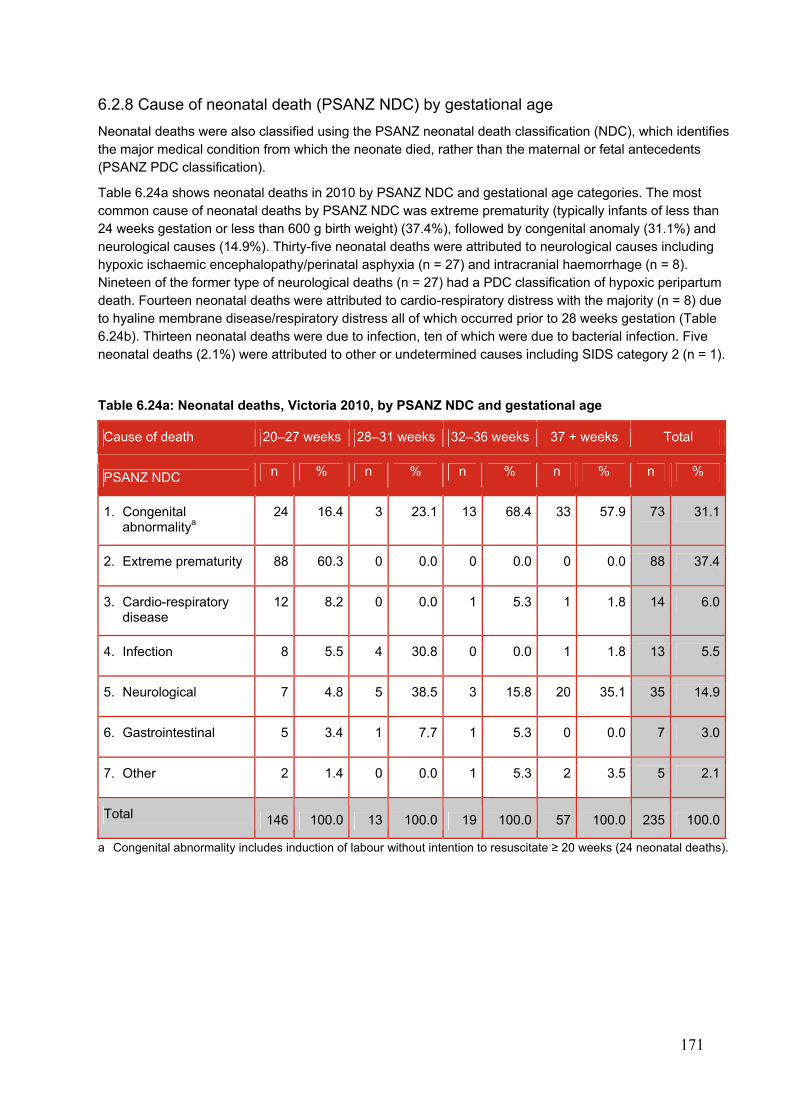
171
6.2.8 Cause of neonatal death (PSANZ NDC) by gestational age
Neonatal deaths were also classified using the PSANZ neonatal death classification (NDC), which identifies the major medical condition from which the neonate died, rather than the maternal or fetal antecedents (PSANZ PDC classification).
Table 6.24a shows neonatal deaths in 2010 by PSANZ NDC and gestational age categories. The most common cause of neonatal deaths by PSANZ NDC was extreme prematurity (typically infants of less than 24 weeks gestation or less than 600 g birth weight) (37.4%), followed by congenital anomaly (31.1%) and neurological causes (14.9%). Thirty-five neonatal deaths were attributed to neurological causes including hypoxic ischaemic encephalopathy/perinatal asphyxia (n = 27) and intracranial haemorrhage (n = 8). Nineteen of the former type of neurological deaths (n = 27) had a PDC classification of hypoxic peripartum death. Fourteen neonatal deaths were attributed to cardio-respiratory distress with the majority (n = 8) due to hyaline membrane disease/respiratory distress all of which occurred prior to 28 weeks gestation (Table 6.24b). Thirteen neonatal deaths were due to infection, ten of which were due to bacterial infection. Five neonatal deaths (2.1%) were attributed to other or undetermined causes including SIDS category 2 (n = 1).
Table 6.24a: Neonatal deaths, Victoria 2010, by PSANZ NDC and gestational age
Cause of death 20–27 weeks 28–31 weeks 32–36 weeks 37 + weeks Total
PSANZ NDC n % n % n % n % n %
1. Congenital abnormalitya
24 16.4 3 23.1 13 68.4 33 57.9 73 31.1
2. Extreme prematurity 88 60.3 0 0.0 0 0.0 0 0.0 88 37.4
3. Cardio-respiratory disease
12 8.2 0 0.0 1 5.3 1 1.8 14 6.0
4. Infection 8 5.5 4 30.8 0 0.0 1 1.8 13 5.5
5. Neurological 7 4.8 5 38.5 3 15.8 20 35.1 35 14.9
6. Gastrointestinal 5 3.4 1 7.7 1 5.3 0 0.0 7 3.0
7. Other 2 1.4 0 0.0 1 5.3 2 3.5 5 2.1
Total 146 100.0 13 100.0 19 100.0 57 100.0 235 100.0
a Congenital abnormality includes induction of labour without intention to resuscitate ≥ 20 weeks (24 neonatal deaths).
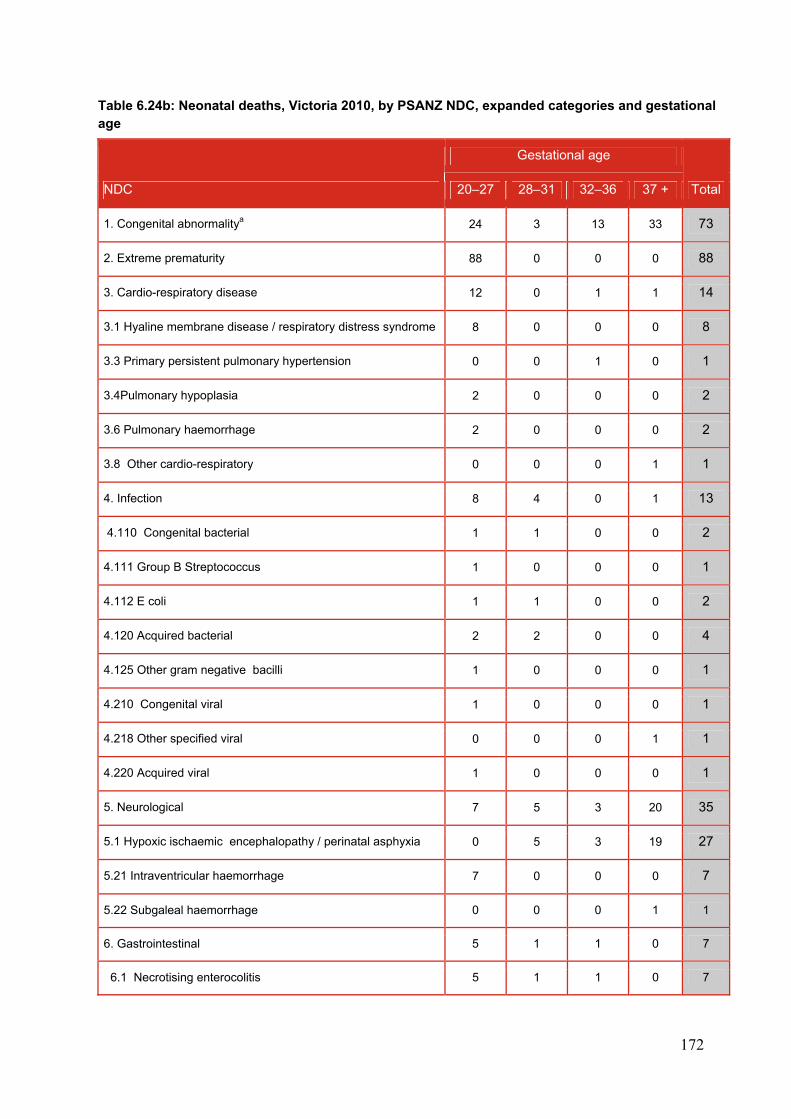
172
Table 6.24b: Neonatal deaths, Victoria 2010, by PSANZ NDC, expanded categories and gestational age
NDC
Gestational age
Total 20–27 28–31 32–36 37 +
1. Congenital abnormalitya 24 3 13 33 73
2. Extreme prematurity 88 0 0 0 88
3. Cardio-respiratory disease 12 0 1 1 14
3.1 Hyaline membrane disease / respiratory distress syndrome 8 0 0 0 8
3.3 Primary persistent pulmonary hypertension 0 0 1 0 1
3.4Pulmonary hypoplasia 2 0 0 0 2
3.6 Pulmonary haemorrhage 2 0 0 0 2
3.8 Other cardio-respiratory 0 0 0 1 1
4. Infection 8 4 0 1 13
4.110 Congenital bacterial 1 1 0 0 2
4.111 Group B Streptococcus 1 0 0 0 1
4.112 E coli 1 1 0 0 2
4.120 Acquired bacterial 2 2 0 0 4
4.125 Other gram negative bacilli 1 0 0 0 1
4.210 Congenital viral 1 0 0 0 1
4.218 Other specified viral 0 0 0 1 1
4.220 Acquired viral 1 0 0 0 1
5. Neurological 7 5 3 20 35
5.1 Hypoxic ischaemic encephalopathy / perinatal asphyxia 0 5 3 19 27
5.21 Intraventricular haemorrhage 7 0 0 0 7
5.22 Subgaleal haemorrhage 0 0 0 1 1
6. Gastrointestinal 5 1 1 0 7
6.1 Necrotising enterocolitis 5 1 1 0 7
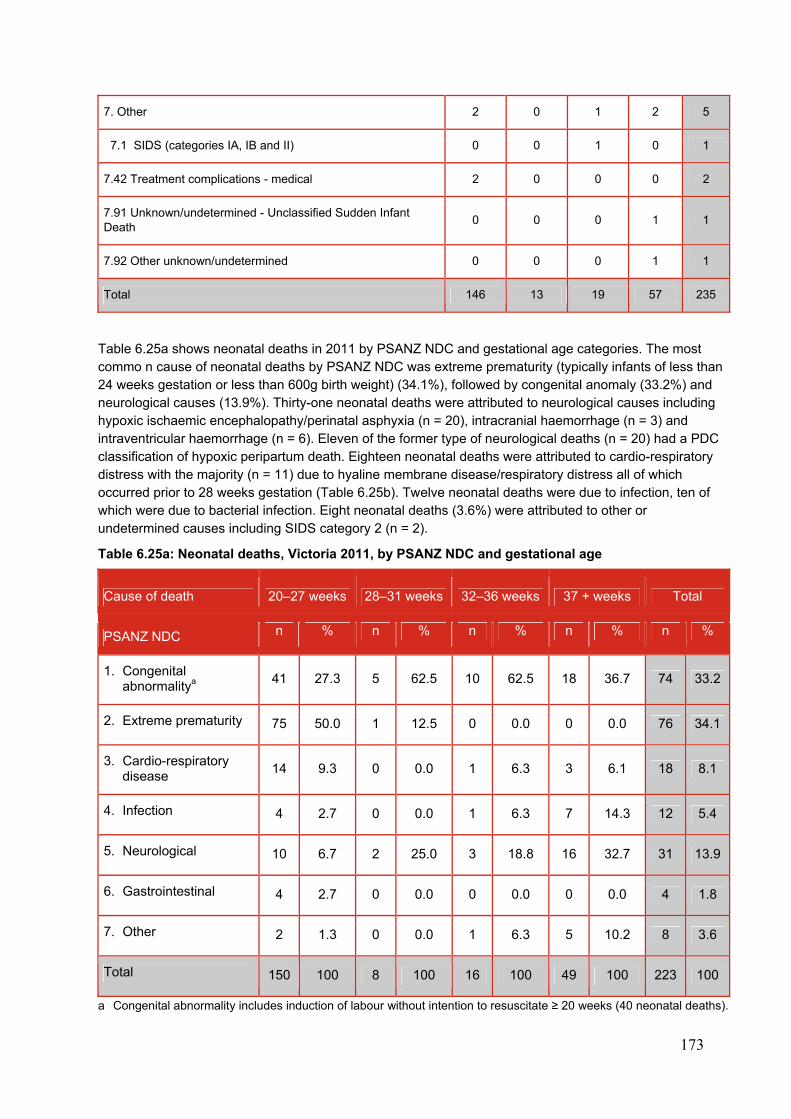
173
7. Other 2 0 1 2 5
7.1 SIDS (categories IA, IB and II) 0 0 1 0 1
7.42 Treatment complications - medical 2 0 0 0 2
7.91 Unknown/undetermined - Unclassified Sudden Infant Death
0 0 0 1 1
7.92 Other unknown/undetermined 0 0 0 1 1
Total 146 13 19 57 235
Table 6.25a shows neonatal deaths in 2011 by PSANZ NDC and gestational age categories. The most commo n cause of neonatal deaths by PSANZ NDC was extreme prematurity (typically infants of less than 24 weeks gestation or less than 600g birth weight) (34.1%), followed by congenital anomaly (33.2%) and neurological causes (13.9%). Thirty-one neonatal deaths were attributed to neurological causes including hypoxic ischaemic encephalopathy/perinatal asphyxia (n = 20), intracranial haemorrhage (n = 3) and intraventricular haemorrhage (n = 6). Eleven of the former type of neurological deaths (n = 20) had a PDC classification of hypoxic peripartum death. Eighteen neonatal deaths were attributed to cardio-respiratory distress with the majority (n = 11) due to hyaline membrane disease/respiratory distress all of which occurred prior to 28 weeks gestation (Table 6.25b). Twelve neonatal deaths were due to infection, ten of which were due to bacterial infection. Eight neonatal deaths (3.6%) were attributed to other or undetermined causes including SIDS category 2 (n = 2).
Table 6.25a: Neonatal deaths, Victoria 2011, by PSANZ NDC and gestational age
Cause of death 20–27 weeks 28–31 weeks 32–36 weeks 37 + weeks Total
PSANZ NDC n % n % n % n % n %
1. Congenital abnormalitya
41 27.3 5 62.5 10 62.5 18 36.7 74 33.2
2. Extreme prematurity 75 50.0 1 12.5 0 0.0 0 0.0 76 34.1
3. Cardio-respiratory disease
14 9.3 0 0.0 1 6.3 3 6.1 18 8.1
4. Infection 4 2.7 0 0.0 1 6.3 7 14.3 12 5.4
5. Neurological 10 6.7 2 25.0 3 18.8 16 32.7 31 13.9
6. Gastrointestinal 4 2.7 0 0.0 0 0.0 0 0.0 4 1.8
7. Other 2 1.3 0 0.0 1 6.3 5 10.2 8 3.6
Total 150 100 8 100 16 100 49 100 223 100
a Congenital abnormality includes induction of labour without intention to resuscitate ≥ 20 weeks (40 neonatal deaths).
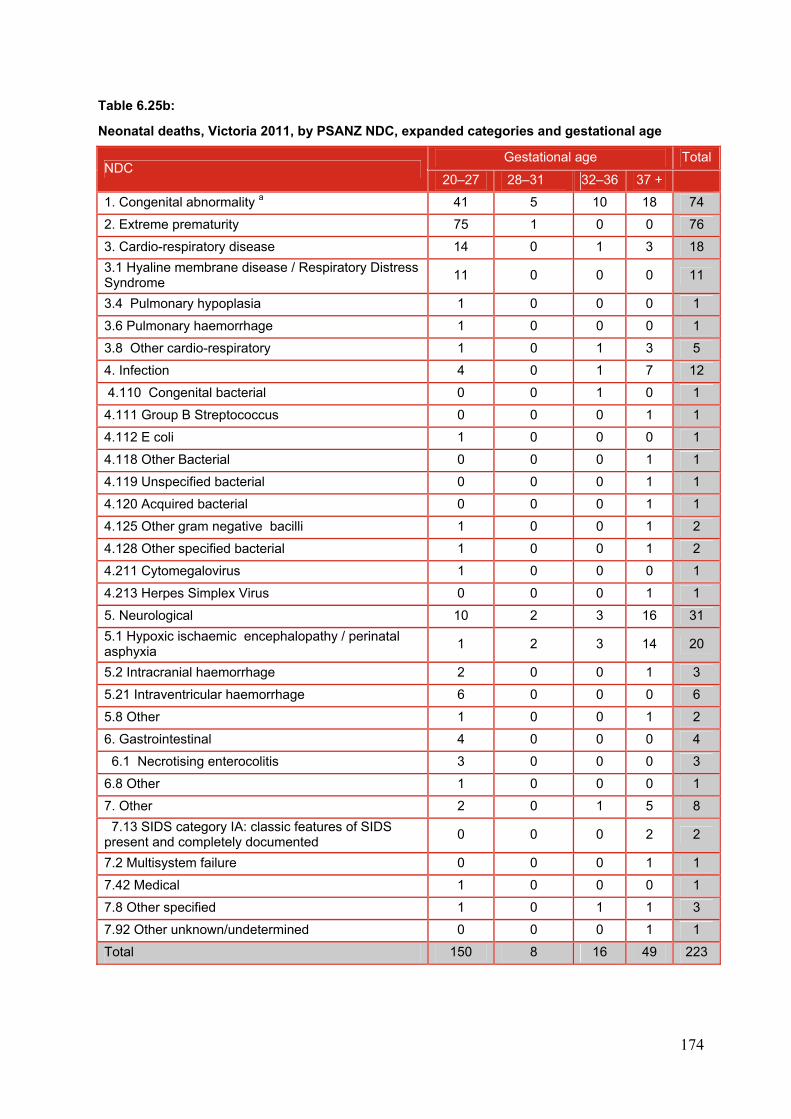
174
Table 6.25b:
Neonatal deaths, Victoria 2011, by PSANZ NDC, expanded categories and gestational age
NDC Gestational age Total
20–27 28–31 32–36 37 +
1. Congenital abnormality a 41 5 10 18 74
2. Extreme prematurity 75 1 0 0 76
3. Cardio-respiratory disease 14 0 1 3 18
3.1 Hyaline membrane disease / Respiratory Distress Syndrome
11 0 0 0 11
3.4 Pulmonary hypoplasia 1 0 0 0 1
3.6 Pulmonary haemorrhage 1 0 0 0 1
3.8 Other cardio-respiratory 1 0 1 3 5
4. Infection 4 0 1 7 12
4.110 Congenital bacterial 0 0 1 0 1
4.111 Group B Streptococcus 0 0 0 1 1
4.112 E coli 1 0 0 0 1
4.118 Other Bacterial 0 0 0 1 1
4.119 Unspecified bacterial 0 0 0 1 1
4.120 Acquired bacterial 0 0 0 1 1
4.125 Other gram negative bacilli 1 0 0 1 2
4.128 Other specified bacterial 1 0 0 1 2
4.211 Cytomegalovirus 1 0 0 0 1
4.213 Herpes Simplex Virus 0 0 0 1 1
5. Neurological 10 2 3 16 31
5.1 Hypoxic ischaemic encephalopathy / perinatal asphyxia
1 2 3 14 20
5.2 Intracranial haemorrhage 2 0 0 1 3
5.21 Intraventricular haemorrhage 6 0 0 0 6
5.8 Other 1 0 0 1 2
6. Gastrointestinal 4 0 0 0 4
6.1 Necrotising enterocolitis 3 0 0 0 3
6.8 Other 1 0 0 0 1
7. Other 2 0 1 5 8
7.13 SIDS category IA: classic features of SIDS present and completely documented
0 0 0 2 2
7.2 Multisystem failure 0 0 0 1 1
7.42 Medical 1 0 0 0 1
7.8 Other specified 1 0 1 1 3
7.92 Other unknown/undetermined 0 0 0 1 1
Total 150 8 16 49 223
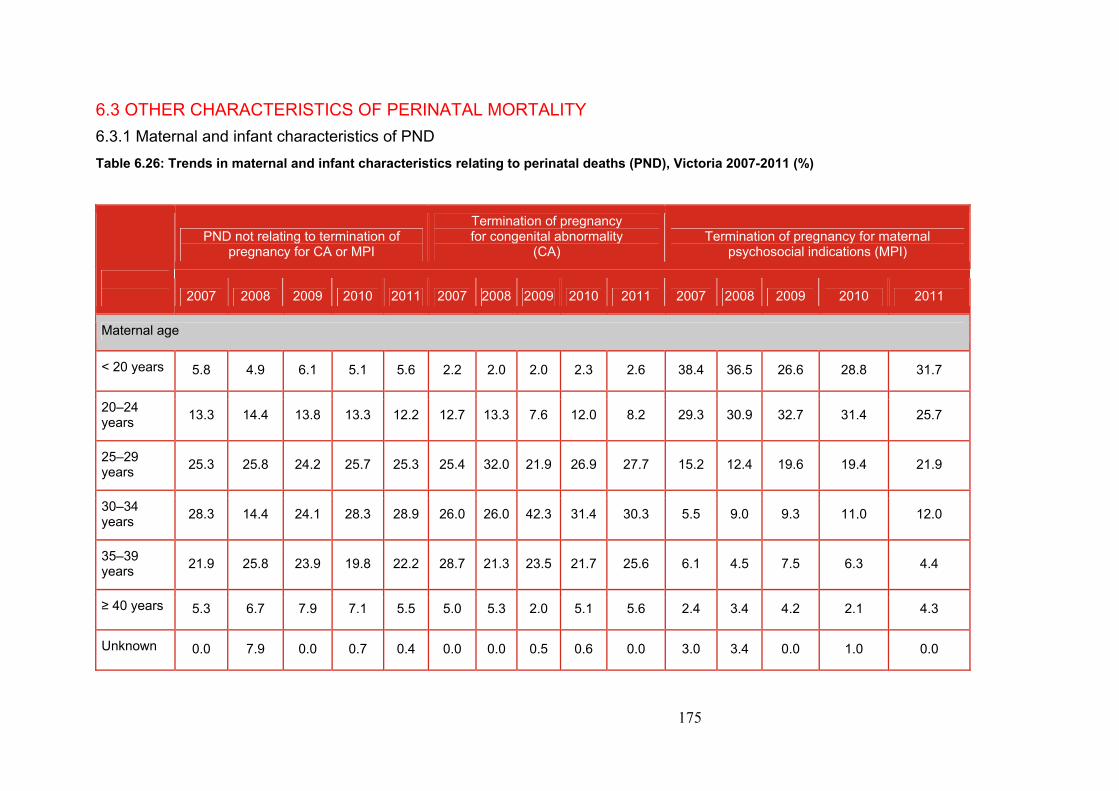
175
6.3 OTHER CHARACTERISTICS OF PERINATAL MORTALITY
6.3.1 Maternal and infant characteristics of PND
Table 6.26: Trends in maternal and infant characteristics relating to perinatal deaths (PND), Victoria 2007-2011 (%)
PND not relating to termination of pregnancy for CA or MPI
Termination of pregnancy for congenital abnormality
(CA) Termination of pregnancy for maternal
psychosocial indications (MPI)
2007 2008 2009 2010 2011 2007 2008 2009 2010 2011 2007 2008 2009 2010 2011
Maternal age
< 20 years 5.8 4.9 6.1 5.1 5.6 2.2 2.0 2.0 2.3 2.6 38.4 36.5 26.6 28.8 31.7
20–24 years
13.3 14.4 13.8 13.3 12.2 12.7 13.3 7.6 12.0 8.2 29.3 30.9 32.7 31.4 25.7
25–29 years
25.3 25.8 24.2 25.7 25.3 25.4 32.0 21.9 26.9 27.7 15.2 12.4 19.6 19.4 21.9
30–34 years
28.3 14.4 24.1 28.3 28.9 26.0 26.0 42.3 31.4 30.3 5.5 9.0 9.3 11.0 12.0
35–39 years
21.9 25.8 23.9 19.8 22.2 28.7 21.3 23.5 21.7 25.6 6.1 4.5 7.5 6.3 4.4
≥ 40 years 5.3 6.7 7.9 7.1 5.5 5.0 5.3 2.0 5.1 5.6 2.4 3.4 4.2 2.1 4.3
Unknown 0.0 7.9 0.0 0.7 0.4 0.0 0.0 0.5 0.6 0.0 3.0 3.4 0.0 1.0 0.0
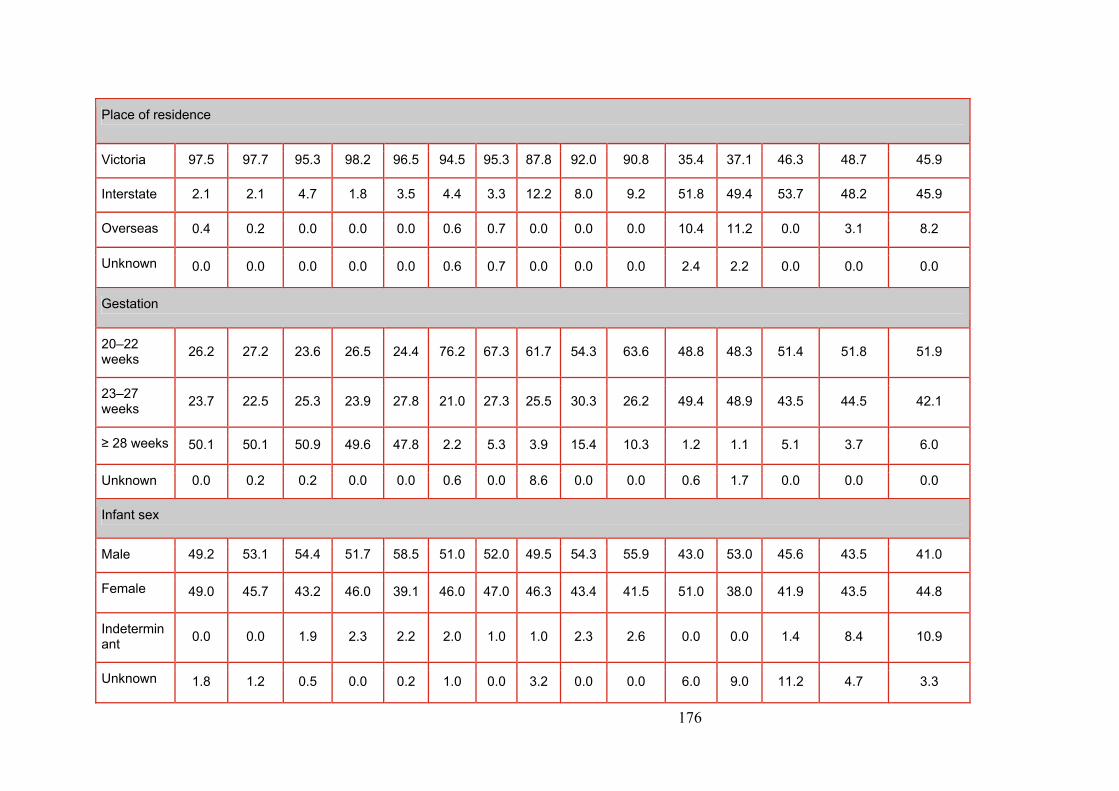
176
Place of residence
Victoria 97.5 97.7 95.3 98.2 96.5 94.5 95.3 87.8 92.0 90.8 35.4 37.1 46.3 48.7 45.9
Interstate 2.1 2.1 4.7 1.8 3.5 4.4 3.3 12.2 8.0 9.2 51.8 49.4 53.7 48.2 45.9
Overseas 0.4 0.2 0.0 0.0 0.0 0.6 0.7 0.0 0.0 0.0 10.4 11.2 0.0 3.1 8.2
Unknown 0.0 0.0 0.0 0.0 0.0 0.6 0.7 0.0 0.0 0.0 2.4 2.2 0.0 0.0 0.0
Gestation
20–22 weeks
26.2 27.2 23.6 26.5 24.4 76.2 67.3 61.7 54.3 63.6 48.8 48.3 51.4 51.8 51.9
23–27 weeks
23.7 22.5 25.3 23.9 27.8 21.0 27.3 25.5 30.3 26.2 49.4 48.9 43.5 44.5 42.1
≥ 28 weeks 50.1 50.1 50.9 49.6 47.8 2.2 5.3 3.9 15.4 10.3 1.2 1.1 5.1 3.7 6.0
Unknown 0.0 0.2 0.2 0.0 0.0 0.6 0.0 8.6 0.0 0.0 0.6 1.7 0.0 0.0 0.0
Infant sex
Male 49.2 53.1 54.4 51.7 58.5 51.0 52.0 49.5 54.3 55.9 43.0 53.0 45.6 43.5 41.0
Female 49.0 45.7 43.2 46.0 39.1 46.0 47.0 46.3 43.4 41.5 51.0 38.0 41.9 43.5 44.8
Indeterminant
0.0 0.0 1.9 2.3 2.2 2.0 1.0 1.0 2.3 2.6 0.0 0.0 1.4 8.4 10.9
Unknown 1.8 1.2 0.5 0.0 0.2 1.0 0.0 3.2 0.0 0.0 6.0 9.0 11.2 4.7 3.3
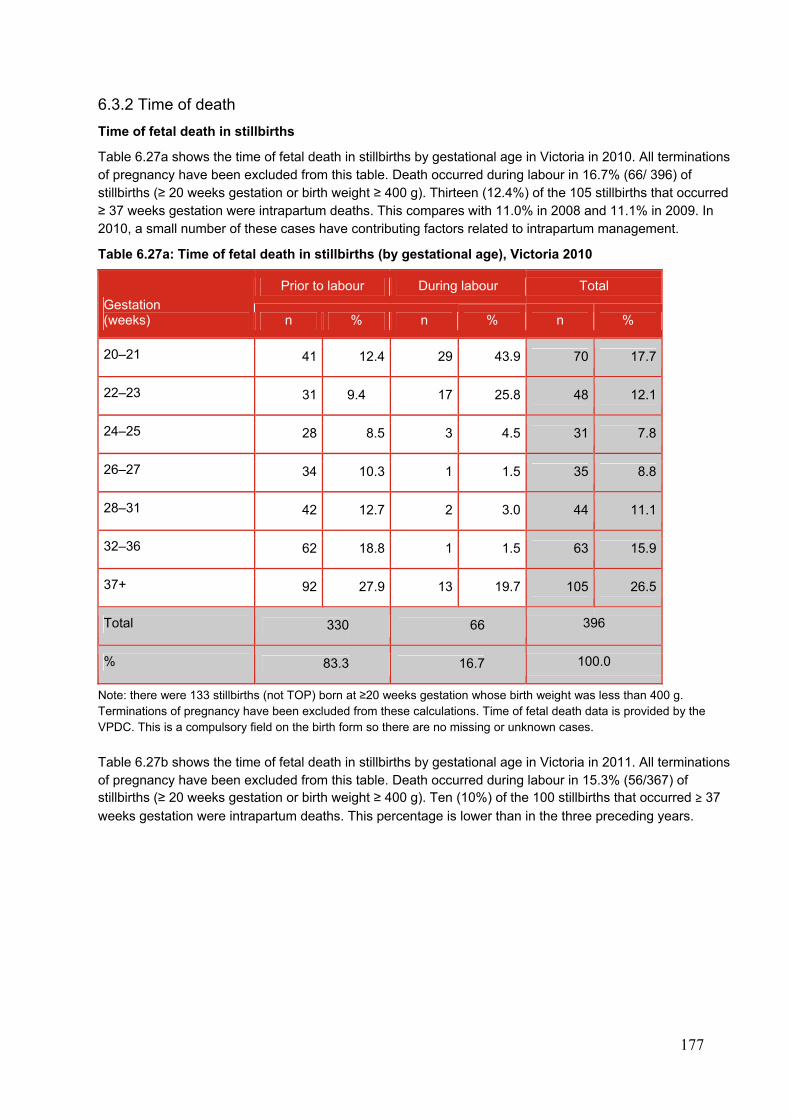
177
6.3.2 Time of death
Time of fetal death in stillbirths
Table 6.27a shows the time of fetal death in stillbirths by gestational age in Victoria in 2010. All terminations of pregnancy have been excluded from this table. Death occurred during labour in 16.7% (66/ 396) of stillbirths (≥ 20 weeks gestation or birth weight ≥ 400 g). Thirteen (12.4%) of the 105 stillbirths that occurred ≥ 37 weeks gestation were intrapartum deaths. This compares with 11.0% in 2008 and 11.1% in 2009. In 2010, a small number of these cases have contributing factors related to intrapartum management.
Table 6.27a: Time of fetal death in stillbirths (by gestational age), Victoria 2010
Note: there were 133 stillbirths (not TOP) born at ≥20 weeks gestation whose birth weight was less than 400 g. Terminations of pregnancy have been excluded from these calculations. Time of fetal death data is provided by the VPDC. This is a compulsory field on the birth form so there are no missing or unknown cases.
Table 6.27b shows the time of fetal death in stillbirths by gestational age in Victoria in 2011. All terminations of pregnancy have been excluded from this table. Death occurred during labour in 15.3% (56/367) of stillbirths (≥ 20 weeks gestation or birth weight ≥ 400 g). Ten (10%) of the 100 stillbirths that occurred ≥ 37
weeks gestation were intrapartum deaths. This percentage is lower than in the three preceding years.
Gestation (weeks)
Prior to labour During labour Total
n % n % n %
20–21 41 12.4 29 43.9 70 17.7
22–23 31 9.4 17 25.8 48 12.1
24–25 28 8.5 3 4.5 31 7.8
26–27 34 10.3 1 1.5 35 8.8
28–31 42 12.7 2 3.0 44 11.1
32–36 62 18.8 1 1.5 63 15.9
37+ 92 27.9 13 19.7 105 26.5
Total 330 66 396
% 83.3 16.7 100.0
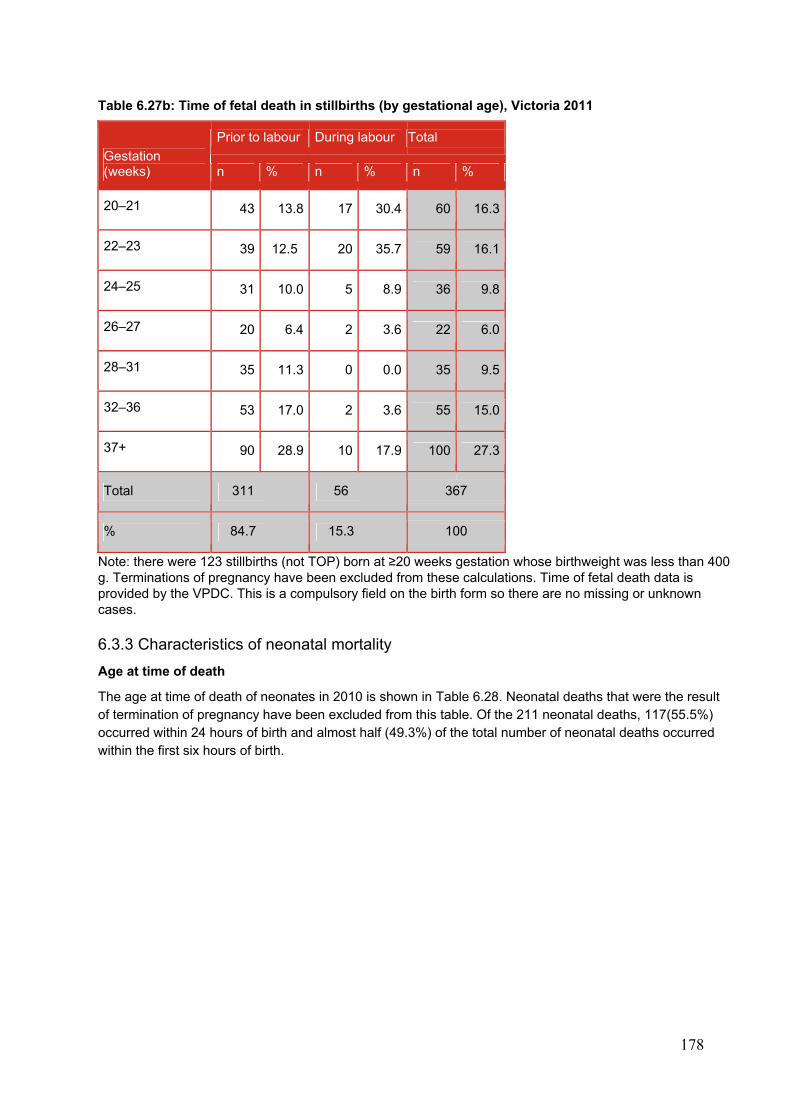
178
Table 6.27b: Time of fetal death in stillbirths (by gestational age), Victoria 2011
Gestation (weeks)
Prior to labour During labour Total
n % n % n %
20–21 43 13.8 17 30.4 60 16.3
22–23 39 12.5 20 35.7 59 16.1
24–25 31 10.0 5 8.9 36 9.8
26–27 20 6.4 2 3.6 22 6.0
28–31 35 11.3 0 0.0 35 9.5
32–36 53 17.0 2 3.6 55 15.0
37+ 90 28.9 10 17.9 100 27.3
Total 311 56 367
% 84.7 15.3 100
Note: there were 123 stillbirths (not TOP) born at ≥20 weeks gestation whose birthweight was less than 400 g. Terminations of pregnancy have been excluded from these calculations. Time of fetal death data is provided by the VPDC. This is a compulsory field on the birth form so there are no missing or unknown cases.
6.3.3 Characteristics of neonatal mortality
Age at time of death
The age at time of death of neonates in 2010 is shown in Table 6.28. Neonatal deaths that were the result of termination of pregnancy have been excluded from this table. Of the 211 neonatal deaths, 117(55.5%) occurred within 24 hours of birth and almost half (49.3%) of the total number of neonatal deaths occurred within the first six hours of birth.
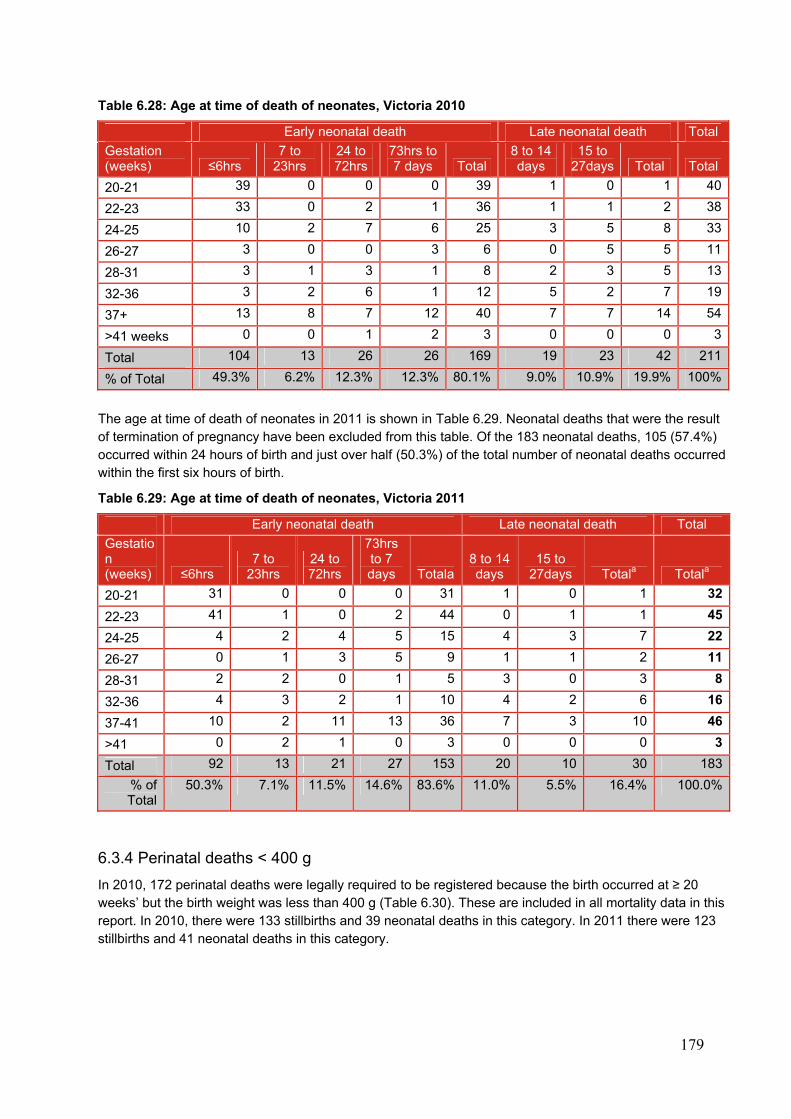
179
Table 6.28: Age at time of death of neonates, Victoria 2010
Early neonatal death Late neonatal death Total
Gestation (weeks) ≤6hrs
7 to 23hrs
24 to 72hrs
73hrs to 7 days Total
8 to 14 days
15 to 27days Total Total
20-21 39 0 0 0 39 1 0 1 40
22-23 33 0 2 1 36 1 1 2 38
24-25 10 2 7 6 25 3 5 8 33
26-27 3 0 0 3 6 0 5 5 11
28-31 3 1 3 1 8 2 3 5 13
32-36 3 2 6 1 12 5 2 7 19
37+ 13 8 7 12 40 7 7 14 54
>41 weeks 0 0 1 2 3 0 0 0 3
Total 104 13 26 26 169 19 23 42 211
% of Total 49.3% 6.2% 12.3% 12.3% 80.1% 9.0% 10.9% 19.9% 100%
The age at time of death of neonates in 2011 is shown in Table 6.29. Neonatal deaths that were the result of termination of pregnancy have been excluded from this table. Of the 183 neonatal deaths, 105 (57.4%) occurred within 24 hours of birth and just over half (50.3%) of the total number of neonatal deaths occurred within the first six hours of birth.
Table 6.29: Age at time of death of neonates, Victoria 2011
Early neonatal death Late neonatal death Total
Gestation (weeks) ≤6hrs
7 to 23hrs
24 to 72hrs
73hrs to 7 days Totala
8 to 14 days
15 to 27days Totala Totala
20-21 31 0 0 0 31 1 0 1 32
22-23 41 1 0 2 44 0 1 1 45
24-25 4 2 4 5 15 4 3 7 22
26-27 0 1 3 5 9 1 1 2 11
28-31 2 2 0 1 5 3 0 3 8
32-36 4 3 2 1 10 4 2 6 16
37-41 10 2 11 13 36 7 3 10 46
>41 0 2 1 0 3 0 0 0 3
Total 92 13 21 27 153 20 10 30 183
% of Total
50.3% 7.1% 11.5% 14.6% 83.6% 11.0% 5.5% 16.4% 100.0%
6.3.4 Perinatal deaths < 400 g
In 2010, 172 perinatal deaths were legally required to be registered because the birth occurred at ≥ 20 weeks’ but the birth weight was less than 400 g (Table 6.30). These are included in all mortality data in this report. In 2010, there were 133 stillbirths and 39 neonatal deaths in this category. In 2011 there were 123 stillbirths and 41 neonatal deaths in this category.
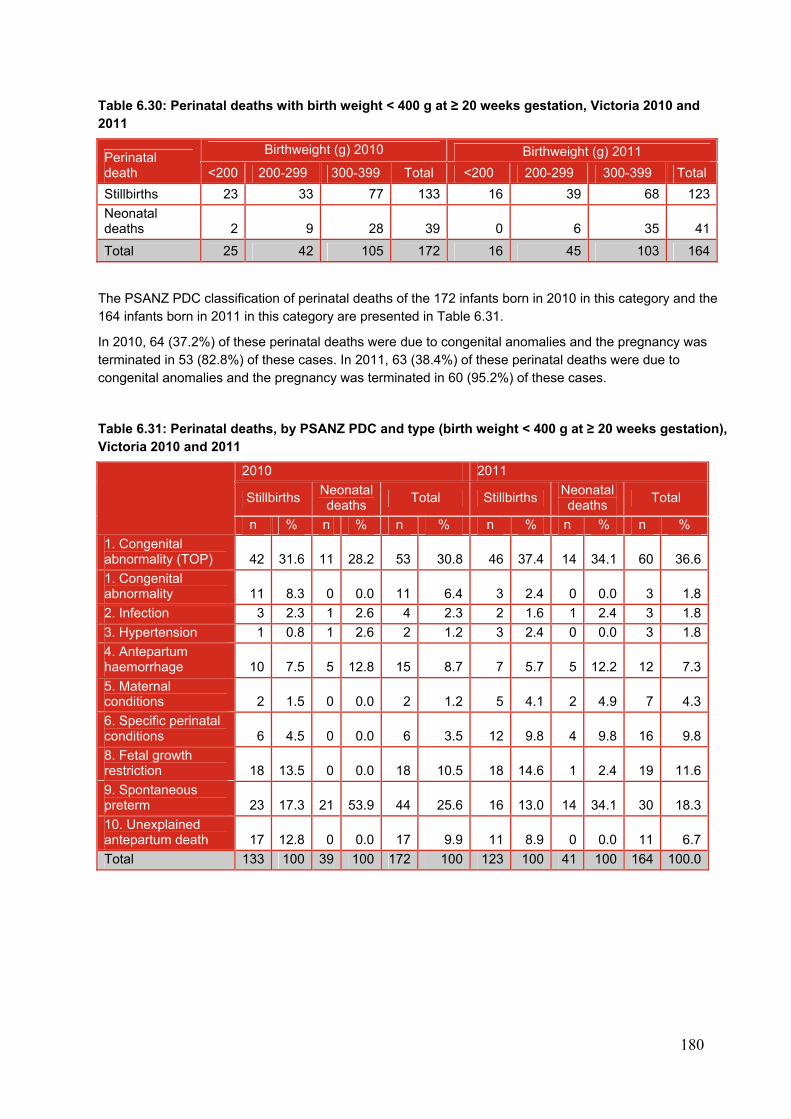
180
Table 6.30: Perinatal deaths with birth weight < 400 g at ≥ 20 weeks gestation, Victoria 2010 and 2011
Perinatal death
Birthweight (g) 2010 Birthweight (g) 2011
<200 200-299 300-399 Total <200 200-299 300-399 Total
Stillbirths 23 33 77 133 16 39 68 123
Neonatal deaths 2 9 28 39 0 6 35 41
Total 25 42 105 172 16 45 103 164
The PSANZ PDC classification of perinatal deaths of the 172 infants born in 2010 in this category and the 164 infants born in 2011 in this category are presented in Table 6.31.
In 2010, 64 (37.2%) of these perinatal deaths were due to congenital anomalies and the pregnancy was terminated in 53 (82.8%) of these cases. In 2011, 63 (38.4%) of these perinatal deaths were due to congenital anomalies and the pregnancy was terminated in 60 (95.2%) of these cases.
Table 6.31: Perinatal deaths, by PSANZ PDC and type (birth weight < 400 g at ≥ 20 weeks gestation), Victoria 2010 and 2011
2010 2011
Stillbirths Neonatal deaths
Total Stillbirths Neonatal deaths
Total
n % n % n % n % n % n %
1. Congenital abnormality (TOP) 42 31.6 11 28.2 53 30.8 46 37.4 14 34.1 60 36.6
1. Congenital abnormality 11 8.3 0 0.0 11 6.4 3 2.4 0 0.0 3 1.8
2. Infection 3 2.3 1 2.6 4 2.3 2 1.6 1 2.4 3 1.8
3. Hypertension 1 0.8 1 2.6 2 1.2 3 2.4 0 0.0 3 1.8
4. Antepartum haemorrhage 10 7.5 5 12.8 15 8.7 7 5.7 5 12.2 12 7.3
5. Maternal conditions 2 1.5 0 0.0 2 1.2 5 4.1 2 4.9 7 4.3
6. Specific perinatal conditions 6 4.5 0 0.0 6 3.5 12 9.8 4 9.8 16 9.8
8. Fetal growth restriction 18 13.5 0 0.0 18 10.5 18 14.6 1 2.4 19 11.6
9. Spontaneous preterm 23 17.3 21 53.9 44 25.6 16 13.0 14 34.1 30 18.3
10. Unexplained antepartum death 17 12.8 0 0.0 17 9.9 11 8.9 0 0.0 11 6.7
Total 133 100 39 100 172 100 123 100 41 100 164 100.0
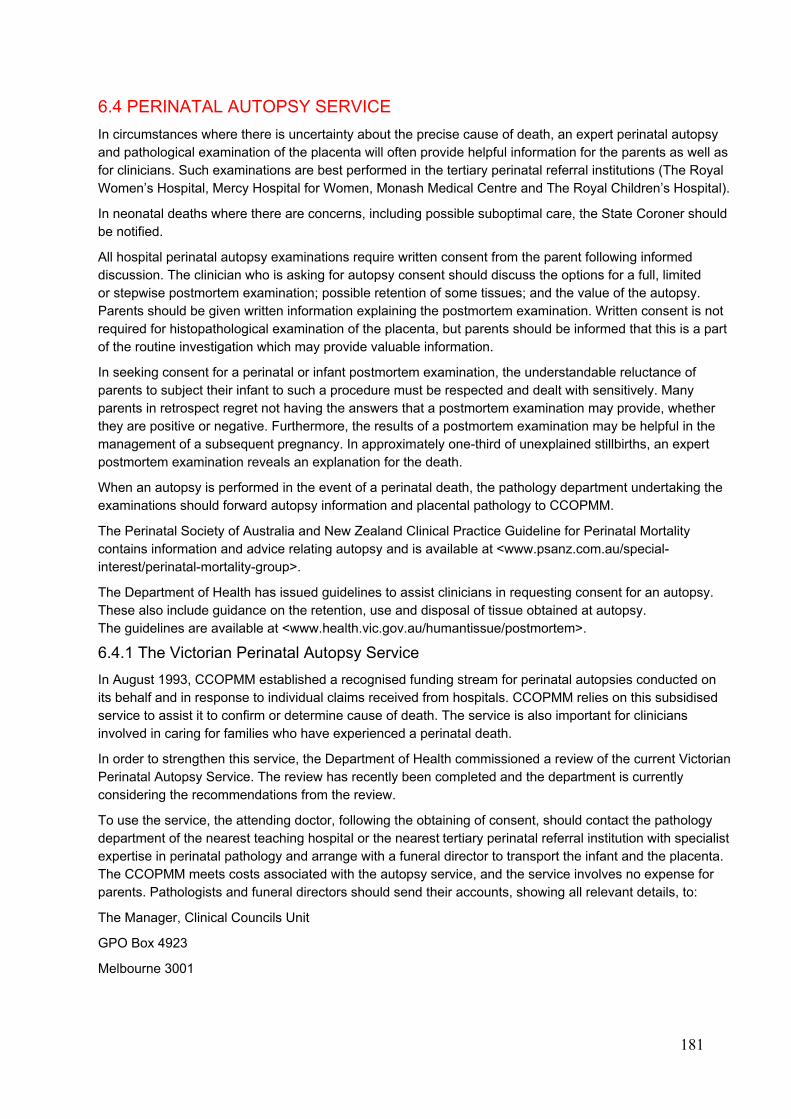
181
6.4 PERINATAL AUTOPSY SERVICE
In circumstances where there is uncertainty about the precise cause of death, an expert perinatal autopsy and pathological examination of the placenta will often provide helpful information for the parents as well as for clinicians. Such examinations are best performed in the tertiary perinatal referral institutions (The Royal Women’s Hospital, Mercy Hospital for Women, Monash Medical Centre and The Royal Children’s Hospital).
In neonatal deaths where there are concerns, including possible suboptimal care, the State Coroner should be notified.
All hospital perinatal autopsy examinations require written consent from the parent following informed discussion. The clinician who is asking for autopsy consent should discuss the options for a full, limited or stepwise postmortem examination; possible retention of some tissues; and the value of the autopsy. Parents should be given written information explaining the postmortem examination. Written consent is not required for histopathological examination of the placenta, but parents should be informed that this is a part of the routine investigation which may provide valuable information.
In seeking consent for a perinatal or infant postmortem examination, the understandable reluctance of parents to subject their infant to such a procedure must be respected and dealt with sensitively. Many parents in retrospect regret not having the answers that a postmortem examination may provide, whether they are positive or negative. Furthermore, the results of a postmortem examination may be helpful in the management of a subsequent pregnancy. In approximately one-third of unexplained stillbirths, an expert postmortem examination reveals an explanation for the death.
When an autopsy is performed in the event of a perinatal death, the pathology department undertaking the examinations should forward autopsy information and placental pathology to CCOPMM.
The Perinatal Society of Australia and New Zealand Clinical Practice Guideline for Perinatal Mortality contains information and advice relating autopsy and is available at <www.psanz.com.au/special-interest/perinatal-mortality-group>.
The Department of Health has issued guidelines to assist clinicians in requesting consent for an autopsy. These also include guidance on the retention, use and disposal of tissue obtained at autopsy. The guidelines are available at <www.health.vic.gov.au/humantissue/postmortem>.
6.4.1 The Victorian Perinatal Autopsy Service
In August 1993, CCOPMM established a recognised funding stream for perinatal autopsies conducted on its behalf and in response to individual claims received from hospitals. CCOPMM relies on this subsidised service to assist it to confirm or determine cause of death. The service is also important for clinicians involved in caring for families who have experienced a perinatal death.
In order to strengthen this service, the Department of Health commissioned a review of the current Victorian Perinatal Autopsy Service. The review has recently been completed and the department is currently considering the recommendations from the review.
To use the service, the attending doctor, following the obtaining of consent, should contact the pathology department of the nearest teaching hospital or the nearest tertiary perinatal referral institution with specialist expertise in perinatal pathology and arrange with a funeral director to transport the infant and the placenta. The CCOPMM meets costs associated with the autopsy service, and the service involves no expense for parents. Pathologists and funeral directors should send their accounts, showing all relevant details, to:
The Manager, Clinical Councils Unit
GPO Box 4923
Melbourne 3001
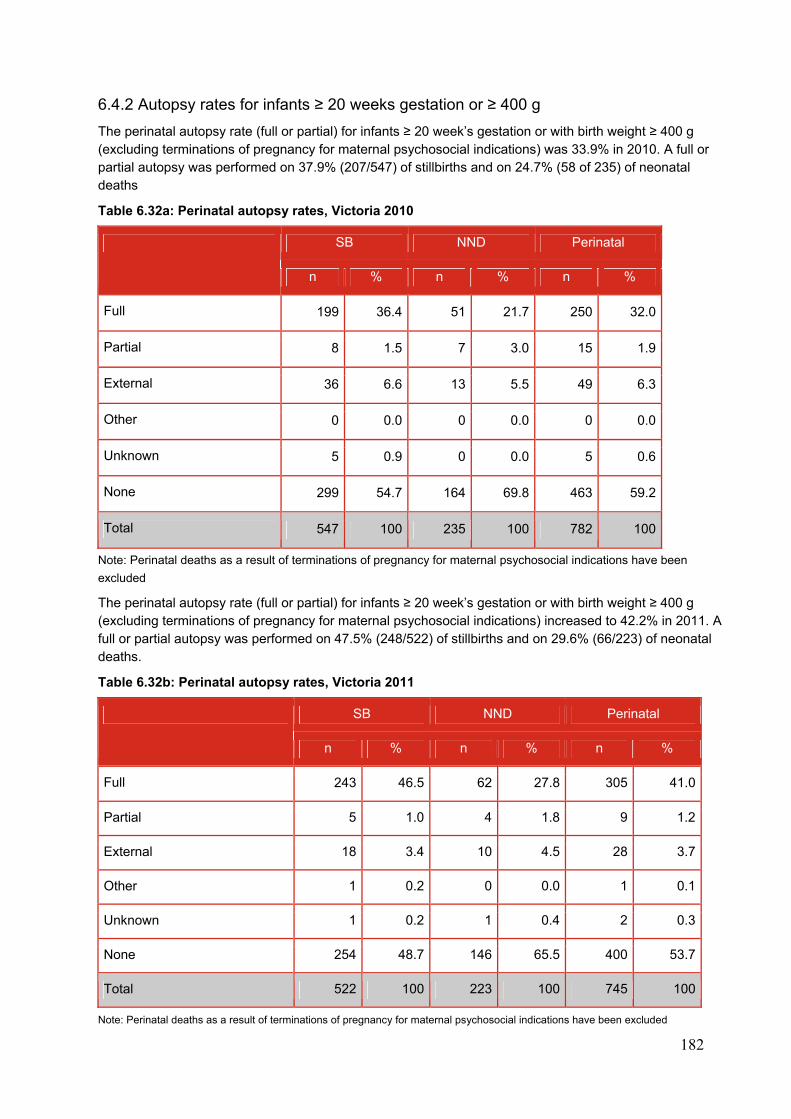
182
6.4.2 Autopsy rates for infants ≥ 20 weeks gestation or ≥ 400 g
The perinatal autopsy rate (full or partial) for infants ≥ 20 week’s gestation or with birth weight ≥ 400 g (excluding terminations of pregnancy for maternal psychosocial indications) was 33.9% in 2010. A full or partial autopsy was performed on 37.9% (207/547) of stillbirths and on 24.7% (58 of 235) of neonatal deaths
Table 6.32a: Perinatal autopsy rates, Victoria 2010
SB NND Perinatal
n % n % n %
Full 199 36.4 51 21.7 250 32.0
Partial 8 1.5 7 3.0 15 1.9
External 36 6.6 13 5.5 49 6.3
Other 0 0.0 0 0.0 0 0.0
Unknown 5 0.9 0 0.0 5 0.6
None 299 54.7 164 69.8 463 59.2
Total 547 100 235 100 782 100
Note: Perinatal deaths as a result of terminations of pregnancy for maternal psychosocial indications have been
excluded
The perinatal autopsy rate (full or partial) for infants ≥ 20 week’s gestation or with birth weight ≥ 400 g (excluding terminations of pregnancy for maternal psychosocial indications) increased to 42.2% in 2011. A full or partial autopsy was performed on 47.5% (248/522) of stillbirths and on 29.6% (66/223) of neonatal deaths.
Table 6.32b: Perinatal autopsy rates, Victoria 2011
SB NND Perinatal
n % n % n %
Full 243 46.5 62 27.8 305 41.0
Partial 5 1.0 4 1.8 9 1.2
External 18 3.4 10 4.5 28 3.7
Other 1 0.2 0 0.0 1 0.1
Unknown 1 0.2 1 0.4 2 0.3
None 254 48.7 146 65.5 400 53.7
Total 522 100 223 100 745 100
Note: Perinatal deaths as a result of terminations of pregnancy for maternal psychosocial indications have been excluded
183
The perinatal autopsy rate (full or partial) was 33.9% in 2010. This increased from a rate of 31.1% in 2009 but was lower than the three preceding years (38.7% in 2008, 40.9% in 2007 and 38.0% in 2006). The perinatal autopsy rate (full or partial) increased to 42.2% in 2011. The perinatal autopsy rate has not been this high since 2001. This increase in the perinatal autopsy rate is reassuring and will hopefully continue to rise in future years. It is vital to the accuracy of CCOPMM’s investigations that full advantage is taken of the autopsy service available for perinatal deaths occurring in Victoria. The results of perinatal autopsy improve the accuracy of PSANZ classification of perinatal deaths.
Figure 6.13: Perinatal autopsy rates, Victoria 2000 - 2011
Note: Perinatal deaths as a result of terminations of pregnancy for maternal psychosocial indications have been excluded.
6.4.3 Placental pathology
Following a stillbirth, neonatal death in the delivery room or birth of a high-risk infant, the placenta should be sent for examination by a perinatal/paediatric pathologist regardless of whether consent for an autopsy has been gained.
The placenta is an integral part of the postmortem examination and, ideally, all placentas should be retained for a few days after birth to allow subsequent retrieval should an infant deteriorate, such as may happen with sepsis or a metabolic disorder. The placenta, membrane and cord should be sent to the pathologist fresh and unfixed for histopathological examination once samples have been collected for cytogenetics and microbiology.
Placental examination by a perinatal/paediatric pathologist should be performed for all high-risk neonates including:
infants admitted to neonatal intensive care infants failing to respond to resuscitation spontaneous preterm labour and birth planned delivery for fetal compromise including growth restriction severe cardiorespiratory depression at birth including resuscitated stillborn babies signs consistent with congenital infection severe growth restriction hydropic infants
0
10
20
30
40
50
60
2000 2001 2002 2003 2004 2005 2006 2007 2008 2009 2010 2011
%
Stillbirth
Neonatal
Perinatal
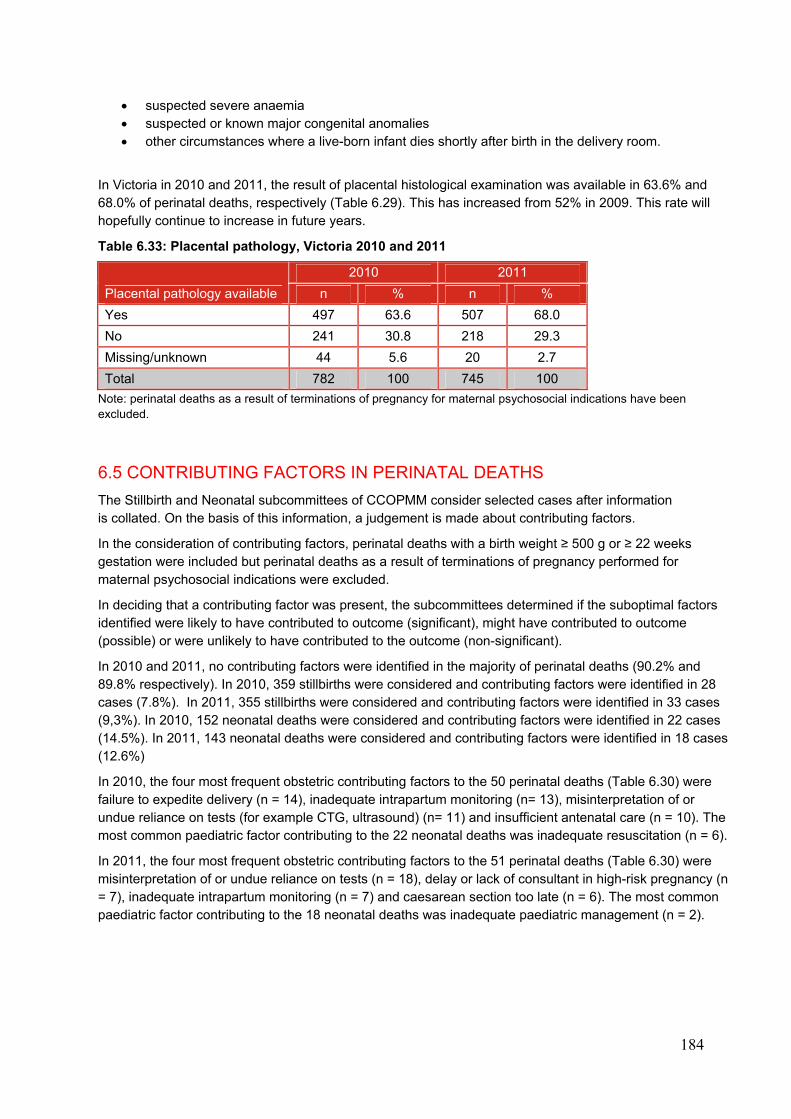
184
suspected severe anaemia suspected or known major congenital anomalies other circumstances where a live-born infant dies shortly after birth in the delivery room.
In Victoria in 2010 and 2011, the result of placental histological examination was available in 63.6% and 68.0% of perinatal deaths, respectively (Table 6.29). This has increased from 52% in 2009. This rate will hopefully continue to increase in future years.
Table 6.33: Placental pathology, Victoria 2010 and 2011
Placental pathology available
2010 2011
n % n %
Yes 497 63.6 507 68.0
No 241 30.8 218 29.3
Missing/unknown 44 5.6 20 2.7
Total 782 100 745 100
Note: perinatal deaths as a result of terminations of pregnancy for maternal psychosocial indications have been excluded.
6.5 CONTRIBUTING FACTORS IN PERINATAL DEATHS
The Stillbirth and Neonatal subcommittees of CCOPMM consider selected cases after information is collated. On the basis of this information, a judgement is made about contributing factors.
In the consideration of contributing factors, perinatal deaths with a birth weight ≥ 500 g or ≥ 22 weeks gestation were included but perinatal deaths as a result of terminations of pregnancy performed for maternal psychosocial indications were excluded.
In deciding that a contributing factor was present, the subcommittees determined if the suboptimal factors identified were likely to have contributed to outcome (significant), might have contributed to outcome (possible) or were unlikely to have contributed to the outcome (non-significant).
In 2010 and 2011, no contributing factors were identified in the majority of perinatal deaths (90.2% and 89.8% respectively). In 2010, 359 stillbirths were considered and contributing factors were identified in 28 cases (7.8%). In 2011, 355 stillbirths were considered and contributing factors were identified in 33 cases (9,3%). In 2010, 152 neonatal deaths were considered and contributing factors were identified in 22 cases (14.5%). In 2011, 143 neonatal deaths were considered and contributing factors were identified in 18 cases (12.6%)
In 2010, the four most frequent obstetric contributing factors to the 50 perinatal deaths (Table 6.30) were failure to expedite delivery (n = 14), inadequate intrapartum monitoring (n= 13), misinterpretation of or undue reliance on tests (for example CTG, ultrasound) (n= 11) and insufficient antenatal care (n = 10). The most common paediatric factor contributing to the 22 neonatal deaths was inadequate resuscitation (n = 6).
In 2011, the four most frequent obstetric contributing factors to the 51 perinatal deaths (Table 6.30) were misinterpretation of or undue reliance on tests (n = 18), delay or lack of consultant in high-risk pregnancy (n = 7), inadequate intrapartum monitoring (n = 7) and caesarean section too late (n = 6). The most common paediatric factor contributing to the 18 neonatal deaths was inadequate paediatric management (n = 2).
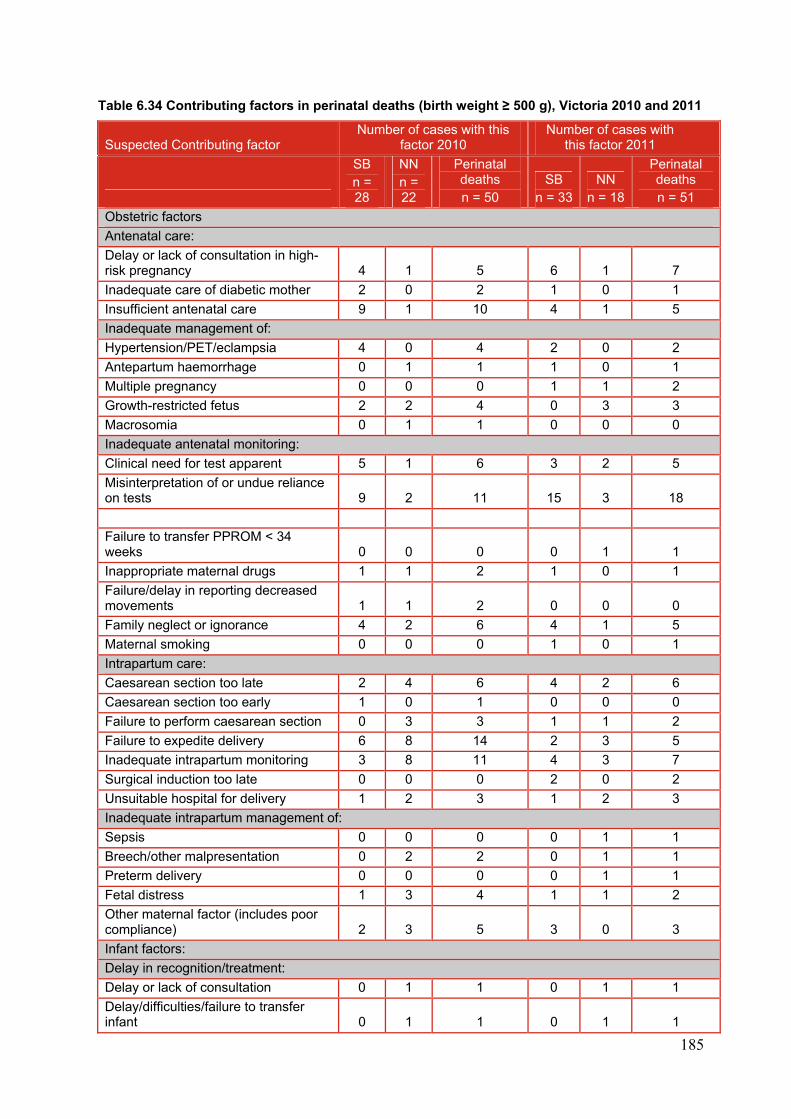
185
Table 6.34 Contributing factors in perinatal deaths (birth weight ≥ 500 g), Victoria 2010 and 2011
Suspected Contributing factor Number of cases with this
factor 2010 Number of cases with
this factor 2011
SB n = 28
NN n = 22
Perinatal deaths n = 50
SB n = 33
NN n = 18
Perinatal deaths n = 51
Obstetric factors
Antenatal care:
Delay or lack of consultation in high-risk pregnancy 4 1 5 6 1 7
Inadequate care of diabetic mother 2 0 2 1 0 1
Insufficient antenatal care 9 1 10 4 1 5
Inadequate management of:
Hypertension/PET/eclampsia 4 0 4 2 0 2
Antepartum haemorrhage 0 1 1 1 0 1
Multiple pregnancy 0 0 0 1 1 2
Growth-restricted fetus 2 2 4 0 3 3
Macrosomia 0 1 1 0 0 0
Inadequate antenatal monitoring:
Clinical need for test apparent 5 1 6 3 2 5
Misinterpretation of or undue reliance on tests 9 2 11 15 3 18
Failure to transfer PPROM < 34 weeks 0 0 0 0 1 1
Inappropriate maternal drugs 1 1 2 1 0 1
Failure/delay in reporting decreased movements 1 1 2 0 0 0
Family neglect or ignorance 4 2 6 4 1 5
Maternal smoking 0 0 0 1 0 1
Intrapartum care:
Caesarean section too late 2 4 6 4 2 6
Caesarean section too early 1 0 1 0 0 0
Failure to perform caesarean section 0 3 3 1 1 2
Failure to expedite delivery 6 8 14 2 3 5
Inadequate intrapartum monitoring 3 8 11 4 3 7
Surgical induction too late 0 0 0 2 0 2
Unsuitable hospital for delivery 1 2 3 1 2 3
Inadequate intrapartum management of:
Sepsis 0 0 0 0 1 1
Breech/other malpresentation 0 2 2 0 1 1
Preterm delivery 0 0 0 0 1 1
Fetal distress 1 3 4 1 1 2
Other maternal factor (includes poor compliance) 2 3 5 3 0 3
Infant factors:
Delay in recognition/treatment:
Delay or lack of consultation 0 1 1 0 1 1
Delay/difficulties/failure to transfer infant 0 1 1 0 1 1
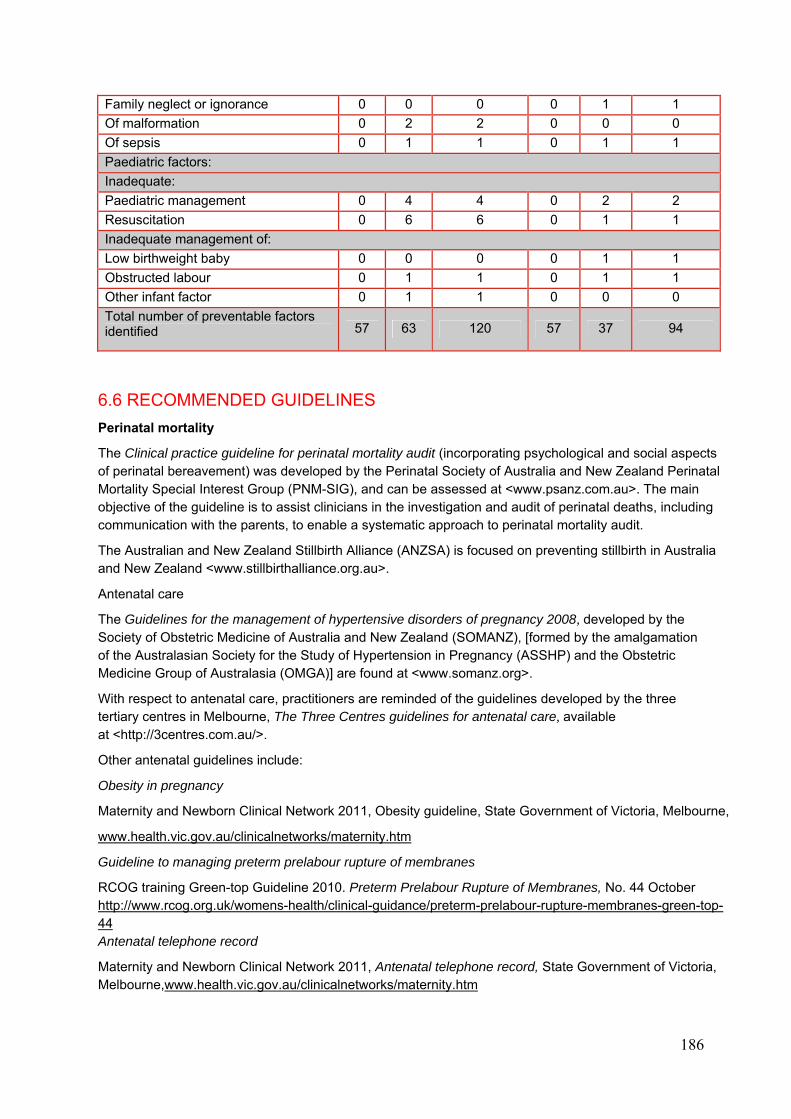
186
Family neglect or ignorance 0 0 0 0 1 1
Of malformation 0 2 2 0 0 0
Of sepsis 0 1 1 0 1 1
Paediatric factors:
Inadequate:
Paediatric management 0 4 4 0 2 2
Resuscitation 0 6 6 0 1 1
Inadequate management of:
Low birthweight baby 0 0 0 0 1 1
Obstructed labour 0 1 1 0 1 1
Other infant factor 0 1 1 0 0 0
Total number of preventable factors identified 57 63 120 57 37 94
6.6 RECOMMENDED GUIDELINES
Perinatal mortality
The Clinical practice guideline for perinatal mortality audit (incorporating psychological and social aspects of perinatal bereavement) was developed by the Perinatal Society of Australia and New Zealand Perinatal Mortality Special Interest Group (PNM-SIG), and can be assessed at <www.psanz.com.au>. The main objective of the guideline is to assist clinicians in the investigation and audit of perinatal deaths, including communication with the parents, to enable a systematic approach to perinatal mortality audit.
The Australian and New Zealand Stillbirth Alliance (ANZSA) is focused on preventing stillbirth in Australia and New Zealand <www.stillbirthalliance.org.au>.
Antenatal care
The Guidelines for the management of hypertensive disorders of pregnancy 2008, developed by the Society of Obstetric Medicine of Australia and New Zealand (SOMANZ), [formed by the amalgamation of the Australasian Society for the Study of Hypertension in Pregnancy (ASSHP) and the Obstetric Medicine Group of Australasia (OMGA)] are found at <www.somanz.org>.
With respect to antenatal care, practitioners are reminded of the guidelines developed by the three tertiary centres in Melbourne, The Three Centres guidelines for antenatal care, available at <http://3centres.com.au/>.
Other antenatal guidelines include:
Obesity in pregnancy
Maternity and Newborn Clinical Network 2011, Obesity guideline, State Government of Victoria, Melbourne,
www.health.vic.gov.au/clinicalnetworks/maternity.htm
Guideline to managing preterm prelabour rupture of membranes
RCOG training Green-top Guideline 2010. Preterm Prelabour Rupture of Membranes, No. 44 October http://www.rcog.org.uk/womens-health/clinical-guidance/preterm-prelabour-rupture-membranes-green-top-44 Antenatal telephone record
Maternity and Newborn Clinical Network 2011, Antenatal telephone record, State Government of Victoria, Melbourne,www.health.vic.gov.au/clinicalnetworks/maternity.htm

187
National midwifery guidelines for consultation and referral, Indications during pregnancy and labour - Non cephalic presentation at full term.
National midwifery guidelines for consultation and referral 3rd edition 2013, “Indications during pregnancy and labour” - Non cephalic presentation at full term - C(Referral), Section 8.1.1, p50, 7.1.17, p47
http://www.clinicalguidelines.gov.au/browse.php?treePath=&pageType=2&fldglrID=1534&
Neonatal resuscitation
Guidelines
The Australian Resuscitation Council guidelines (December 2010) can be found at <www.resus.org.au>.
NeoResus
NeoResus is a specialised training program designed to standardise the way newborn resuscitation is taught in Victoria. Face-to-face, multidisciplinary training programs are supported by online, evidence�based learning modules, which are completed by all program participants in two skills-based, teamwork-focused training programs: First Response and Advanced <www.neoresus.org.au>.
Examination of the newborn
The Paediatrics and Child Health Division of The Royal Australasian College of Physicians guidelines for examination of the newborn are available at <www.racp.edu.au/page/paed-policy>.
Neonatal handbook
The Neonatal handbook contains guidelines which detail the initial assessment and management of many conditions encountered in the newborn period. It is available at <www.netsvic.org.au/nets/handbook>.
Emergency transport services
Paediatric Infant Perinatal Emergency Retrieval (PIPER) represents a cooperation of the Victorian Paediatric Emergency Transport Service (PETS), the Newborn Emergency Transport Service (NETS) and the Perinatal Emergency Referral Service (PERS) under the governance of the Royal Children's Hospital.
Direct all paediatric, infant and perinatal emergency retrieval queries to 1300 137 650.
The cooperation is a statewide, 24-hour service that provides emergency referral and retrieval services for critically ill babies and children as well as providing advice and facilitating in utero transfers for high-risk pregnant women to ensure timely and equitable access to appropriate levels of maternity, neonatal and paediatric intensive care.
Royal Australian and New Zealand College of Obstetricians and Gynaecologists
Specific RANZCOG guidelines relating to CCOPMM recommendations;
Guidelines for the use of RhD immunoglobulin (Anti-D) in obstetrics in Australia (C-Obs 6)
Suitability criteria for models of care and indications for referral within and between models of care (C-Obs 30).
Management of obesity in pregnancy (C-Obs 49)
The Royal Australian and New Zealand College of Obstetricians and Gynaecologists (RANZCOG), Management of Obesity in Pregnancy, C-Obs 49, Sept 2013
www.ranzcog.edu.au/doc/management-of-obesity-in-pregnancy.html
Clinical guidelines for Intrapartum fetal surveillance
Royal Australian and New Zealand College of Obstetricians and Gynaecologists 2010, Intrapartum fetal surveillance clinical guidelines, 11, p8, 2nd edition, RANZCOG, Melbourne,

188
Clinical Guidelines for the management of women who report decreased fetal movements
http://www.ranzcog.edu.au/intrapartum-fetal-surveillance-clinical-guidelines.html
For information on all RANZCOG guidelines visit <www.ranzcog.edu.au>.
Postnatal care
Recognising serious illness in your infant
State of Victoria, Department of Education and Early Childhood Development 2013 “Recognising serious illness in you infant”, in My Health and Development Record. Melbourne: Internal Publication.
http://www.education.vic.gov.au/childhood/parents/mch/Pages/record.aspx
189
7. POST-NEONATAL INFANT, CHILD AND ADOLESCENT DEATH
REVIEW 2010–2011
7.1 INTRODUCTION
This section reports on the post-neonatal infant, child and adolescent deaths (28 days - 17 years) that occurred during the 2010 and 2011 calendar years. Accurate information for these age groups is important and CCOPMM wishes to thank medical practitioners, health professionals, the State Coroner’s Office and similar bodies in other jurisdictions that provided additional information on post-neonatal infant, child and adolescent deaths. Such assistance with data provision is greatly appreciated.
This is the sixth and seventh years that CCOPMM has reported on the deaths of adolescents aged 15 to 17 years (up to, but not including the 18th birthday), as a result of an amendment made to the Health Act 1958 in June 2004.
In 2010, CCOPMM was notified of the deaths of 264 children (94 post-neonatal infants aged 28–364 days
and 170 children and adolescents 1–17 years of age). There were no reports to CCOPMM of Victorian residents who died interstate or overseas in 2010.
In 2011, CCOPMM was notified of the deaths of 227 children (64 post-neonatal infants aged 28–364 days
and 163 children and adolescents 1–17 years of age). In addition, one adolescent who was a resident of Victoria and died interstate (Queensland) in 2011 was identified from a published report. 67
Fewer than 10 of the deaths in 2010 and 2011 combined were documented to be in Aboriginal and Torres Strait Islander people.
As in the past, CCOPMM only reports on deaths of children who were residents in Victoria and who died in Victoria during the calendar years 2010–2011. As a result, the following deaths are excluded:
• 2010 (see Figure 7.1a)
One post-neonatal infant and six children died in Victoria but were normally resident outside Victoria. The place of residence on the death certificate was listed as Northern Territory, Queensland, South Australia and Western Australia (each one) and New South Wales (three). The causes of death were congenital anomaly, SIDS, drowning and infection (each one) and motor vehicle accident (three).
• 2011 (see Figure 7.1b)
Two Victorian residents were known to have died interstate (one each in NSW and QLD) in 2011, and the death was from unintentional injury in both cases.
Four post-neonatal infants and five children died in Victoria but were normally resident outside Victoria. The place of residence on the death certificate was listed as New South Wales, Queensland and Western Australia (each one), and South Australia and Tasmania (each three). The causes of death were other acquired disease (one) motor vehicle accident (three) and congenital anomaly (five).
There were therefore 257 child deaths (93 post-neonatal infants and 164 children and adolescents) in 2010 and 217 child deaths (60 post-neonatal infants and 157 children and adolescents) in 2011 detailed in this section of the report.
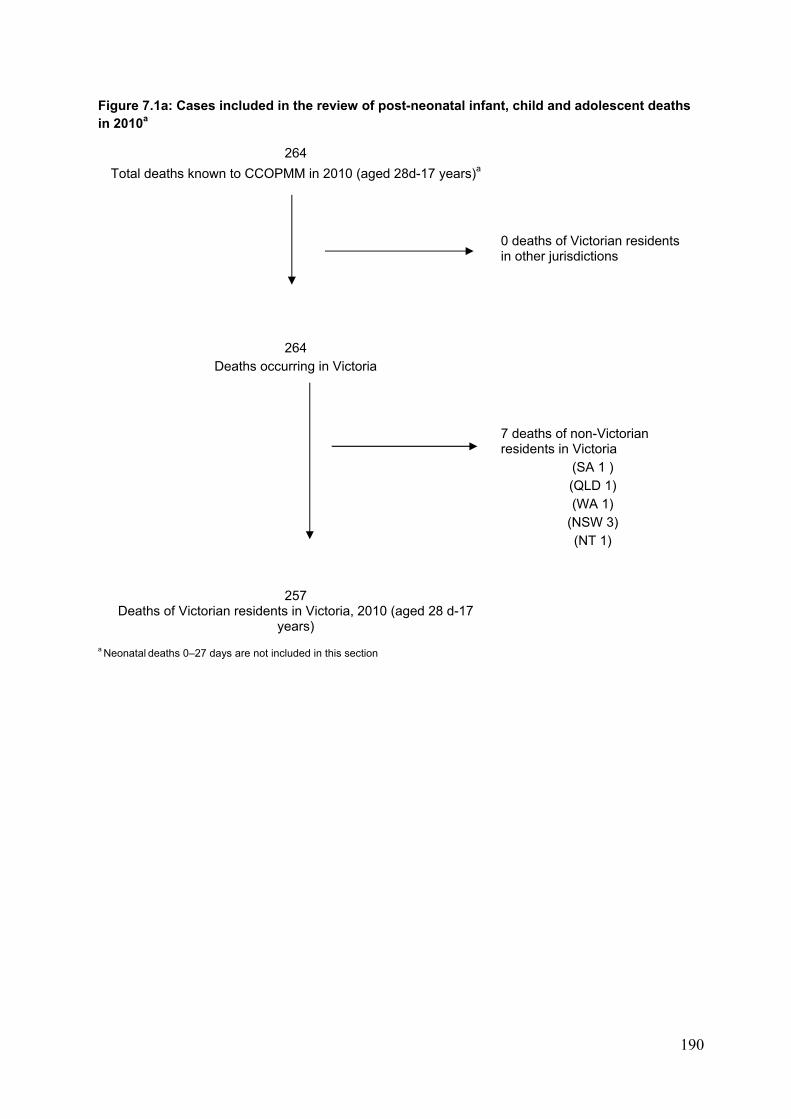
190
Figure 7.1a: Cases included in the review of post-neonatal infant, child and adolescent deaths in 2010a
264
Total deaths known to CCOPMM in 2010 (aged 28d-17 years)a
0 deaths of Victorian residents in other jurisdictions
264 Deaths occurring in Victoria
7 deaths of non-Victorian residents in Victoria
(SA 1 ) (QLD 1) (WA 1)
(NSW 3) (NT 1)
257 Deaths of Victorian residents in Victoria, 2010 (aged 28 d-17
years)
a Neonatal deaths 0–27 days are not included in this section
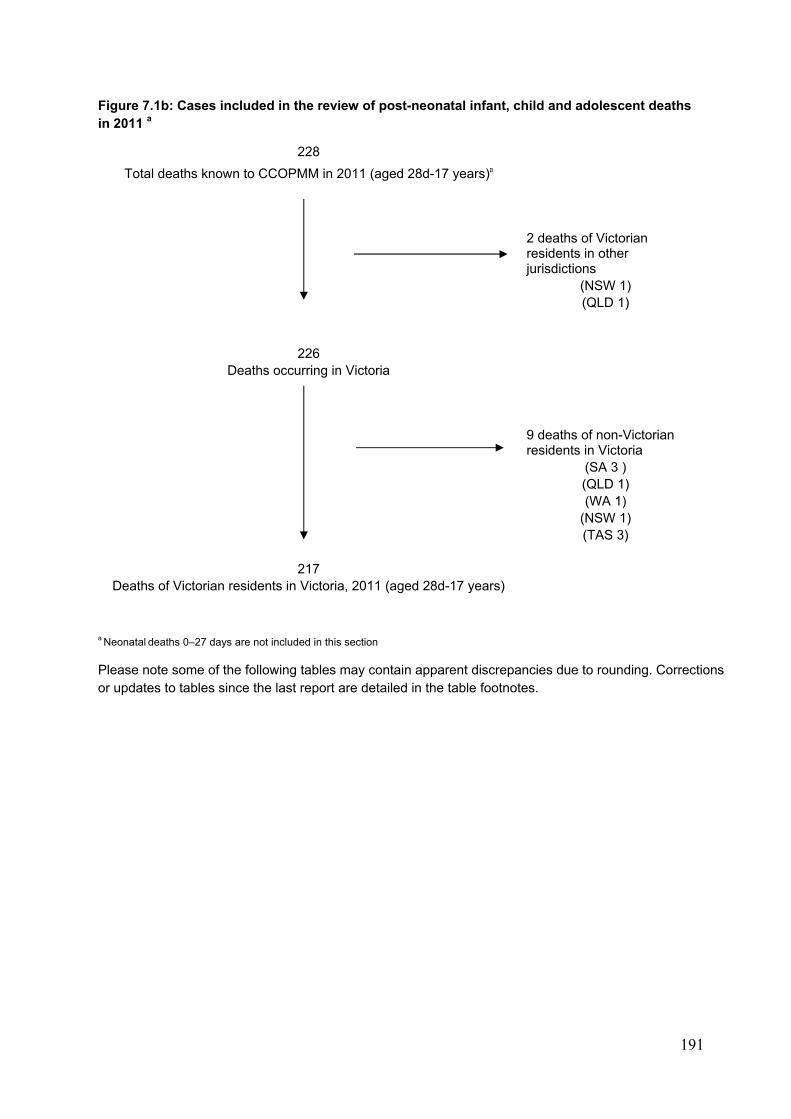
191
Figure 7.1b: Cases included in the review of post-neonatal infant, child and adolescent deaths in 2011 a
228
Total deaths known to CCOPMM in 2011 (aged 28d-17 years)a
2 deaths of Victorian residents in other jurisdictions
(NSW 1) (QLD 1)
226 Deaths occurring in Victoria
9 deaths of non-Victorian residents in Victoria
(SA 3 ) (QLD 1) (WA 1)
(NSW 1) (TAS 3)
217 Deaths of Victorian residents in Victoria, 2011 (aged 28d-17 years)
a Neonatal deaths 0–27 days are not included in this section
Please note some of the following tables may contain apparent discrepancies due to rounding. Corrections or updates to tables since the last report are detailed in the table footnotes.
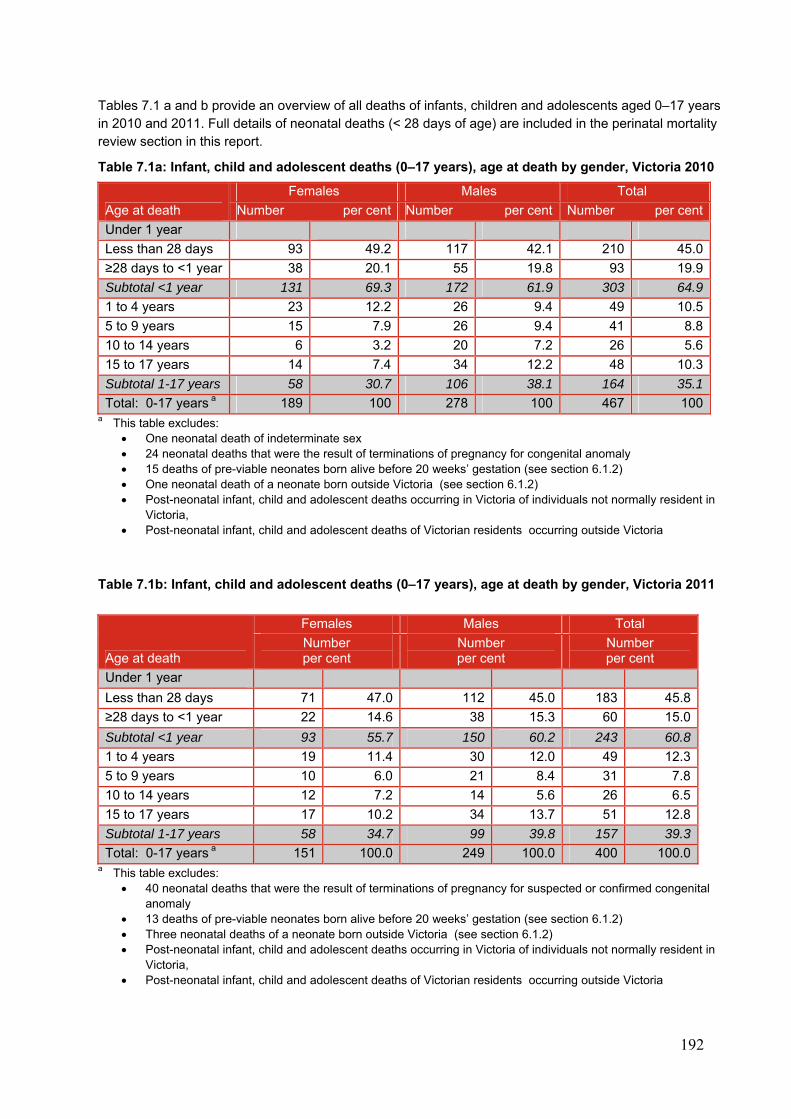
192
Tables 7.1 a and b provide an overview of all deaths of infants, children and adolescents aged 0–17 years in 2010 and 2011. Full details of neonatal deaths (< 28 days of age) are included in the perinatal mortality review section in this report.
Table 7.1a: Infant, child and adolescent deaths (0–17 years), age at death by gender, Victoria 2010
Age at death
Females Males Total
Number per cent Number per cent Number per cent
Under 1 year
Less than 28 days 93 49.2 117 42.1 210 45.0
≥28 days to <1 year 38 20.1 55 19.8 93 19.9
Subtotal <1 year 131 69.3 172 61.9 303 64.9
1 to 4 years 23 12.2 26 9.4 49 10.5
5 to 9 years 15 7.9 26 9.4 41 8.8
10 to 14 years 6 3.2 20 7.2 26 5.6
15 to 17 years 14 7.4 34 12.2 48 10.3
Subtotal 1-17 years 58 30.7 106 38.1 164 35.1
Total: 0-17 years a 189 100 278 100 467 100a This table excludes:
One neonatal death of indeterminate sex 24 neonatal deaths that were the result of terminations of pregnancy for congenital anomaly 15 deaths of pre-viable neonates born alive before 20 weeks’ gestation (see section 6.1.2) One neonatal death of a neonate born outside Victoria (see section 6.1.2) Post-neonatal infant, child and adolescent deaths occurring in Victoria of individuals not normally resident in
Victoria, Post-neonatal infant, child and adolescent deaths of Victorian residents occurring outside Victoria
Table 7.1b: Infant, child and adolescent deaths (0–17 years), age at death by gender, Victoria 2011
Age at death
Females Males Total
Number per cent
Number per cent
Number per cent
Under 1 year
Less than 28 days 71 47.0 112 45.0 183 45.8
≥28 days to <1 year 22 14.6 38 15.3 60 15.0
Subtotal <1 year 93 55.7 150 60.2 243 60.8
1 to 4 years 19 11.4 30 12.0 49 12.3
5 to 9 years 10 6.0 21 8.4 31 7.8
10 to 14 years 12 7.2 14 5.6 26 6.5
15 to 17 years 17 10.2 34 13.7 51 12.8
Subtotal 1-17 years 58 34.7 99 39.8 157 39.3
Total: 0-17 years a 151 100.0 249 100.0 400 100.0a This table excludes:
40 neonatal deaths that were the result of terminations of pregnancy for suspected or confirmed congenital anomaly
13 deaths of pre-viable neonates born alive before 20 weeks’ gestation (see section 6.1.2) Three neonatal deaths of a neonate born outside Victoria (see section 6.1.2) Post-neonatal infant, child and adolescent deaths occurring in Victoria of individuals not normally resident in
Victoria, Post-neonatal infant, child and adolescent deaths of Victorian residents occurring outside Victoria
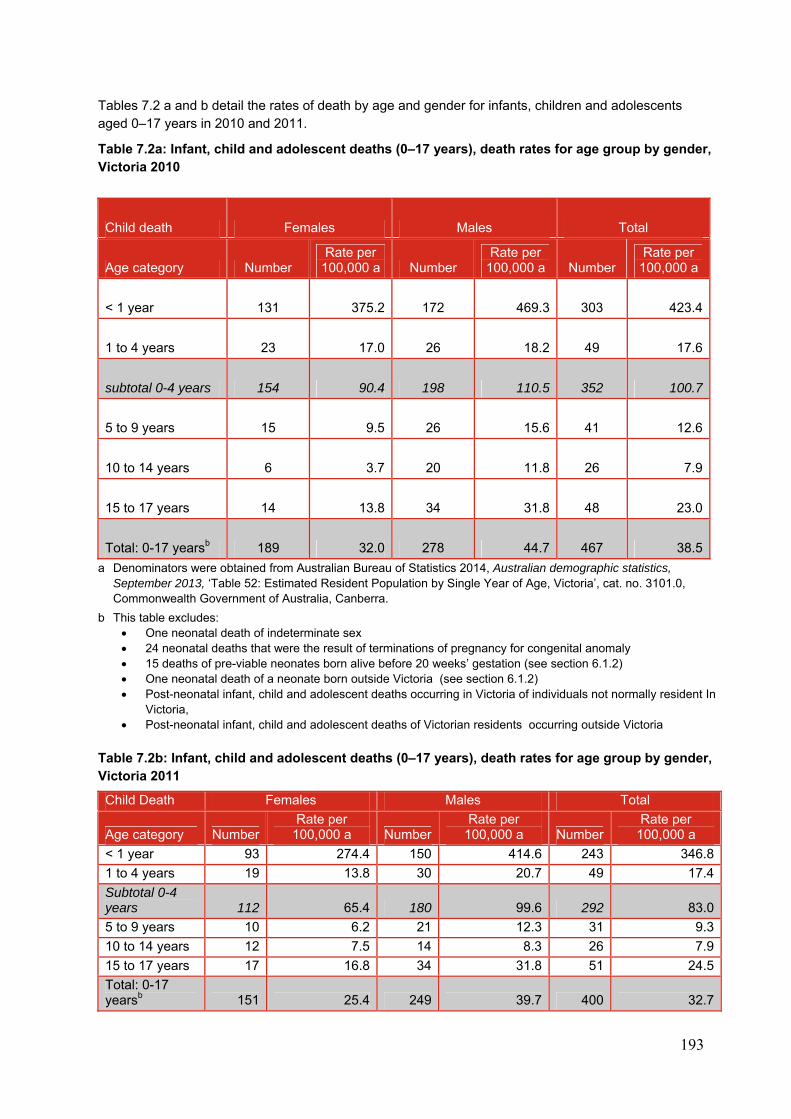
193
Tables 7.2 a and b detail the rates of death by age and gender for infants, children and adolescents aged 0–17 years in 2010 and 2011.
Table 7.2a: Infant, child and adolescent deaths (0–17 years), death rates for age group by gender, Victoria 2010
Child death Females Males Total
Age category Number Rate per
100,000 a Number Rate per
100,000 a Number Rate per
100,000 a
< 1 year 131 375.2 172 469.3 303 423.4
1 to 4 years 23 17.0 26 18.2 49 17.6
subtotal 0-4 years 154 90.4 198 110.5 352 100.7
5 to 9 years 15 9.5 26 15.6 41 12.6
10 to 14 years 6 3.7 20 11.8 26 7.9
15 to 17 years 14 13.8 34 31.8 48 23.0
Total: 0-17 yearsb 189 32.0 278 44.7 467 38.5
a Denominators were obtained from Australian Bureau of Statistics 2014, Australian demographic statistics, September 2013, ‘Table 52: Estimated Resident Population by Single Year of Age, Victoria’, cat. no. 3101.0, Commonwealth Government of Australia, Canberra.
b This table excludes: One neonatal death of indeterminate sex 24 neonatal deaths that were the result of terminations of pregnancy for congenital anomaly 15 deaths of pre-viable neonates born alive before 20 weeks’ gestation (see section 6.1.2) One neonatal death of a neonate born outside Victoria (see section 6.1.2) Post-neonatal infant, child and adolescent deaths occurring in Victoria of individuals not normally resident In
Victoria, Post-neonatal infant, child and adolescent deaths of Victorian residents occurring outside Victoria
Table 7.2b: Infant, child and adolescent deaths (0–17 years), death rates for age group by gender, Victoria 2011
Child Death Females Males Total
Age category Number Rate per
100,000 a NumberRate per
100,000 a Number Rate per
100,000 a
< 1 year 93 274.4 150 414.6 243 346.8
1 to 4 years 19 13.8 30 20.7 49 17.4
Subtotal 0-4 years 112 65.4 180 99.6 292 83.0
5 to 9 years 10 6.2 21 12.3 31 9.3
10 to 14 years 12 7.5 14 8.3 26 7.9
15 to 17 years 17 16.8 34 31.8 51 24.5
Total: 0-17 yearsb 151 25.4 249 39.7 400 32.7
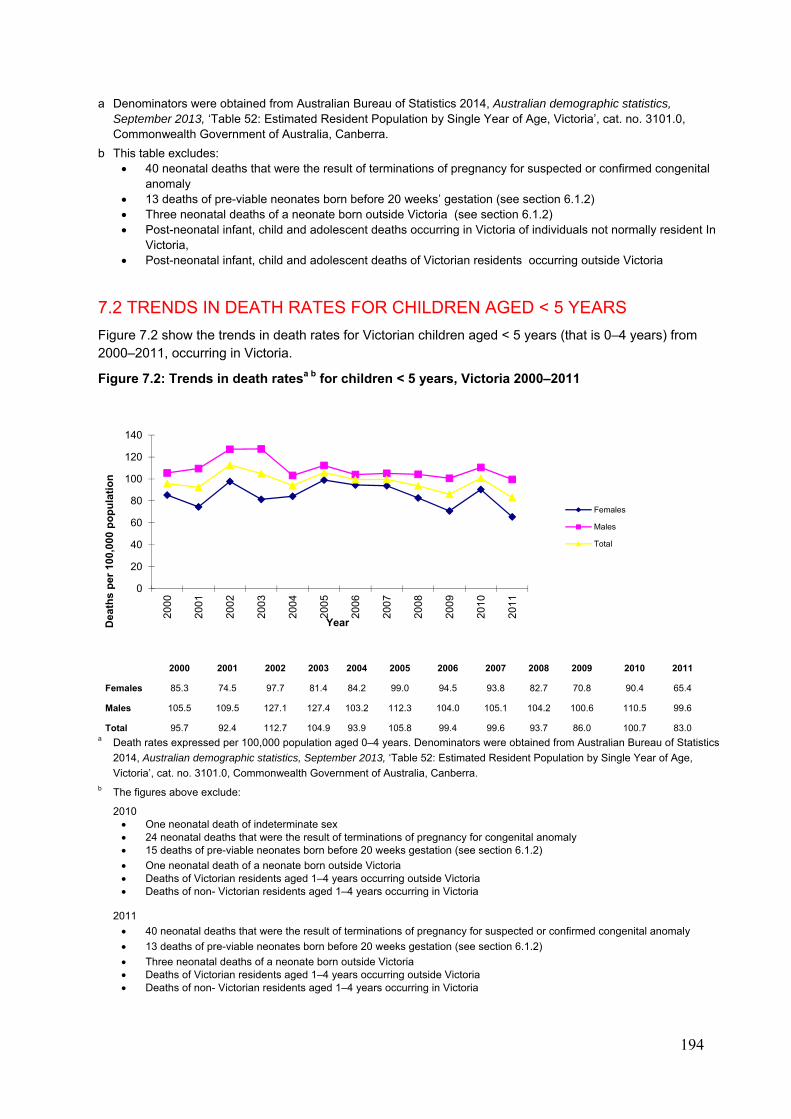
194
a Denominators were obtained from Australian Bureau of Statistics 2014, Australian demographic statistics, September 2013, ‘Table 52: Estimated Resident Population by Single Year of Age, Victoria’, cat. no. 3101.0, Commonwealth Government of Australia, Canberra.
b This table excludes: 40 neonatal deaths that were the result of terminations of pregnancy for suspected or confirmed congenital
anomaly 13 deaths of pre-viable neonates born before 20 weeks’ gestation (see section 6.1.2) Three neonatal deaths of a neonate born outside Victoria (see section 6.1.2) Post-neonatal infant, child and adolescent deaths occurring in Victoria of individuals not normally resident In
Victoria, Post-neonatal infant, child and adolescent deaths of Victorian residents occurring outside Victoria
7.2 TRENDS IN DEATH RATES FOR CHILDREN AGED < 5 YEARS
Figure 7.2 show the trends in death rates for Victorian children aged < 5 years (that is 0–4 years) from 2000–2011, occurring in Victoria.
Figure 7.2: Trends in death ratesa b for children < 5 years, Victoria 2000–2011
2000 2001 2002 2003 2004 2005 2006 2007 2008 2009 2010 2011
Females 85.3 74.5 97.7 81.4 84.2 99.0 94.5 93.8 82.7 70.8 90.4 65.4
Males 105.5 109.5 127.1 127.4 103.2 112.3 104.0 105.1 104.2 100.6 110.5 99.6
Total 95.7 92.4 112.7 104.9 93.9 105.8 99.4 99.6 93.7 86.0 100.7 83.0 a Death rates expressed per 100,000 population aged 0–4 years. Denominators were obtained from Australian Bureau of Statistics
2014, Australian demographic statistics, September 2013, ‘Table 52: Estimated Resident Population by Single Year of Age,
Victoria’, cat. no. 3101.0, Commonwealth Government of Australia, Canberra. b The figures above exclude:
2010 One neonatal death of indeterminate sex 24 neonatal deaths that were the result of terminations of pregnancy for congenital anomaly 15 deaths of pre-viable neonates born before 20 weeks gestation (see section 6.1.2)
One neonatal death of a neonate born outside Victoria Deaths of Victorian residents aged 1–4 years occurring outside Victoria Deaths of non- Victorian residents aged 1–4 years occurring in Victoria
2011
40 neonatal deaths that were the result of terminations of pregnancy for suspected or confirmed congenital anomaly
13 deaths of pre-viable neonates born before 20 weeks gestation (see section 6.1.2)
Three neonatal deaths of a neonate born outside Victoria Deaths of Victorian residents aged 1–4 years occurring outside Victoria Deaths of non- Victorian residents aged 1–4 years occurring in Victoria
0
20
40
60
80
100
120
140
200
0
200
1
200
2
200
3
200
4
200
5
200
6
200
7
200
8
200
9
201
0
201
1
Dea
ths
per
100
,000
po
pu
lati
on
Year
Females
Males
Total
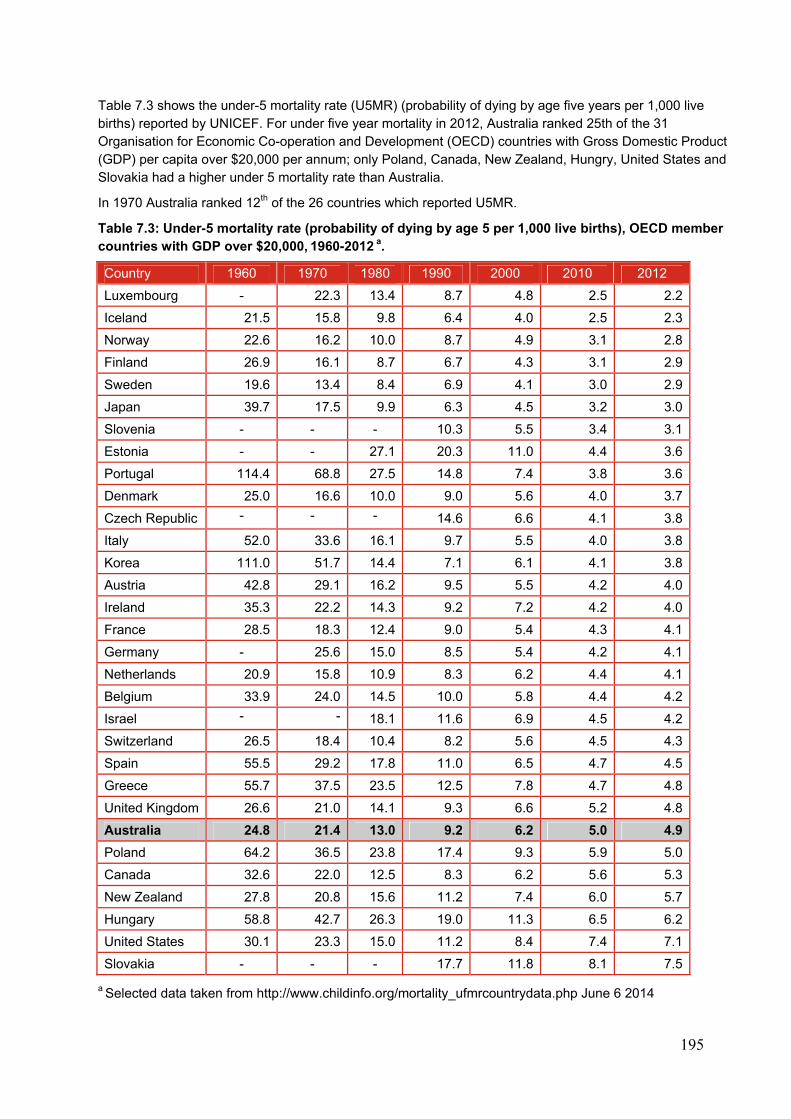
195
Table 7.3 shows the under-5 mortality rate (U5MR) (probability of dying by age five years per 1,000 live births) reported by UNICEF. For under five year mortality in 2012, Australia ranked 25th of the 31 Organisation for Economic Co-operation and Development (OECD) countries with Gross Domestic Product (GDP) per capita over $20,000 per annum; only Poland, Canada, New Zealand, Hungry, United States and Slovakia had a higher under 5 mortality rate than Australia.
In 1970 Australia ranked 12th of the 26 countries which reported U5MR.
Table 7.3: Under-5 mortality rate (probability of dying by age 5 per 1,000 live births), OECD member countries with GDP over $20,000, 1960-2012 a.
Country 1960 1970 1980 1990 2000 2010 2012
Luxembourg - 22.3 13.4 8.7 4.8 2.5 2.2
Iceland 21.5 15.8 9.8 6.4 4.0 2.5 2.3
Norway 22.6 16.2 10.0 8.7 4.9 3.1 2.8
Finland 26.9 16.1 8.7 6.7 4.3 3.1 2.9
Sweden 19.6 13.4 8.4 6.9 4.1 3.0 2.9
Japan 39.7 17.5 9.9 6.3 4.5 3.2 3.0
Slovenia - - - 10.3 5.5 3.4 3.1
Estonia - - 27.1 20.3 11.0 4.4 3.6
Portugal 114.4 68.8 27.5 14.8 7.4 3.8 3.6
Denmark 25.0 16.6 10.0 9.0 5.6 4.0 3.7
Czech Republic - - - 14.6 6.6 4.1 3.8
Italy 52.0 33.6 16.1 9.7 5.5 4.0 3.8
Korea 111.0 51.7 14.4 7.1 6.1 4.1 3.8
Austria 42.8 29.1 16.2 9.5 5.5 4.2 4.0
Ireland 35.3 22.2 14.3 9.2 7.2 4.2 4.0
France 28.5 18.3 12.4 9.0 5.4 4.3 4.1
Germany - 25.6 15.0 8.5 5.4 4.2 4.1
Netherlands 20.9 15.8 10.9 8.3 6.2 4.4 4.1
Belgium 33.9 24.0 14.5 10.0 5.8 4.4 4.2
Israel - - 18.1 11.6 6.9 4.5 4.2
Switzerland 26.5 18.4 10.4 8.2 5.6 4.5 4.3
Spain 55.5 29.2 17.8 11.0 6.5 4.7 4.5
Greece 55.7 37.5 23.5 12.5 7.8 4.7 4.8
United Kingdom 26.6 21.0 14.1 9.3 6.6 5.2 4.8
Australia 24.8 21.4 13.0 9.2 6.2 5.0 4.9
Poland 64.2 36.5 23.8 17.4 9.3 5.9 5.0
Canada 32.6 22.0 12.5 8.3 6.2 5.6 5.3
New Zealand 27.8 20.8 15.6 11.2 7.4 6.0 5.7
Hungary 58.8 42.7 26.3 19.0 11.3 6.5 6.2
United States 30.1 23.3 15.0 11.2 8.4 7.4 7.1
Slovakia - - - 17.7 11.8 8.1 7.5
a Selected data taken from http://www.childinfo.org/mortality_ufmrcountrydata.php June 6 2014
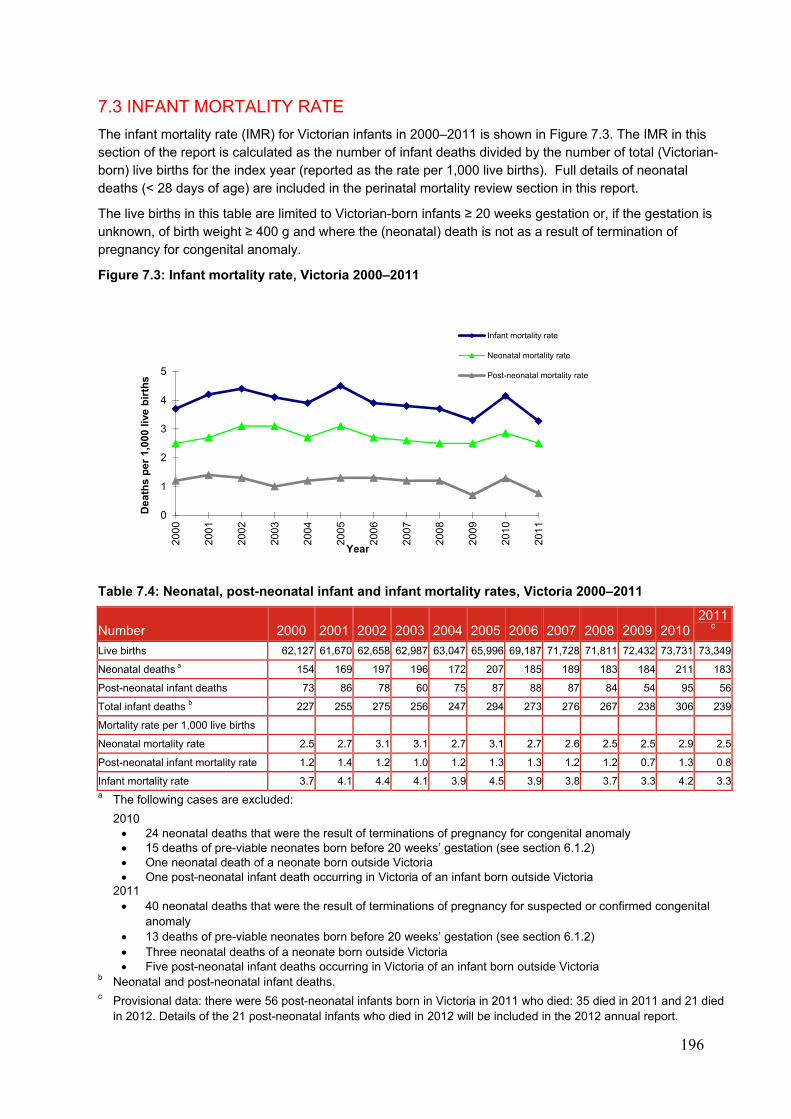
196
7.3 INFANT MORTALITY RATE
The infant mortality rate (IMR) for Victorian infants in 2000–2011 is shown in Figure 7.3. The IMR in this section of the report is calculated as the number of infant deaths divided by the number of total (Victorian-born) live births for the index year (reported as the rate per 1,000 live births). Full details of neonatal deaths (< 28 days of age) are included in the perinatal mortality review section in this report.
The live births in this table are limited to Victorian-born infants ≥ 20 weeks gestation or, if the gestation is unknown, of birth weight ≥ 400 g and where the (neonatal) death is not as a result of termination of pregnancy for congenital anomaly.
Figure 7.3: Infant mortality rate, Victoria 2000–2011
Table 7.4: Neonatal, post-neonatal infant and infant mortality rates, Victoria 2000–2011
Number 2000 2001 2002 2003 2004 2005 2006 2007 2008 2009 20102011
c
Live births 62,127 61,670 62,658 62,987 63,047 65,996 69,187 71,728 71,811 72,432 73,731 73,349
Neonatal deaths a 154 169 197 196 172 207 185 189 183 184 211 183
Post-neonatal infant deaths 73 86 78 60 75 87 88 87 84 54 95 56
Total infant deaths b 227 255 275 256 247 294 273 276 267 238 306 239
Mortality rate per 1,000 live births
Neonatal mortality rate 2.5 2.7 3.1 3.1 2.7 3.1 2.7 2.6 2.5 2.5 2.9 2.5
Post-neonatal infant mortality rate 1.2 1.4 1.2 1.0 1.2 1.3 1.3 1.2 1.2 0.7 1.3 0.8
Infant mortality rate 3.7 4.1 4.4 4.1 3.9 4.5 3.9 3.8 3.7 3.3 4.2 3.3a The following cases are excluded:
2010 24 neonatal deaths that were the result of terminations of pregnancy for congenital anomaly 15 deaths of pre-viable neonates born before 20 weeks’ gestation (see section 6.1.2) One neonatal death of a neonate born outside Victoria One post-neonatal infant death occurring in Victoria of an infant born outside Victoria
2011 40 neonatal deaths that were the result of terminations of pregnancy for suspected or confirmed congenital
anomaly 13 deaths of pre-viable neonates born before 20 weeks’ gestation (see section 6.1.2) Three neonatal deaths of a neonate born outside Victoria Five post-neonatal infant deaths occurring in Victoria of an infant born outside Victoria
b Neonatal and post-neonatal infant deaths. c Provisional data: there were 56 post-neonatal infants born in Victoria in 2011 who died: 35 died in 2011 and 21 died
in 2012. Details of the 21 post-neonatal infants who died in 2012 will be included in the 2012 annual report.
0
1
2
3
4
5
200
0
200
1
200
2
200
3
200
4
200
5
200
6
200
7
200
8
200
9
201
0
201
1
Dea
ths
per
1,0
00 l
ive
bir
ths
Year
Infant mortality rate
Neonatal mortality rate
Post-neonatal mortality rate

197
If the 24 (2010) and 40 (2011) deaths from terminations of pregnancy for congenital anomaly are included in Victoria’s IMR, the rate rises to 4.5 (2010) and 3.8 (2011) per 1,000 live births respectively. If any Victorian-born live birth is included, an additional 15 (2010) and 13 (2011) neonatal deaths occurring in live born infants < 20 weeks gestation are identified, giving an IMR of 4.7 (2010) and 4.0 (2011) per 1,000 live births respectively.
Table 7.5 shows the IMR for the 34 OECD member countries for selected years between 1960 and 2012a. Australia's IMR continues to fall and in 2012 Australia was ranked equal 23rd of the 34 OECD countries for IMR. The countries with the lowest IMR in 2012 were Luxembourg and Iceland. Despite the overall decrease in Australia's IMR, the rate of Australia’s decline in IMR has been significantly slower than other countriesb (data not shown). In 1970, Australia was ranked 11th of the 29 countries which reported IMR.
Although the definition for IMR used by the OECD is the number of deaths of children under one year of age in a given year, expressed per 1,000 live births, it is possible that some countries may use different parameters in calculating IMR (for example birth weight ≥ 500 g or gestation ≥ 22 weeks), so comparisons between countries should be made with caution.
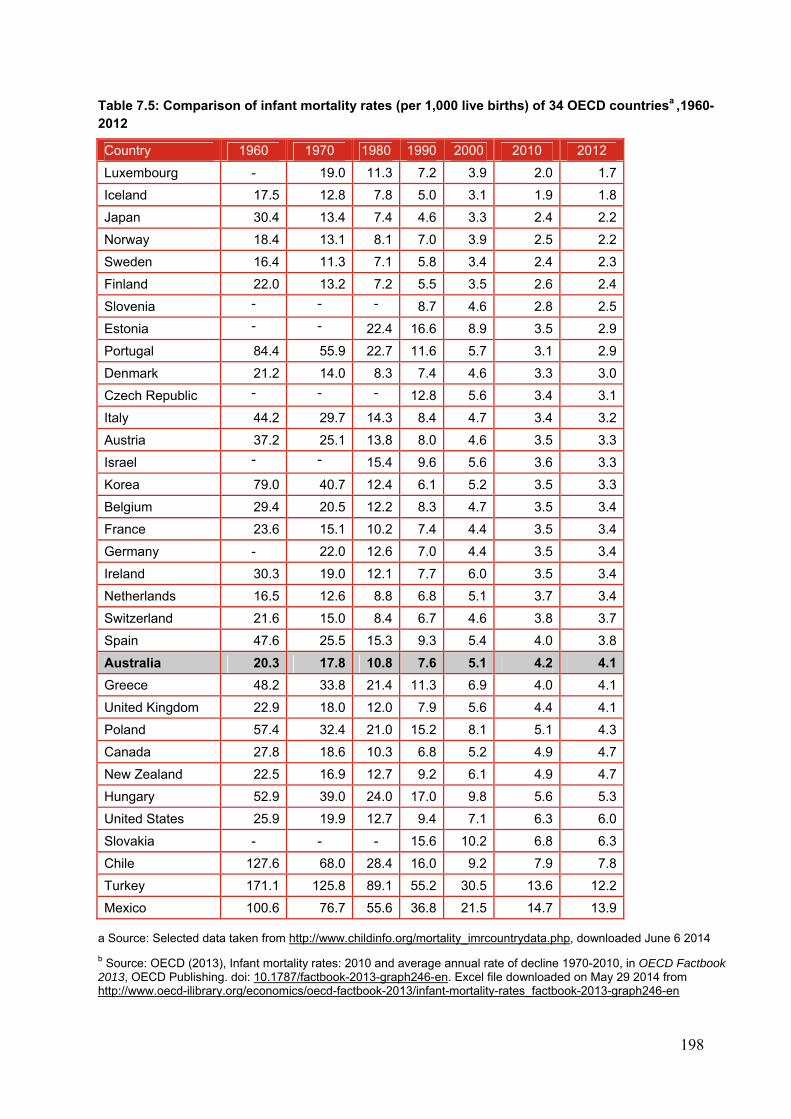
198
Table 7.5: Comparison of infant mortality rates (per 1,000 live births) of 34 OECD countriesa ,1960-2012
Country 1960 1970 1980 1990 2000 2010 2012
Luxembourg - 19.0 11.3 7.2 3.9 2.0 1.7
Iceland 17.5 12.8 7.8 5.0 3.1 1.9 1.8
Japan 30.4 13.4 7.4 4.6 3.3 2.4 2.2
Norway 18.4 13.1 8.1 7.0 3.9 2.5 2.2
Sweden 16.4 11.3 7.1 5.8 3.4 2.4 2.3
Finland 22.0 13.2 7.2 5.5 3.5 2.6 2.4
Slovenia - - - 8.7 4.6 2.8 2.5
Estonia - - 22.4 16.6 8.9 3.5 2.9
Portugal 84.4 55.9 22.7 11.6 5.7 3.1 2.9
Denmark 21.2 14.0 8.3 7.4 4.6 3.3 3.0
Czech Republic - - - 12.8 5.6 3.4 3.1
Italy 44.2 29.7 14.3 8.4 4.7 3.4 3.2
Austria 37.2 25.1 13.8 8.0 4.6 3.5 3.3
Israel - - 15.4 9.6 5.6 3.6 3.3
Korea 79.0 40.7 12.4 6.1 5.2 3.5 3.3
Belgium 29.4 20.5 12.2 8.3 4.7 3.5 3.4
France 23.6 15.1 10.2 7.4 4.4 3.5 3.4
Germany - 22.0 12.6 7.0 4.4 3.5 3.4
Ireland 30.3 19.0 12.1 7.7 6.0 3.5 3.4
Netherlands 16.5 12.6 8.8 6.8 5.1 3.7 3.4
Switzerland 21.6 15.0 8.4 6.7 4.6 3.8 3.7
Spain 47.6 25.5 15.3 9.3 5.4 4.0 3.8
Australia 20.3 17.8 10.8 7.6 5.1 4.2 4.1
Greece 48.2 33.8 21.4 11.3 6.9 4.0 4.1
United Kingdom 22.9 18.0 12.0 7.9 5.6 4.4 4.1
Poland 57.4 32.4 21.0 15.2 8.1 5.1 4.3
Canada 27.8 18.6 10.3 6.8 5.2 4.9 4.7
New Zealand 22.5 16.9 12.7 9.2 6.1 4.9 4.7
Hungary 52.9 39.0 24.0 17.0 9.8 5.6 5.3
United States 25.9 19.9 12.7 9.4 7.1 6.3 6.0
Slovakia - - - 15.6 10.2 6.8 6.3
Chile 127.6 68.0 28.4 16.0 9.2 7.9 7.8
Turkey 171.1 125.8 89.1 55.2 30.5 13.6 12.2
Mexico 100.6 76.7 55.6 36.8 21.5 14.7 13.9
a Source: Selected data taken from http://www.childinfo.org/mortality_imrcountrydata.php, downloaded June 6 2014
b Source: OECD (2013), Infant mortality rates: 2010 and average annual rate of decline 1970-2010, in OECD Factbook 2013, OECD Publishing. doi: 10.1787/factbook-2013-graph246-en. Excel file downloaded on May 29 2014 from http://www.oecd-ilibrary.org/economics/oecd-factbook-2013/infant-mortality-rates_factbook-2013-graph246-en
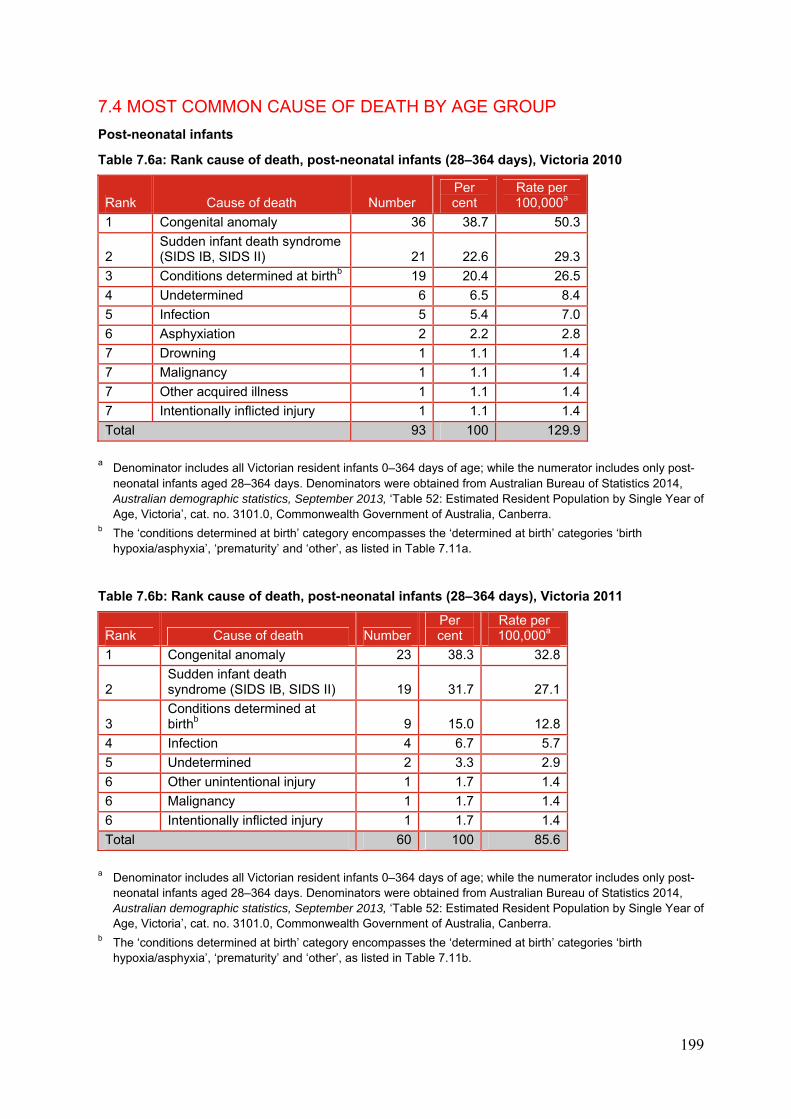
199
7.4 MOST COMMON CAUSE OF DEATH BY AGE GROUP
Post-neonatal infants
Table 7.6a: Rank cause of death, post-neonatal infants (28–364 days), Victoria 2010
Rank Cause of death Number Per cent
Rate per 100,000a
1 Congenital anomaly 36 38.7 50.3
2 Sudden infant death syndrome (SIDS IB, SIDS II) 21 22.6 29.3
3 Conditions determined at birthb 19 20.4 26.5
4 Undetermined 6 6.5 8.4
5 Infection 5 5.4 7.0
6 Asphyxiation 2 2.2 2.8
7 Drowning 1 1.1 1.4
7 Malignancy 1 1.1 1.4
7 Other acquired illness 1 1.1 1.4
7 Intentionally inflicted injury 1 1.1 1.4
Total 93 100 129.9
a Denominator includes all Victorian resident infants 0–364 days of age; while the numerator includes only post-
neonatal infants aged 28–364 days. Denominators were obtained from Australian Bureau of Statistics 2014, Australian demographic statistics, September 2013, ‘Table 52: Estimated Resident Population by Single Year of Age, Victoria’, cat. no. 3101.0, Commonwealth Government of Australia, Canberra.
b The ‘conditions determined at birth’ category encompasses the ‘determined at birth’ categories ‘birth hypoxia/asphyxia’, ‘prematurity’ and ‘other’, as listed in Table 7.11a.
Table 7.6b: Rank cause of death, post-neonatal infants (28–364 days), Victoria 2011
Rank Cause of death NumberPer cent
Rate per 100,000a
1 Congenital anomaly 23 38.3 32.8
2 Sudden infant death syndrome (SIDS IB, SIDS II) 19 31.7 27.1
3 Conditions determined at birthb 9 15.0 12.8
4 Infection 4 6.7 5.7
5 Undetermined 2 3.3 2.9
6 Other unintentional injury 1 1.7 1.4
6 Malignancy 1 1.7 1.4
6 Intentionally inflicted injury 1 1.7 1.4
Total 60 100 85.6
a Denominator includes all Victorian resident infants 0–364 days of age; while the numerator includes only post-
neonatal infants aged 28–364 days. Denominators were obtained from Australian Bureau of Statistics 2014, Australian demographic statistics, September 2013, ‘Table 52: Estimated Resident Population by Single Year of Age, Victoria’, cat. no. 3101.0, Commonwealth Government of Australia, Canberra.
b The ‘conditions determined at birth’ category encompasses the ‘determined at birth’ categories ‘birth hypoxia/asphyxia’, ‘prematurity’ and ‘other’, as listed in Table 7.11b.
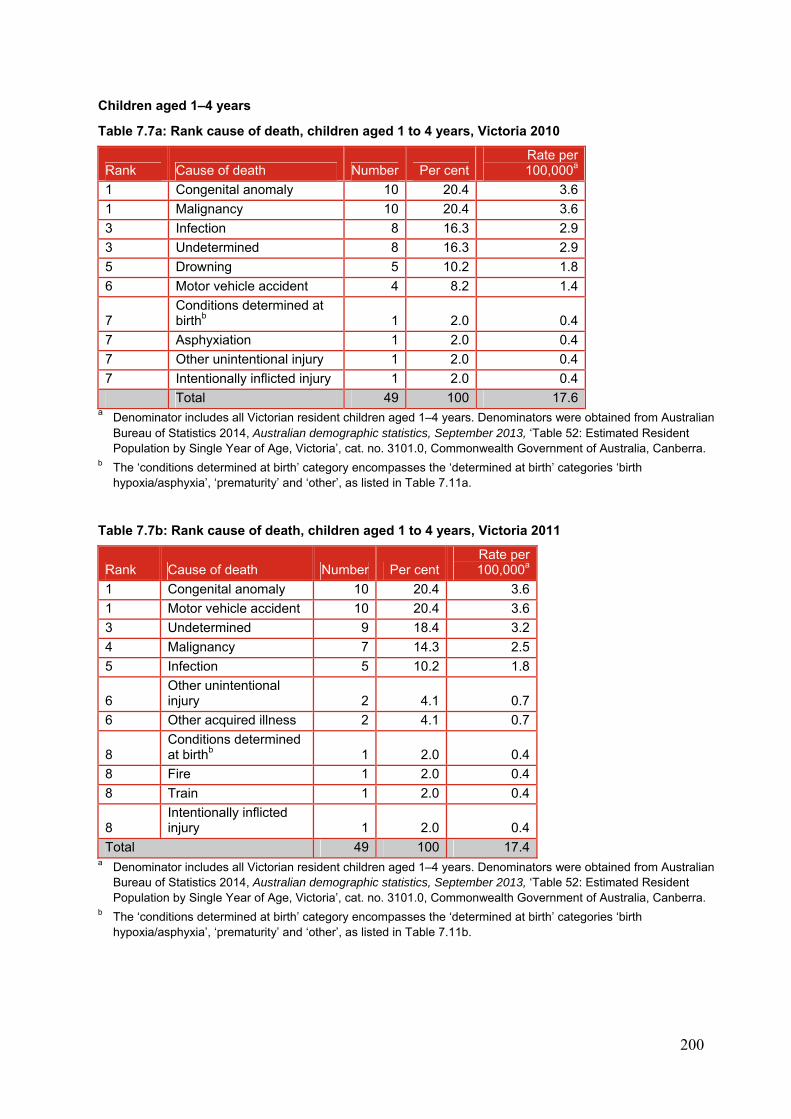
200
Children aged 1–4 years
Table 7.7a: Rank cause of death, children aged 1 to 4 years, Victoria 2010
Rank Cause of death Number Per centRate per 100,000a
1 Congenital anomaly 10 20.4 3.6
1 Malignancy 10 20.4 3.6
3 Infection 8 16.3 2.9
3 Undetermined 8 16.3 2.9
5 Drowning 5 10.2 1.8
6 Motor vehicle accident 4 8.2 1.4
7 Conditions determined at birthb 1 2.0 0.4
7 Asphyxiation 1 2.0 0.4
7 Other unintentional injury 1 2.0 0.4
7 Intentionally inflicted injury 1 2.0 0.4
Total 49 100 17.6 a Denominator includes all Victorian resident children aged 1–4 years. Denominators were obtained from Australian
Bureau of Statistics 2014, Australian demographic statistics, September 2013, ‘Table 52: Estimated Resident Population by Single Year of Age, Victoria’, cat. no. 3101.0, Commonwealth Government of Australia, Canberra.
b The ‘conditions determined at birth’ category encompasses the ‘determined at birth’ categories ‘birth hypoxia/asphyxia’, ‘prematurity’ and ‘other’, as listed in Table 7.11a.
Table 7.7b: Rank cause of death, children aged 1 to 4 years, Victoria 2011
Rank Cause of death Number Per centRate per 100,000a
1 Congenital anomaly 10 20.4 3.6
1 Motor vehicle accident 10 20.4 3.6
3 Undetermined 9 18.4 3.2
4 Malignancy 7 14.3 2.5
5 Infection 5 10.2 1.8
6 Other unintentional injury 2 4.1 0.7
6 Other acquired illness 2 4.1 0.7
8 Conditions determined at birthb 1 2.0 0.4
8 Fire 1 2.0 0.4
8 Train 1 2.0 0.4
8 Intentionally inflicted injury 1 2.0 0.4
Total 49 100 17.4a Denominator includes all Victorian resident children aged 1–4 years. Denominators were obtained from Australian
Bureau of Statistics 2014, Australian demographic statistics, September 2013, ‘Table 52: Estimated Resident Population by Single Year of Age, Victoria’, cat. no. 3101.0, Commonwealth Government of Australia, Canberra.
b The ‘conditions determined at birth’ category encompasses the ‘determined at birth’ categories ‘birth hypoxia/asphyxia’, ‘prematurity’ and ‘other’, as listed in Table 7.11b.
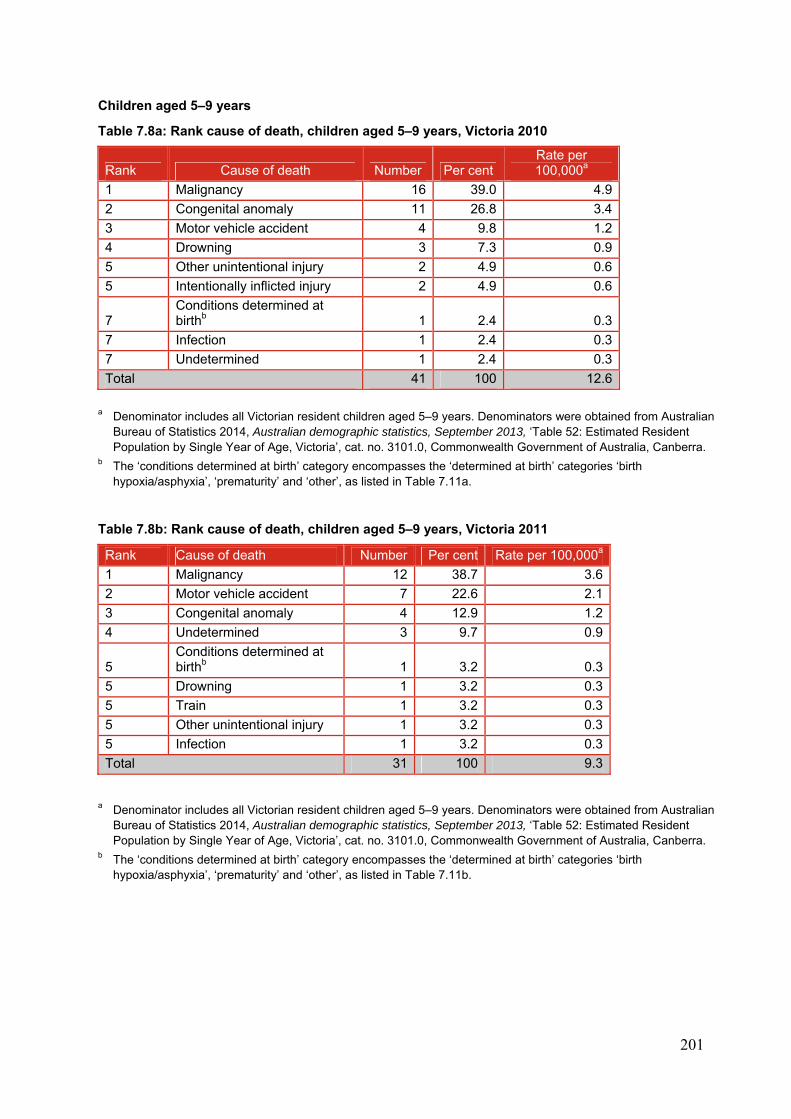
201
Children aged 5–9 years
Table 7.8a: Rank cause of death, children aged 5–9 years, Victoria 2010
Rank Cause of death Number Per cent Rate per 100,000a
1 Malignancy 16 39.0 4.9
2 Congenital anomaly 11 26.8 3.4
3 Motor vehicle accident 4 9.8 1.2
4 Drowning 3 7.3 0.9
5 Other unintentional injury 2 4.9 0.6
5 Intentionally inflicted injury 2 4.9 0.6
7 Conditions determined at birthb 1 2.4 0.3
7 Infection 1 2.4 0.3
7 Undetermined 1 2.4 0.3
Total 41 100 12.6
a Denominator includes all Victorian resident children aged 5–9 years. Denominators were obtained from Australian
Bureau of Statistics 2014, Australian demographic statistics, September 2013, ‘Table 52: Estimated Resident Population by Single Year of Age, Victoria’, cat. no. 3101.0, Commonwealth Government of Australia, Canberra.
b The ‘conditions determined at birth’ category encompasses the ‘determined at birth’ categories ‘birth hypoxia/asphyxia’, ‘prematurity’ and ‘other’, as listed in Table 7.11a.
Table 7.8b: Rank cause of death, children aged 5–9 years, Victoria 2011
Rank Cause of death Number Per cent Rate per 100,000a
1 Malignancy 12 38.7 3.6
2 Motor vehicle accident 7 22.6 2.1
3 Congenital anomaly 4 12.9 1.2
4 Undetermined 3 9.7 0.9
5 Conditions determined at birthb 1 3.2 0.3
5 Drowning 1 3.2 0.3
5 Train 1 3.2 0.3
5 Other unintentional injury 1 3.2 0.3
5 Infection 1 3.2 0.3
Total 31 100 9.3
a Denominator includes all Victorian resident children aged 5–9 years. Denominators were obtained from Australian Bureau of Statistics 2014, Australian demographic statistics, September 2013, ‘Table 52: Estimated Resident Population by Single Year of Age, Victoria’, cat. no. 3101.0, Commonwealth Government of Australia, Canberra.
b The ‘conditions determined at birth’ category encompasses the ‘determined at birth’ categories ‘birth hypoxia/asphyxia’, ‘prematurity’ and ‘other’, as listed in Table 7.11b.
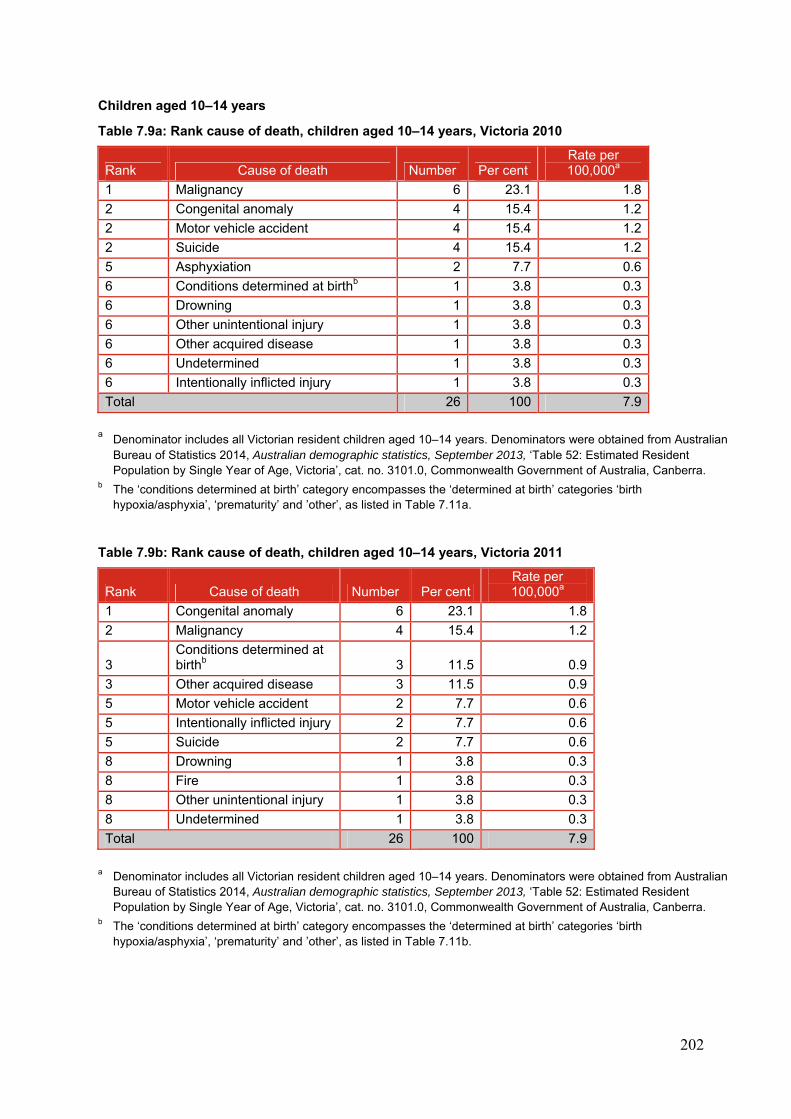
202
Children aged 10–14 years
Table 7.9a: Rank cause of death, children aged 10–14 years, Victoria 2010
Rank Cause of death Number Per cent Rate per 100,000a
1 Malignancy 6 23.1 1.8
2 Congenital anomaly 4 15.4 1.2
2 Motor vehicle accident 4 15.4 1.2
2 Suicide 4 15.4 1.2
5 Asphyxiation 2 7.7 0.6
6 Conditions determined at birthb 1 3.8 0.3
6 Drowning 1 3.8 0.3
6 Other unintentional injury 1 3.8 0.3
6 Other acquired disease 1 3.8 0.3
6 Undetermined 1 3.8 0.3
6 Intentionally inflicted injury 1 3.8 0.3
Total 26 100 7.9
a Denominator includes all Victorian resident children aged 10–14 years. Denominators were obtained from Australian
Bureau of Statistics 2014, Australian demographic statistics, September 2013, ‘Table 52: Estimated Resident Population by Single Year of Age, Victoria’, cat. no. 3101.0, Commonwealth Government of Australia, Canberra.
b The ‘conditions determined at birth’ category encompasses the ‘determined at birth’ categories ‘birth hypoxia/asphyxia’, ‘prematurity’ and ’other’, as listed in Table 7.11a.
Table 7.9b: Rank cause of death, children aged 10–14 years, Victoria 2011
Rank Cause of death Number Per cent Rate per 100,000a
1 Congenital anomaly 6 23.1 1.8
2 Malignancy 4 15.4 1.2
3 Conditions determined at birthb 3 11.5 0.9
3 Other acquired disease 3 11.5 0.9
5 Motor vehicle accident 2 7.7 0.6
5 Intentionally inflicted injury 2 7.7 0.6
5 Suicide 2 7.7 0.6
8 Drowning 1 3.8 0.3
8 Fire 1 3.8 0.3
8 Other unintentional injury 1 3.8 0.3
8 Undetermined 1 3.8 0.3
Total 26 100 7.9
a Denominator includes all Victorian resident children aged 10–14 years. Denominators were obtained from Australian
Bureau of Statistics 2014, Australian demographic statistics, September 2013, ‘Table 52: Estimated Resident Population by Single Year of Age, Victoria’, cat. no. 3101.0, Commonwealth Government of Australia, Canberra.
b The ‘conditions determined at birth’ category encompasses the ‘determined at birth’ categories ‘birth hypoxia/asphyxia’, ‘prematurity’ and ’other’, as listed in Table 7.11b.
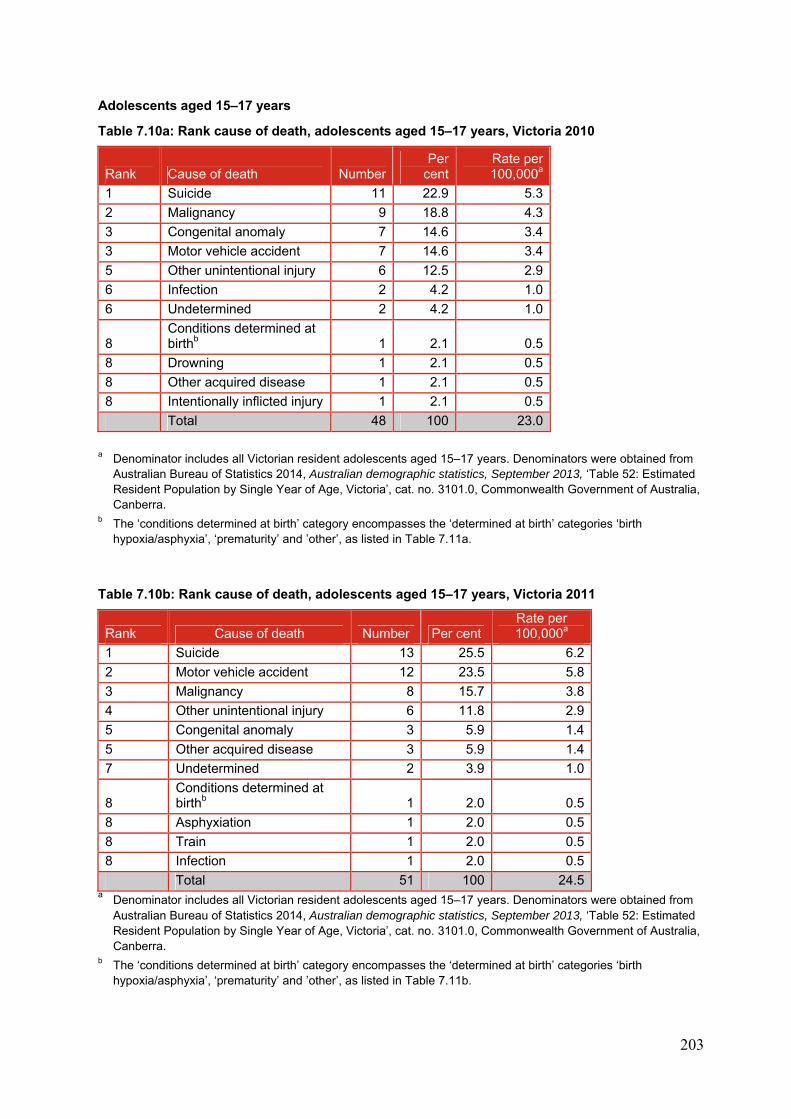
203
Adolescents aged 15–17 years
Table 7.10a: Rank cause of death, adolescents aged 15–17 years, Victoria 2010
Rank Cause of death NumberPer
centRate per 100,000a
1 Suicide 11 22.9 5.3
2 Malignancy 9 18.8 4.3
3 Congenital anomaly 7 14.6 3.4
3 Motor vehicle accident 7 14.6 3.4
5 Other unintentional injury 6 12.5 2.9
6 Infection 2 4.2 1.0
6 Undetermined 2 4.2 1.0
8 Conditions determined at birthb 1 2.1 0.5
8 Drowning 1 2.1 0.5
8 Other acquired disease 1 2.1 0.5
8 Intentionally inflicted injury 1 2.1 0.5
Total 48 100 23.0
a Denominator includes all Victorian resident adolescents aged 15–17 years. Denominators were obtained from
Australian Bureau of Statistics 2014, Australian demographic statistics, September 2013, ‘Table 52: Estimated Resident Population by Single Year of Age, Victoria’, cat. no. 3101.0, Commonwealth Government of Australia, Canberra.
b The ‘conditions determined at birth’ category encompasses the ‘determined at birth’ categories ‘birth hypoxia/asphyxia’, ‘prematurity’ and ’other’, as listed in Table 7.11a.
Table 7.10b: Rank cause of death, adolescents aged 15–17 years, Victoria 2011
Rank Cause of death Number Per cent Rate per 100,000a
1 Suicide 13 25.5 6.2
2 Motor vehicle accident 12 23.5 5.8
3 Malignancy 8 15.7 3.8
4 Other unintentional injury 6 11.8 2.9
5 Congenital anomaly 3 5.9 1.4
5 Other acquired disease 3 5.9 1.4
7 Undetermined 2 3.9 1.0
8 Conditions determined at birthb 1 2.0 0.5
8 Asphyxiation 1 2.0 0.5
8 Train 1 2.0 0.5
8 Infection 1 2.0 0.5
Total 51 100 24.5 a Denominator includes all Victorian resident adolescents aged 15–17 years. Denominators were obtained from
Australian Bureau of Statistics 2014, Australian demographic statistics, September 2013, ‘Table 52: Estimated Resident Population by Single Year of Age, Victoria’, cat. no. 3101.0, Commonwealth Government of Australia, Canberra.
b The ‘conditions determined at birth’ category encompasses the ‘determined at birth’ categories ‘birth hypoxia/asphyxia’, ‘prematurity’ and ’other’, as listed in Table 7.11b.
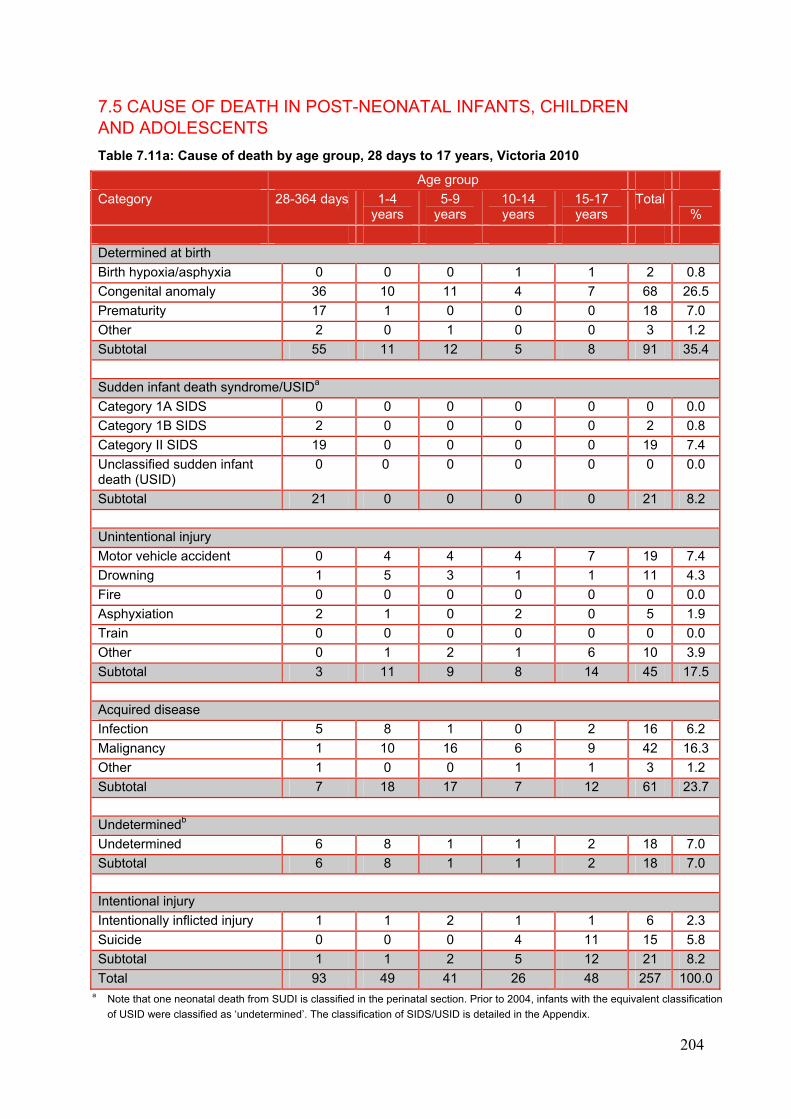
204
7.5 CAUSE OF DEATH IN POST-NEONATAL INFANTS, CHILDREN AND ADOLESCENTS
Table 7.11a: Cause of death by age group, 28 days to 17 years, Victoria 2010
Age group
Category 28-364 days 1-4 years
5-9 years
10-14 years
15-17 years
Total%
Determined at birth
Birth hypoxia/asphyxia 0 0 0 1 1 2 0.8
Congenital anomaly 36 10 11 4 7 68 26.5
Prematurity 17 1 0 0 0 18 7.0
Other 2 0 1 0 0 3 1.2
Subtotal 55 11 12 5 8 91 35.4
Sudden infant death syndrome/USIDa
Category 1A SIDS 0 0 0 0 0 0 0.0
Category 1B SIDS 2 0 0 0 0 2 0.8
Category II SIDS 19 0 0 0 0 19 7.4
Unclassified sudden infant death (USID)
0 0 0 0 0 0 0.0
Subtotal 21 0 0 0 0 21 8.2
Unintentional injury
Motor vehicle accident 0 4 4 4 7 19 7.4
Drowning 1 5 3 1 1 11 4.3
Fire 0 0 0 0 0 0 0.0
Asphyxiation 2 1 0 2 0 5 1.9
Train 0 0 0 0 0 0 0.0
Other 0 1 2 1 6 10 3.9
Subtotal 3 11 9 8 14 45 17.5
Acquired disease
Infection 5 8 1 0 2 16 6.2
Malignancy 1 10 16 6 9 42 16.3
Other 1 0 0 1 1 3 1.2
Subtotal 7 18 17 7 12 61 23.7
Undeterminedb
Undetermined 6 8 1 1 2 18 7.0
Subtotal 6 8 1 1 2 18 7.0
Intentional injury
Intentionally inflicted injury 1 1 2 1 1 6 2.3
Suicide 0 0 0 4 11 15 5.8
Subtotal 1 1 2 5 12 21 8.2
Total 93 49 41 26 48 257 100.0a Note that one neonatal death from SUDI is classified in the perinatal section. Prior to 2004, infants with the equivalent classification
of USID were classified as ‘undetermined’. The classification of SIDS/USID is detailed in the Appendix.
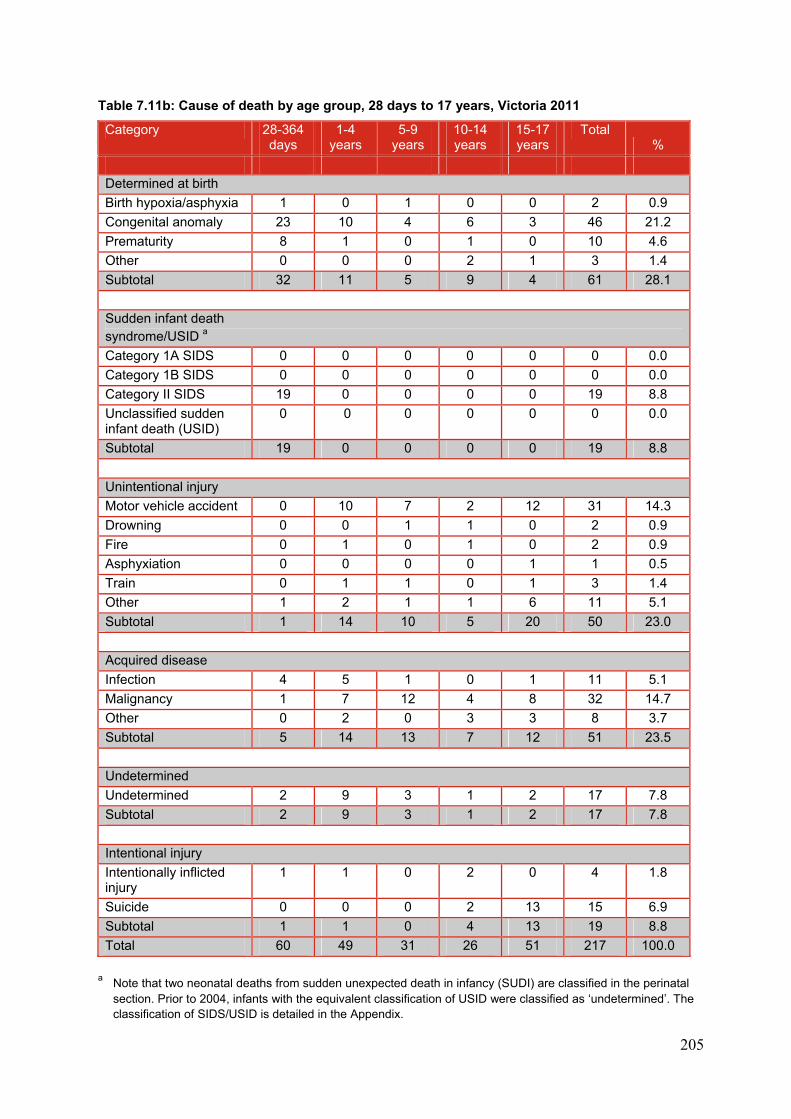
205
Table 7.11b: Cause of death by age group, 28 days to 17 years, Victoria 2011
Category 28-364 days
1-4 years
5-9 years
10-14 years
15-17 years
Total %
Determined at birth
Birth hypoxia/asphyxia 1 0 1 0 0 2 0.9
Congenital anomaly 23 10 4 6 3 46 21.2
Prematurity 8 1 0 1 0 10 4.6
Other 0 0 0 2 1 3 1.4
Subtotal 32 11 5 9 4 61 28.1
Sudden infant death syndrome/USID a
Category 1A SIDS 0 0 0 0 0 0 0.0
Category 1B SIDS 0 0 0 0 0 0 0.0
Category II SIDS 19 0 0 0 0 19 8.8
Unclassified sudden infant death (USID)
0 0 0 0 0 0 0.0
Subtotal 19 0 0 0 0 19 8.8
Unintentional injury
Motor vehicle accident 0 10 7 2 12 31 14.3
Drowning 0 0 1 1 0 2 0.9
Fire 0 1 0 1 0 2 0.9
Asphyxiation 0 0 0 0 1 1 0.5
Train 0 1 1 0 1 3 1.4
Other 1 2 1 1 6 11 5.1
Subtotal 1 14 10 5 20 50 23.0
Acquired disease
Infection 4 5 1 0 1 11 5.1
Malignancy 1 7 12 4 8 32 14.7
Other 0 2 0 3 3 8 3.7
Subtotal 5 14 13 7 12 51 23.5
Undetermined
Undetermined 2 9 3 1 2 17 7.8
Subtotal 2 9 3 1 2 17 7.8
Intentional injury
Intentionally inflicted injury
1 1 0 2 0 4 1.8
Suicide 0 0 0 2 13 15 6.9
Subtotal 1 1 0 4 13 19 8.8
Total 60 49 31 26 51 217 100.0
a Note that two neonatal deaths from sudden unexpected death in infancy (SUDI) are classified in the perinatal
section. Prior to 2004, infants with the equivalent classification of USID were classified as ‘undetermined’. The classification of SIDS/USID is detailed in the Appendix.
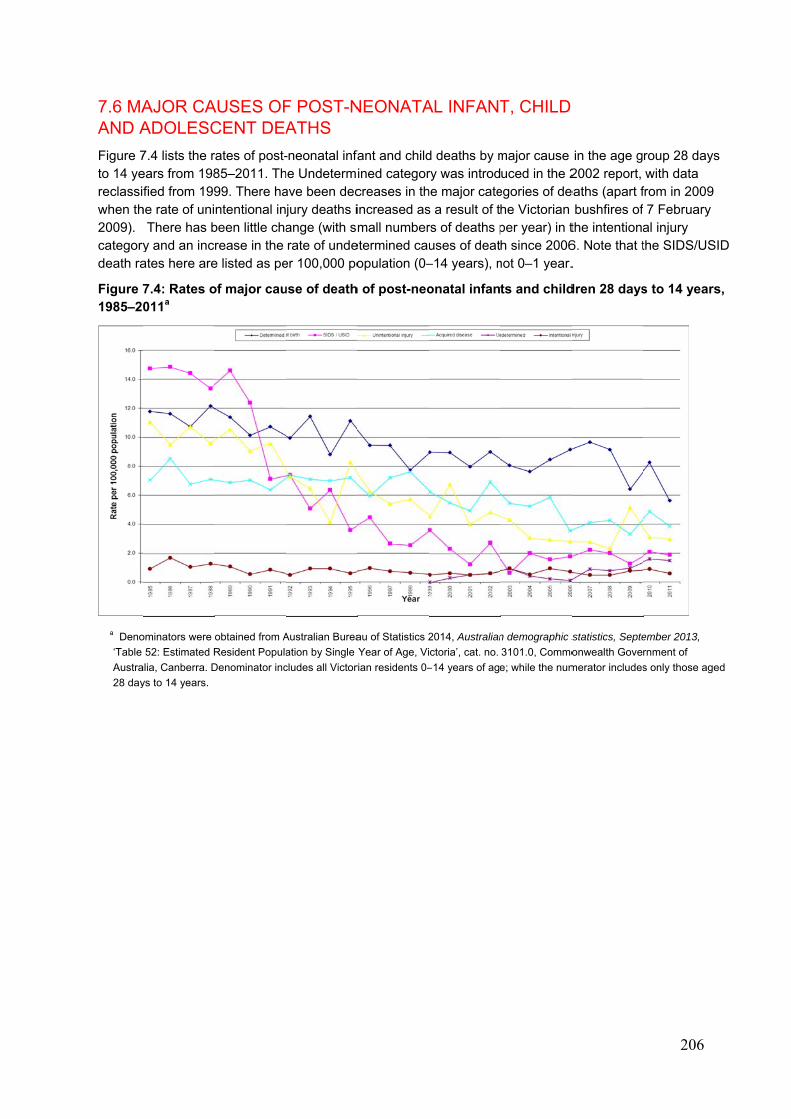
7.6 MAAND A
Figure 7to 14 yereclassiwhen th2009). categorydeath ra
Figure 71985–20
a Deno
‘Table
Austra
28 day
AJOR CAADOLESC
7.4 lists the rears from 198fied from 199
he rate of uni There has by and an incates here are
7.4: Rates o011a
ominators were
52: Estimated R
alia, Canberra. D
ys to 14 years.
AUSES OFCENT DEA
rates of post-85–2011. Th99. There hantentional in
been little charease in the e listed as pe
of major cau
obtained from A
Resident Popula
Denominator inc
F POST-NATHS
-neonatal infahe Undetermave been decjury deaths iange (with smrate of unde
er 100,000 po
use of death
Australian Burea
ation by Single
cludes all Victor
NEONATA
fant and childined categorcreases in thincreased asmall number
etermined cauopulation (0–
h of post-neo
au of Statistics 2
Year of Age, Vi
rian residents 0–
AL INFANT
d deaths by mry was introdhe major cates a result of trs of deaths puses of deat–14 years), n
onatal infan
2014, Australian
ctoria’, cat. no.
–14 years of age
T, CHILD
major cause uced in the 2
egories of dehe Victorian per year) in th since 2006
not 0–1 year.
ts and child
n demographic s
3101.0, Commo
e; while the num
in the age g2002 report,
eaths (apart fbushfires of
the intentiona6. Note that t.
dren 28 days
statistics, Septe
onwealth Gove
merator includes
206
roup 28 dayswith data
from in 2009 7 February
al injury the SIDS/US
s to 14 years
ember 2013,
rnment of
s only those age
s
SID
s,
ed
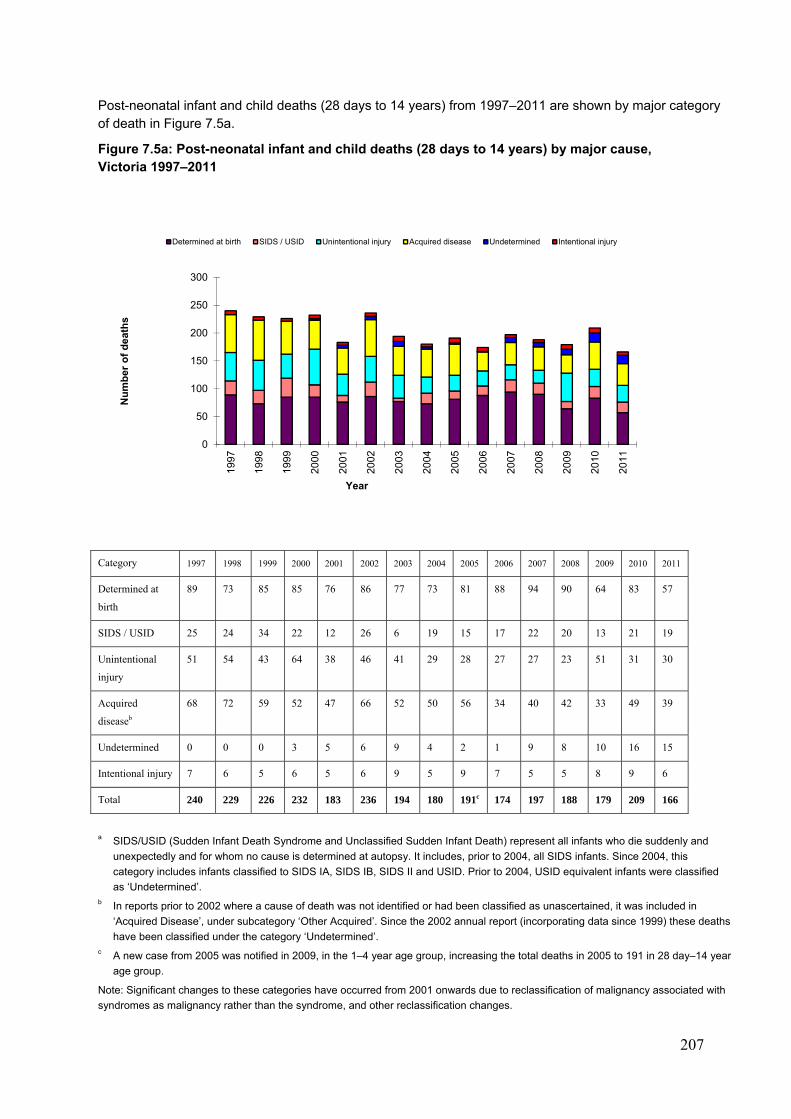
207
Post-neonatal infant and child deaths (28 days to 14 years) from 1997–2011 are shown by major category of death in Figure 7.5a.
Figure 7.5a: Post-neonatal infant and child deaths (28 days to 14 years) by major cause, Victoria 1997–2011
Category 1997 1998 1999 2000 2001 2002 2003 2004 2005 2006 2007 2008 2009 2010 2011
Determined at
birth
89 73 85 85 76 86 77 73 81 88 94 90 64 83 57
SIDS / USID 25 24 34 22 12 26 6 19 15 17 22 20 13 21 19
Unintentional
injury
51 54 43 64 38 46 41 29 28 27 27 23 51 31 30
Acquired
diseaseb
68 72 59 52 47 66 52 50 56 34 40 42 33 49 39
Undetermined 0 0 0 3 5 6 9 4 2 1 9 8 10 16 15
Intentional injury 7 6 5 6 5 6 9 5 9 7 5 5 8 9 6
Total 240 229 226 232 183 236 194 180 191c 174 197 188 179 209 166
a SIDS/USID (Sudden Infant Death Syndrome and Unclassified Sudden Infant Death) represent all infants who die suddenly and
unexpectedly and for whom no cause is determined at autopsy. It includes, prior to 2004, all SIDS infants. Since 2004, this
category includes infants classified to SIDS IA, SIDS IB, SIDS II and USID. Prior to 2004, USID equivalent infants were classified
as ‘Undetermined’. b In reports prior to 2002 where a cause of death was not identified or had been classified as unascertained, it was included in
‘Acquired Disease’, under subcategory ‘Other Acquired’. Since the 2002 annual report (incorporating data since 1999) these deaths
have been classified under the category ‘Undetermined’. c A new case from 2005 was notified in 2009, in the 1–4 year age group, increasing the total deaths in 2005 to 191 in 28 day–14 year
age group.
Note: Significant changes to these categories have occurred from 2001 onwards due to reclassification of malignancy associated with
syndromes as malignancy rather than the syndrome, and other reclassification changes.
0
50
100
150
200
250
300
1997
1998
1999
2000
2001
2002
2003
2004
2005
2006
2007
2008
2009
2010
2011
Nu
mb
er o
f d
eath
s
Year
Determined at birth SIDS / USID Unintentional injury Acquired disease Undetermined Intentional injury
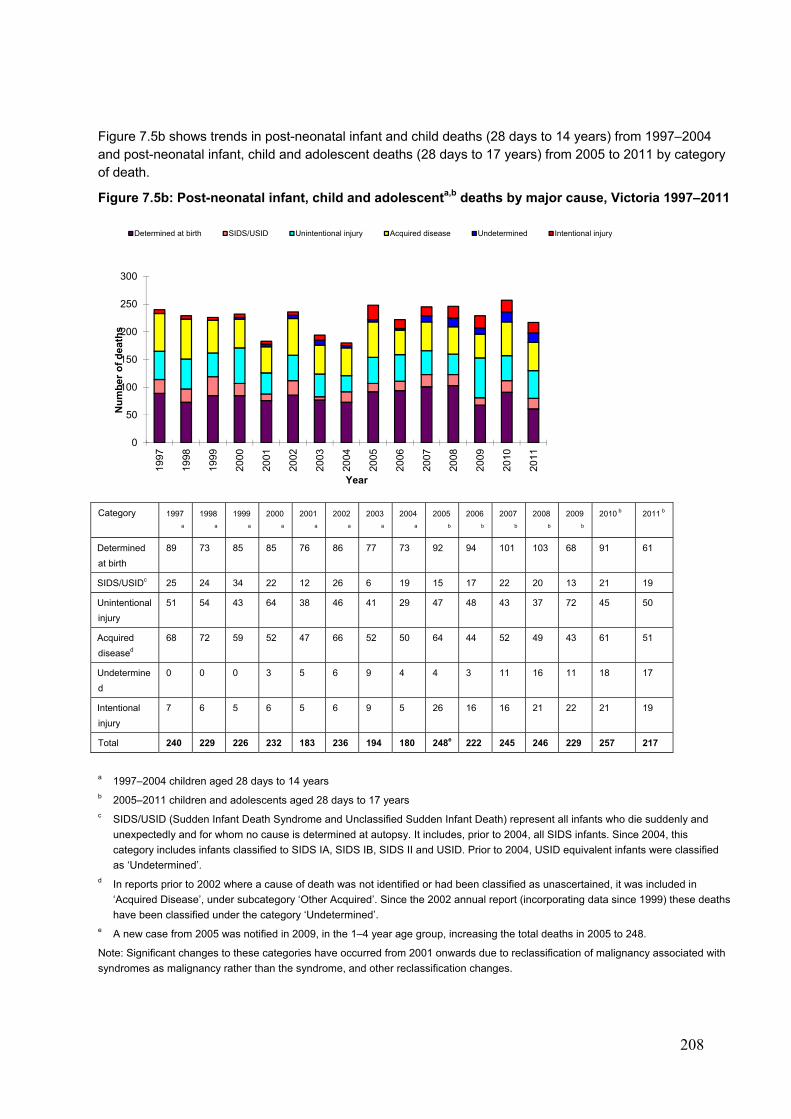
208
Figure 7.5b shows trends in post-neonatal infant and child deaths (28 days to 14 years) from 1997–2004 and post-neonatal infant, child and adolescent deaths (28 days to 17 years) from 2005 to 2011 by category of death.
Figure 7.5b: Post-neonatal infant, child and adolescenta,b deaths by major cause, Victoria 1997–2011
Category 1997
a
1998
a
1999
a
2000
a
2001
a
2002
a
2003
a
2004
a
2005
b
2006
b
2007
b
2008
b
2009
b
2010 b 2011 b
Determined
at birth
89 73 85 85 76 86 77 73 92 94 101 103 68 91 61
SIDS/USIDc 25 24 34 22 12 26 6 19 15 17 22 20 13 21 19
Unintentional
injury
51 54 43 64 38 46 41 29 47 48 43 37 72 45 50
Acquired
diseased
68 72 59 52 47 66 52 50 64 44 52 49 43 61 51
Undetermine
d
0 0 0 3 5 6 9 4 4 3 11 16 11 18 17
Intentional
injury
7 6 5 6 5 6 9 5 26 16 16 21 22 21 19
Total 240 229 226 232 183 236 194 180 248e 222 245 246 229 257 217
a 1997–2004 children aged 28 days to 14 years b 2005–2011 children and adolescents aged 28 days to 17 years c SIDS/USID (Sudden Infant Death Syndrome and Unclassified Sudden Infant Death) represent all infants who die suddenly and
unexpectedly and for whom no cause is determined at autopsy. It includes, prior to 2004, all SIDS infants. Since 2004, this
category includes infants classified to SIDS IA, SIDS IB, SIDS II and USID. Prior to 2004, USID equivalent infants were classified
as ‘Undetermined’. d In reports prior to 2002 where a cause of death was not identified or had been classified as unascertained, it was included in
‘Acquired Disease’, under subcategory ‘Other Acquired’. Since the 2002 annual report (incorporating data since 1999) these deaths
have been classified under the category ‘Undetermined’. e A new case from 2005 was notified in 2009, in the 1–4 year age group, increasing the total deaths in 2005 to 248.
Note: Significant changes to these categories have occurred from 2001 onwards due to reclassification of malignancy associated with
syndromes as malignancy rather than the syndrome, and other reclassification changes.
0
50
100
150
200
250
300
1997
1998
1999
2000
2001
2002
2003
2004
2005
2006
2007
2008
2009
2010
2011
Nu
mb
er
of
de
ath
s
Year
Determined at birth SIDS/USID Unintentional injury Acquired disease Undetermined Intentional injury
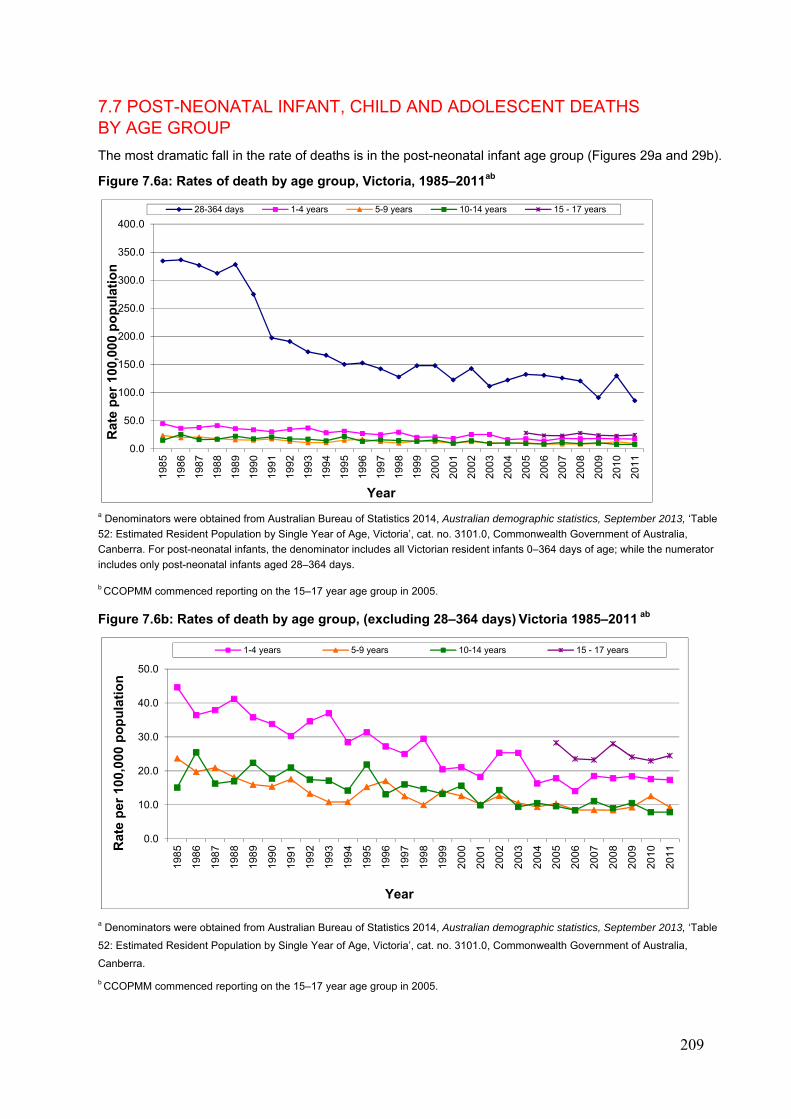
209
7.7 POST-NEONATAL INFANT, CHILD AND ADOLESCENT DEATHS BY AGE GROUP
The most dramatic fall in the rate of deaths is in the post-neonatal infant age group (Figures 29a and 29b).
Figure 7.6a: Rates of death by age group, Victoria, 1985–2011ab
a Denominators were obtained from Australian Bureau of Statistics 2014, Australian demographic statistics, September 2013, ‘Table
52: Estimated Resident Population by Single Year of Age, Victoria’, cat. no. 3101.0, Commonwealth Government of Australia,
Canberra. For post-neonatal infants, the denominator includes all Victorian resident infants 0–364 days of age; while the numerator
includes only post-neonatal infants aged 28–364 days.
b CCOPMM commenced reporting on the 15–17 year age group in 2005.
Figure 7.6b: Rates of death by age group, (excluding 28–364 days) Victoria 1985–2011 ab
a Denominators were obtained from Australian Bureau of Statistics 2014, Australian demographic statistics, September 2013, ‘Table
52: Estimated Resident Population by Single Year of Age, Victoria’, cat. no. 3101.0, Commonwealth Government of Australia,
Canberra.
b CCOPMM commenced reporting on the 15–17 year age group in 2005.
0.0
50.0
100.0
150.0
200.0
250.0
300.0
350.0
400.0
198
5
198
6
198
7
198
8
198
9
199
0
199
1
199
2
199
3
199
4
199
5
199
6
199
7
199
8
199
9
200
0
200
1
200
2
200
3
200
4
200
5
200
6
200
7
200
8
200
9
201
0
201
1
Rat
e p
er 1
00,0
00 p
op
ula
tio
n
Year
28-364 days 1-4 years 5-9 years 10-14 years 15 - 17 years
0.0
10.0
20.0
30.0
40.0
50.0
198
5
198
6
198
7
198
8
198
9
199
0
199
1
199
2
199
3
199
4
199
5
199
6
199
7
199
8
199
9
200
0
200
1
200
2
200
3
200
4
200
5
200
6
200
7
200
8
200
9
201
0
201
1Rat
e p
er 1
00,0
00 p
op
ula
tio
n
Year
1-4 years 5-9 years 10-14 years 15 - 17 years

210
Post-neonatal infant, child and adolescent deaths from 1997 to 2011 are shown by age at death in Figure 7.7.
Figure 7.7: Post-neonatal infant, child and adolescent deaths by age group, Victoria 1997–2011a
Age group
1997 1998 1999 2000 2001
c
2002
c
2003
c
2004
c
2005
b c
2006 2007 2008 2009 2010 2011
28–364 days
87 77 88 89 73 86 67 75 82 84 86 84 64 93 60
1–4 years 63 74 51 52 45 62 62 40 44 35 47 47 50 49 49
5–9 years 40 32 45 41 33 41 34 30 33 27 27 27 30 41 31
10–14 years
50 46 42 50 32 47 31 35 32 28 37 30 35 26 26
15–17 years
n/a n/a n/a n/a n/a n/a n/a n/a 57 48 48 58 50 48 51
Total 240 229 226 232 183 236 194 180 248 222 245 246 229 257 217
a CCOPMM commenced reporting on the 15–17 year age group in 2005.
b A new case from 2005 was notified in 2009, in the 1–4 year age group, increasing the total deaths in 2005 to 248 c A review of data has resulted in changes in the numbers of some age groups from 2001–2005
n/a not applicable, as 15–17 year old age group reporting commenced in 2005
0
50
100
150
200
250
30019
97
199
8
199
9
200
0
200
1
200
2
200
3
200
4
200
5
200
6
200
7
200
8
200
9
201
0
201
1
Nu
mb
er o
f d
eath
s
Year
28-364 days 1-4 years 5-9 years 10-14 years 15-17 years
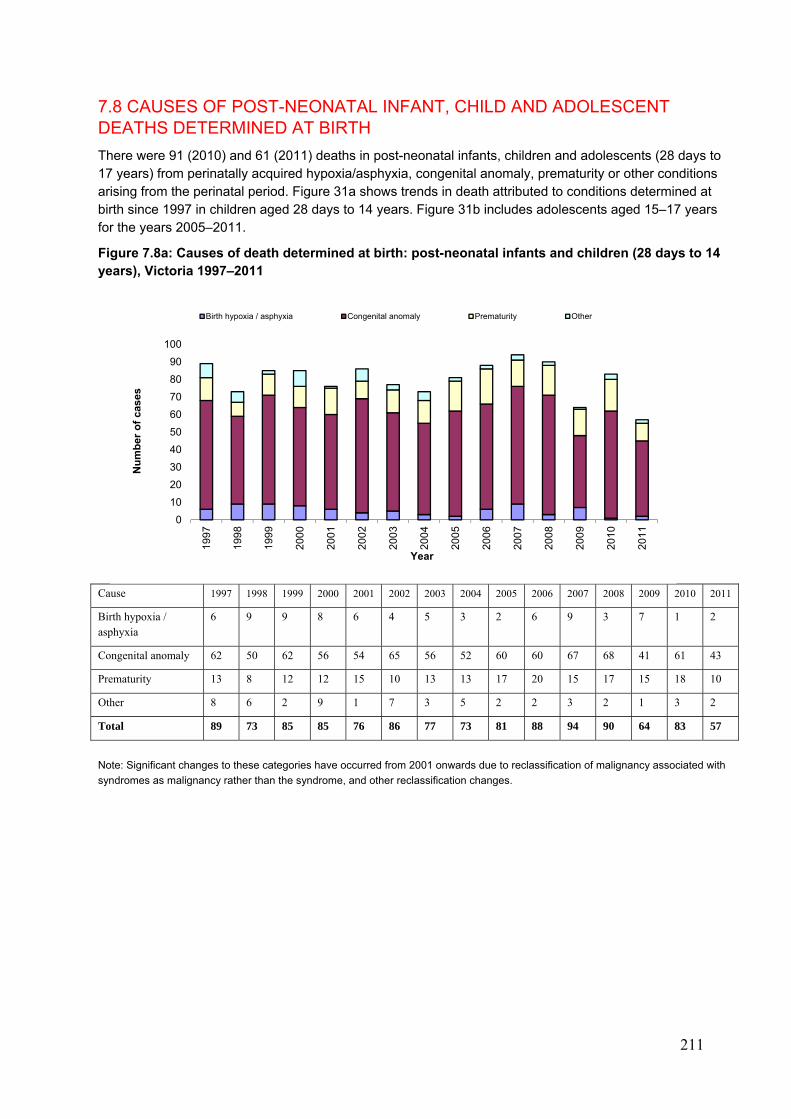
211
7.8 CAUSES OF POST-NEONATAL INFANT, CHILD AND ADOLESCENT DEATHS DETERMINED AT BIRTH
There were 91 (2010) and 61 (2011) deaths in post-neonatal infants, children and adolescents (28 days to 17 years) from perinatally acquired hypoxia/asphyxia, congenital anomaly, prematurity or other conditions arising from the perinatal period. Figure 31a shows trends in death attributed to conditions determined at birth since 1997 in children aged 28 days to 14 years. Figure 31b includes adolescents aged 15–17 years for the years 2005–2011.
Figure 7.8a: Causes of death determined at birth: post-neonatal infants and children (28 days to 14 years), Victoria 1997–2011
Cause 1997 1998 1999 2000 2001 2002 2003 2004 2005 2006 2007 2008 2009 2010 2011
Birth hypoxia / asphyxia
6 9 9 8 6 4 5 3 2 6 9 3 7 1 2
Congenital anomaly 62 50 62 56 54 65 56 52 60 60 67 68 41 61 43
Prematurity 13 8 12 12 15 10 13 13 17 20 15 17 15 18 10
Other 8 6 2 9 1 7 3 5 2 2 3 2 1 3 2
Total 89 73 85 85 76 86 77 73 81 88 94 90 64 83 57
Note: Significant changes to these categories have occurred from 2001 onwards due to reclassification of malignancy associated with
syndromes as malignancy rather than the syndrome, and other reclassification changes.
0
10
20
30
40
50
60
70
80
90
100
199
7
199
8
199
9
200
0
200
1
200
2
200
3
200
4
200
5
200
6
200
7
200
8
200
9
201
0
201
1
Nu
mb
er o
f ca
ses
Year
Birth hypoxia / asphyxia Congenital anomaly Prematurity Other
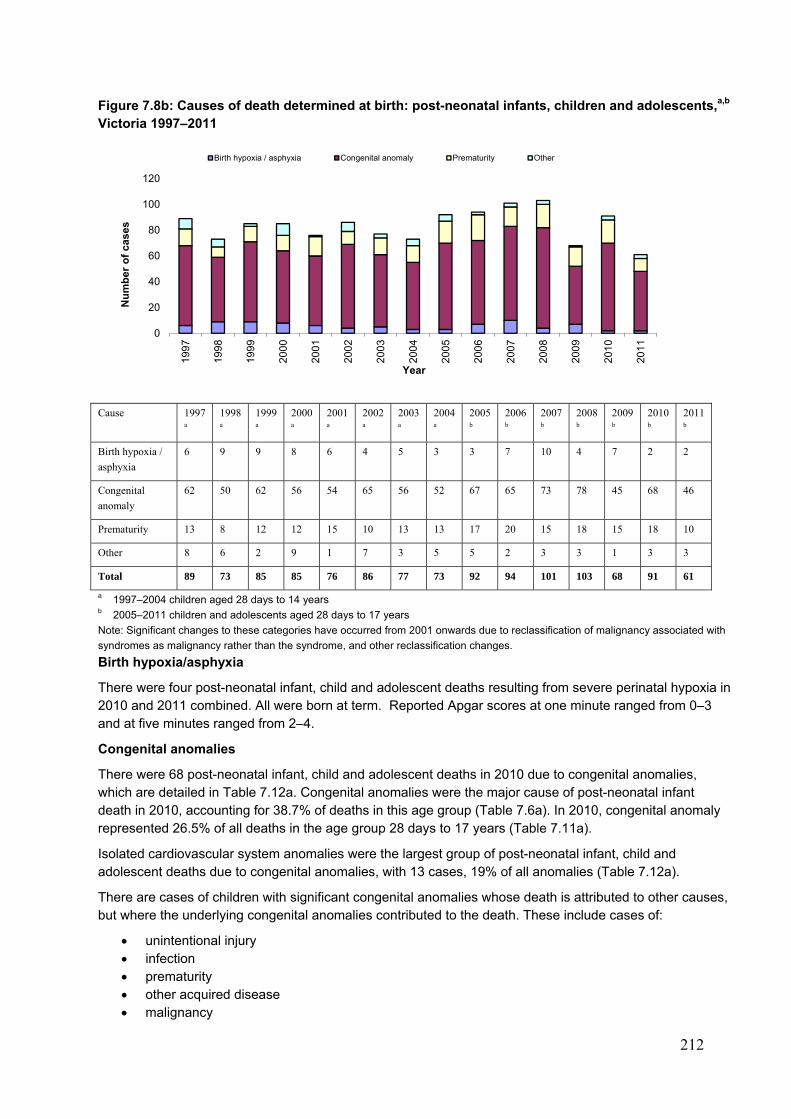
212
Figure 7.8b: Causes of death determined at birth: post-neonatal infants, children and adolescents,a,b Victoria 1997–2011
Cause 1997
a
1998
a
1999
a
2000
a
2001
a
2002
a
2003
a
2004
a
2005
b
2006
b
2007
b
2008
b
2009
b
2010
b
2011
b
Birth hypoxia /
asphyxia
6 9 9 8 6 4 5 3 3 7 10 4 7 2 2
Congenital
anomaly
62 50 62 56 54 65 56 52 67 65 73 78 45 68 46
Prematurity 13 8 12 12 15 10 13 13 17 20 15 18 15 18 10
Other 8 6 2 9 1 7 3 5 5 2 3 3 1 3 3
Total 89 73 85 85 76 86 77 73 92 94 101 103 68 91 61
a 1997–2004 children aged 28 days to 14 years b 2005–2011 children and adolescents aged 28 days to 17 years
Note: Significant changes to these categories have occurred from 2001 onwards due to reclassification of malignancy associated with
syndromes as malignancy rather than the syndrome, and other reclassification changes.
Birth hypoxia/asphyxia
There were four post-neonatal infant, child and adolescent deaths resulting from severe perinatal hypoxia in 2010 and 2011 combined. All were born at term. Reported Apgar scores at one minute ranged from 0–3 and at five minutes ranged from 2–4.
Congenital anomalies
There were 68 post-neonatal infant, child and adolescent deaths in 2010 due to congenital anomalies, which are detailed in Table 7.12a. Congenital anomalies were the major cause of post-neonatal infant death in 2010, accounting for 38.7% of deaths in this age group (Table 7.6a). In 2010, congenital anomaly represented 26.5% of all deaths in the age group 28 days to 17 years (Table 7.11a).
Isolated cardiovascular system anomalies were the largest group of post-neonatal infant, child and adolescent deaths due to congenital anomalies, with 13 cases, 19% of all anomalies (Table 7.12a).
There are cases of children with significant congenital anomalies whose death is attributed to other causes, but where the underlying congenital anomalies contributed to the death. These include cases of:
unintentional injury infection prematurity other acquired disease malignancy
0
20
40
60
80
100
12019
97
199
8
199
9
200
0
200
1
200
2
200
3
200
4
200
5
200
6
200
7
200
8
200
9
201
0
201
1
Nu
mb
er o
f ca
ses
Year
Birth hypoxia / asphyxia Congenital anomaly Prematurity Other
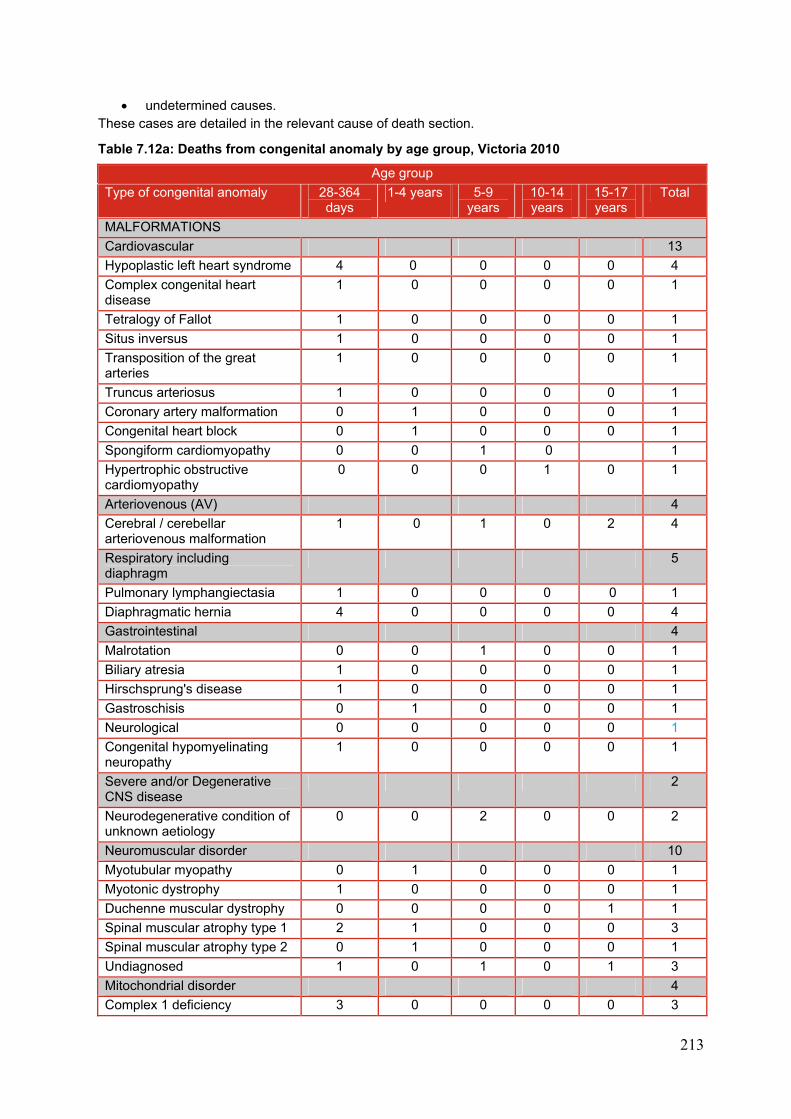
213
undetermined causes. These cases are detailed in the relevant cause of death section.
Table 7.12a: Deaths from congenital anomaly by age group, Victoria 2010
Age group
Type of congenital anomaly 28-364 days
1-4 years 5-9 years
10-14 years
15-17 years
Total
MALFORMATIONS
Cardiovascular 13
Hypoplastic left heart syndrome 4 0 0 0 0 4
Complex congenital heart disease
1 0 0 0 0 1
Tetralogy of Fallot 1 0 0 0 0 1
Situs inversus 1 0 0 0 0 1
Transposition of the great arteries
1 0 0 0 0 1
Truncus arteriosus 1 0 0 0 0 1
Coronary artery malformation 0 1 0 0 0 1
Congenital heart block 0 1 0 0 0 1
Spongiform cardiomyopathy 0 0 1 0 1
Hypertrophic obstructive cardiomyopathy
0 0 0 1 0 1
Arteriovenous (AV) 4
Cerebral / cerebellar arteriovenous malformation
1 0 1 0 2 4
Respiratory including diaphragm
5
Pulmonary lymphangiectasia 1 0 0 0 0 1
Diaphragmatic hernia 4 0 0 0 0 4
Gastrointestinal 4
Malrotation 0 0 1 0 0 1
Biliary atresia 1 0 0 0 0 1
Hirschsprung's disease 1 0 0 0 0 1
Gastroschisis 0 1 0 0 0 1
Neurological 0 0 0 0 0 1
Congenital hypomyelinating neuropathy
1 0 0 0 0 1
Severe and/or Degenerative CNS disease
2
Neurodegenerative condition of unknown aetiology
0 0 2 0 0 2
Neuromuscular disorder 10
Myotubular myopathy 0 1 0 0 0 1
Myotonic dystrophy 1 0 0 0 0 1
Duchenne muscular dystrophy 0 0 0 0 1 1
Spinal muscular atrophy type 1 2 1 0 0 0 3
Spinal muscular atrophy type 2 0 1 0 0 0 1
Undiagnosed 1 0 1 0 1 3
Mitochondrial disorder 4
Complex 1 deficiency 3 0 0 0 0 3
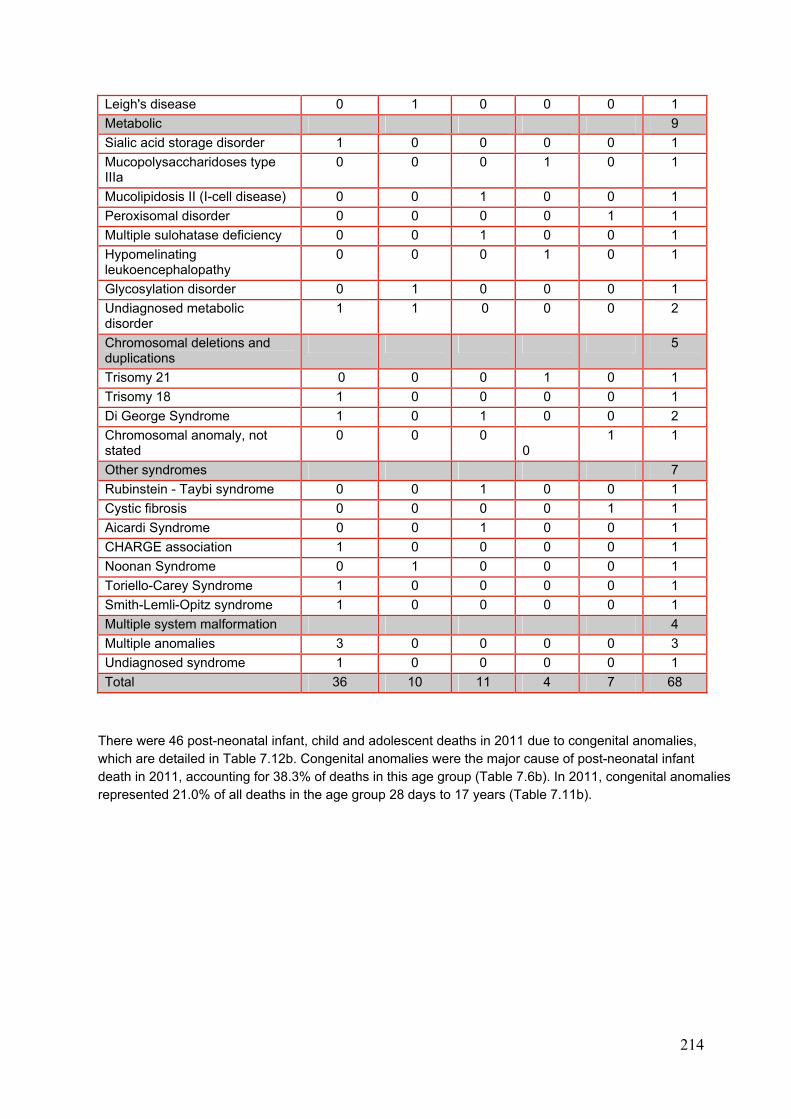
214
Leigh's disease 0 1 0 0 0 1
Metabolic 9
Sialic acid storage disorder 1 0 0 0 0 1
Mucopolysaccharidoses type IIIa
0 0 0 1 0 1
Mucolipidosis II (I-cell disease) 0 0 1 0 0 1
Peroxisomal disorder 0 0 0 0 1 1
Multiple sulohatase deficiency 0 0 1 0 0 1
Hypomelinating leukoencephalopathy
0 0 0 1 0 1
Glycosylation disorder 0 1 0 0 0 1
Undiagnosed metabolic disorder
1 1 0 0 0 2
Chromosomal deletions and duplications
5
Trisomy 21 0 0 0 1 0 1
Trisomy 18 1 0 0 0 0 1
Di George Syndrome 1 0 1 0 0 2
Chromosomal anomaly, not stated
0 0 0 0
1 1
Other syndromes 7
Rubinstein - Taybi syndrome 0 0 1 0 0 1
Cystic fibrosis 0 0 0 0 1 1
Aicardi Syndrome 0 0 1 0 0 1
CHARGE association 1 0 0 0 0 1
Noonan Syndrome 0 1 0 0 0 1
Toriello-Carey Syndrome 1 0 0 0 0 1
Smith-Lemli-Opitz syndrome 1 0 0 0 0 1
Multiple system malformation 4
Multiple anomalies 3 0 0 0 0 3
Undiagnosed syndrome 1 0 0 0 0 1
Total 36 10 11 4 7 68
There were 46 post-neonatal infant, child and adolescent deaths in 2011 due to congenital anomalies, which are detailed in Table 7.12b. Congenital anomalies were the major cause of post-neonatal infant death in 2011, accounting for 38.3% of deaths in this age group (Table 7.6b). In 2011, congenital anomalies represented 21.0% of all deaths in the age group 28 days to 17 years (Table 7.11b).
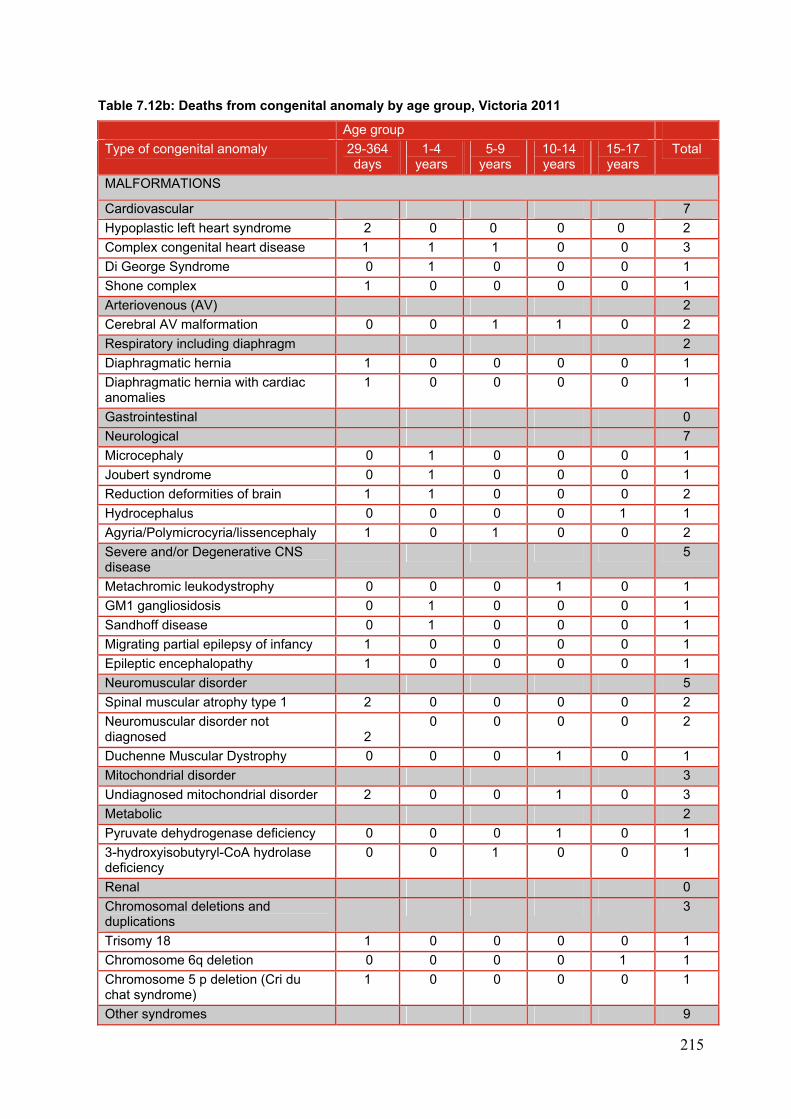
215
Table 7.12b: Deaths from congenital anomaly by age group, Victoria 2011
Age group
Type of congenital anomaly 29-364 days
1-4 years
5-9 years
10-14 years
15-17 years
Total
MALFORMATIONS
Cardiovascular 7
Hypoplastic left heart syndrome 2 0 0 0 0 2
Complex congenital heart disease 1 1 1 0 0 3
Di George Syndrome 0 1 0 0 0 1
Shone complex 1 0 0 0 0 1
Arteriovenous (AV) 2
Cerebral AV malformation 0 0 1 1 0 2
Respiratory including diaphragm 2
Diaphragmatic hernia 1 0 0 0 0 1
Diaphragmatic hernia with cardiac anomalies
1 0 0 0 0 1
Gastrointestinal 0
Neurological 7
Microcephaly 0 1 0 0 0 1
Joubert syndrome 0 1 0 0 0 1
Reduction deformities of brain 1 1 0 0 0 2
Hydrocephalus 0 0 0 0 1 1
Agyria/Polymicrocyria/lissencephaly 1 0 1 0 0 2
Severe and/or Degenerative CNS disease
5
Metachromic leukodystrophy 0 0 0 1 0 1
GM1 gangliosidosis 0 1 0 0 0 1
Sandhoff disease 0 1 0 0 0 1
Migrating partial epilepsy of infancy 1 0 0 0 0 1
Epileptic encephalopathy 1 0 0 0 0 1
Neuromuscular disorder 5
Spinal muscular atrophy type 1 2 0 0 0 0 2
Neuromuscular disorder not diagnosed 2
0 0 0 0 2
Duchenne Muscular Dystrophy 0 0 0 1 0 1
Mitochondrial disorder 3
Undiagnosed mitochondrial disorder 2 0 0 1 0 3
Metabolic 2
Pyruvate dehydrogenase deficiency 0 0 0 1 0 1
3-hydroxyisobutyryl-CoA hydrolase deficiency
0 0 1 0 0 1
Renal 0
Chromosomal deletions and duplications
3
Trisomy 18 1 0 0 0 0 1
Chromosome 6q deletion 0 0 0 0 1 1
Chromosome 5 p deletion (Cri du chat syndrome)
1 0 0 0 0 1
Other syndromes 9
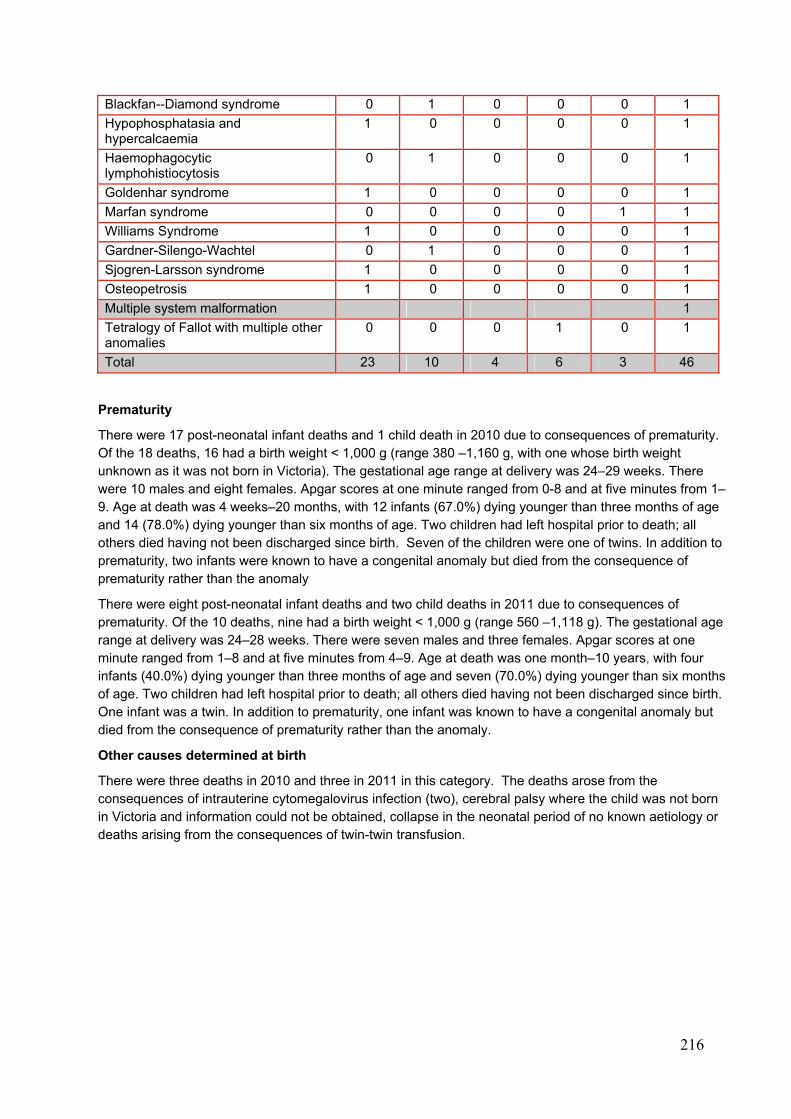
216
Blackfan--Diamond syndrome 0 1 0 0 0 1
Hypophosphatasia and hypercalcaemia
1 0 0 0 0 1
Haemophagocytic lymphohistiocytosis
0 1 0 0 0 1
Goldenhar syndrome 1 0 0 0 0 1
Marfan syndrome 0 0 0 0 1 1
Williams Syndrome 1 0 0 0 0 1
Gardner-Silengo-Wachtel 0 1 0 0 0 1
Sjogren-Larsson syndrome 1 0 0 0 0 1
Osteopetrosis 1 0 0 0 0 1
Multiple system malformation 1
Tetralogy of Fallot with multiple other anomalies
0 0 0 1 0 1
Total 23 10 4 6 3 46
Prematurity
There were 17 post-neonatal infant deaths and 1 child death in 2010 due to consequences of prematurity. Of the 18 deaths, 16 had a birth weight < 1,000 g (range 380 –1,160 g, with one whose birth weight unknown as it was not born in Victoria). The gestational age range at delivery was 24–29 weeks. There were 10 males and eight females. Apgar scores at one minute ranged from 0-8 and at five minutes from 1–9. Age at death was 4 weeks–20 months, with 12 infants (67.0%) dying younger than three months of age and 14 (78.0%) dying younger than six months of age. Two children had left hospital prior to death; all others died having not been discharged since birth. Seven of the children were one of twins. In addition to prematurity, two infants were known to have a congenital anomaly but died from the consequence of prematurity rather than the anomaly
There were eight post-neonatal infant deaths and two child deaths in 2011 due to consequences of prematurity. Of the 10 deaths, nine had a birth weight < 1,000 g (range 560 –1,118 g). The gestational age range at delivery was 24–28 weeks. There were seven males and three females. Apgar scores at one minute ranged from 1–8 and at five minutes from 4–9. Age at death was one month–10 years, with four infants (40.0%) dying younger than three months of age and seven (70.0%) dying younger than six months of age. Two children had left hospital prior to death; all others died having not been discharged since birth. One infant was a twin. In addition to prematurity, one infant was known to have a congenital anomaly but died from the consequence of prematurity rather than the anomaly.
Other causes determined at birth
There were three deaths in 2010 and three in 2011 in this category. The deaths arose from the consequences of intrauterine cytomegalovirus infection (two), cerebral palsy where the child was not born in Victoria and information could not be obtained, collapse in the neonatal period of no known aetiology or deaths arising from the consequences of twin-twin transfusion.
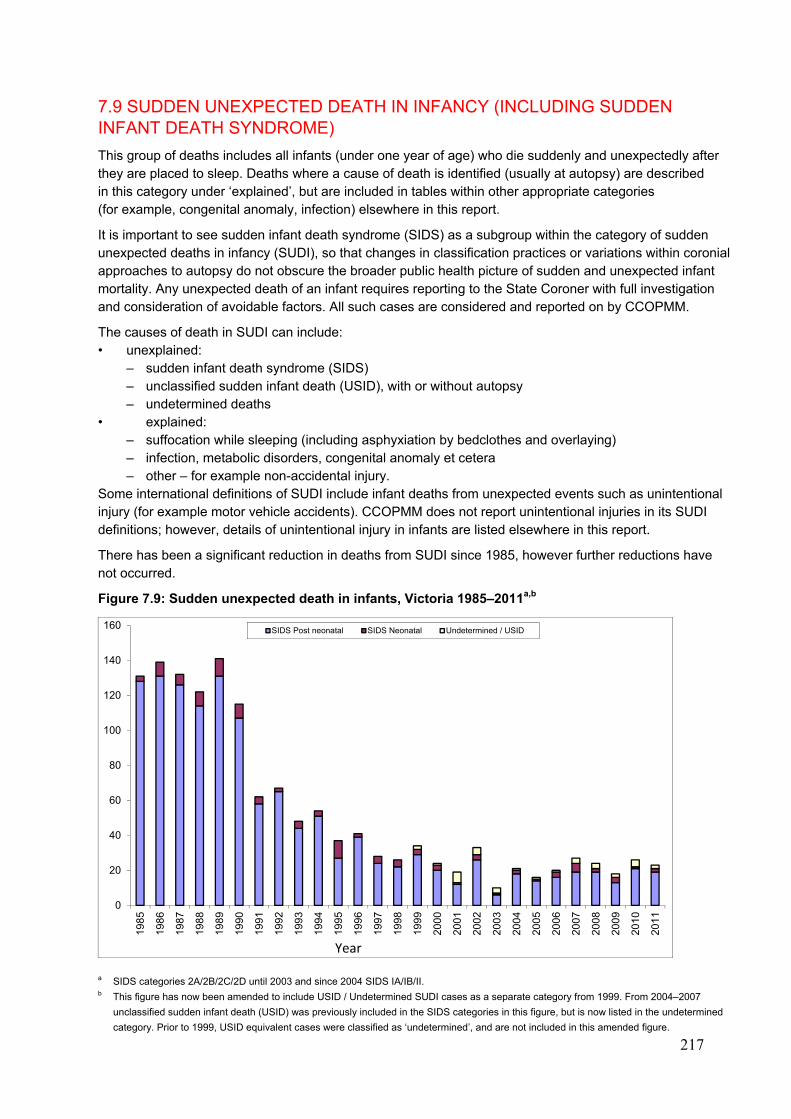
217
7.9 SUDDEN UNEXPECTED DEATH IN INFANCY (INCLUDING SUDDEN INFANT DEATH SYNDROME)
This group of deaths includes all infants (under one year of age) who die suddenly and unexpectedly after they are placed to sleep. Deaths where a cause of death is identified (usually at autopsy) are described in this category under ‘explained’, but are included in tables within other appropriate categories (for example, congenital anomaly, infection) elsewhere in this report.
It is important to see sudden infant death syndrome (SIDS) as a subgroup within the category of sudden unexpected deaths in infancy (SUDI), so that changes in classification practices or variations within coronial approaches to autopsy do not obscure the broader public health picture of sudden and unexpected infant mortality. Any unexpected death of an infant requires reporting to the State Coroner with full investigation and consideration of avoidable factors. All such cases are considered and reported on by CCOPMM.
The causes of death in SUDI can include: • unexplained:
– sudden infant death syndrome (SIDS) – unclassified sudden infant death (USID), with or without autopsy – undetermined deaths
• explained: – suffocation while sleeping (including asphyxiation by bedclothes and overlaying) – infection, metabolic disorders, congenital anomaly et cetera – other – for example non-accidental injury.
Some international definitions of SUDI include infant deaths from unexpected events such as unintentional injury (for example motor vehicle accidents). CCOPMM does not report unintentional injuries in its SUDI definitions; however, details of unintentional injury in infants are listed elsewhere in this report.
There has been a significant reduction in deaths from SUDI since 1985, however further reductions have not occurred.
Figure 7.9: Sudden unexpected death in infants, Victoria 1985–2011a,b
a SIDS categories 2A/2B/2C/2D until 2003 and since 2004 SIDS IA/IB/II. b This figure has now been amended to include USID / Undetermined SUDI cases as a separate category from 1999. From 2004–2007
unclassified sudden infant death (USID) was previously included in the SIDS categories in this figure, but is now listed in the undetermined
category. Prior to 1999, USID equivalent cases were classified as ‘undetermined’, and are not included in this amended figure.
0
20
40
60
80
100
120
140
160
1985
1986
1987
1988
1989
1990
1991
1992
1993
1994
1995
1996
1997
1998
1999
2000
2001
2002
2003
2004
2005
2006
2007
2008
2009
2010
2011
SIDS Post neonatal SIDS Neonatal Undetermined / USID
Year
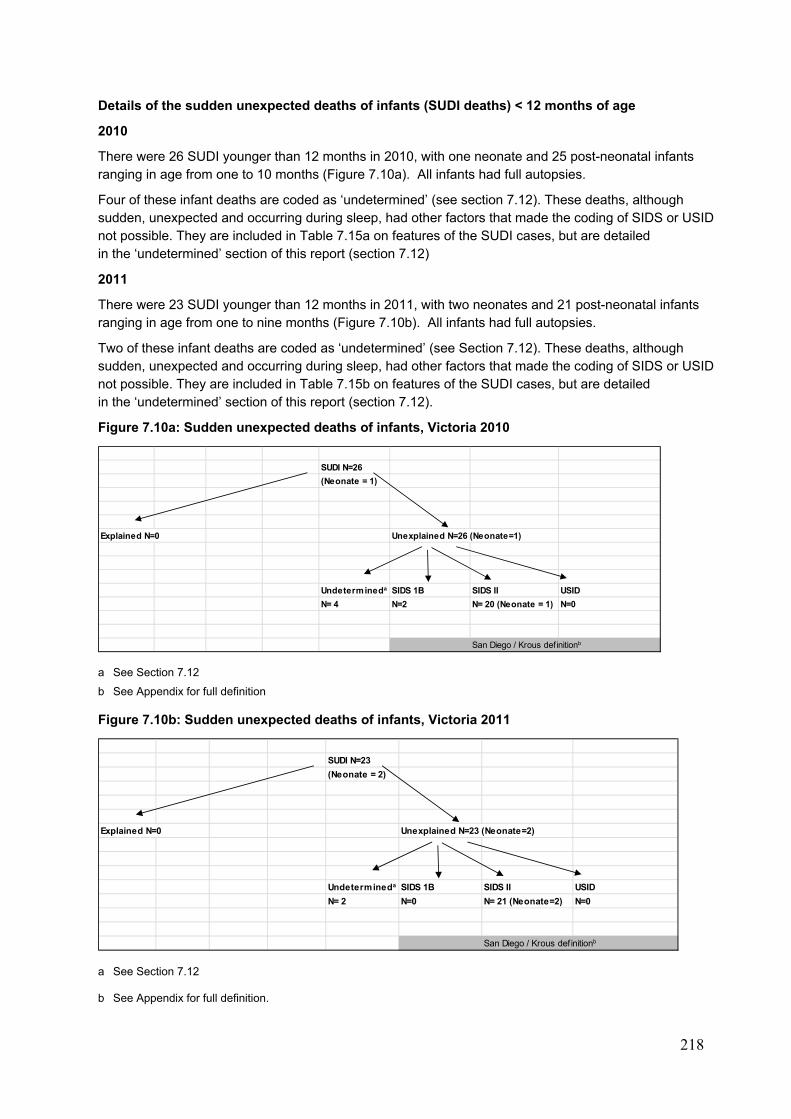
218
Details of the sudden unexpected deaths of infants (SUDI deaths) < 12 months of age
2010
There were 26 SUDI younger than 12 months in 2010, with one neonate and 25 post-neonatal infants ranging in age from one to 10 months (Figure 7.10a). All infants had full autopsies.
Four of these infant deaths are coded as ‘undetermined’ (see section 7.12). These deaths, although sudden, unexpected and occurring during sleep, had other factors that made the coding of SIDS or USID not possible. They are included in Table 7.15a on features of the SUDI cases, but are detailed in the ‘undetermined’ section of this report (section 7.12)
2011
There were 23 SUDI younger than 12 months in 2011, with two neonates and 21 post-neonatal infants ranging in age from one to nine months (Figure 7.10b). All infants had full autopsies.
Two of these infant deaths are coded as ‘undetermined’ (see Section 7.12). These deaths, although sudden, unexpected and occurring during sleep, had other factors that made the coding of SIDS or USID not possible. They are included in Table 7.15b on features of the SUDI cases, but are detailed in the ‘undetermined’ section of this report (section 7.12).
Figure 7.10a: Sudden unexpected deaths of infants, Victoria 2010
a See Section 7.12
b See Appendix for full definition
Figure 7.10b: Sudden unexpected deaths of infants, Victoria 2011
a See Section 7.12
b See Appendix for full definition.
SUDI N=26
(Neonate = 1)
Explained N=0 Unexplained N=26 (Neonate=1)
Undetermineda SIDS 1B SIDS II USID
N= 4 N=2 N= 20 (Neonate = 1) N=0
San Diego / Krous definitionb
SUDI N=23
(Neonate = 2)
Explained N=0 Unexplained N=23 (Neonate=2)
Undetermineda SIDS 1B SIDS II USID
N= 2 N=0 N= 21 (Neonate=2) N=0
San Diego / Krous def initionb
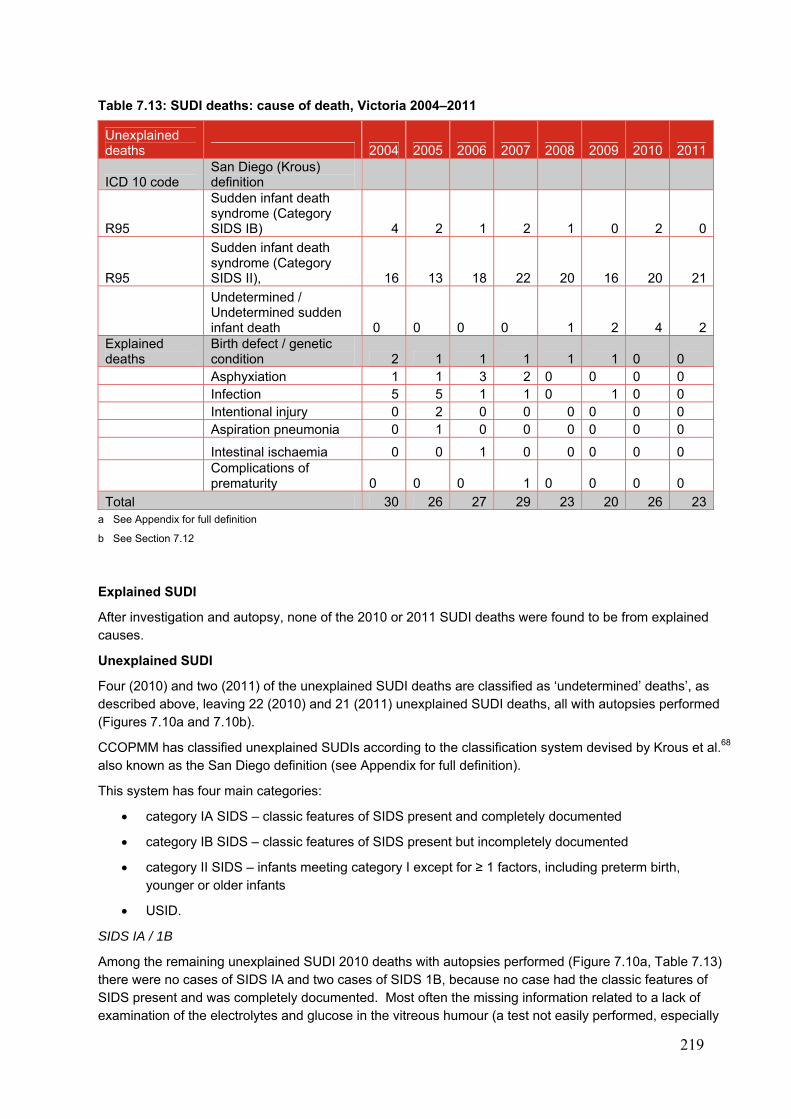
219
Table 7.13: SUDI deaths: cause of death, Victoria 2004–2011
Unexplained deaths 2004 2005 2006 2007 2008 2009 2010 2011
ICD 10 code San Diego (Krous) definition
R95
Sudden infant death syndrome (Category SIDS IB) 4 2 1 2 1 0 2 0
R95
Sudden infant death syndrome (Category SIDS II), 16 13 18 22 20 16 20 21
Undetermined / Undetermined sudden infant death 0 0 0 0 1 2 4 2
Explained deaths
Birth defect / genetic condition 2 1 1 1 1 1 0 0
Asphyxiation 1 1 3 2 0 0 0 0 Infection 5 5 1 1 0 1 0 0 Intentional injury 0 2 0 0 0 0 0 0 Aspiration pneumonia 0 1 0 0 0 0 0 0
Intestinal ischaemia 0 0 1 0 0 0 0 0
Complications of prematurity 0 0 0 1 0 0 0 0
Total 30 26 27 29 23 20 26 23a See Appendix for full definition
b See Section 7.12
Explained SUDI
After investigation and autopsy, none of the 2010 or 2011 SUDI deaths were found to be from explained causes.
Unexplained SUDI
Four (2010) and two (2011) of the unexplained SUDI deaths are classified as ‘undetermined’ deaths’, as described above, leaving 22 (2010) and 21 (2011) unexplained SUDI deaths, all with autopsies performed (Figures 7.10a and 7.10b).
CCOPMM has classified unexplained SUDIs according to the classification system devised by Krous et al.68 also known as the San Diego definition (see Appendix for full definition).
This system has four main categories:
category IA SIDS – classic features of SIDS present and completely documented
category IB SIDS – classic features of SIDS present but incompletely documented
category II SIDS – infants meeting category I except for ≥ 1 factors, including preterm birth, younger or older infants
USID.
SIDS IA / 1B
Among the remaining unexplained SUDI 2010 deaths with autopsies performed (Figure 7.10a, Table 7.13) there were no cases of SIDS IA and two cases of SIDS 1B, because no case had the classic features of SIDS present and was completely documented. Most often the missing information related to a lack of examination of the electrolytes and glucose in the vitreous humour (a test not easily performed, especially
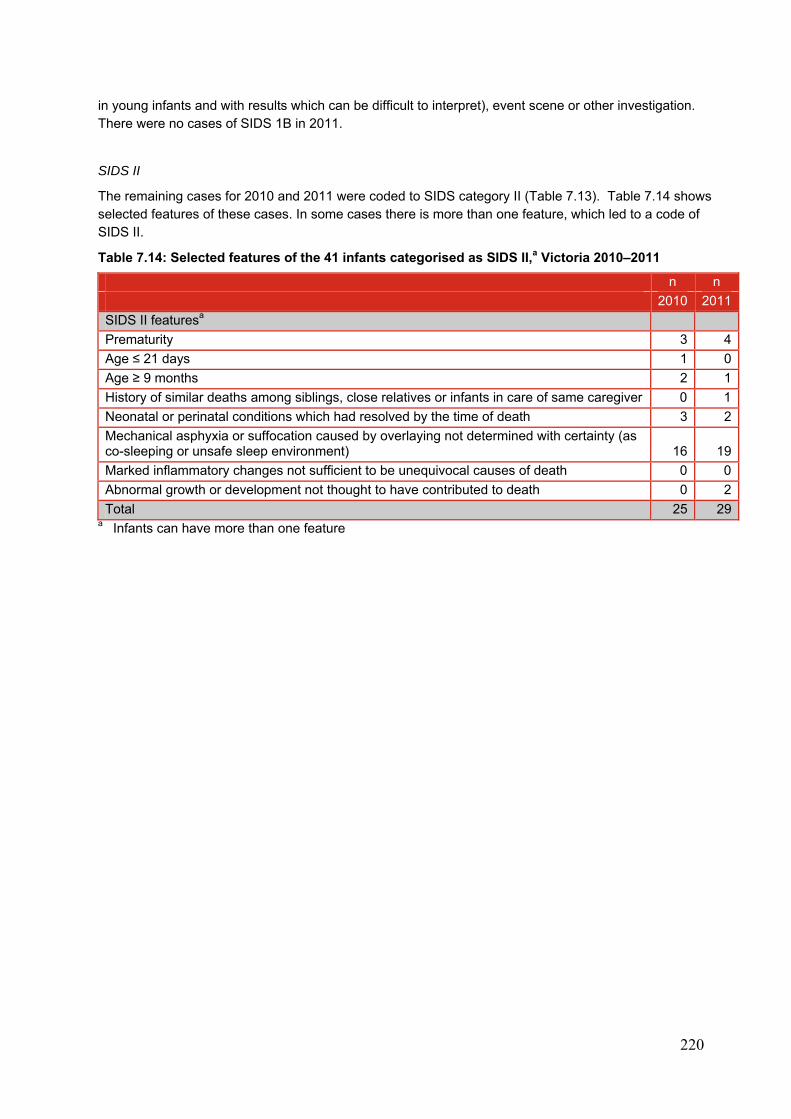
220
in young infants and with results which can be difficult to interpret), event scene or other investigation. There were no cases of SIDS 1B in 2011.
SIDS II
The remaining cases for 2010 and 2011 were coded to SIDS category II (Table 7.13). Table 7.14 shows selected features of these cases. In some cases there is more than one feature, which led to a code of SIDS II.
Table 7.14: Selected features of the 41 infants categorised as SIDS II,a Victoria 2010–2011
n n
2010 2011
SIDS II featuresa
Prematurity 3 4
Age ≤ 21 days 1 0
Age ≥ 9 months 2 1
History of similar deaths among siblings, close relatives or infants in care of same caregiver 0 1
Neonatal or perinatal conditions which had resolved by the time of death 3 2
Mechanical asphyxia or suffocation caused by overlaying not determined with certainty (as co-sleeping or unsafe sleep environment) 16 19
Marked inflammatory changes not sufficient to be unequivocal causes of death 0 0
Abnormal growth or development not thought to have contributed to death 0 2
Total 25 29a Infants can have more than one feature
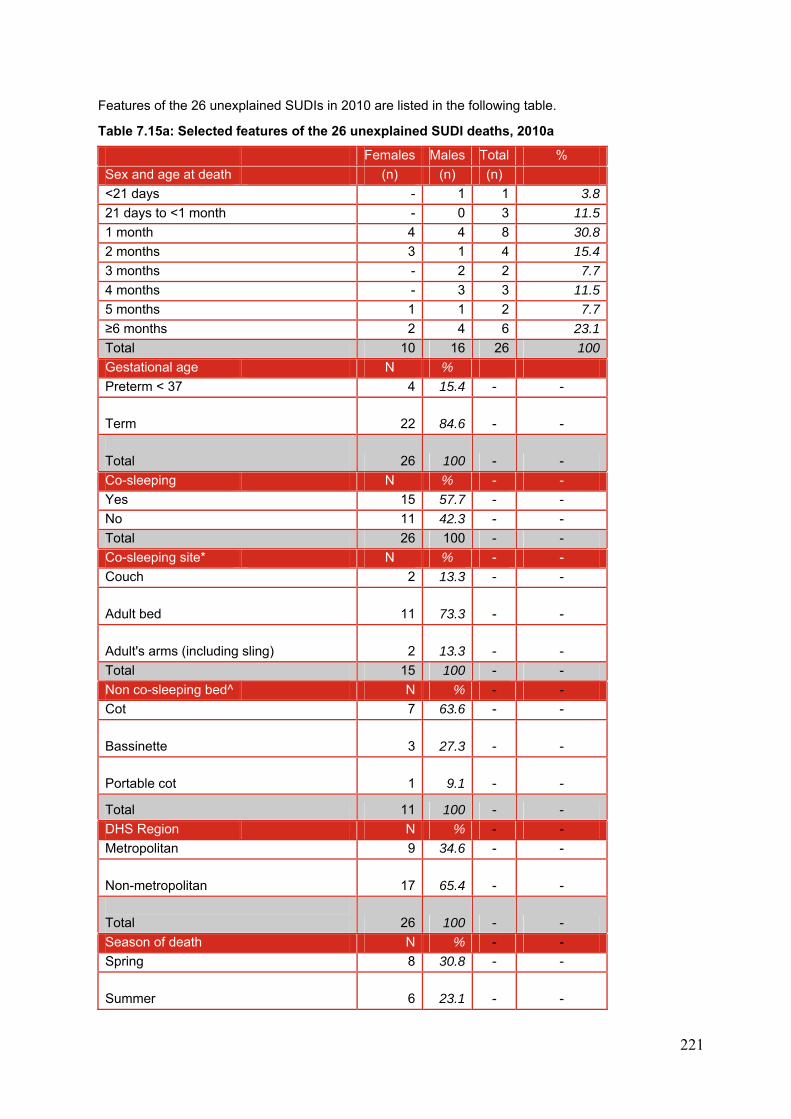
221
Features of the 26 unexplained SUDIs in 2010 are listed in the following table.
Table 7.15a: Selected features of the 26 unexplained SUDI deaths, 2010a
Females Males Total %
Sex and age at death (n) (n) (n)
<21 days - 1 1 3.8
21 days to <1 month - 0 3 11.5
1 month 4 4 8 30.8
2 months 3 1 4 15.4
3 months - 2 2 7.7
4 months - 3 3 11.5
5 months 1 1 2 7.7
≥6 months 2 4 6 23.1
Total 10 16 26 100
Gestational age N %
Preterm < 37 4 15.4 - -
Term 22 84.6 - -
Total 26 100 - -
Co-sleeping N % - -
Yes 15 57.7 - -
No 11 42.3 - -
Total 26 100 - -
Co-sleeping site* N % - -
Couch 2 13.3 - -
Adult bed 11 73.3 - -
Adult's arms (including sling) 2 13.3 - -
Total 15 100 - -
Non co-sleeping bed^ N % - -
Cot 7 63.6 - -
Bassinette 3 27.3 - -
Portable cot 1 9.1 - -
Total 11 100 - -
DHS Region N % - -
Metropolitan 9 34.6 - -
Non-metropolitan 17 65.4 - -
Total 26 100 - -
Season of death N % - -
Spring 8 30.8 - -
Summer 6 23.1 - -
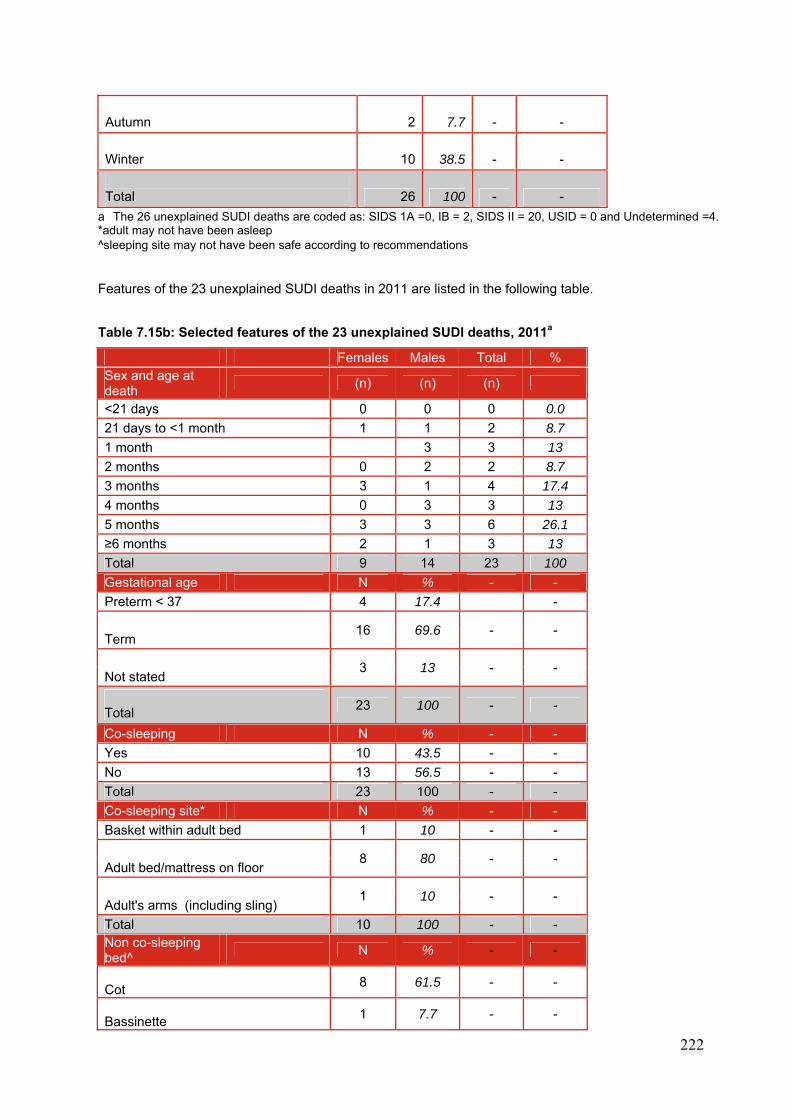
222
Autumn 2 7.7 - -
Winter 10 38.5 - -
Total 26 100 - -
a The 26 unexplained SUDI deaths are coded as: SIDS 1A =0, IB = 2, SIDS II = 20, USID = 0 and Undetermined =4. *adult may not have been asleep ^sleeping site may not have been safe according to recommendations Features of the 23 unexplained SUDI deaths in 2011 are listed in the following table.
Table 7.15b: Selected features of the 23 unexplained SUDI deaths, 2011a
Females Males Total % Sex and age at death
(n) (n) (n)
<21 days 0 0 0 0.0
21 days to <1 month 1 1 2 8.7
1 month 3 3 13
2 months 0 2 2 8.7
3 months 3 1 4 17.4
4 months 0 3 3 13
5 months 3 3 6 26.1
≥6 months 2 1 3 13
Total 9 14 23 100
Gestational age N % - -
Preterm < 37 4 17.4 -
16 69.6 - -
Term
3 13 - -
Not stated
Total
23 100 - -
Co-sleeping N % - -
Yes 10 43.5 - -
No 13 56.5 - -
Total 23 100 - -
Co-sleeping site* N % - -
Basket within adult bed 1 10 - -
8 80 - -
Adult bed/mattress on floor
1 10 - -
Adult's arms (including sling)
Total 10 100 - - Non co-sleeping bed^
N % - -
Cot
8 61.5 - -
Bassinette
1 7.7 - -

223
Portable cot
2 15.4 - -
Mattress on floor 1 7.7 - -
Bouncer 1 7.7 - -
Total 13 100 - -
DHS Region N % - -
Metropolitan 13 56.5 - -
Non-metropolitan
10 43.5 - -
Total
23 100 - -
Season of death N % - - Spring
9 39.1 - -
Summer
4 17.4 - -
Autumn
5 21.7 - -
Winter
5 21.7 - -
Total
23 100 - -
a The 23 unexplained SUDI deaths are coded as: SIDS 1A =0, IB = 0, SIDS II = 21, USID = 0 and Undetermined =2.
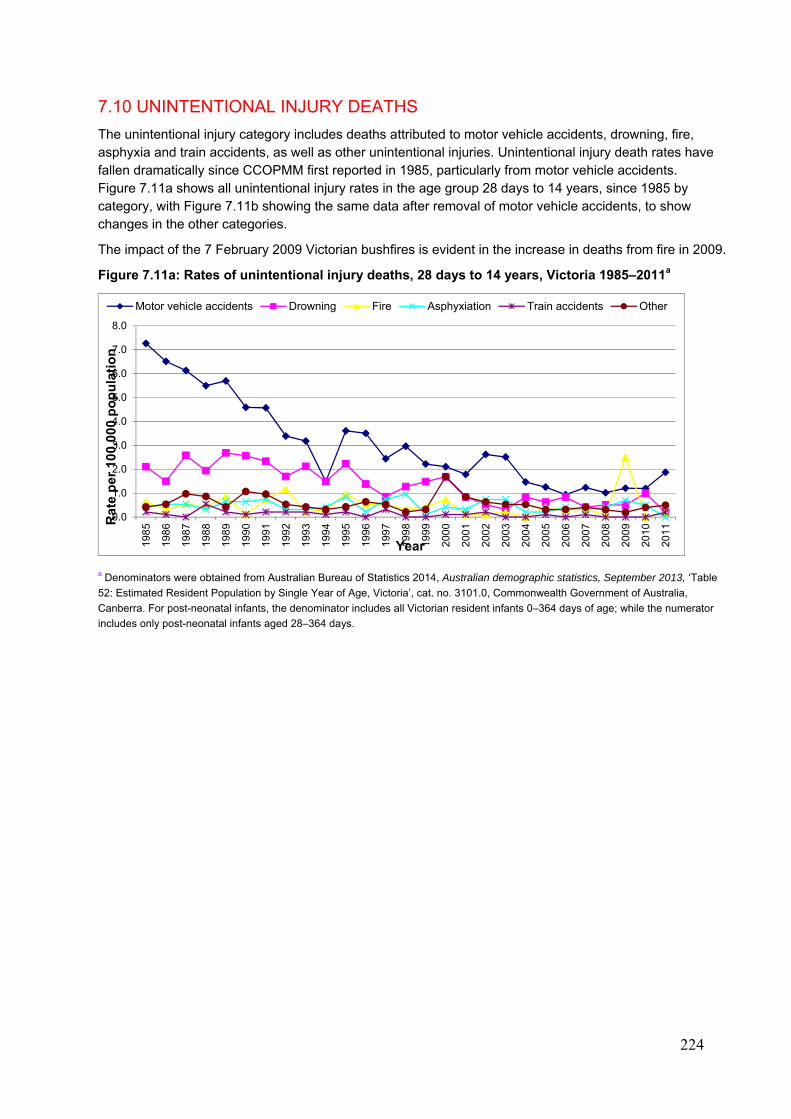
224
7.10 UNINTENTIONAL INJURY DEATHS
The unintentional injury category includes deaths attributed to motor vehicle accidents, drowning, fire, asphyxia and train accidents, as well as other unintentional injuries. Unintentional injury death rates have fallen dramatically since CCOPMM first reported in 1985, particularly from motor vehicle accidents. Figure 7.11a shows all unintentional injury rates in the age group 28 days to 14 years, since 1985 by category, with Figure 7.11b showing the same data after removal of motor vehicle accidents, to show changes in the other categories.
The impact of the 7 February 2009 Victorian bushfires is evident in the increase in deaths from fire in 2009.
Figure 7.11a: Rates of unintentional injury deaths, 28 days to 14 years, Victoria 1985–2011a
a Denominators were obtained from Australian Bureau of Statistics 2014, Australian demographic statistics, September 2013, ‘Table
52: Estimated Resident Population by Single Year of Age, Victoria’, cat. no. 3101.0, Commonwealth Government of Australia,
Canberra. For post-neonatal infants, the denominator includes all Victorian resident infants 0–364 days of age; while the numerator
includes only post-neonatal infants aged 28–364 days.
0.0
1.0
2.0
3.0
4.0
5.0
6.0
7.0
8.0
198
5
198
6
198
7
198
8
198
9
199
0
199
1
199
2
199
3
199
4
199
5
199
6
199
7
199
8
199
9
200
0
200
1
200
2
200
3
200
4
200
5
200
6
200
7
200
8
200
9
201
0
201
1Rat
e p
er 1
00,0
00 p
op
ula
tio
n
Year
Motor vehicle accidents Drowning Fire Asphyxiation Train accidents Other
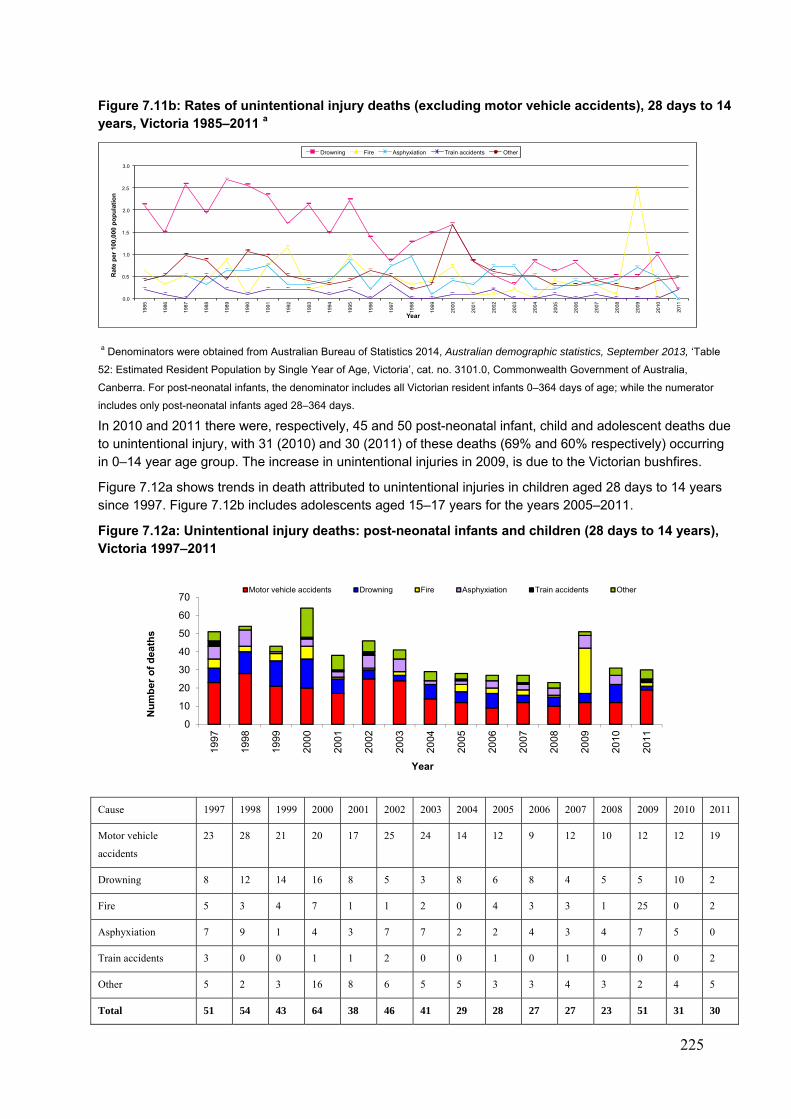
225
Figure 7.11b: Rates of unintentional injury deaths (excluding motor vehicle accidents), 28 days to 14 years, Victoria 1985–2011 a
a Denominators were obtained from Australian Bureau of Statistics 2014, Australian demographic statistics, September 2013, ‘Table
52: Estimated Resident Population by Single Year of Age, Victoria’, cat. no. 3101.0, Commonwealth Government of Australia,
Canberra. For post-neonatal infants, the denominator includes all Victorian resident infants 0–364 days of age; while the numerator
includes only post-neonatal infants aged 28–364 days.
In 2010 and 2011 there were, respectively, 45 and 50 post-neonatal infant, child and adolescent deaths due to unintentional injury, with 31 (2010) and 30 (2011) of these deaths (69% and 60% respectively) occurring in 0–14 year age group. The increase in unintentional injuries in 2009, is due to the Victorian bushfires.
Figure 7.12a shows trends in death attributed to unintentional injuries in children aged 28 days to 14 years since 1997. Figure 7.12b includes adolescents aged 15–17 years for the years 2005–2011.
Figure 7.12a: Unintentional injury deaths: post-neonatal infants and children (28 days to 14 years), Victoria 1997–2011
Cause 1997 1998 1999 2000 2001 2002 2003 2004 2005 2006 2007 2008 2009 2010 2011
Motor vehicle
accidents
23 28 21 20 17 25 24 14 12 9 12 10 12 12 19
Drowning 8 12 14 16 8 5 3 8 6 8 4 5 5 10 2
Fire 5 3 4 7 1 1 2 0 4 3 3 1 25 0 2
Asphyxiation 7 9 1 4 3 7 7 2 2 4 3 4 7 5 0
Train accidents 3 0 0 1 1 2 0 0 1 0 1 0 0 0 2
Other 5 2 3 16 8 6 5 5 3 3 4 3 2 4 5
Total 51 54 43 64 38 46 41 29 28 27 27 23 51 31 30
0.0
0.5
1.0
1.5
2.0
2.5
3.0
198
5
198
6
198
7
198
8
198
9
199
0
199
1
199
2
199
3
199
4
199
5
199
6
199
7
199
8
199
9
200
0
200
1
200
2
200
3
200
4
200
5
200
6
200
7
200
8
200
9
201
0
2011
Rat
e p
er 1
00,0
00 p
op
ula
tio
n
Year
Drowning Fire Asphyxiation Train accidents Other
0
10
20
30
40
50
60
70
1997
1998
1999
2000
2001
2002
2003
2004
2005
2006
2007
2008
2009
2010
2011
Nu
mb
er
of
de
ath
s
Year
Motor vehicle accidents Drowning Fire Asphyxiation Train accidents Other
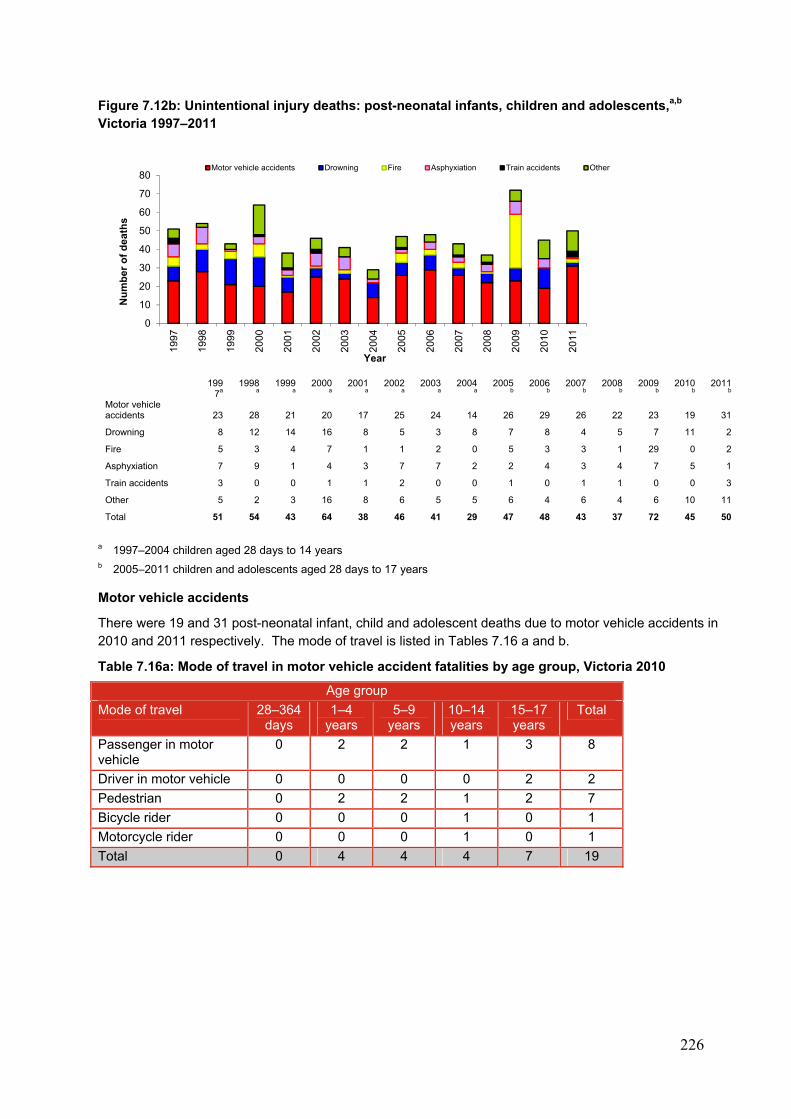
226
Figure 7.12b: Unintentional injury deaths: post-neonatal infants, children and adolescents,a,b
Victoria 1997–2011
199
7a 1998
a 1999
a 2000
a 2001
a 2002
a 2003
a 2004
a 2005
b 2006
b 2007
b 2008
b 2009
b 2010
b 2011
b Motor vehicle accidents 23 28 21 20 17 25 24 14 26 29 26 22 23 19 31
Drowning 8 12 14 16 8 5 3 8 7 8 4 5 7 11 2
Fire 5 3 4 7 1 1 2 0 5 3 3 1 29 0 2
Asphyxiation 7 9 1 4 3 7 7 2 2 4 3 4 7 5 1
Train accidents 3 0 0 1 1 2 0 0 1 0 1 1 0 0 3
Other 5 2 3 16 8 6 5 5 6 4 6 4 6 10 11
Total 51 54 43 64 38 46 41 29 47 48 43 37 72 45 50
a 1997–2004 children aged 28 days to 14 years b 2005–2011 children and adolescents aged 28 days to 17 years
Motor vehicle accidents
There were 19 and 31 post-neonatal infant, child and adolescent deaths due to motor vehicle accidents in 2010 and 2011 respectively. The mode of travel is listed in Tables 7.16 a and b.
Table 7.16a: Mode of travel in motor vehicle accident fatalities by age group, Victoria 2010
Age group
Mode of travel 28–364 days
1–4 years
5–9 years
10–14 years
15–17 years
Total
Passenger in motor vehicle
0 2 2 1 3 8
Driver in motor vehicle 0 0 0 0 2 2
Pedestrian 0 2 2 1 2 7
Bicycle rider 0 0 0 1 0 1
Motorcycle rider 0 0 0 1 0 1
Total 0 4 4 4 7 19
0
10
20
30
40
50
60
70
8019
97
1998
1999
2000
2001
2002
2003
2004
2005
2006
2007
2008
2009
2010
2011
Nu
mb
er o
f d
eath
s
Year
Motor vehicle accidents Drowning Fire Asphyxiation Train accidents Other
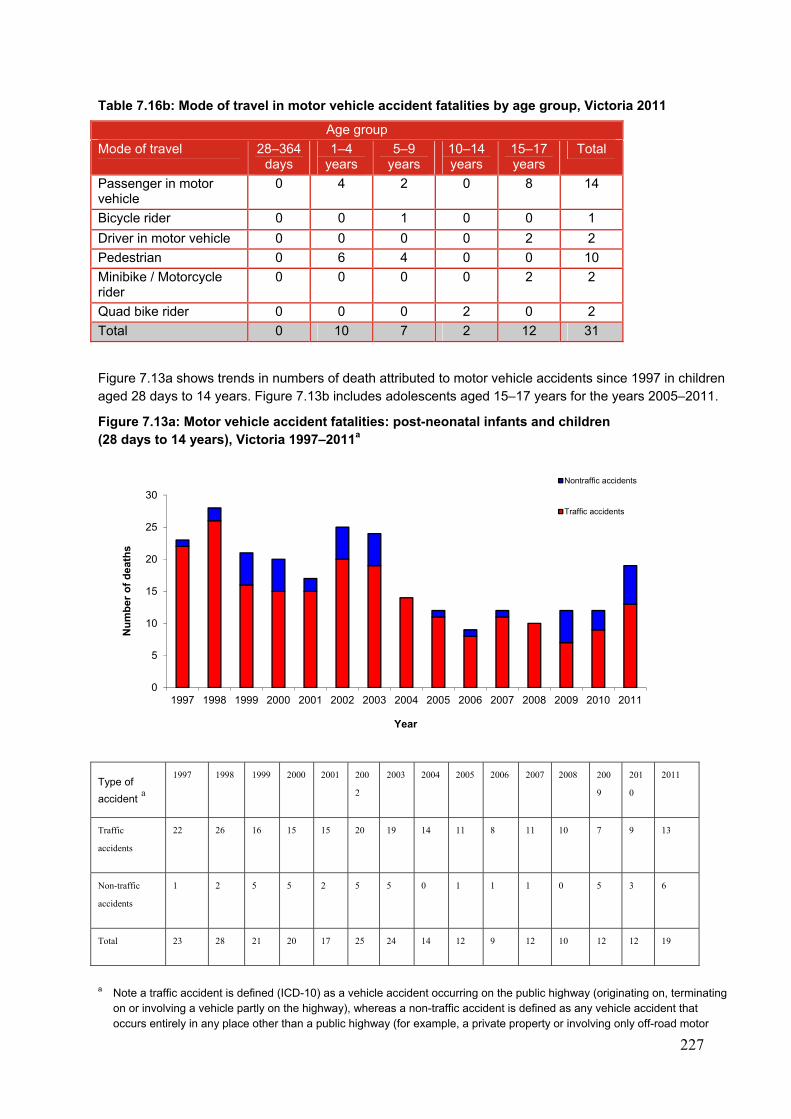
227
Table 7.16b: Mode of travel in motor vehicle accident fatalities by age group, Victoria 2011
Age group
Mode of travel 28–364 days
1–4 years
5–9 years
10–14 years
15–17 years
Total
Passenger in motor vehicle
0 4 2 0 8 14
Bicycle rider 0 0 1 0 0 1
Driver in motor vehicle 0 0 0 0 2 2
Pedestrian 0 6 4 0 0 10
Minibike / Motorcycle rider
0 0 0 0 2 2
Quad bike rider 0 0 0 2 0 2
Total 0 10 7 2 12 31
Figure 7.13a shows trends in numbers of death attributed to motor vehicle accidents since 1997 in children aged 28 days to 14 years. Figure 7.13b includes adolescents aged 15–17 years for the years 2005–2011.
Figure 7.13a: Motor vehicle accident fatalities: post-neonatal infants and children (28 days to 14 years), Victoria 1997–2011a
Type of
accident a
1997 1998 1999 2000 2001 200
2
2003 2004 2005 2006 2007 2008 200
9
201
0
2011
Traffic
accidents
22 26 16 15 15 20 19 14 11 8 11 10 7 9 13
Non-traffic
accidents
1 2 5 5 2 5 5 0 1 1 1 0 5 3 6
Total 23 28 21 20 17 25 24 14 12 9 12 10 12 12 19
a Note a traffic accident is defined (ICD-10) as a vehicle accident occurring on the public highway (originating on, terminating
on or involving a vehicle partly on the highway), whereas a non-traffic accident is defined as any vehicle accident that occurs entirely in any place other than a public highway (for example, a private property or involving only off-road motor
0
5
10
15
20
25
30
1997 1998 1999 2000 2001 2002 2003 2004 2005 2006 2007 2008 2009 2010 2011
Nu
mb
er o
f d
eath
s
Year
Nontraffic accidents
Traffic accidents
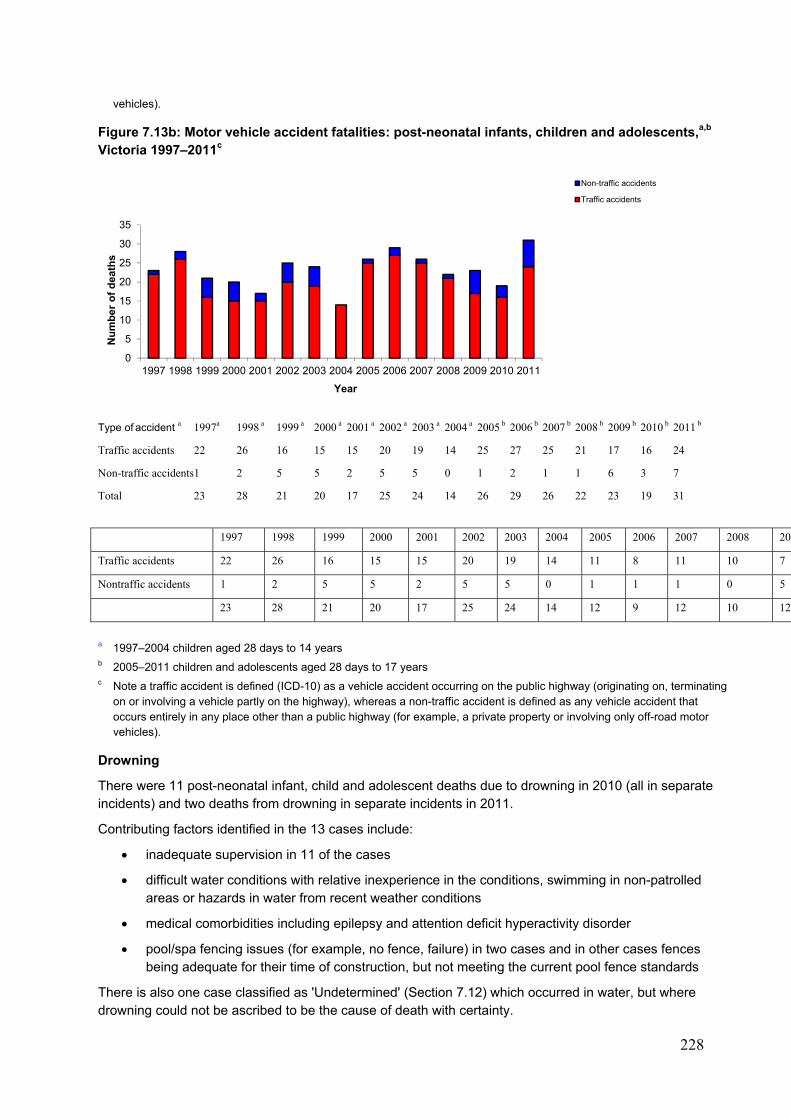
228
vehicles).
Figure 7.13b: Motor vehicle accident fatalities: post-neonatal infants, children and adolescents,a,b Victoria 1997–2011c
Type of accident a 1997a 1998 a 1999 a 2000 a 2001 a 2002 a 2003 a 2004 a 2005 b 2006 b 2007 b 2008 b 2009 b 2010 b 2011 b
Traffic accidents 22 26 16 15 15 20 19 14 25 27 25 21 17 16 24
Non-traffic accidents 1 2 5 5 2 5 5 0 1 2 1 1 6 3 7
Total 23 28 21 20 17 25 24 14 26 29 26 22 23 19 31
1997 1998 1999 2000 2001 2002 2003 2004 2005 2006 2007 2008 200
Traffic accidents 22 26 16 15 15 20 19 14 11 8 11 10 7
Nontraffic accidents 1 2 5 5 2 5 5 0 1 1 1 0 5
23 28 21 20 17 25 24 14 12 9 12 10 12
a 1997–2004 children aged 28 days to 14 years b 2005–2011 children and adolescents aged 28 days to 17 years c Note a traffic accident is defined (ICD-10) as a vehicle accident occurring on the public highway (originating on, terminating
on or involving a vehicle partly on the highway), whereas a non-traffic accident is defined as any vehicle accident that occurs entirely in any place other than a public highway (for example, a private property or involving only off-road motor vehicles).
Drowning
There were 11 post-neonatal infant, child and adolescent deaths due to drowning in 2010 (all in separate incidents) and two deaths from drowning in separate incidents in 2011.
Contributing factors identified in the 13 cases include:
inadequate supervision in 11 of the cases
difficult water conditions with relative inexperience in the conditions, swimming in non-patrolled areas or hazards in water from recent weather conditions
medical comorbidities including epilepsy and attention deficit hyperactivity disorder
pool/spa fencing issues (for example, no fence, failure) in two cases and in other cases fences being adequate for their time of construction, but not meeting the current pool fence standards
There is also one case classified as 'Undetermined' (Section 7.12) which occurred in water, but where drowning could not be ascribed to be the cause of death with certainty.
0
5
10
15
20
25
30
35
1997 1998 1999 2000 2001 2002 2003 2004 2005 2006 2007 2008 2009 2010 2011
Nu
mb
er o
f d
eath
s
Year
Non-traffic accidents
Traffic accidents
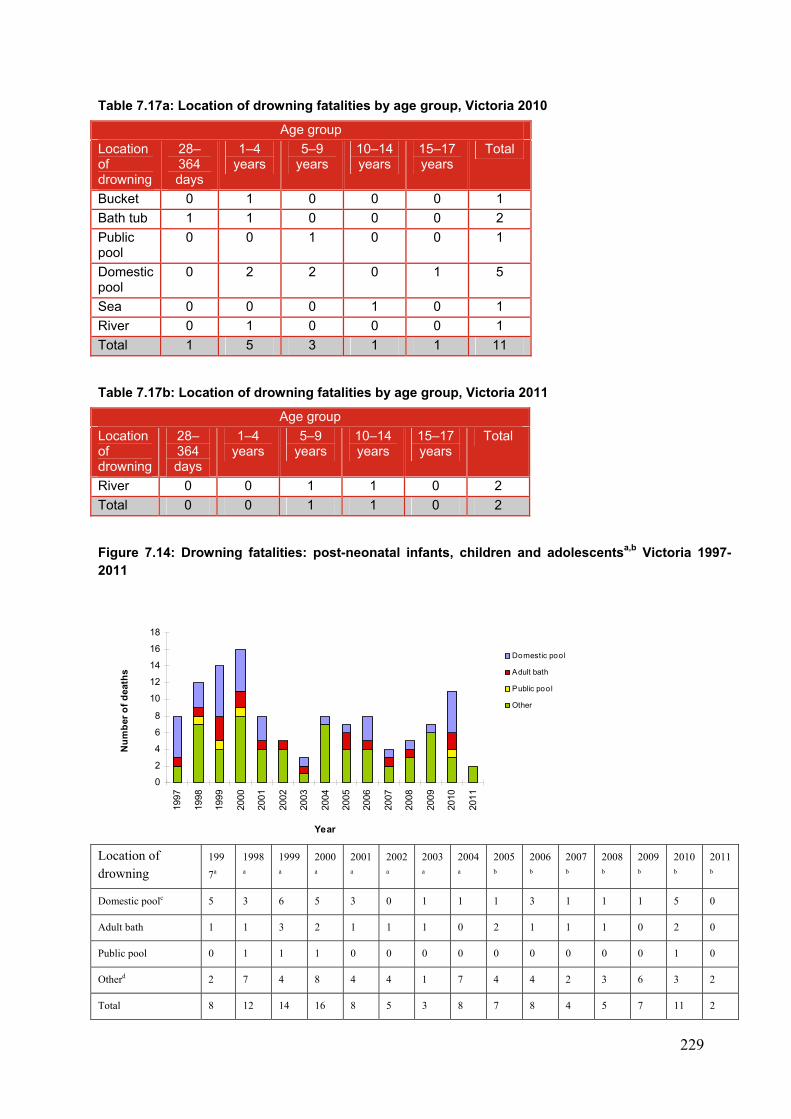
229
Table 7.17a: Location of drowning fatalities by age group, Victoria 2010
Age group
Location of drowning
28–364 days
1–4 years
5–9 years
10–14 years
15–17 years
Total
Bucket 0 1 0 0 0 1
Bath tub 1 1 0 0 0 2
Public pool
0 0 1 0 0 1
Domestic pool
0 2 2 0 1 5
Sea 0 0 0 1 0 1
River 0 1 0 0 0 1
Total 1 5 3 1 1 11
Table 7.17b: Location of drowning fatalities by age group, Victoria 2011
Age group
Location of drowning
28–364 days
1–4 years
5–9 years
10–14 years
15–17 years
Total
River 0 0 1 1 0 2
Total 0 0 1 1 0 2
Figure 7.14: Drowning fatalities: post-neonatal infants, children and adolescentsa,b Victoria 1997-2011
Location of drowning
199
7a
1998
a
1999
a
2000
a
2001
a
2002
a
2003
a
2004
a
2005
b
2006
b
2007
b
2008
b
2009
b
2010
b
2011
b
Domestic poolc 5 3 6 5 3 0 1 1 1 3 1 1 1 5 0
Adult bath 1 1 3 2 1 1 1 0 2 1 1 1 0 2 0
Public pool 0 1 1 1 0 0 0 0 0 0 0 0 0 1 0
Otherd 2 7 4 8 4 4 1 7 4 4 2 3 6 3 2
Total 8 12 14 16 8 5 3 8 7 8 4 5 7 11 2
0
2
4
6
8
10
12
14
16
18
1997
1998
1999
2000
2001
2002
2003
2004
2005
2006
2007
2008
2009
2010
2011
Year
Nu
mb
er o
f d
eath
s
Domestic pool
Adult bath
Public pool
Other
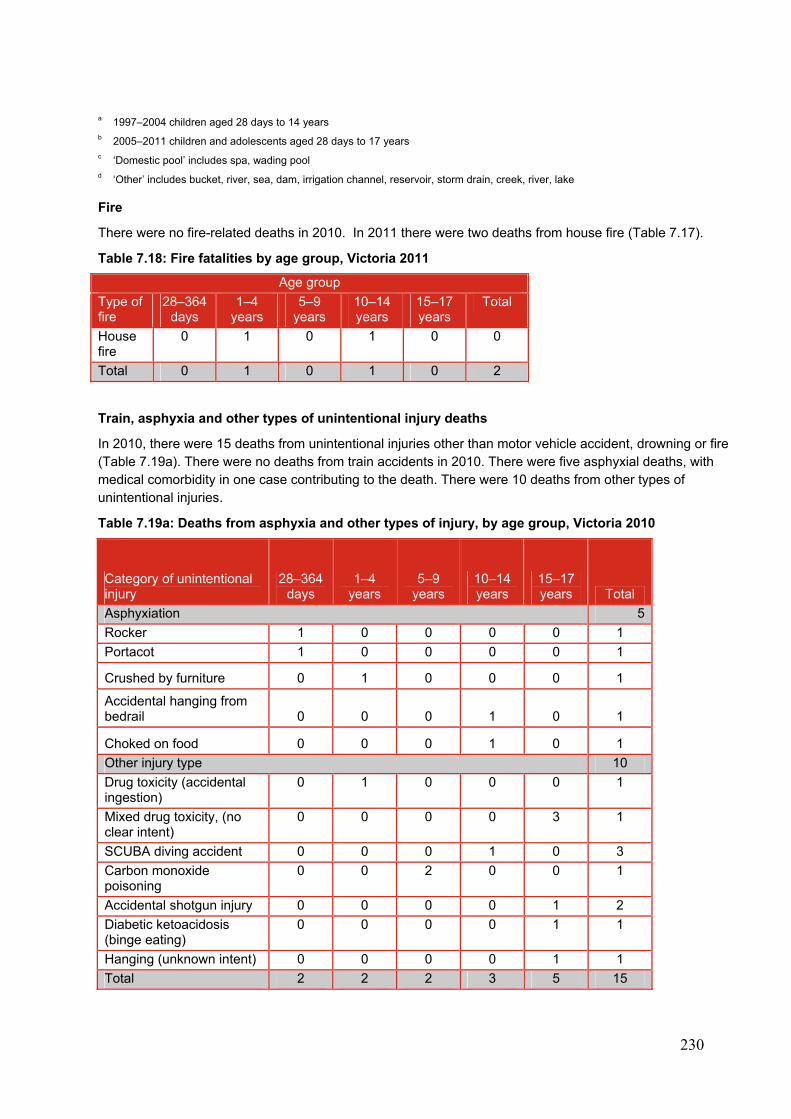
230
a 1997–2004 children aged 28 days to 14 years b 2005–2011 children and adolescents aged 28 days to 17 years c ‘Domestic pool’ includes spa, wading pool d ‘Other’ includes bucket, river, sea, dam, irrigation channel, reservoir, storm drain, creek, river, lake
Fire
There were no fire-related deaths in 2010. In 2011 there were two deaths from house fire (Table 7.17).
Table 7.18: Fire fatalities by age group, Victoria 2011
Age group
Type of fire
28–364 days
1–4 years
5–9 years
10–14 years
15–17 years
Total
House fire
0 1 0 1 0 0
Total 0 1 0 1 0 2
Train, asphyxia and other types of unintentional injury deaths
In 2010, there were 15 deaths from unintentional injuries other than motor vehicle accident, drowning or fire (Table 7.19a). There were no deaths from train accidents in 2010. There were five asphyxial deaths, with medical comorbidity in one case contributing to the death. There were 10 deaths from other types of unintentional injuries.
Table 7.19a: Deaths from asphyxia and other types of injury, by age group, Victoria 2010
Category of unintentional injury
28–364 days
1–4 years
5–9 years
10–14 years
15–17 years Total
Asphyxiation 5
Rocker 1 0 0 0 0 1
Portacot 1 0 0 0 0 1
Crushed by furniture 0 1 0 0 0 1
Accidental hanging from bedrail 0 0 0 1 0 1
Choked on food 0 0 0 1 0 1
Other injury type 10
Drug toxicity (accidental ingestion)
0 1 0 0 0 1
Mixed drug toxicity, (no clear intent)
0 0 0 0 3 1
SCUBA diving accident 0 0 0 1 0 3
Carbon monoxide poisoning
0 0 2 0 0 1
Accidental shotgun injury 0 0 0 0 1 2
Diabetic ketoacidosis (binge eating)
0 0 0 0 1 1
Hanging (unknown intent) 0 0 0 0 1 1
Total 2 2 2 3 5 15
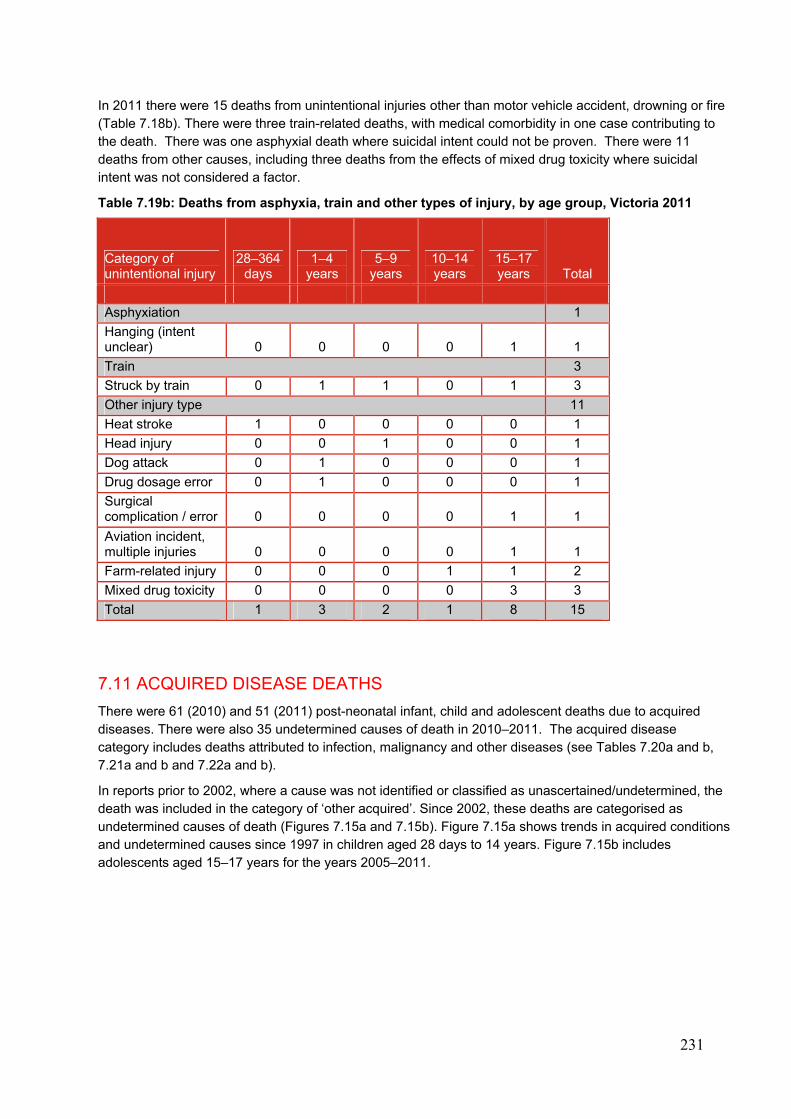
231
In 2011 there were 15 deaths from unintentional injuries other than motor vehicle accident, drowning or fire (Table 7.18b). There were three train-related deaths, with medical comorbidity in one case contributing to the death. There was one asphyxial death where suicidal intent could not be proven. There were 11 deaths from other causes, including three deaths from the effects of mixed drug toxicity where suicidal intent was not considered a factor.
Table 7.19b: Deaths from asphyxia, train and other types of injury, by age group, Victoria 2011
Category of unintentional injury
28–364 days
1–4 years
5–9 years
10–14 years
15–17 years Total
Asphyxiation 1
Hanging (intent unclear) 0 0 0 0 1 1
Train 3
Struck by train 0 1 1 0 1 3
Other injury type 11
Heat stroke 1 0 0 0 0 1
Head injury 0 0 1 0 0 1
Dog attack 0 1 0 0 0 1
Drug dosage error 0 1 0 0 0 1
Surgical complication / error 0 0 0 0 1 1
Aviation incident, multiple injuries 0 0 0 0 1 1
Farm-related injury 0 0 0 1 1 2
Mixed drug toxicity 0 0 0 0 3 3
Total 1 3 2 1 8 15
7.11 ACQUIRED DISEASE DEATHS
There were 61 (2010) and 51 (2011) post-neonatal infant, child and adolescent deaths due to acquired diseases. There were also 35 undetermined causes of death in 2010–2011. The acquired disease category includes deaths attributed to infection, malignancy and other diseases (see Tables 7.20a and b, 7.21a and b and 7.22a and b).
In reports prior to 2002, where a cause was not identified or classified as unascertained/undetermined, the death was included in the category of ‘other acquired’. Since 2002, these deaths are categorised as undetermined causes of death (Figures 7.15a and 7.15b). Figure 7.15a shows trends in acquired conditions and undetermined causes since 1997 in children aged 28 days to 14 years. Figure 7.15b includes adolescents aged 15–17 years for the years 2005–2011.
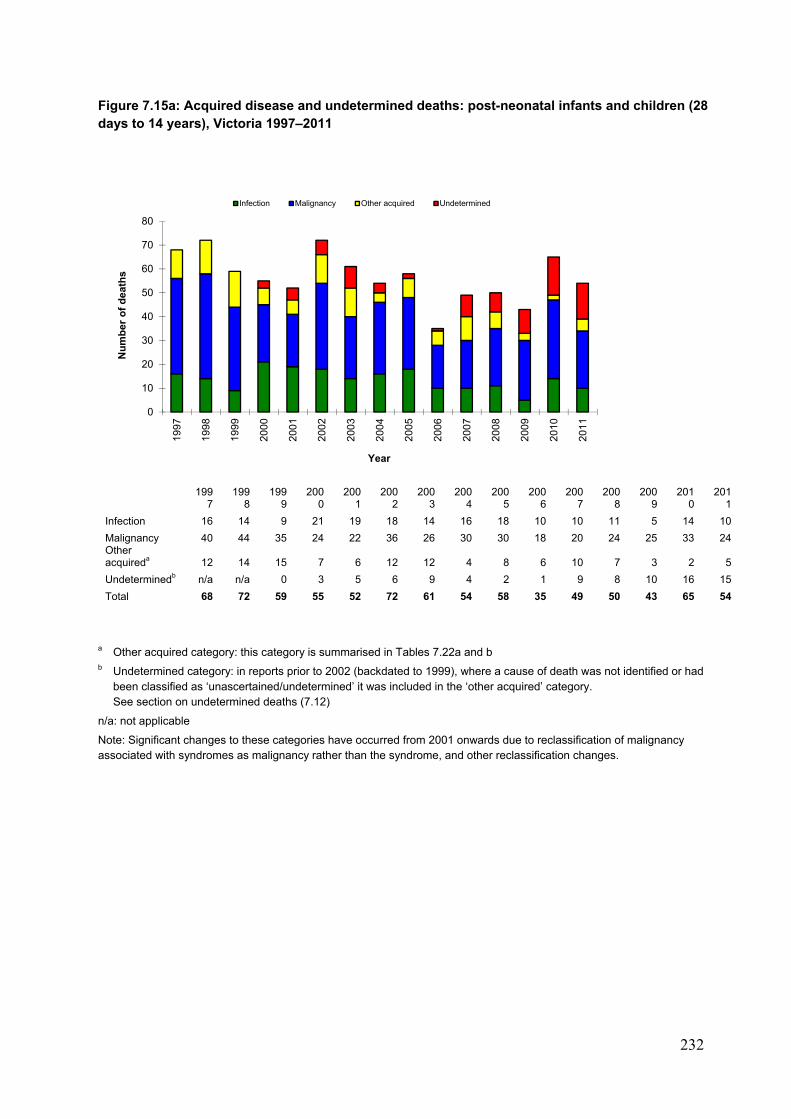
232
Figure 7.15a: Acquired disease and undetermined deaths: post-neonatal infants and children (28 days to 14 years), Victoria 1997–2011
199
7 199
8 199
9 200
0 200
1 200
2 200
3 200
4 200
5 200
6 200
7 200
8 200
9 201
0 201
1
Infection 16 14 9 21 19 18 14 16 18 10 10 11 5 14 10
Malignancy 40 44 35 24 22 36 26 30 30 18 20 24 25 33 24 Other acquireda 12 14 15 7 6 12 12 4 8 6 10 7 3 2 5
Undeterminedb n/a n/a 0 3 5 6 9 4 2 1 9 8 10 16 15
Total 68 72 59 55 52 72 61 54 58 35 49 50 43 65 54
a Other acquired category: this category is summarised in Tables 7.22a and b b Undetermined category: in reports prior to 2002 (backdated to 1999), where a cause of death was not identified or had
been classified as ‘unascertained/undetermined’ it was included in the ‘other acquired’ category. See section on undetermined deaths (7.12)
n/a: not applicable
Note: Significant changes to these categories have occurred from 2001 onwards due to reclassification of malignancy associated with syndromes as malignancy rather than the syndrome, and other reclassification changes.
0
10
20
30
40
50
60
70
80
1997
1998
1999
2000
2001
2002
2003
2004
2005
2006
2007
2008
2009
2010
2011
Nu
mb
er o
f d
eath
s
Year
Infection Malignancy Other acquired Undetermined
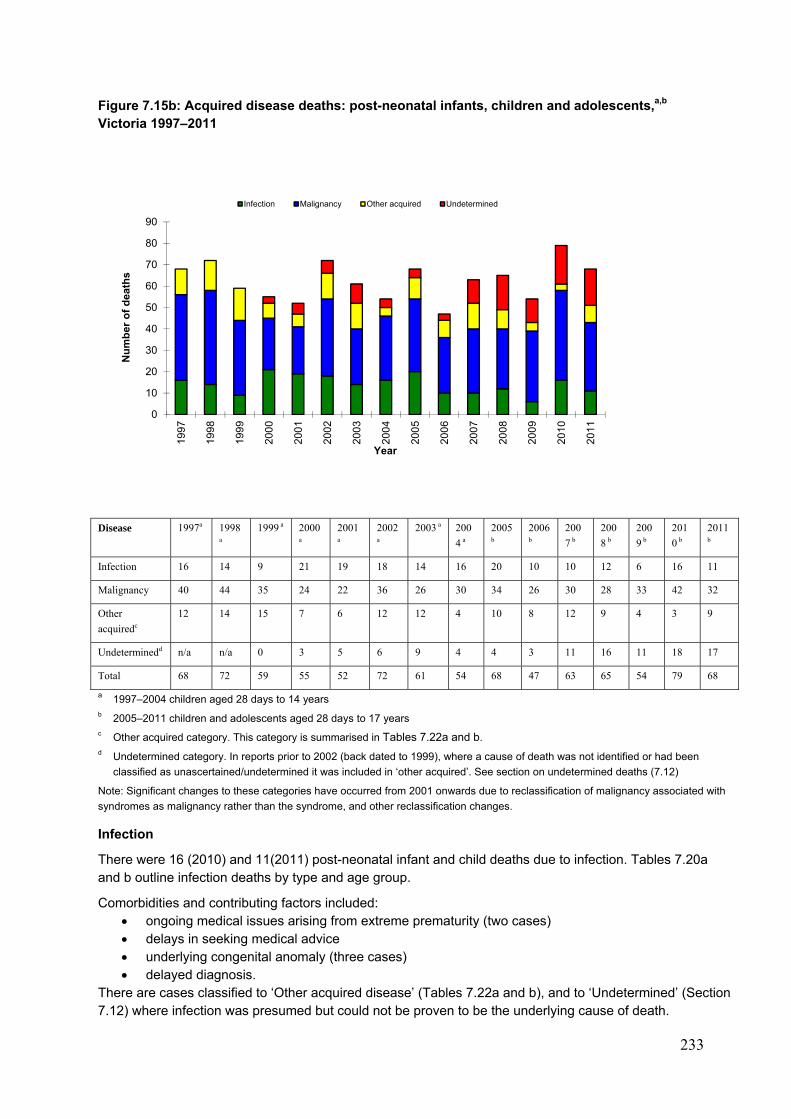
233
Figure 7.15b: Acquired disease deaths: post-neonatal infants, children and adolescents,a,b Victoria 1997–2011
Disease 1997a 1998
a
1999 a 2000
a
2001
a
2002
a
2003 a 200
4 a
2005
b
2006
b
200
7 b
200
8 b
200
9 b
201
0 b
2011
b
Infection 16 14 9 21 19 18 14 16 20 10 10 12 6 16 11
Malignancy 40 44 35 24 22 36 26 30 34 26 30 28 33 42 32
Other
acquiredc
12 14 15 7 6 12 12 4 10 8 12 9 4 3 9
Undeterminedd n/a n/a 0 3 5 6 9 4 4 3 11 16 11 18 17
Total 68 72 59 55 52 72 61 54 68 47 63 65 54 79 68
a 1997–2004 children aged 28 days to 14 years b 2005–2011 children and adolescents aged 28 days to 17 years c Other acquired category. This category is summarised in Tables 7.22a and b. d Undetermined category. In reports prior to 2002 (back dated to 1999), where a cause of death was not identified or had been
classified as unascertained/undetermined it was included in ‘other acquired’. See section on undetermined deaths (7.12)
Note: Significant changes to these categories have occurred from 2001 onwards due to reclassification of malignancy associated with
syndromes as malignancy rather than the syndrome, and other reclassification changes.
Infection
There were 16 (2010) and 11(2011) post-neonatal infant and child deaths due to infection. Tables 7.20a and b outline infection deaths by type and age group.
Comorbidities and contributing factors included: ongoing medical issues arising from extreme prematurity (two cases) delays in seeking medical advice underlying congenital anomaly (three cases) delayed diagnosis.
There are cases classified to ‘Other acquired disease’ (Tables 7.22a and b), and to ‘Undetermined’ (Section 7.12) where infection was presumed but could not be proven to be the underlying cause of death.
0
10
20
30
40
50
60
70
80
90
199
7
199
8
199
9
200
0
200
1
200
2
200
3
200
4
200
5
200
6
200
7
200
8
200
9
201
0
201
1
Nu
mb
er o
f d
eath
s
Year
Infection Malignancy Other acquired Undetermined
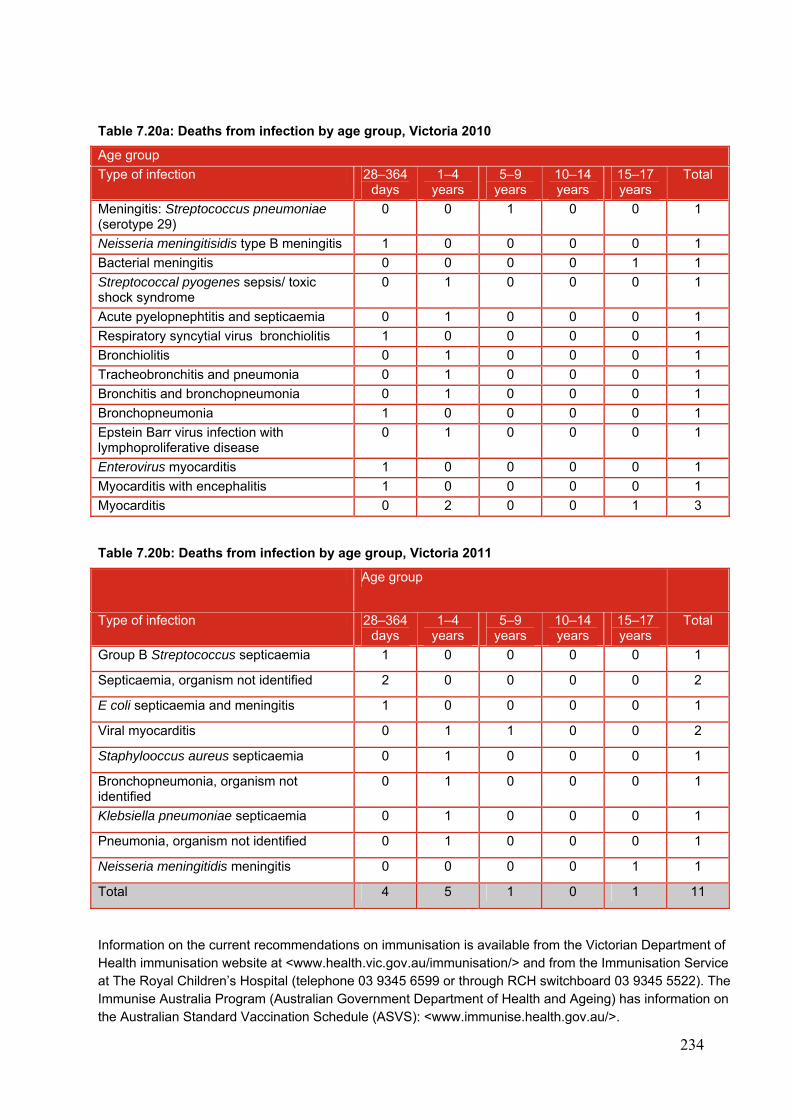
234
Table 7.20a: Deaths from infection by age group, Victoria 2010
Age group
Type of infection 28–364 days
1–4 years
5–9 years
10–14 years
15–17 years
Total
Meningitis: Streptococcus pneumoniae (serotype 29)
0 0 1 0 0 1
Neisseria meningitisidis type B meningitis 1 0 0 0 0 1
Bacterial meningitis 0 0 0 0 1 1
Streptococcal pyogenes sepsis/ toxic shock syndrome
0 1 0 0 0 1
Acute pyelopnephtitis and septicaemia 0 1 0 0 0 1
Respiratory syncytial virus bronchiolitis 1 0 0 0 0 1
Bronchiolitis 0 1 0 0 0 1
Tracheobronchitis and pneumonia 0 1 0 0 0 1
Bronchitis and bronchopneumonia 0 1 0 0 0 1
Bronchopneumonia 1 0 0 0 0 1
Epstein Barr virus infection with lymphoproliferative disease
0 1 0 0 0 1
Enterovirus myocarditis 1 0 0 0 0 1
Myocarditis with encephalitis 1 0 0 0 0 1
Myocarditis 0 2 0 0 1 3
Table 7.20b: Deaths from infection by age group, Victoria 2011
Age group
Type of infection 28–364 days
1–4 years
5–9 years
10–14 years
15–17 years
Total
Group B Streptococcus septicaemia 1 0 0 0 0 1
Septicaemia, organism not identified 2 0 0 0 0 2
E coli septicaemia and meningitis 1 0 0 0 0 1
Viral myocarditis 0 1 1 0 0 2
Staphylooccus aureus septicaemia 0 1 0 0 0 1
Bronchopneumonia, organism not identified
0 1 0 0 0 1
Klebsiella pneumoniae septicaemia 0 1 0 0 0 1
Pneumonia, organism not identified 0 1 0 0 0 1
Neisseria meningitidis meningitis 0 0 0 0 1 1
Total 4 5 1 0 1 11
Information on the current recommendations on immunisation is available from the Victorian Department of Health immunisation website at <www.health.vic.gov.au/immunisation/> and from the Immunisation Service at The Royal Children’s Hospital (telephone 03 9345 6599 or through RCH switchboard 03 9345 5522). The Immunise Australia Program (Australian Government Department of Health and Ageing) has information on the Australian Standard Vaccination Schedule (ASVS): <www.immunise.health.gov.au/>.
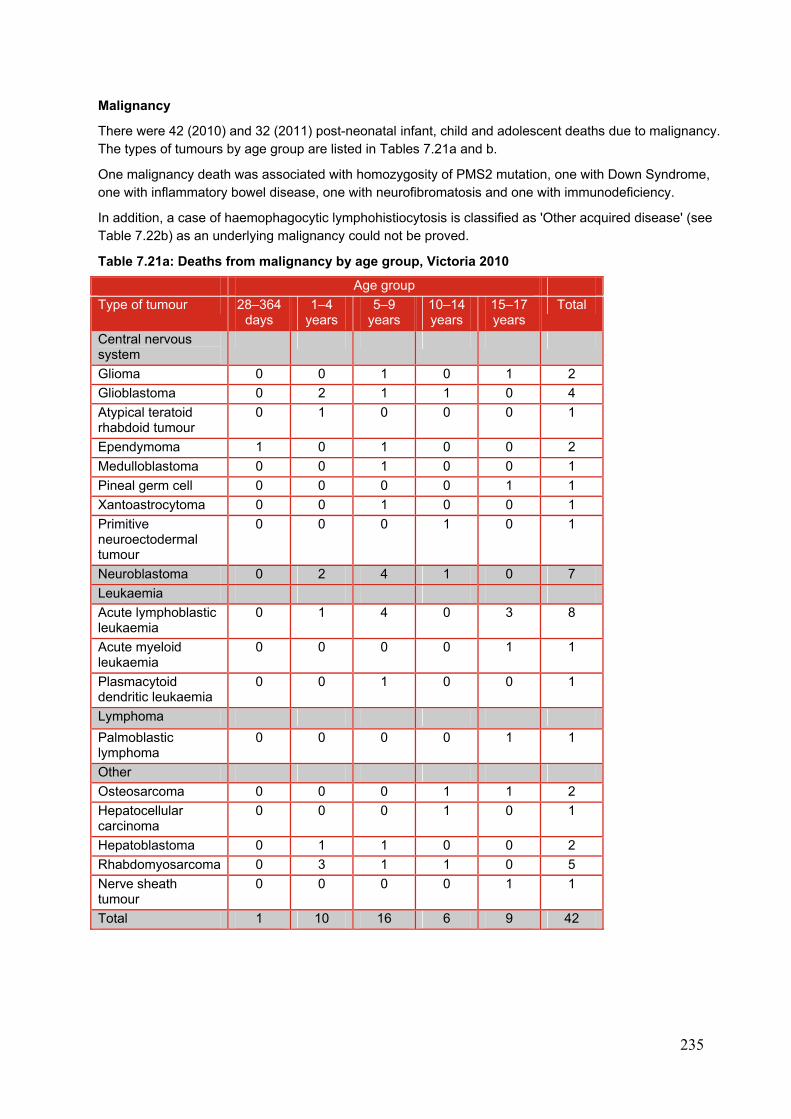
235
Malignancy
There were 42 (2010) and 32 (2011) post-neonatal infant, child and adolescent deaths due to malignancy. The types of tumours by age group are listed in Tables 7.21a and b.
One malignancy death was associated with homozygosity of PMS2 mutation, one with Down Syndrome, one with inflammatory bowel disease, one with neurofibromatosis and one with immunodeficiency.
In addition, a case of haemophagocytic lymphohistiocytosis is classified as 'Other acquired disease' (see Table 7.22b) as an underlying malignancy could not be proved.
Table 7.21a: Deaths from malignancy by age group, Victoria 2010
Age group
Type of tumour 28–364 days
1–4 years
5–9 years
10–14 years
15–17 years
Total
Central nervous system
Glioma 0 0 1 0 1 2
Glioblastoma 0 2 1 1 0 4
Atypical teratoid rhabdoid tumour
0 1 0 0 0 1
Ependymoma 1 0 1 0 0 2
Medulloblastoma 0 0 1 0 0 1
Pineal germ cell 0 0 0 0 1 1
Xantoastrocytoma 0 0 1 0 0 1
Primitive neuroectodermal tumour
0 0 0 1 0 1
Neuroblastoma 0 2 4 1 0 7
Leukaemia
Acute lymphoblastic leukaemia
0 1 4 0 3 8
Acute myeloid leukaemia
0 0 0 0 1 1
Plasmacytoid dendritic leukaemia
0 0 1 0 0 1
Lymphoma
Palmoblastic lymphoma
0 0 0 0 1 1
Other
Osteosarcoma 0 0 0 1 1 2
Hepatocellular carcinoma
0 0 0 1 0 1
Hepatoblastoma 0 1 1 0 0 2
Rhabdomyosarcoma 0 3 1 1 0 5
Nerve sheath tumour
0 0 0 0 1 1
Total 1 10 16 6 9 42
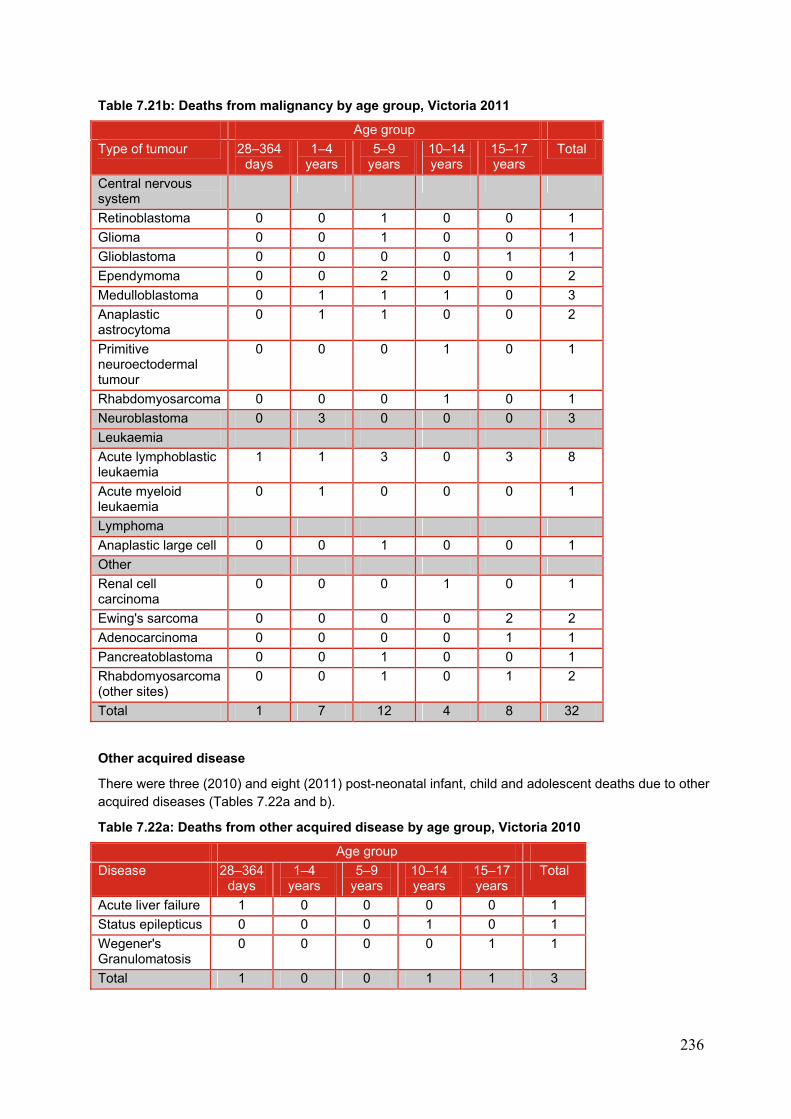
236
Table 7.21b: Deaths from malignancy by age group, Victoria 2011
Age group
Type of tumour 28–364 days
1–4 years
5–9 years
10–14 years
15–17 years
Total
Central nervous system
Retinoblastoma 0 0 1 0 0 1
Glioma 0 0 1 0 0 1
Glioblastoma 0 0 0 0 1 1
Ependymoma 0 0 2 0 0 2
Medulloblastoma 0 1 1 1 0 3
Anaplastic astrocytoma
0 1 1 0 0 2
Primitive neuroectodermal tumour
0 0 0 1 0 1
Rhabdomyosarcoma 0 0 0 1 0 1
Neuroblastoma 0 3 0 0 0 3
Leukaemia
Acute lymphoblastic leukaemia
1 1 3 0 3 8
Acute myeloid leukaemia
0 1 0 0 0 1
Lymphoma
Anaplastic large cell 0 0 1 0 0 1
Other
Renal cell carcinoma
0 0 0 1 0 1
Ewing's sarcoma 0 0 0 0 2 2
Adenocarcinoma 0 0 0 0 1 1
Pancreatoblastoma 0 0 1 0 0 1
Rhabdomyosarcoma (other sites)
0 0 1 0 1 2
Total 1 7 12 4 8 32
Other acquired disease
There were three (2010) and eight (2011) post-neonatal infant, child and adolescent deaths due to other acquired diseases (Tables 7.22a and b).
Table 7.22a: Deaths from other acquired disease by age group, Victoria 2010
Age group
Disease 28–364 days
1–4 years
5–9 years
10–14 years
15–17 years
Total
Acute liver failure 1 0 0 0 0 1
Status epilepticus 0 0 0 1 0 1
Wegener's Granulomatosis
0 0 0 0 1 1
Total 1 0 0 1 1 3

237
Table 7.22b: Deaths from other acquired disease by age group, Victoria 2011
Age group
28-364 days
1-4 years
5-9 years
10-14 years
15-17 years
Total
Bowel obstruction secondary to constipation
0 0 0 1 0 1
Multi-organ failure 0 0 0 1 0 1
Obstructive sleep apnoea
0 1 0 0 0 1
Pulmonary embolism
0 0 0 0 1 1
Cardiomyopathy 0 1 0 0 0 1
Haemophagocytic lymphohistiocytosis
0 0 0 0 1 1
Asthma 0 0 0 1 1 2
Total 0 2 0 3 3 8
7.12 UNDETERMINED DEATHS
There were 18 (2010) and 17 (2011) deaths in post-neonatal infants, children and adolescents from undetermined causes (Table 7.23a and b). Thirty-three of the 35 children had a full postmortem examination, where a pathological cause of death could not be determined. One child had a partial postmortem examination and one child had only an external examination.
There were a number of factors that contributed to the classification of undetermined cause of death in these children and adolescents. These include Individual factors, including a history of:
congenital anomaly (but not enough to be the cause of death) prematurity severe birth asphyxia mild intercurrent illness (but not enough for infection to be considered the cause of death) seizures, epilepsy or febrile convulsions cerebral palsy with quadriplegia recurrent urinary tract infection very recent high caffeine intake recent admission for non-accidental injury.
Non-accidental injury was not able to be ruled out in some cases.
In one case the event occurred in water, but drowning could not be proven.
In two infant cases, the deaths occurred when the infant fell asleep at the breast when the parent was feeding.
In some cases the circumstances of death were similar to those of SUDI, with the child dying during sleep, however the child was beyond the age of 12 months. A diagnosis of Sudden Unexpected Death In Childhood has been postulated.
Parental and other circumstances such as:
parental injecting drug use, methadone program participation or use of other non-prescription or prescription drugs known to impair judgement
current or past history of delays in seeking medical help for the deceased or siblings of the
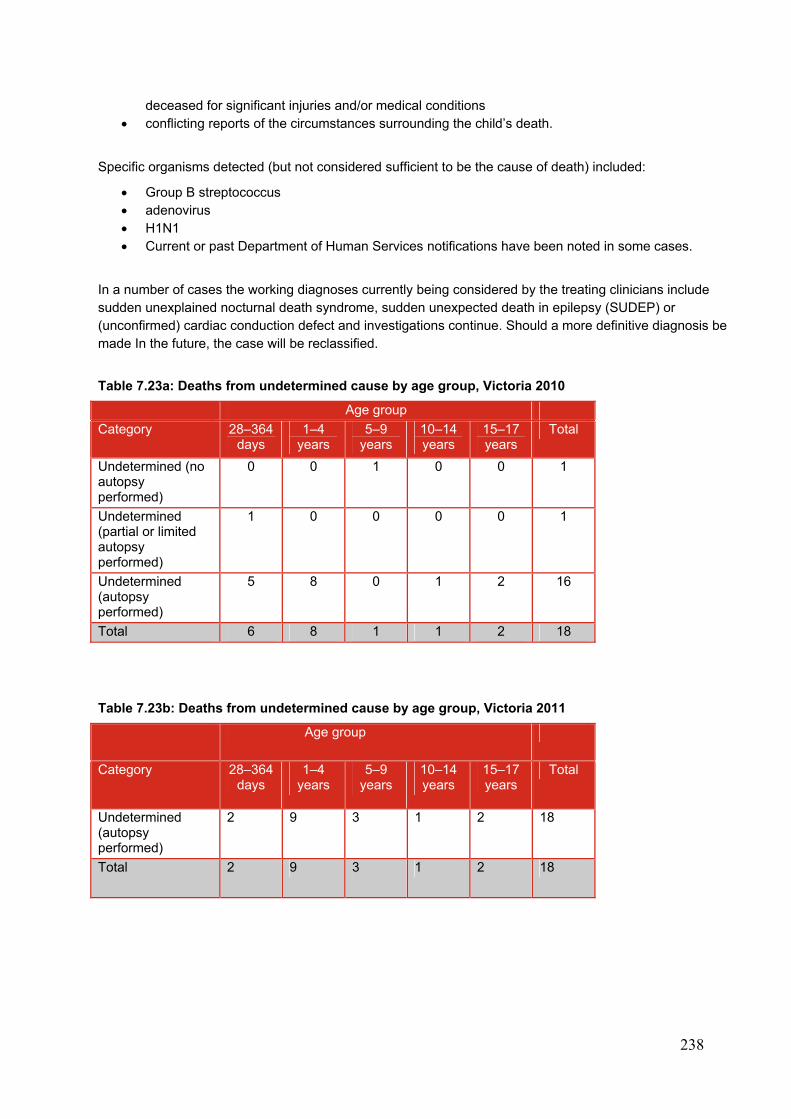
238
deceased for significant injuries and/or medical conditions conflicting reports of the circumstances surrounding the child’s death.
Specific organisms detected (but not considered sufficient to be the cause of death) included:
Group B streptococcus adenovirus H1N1 Current or past Department of Human Services notifications have been noted in some cases.
In a number of cases the working diagnoses currently being considered by the treating clinicians include sudden unexplained nocturnal death syndrome, sudden unexpected death in epilepsy (SUDEP) or (unconfirmed) cardiac conduction defect and investigations continue. Should a more definitive diagnosis be made In the future, the case will be reclassified.
Table 7.23a: Deaths from undetermined cause by age group, Victoria 2010
Age group
Category 28–364 days
1–4 years
5–9 years
10–14 years
15–17 years
Total
Undetermined (no autopsy performed)
0 0 1 0 0 1
Undetermined (partial or limited autopsy performed)
1 0 0 0 0 1
Undetermined (autopsy performed)
5 8 0 1 2 16
Total 6 8 1 1 2 18
Table 7.23b: Deaths from undetermined cause by age group, Victoria 2011
Age group
Category 28–364 days
1–4 years
5–9 years
10–14 years
15–17 years
Total
Undetermined (autopsy performed)
2 9 3 1 2 18
Total 2 9 3 1 2 18
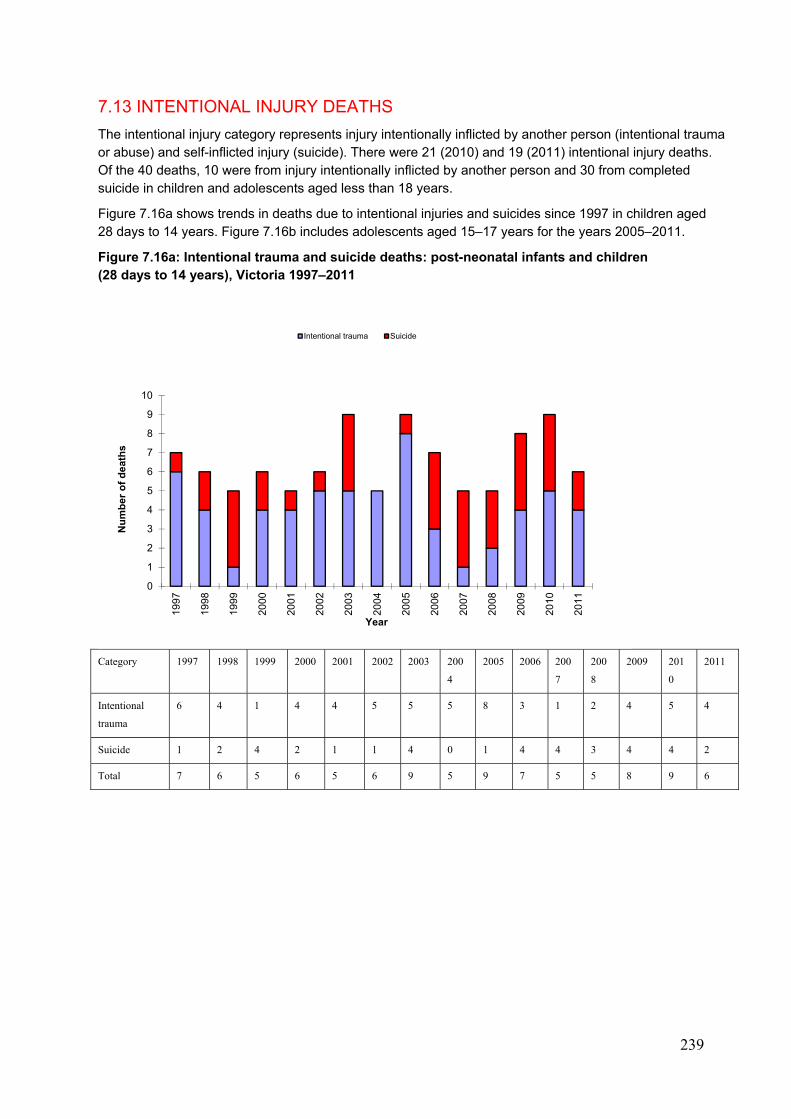
239
7.13 INTENTIONAL INJURY DEATHS
The intentional injury category represents injury intentionally inflicted by another person (intentional trauma or abuse) and self-inflicted injury (suicide). There were 21 (2010) and 19 (2011) intentional injury deaths. Of the 40 deaths, 10 were from injury intentionally inflicted by another person and 30 from completed suicide in children and adolescents aged less than 18 years.
Figure 7.16a shows trends in deaths due to intentional injuries and suicides since 1997 in children aged 28 days to 14 years. Figure 7.16b includes adolescents aged 15–17 years for the years 2005–2011.
Figure 7.16a: Intentional trauma and suicide deaths: post-neonatal infants and children (28 days to 14 years), Victoria 1997–2011
Category 1997 1998 1999 2000 2001 2002 2003 200
4
2005 2006 200
7
200
8
2009 201
0
2011
Intentional
trauma
6 4 1 4 4 5 5 5 8 3 1 2 4 5 4
Suicide 1 2 4 2 1 1 4 0 1 4 4 3 4 4 2
Total 7 6 5 6 5 6 9 5 9 7 5 5 8 9 6
0
1
2
3
4
5
6
7
8
9
10
1997
1998
1999
2000
2001
2002
2003
2004
2005
2006
2007
2008
2009
2010
2011
Nu
mb
er o
f d
eath
s
Year
Intentional trauma Suicide
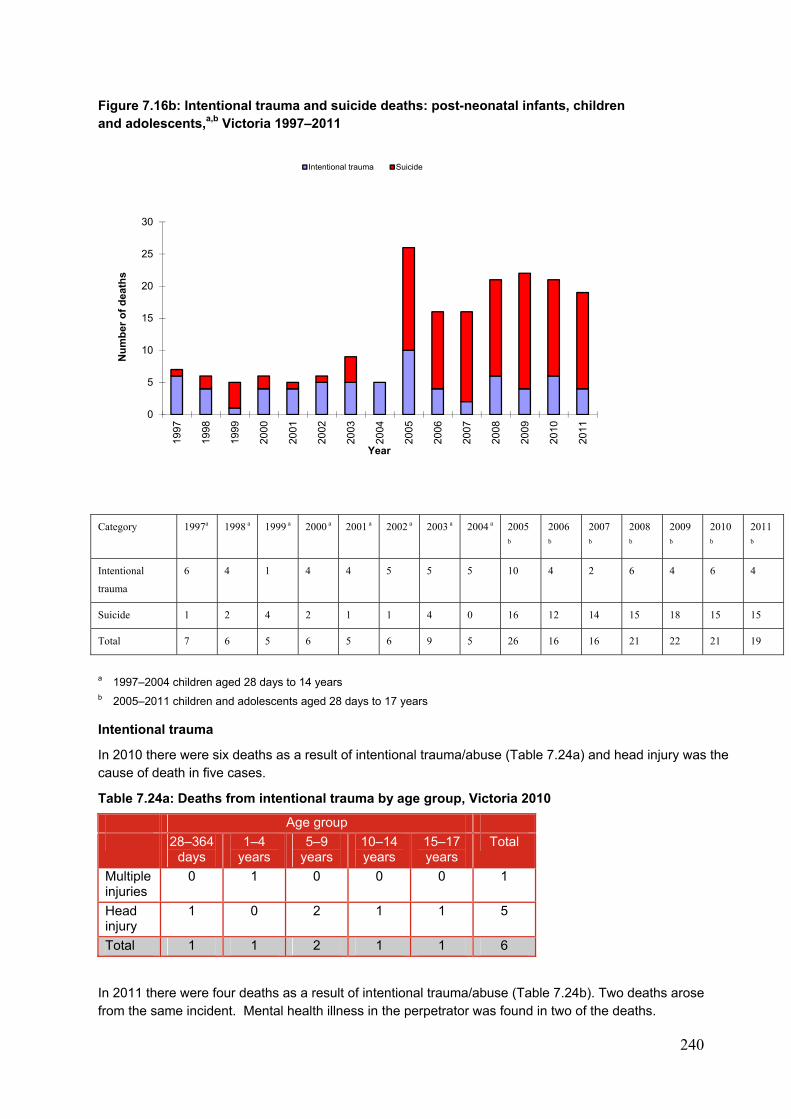
240
Figure 7.16b: Intentional trauma and suicide deaths: post-neonatal infants, children and adolescents,a,b Victoria 1997–2011
Category 1997a 1998 a 1999 a 2000 a 2001 a 2002 a 2003 a 2004 a 2005
b
2006
b
2007
b
2008
b
2009
b
2010
b
2011
b
Intentional
trauma
6 4 1 4 4 5 5 5 10 4 2 6 4 6 4
Suicide 1 2 4 2 1 1 4 0 16 12 14 15 18 15 15
Total 7 6 5 6 5 6 9 5 26 16 16 21 22 21 19
a 1997–2004 children aged 28 days to 14 years b 2005–2011 children and adolescents aged 28 days to 17 years
Intentional trauma
In 2010 there were six deaths as a result of intentional trauma/abuse (Table 7.24a) and head injury was the cause of death in five cases.
Table 7.24a: Deaths from intentional trauma by age group, Victoria 2010
Age group
28–364 days
1–4 years
5–9 years
10–14 years
15–17 years
Total
Multiple injuries
0 1 0 0 0 1
Head injury
1 0 2 1 1 5
Total 1 1 2 1 1 6
In 2011 there were four deaths as a result of intentional trauma/abuse (Table 7.24b). Two deaths arose from the same incident. Mental health illness in the perpetrator was found in two of the deaths.
0
5
10
15
20
25
30
1997
1998
1999
2000
2001
2002
2003
2004
2005
2006
2007
2008
2009
2010
2011
Nu
mb
er o
f d
eath
s
Year
Intentional trauma Suicide
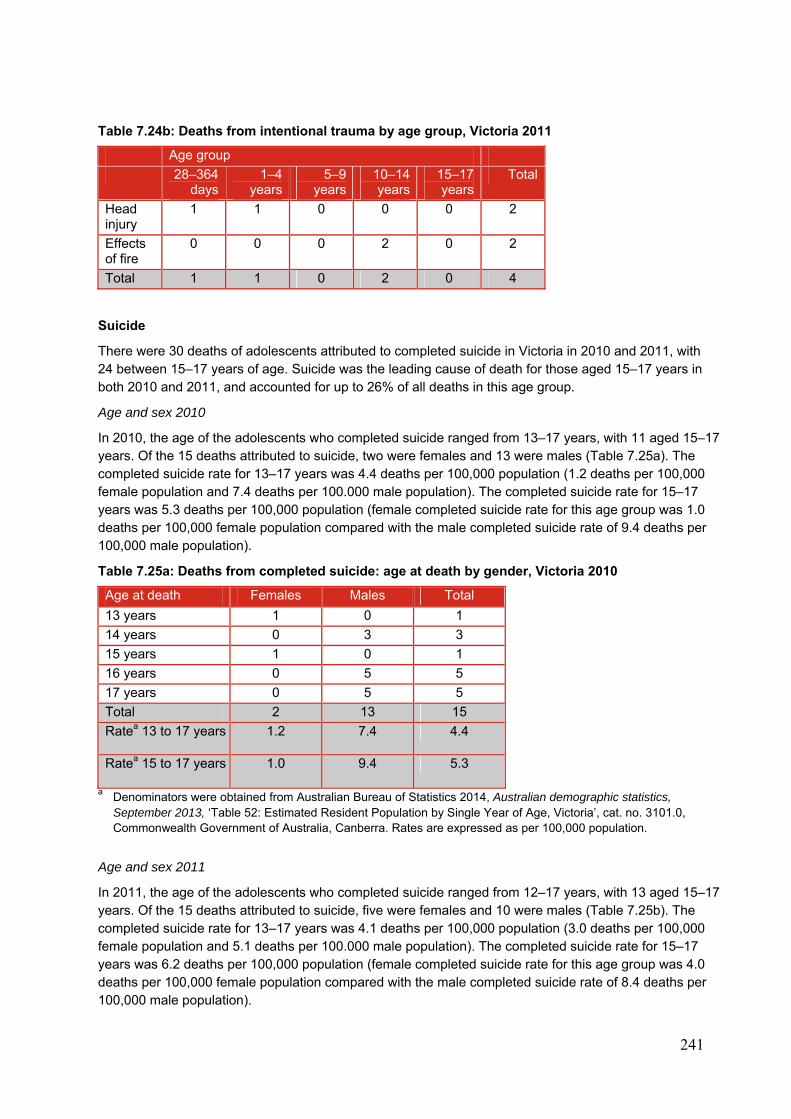
241
Table 7.24b: Deaths from intentional trauma by age group, Victoria 2011
Age group
28–364 days
1–4 years
5–9 years
10–14 years
15–17 years
Total
Head injury
1 1 0 0 0 2
Effects of fire
0 0 0 2 0 2
Total 1 1 0 2 0 4
Suicide
There were 30 deaths of adolescents attributed to completed suicide in Victoria in 2010 and 2011, with 24 between 15–17 years of age. Suicide was the leading cause of death for those aged 15–17 years in both 2010 and 2011, and accounted for up to 26% of all deaths in this age group.
Age and sex 2010
In 2010, the age of the adolescents who completed suicide ranged from 13–17 years, with 11 aged 15–17 years. Of the 15 deaths attributed to suicide, two were females and 13 were males (Table 7.25a). The completed suicide rate for 13–17 years was 4.4 deaths per 100,000 population (1.2 deaths per 100,000 female population and 7.4 deaths per 100.000 male population). The completed suicide rate for 15–17 years was 5.3 deaths per 100,000 population (female completed suicide rate for this age group was 1.0 deaths per 100,000 female population compared with the male completed suicide rate of 9.4 deaths per 100,000 male population).
Table 7.25a: Deaths from completed suicide: age at death by gender, Victoria 2010
Age at death Females Males Total
13 years 1 0 1
14 years 0 3 3
15 years 1 0 1
16 years 0 5 5
17 years 0 5 5
Total 2 13 15
Ratea 13 to 17 years 1.2 7.4 4.4
Ratea 15 to 17 years 1.0 9.4 5.3
a Denominators were obtained from Australian Bureau of Statistics 2014, Australian demographic statistics, September 2013, ‘Table 52: Estimated Resident Population by Single Year of Age, Victoria’, cat. no. 3101.0, Commonwealth Government of Australia, Canberra. Rates are expressed as per 100,000 population.
Age and sex 2011
In 2011, the age of the adolescents who completed suicide ranged from 12–17 years, with 13 aged 15–17 years. Of the 15 deaths attributed to suicide, five were females and 10 were males (Table 7.25b). The completed suicide rate for 13–17 years was 4.1 deaths per 100,000 population (3.0 deaths per 100,000 female population and 5.1 deaths per 100.000 male population). The completed suicide rate for 15–17 years was 6.2 deaths per 100,000 population (female completed suicide rate for this age group was 4.0 deaths per 100,000 female population compared with the male completed suicide rate of 8.4 deaths per 100,000 male population).
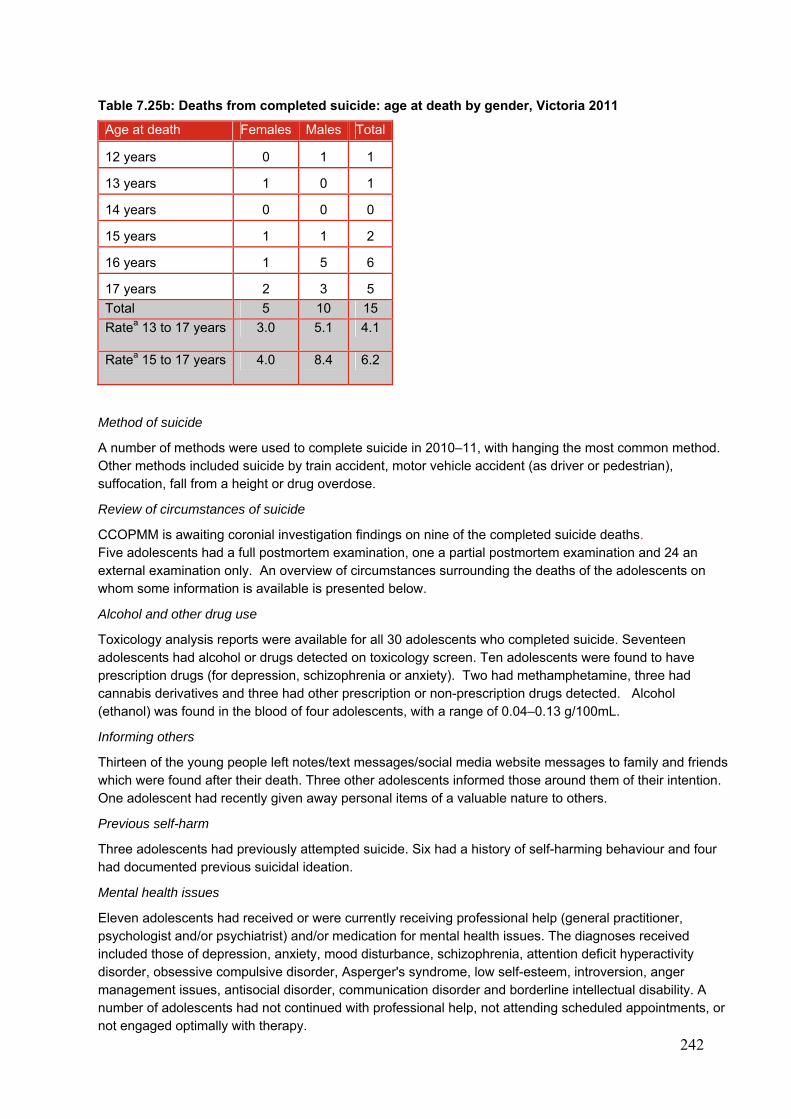
242
Table 7.25b: Deaths from completed suicide: age at death by gender, Victoria 2011
Age at death Females Males Total
12 years 0 1 1
13 years 1 0 1
14 years 0 0 0
15 years 1 1 2
16 years 1 5 6
17 years 2 3 5
Total 5 10 15
Ratea 13 to 17 years 3.0 5.1 4.1
Ratea 15 to 17 years 4.0 8.4 6.2
Method of suicide
A number of methods were used to complete suicide in 2010–11, with hanging the most common method. Other methods included suicide by train accident, motor vehicle accident (as driver or pedestrian), suffocation, fall from a height or drug overdose.
Review of circumstances of suicide
CCOPMM is awaiting coronial investigation findings on nine of the completed suicide deaths. Five adolescents had a full postmortem examination, one a partial postmortem examination and 24 an external examination only. An overview of circumstances surrounding the deaths of the adolescents on whom some information is available is presented below.
Alcohol and other drug use
Toxicology analysis reports were available for all 30 adolescents who completed suicide. Seventeen adolescents had alcohol or drugs detected on toxicology screen. Ten adolescents were found to have prescription drugs (for depression, schizophrenia or anxiety). Two had methamphetamine, three had cannabis derivatives and three had other prescription or non-prescription drugs detected. Alcohol (ethanol) was found in the blood of four adolescents, with a range of 0.04–0.13 g/100mL.
Informing others
Thirteen of the young people left notes/text messages/social media website messages to family and friends which were found after their death. Three other adolescents informed those around them of their intention. One adolescent had recently given away personal items of a valuable nature to others.
Previous self-harm
Three adolescents had previously attempted suicide. Six had a history of self-harming behaviour and four had documented previous suicidal ideation.
Mental health issues
Eleven adolescents had received or were currently receiving professional help (general practitioner, psychologist and/or psychiatrist) and/or medication for mental health issues. The diagnoses received included those of depression, anxiety, mood disturbance, schizophrenia, attention deficit hyperactivity disorder, obsessive compulsive disorder, Asperger's syndrome, low self-esteem, introversion, anger management issues, antisocial disorder, communication disorder and borderline intellectual disability. A number of adolescents had not continued with professional help, not attending scheduled appointments, or not engaged optimally with therapy.

243
Adverse life events and comorbidities
The adverse life events, risk-taking behaviours and comorbidities experienced by this group of adolescents who completed suicide included:
• recent relationship breakdowns
• suicide or death of friend/s, siblings
• parental separation
• physical violence towards deceased
• conflict with parents/siblings
• bullying
• school difficulties/fear of VCE failure
• school non-attendance
• low self-esteem
• concerns about sexuality
• risk-taking behaviours
– use of alcohol (including binge drinking) and drugs
– intentional self-harm
• medical comorbidities included:
– acne on an isotretinoin medication.
The presence of these comorbidities and adverse life events resulted in involvement with Child and Adolescent Mental Health Services or professionals in some cases.
Depression or suicidal thoughts
Although suicide in people younger than 15 years is less common, it should be noted that a number of deaths occur in ambiguous circumstances and may therefore be classified as accidental when they were, in fact, suicide. These suicide figures should therefore be viewed as a conservative estimate. In children, the diagnosis of depression should not be overlooked and threats of suicide should not be ignored. Suspected depression should be taken seriously, with children subjected to bullying being particularly vulnerable. Threats of suicide usually indicate the need for referral for specialist mental health assessment.
Depression and threats of suicide both need to be taken seriously.
244
8. IMMUNISATION AND VACCINE-PREVENTABLE DISEASES
The following sections relating to the immunisation program in Victoria have been prepared by staff at the Department of Health.
Immunisation program in Victoria, 2010, 2011, 2012
The National Immunisation Program (NIP) schedule for children and adolescents provides protection against 14 vaccine-preventable diseases. The NIP commences at birth with the administration of the birth dose of hepatitis B vaccine. The vaccine schedule is continued at two (from six weeks of age), four, six, 12 and 18 months of age with booster vaccine doses given at 4 years of age. Vaccines given to adolescents include hepatitis B vaccine, human papillomavirus and varicella vaccine, administered in the first year of secondary school for those who have not been previously immunised. A booster dose of diphtheria, tetanus and pertussis-containing vaccine is administered in the fourth year of secondary school.
The schedule protects against the following diseases/infections:
Hepatitis B Diphtheria Tetanus Pertussis Poliomyelitis Haemophilus influenzae type b Pneumococcal Rotavirus Measles Mumps Rubella Meningococcal C Varicella Human papillomavirus
The Australian Childhood Immunisation Register (ACIR) reports immunisation coverage at local, regional, state and national levels each year for children under seven years of age. Annualised immunisation coverage in Victoria in 2010, 2011 and 2012 has been greater than 90% for all three measured cohorts: 12 months, 92.35% (2012), two years, 93.38% (2012) and five years, 92.35% (2012). The comparable annualised coverage for Australia in 2012 is 91.69% at 12 months, 92.59% at two years and 90.82% at five years of age. The ACIR does not report on the vaccine coverage rate for pneumococcal, rotavirus, meningococcal C and varicella vaccine doses.
Of note in 2010, the five-year-old cohort achieved coverage greater than 90% for the first time. The main influence for this rise was the change to the ACIR’s due and overdue rules. The rules assess children as being due at four years of age and overdue for immunisation at four years and one month. Consequently, four-year-old children overdue by one month were identified by various models of notification. These models included immunisation history statements accessed by parents, overdue ACIR reports generated for immunisation providers and by letters to parents from the Family Assistance Office regarding entitlement to the maternity immunisation allowance. The earlier overdue notifications gave both parents and providers the opportunity to immunise the children in a timely manner and report the data to ACIR before they turned five years of age when the calculation is made.
Information on the current recommendations on immunisation is available from the Department of Health immunisation website at <www.health.vic.gov.au/immunisation/> or on the Immunise Australia Program website at <www.immunise.health.gov.au/>.
245
APPENDICES
APPENDIX 1: SUDDEN INFANT DEATH69
General definition of SIDS
SIDS is defined as the sudden unexpected death of an infant < 1 year of age, with onset of the fatal episode apparently occurring during sleep, that remains unexplained after a thorough investigation, including performance of a complete autopsy and review of the circumstances of the death and the clinical history.
Category IA SIDS
Category IA includes deaths that meet the requirements of the general definition and also all of the following requirements.
Clinical
• > 21 days and < 9 months of age
• normal clinical history including term pregnancy (gestational age ≥ 37weeks)
• normal growth and development
• no similar deaths among siblings, close genetic relatives (uncles, aunts or first degree cousins) or other infants in the custody of the same caregiver.
Circumstances of death
• investigation of the various scenes where incidents leading to death might have occurred and determination that they do not provide an explanation for the death
• found in a safe sleeping environment, with no evidence of accidental death.
Autopsy
• absence of potentially fatal pathologic findings. Minor respiratory system inflammatory infiltrates are acceptable; intrathoracic petechial haemorrhage is a supportive but not obligatory or diagnostic finding
• no evidence of unexplained trauma, abuse, neglect or unintentional injury
• no evidence of substantial thymic stress effect (thymic weight of < 15 g and/or moderate/severe cortical lymphocyte depletion). Occasional ‘starry sky’ macrophages or minor cortical depletion is acceptable
• negative results of toxicologic, microbiologic, radiologic, vitreous chemistry and metabolic screening studies.
Category IB SIDS
Category IB includes infant deaths that meet the requirements of the general definition and also meet all of the criteria for category IA except that investigation of the various scenes where incidents leading to death might have occurred was not performed or ≥ 1 of the following analyses were not performed: toxicologic, microbiologic, radiologic, vitreous chemistry or metabolic screening studies.
Category II SIDS
Category II includes infants that meet category I except for ≥ 1 of the following.
Clinical
• age range outside that of category IA or IB (that is 0–21 days or 270 days [9 months] through to first birthday)
• similar deaths among siblings, close relatives or infants in the custody of the same caregiver that are not recognised suspect for infanticide or recognised genetic disorders
• neonatal or perinatal conditions (for example those resulting from preterm birth) that have resolved by the time of death.
246
Circumstances of death
• mechanical asphyxia or suffocation caused by overlaying not determined with certainty.
Autopsy
• abnormal growth or development not thought to have contributed to death
• marked inflammatory changes or anomalies not sufficient to be unequivocal causes of death.
Unclassified sudden infant death
Includes deaths that do not meet the criteria for category I or II SIDS, but for which alternative diagnoses of natural or unnatural conditions are equivocal, including cases where autopsies were not performed.
Post-resuscitation cases
Infants found in extremis who are resuscitated and later die (‘temporarily interrupted SIDS’) may be included in the aforementioned categories, depending on the fulfilment of relevant criteria.
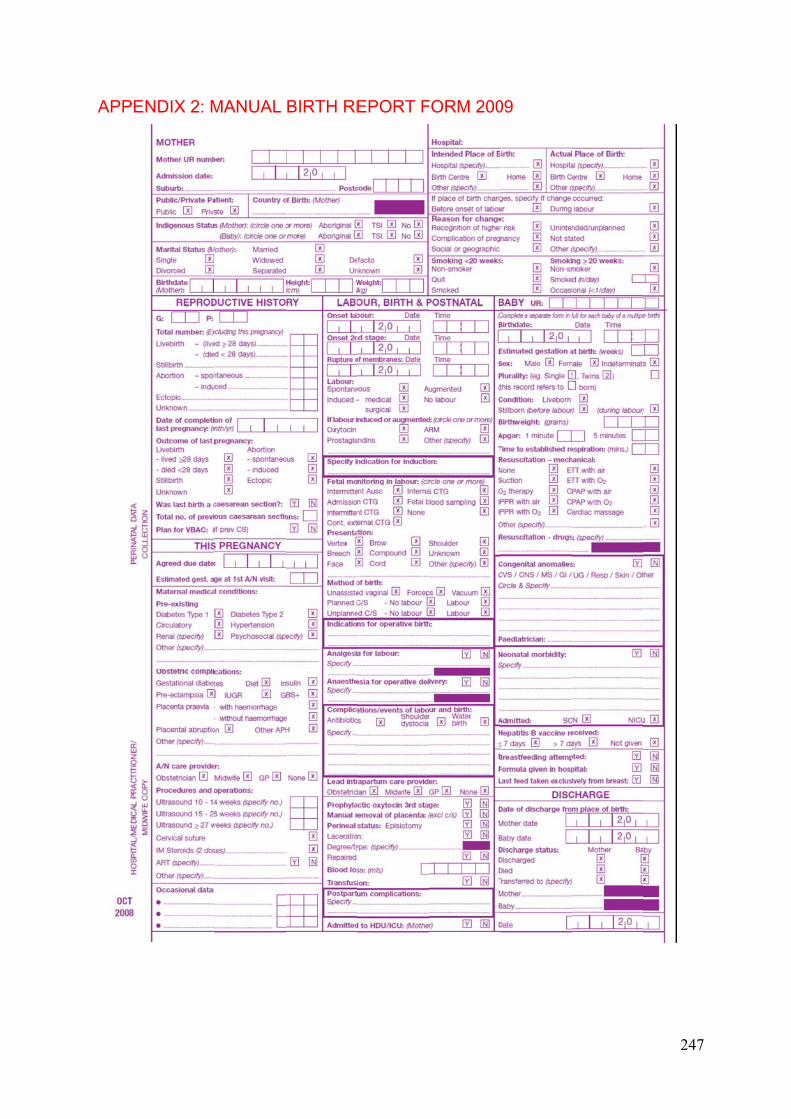
APPE
ENDIX 2: M
MANUAL BIRTH RE
EPORT FFORM 20009
247

248
APPENDIX 3: FEEDBACK FORM
The CCOPMM is committed to ensuring that the annual report is a useful tool for obstetricians, paediatricians, midwives and researchers in monitoring the care and outcomes for mothers and their babies along with infants, children and adolescents. To this end we would welcome your feedback. Please complete the following form and return it to:
Victorian Consultative Council on Obstetric and Paediatric Mortality and Morbidity GPO Box 4923 MELBPOURNE VIC 3001
1. Please circle your discipline:
Obstetrics Paediatrics General practice Neonatologist Midwifery or nursing Non-clinical Other
other, please specify
2. Why do you read or refer to this report?
Research Planning Lectures/presentations Clinical updates Other
other, please specify
3. Which area of the report do you refer to?
Births in Victoria
Maternal deaths
Perinatal deaths
Child and adolescent deaths
Methodology
Executive summary
Other specific area
other, please specify
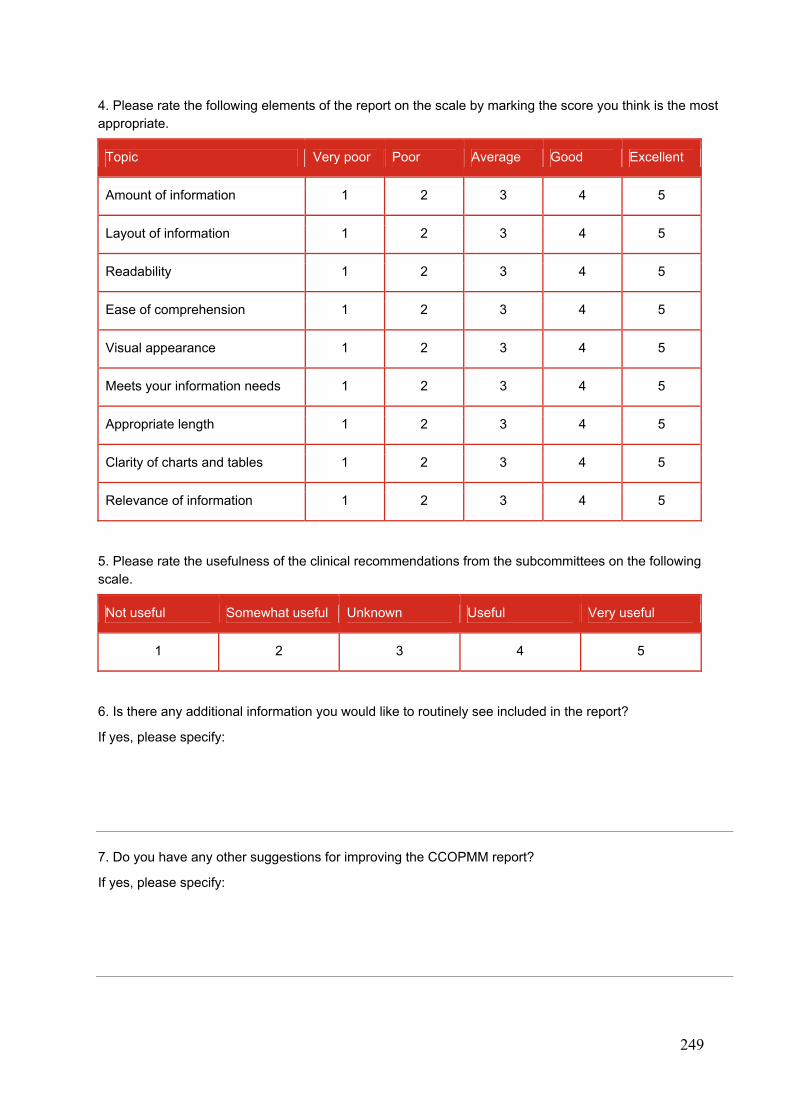
249
4. Please rate the following elements of the report on the scale by marking the score you think is the most appropriate.
Topic Very poor Poor Average Good Excellent
Amount of information 1 2 3 4 5
Layout of information 1 2 3 4 5
Readability 1 2 3 4 5
Ease of comprehension 1 2 3 4 5
Visual appearance 1 2 3 4 5
Meets your information needs 1 2 3 4 5
Appropriate length 1 2 3 4 5
Clarity of charts and tables 1 2 3 4 5
Relevance of information 1 2 3 4 5
5. Please rate the usefulness of the clinical recommendations from the subcommittees on the following scale.
Not useful Somewhat useful Unknown Useful Very useful
1 2 3 4 5
6. Is there any additional information you would like to routinely see included in the report?
If yes, please specify:
7. Do you have any other suggestions for improving the CCOPMM report?
If yes, please specify:
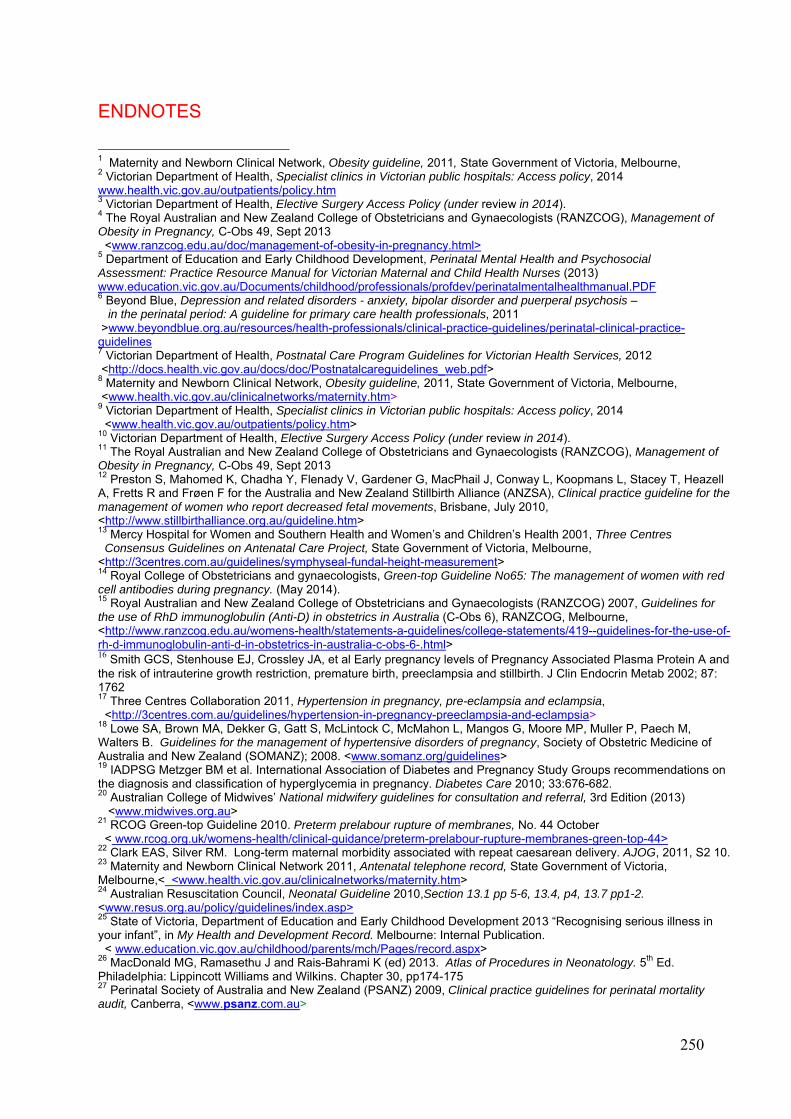
250
ENDNOTES
1 Maternity and Newborn Clinical Network, Obesity guideline, 2011, State Government of Victoria, Melbourne, 2 Victorian Department of Health, Specialist clinics in Victorian public hospitals: Access policy, 2014 www.health.vic.gov.au/outpatients/policy.htm 3 Victorian Department of Health, Elective Surgery Access Policy (under review in 2014). 4 The Royal Australian and New Zealand College of Obstetricians and Gynaecologists (RANZCOG), Management of Obesity in Pregnancy, C-Obs 49, Sept 2013 <www.ranzcog.edu.au/doc/management-of-obesity-in-pregnancy.html> 5 Department of Education and Early Childhood Development, Perinatal Mental Health and Psychosocial Assessment: Practice Resource Manual for Victorian Maternal and Child Health Nurses (2013) www.education.vic.gov.au/Documents/childhood/professionals/profdev/perinatalmentalhealthmanual.PDF 6 Beyond Blue, Depression and related disorders - anxiety, bipolar disorder and puerperal psychosis – in the perinatal period: A guideline for primary care health professionals, 2011 >www.beyondblue.org.au/resources/health-professionals/clinical-practice-guidelines/perinatal-clinical-practice-guidelines 7 Victorian Department of Health, Postnatal Care Program Guidelines for Victorian Health Services, 2012 <http://docs.health.vic.gov.au/docs/doc/Postnatalcareguidelines_web.pdf> 8 Maternity and Newborn Clinical Network, Obesity guideline, 2011, State Government of Victoria, Melbourne, <www.health.vic.gov.au/clinicalnetworks/maternity.htm> 9 Victorian Department of Health, Specialist clinics in Victorian public hospitals: Access policy, 2014 <www.health.vic.gov.au/outpatients/policy.htm> 10 Victorian Department of Health, Elective Surgery Access Policy (under review in 2014). 11 The Royal Australian and New Zealand College of Obstetricians and Gynaecologists (RANZCOG), Management of Obesity in Pregnancy, C-Obs 49, Sept 2013 12 Preston S, Mahomed K, Chadha Y, Flenady V, Gardener G, MacPhail J, Conway L, Koopmans L, Stacey T, Heazell A, Fretts R and Frøen F for the Australia and New Zealand Stillbirth Alliance (ANZSA), Clinical practice guideline for the management of women who report decreased fetal movements, Brisbane, July 2010, <http://www.stillbirthalliance.org.au/guideline.htm> 13 Mercy Hospital for Women and Southern Health and Women’s and Children’s Health 2001, Three Centres Consensus Guidelines on Antenatal Care Project, State Government of Victoria, Melbourne, <http://3centres.com.au/guidelines/symphyseal-fundal-height-measurement> 14 Royal College of Obstetricians and gynaecologists, Green-top Guideline No65: The management of women with red cell antibodies during pregnancy. (May 2014). 15 Royal Australian and New Zealand College of Obstetricians and Gynaecologists (RANZCOG) 2007, Guidelines for the use of RhD immunoglobulin (Anti-D) in obstetrics in Australia (C-Obs 6), RANZCOG, Melbourne, <http://www.ranzcog.edu.au/womens-health/statements-a-guidelines/college-statements/419--guidelines-for-the-use-of-rh-d-immunoglobulin-anti-d-in-obstetrics-in-australia-c-obs-6-.html> 16 Smith GCS, Stenhouse EJ, Crossley JA, et al Early pregnancy levels of Pregnancy Associated Plasma Protein A and the risk of intrauterine growth restriction, premature birth, preeclampsia and stillbirth. J Clin Endocrin Metab 2002; 87: 1762 17 Three Centres Collaboration 2011, Hypertension in pregnancy, pre-eclampsia and eclampsia, <http://3centres.com.au/guidelines/hypertension-in-pregnancy-preeclampsia-and-eclampsia> 18 Lowe SA, Brown MA, Dekker G, Gatt S, McLintock C, McMahon L, Mangos G, Moore MP, Muller P, Paech M, Walters B. Guidelines for the management of hypertensive disorders of pregnancy, Society of Obstetric Medicine of Australia and New Zealand (SOMANZ); 2008. <www.somanz.org/guidelines> 19 IADPSG Metzger BM et al. International Association of Diabetes and Pregnancy Study Groups recommendations on the diagnosis and classification of hyperglycemia in pregnancy. Diabetes Care 2010; 33:676-682. 20 Australian College of Midwives’ National midwifery guidelines for consultation and referral, 3rd Edition (2013) <www.midwives.org.au> 21 RCOG Green-top Guideline 2010. Preterm prelabour rupture of membranes, No. 44 October < www.rcog.org.uk/womens-health/clinical-guidance/preterm-prelabour-rupture-membranes-green-top-44> 22 Clark EAS, Silver RM. Long-term maternal morbidity associated with repeat caesarean delivery. AJOG, 2011, S2 10. 23 Maternity and Newborn Clinical Network 2011, Antenatal telephone record, State Government of Victoria, Melbourne,< <www.health.vic.gov.au/clinicalnetworks/maternity.htm> 24 Australian Resuscitation Council, Neonatal Guideline 2010,Section 13.1 pp 5-6, 13.4, p4, 13.7 pp1-2. <www.resus.org.au/policy/guidelines/index.asp> 25 State of Victoria, Department of Education and Early Childhood Development 2013 “Recognising serious illness in your infant”, in My Health and Development Record. Melbourne: Internal Publication. < www.education.vic.gov.au/childhood/parents/mch/Pages/record.aspx> 26 MacDonald MG, Ramasethu J and Rais-Bahrami K (ed) 2013. Atlas of Procedures in Neonatology. 5th Ed. Philadelphia: Lippincott Williams and Wilkins. Chapter 30, pp174-175 27 Perinatal Society of Australia and New Zealand (PSANZ) 2009, Clinical practice guidelines for perinatal mortality audit, Canberra, <www.psanz.com.au>
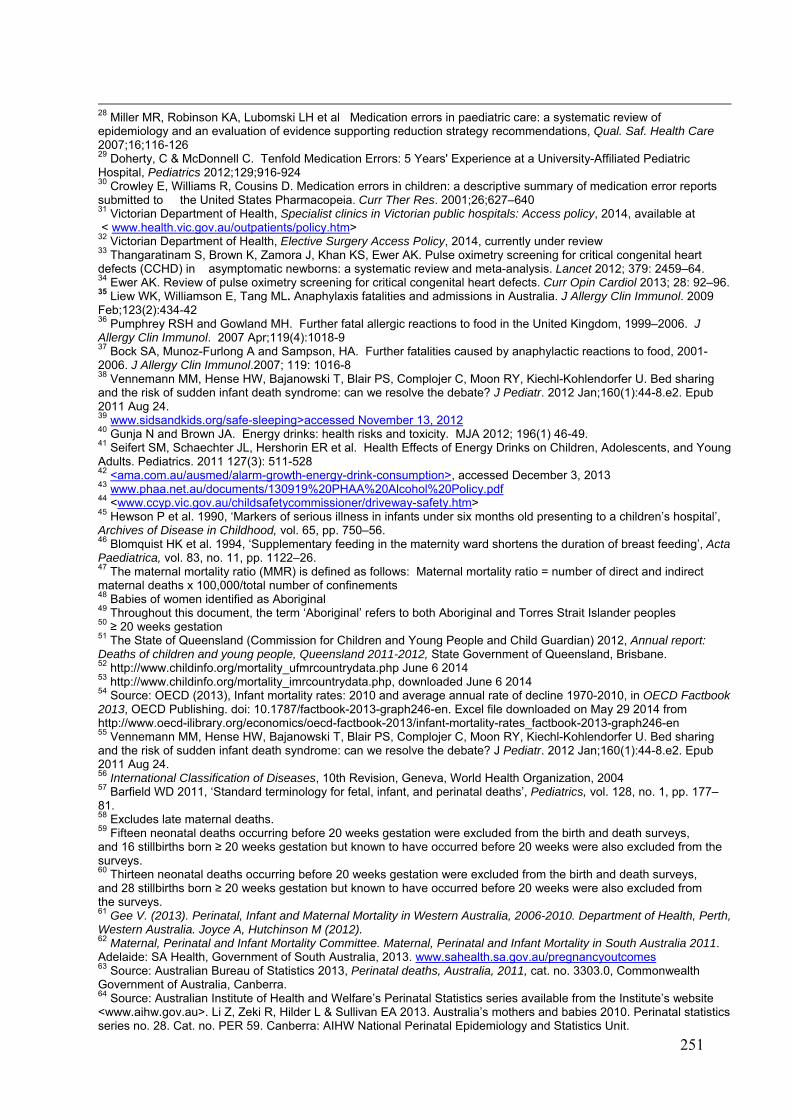
251
28 Miller MR, Robinson KA, Lubomski LH et al Medication errors in paediatric care: a systematic review of epidemiology and an evaluation of evidence supporting reduction strategy recommendations, Qual. Saf. Health Care 2007;16;116-126 29 Doherty, C & McDonnell C. Tenfold Medication Errors: 5 Years' Experience at a University-Affiliated Pediatric Hospital, Pediatrics 2012;129;916-924 30 Crowley E, Williams R, Cousins D. Medication errors in children: a descriptive summary of medication error reports submitted to the United States Pharmacopeia. Curr Ther Res. 2001;26;627–640 31 Victorian Department of Health, Specialist clinics in Victorian public hospitals: Access policy, 2014, available at < www.health.vic.gov.au/outpatients/policy.htm> 32 Victorian Department of Health, Elective Surgery Access Policy, 2014, currently under review 33 Thangaratinam S, Brown K, Zamora J, Khan KS, Ewer AK. Pulse oximetry screening for critical congenital heart defects (CCHD) in asymptomatic newborns: a systematic review and meta-analysis. Lancet 2012; 379: 2459–64. 34 Ewer AK. Review of pulse oximetry screening for critical congenital heart defects. Curr Opin Cardiol 2013; 28: 92–96. 35 Liew WK, Williamson E, Tang ML. Anaphylaxis fatalities and admissions in Australia. J Allergy Clin Immunol. 2009 Feb;123(2):434-42 36 Pumphrey RSH and Gowland MH. Further fatal allergic reactions to food in the United Kingdom, 1999–2006. J Allergy Clin Immunol. 2007 Apr;119(4):1018-9 37 Bock SA, Munoz-Furlong A and Sampson, HA. Further fatalities caused by anaphylactic reactions to food, 2001-2006. J Allergy Clin Immunol.2007; 119: 1016-8 38 Vennemann MM, Hense HW, Bajanowski T, Blair PS, Complojer C, Moon RY, Kiechl-Kohlendorfer U. Bed sharing and the risk of sudden infant death syndrome: can we resolve the debate? J Pediatr. 2012 Jan;160(1):44-8.e2. Epub 2011 Aug 24. 39 www.sidsandkids.org/safe-sleeping>accessed November 13, 2012 40 Gunja N and Brown JA. Energy drinks: health risks and toxicity. MJA 2012; 196(1) 46-49. 41 Seifert SM, Schaechter JL, Hershorin ER et al. Health Effects of Energy Drinks on Children, Adolescents, and Young Adults. Pediatrics. 2011 127(3): 511-528 42 <ama.com.au/ausmed/alarm-growth-energy-drink-consumption>, accessed December 3, 2013 43 www.phaa.net.au/documents/130919%20PHAA%20Alcohol%20Policy.pdf 44 <www.ccyp.vic.gov.au/childsafetycommissioner/driveway-safety.htm> 45 Hewson P et al. 1990, ‘Markers of serious illness in infants under six months old presenting to a children’s hospital’, Archives of Disease in Childhood, vol. 65, pp. 750–56. 46 Blomquist HK et al. 1994, ‘Supplementary feeding in the maternity ward shortens the duration of breast feeding’, Acta Paediatrica, vol. 83, no. 11, pp. 1122–26. 47 The maternal mortality ratio (MMR) is defined as follows: Maternal mortality ratio = number of direct and indirect maternal deaths x 100,000/total number of confinements 48 Babies of women identified as Aboriginal 49 Throughout this document, the term ‘Aboriginal’ refers to both Aboriginal and Torres Strait Islander peoples 50 ≥ 20 weeks gestation 51 The State of Queensland (Commission for Children and Young People and Child Guardian) 2012, Annual report: Deaths of children and young people, Queensland 2011-2012, State Government of Queensland, Brisbane. 52 http://www.childinfo.org/mortality_ufmrcountrydata.php June 6 2014 53 http://www.childinfo.org/mortality_imrcountrydata.php, downloaded June 6 2014 54 Source: OECD (2013), Infant mortality rates: 2010 and average annual rate of decline 1970-2010, in OECD Factbook 2013, OECD Publishing. doi: 10.1787/factbook-2013-graph246-en. Excel file downloaded on May 29 2014 from http://www.oecd-ilibrary.org/economics/oecd-factbook-2013/infant-mortality-rates_factbook-2013-graph246-en 55 Vennemann MM, Hense HW, Bajanowski T, Blair PS, Complojer C, Moon RY, Kiechl-Kohlendorfer U. Bed sharing and the risk of sudden infant death syndrome: can we resolve the debate? J Pediatr. 2012 Jan;160(1):44-8.e2. Epub 2011 Aug 24. 56 International Classification of Diseases, 10th Revision, Geneva, World Health Organization, 2004 57 Barfield WD 2011, ‘Standard terminology for fetal, infant, and perinatal deaths’, Pediatrics, vol. 128, no. 1, pp. 177–81. 58 Excludes late maternal deaths. 59 Fifteen neonatal deaths occurring before 20 weeks gestation were excluded from the birth and death surveys, and 16 stillbirths born ≥ 20 weeks gestation but known to have occurred before 20 weeks were also excluded from the surveys. 60 Thirteen neonatal deaths occurring before 20 weeks gestation were excluded from the birth and death surveys, and 28 stillbirths born ≥ 20 weeks gestation but known to have occurred before 20 weeks were also excluded from the surveys. 61 Gee V. (2013). Perinatal, Infant and Maternal Mortality in Western Australia, 2006-2010. Department of Health, Perth, Western Australia. Joyce A, Hutchinson M (2012). 62 Maternal, Perinatal and Infant Mortality Committee. Maternal, Perinatal and Infant Mortality in South Australia 2011. Adelaide: SA Health, Government of South Australia, 2013. www.sahealth.sa.gov.au/pregnancyoutcomes 63 Source: Australian Bureau of Statistics 2013, Perinatal deaths, Australia, 2011, cat. no. 3303.0, Commonwealth Government of Australia, Canberra. 64 Source: Australian Institute of Health and Welfare’s Perinatal Statistics series available from the Institute’s website <www.aihw.gov.au>. Li Z, Zeki R, Hilder L & Sullivan EA 2013. Australia’s mothers and babies 2010. Perinatal statistics series no. 28. Cat. no. PER 59. Canberra: AIHW National Perinatal Epidemiology and Statistics Unit.

252
65 Source: Australian Institute of Health and Welfare’s Perinatal Statistics series available from the Institute’s website <www.aihw.gov.au>. Li Z, Zeki R, Hilder L & Sullivan EA 2013. Australia’s mothers and babies 2011. Perinatal statistics series no. 28. Cat. no. PER 59. Canberra: AIHW National Perinatal Epidemiology and Statistics Unit. 66 The GSPMR and further explanatory notes are reported in the 'Victorian maternity services performance indicators Complete set for 2010–11 and 2011–12' report available at http://www.health.vic.gov.au/maternitycare/publications.htm. 67 The State of Queensland (Commission for Children and Young People and Child Guardian) 2012, Annual report: Deaths of children and young people, Queensland 2011-2012, State Government of Queensland, Brisbane. 68 Krous et al. 2004, ‘Sudden infant death syndrome and unclassified sudden infant deaths: a definitional and diagnostic approach’, Pediatrics, vol. 114, no. 1, pp. 234–238. 69 Krous HF, Beckwith JB, Byard RW, Rognum TO, Bajanowski T, Corey T, Cutz E, Hanzlick R, Keens TG, Mitchell EA 2004, ‘Sudden infant death syndrome and unclassified sudden infant deaths: a definitional and diagnostic approach’, Pediatrics, vol. 114 no. 1, pp. 234–238.

2010/2011 Victoria’s Mothers and BabiesVictoria’s Maternal, Perinatal, Child and Adolescent Mortality
The Consultative Council on Obstetric and Paediatric Mortality and Morbidity (CCOPMM)
CC
OP
MM
2010/2011 VIC
TOR
IA’S M
OTH
ER
S A
ND
BA
BIE
S