Embed Size (px)
Citation preview

Victorian Budget 2014|15
David MartineSecretary, Department of Treasury and Finance
7 May 2014
Victorian Budget 2014|15
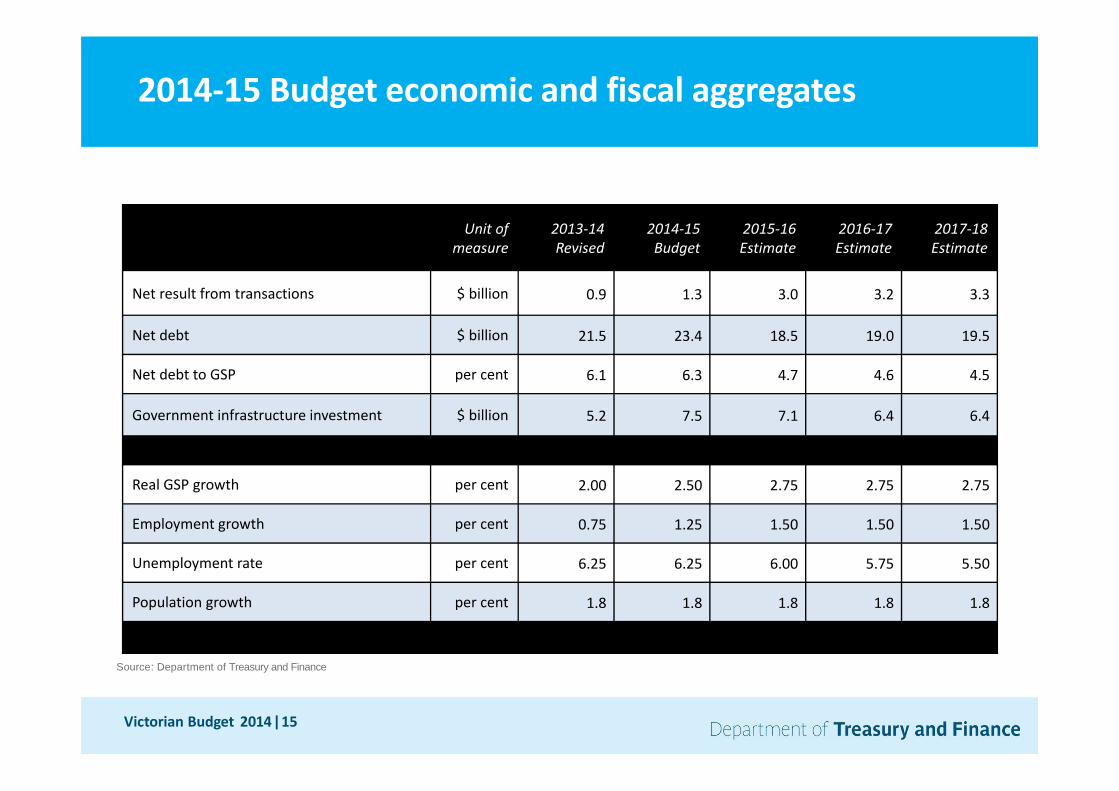
Unit of measure
2013‐14 Revised
2014‐15 Budget
2015‐16 Estimate
2016‐17 Estimate
2017‐18 Estimate
Net result from transactions $ billion 0.9 1.3 3.0 3.2 3.3
Net debt $ billion 21.5 23.4 18.5 19.0 19.5
Net debt to GSP per cent 6.1 6.3 4.7 4.6 4.5
Government infrastructure investment $ billion 5.2 7.5 7.1 6.4 6.4
Real GSP growth per cent 2.00 2.50 2.75 2.75 2.75
Employment growth per cent 0.75 1.25 1.50 1.50 1.50
Unemployment rate per cent 6.25 6.25 6.00 5.75 5.50
Population growth per cent 1.8 1.8 1.8 1.8 1.8
2014‐15 Budget economic and fiscal aggregates
Source: Department of Treasury and Finance

Victorian Budget 2014|15
‐2
‐1
0
1
2
3
4
GDP Consumption MiningInvestment
Non‐MiningInvestment
DwellingInvestment
Public Demand Exports Imports
percen
tage points
2012 2013
Contributions to national economic growth
Source: Australia Bureau of Statistics, Department of Treasury and Finance

Victorian Budget 2014|15
0
25
50
75
100
1998‐99 2000‐01 2002‐03 2004‐05 2006‐07 2008‐09 2010‐11 2012‐13 2014‐15
$ billion
Actual and expected business investment by sector*
Mining Non‐mining
National mining investment peaked in 2012‐13
Source: Australia Bureau of Statistics, Department of Treasury and Finance *Dotted lines indicate expected capital spending adjusted for average realisation ratios

Victorian Budget 2014|15
‐2
0
2
4
6
8
10
12
14
Dec‐1986 Dec‐1989 Dec‐1992 Dec‐1995 Dec‐1998 Dec‐2001 Dec‐2004 Dec‐2007 Dec‐2010 Dec‐2013
per cen
t
Household savings ratio 5 year average (savings)
Structural shift in household savings
Source: Australian Bureau of Statistics

Victorian Budget 2014|15
0
1
2
3
4
5
6
Tasmania New South Wales South Australia Victoria Queensland Western Australia
per cen
t
10‐year average GSP growth rates
Average of non‐mining states
Victoria has the strongest economy of the non‐mining states
Source: Australian Bureau of Statistics

Victorian Budget 2014|15
‐40
‐20
0
20
40
60
80
Private consumption Dwelling & OTC* Business investment Public demand Net trade Balancing item
per cen
t
Victoria Mining statesSource: Australia Bureau of Statistics, Department of Treasury and Finance
Components of the Victorian economy in 2012‐13
*OTC = Ownership transfer costs
Victorian Budget 2014|15
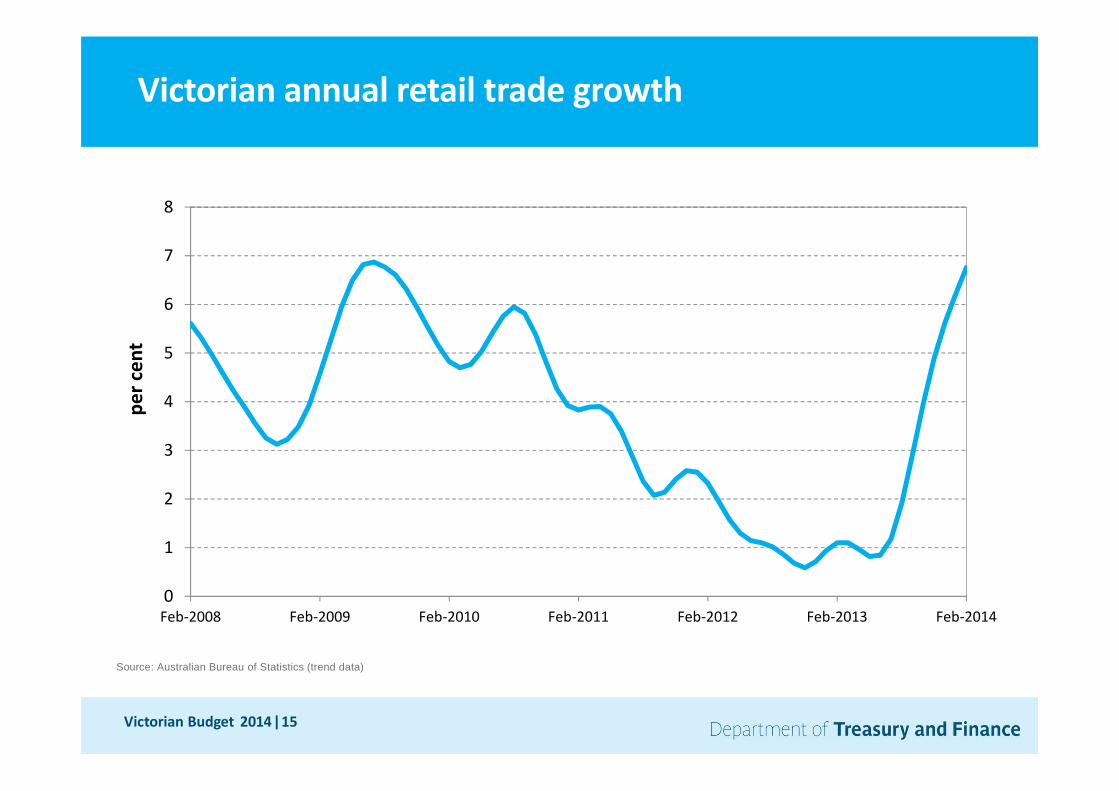
0
1
2
3
4
5
6
7
8
Feb‐2008 Feb‐2009 Feb‐2010 Feb‐2011 Feb‐2012 Feb‐2013 Feb‐2014
per cen
t
Victorian annual retail trade growth
Source: Australian Bureau of Statistics (trend data)

Victorian Budget 2014|15
0
1,000
2,000
3,000
4,000
5,000
6,000
Mar‐2008 Mar‐2009 Mar‐2010 Mar‐2011 Mar‐2012 Mar‐2013 Mar‐2014
numbe
r per m
onth
Dwelling approvals
Source: Australian Bureau of Statistics (trend data)
VIC
WA
Qld
NSW
ROA
Victorian Budget 2014|15
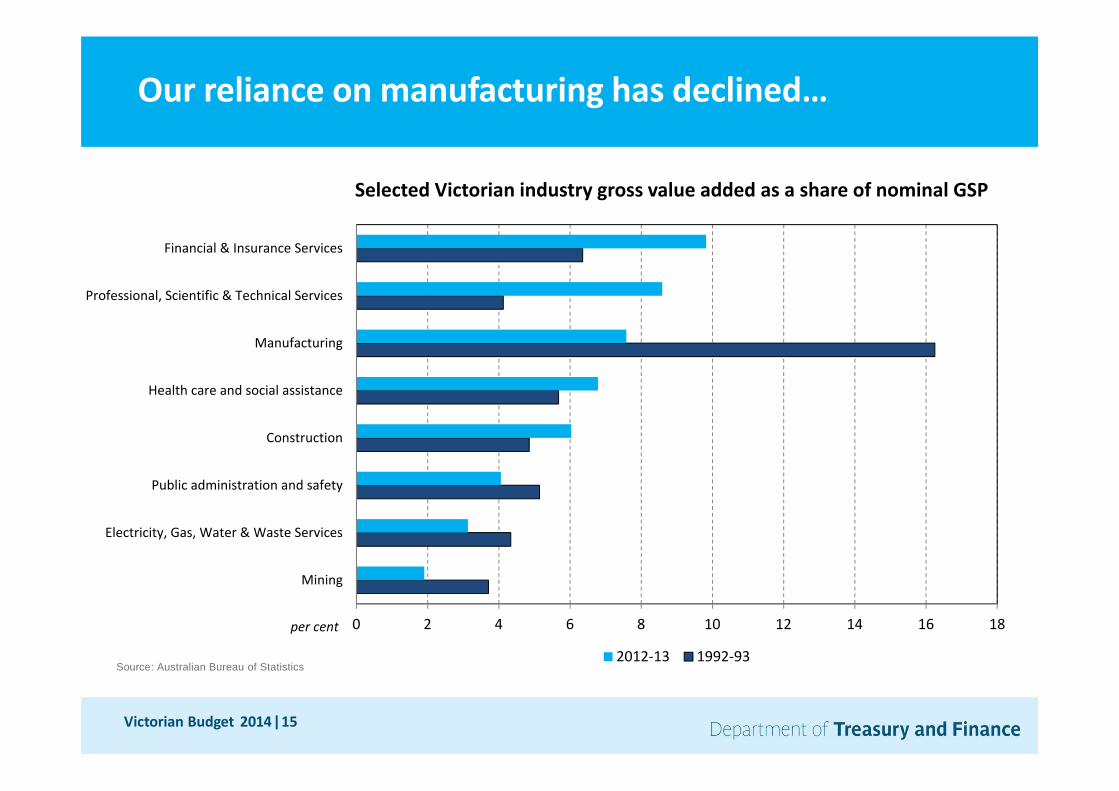
0 2 4 6 8 10 12 14 16 18
Mining
Electricity, Gas, Water & Waste Services
Public administration and safety
Construction
Health care and social assistance
Manufacturing
Professional, Scientific & Technical Services
Financial & Insurance Services
Selected Victorian industry gross value added as a share of nominal GSP
2012‐13 1992‐93
per cent
Our reliance on manufacturing has declined…
Source: Australian Bureau of Statistics

Victorian Budget 2014|15
‐7.5
‐5.0
‐2.5
0.0
2.5Agriculture, forestry and fishing
Mining
Manufacturing
Electricity, gas, water and wasteservices
Construction
Wholesale trade
Retail trade
Accommodation and food services
Transport, postal and warehousingInformation media andtelecommunications
Financial and insurance services
Rental, hiring and real estateservices
Professional, scientific andtechnical services
Administrative and supportservices
Public administration and safety
Education and training
Health care and social assistance
Arts and recreation services
Other services
Ownership of dwellings
Victorian deviationfrom national average
Deviation of Victorian industry gross value added share from national share (percentage points)
…and our industrial structure is diverse
Source: Australian Bureau of Statistics

Victorian Budget 2014|15
29.2
29.2
17.7
12.0
9.9
9.8
9.3
8.4
0 5 10 15 20 25 30
ACT(Public administration and safety)
WA(Mining)
NT(Construction)
NSW(Financial and insurance services)
TAS(Health care and social assistance)
Victoria(Financial and insurance services)
QLD(Construction)
SA(Health care and social assistance)
Largest industry ‐ gross value added as a share of nominal GSP
We are less vulnerable to external shocks
Source: Australian Bureau of Statistics
per cent

Victorian Budget 2014|15
80
100
120
140
160
180
200
1990‐91 1992‐93 1994‐95 1996‐97 1998‐99 2000‐01 2002‐03 2004‐05 2006‐07 2008‐09 2010‐11 2012‐13
Inde
x 1990
‐91 = 100
Victoria Australia
Victorian and national terms of trade
Source: Australia Bureau of Statistics, Department of Treasury and Finance
Victorian Budget 2014|15
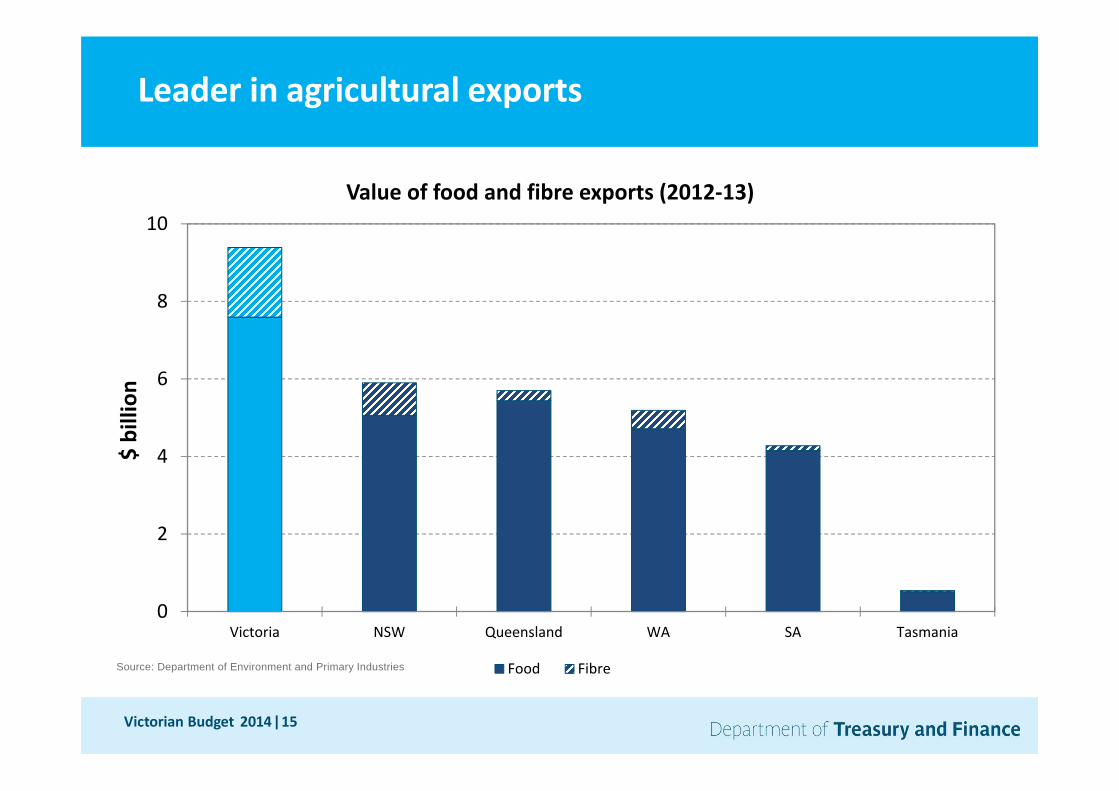
0
2
4
6
8
10
Victoria NSW Queensland WA SA Tasmania
$ billion
Value of food and fibre exports (2012‐13)
Food Fibre
Leader in agricultural exports
Source: Department of Environment and Primary Industries

Victorian Budget 2014|15
+5.2+4.9
+0.7‐0.7 ‐1.1 ‐1.3
‐2.9
‐4.8
‐6
‐4
‐2
0
2
4
6
Victoria NSW ACT NT SA Tasmania WA Queensland
percen
tage points
2012‐13
Share of national education exports less population share
Source: Australia Bureau of Statistics, Department of Treasury and Finance

Victorian Budget 2014|15
56
58
60
62
64
66
68
70
Tasmania SA NSW Victoria Queensland WA
per cen
t
Trend labour force participation rate – March 2014
Average of non‐mining states
Highest participation of the non‐mining states
Source: Australian Bureau of Statistics

Victorian Budget 2014|15
‐100
‐50
0
50
100
150
200
250
300
Manufacturing Mining Utilities Agriculture,Forestry &Fishing
HouseholdServices
Construction GoodsDistribution
BusinessServices
thou
sand
s
Change in employment: February 2004 – February 2014
Victorian employment change by industry
Source: Australian Bureau of Statistics

Victorian Budget 2014|15
0
20
40
60
80
100
Victoria Australia
per cen
t
Share of economic growth 2007‐08 to 2012‐13*
Low capital intensive industries** High capital intensive industries**
Victorian growth driven by low capital intensive industries
Source: Australian Bureau of Statistics; Department of Treasury and Finance
*Excludes ownership of dwellings**Categorised based on industry capital intensity relative to manufacturing as a baseline.
Capital intensity is defined as capital stock over hours worked

Victorian Budget 2014|15
‐4000
‐2000
0
2000
4000
6000
8000
1.2
1.4
1.6
1.8
2.0
2.2
2.4
Sep‐07 Sep‐08 Sep‐09 Sep‐10 Sep‐11 Sep‐12 Sep‐13 Sep‐08 Sep‐09 Sep‐10 Sep‐11 Sep‐12 Sep‐13
PersonsPer cen
t
Annual population growth Annual net interstate migration
A growing population
Source: Australian Bureau of Statistics
Victoria
Australia
Victoria
Victorian Budget 2014|15
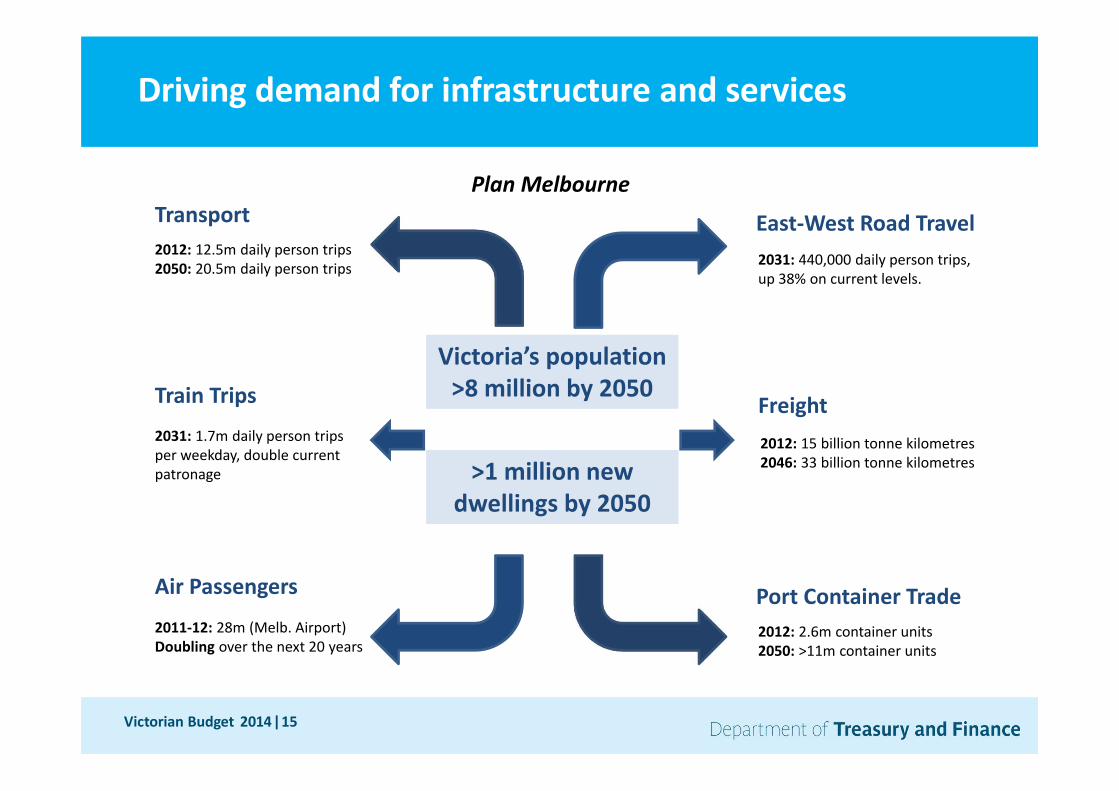
Victoria’s population >8 million by 2050
>1 million new dwellings by 2050
2011‐12: 28m (Melb. Airport)Doubling over the next 20 years
2012: 12.5m daily person trips2050: 20.5m daily person trips 2031: 440,000 daily person trips,
up 38% on current levels.
2012: 2.6m container units 2050: >11m container units
2012: 15 billion tonne kilometres2046: 33 billion tonne kilometres
Driving demand for infrastructure and services
Plan MelbourneTransport
Train Trips
2031: 1.7m daily person trips per weekday, double current patronage
Air Passengers
East‐West Road Travel
Freight
Port Container Trade

Victorian Budget 2014|15
Financial measures Parameters
Operating surplus A net operating surplus of at least $100 million and consistent with the infrastructure and debt parameters
Net debt General government net debt reduced as a percentage of GSP over the decade to 2022
Infrastructure investment Infrastructure investment of 1.3 per cent of GSP (calculated as a rolling five‐year average)
Superannuation liabilities Fully fund the unfunded superannuation liability by 2035
Medium‐term fiscal strategy
Source: Department of Treasury and Finance

Victorian Budget 2014|15
0
3
6
9
12
15
2000‐01 2002‐03 2004‐05 2006‐07 2008‐09 2010‐11 2012‐13 2014‐15 2016‐17
per cen
tAnnual revenue growth
Source: Department of Treasury and Finance
Victorian Budget 2014|15
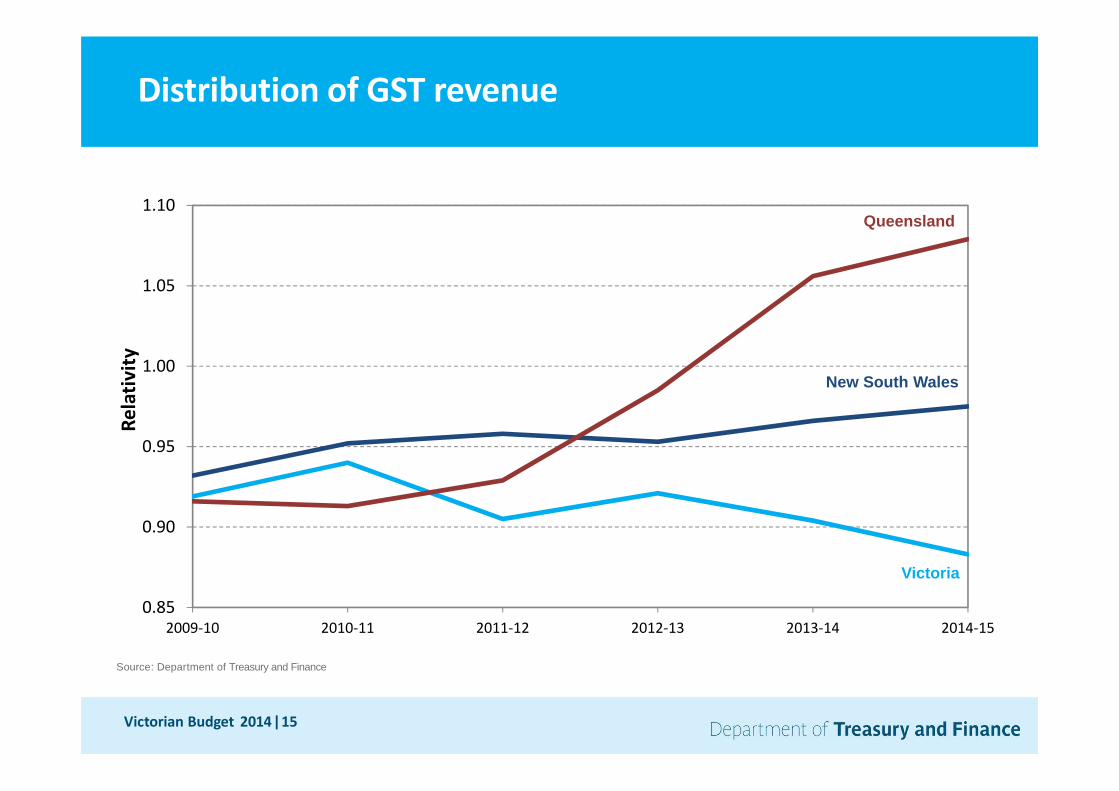
0.85
0.90
0.95
1.00
1.05
1.10
2009‐10 2010‐11 2011‐12 2012‐13 2013‐14 2014‐15
Relativ
ity
Distribution of GST revenue
Victoria
Queensland
New South Wales
Source: Department of Treasury and Finance

Victorian Budget 2014|15
0
3
6
9
12
15
2000‐01 2002‐03 2004‐05 2006‐07 2008‐09 2010‐11 2012‐13 2014‐15 2016‐17
per cen
tAnnual expenditure growth
Source: Department of Treasury and Finance

Victorian Budget 2014|15
Victoria general government revenue and expenses
Source: Department of Treasury and Finance
12.0
12.5
13.0
13.5
14.0
14.5
15.0
1999‐00 2001‐02 2003‐04 2005‐06 2007‐08 2009‐10 2011‐12 2013‐14 2015‐16 2017‐18
percen
tage of G
SP
Revenue Expenses
Victorian Budget 2014|15
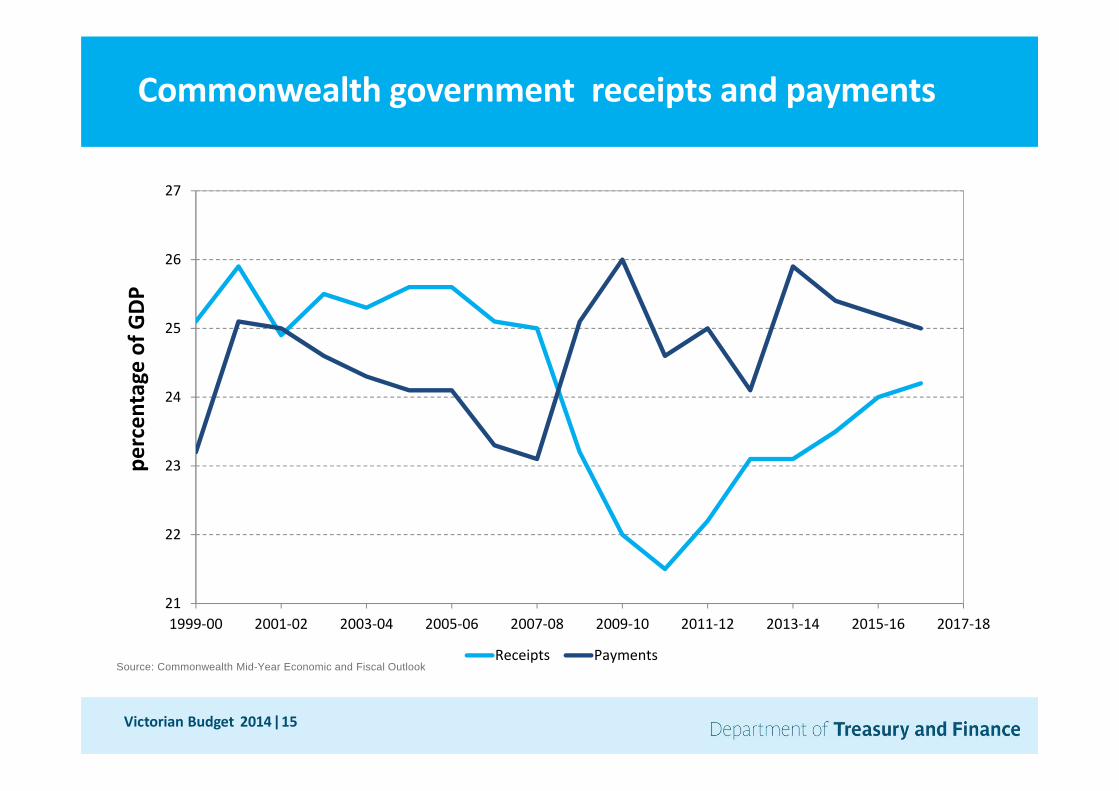
21
22
23
24
25
26
27
1999‐00 2001‐02 2003‐04 2005‐06 2007‐08 2009‐10 2011‐12 2013‐14 2015‐16 2017‐18
percen
tage of G
DP
Receipts Payments
Commonwealth government receipts and payments
Source: Commonwealth Mid-Year Economic and Fiscal Outlook
Victorian Budget 2014|15
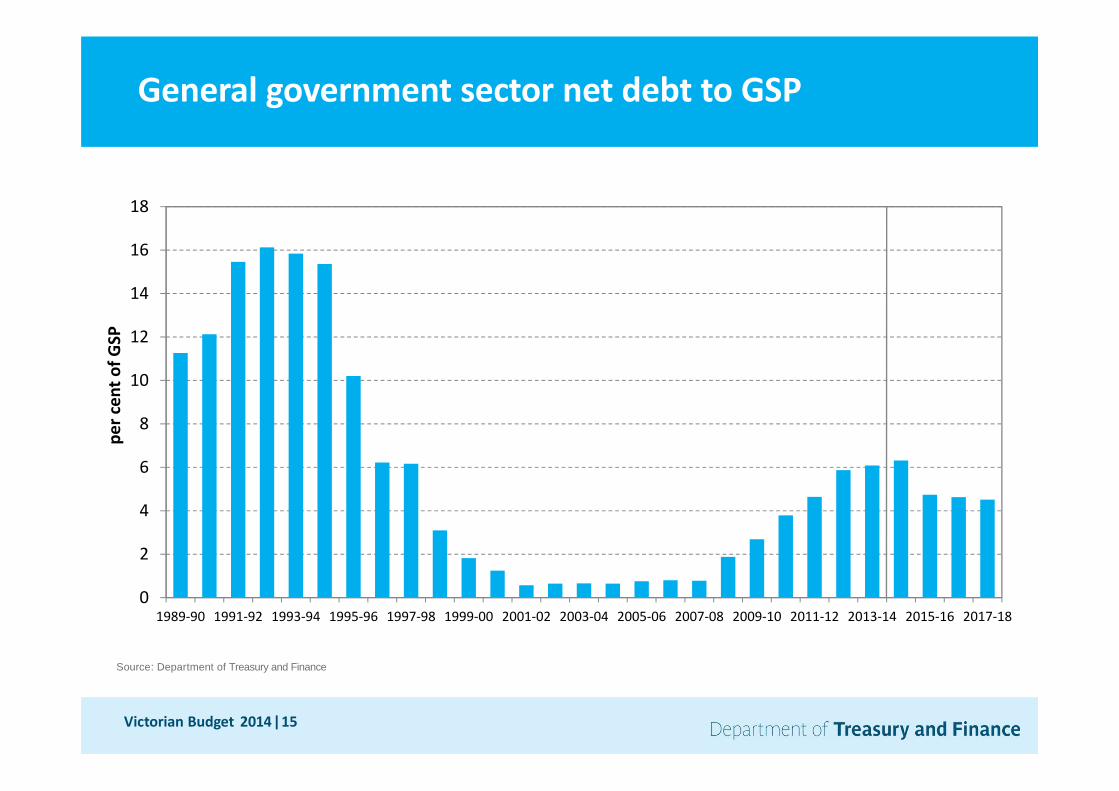
0
2
4
6
8
10
12
14
16
18
1989‐90 1991‐92 1993‐94 1995‐96 1997‐98 1999‐00 2001‐02 2003‐04 2005‐06 2007‐08 2009‐10 2011‐12 2013‐14 2015‐16 2017‐18
per cen
t of G
SPGeneral government sector net debt to GSP
Source: Department of Treasury and Finance

Victorian Budget 2014|15
State Standard & Poor’s Moody’s
Credit rating Outlook Credit rating Outlook
Victoria AAA Stable Aaa Stable
New South Wales AAA Negative Aaa Stable
Queensland AA+ Stable Aa1 Negative
Western Australia AA+ Stable Aaa Negative
South Australia AA Stable Aa1 Stable
Tasmania AA+ Stable Aa1 Negative
Northern Territory N/A N/A Aa1 Negative
Australian Capital Territory AAA Stable N/A N/A
Source: Department of Treasury and Finance
Strongest credit rating among the States
Victorian Budget 2014|15
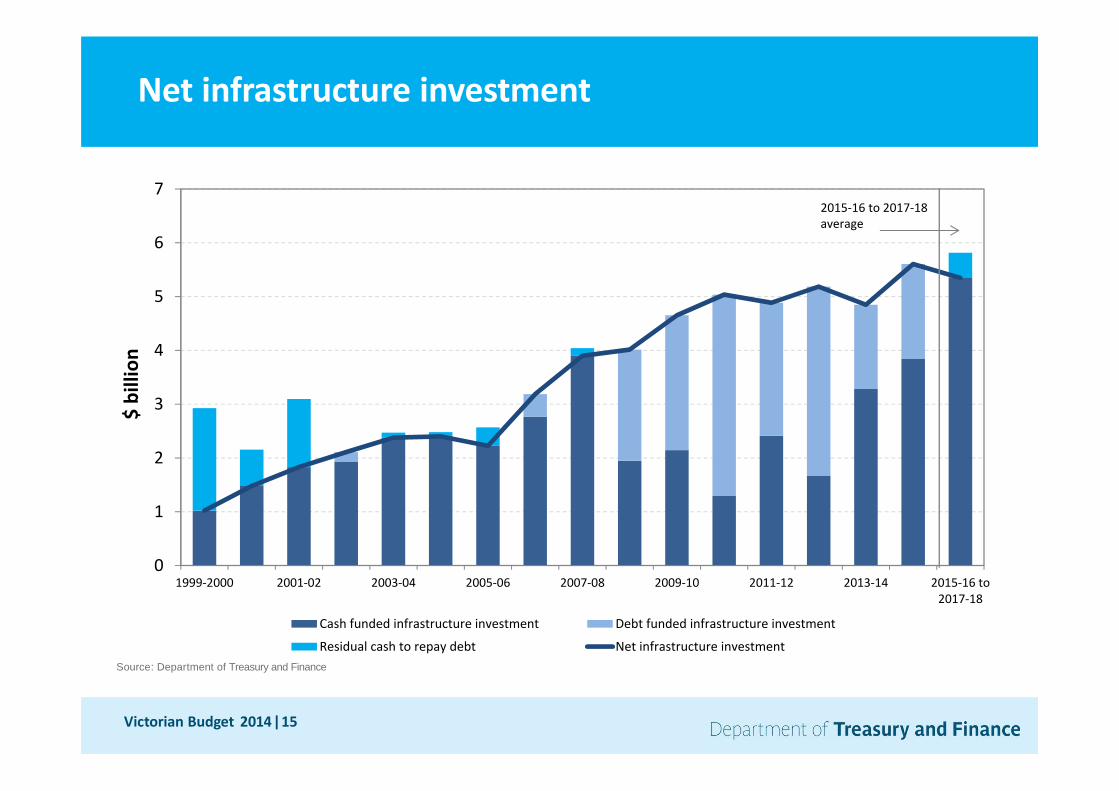
0
1
2
3
4
5
6
7
1999‐2000 2001‐02 2003‐04 2005‐06 2007‐08 2009‐10 2011‐12 2013‐14 2015‐16 to2017‐18
$ billion
Cash funded infrastructure investment Debt funded infrastructure investment
Residual cash to repay debt Net infrastructure investment
2015‐16 to 2017‐18 average
Net infrastructure investment
Source: Department of Treasury and Finance
Victorian Budget 2014|15
• Partnership between Commonwealth and Victorian Governments to deliver significant projects for Victoria
• Victorians will benefit from incentive payments through divestment of the:
‐ Port of Melbourne (via medium‐term lease)
‐ Rural Finance Corporation
• Enabling additional investment in long‐term infrastructure projects
Source: Department of Treasury and Finance
Asset recycling initiative

Victorian Budget 2014|15
Project Construction Period Estimated Value
Melbourne Rail Link (including Airport Rail Link) 2016‐2026 $8.5b‐$11b
East West Link – Western Section 2015‐2023 $8b‐$10b
Cranbourne‐Pakenham Rail Corridor 2015‐2018 $2b‐$2.5b
East West Link – Eastern Section 2014‐2019 $6b‐$8b
CityLink‐Tulla widening 2015‐2016 Up to $850m
Princes Highway West duplication 2015‐2019 $362m
Murray Basin Rail Project 2014‐2018 $180m‐$220m
Latrobe Regional Hospital redevelopment 2014‐2018 $73m
Source: Department of Treasury and Finance
Infrastructure program – summary
Victorian Budget 2014|15
Melbourne Rail Link ‐ $8.5b‐$11b
• Rail tunnel from South Yarra to Southern Cross
• Two new underground stations at Domain and Fishermans Bend(Montague)
• Alignment will act as a major catalyst for commercial and residential development
• Increases capacity of Melbourne rail network by 30 per cent
• Construction of Airport Rail Link
Source: Department of Transport, Planning and Local Infrastructure

Victorian Budget 2014|15
Cranbourne‐Pakenham Rail Corridor project ‐ $2b‐$2.5b
• 1 in 10 Melburnians to benefit from improved services on Melbourne’s busiest suburban train line
• 25 next‐generation, high capacity trains
• Accommodating an additional 4 500 passengers during peak periods
• Four level crossing removals with plans for a further five
• Gippsland V/Line services to benefit from improved reliability
Source: Department of Transport, Planning and Local Infrastructure
Victorian Budget 2014|15
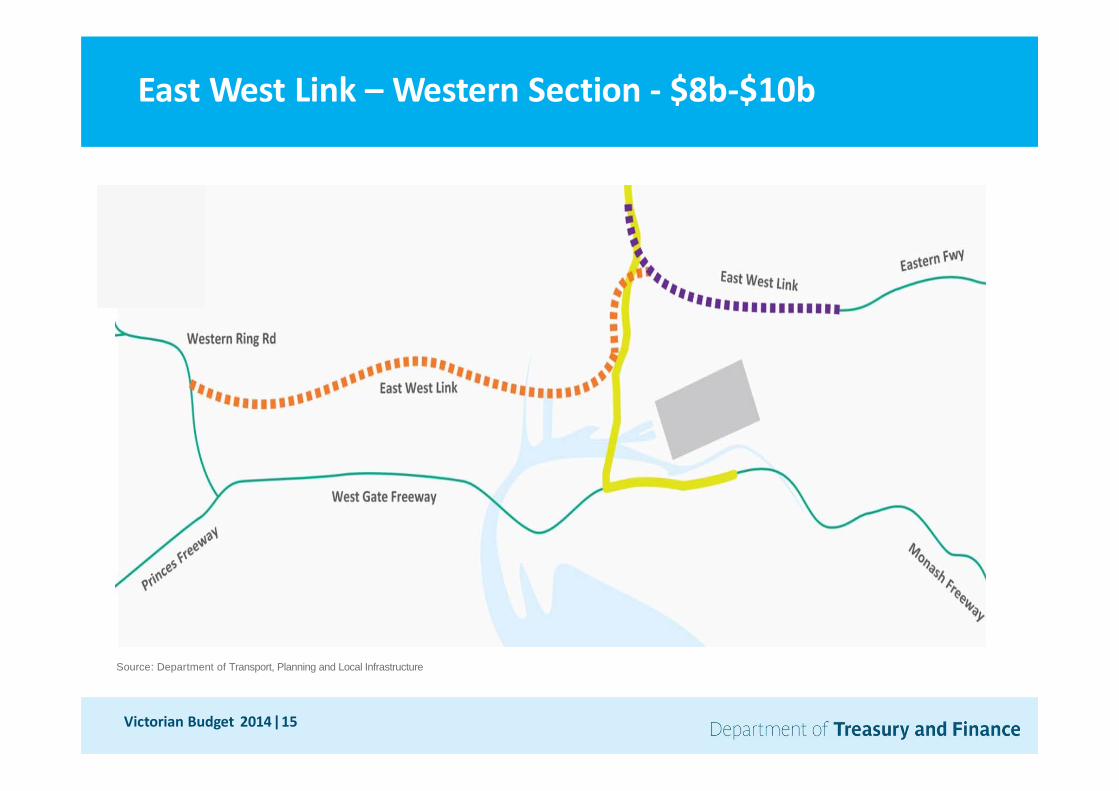
East West Link – Western Section ‐ $8b‐$10b
Source: Department of Transport, Planning and Local Infrastructure

Victorian Budget 2014|15
Other infrastructure initiatives
• Up to $850m CityLink ‐ Tulla widening
• $362m Princes Highway West duplication
• $180m‐$220m Murray Basin Rail Project
• $447m to expand Victoria’s prison capacity
• Additional $685m to remove more level crossings
• $73m Latrobe Regional Hospital
Source: Department of Treasury and Finance

Victorian Budget 2014|15
Education and training initiatives
Source: Department of Treasury and Finance
• $2.8b over five years for initiatives and enrolment funding
• $500m to build and upgrade government school facilities, including:
‐ Construction of 12 new schools
‐ More than 70 existing schools to be upgraded
• PPPs to deliver components of the school capital program
• VET funding $1.2b a year, including $30m to assist automotive workers

Victorian Budget 2014|15
Health care and community services
Source: Department of Treasury and Finance
• Additional $1.4b over four years
• $60m to boost health service capacity over the winter peak
• $156m for mental health and drug services
• $190m for elective surgery
• $200m to support people with a disability
• Additional capital expenditure

Victorian Budget 2014|15
Community safety
• $33m to construct new police stations
• $783m investment in fire services
‐ CFA funding up 2.5 per cent to $457m‐ MFB funding up 3.1 per cent to $326m
• $29m for 78 new CFA fire trucks
• Correction system expansion including:
‐ Additional 871 prison beds‐ Infrastructure upgrades at Beechworth Correctional Centre and Langi Kal
Kal Prison
Source: Department of Treasury and Finance

Victorian Budget 2014|15
Regional Victoria initiatives
Source: Department of Treasury and Finance
• $211m for 12 new schools across the State
• $28m for Barwon Health‐North Facility
• $86m Calder Highway redevelopment
• $50m Great Ocean Road upgrade
• $30m Ballarat West Employment Zone
• $73m Shepparton Law Courts

Victorian Budget 2014|15
0
1
2
3
4
5
6
7
8
9
Victoria WA Queensland NSW SA Tasmania
per cen
t
12 month average to March 2014
Regional Australia average
Regional unemployment rates
Source: Australian Bureau of Statistics
Victorian Budget 2014|15
• Cut payroll tax rate to 4.85 per cent from 1 July 2014, benefitting 39 000 employers
• Lowest payroll tax in Australia for businesses with payrolls from $4.7m to $26.7m
• Duty on life insurance also abolished from 1 July 2014
Source: Department of Treasury and Finance
Revenue initiatives

Victorian Budget 2014|15
2014‐15 Budget Papers
• Budget papers this year are structured along the same lines as last year
• Some incremental refinements to the presentation of content, including:
— additional clarification relating to the completion of capital projects
— continuous improvement to the defining of key terms used in budget papers

Victorian Budget 2014|15
David MartineSecretary, Department of Treasury and Finance
7 May 2014