Embed Size (px)
Citation preview

Victorian Community Profiles: 2016 Census
Philippines-born

CONTENTS
AcknowledgementsNotes on the data
Tables
1 Distribution within Australia of Philippines-born: 2016, 2011
2 Number of Philippines-born by Top Twenty Local Government Areas and their Major Suburbs, Victoria: 2016
3 Number of Philippines-born by Top Twenty Local Government Areas, Victoria: 2016, 2011
4 Year of Arrival of Philippines-born and Total Victorian Overseas-born: 2016
5 Year of Arrival by Top Twenty Local Government Areas, Philippines-born, Victoria: 2016
6 Age Groups of Philippines-born and the Total Victorian Population: 2016, 2011
7 Total Persons Identified with Filipino Ancestry by Top Twenty Local Government Areas, Victoria: 2016, 2011
8 Country of Birth (Top Twenty plus Australia) of Persons of Filipino Ancestry, Victoria: 2016, 2011
9 Languages Spoken at Home (Top Twenty), Philippines-born and the Total Victorian Population: 2016, 2011.
10 Languages Spoken at Home (Top 3) by Top Twenty Local Government Areas, Philippines-born, Victoria, 2016
11 Proficiency in Spoken English, Philippines-born, Victoria: 2016, 2011
12 Proficiency in Spoken English by Top Twenty Local Government Areas, Philippines-born, Victoria: 2016
13 Religious Affiliation (Top Twenty), Philippines-born and the Total Victorian Population: 2016, 2011
14 Religious Affiliation (Top Three) by Top Twenty Local Government Areas, Philippines-born, Victoria: 2016
15 Type of Internet Connection, Philippines-born and the Total Victorian Population: 2016, 2011
16 Type of Internet Connection by Top Ten Local Government Areas, Philippines-born, Victoria: 2016
17 Highest Level of Educational Attainment, Philippines-born and Total Victoria: 2016, 2011
18 Highest Level of Educational Attainment by Top Ten Local Government Areas, Philippines-born, Victoria: 2016
19 Labour Force Participation, Philippines-born and Total Victoria: 2016, 2011
20 Labour Force Participation by Top Ten Local Government Areas, Philippines-born, Victoria: 2016
21 Occupation of Philippines-born and Total Victoria: 2016, 2011
22 Occupation by Top Ten Local Government Areas, Philippines-born, Victoria: 2016
23 Industry of Employment, Philippines-born and Total Victoria: 2016, 2011
24 Industry of Employment by Top Ten Local Government Areas, Philippines-born, Victoria: 2016
25 Voluntary Work, Philippines-born and Total Victoria: 2016, 2011
26 Voluntary Work by Top Ten Local Government Areas, Philippines-born, Victoria: 2016
27 Total Personal Income (Weekly), Philippines-born and Total Victoria: 2016
28 Total Personal Income (Weekly) by Top Ten Local Government Areas, Philippines-born, Victoria: 2016
29 Housing Tenure Type, Philippines-born and the Total Victorian Population: 2016, 2011
30 Housing Tenure Type by Top Ten Local Government Areas, Philippines-born, Victoria: 2016
31 Family Composition, Philippines-born and the Total Victorian Population: 2016, 2011
32 Citizenship Status, Philippines-born and the Total Victorian Population: 2016
33 Citizenship Status by Top Ten Local Government Areas, Philippines-born: 2016, 2011
34 Core Activity Need for Assistance, Philippines-born and the Total Victorian Population: 2016, 2011
35 Core Activity Need for Assistance by Top Ten Local Government Areas, Philippines-born, Victoria: 2016
36 Usual Address Five Years Ago by Top Ten Local Government Areas, Philippines-born and Total Victoria: 2016
Figures and Maps
Figure 1 - Geographic Distribution of Philippines-born in Metropolitan Local Government Areas, Victoria: 2016
Figure 2 - Age and Gender Distribution of Philippines-born and of the Total Victorian Population: 2016, 2011(including tables on age in five year groups, and sex distribution, persons and percentage)
Map 1 - Victoria State, Local Government Areas and Regional Advisory Councils Regions, 2016
Map 2 - Metropolitan Melbourne, Local Government Areas and Regional Advisory Councils Regions, 2016

Acknowledgements
The Multicultural Affairs and Social Cohesion Division, Department of Premier and Cabinet, would like to acknowledge the valuable contribution made by the Australian Bureau of Statistics in the preparation of thisreport. The report is based on data from the 2016, 2011 and 2006 Census of Population and Housing. TheCensus provides the the Australian community, including planners and policy makers, with a detailed source of information about the composition of Australian society and how it has changed over time.
© The State of Victoria, Department of Premier and Cabinet 2018
ISBN 987-1-92551-84-6 Online (pdf)
Accessibility
Disclaimer
Source of data in this publication
Australian Bureau of Statistics, Census of Population and Housing, 2016, 2011 and 2006.
Images by: Artificial Studios (Jorge de Araugo)
This work is licensed under a Creative Commons Attribution 4.0 international licence. You are free to re-use the work under that licence, on the condition that you credit the State of Victoria (Department of Premier and Cabinet) as author. This license does not apply to any images or branding, including the Victorian Coat of Arms and the Victorian logo. To view a copy of this license, visit http: creativecommons.org/licenses/by/4.0/
If you would like to receive this publication in an alternative format, please email the Multicultural Affairs and Social Cohesion Division, Department of Premier and Cabinet, on [email protected]. This document is available in PDF format on the internet at www.multicultural.vic.gov.au.
This publication has been prepared with data and terminology supplied by the Australian Bureau of Statistics only for the purpose of disseminating information for the benefit of the public. No warranty is given as to the accuracy, reliability, currency or completeness of the information. The State of Victoria accepts no liability for any loss or damage that may be incurred by any person from the use, interpretation or reliance on the information provided.

Notes on the Data
Confidentiality and Introduced Random Error
Local Government Areas and new ABS Geography
The counts and totals in summary tables are subjected to small adjustments. These adjustments may cause the sum of rows or columns to differ by small amounts from table totals. The counts are adjusted independently in a controlled manner, so the same information is adjusted by the same amount. However, tables at higher geographic levels may not be equal to the sum of the tables for the component geographic units.
Many classifications used in ABS statistics have an uneven distribution of data throughout their categories. For example, the number of people who are Anglican or born in Italy is quite large (3,101,185 and 174,042 respectively in 2016), while the number of people who are Buddhist or born in Chile (563,674 and 26,086 respectively in 2016), is relatively small. When religion is cross-classified with country of birth, the number in the table cell who are Anglican and who were born in Italy could be small, and the number of Buddhists born in Chile even smaller. These small numbers increase the risk of identifying individuals in the statistics.
These notes relate to the Birthplace Community Profiles, and detail some important considerations regarding the classifications used and comparability issues between Census years. For more general information about what is collected in the Census and the meaning of various categories, please see the Australian Bureau of Statistics (ABS) Census Dictionary, 2016, Catalogue No. 2901.0 on the ABS Website www.abs.gov.au, which also contains the other publications mentioned in these notes.
Even when variables are more evenly distributed in the classifications, the problem still occurs. The more detailed the classifications, and the more of them that are applied in constructing a table, the greater the incidence of very small cells.
Care is taken in the specification of tables to minimise the risk of identifying individuals. In addition, a technique has been developed to randomly adjust cell values. Random adjustment of the data is considered to be the most satisfactory technique for avoiding the release of identifiable Census data. When the technique is applied, all cells are slightly adjusted to prevent any identifiable data being exposed. These adjustments result in small introduced random errors. However, the information value of the table as a whole is not impaired. The technique allows very large tables to be produced even though they contain numbers of very small cells.
It is not possible to determine which individual figures have been affected by random error adjustments, but the small variance which may be associated with derived totals can, for the most part, be ignored.
No reliance should be placed on small cells as they are impacted by random adjustment, respondent and processing errors.
Many different classifications are used in Census tables and the tables are produced for a variety of geographical areas. The effect of the introduced random error is minimised if the statistic required is found direct from a tabulation rather than from aggregating more finely classified data. Similarly, rather than aggregating data from small areas to obtain statistics about a larger standard geographic area, published data for the larger area should be used wherever possible.
When calculating proportions, percentages or ratios from cross-classified or small area tables, the random error introduced can be ignored except when very small cells are involved, in which case the impact on percentages and ratios can be significant.
The Local Government Area (LGA) is part of the Non-ABS Structure of the ASGS and the ABS will continue to support LGAs with the data it currently provides. There were no boundary changes between Local Government Areas (LGAs) in Victoria between 2011 and 2016.

Census variables
Country of Birth of Person
Some country name changes from 2011 to 2016:2011 2016Former Yugoslav Republic of Macedonia (FYROM) FYR of MacedoniaMyanmar, The Republic of the Union of MyanmarBolivia, Plurinational State of BoliviaVenezuela, Bolivarian Republic of Venezuela
Indigenous Status
Year of Arrival
Ancestry
Age
Language Spoken at Home
Proficiency in Spoken English
Religious Affiliation
The following describes Census topics presented in this publication. (Please refer to the Census Dictionary, 2016 ).
This variable indicates in which country a person was born and is coded using the Standard Australian Classification of Countries (SACC), 2016 , Catalogue No. 1269.0. Change of names of countries between censuses should be noted when making time series comparisons. Examples are provided below:
This provides responses of persons who identified themselves as being of Australian Aboriginal and/or Torres Strait Islander origin.
This states for persons born overseas, the year they first arrived in Australia with the intention of staying for at least one year. The variable Country of Birth of Person is the basis for determining if a person was born in Australia or overseas. The year 2016 refers to the period from 1st January 2016 to 9th August 2016 only.
Ancestry is coded using the Australian Standard Classification of Cultural and Ethnic Groups (ASCCEG), 2016 , Catalogue No.1249.0. There are two ancestry variables, First and Second Response, because respondents to the Census are asked to report up to two ancestries. Respondents do not have the option of ranking their answers to the ancestry question, so where a respondent reports two ancestries, those two ancestries have equal standing. The two ancestry variables are combined into one variable Ancestry Multi-Response, or Total Responses as used in this publication.
This contains a person's age, and is collected for each person. Age is calculated from date of birth, however if this is not provided, stated age will be used. If neither is provided, age is imputed.
This records responses to the Census question “Does the person speak a language other than English at home?”, and is coded using the Australian Standard Classification of Languages (ASCL), 2016 , Catalogue No. 1267.0. This question allows for one answer only.
This variable classifies their self-assessed proficiency in spoken English for each person who speaks a language other than English at home.
Religions are coded using the Australian Standard Classification of Religions Groups (ASCRG), 2016 , Catalogue No. 1266.0. The variable records a person’s religious affiliation. Answering this Census question is optional.

Dwelling Internet Connection
Level of Highest Educational Attainment
Labour Force Status
Occupation
Industry of Employment
Voluntary Work
Total Personal Income (Weekly)This indicates the total income that the person usually receives each week.
Tenure Type
Family Composition
CitizenshipThis records whether a person has Australian citizenship.
Core Activity Need for Assistance
Occupation is coded using the Australian and New Zealand Standard Classification of Occupations (ANZSCO), 2013, Version 1.2 , Catalogue No. 1220.0. The Occupation code assigned to a response is based on the occupation title and tasks of the main job held during the week prior to Census night.
Industry of Employment is coded using the Australian and New Zealand Standard Industrial Classification (ANZSIC), 2006 Revision 2.0 , Catalogue No. 1292.0.
This variable records people who spent time doing unpaid voluntary work through an organisation or group, in the twelve months prior to Census Night. It excludes work done as part of paid employment; if main reason is to qualify for Government benefit, obtain an educational qualification or due to a community work order: and in a family business
This variable records whether any member of the household accesses the internet from the dwelling, through a desktop/laptop computer, mobile or smart phone, tablet, music or video player, gaming console, smart TV or any other devices. It also includes accessing through any type of connection, for example, ADSL, fibre, cable, wireless, satellite and mobile broadband (3G/4G).
This variable combines ”Non-School Qualification: Level of Education” and “Highest Year of School Completed” to produce a single measure of a person's overall level of educational attainment, whether it be a school or non-school qualification.
This variable records, for the week prior to Census night, a person's labour force status. The category, “Employed, away from work” also includes persons who stated they worked but who did not state their number of hours worked.
This describes whether a dwelling is owned, being purchased or rented. Dwellings occupied under a life tenure scheme can be considered as being owned.
Family Composition classifies families into different types. When classifying families into different types, information about temporarily absent family members is used.
No provision has been made in Family Composition to classify family members outside the family nucleus. For example, in a family which contains a couple and their dependent children, plus a parent of one of the couple, the latter would be recorded as an “Other related individual”. Identification of such persons within a family is done by means of “Relationship in household” data.
This measures the number of people with a profound or severe disability. People with a profound or severe disability are defined as those people needing help or assistance in one or more of the three core activity areas of self-care, mobility and communication because of a disability, long term health condition (lasting six months or more) or old age.

Usual Address 5 years ago
Abbreviations
nfd Not further definednec Not elsewhere classifiedna Not available or Not applicableAlia AustraliaVic VictoriaCOB Country of BirthOSB Overseas-bornLOTE Language other than EnglishLGA Local Government AreaMESC Main English-speaking CountriesNMESC Non-Main English-speaking Countries
Category names have been shortened where they do not fit within the columns or rows in the tables in this publication. The commonly used abbreviations include:
This is derived from the mark box answer to the question on the 2016 Census form which asks, “Where did the person usually live five years ago (at 9 August 2011)?”. This variable shows migration patterns when used with the “Usual Address Census Night Indicator”, “Usual Address One Year Ago Indicator” and “Place of usual residence” data.

Table 1Distribution within Australia of Philippines-born: 2016 and 2011 Census
2011-2016 2011-2016
Persons% of
total(d) Persons% of
total(d)%
change Persons% of
total(d) Persons% of
total(d)%
change
New South Wales 86,749 37.3 70,388 41.1 23.2 2,072,566 33.6 1,778,545 33.6 16.5Greater Sydney 75,480 32.5 62,840 36.7 20.1 1,773,543 28.8 1,503,620 28.4 18.0Rest of State 11,270 4.8 7,541 4.4 49.4 299,027 4.9 274,922 5.2 8.8
Victoria 51,290 22.1 38,002 22.2 35.0 1,680,274 27.3 1,405,337 26.5 19.6Greater Melbourne 45,157 19.4 33,922 19.8 33.1 1,520,265 24.7 1,259,966 23.8 20.7Rest of State 6,129 2.6 4,079 2.4 50.3 160,012 2.6 145,374 2.7 10.1
Queensland 39,661 17.1 29,462 17.2 34.6 1,016,035 16.5 888,634 16.8 14.3Greater Brisbane 20,797 8.9 15,943 9.3 30.4 592,693 9.6 509,159 9.6 16.4Rest of State 18,861 8.1 13,521 7.9 39.5 423,341 6.9 379,473 7.2 11.6
South Australia 12,465 5.4 8,858 5.2 40.7 384,096 6.2 352,998 6.7 8.8Greater Adelaide 10,204 4.4 7,507 4.4 35.9 341,059 5.5 310,940 5.9 9.7Rest of State 2,260 1.0 1,353 0.8 67.0 43,039 0.7 42,059 0.8 2.3
Western Australia 30,835 13.3 17,231 10.1 79.0 797,714 12.9 688,220 13.0 15.9Greater Perth 24,624 10.6 13,397 7.8 83.8 702,554 11.4 597,927 11.3 17.5Rest of State 6,209 2.7 3,835 2.2 61.9 95,153 1.5 90,291 1.7 5.4
Tasmania 1,616 0.7 1,267 0.7 27.5 61,241 1.0 57,653 1.1 6.2Greater Hobart 714 0.3 533 0.3 34.0 30,670 0.5 27,953 0.5 9.7Rest of State 905 0.4 736 0.4 23.0 30,573 0.5 29,697 0.6 2.9
Northern Territory 5,914 2.5 3,586 2.1 64.9 45,407 0.7 35,177 0.7 29.1Greater Darwin 4,963 2.1 2,890 1.7 71.7 34,979 0.6 26,132 0.5 33.9Rest of Territory 951 0.4 693 0.4 37.2 10,426 0.2 9,041 0.2 15.3
ACT 3,798 1.6 2,422 1.4 56.8 105,170 1.7 86,324 1.6 21.8
Australia(b) 232,386 100.0 171,233 100.0 35.7 6,164,361 100.0 5,294,150 100.0 16.4All capital cities(c) 181,939 78.3 137,035 80.0 32.8 4,995,765 81.0 4,235,703 80.0 17.9Rest of country 50,447 21.7 34,201 20.0 47.5 1,168,601 19.0 1,058,448 20.0 10.4
(a) Rest of State or Territory categories include "No Usual Address" and "Migratory-Offshore-Shipping".(b) Australia total includes "Other Territories".(c) Comprises Greater Sydney, Greater Melbourne, Greater Brisbane, Greater Adelaide, Greater Perth, Greater Hobart and Greater Darwin.(d) Percent in italics adds up to total for Australia.(e) Includes "Inadequately described", "At sea", "Australia (includes External Territories), nfd", "Norfolk Island" and "Australian External Territories, nec".
State or Territory/Greater Capital city Statistical Area/Rest of State or Territory(a)
Philippines-born
2016 2011
Overseas-born(e)
2016 2011

Table 2Number of Philippines-born by Top Twenty Local Government Areasand Major Suburbs, Victoria: 2016
Rank in 2016
Rank in 2011 Local Government Area Suburbs with most Philippines-born, ranked
1 1 Brimbank (C)
2 2 Wyndham (C)
3 3 Casey (C)
4 4 Melton (C)
5 5 Hume (C)
6 6 Whittlesea (C)
7 7 Greater Dandenong (C)
8 8 Kingston (C)
9 9 Knox (C)
10 12 Greater Geelong (C)
11 10 Monash (C)
12 13 Moreland (C)
13 19 Melbourne (C)
14 14 Frankston (C)
15 15 Maribyrnong (C)
16 11 Hobsons Bay (C)
17 16 Whitehorse (C)
18 17 Darebin (C)
19 21 Glen Eira (C)
20 18 Moonee Valley (C)
Noble Park, Dandenong, Keysborough, Dandenong North, Springvale (Vic.)
Clayton South, Clarinda, Cheltenham (Vic.), Oakleigh South, Chelsea Heights
Rowville, Ferntree Gully, Bayswater (Vic.), Boronia, Wantirna South
Lara, Corio, Norlane, Grovedale, Bell Park
St Albans (Vic.), Deer Park, Derrimut, Cairnlea, Delahey
Tarneit, Point Cook, Hoppers Crossing, Truganina, Werribee
Hampton Park, Cranbourne East, Cranbourne North, Berwick, Narre Warren South
Caroline Springs, Taylors Hill, Burnside (Vic.), Burnside Heights, Plumpton (Vic.)
Craigieburn, Roxburgh Park, Sunbury, Broadmeadows (Vic.), Meadow Heights
Epping (Vic.), Mill Park, South Morang, Lalor, Mernda
Glen Waverley, Clayton, Mount Waverley, Mulgrave (Vic.), Wheelers Hill
Glenroy (Vic.), Fawkner, Pascoe Vale, Coburg, Brunswick West
Melbourne, Southbank, North Melbourne, Carlton (Vic.), Docklands
Carrum Downs, Frankston, Skye (Vic.), Seaford (Vic.), Langwarrin
Footscray, Braybrook, Maribyrnong, West Footscray, Maidstone
Altona Meadows, Laverton (Vic.), Altona (Vic.), Seabrook, Altona North
Box Hill (Vic.), Forest Hill (Vic.), Burwood (Vic.), Box Hill North, Burwood East
Reservoir (Vic.), Preston (Vic.), Northcote, Thornbury, Kingsbury
Bentleigh East, Carnegie, Bentleigh, Caulfield North, Glen Huntly
Avondale Heights, Keilor East, Ascot Vale, Moonee Ponds, Essendon

Figure 1Geographic Distribution of Philippines-born inMetropolitan Local Government Areas, Victoria: 2016
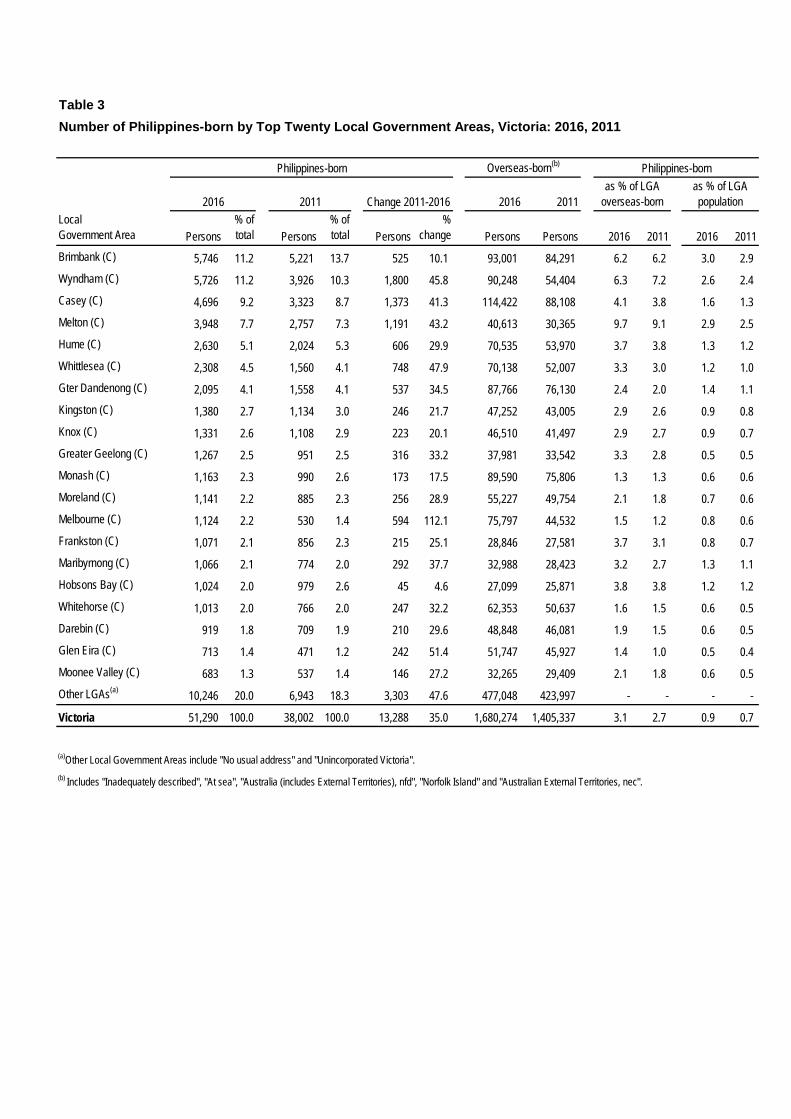
Table 3Number of Philippines-born by Top Twenty Local Government Areas, Victoria: 2016, 2011
2016 2011Local Government Area Persons
% of total Persons
% of total Persons
% change Persons Persons 2016 2011 2016 2011
Brimbank (C) 5,746 11.2 5,221 13.7 525 10.1 93,001 84,291 6.2 6.2 3.0 2.9 Wyndham (C) 5,726 11.2 3,926 10.3 1,800 45.8 90,248 54,404 6.3 7.2 2.6 2.4 Casey (C) 4,696 9.2 3,323 8.7 1,373 41.3 114,422 88,108 4.1 3.8 1.6 1.3 Melton (C) 3,948 7.7 2,757 7.3 1,191 43.2 40,613 30,365 9.7 9.1 2.9 2.5 Hume (C) 2,630 5.1 2,024 5.3 606 29.9 70,535 53,970 3.7 3.8 1.3 1.2 Whittlesea (C) 2,308 4.5 1,560 4.1 748 47.9 70,138 52,007 3.3 3.0 1.2 1.0 Gter Dandenong (C) 2,095 4.1 1,558 4.1 537 34.5 87,766 76,130 2.4 2.0 1.4 1.1 Kingston (C) 1,380 2.7 1,134 3.0 246 21.7 47,252 43,005 2.9 2.6 0.9 0.8 Knox (C) 1,331 2.6 1,108 2.9 223 20.1 46,510 41,497 2.9 2.7 0.9 0.7 Greater Geelong (C) 1,267 2.5 951 2.5 316 33.2 37,981 33,542 3.3 2.8 0.5 0.5 Monash (C) 1,163 2.3 990 2.6 173 17.5 89,590 75,806 1.3 1.3 0.6 0.6 Moreland (C) 1,141 2.2 885 2.3 256 28.9 55,227 49,754 2.1 1.8 0.7 0.6 Melbourne (C) 1,124 2.2 530 1.4 594 112.1 75,797 44,532 1.5 1.2 0.8 0.6 Frankston (C) 1,071 2.1 856 2.3 215 25.1 28,846 27,581 3.7 3.1 0.8 0.7 Maribyrnong (C) 1,066 2.1 774 2.0 292 37.7 32,988 28,423 3.2 2.7 1.3 1.1 Hobsons Bay (C) 1,024 2.0 979 2.6 45 4.6 27,099 25,871 3.8 3.8 1.2 1.2 Whitehorse (C) 1,013 2.0 766 2.0 247 32.2 62,353 50,637 1.6 1.5 0.6 0.5 Darebin (C) 919 1.8 709 1.9 210 29.6 48,848 46,081 1.9 1.5 0.6 0.5 Glen Eira (C) 713 1.4 471 1.2 242 51.4 51,747 45,927 1.4 1.0 0.5 0.4 Moonee Valley (C) 683 1.3 537 1.4 146 27.2 32,265 29,409 2.1 1.8 0.6 0.5 Other LGAs(a) 10,246 20.0 6,943 18.3 3,303 47.6 477,048 423,997 - - - -
Victoria 51,290 100.0 38,002 100.0 13,288 35.0 1,680,274 1,405,337 3.1 2.7 0.9 0.7
(a)Other Local Government Areas include "No usual address" and "Unincorporated Victoria".(b) Includes "Inadequately described", "At sea", "Australia (includes External Territories), nfd", "Norfolk Island" and "Australian External Territories, nec".
Philippines-bornas % of LGA
overseas-bornas % of LGApopulation
Philippines-born Overseas-born(b)
2016 2011 Change 2011-2016

Table 4Year of Arrival of Philippines-born and Total Overseas-born, Victoria: 2016
Year of arrival(a) Persons % of total Persons % of total
Prior to 1941 - - 2,500 0.1
1941-1950 17 0.0 23,085 1.4
1951-1960 33 0.1 107,852 6.4
1961-1970 221 0.4 166,674 9.9
1971-1980 2,155 4.2 134,637 8.0
1981-1990 10,322 20.1 195,313 11.6
1991-2000 7,589 14.8 191,778 11.4
2001-2010 16,043 31.3 418,771 24.9
Jan 2011-Aug 2016 13,441 26.2 381,130 22.7
Not stated 1,462 2.9 58,517 3.5
Total 51,290 100.0 1,680,256 100.0
(a)This variable records the year of arrival in Australia for people born overseas who
intend staying in Australia for at least one year.
Philippines-born Total Overseas-born, Vic

Table 5Year of Arrival by Top Twenty Local Government Areas, Philippines-born, Victoria: 2016
Local Government Area Persons
% of total Persons
% of total Persons
% of total Persons
% of total Persons
% of total Persons
% of total Persons
% of total
Brimbank (C) - - 5 9.8 366 15.4 2,402 13.4 2,806 9.5 163 11.1 5,746 11.2Wyndham (C) - - - - 131 5.5 1,667 9.3 3,836 13.0 98 6.7 5,726 11.2Casey (C) - - 3 5.9 115 4.8 1,614 9.0 2,871 9.7 91 6.2 4,696 9.2Melton (C) - - - - 159 6.7 1,370 7.6 2,341 7.9 77 5.3 3,948 7.7Hume (C) - - 3 5.9 123 5.2 1,072 6.0 1,373 4.7 52 3.6 2,630 5.1Whittlesea (C) - - - - 94 4.0 831 4.6 1,312 4.4 65 4.4 2,308 4.5Gter Dandenong (C) - - - - 62 2.6 779 4.3 1,194 4.0 55 3.8 2,095 4.1Kingston (C) - - - - 94 4.0 600 3.3 657 2.2 31 2.1 1,380 2.7Knox (C) - - 3 5.9 101 4.3 554 3.1 630 2.1 44 3.0 1,331 2.6Greater Geelong (C) - - - - 50 2.1 402 2.2 766 2.6 44 3.0 1,267 2.5Monash (C) - - - - 74 3.1 421 2.3 637 2.2 37 2.5 1,163 2.3Moreland (C) - - 3 5.9 72 3.0 377 2.1 647 2.2 43 2.9 1,141 2.2Melbourne (C) - - - - 31 1.3 265 1.5 791 2.7 40 2.7 1,124 2.2Frankston (C) - - - - 35 1.5 400 2.2 607 2.1 30 2.1 1,071 2.1Maribyrnong (C) - - - - 82 3.5 440 2.5 507 1.7 30 2.1 1,066 2.1Hobsons Bay (C) - - - - 58 2.4 454 2.5 492 1.7 23 1.6 1,024 2.0Whitehorse (C) - - - - 53 2.2 329 1.8 610 2.1 17 1.2 1,013 2.0Darebin (C) - - - - 33 1.4 323 1.8 528 1.8 28 1.9 919 1.8Glen Eira (C) - - - - 38 1.6 231 1.3 426 1.4 18 1.2 713 1.4Moonee Valley (C) - - - - 70 2.9 227 1.3 354 1.2 29 2.0 683 1.3
Other LGAs(a) - - 34 66.7 532 22.4 3,159 17.6 6,104 20.7 447 30.6 10,246 20.0
Victoria - - 51 100.0 2,373 100.0 17,917 100.0 29,489 100.0 1,462 100.0 51,290 100.0
(a)Other Local Government Areas include "No usual address", "Migratory and off-shore"and "Unincorporated Victoria".(b)To 9 Aug 2016.
Not stated Total
Year of arrival of Philippines-born
Prior to 1941 1941-1960 1961-1980 1981-2000 2001-2016(b)
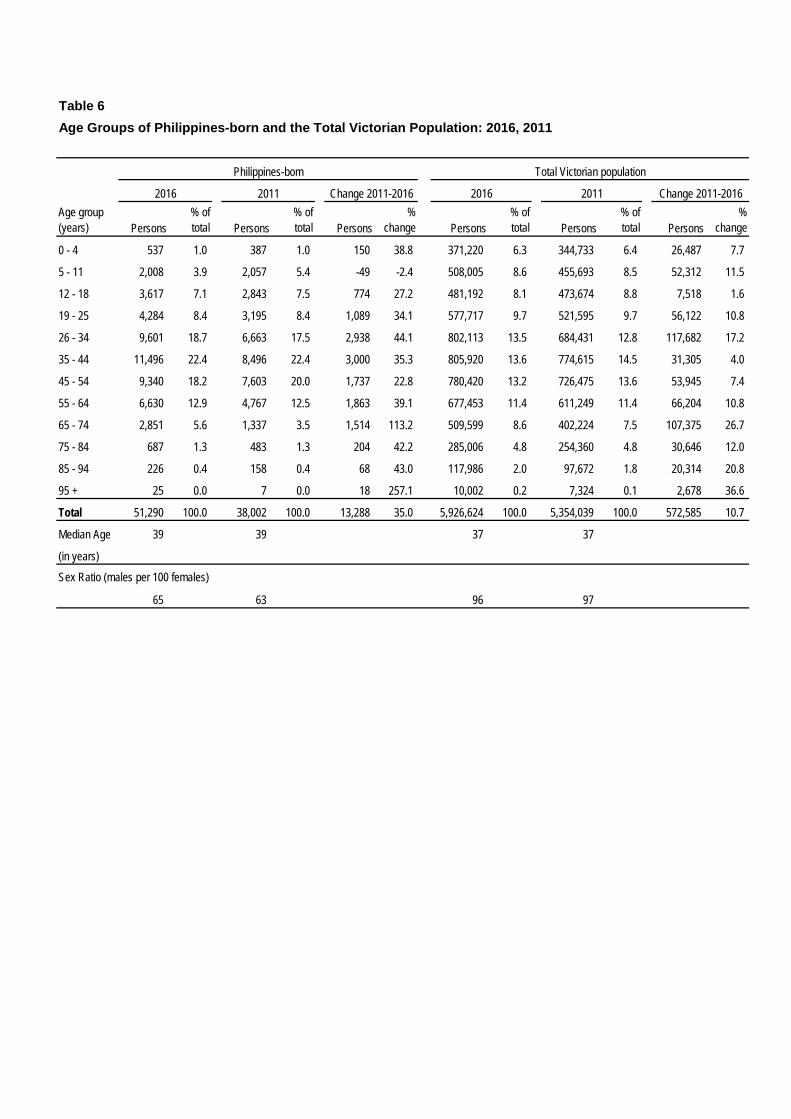
Table 6Age Groups of Philippines-born and the Total Victorian Population: 2016, 2011
Age group(years) Persons
% of total Persons
% of total Persons
%change Persons
% of total Persons
% of total Persons
%change
0 - 4 537 1.0 387 1.0 150 38.8 371,220 6.3 344,733 6.4 26,487 7.7
5 - 11 2,008 3.9 2,057 5.4 -49 -2.4 508,005 8.6 455,693 8.5 52,312 11.5
12 - 18 3,617 7.1 2,843 7.5 774 27.2 481,192 8.1 473,674 8.8 7,518 1.6
19 - 25 4,284 8.4 3,195 8.4 1,089 34.1 577,717 9.7 521,595 9.7 56,122 10.8
26 - 34 9,601 18.7 6,663 17.5 2,938 44.1 802,113 13.5 684,431 12.8 117,682 17.2
35 - 44 11,496 22.4 8,496 22.4 3,000 35.3 805,920 13.6 774,615 14.5 31,305 4.0
45 - 54 9,340 18.2 7,603 20.0 1,737 22.8 780,420 13.2 726,475 13.6 53,945 7.4
55 - 64 6,630 12.9 4,767 12.5 1,863 39.1 677,453 11.4 611,249 11.4 66,204 10.8
65 - 74 2,851 5.6 1,337 3.5 1,514 113.2 509,599 8.6 402,224 7.5 107,375 26.7
75 - 84 687 1.3 483 1.3 204 42.2 285,006 4.8 254,360 4.8 30,646 12.0
85 - 94 226 0.4 158 0.4 68 43.0 117,986 2.0 97,672 1.8 20,314 20.8
95 + 25 0.0 7 0.0 18 257.1 10,002 0.2 7,324 0.1 2,678 36.6
Total 51,290 100.0 38,002 100.0 13,288 35.0 5,926,624 100.0 5,354,039 100.0 572,585 10.7
Median Age 39 39 37 37
(in years)
Sex Ratio (males per 100 females)
65 63 96 97
Philippines-born Total Victorian population
2016 2011 Change 2011-2016 Change 2011-20162016 2011

Figure 2Age and Gender Distribution of Philippines-born and the Total Victorian Population: 2016, 2011
(a) Philippines-born
same as for (a)
(b) Total Victorian Population
Age (years)
Age (years)
05101520253035
0-4
5-9
10-14
15-19
20-24
25-29
30-34
35-39
40-44
45-49
50-54
55-59
60-64
65-69
70-74
75-79
80-84
85+
Males (%) 0 5 10 15 20 25 30 35
0-4
5-9
10-14
15-19
20-24
25-29
30-34
35-39
40-44
45-49
50-54
55-59
60-64
65-69
70-74
75-79
80-84
85+
Females (%)
2011
2016
05101520253035
0-4
5-9
10-14
15-19
20-24
25-29
30-34
35-39
40-44
45-49
50-54
55-59
60-64
65-69
70-74
75-79
80-84
85+
Males (%) 0 5 10 15 20 25 30 35
0-4
5-9
10-14
15-19
20-24
25-29
30-34
35-39
40-44
45-49
50-54
55-59
60-64
65-69
70-74
75-79
80-84
85+
Females (%)
2011
2016
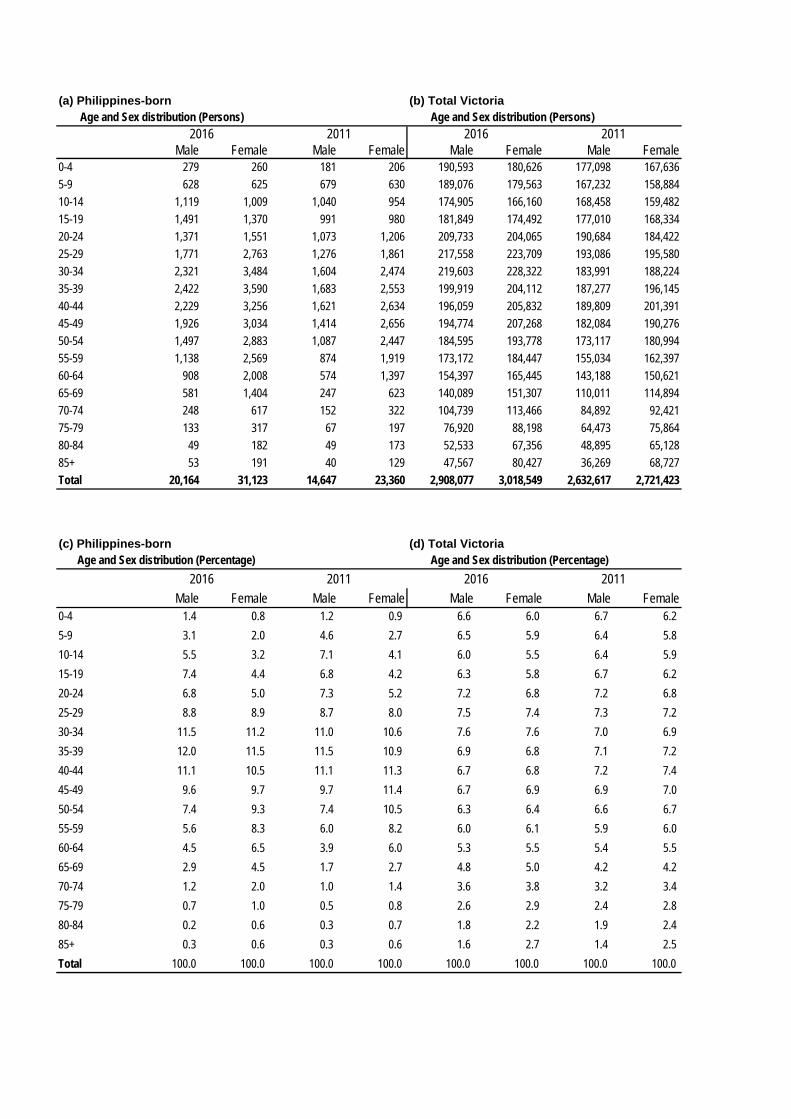
Age and Sex distribution (Persons) Age and Sex distribution (Persons)
Male Female Male Female Male Female Male Female0-4 279 260 181 206 190,593 180,626 177,098 167,6365-9 628 625 679 630 189,076 179,563 167,232 158,88410-14 1,119 1,009 1,040 954 174,905 166,160 168,458 159,48215-19 1,491 1,370 991 980 181,849 174,492 177,010 168,33420-24 1,371 1,551 1,073 1,206 209,733 204,065 190,684 184,42225-29 1,771 2,763 1,276 1,861 217,558 223,709 193,086 195,58030-34 2,321 3,484 1,604 2,474 219,603 228,322 183,991 188,22435-39 2,422 3,590 1,683 2,553 199,919 204,112 187,277 196,14540-44 2,229 3,256 1,621 2,634 196,059 205,832 189,809 201,39145-49 1,926 3,034 1,414 2,656 194,774 207,268 182,084 190,27650-54 1,497 2,883 1,087 2,447 184,595 193,778 173,117 180,99455-59 1,138 2,569 874 1,919 173,172 184,447 155,034 162,39760-64 908 2,008 574 1,397 154,397 165,445 143,188 150,62165-69 581 1,404 247 623 140,089 151,307 110,011 114,89470-74 248 617 152 322 104,739 113,466 84,892 92,42175-79 133 317 67 197 76,920 88,198 64,473 75,86480-84 49 182 49 173 52,533 67,356 48,895 65,12885+ 53 191 40 129 47,567 80,427 36,269 68,727Total 20,164 31,123 14,647 23,360 2,908,077 3,018,549 2,632,617 2,721,423
Age and Sex distribution (Percentage) Age and Sex distribution (Percentage)
Male Female Male Female Male Female Male Female0-4 1.4 0.8 1.2 0.9 6.6 6.0 6.7 6.25-9 3.1 2.0 4.6 2.7 6.5 5.9 6.4 5.810-14 5.5 3.2 7.1 4.1 6.0 5.5 6.4 5.915-19 7.4 4.4 6.8 4.2 6.3 5.8 6.7 6.220-24 6.8 5.0 7.3 5.2 7.2 6.8 7.2 6.825-29 8.8 8.9 8.7 8.0 7.5 7.4 7.3 7.230-34 11.5 11.2 11.0 10.6 7.6 7.6 7.0 6.935-39 12.0 11.5 11.5 10.9 6.9 6.8 7.1 7.240-44 11.1 10.5 11.1 11.3 6.7 6.8 7.2 7.445-49 9.6 9.7 9.7 11.4 6.7 6.9 6.9 7.050-54 7.4 9.3 7.4 10.5 6.3 6.4 6.6 6.755-59 5.6 8.3 6.0 8.2 6.0 6.1 5.9 6.060-64 4.5 6.5 3.9 6.0 5.3 5.5 5.4 5.565-69 2.9 4.5 1.7 2.7 4.8 5.0 4.2 4.270-74 1.2 2.0 1.0 1.4 3.6 3.8 3.2 3.475-79 0.7 1.0 0.5 0.8 2.6 2.9 2.4 2.880-84 0.2 0.6 0.3 0.7 1.8 2.2 1.9 2.485+ 0.3 0.6 0.3 0.6 1.6 2.7 1.4 2.5Total 100.0 100.0 100.0 100.0 100.0 100.0 100.0 100.0
(b) Total Victoria
2016 2011
2016 2011
(d) Total Victoria
(a) Philippines-born
2016 2011
(c) Philippines-born
2016 2011

Table 7Filipino Ancestry, Total Responses by Top Twenty Local Government Areas, Victoria, 2016, 2011
Local Government Area
Total responses
% oftotal
Total responses
% oftotal
Total responses
%change
Wyndham (C) 7,632 11.2 5,184 10.4 2,448 47.2
Brimbank (C) 7,621 11.2 6,640 13.3 981 14.8
Casey (C) 6,235 9.1 4,422 8.8 1,813 41.0
Melton (C) 5,535 8.1 3,802 7.6 1,733 45.6
Hume (C) 3,482 5.1 2,662 5.3 820 30.8
Whittlesea (C) 3,127 4.6 2,071 4.1 1,056 51.0
Greater Dandenong (C) 2,469 3.6 1,912 3.8 557 29.1
Kingston (C) 1,849 2.7 1,490 3.0 359 24.1
Knox (C) 1,773 2.6 1,463 2.9 310 21.2
Greater Geelong (C) 1,700 2.5 1,203 2.4 497 41.3
Moreland (C) 1,597 2.3 1,211 2.4 386 31.9
Monash (C) 1,538 2.3 1,254 2.5 284 22.6
Frankston (C) 1,503 2.2 1,204 2.4 299 24.8
Maribyrnong (C) 1,449 2.1 1,026 2.0 423 41.2
Hobsons Bay (C) 1,373 2.0 1,299 2.6 74 5.7
Melbourne (C) 1,339 2.0 653 1.3 686 105.1
Whitehorse (C) 1,292 1.9 975 1.9 317 32.5
Darebin (C) 1,266 1.9 945 1.9 321 34.0
Glen Eira (C) 942 1.4 617 1.2 325 52.7
Moonee Valley (C) 923 1.4 732 1.5 191 26.1
Other LGAs(a) 13,669 20.0 9,300 18.6 4,369 47.0
Victoria 68,314 100.0 50,065 100.0 18,249 36.5
Note: This table selects all those in Victoria (not limited to the Philippines-born subgroup) identifying with Filipino ancestry.(a)Other Local Government Areas include "No usual address" and "Unincorporated Victoria".(b)Respondents have the option of providing more than one response but only the first two responses are coded. Total responses may exceed total persons.
This table is based on the ancestry with the most responses for Philippines-born persons.
2016 2011 Change 2011-2016
Total Filipino ancestry, First and Second Responses(b)

Table 8Country of Birth (Top Twenty plus Australia) of Persons of Filipino Ancestry,Victoria: 2016, 2011
Total responses
% oftotal
Total responses
% of total
Total responses
%change
Australia 18,713 27.4 13,198 26.4 5,515 41.8
Philippines 46,485 68.0 34,873 69.7 11,612 33.3
New Zealand 593 0.9 307 0.6 286 93.2
England 348 0.5 238 0.5 110 46.2
Singapore 216 0.3 88 0.2 128 145.5
USA 200 0.3 141 0.3 59 41.8
Saudi Arabia 98 0.1 79 0.2 19 24.1
Hong Kong 74 0.1 40 0.1 34 85.0
Canada 62 0.1 26 0.1 36 138.5
United Arab Emirates 55 0.1 24 0.0 31 129.2
Malaysia 50 0.1 33 0.1 17 51.5
Vietnam 45 0.1 29 0.1 16 55.2
Japan 37 0.1 23 0.0 14 60.9
Ireland 35 0.1 13 0.0 22 169.2
Thailand 30 0.0 24 0.0 6 25.0
Papua New Guinea 29 0.0 27 0.1 2 7.4
Indonesia 28 0.0 16 0.0 12 75.0
Germany 22 0.0 18 0.0 4 22.2
Kuwait 22 0.0 9 0.0 13 144.4
South Africa 16 0.0 9 0.0 7 77.8
Italy 10 0.0 - - 10 -
Other countries 192 0.3 179 0.4 13 7.3
Not stated etc(a) 954 1.4 671 1.3 283 42.2Total responses, Filipino ancestry 68,314 100.0 50,065 100.0 18,249 36.5
Note: The ranking of countries of birth in this table is based on the most total responses (First and Second responses) for Filipino ancestry.(a)Includes "Inadequately described" and, "At sea".(b)Respondents have the option of providing more than one response but only the first two responses are coded. Total responses may
exceed total persons.
Country of birth of persons of Filipino ancestry
Persons identifying with Filipino ancestry(b)
2016 2011 Change 2011-2016
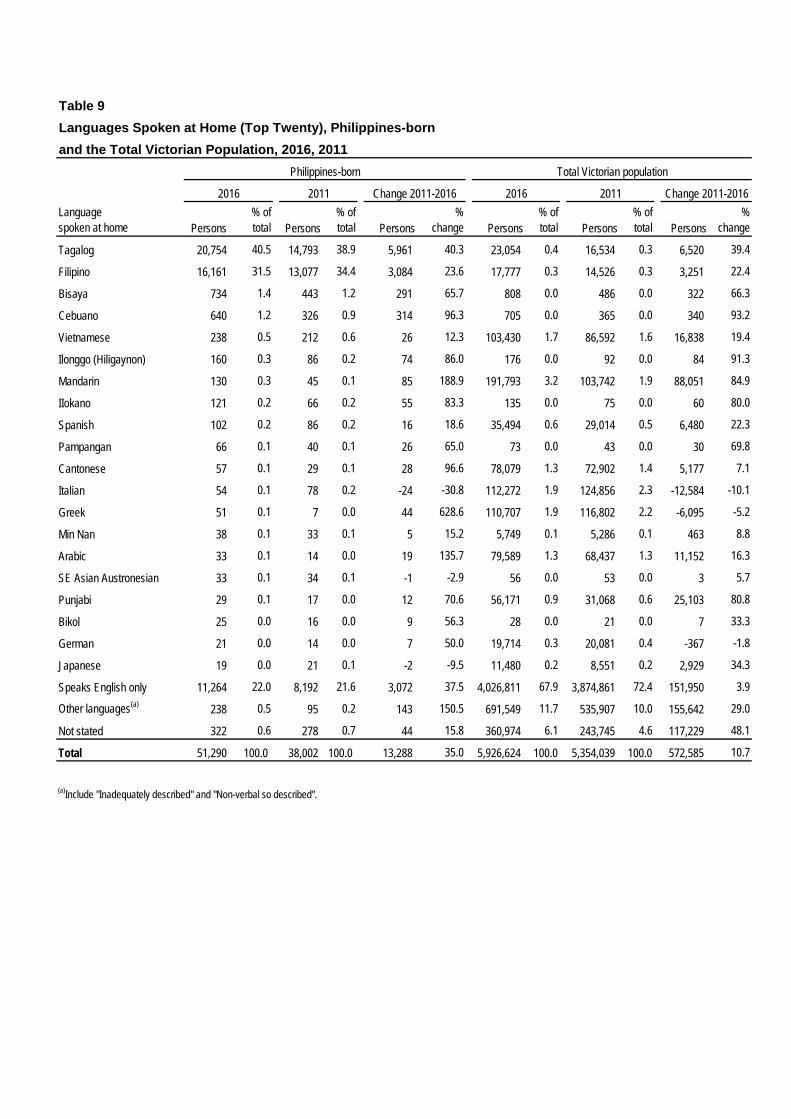
Table 9Languages Spoken at Home (Top Twenty), Philippines-bornand the Total Victorian Population, 2016, 2011
Languagespoken at home Persons
% of total Persons
% of total Persons
% change Persons
% of total Persons
% of total Persons
%change
Tagalog 20,754 40.5 14,793 38.9 5,961 40.3 23,054 0.4 16,534 0.3 6,520 39.4
Filipino 16,161 31.5 13,077 34.4 3,084 23.6 17,777 0.3 14,526 0.3 3,251 22.4
Bisaya 734 1.4 443 1.2 291 65.7 808 0.0 486 0.0 322 66.3
Cebuano 640 1.2 326 0.9 314 96.3 705 0.0 365 0.0 340 93.2
Vietnamese 238 0.5 212 0.6 26 12.3 103,430 1.7 86,592 1.6 16,838 19.4
Ilonggo (Hiligaynon) 160 0.3 86 0.2 74 86.0 176 0.0 92 0.0 84 91.3
Mandarin 130 0.3 45 0.1 85 188.9 191,793 3.2 103,742 1.9 88,051 84.9
IIokano 121 0.2 66 0.2 55 83.3 135 0.0 75 0.0 60 80.0
Spanish 102 0.2 86 0.2 16 18.6 35,494 0.6 29,014 0.5 6,480 22.3
Pampangan 66 0.1 40 0.1 26 65.0 73 0.0 43 0.0 30 69.8
Cantonese 57 0.1 29 0.1 28 96.6 78,079 1.3 72,902 1.4 5,177 7.1
Italian 54 0.1 78 0.2 -24 -30.8 112,272 1.9 124,856 2.3 -12,584 -10.1
Greek 51 0.1 7 0.0 44 628.6 110,707 1.9 116,802 2.2 -6,095 -5.2
Min Nan 38 0.1 33 0.1 5 15.2 5,749 0.1 5,286 0.1 463 8.8
Arabic 33 0.1 14 0.0 19 135.7 79,589 1.3 68,437 1.3 11,152 16.3
SE Asian Austronesian 33 0.1 34 0.1 -1 -2.9 56 0.0 53 0.0 3 5.7
Punjabi 29 0.1 17 0.0 12 70.6 56,171 0.9 31,068 0.6 25,103 80.8
Bikol 25 0.0 16 0.0 9 56.3 28 0.0 21 0.0 7 33.3
German 21 0.0 14 0.0 7 50.0 19,714 0.3 20,081 0.4 -367 -1.8
Japanese 19 0.0 21 0.1 -2 -9.5 11,480 0.2 8,551 0.2 2,929 34.3
Speaks English only 11,264 22.0 8,192 21.6 3,072 37.5 4,026,811 67.9 3,874,861 72.4 151,950 3.9
Other languages(a) 238 0.5 95 0.2 143 150.5 691,549 11.7 535,907 10.0 155,642 29.0
Not stated 322 0.6 278 0.7 44 15.8 360,974 6.1 243,745 4.6 117,229 48.1
Total 51,290 100.0 38,002 100.0 13,288 35.0 5,926,624 100.0 5,354,039 100.0 572,585 10.7
(a)Include "Inadequately described" and "Non-verbal so described".
Philippines-born Total Victorian population
2016 2011 Change 2011-2016 2016 2011 Change 2011-2016
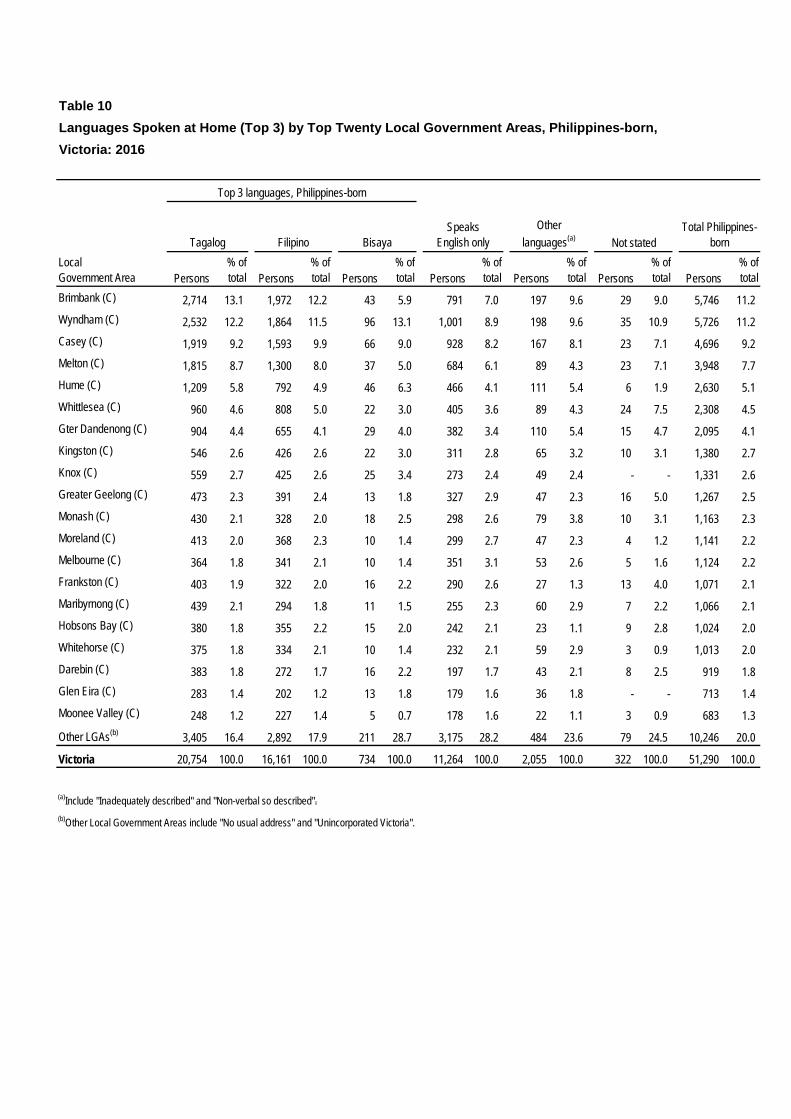
Table 10Languages Spoken at Home (Top 3) by Top Twenty Local Government Areas, Philippines-born, Victoria: 2016
LocalGovernment Area Persons
% of total Persons
% of total Persons
% of total Persons
% of total Persons
% of total Persons
% of total Persons
% of total
Brimbank (C) 2,714 13.1 1,972 12.2 43 5.9 791 7.0 197 9.6 29 9.0 5,746 11.2Wyndham (C) 2,532 12.2 1,864 11.5 96 13.1 1,001 8.9 198 9.6 35 10.9 5,726 11.2Casey (C) 1,919 9.2 1,593 9.9 66 9.0 928 8.2 167 8.1 23 7.1 4,696 9.2Melton (C) 1,815 8.7 1,300 8.0 37 5.0 684 6.1 89 4.3 23 7.1 3,948 7.7Hume (C) 1,209 5.8 792 4.9 46 6.3 466 4.1 111 5.4 6 1.9 2,630 5.1Whittlesea (C) 960 4.6 808 5.0 22 3.0 405 3.6 89 4.3 24 7.5 2,308 4.5Gter Dandenong (C) 904 4.4 655 4.1 29 4.0 382 3.4 110 5.4 15 4.7 2,095 4.1Kingston (C) 546 2.6 426 2.6 22 3.0 311 2.8 65 3.2 10 3.1 1,380 2.7Knox (C) 559 2.7 425 2.6 25 3.4 273 2.4 49 2.4 - - 1,331 2.6Greater Geelong (C) 473 2.3 391 2.4 13 1.8 327 2.9 47 2.3 16 5.0 1,267 2.5Monash (C) 430 2.1 328 2.0 18 2.5 298 2.6 79 3.8 10 3.1 1,163 2.3Moreland (C) 413 2.0 368 2.3 10 1.4 299 2.7 47 2.3 4 1.2 1,141 2.2Melbourne (C) 364 1.8 341 2.1 10 1.4 351 3.1 53 2.6 5 1.6 1,124 2.2Frankston (C) 403 1.9 322 2.0 16 2.2 290 2.6 27 1.3 13 4.0 1,071 2.1Maribyrnong (C) 439 2.1 294 1.8 11 1.5 255 2.3 60 2.9 7 2.2 1,066 2.1Hobsons Bay (C) 380 1.8 355 2.2 15 2.0 242 2.1 23 1.1 9 2.8 1,024 2.0Whitehorse (C) 375 1.8 334 2.1 10 1.4 232 2.1 59 2.9 3 0.9 1,013 2.0Darebin (C) 383 1.8 272 1.7 16 2.2 197 1.7 43 2.1 8 2.5 919 1.8Glen Eira (C) 283 1.4 202 1.2 13 1.8 179 1.6 36 1.8 - - 713 1.4Moonee Valley (C) 248 1.2 227 1.4 5 0.7 178 1.6 22 1.1 3 0.9 683 1.3
Other LGAs(b) 3,405 16.4 2,892 17.9 211 28.7 3,175 28.2 484 23.6 79 24.5 10,246 20.0
Victoria 20,754 100.0 16,161 100.0 734 100.0 11,264 100.0 2,055 100.0 322 100.0 51,290 100.0
(a)Include "Inadequately described" and "Non-verbal so described".(b)Other Local Government Areas include "No usual address" and "Unincorporated Victoria".
Total Philippines-born
Top 3 languages, Philippines-born
Tagalog Filipino Bisaya Not statedSpeaks
English onlyOther
languages(a)

Table 11Proficiency in Spoken English, Philippines-born and the Total Victorian Population: 2016, 2011
Persons% of total Persons
% of total Persons
% change Persons
% of total Persons
% of total Persons
%change
Speaks English only 11,264 22.0 8,192 21.6 3,072 37.5 4,026,811 67.9 3,874,861 72.4 151,950 3.9 Speaks other languages & speaks English:
Very well 27,161 53.0 20,314 53.5 6,847 33.7 854,437 14.4 691,030 12.9 163,407 23.6
Well 11,344 22.1 8,316 21.9 3,028 36.4 419,756 7.1 332,894 6.2 86,862 26.1
Not well 967 1.9 725 1.9 242 33.4 204,807 3.5 167,831 3.1 36,976 22.0
Not at all 88 0.2 56 0.1 32 57.1 61,277 1.0 44,804 0.8 16,473 36.8
Not stated (b) 459 0.9 405 1.1 54 13.3 359,543 6.1 242,618 4.5 116,925 48.2
Total 51,290 100.0 38,002 100.0 13,288 35.0 5,926,624 100.0 5,354,039 100.0 572,585 10.7
(a)This is a self-assessment. (b)Not stated includes "Language or English proficiency not stated" and "Both language and English proficiency not stated".
Philippines-born Total Victorian population
2011 Change 2011-2016Proficiency in spoken English(a)
20162016 2011Change 2011-
2016

Table 12Proficiency in Spoken English by Top Twenty Local Government Areas,Philippines-born, Victoria: 2016
LocalGovernment Area Persons
% of total Persons
% of total Persons
% of total Persons
% of total Persons
% of total Persons
% of total Persons
% of total
Brimbank (C) 791 13.8 3,191 55.5 1,530 26.6 172 3.0 10 0.2 53 0.9 5,746 100.0Wyndham (C) 1,001 17.5 3,381 59.0 1,183 20.7 91 1.6 7 0.1 63 1.1 5,726 100.0Casey (C) 928 19.8 2,537 54.0 1,099 23.4 78 1.7 4 0.1 52 1.1 4,696 100.0Melton (C) 684 17.3 2,357 59.7 821 20.8 47 1.2 10 0.3 37 0.9 3,948 100.0Hume (C) 466 17.7 1,467 55.8 604 23.0 69 2.6 3 0.1 20 0.8 2,630 100.0Whittlesea (C) 405 17.5 1,346 58.3 492 21.3 45 1.9 6 0.3 13 0.6 2,308 100.0Gter Dandenong (C) 382 18.2 1,103 52.6 542 25.9 53 2.5 4 0.2 11 0.5 2,095 100.0Kingston (C) 311 22.5 728 52.8 307 22.2 21 1.5 3 0.2 8 0.6 1,380 100.0Knox (C) 273 20.5 747 56.1 280 21.0 24 1.8 5 0.4 11 0.8 1,331 100.0Greater Geelong (C) 327 25.8 605 47.8 296 23.4 21 1.7 6 0.5 12 0.9 1,267 100.0Monash (C) 298 25.6 658 56.6 173 14.9 26 2.2 3 0.3 8 0.7 1,163 100.0Moreland (C) 299 26.2 546 47.9 261 22.9 20 1.8 - - 14 1.2 1,141 100.0Melbourne (C) 351 31.2 596 53.0 158 14.1 6 0.5 - - 6 0.5 1,124 100.0Frankston (C) 290 27.1 523 48.8 234 21.8 10 0.9 3 0.3 15 1.4 1,071 100.0Maribyrnong (C) 255 23.9 547 51.3 225 21.1 32 3.0 3 0.3 5 0.5 1,066 100.0Hobsons Bay (C) 242 23.6 487 47.6 265 25.9 18 1.8 3 0.3 12 1.2 1,024 100.0Whitehorse (C) 232 22.9 563 55.6 200 19.7 6 0.6 - - 5 0.5 1,013 100.0Darebin (C) 197 21.4 441 48.0 236 25.7 18 2.0 - - 15 1.6 919 100.0Glen Eira (C) 179 25.1 361 50.6 158 22.2 5 0.7 3 0.4 5 0.7 713 100.0Moonee Valley (C) 178 26.1 379 55.5 112 16.4 13 1.9 3 0.4 - - 683 100.0Other LGAs(c) 3,175 31.0 4,598 44.9 2,168 21.2 192 1.9 12 0.1 94 0.9 10,246 100.0
Victoria 11,264 22.0 27,161 53.0 11,344 22.1 967 1.9 88 0.2 459 0.9 51,290 100.0
(a)This is a self-assessment. (b)Not stated includes "Language or English proficiency not stated" and "Both language and English proficiency not stated".(c)Other Local Government Areas include "No usual address" and "Unincorporated Victoria".
Total Philippines-born
Speaks English only
Speaks other languages and speaks English (a) :
Very well Well Not well Not at all Not stated(b)
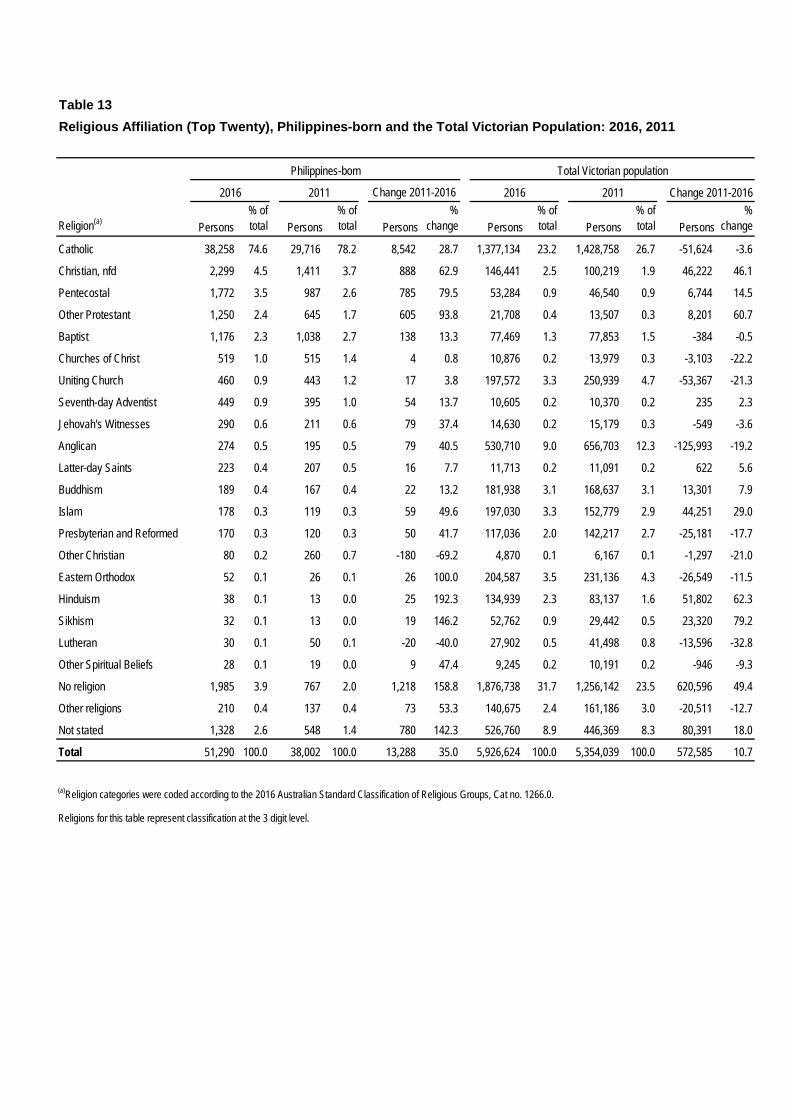
Table 13Religious Affiliation (Top Twenty), Philippines-born and the Total Victorian Population: 2016, 2011
Religion(a) Persons% of total Persons
% of total Persons
% change Persons
% of total Persons
% of total Persons
%change
Catholic 38,258 74.6 29,716 78.2 8,542 28.7 1,377,134 23.2 1,428,758 26.7 -51,624 -3.6
Christian, nfd 2,299 4.5 1,411 3.7 888 62.9 146,441 2.5 100,219 1.9 46,222 46.1
Pentecostal 1,772 3.5 987 2.6 785 79.5 53,284 0.9 46,540 0.9 6,744 14.5
Other Protestant 1,250 2.4 645 1.7 605 93.8 21,708 0.4 13,507 0.3 8,201 60.7
Baptist 1,176 2.3 1,038 2.7 138 13.3 77,469 1.3 77,853 1.5 -384 -0.5
Churches of Christ 519 1.0 515 1.4 4 0.8 10,876 0.2 13,979 0.3 -3,103 -22.2
Uniting Church 460 0.9 443 1.2 17 3.8 197,572 3.3 250,939 4.7 -53,367 -21.3
Seventh-day Adventist 449 0.9 395 1.0 54 13.7 10,605 0.2 10,370 0.2 235 2.3
Jehovah's Witnesses 290 0.6 211 0.6 79 37.4 14,630 0.2 15,179 0.3 -549 -3.6
Anglican 274 0.5 195 0.5 79 40.5 530,710 9.0 656,703 12.3 -125,993 -19.2
Latter-day Saints 223 0.4 207 0.5 16 7.7 11,713 0.2 11,091 0.2 622 5.6
Buddhism 189 0.4 167 0.4 22 13.2 181,938 3.1 168,637 3.1 13,301 7.9
Islam 178 0.3 119 0.3 59 49.6 197,030 3.3 152,779 2.9 44,251 29.0
Presbyterian and Reformed 170 0.3 120 0.3 50 41.7 117,036 2.0 142,217 2.7 -25,181 -17.7
Other Christian 80 0.2 260 0.7 -180 -69.2 4,870 0.1 6,167 0.1 -1,297 -21.0
Eastern Orthodox 52 0.1 26 0.1 26 100.0 204,587 3.5 231,136 4.3 -26,549 -11.5
Hinduism 38 0.1 13 0.0 25 192.3 134,939 2.3 83,137 1.6 51,802 62.3
Sikhism 32 0.1 13 0.0 19 146.2 52,762 0.9 29,442 0.5 23,320 79.2
Lutheran 30 0.1 50 0.1 -20 -40.0 27,902 0.5 41,498 0.8 -13,596 -32.8
Other Spiritual Beliefs 28 0.1 19 0.0 9 47.4 9,245 0.2 10,191 0.2 -946 -9.3
No religion 1,985 3.9 767 2.0 1,218 158.8 1,876,738 31.7 1,256,142 23.5 620,596 49.4
Other religions 210 0.4 137 0.4 73 53.3 140,675 2.4 161,186 3.0 -20,511 -12.7
Not stated 1,328 2.6 548 1.4 780 142.3 526,760 8.9 446,369 8.3 80,391 18.0
Total 51,290 100.0 38,002 100.0 13,288 35.0 5,926,624 100.0 5,354,039 100.0 572,585 10.7
(a)Religion categories were coded according to the 2016 Australian Standard Classification of Religious Groups, Cat no. 1266.0.
Religions for this table represent classification at the 3 digit level.
Philippines-born Total Victorian population
2016 2011 Change 2011-2016 2016 2011 Change 2011-2016
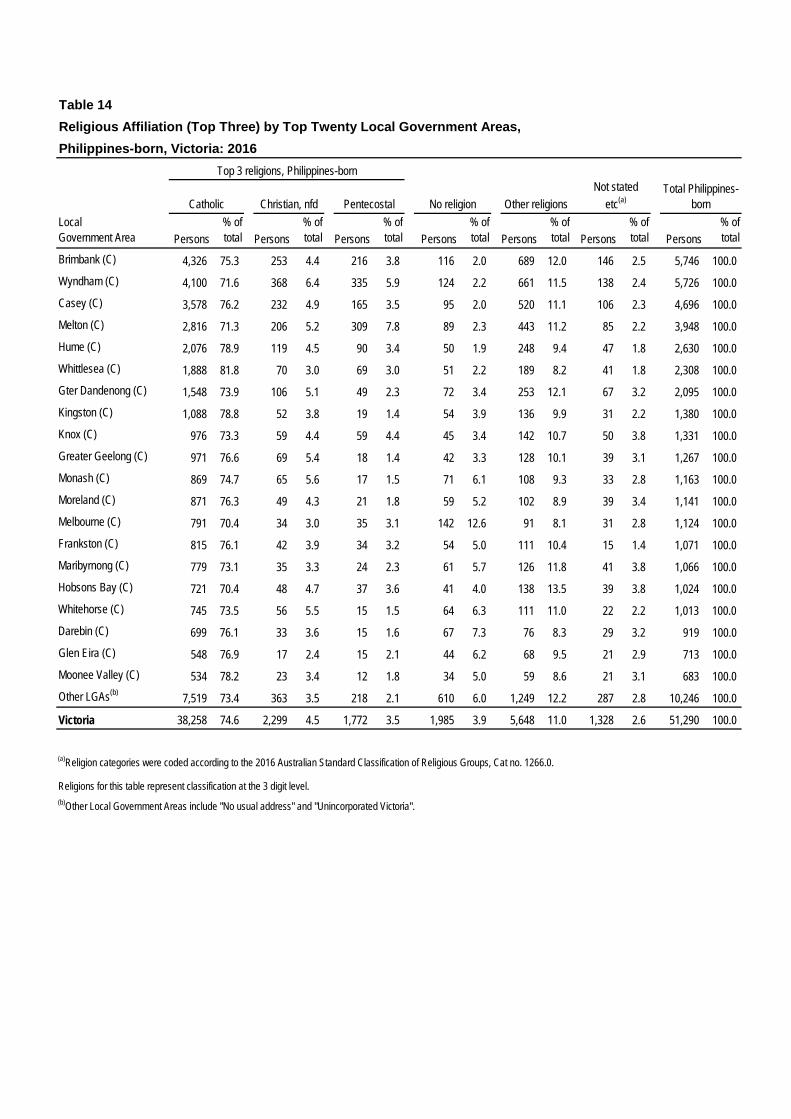
Table 14Religious Affiliation (Top Three) by Top Twenty Local Government Areas,Philippines-born, Victoria: 2016
LocalGovernment Area Persons
% of total Persons
% of total Persons
% of total Persons
% of total Persons
% of total Persons
% of total Persons
% of total
Brimbank (C) 4,326 75.3 253 4.4 216 3.8 116 2.0 689 12.0 146 2.5 5,746 100.0Wyndham (C) 4,100 71.6 368 6.4 335 5.9 124 2.2 661 11.5 138 2.4 5,726 100.0Casey (C) 3,578 76.2 232 4.9 165 3.5 95 2.0 520 11.1 106 2.3 4,696 100.0Melton (C) 2,816 71.3 206 5.2 309 7.8 89 2.3 443 11.2 85 2.2 3,948 100.0Hume (C) 2,076 78.9 119 4.5 90 3.4 50 1.9 248 9.4 47 1.8 2,630 100.0Whittlesea (C) 1,888 81.8 70 3.0 69 3.0 51 2.2 189 8.2 41 1.8 2,308 100.0Gter Dandenong (C) 1,548 73.9 106 5.1 49 2.3 72 3.4 253 12.1 67 3.2 2,095 100.0Kingston (C) 1,088 78.8 52 3.8 19 1.4 54 3.9 136 9.9 31 2.2 1,380 100.0Knox (C) 976 73.3 59 4.4 59 4.4 45 3.4 142 10.7 50 3.8 1,331 100.0Greater Geelong (C) 971 76.6 69 5.4 18 1.4 42 3.3 128 10.1 39 3.1 1,267 100.0Monash (C) 869 74.7 65 5.6 17 1.5 71 6.1 108 9.3 33 2.8 1,163 100.0Moreland (C) 871 76.3 49 4.3 21 1.8 59 5.2 102 8.9 39 3.4 1,141 100.0Melbourne (C) 791 70.4 34 3.0 35 3.1 142 12.6 91 8.1 31 2.8 1,124 100.0Frankston (C) 815 76.1 42 3.9 34 3.2 54 5.0 111 10.4 15 1.4 1,071 100.0Maribyrnong (C) 779 73.1 35 3.3 24 2.3 61 5.7 126 11.8 41 3.8 1,066 100.0Hobsons Bay (C) 721 70.4 48 4.7 37 3.6 41 4.0 138 13.5 39 3.8 1,024 100.0Whitehorse (C) 745 73.5 56 5.5 15 1.5 64 6.3 111 11.0 22 2.2 1,013 100.0Darebin (C) 699 76.1 33 3.6 15 1.6 67 7.3 76 8.3 29 3.2 919 100.0Glen Eira (C) 548 76.9 17 2.4 15 2.1 44 6.2 68 9.5 21 2.9 713 100.0Moonee Valley (C) 534 78.2 23 3.4 12 1.8 34 5.0 59 8.6 21 3.1 683 100.0Other LGAs(b) 7,519 73.4 363 3.5 218 2.1 610 6.0 1,249 12.2 287 2.8 10,246 100.0
Victoria 38,258 74.6 2,299 4.5 1,772 3.5 1,985 3.9 5,648 11.0 1,328 2.6 51,290 100.0
(a)Religion categories were coded according to the 2016 Australian Standard Classification of Religious Groups, Cat no. 1266.0.
Religions for this table represent classification at the 3 digit level.(b)Other Local Government Areas include "No usual address" and "Unincorporated Victoria".
Total Philippines-born
Top 3 religions, Philippines-born
Catholic Christian, nfd Pentecostal No religion Other religionsNot stated
etc(a)
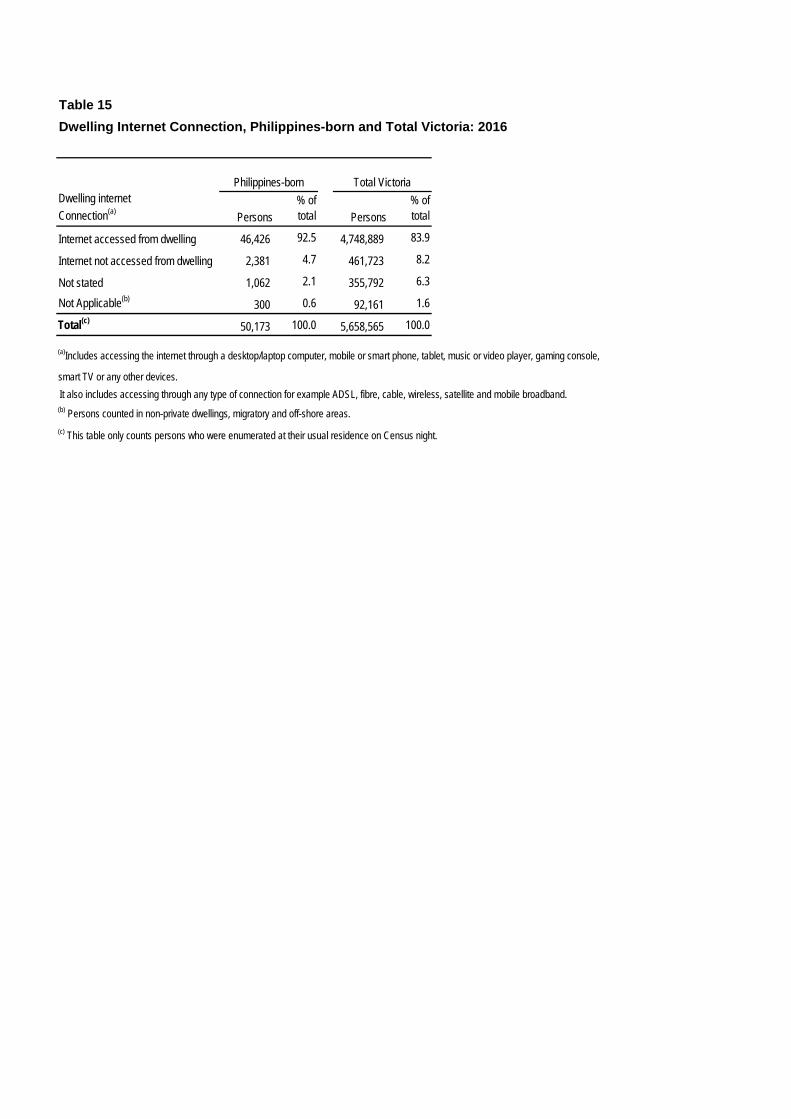
Table 15Dwelling Internet Connection, Philippines-born and Total Victoria: 2016
Dwelling internetConnection(a) Persons
% of total Persons
% of total
Internet accessed from dwelling 46,426 92.5 4,748,889 83.9
Internet not accessed from dwelling 2,381 4.7 461,723 8.2
Not stated 1,062 2.1 355,792 6.3
Not Applicable(b) 300 0.6 92,161 1.6
Total(c) 50,173 100.0 5,658,565 100.0
(a)Includes accessing the internet through a desktop/laptop computer, mobile or smart phone, tablet, music or video player, gaming console,
smart TV or any other devices. It also includes accessing through any type of connection for example ADSL, fibre, cable, wireless, satellite and mobile broadband.(b) Persons counted in non-private dwellings, migratory and off-shore areas.(c) This table only counts persons who were enumerated at their usual residence on Census night.
Philippines-born Total Victoria

Table 16Dwelling internet Connection by Top Ten Local Government Areas,Philippines-born, Victoria: 2016
Persons% oftotal Persons
% oftotal Persons
% oftotal Persons
% oftotal Persons
% oftotal
Brimbank (C) 5,250 93.1 266 4.7 109 1.9 13 0.2 5,638 100.0Wyndham (C) 5,410 95.9 121 2.1 101 1.8 7 0.1 5,641 100.0Casey (C) 4,396 95.2 131 2.8 90 1.9 3 0.1 4,617 100.0Melton (C) 3,760 96.5 81 2.1 49 1.3 7 0.2 3,898 100.0Hume (C) 2,414 93.5 101 3.9 55 2.1 8 0.3 2,582 100.0Whittlesea (C) 2,125 94.3 85 3.8 41 1.8 10 0.4 2,253 100.0Greater Dandenong (C) 1,836 89.8 140 6.8 65 3.2 10 0.5 2,045 100.0Kingston (C) 1,277 93.3 60 4.4 25 1.8 6 0.4 1,369 100.0Knox (C) 1,265 96.4 29 2.2 16 1.2 5 0.4 1,312 100.0Greater Geelong (C) 1,074 87.1 102 8.3 42 3.4 21 1.7 1,233 100.0Other LGAs(b) 17,619 90.0 1,265 6.5 469 2.4 210 1.1 19,585 100.0Victoria(c) 46,426 92.5 2,381 4.7 1,062 2.1 300 0.6 50,173 100.0
(a)Includes accessing the internet through a desktop/laptop computer, mobile or smart phone, tablet, music or video player, gaming console, smart
TV or any other devices. It also includes accessing through any type of connection for example ADSL, fibre, cable, wireless, satellite and mobile broadband.(b)Other Local Government Areas include "No usual address" and "Unincorporated Victoria".(c) This table only counts persons who were enumerated at their usual residence on Census night.(d) Persons counted in non-private dwellings, migratory and off-shore areas.
Not statedNot
applicable(d)
Philippines-born
TotalPhilippines-born
Dwelling internetConnection(a)
Internet accessed from dwelling(c)
Internet not accessed from
dwelling

Table 17Highest Level of Educational Attainment, Philippines-born and Total Victoria: 2016, 2011
Highest level ofeducational attainment(a) Persons
% of total Persons
% of total Persons
% change Persons
% of total Persons
% of total Persons
%change
Postgraduate Degree 1,600 3.4 851 2.5 749 88.0 260,039 5.4 170,382 3.9 89,657 52.6
Grad Dip & Grad Cert 607 1.3 312 0.9 295 94.6 119,226 2.5 95,352 2.2 23,874 25.0
Bachelor Degree 18,910 39.9 13,042 38.0 5,868 45.0 798,270 16.5 641,219 14.7 157,051 24.5
Advanced Dip & Diploma 3,811 8.0 2,474 7.2 1,337 54.0 447,023 9.2 364,758 8.4 82,265 22.6
Certificate 5,679 12.0 3,847 11.2 1,832 47.6 698,036 14.4 614,689 14.1 83,347 13.6School Education only(b) 13,125 27.7 10,376 30.2 2,749 26.5 1,877,183 38.7 1,876,620 43.1 563 0.0No Educational Attainment(c) 197 0.4 105 0.3 92 87.6 48,920 1.0 41,809 1.0 7,111 17.0Not stated etc(d) 3,452 7.3 3,310 9.6 142 4.3 597,010 12.3 550,419 12.6 46,591 8.5
Total 47,375 100.0 34,317 100.0 13,058 38.1 4,845,710 100.0 4,355,243 100.0 490,467 11.3
(a)This variable is applicable to persons aged 15 years and over.(b)Includes persons with highest educational attainment between Year 8 or below and Year 12 level.(c)Includes persons whose qualification is out of scope of this variable.(d)Includes "Inadequately described".
Philippines-born Total Victoria2016 2011 Change 2011-2016 2016 2011 Change 2011-2016

Table 18Highest Level of Educational Attainment by Top Ten LGAs, Philippines-born, Victoria: 2016
Highest level of educational attainment(a), Philippines-born (Persons)
LocalGovernment Area (LGA)
Post-graduate degree
Grad Dip & Grad Cert
Bachelor Degree
Advanced Dip & Dip
Certi-ficate
School education
only(b)
No educa-tional
attainment(c)Not Stated
etc.(d) Persons% oftotal
Brimbank (C) 116 37 2,042 427 741 1,584 29 395 5,371 11.3Wyndham (C) 155 69 2,240 437 627 1,397 18 280 5,227 11.0Casey (C) 105 36 1,526 341 562 1,319 14 333 4,238 8.9Melton (C) 87 45 1,621 336 438 921 14 196 3,658 7.7Hume (C) 75 26 945 246 276 705 8 164 2,449 5.2Whittlesea (C) 69 31 922 188 285 535 3 126 2,158 4.6Greater Dandenong (C) 44 17 682 154 275 606 5 166 1,948 4.1Kingston (C) 40 16 515 120 180 335 8 85 1,300 2.7Knox (C) 34 24 564 93 147 332 - 64 1,256 2.7Greater Geelong (C) 18 9 340 85 173 411 - 116 1,160 2.4Other LGAs(e) 857 297 7,513 1,384 1,975 4,980 98 1,527 18,610 39.3
Victoria 1,600 607 18,910 3,811 5,679 13,125 197 3,452 47,375 100.0
Highest level of educational attainment(a), Philippines-born (Percentage)
LocalGovernment Area (LGA)
Post-graduate degree
Grad Dip & Grad Cert
Bachelor Degree
Advanced Dip & Dip
Certi-ficate
School education
only(b)
No educa-tional
attainment(c)Not Stated
etc.(d) Persons% oftotal
Brimbank (C) 2.2 0.7 38.0 8.0 13.8 29.5 0.5 7.4 5,371 100.0Wyndham (C) 3.0 1.3 42.9 8.4 12.0 26.7 0.3 5.4 5,227 100.0Casey (C) 2.5 0.8 36.0 8.0 13.3 31.1 0.3 7.9 4,238 100.0Melton (C) 2.4 1.2 44.3 9.2 12.0 25.2 0.4 5.4 3,658 100.0Hume (C) 3.1 1.1 38.6 10.0 11.3 28.8 0.3 6.7 2,449 100.0Whittlesea (C) 3.2 1.4 42.7 8.7 13.2 24.8 0.1 5.8 2,158 100.0Greater Dandenong (C) 2.3 0.9 35.0 7.9 14.1 31.1 0.3 8.5 1,948 100.0Kingston (C) 3.1 1.2 39.6 9.2 13.8 25.8 0.6 6.5 1,300 100.0Knox (C) 2.7 1.9 44.9 7.4 11.7 26.4 - 5.1 1,256 100.0Greater Geelong (C) 1.6 0.8 29.3 7.3 14.9 35.4 - 10.0 1,160 100.0Other LGAs(e) 4.6 1.6 40.4 7.4 10.6 26.8 0.5 8.2 18,610 100.0
Victoria 3.4 1.3 39.9 8.0 12.0 27.7 0.4 7.3 47,375 100.0
(a)This variable is applicable to persons aged 15 years and over.(b)Includes persons with highest educational attainment between Year 8 or below and Year 12 level.(c)Includes persons whose qualification is out of scope of this variable.(d)Includes "Inadequately described".(e)Other Local Government Areas includes "No usual address" and "Unincorporated Victoria".
Total
Total
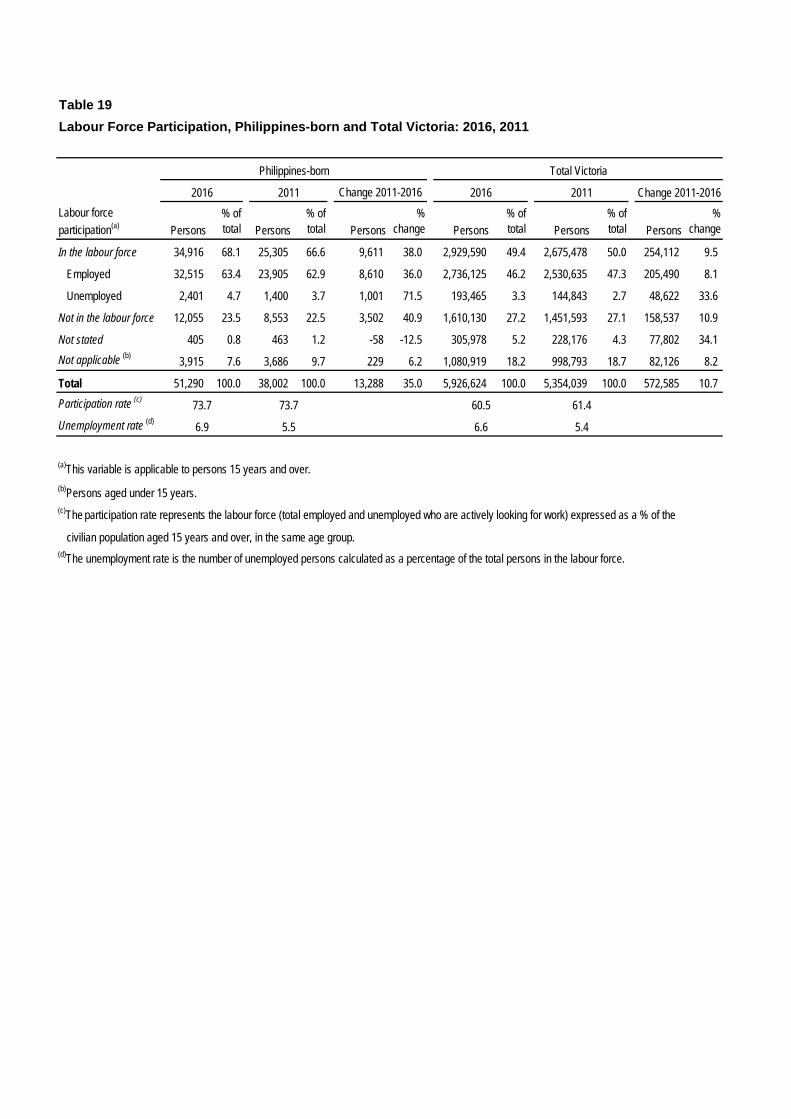
Table 19Labour Force Participation, Philippines-born and Total Victoria: 2016, 2011
Persons% of total Persons
% of total Persons
% change Persons
% of total Persons
% of total Persons
%change
In the labour force 34,916 68.1 25,305 66.6 9,611 38.0 2,929,590 49.4 2,675,478 50.0 254,112 9.5
Employed 32,515 63.4 23,905 62.9 8,610 36.0 2,736,125 46.2 2,530,635 47.3 205,490 8.1
Unemployed 2,401 4.7 1,400 3.7 1,001 71.5 193,465 3.3 144,843 2.7 48,622 33.6
Not in the labour force 12,055 23.5 8,553 22.5 3,502 40.9 1,610,130 27.2 1,451,593 27.1 158,537 10.9
Not stated 405 0.8 463 1.2 -58 -12.5 305,978 5.2 228,176 4.3 77,802 34.1Not applicable (b) 3,915 7.6 3,686 9.7 229 6.2 1,080,919 18.2 998,793 18.7 82,126 8.2
Total 51,290 100.0 38,002 100.0 13,288 35.0 5,926,624 100.0 5,354,039 100.0 572,585 10.7Participation rate (c)
Unemployment rate (d)
(a)This variable is applicable to persons 15 years and over. (b)Persons aged under 15 years. (c)The participation rate represents the labour force (total employed and unemployed who are actively looking for work) expressed as a % of the
civilian population aged 15 years and over, in the same age group.(d)The unemployment rate is the number of unemployed persons calculated as a percentage of the total persons in the labour force.
Labour force participation(a)
73.7 73.7 60.5 61.4
5.46.9 5.5 6.6
Philippines-born Total Victoria
2016 2011 Change 2011-2016 2016 2011 Change 2011-2016
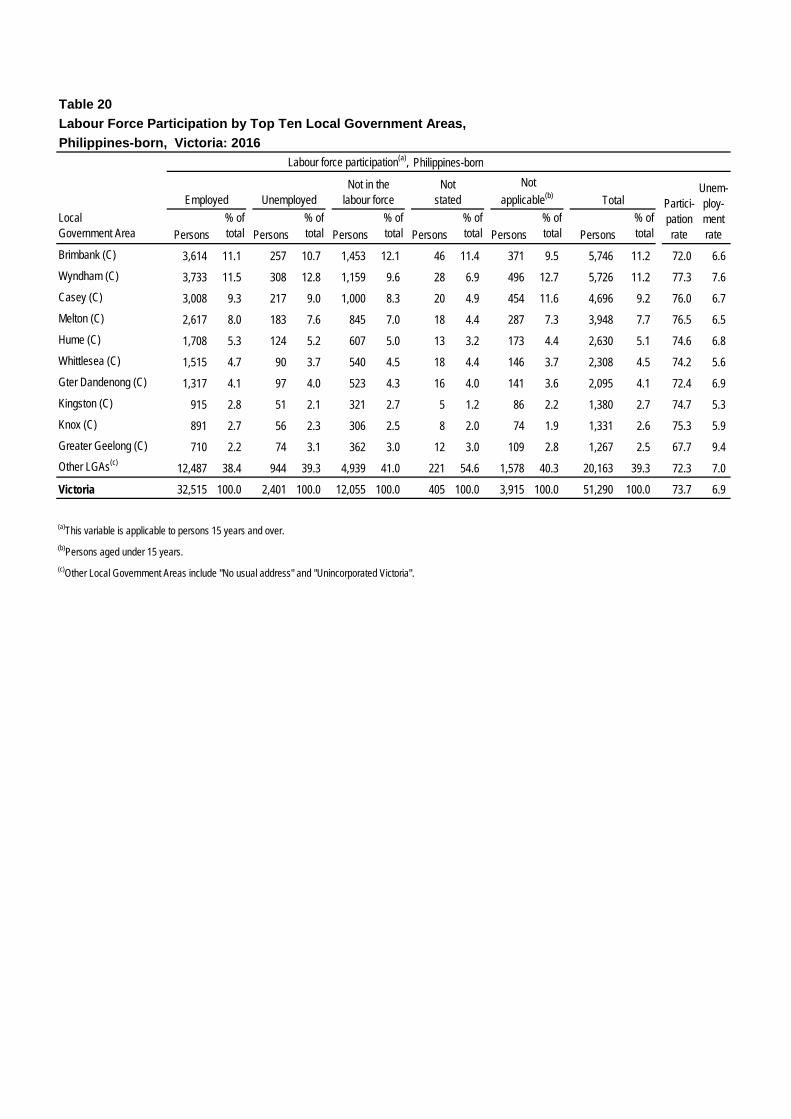
Table 20Labour Force Participation by Top Ten Local Government Areas,Philippines-born, Victoria: 2016
Philippines-born
LocalGovernment Area Persons
% of total Persons
% of total Persons
% of total Persons
% of total Persons
% of total Persons
% of total
Brimbank (C) 3,614 11.1 257 10.7 1,453 12.1 46 11.4 371 9.5 5,746 11.2 72.0 6.6Wyndham (C) 3,733 11.5 308 12.8 1,159 9.6 28 6.9 496 12.7 5,726 11.2 77.3 7.6Casey (C) 3,008 9.3 217 9.0 1,000 8.3 20 4.9 454 11.6 4,696 9.2 76.0 6.7Melton (C) 2,617 8.0 183 7.6 845 7.0 18 4.4 287 7.3 3,948 7.7 76.5 6.5Hume (C) 1,708 5.3 124 5.2 607 5.0 13 3.2 173 4.4 2,630 5.1 74.6 6.8Whittlesea (C) 1,515 4.7 90 3.7 540 4.5 18 4.4 146 3.7 2,308 4.5 74.2 5.6Gter Dandenong (C) 1,317 4.1 97 4.0 523 4.3 16 4.0 141 3.6 2,095 4.1 72.4 6.9Kingston (C) 915 2.8 51 2.1 321 2.7 5 1.2 86 2.2 1,380 2.7 74.7 5.3Knox (C) 891 2.7 56 2.3 306 2.5 8 2.0 74 1.9 1,331 2.6 75.3 5.9Greater Geelong (C) 710 2.2 74 3.1 362 3.0 12 3.0 109 2.8 1,267 2.5 67.7 9.4Other LGAs(c) 12,487 38.4 944 39.3 4,939 41.0 221 54.6 1,578 40.3 20,163 39.3 72.3 7.0
Victoria 32,515 100.0 2,401 100.0 12,055 100.0 405 100.0 3,915 100.0 51,290 100.0 73.7 6.9
(a)This variable is applicable to persons 15 years and over. (b)Persons aged under 15 years.(c)Other Local Government Areas include "No usual address" and "Unincorporated Victoria".
Total Partici-pation rate
Unem-ploy-mentrate
Labour force participation(a),
Employed UnemployedNot in the
labour forceNot
stated Not
applicable(b)
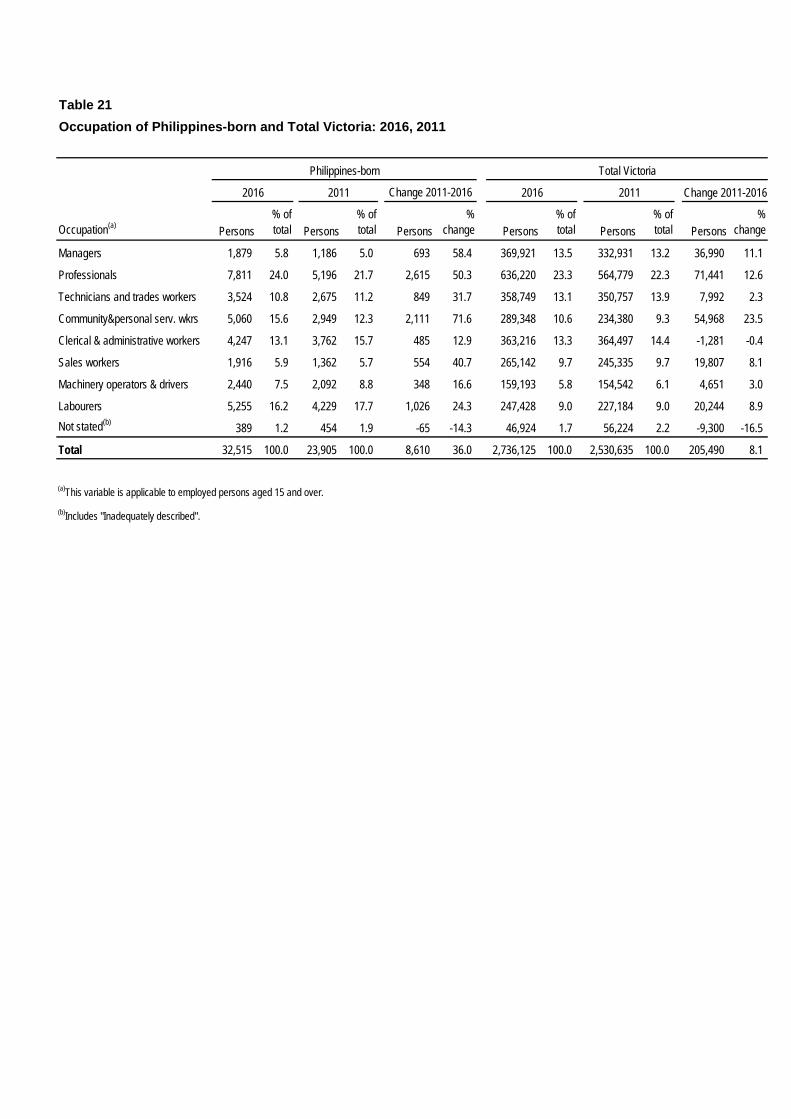
Table 21Occupation of Philippines-born and Total Victoria: 2016, 2011
Occupation(a) Persons% of total Persons
% of total Persons
% change Persons
% of total Persons
% of total Persons
%change
Managers 1,879 5.8 1,186 5.0 693 58.4 369,921 13.5 332,931 13.2 36,990 11.1
Professionals 7,811 24.0 5,196 21.7 2,615 50.3 636,220 23.3 564,779 22.3 71,441 12.6
Technicians and trades workers 3,524 10.8 2,675 11.2 849 31.7 358,749 13.1 350,757 13.9 7,992 2.3
Community&personal serv. wkrs 5,060 15.6 2,949 12.3 2,111 71.6 289,348 10.6 234,380 9.3 54,968 23.5
Clerical & administrative workers 4,247 13.1 3,762 15.7 485 12.9 363,216 13.3 364,497 14.4 -1,281 -0.4
Sales workers 1,916 5.9 1,362 5.7 554 40.7 265,142 9.7 245,335 9.7 19,807 8.1
Machinery operators & drivers 2,440 7.5 2,092 8.8 348 16.6 159,193 5.8 154,542 6.1 4,651 3.0
Labourers 5,255 16.2 4,229 17.7 1,026 24.3 247,428 9.0 227,184 9.0 20,244 8.9Not stated(b) 389 1.2 454 1.9 -65 -14.3 46,924 1.7 56,224 2.2 -9,300 -16.5
Total 32,515 100.0 23,905 100.0 8,610 36.0 2,736,125 100.0 2,530,635 100.0 205,490 8.1
(a)This variable is applicable to employed persons aged 15 and over.(b)Includes "Inadequately described".
Philippines-born Total Victoria
2016 2011 Change 2011-2016 2016 2011 Change 2011-2016
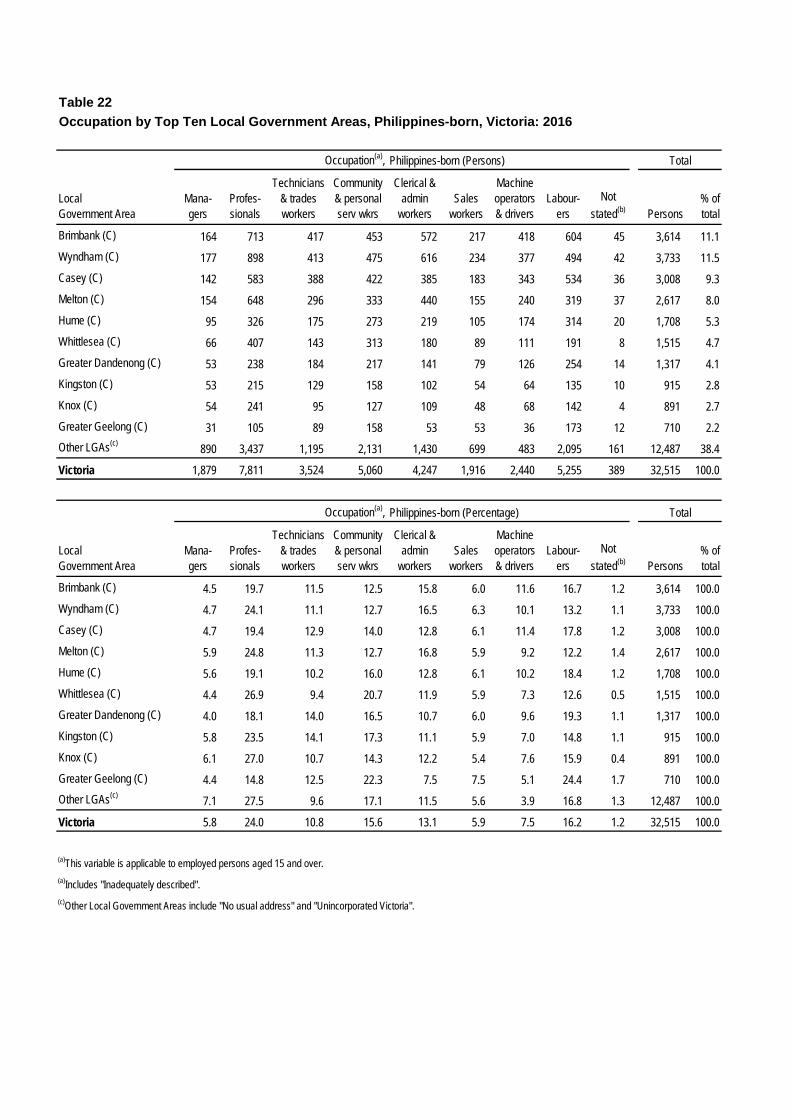
Table 22Occupation by Top Ten Local Government Areas, Philippines-born, Victoria: 2016
Philippines-born (Persons)
LocalGovernment Area
Mana-gers
Profes-sionals
Technicians& tradesworkers
Community& personalserv wkrs
Clerical &admin
workersSales
workers
Machineoperators& drivers
Labour-ers
Not stated(b) Persons
% of total
Brimbank (C) 164 713 417 453 572 217 418 604 45 3,614 11.1Wyndham (C) 177 898 413 475 616 234 377 494 42 3,733 11.5Casey (C) 142 583 388 422 385 183 343 534 36 3,008 9.3Melton (C) 154 648 296 333 440 155 240 319 37 2,617 8.0Hume (C) 95 326 175 273 219 105 174 314 20 1,708 5.3Whittlesea (C) 66 407 143 313 180 89 111 191 8 1,515 4.7Greater Dandenong (C) 53 238 184 217 141 79 126 254 14 1,317 4.1Kingston (C) 53 215 129 158 102 54 64 135 10 915 2.8Knox (C) 54 241 95 127 109 48 68 142 4 891 2.7Greater Geelong (C) 31 105 89 158 53 53 36 173 12 710 2.2Other LGAs(c) 890 3,437 1,195 2,131 1,430 699 483 2,095 161 12,487 38.4
Victoria 1,879 7,811 3,524 5,060 4,247 1,916 2,440 5,255 389 32,515 100.0
Philippines-born (Percentage)
LocalGovernment Area
Mana-gers
Profes-sionals
Technicians& tradesworkers
Community& personalserv wkrs
Clerical &admin
workersSales
workers
Machineoperators& drivers
Labour-ers
Not stated(b) Persons
% of total
Brimbank (C) 4.5 19.7 11.5 12.5 15.8 6.0 11.6 16.7 1.2 3,614 100.0Wyndham (C) 4.7 24.1 11.1 12.7 16.5 6.3 10.1 13.2 1.1 3,733 100.0Casey (C) 4.7 19.4 12.9 14.0 12.8 6.1 11.4 17.8 1.2 3,008 100.0Melton (C) 5.9 24.8 11.3 12.7 16.8 5.9 9.2 12.2 1.4 2,617 100.0Hume (C) 5.6 19.1 10.2 16.0 12.8 6.1 10.2 18.4 1.2 1,708 100.0Whittlesea (C) 4.4 26.9 9.4 20.7 11.9 5.9 7.3 12.6 0.5 1,515 100.0Greater Dandenong (C) 4.0 18.1 14.0 16.5 10.7 6.0 9.6 19.3 1.1 1,317 100.0Kingston (C) 5.8 23.5 14.1 17.3 11.1 5.9 7.0 14.8 1.1 915 100.0Knox (C) 6.1 27.0 10.7 14.3 12.2 5.4 7.6 15.9 0.4 891 100.0Greater Geelong (C) 4.4 14.8 12.5 22.3 7.5 7.5 5.1 24.4 1.7 710 100.0Other LGAs(c) 7.1 27.5 9.6 17.1 11.5 5.6 3.9 16.8 1.3 12,487 100.0
Victoria 5.8 24.0 10.8 15.6 13.1 5.9 7.5 16.2 1.2 32,515 100.0
(a)This variable is applicable to employed persons aged 15 and over.(a)Includes "Inadequately described".(c)Other Local Government Areas include "No usual address" and "Unincorporated Victoria".
TotalOccupation(a),
Occupation(a), Total
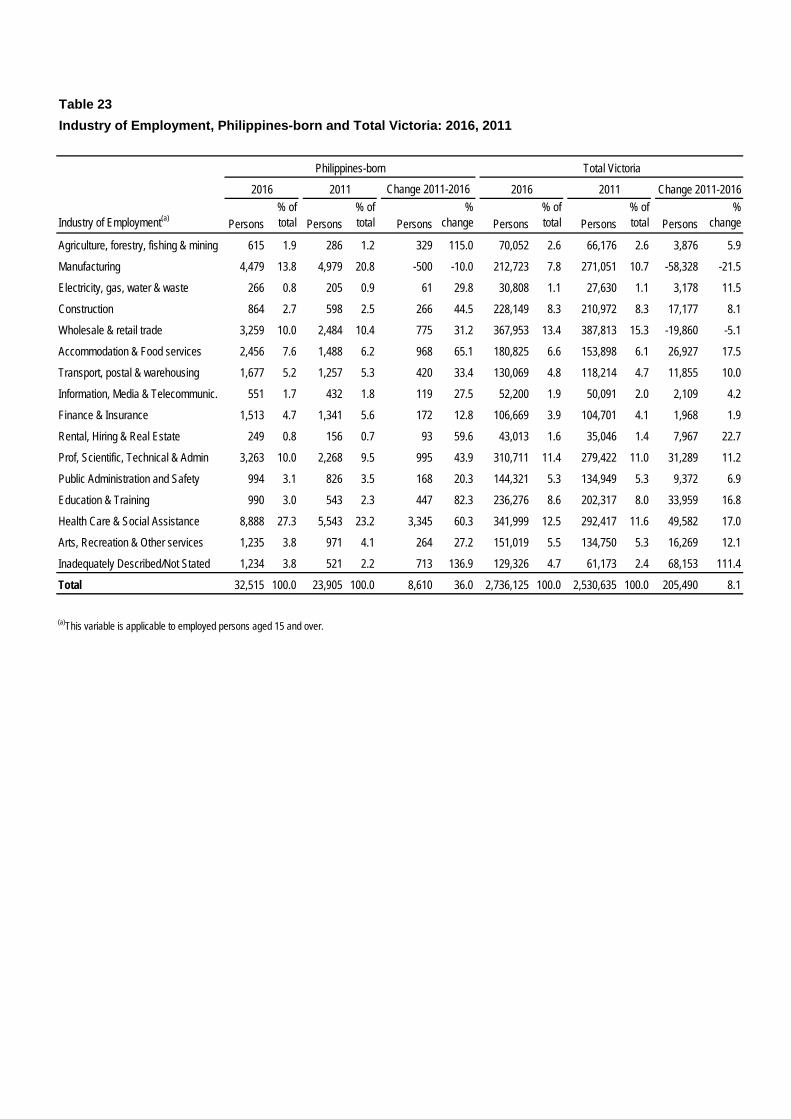
Table 23Industry of Employment, Philippines-born and Total Victoria: 2016, 2011
Industry of Employment(a) Persons% of total Persons
% of total Persons
% change Persons
% of total Persons
% of total Persons
%change
Agriculture, forestry, fishing & mining 615 1.9 286 1.2 329 115.0 70,052 2.6 66,176 2.6 3,876 5.9
Manufacturing 4,479 13.8 4,979 20.8 -500 -10.0 212,723 7.8 271,051 10.7 -58,328 -21.5
Electricity, gas, water & waste 266 0.8 205 0.9 61 29.8 30,808 1.1 27,630 1.1 3,178 11.5
Construction 864 2.7 598 2.5 266 44.5 228,149 8.3 210,972 8.3 17,177 8.1
Wholesale & retail trade 3,259 10.0 2,484 10.4 775 31.2 367,953 13.4 387,813 15.3 -19,860 -5.1
Accommodation & Food services 2,456 7.6 1,488 6.2 968 65.1 180,825 6.6 153,898 6.1 26,927 17.5
Transport, postal & warehousing 1,677 5.2 1,257 5.3 420 33.4 130,069 4.8 118,214 4.7 11,855 10.0
Information, Media & Telecommunic. 551 1.7 432 1.8 119 27.5 52,200 1.9 50,091 2.0 2,109 4.2
Finance & Insurance 1,513 4.7 1,341 5.6 172 12.8 106,669 3.9 104,701 4.1 1,968 1.9
Rental, Hiring & Real Estate 249 0.8 156 0.7 93 59.6 43,013 1.6 35,046 1.4 7,967 22.7
Prof, Scientific, Technical & Admin 3,263 10.0 2,268 9.5 995 43.9 310,711 11.4 279,422 11.0 31,289 11.2
Public Administration and Safety 994 3.1 826 3.5 168 20.3 144,321 5.3 134,949 5.3 9,372 6.9
Education & Training 990 3.0 543 2.3 447 82.3 236,276 8.6 202,317 8.0 33,959 16.8
Health Care & Social Assistance 8,888 27.3 5,543 23.2 3,345 60.3 341,999 12.5 292,417 11.6 49,582 17.0
Arts, Recreation & Other services 1,235 3.8 971 4.1 264 27.2 151,019 5.5 134,750 5.3 16,269 12.1
Inadequately Described/Not Stated 1,234 3.8 521 2.2 713 136.9 129,326 4.7 61,173 2.4 68,153 111.4
Total 32,515 100.0 23,905 100.0 8,610 36.0 2,736,125 100.0 2,530,635 100.0 205,490 8.1
(a)This variable is applicable to employed persons aged 15 and over.
Philippines-born Total Victoria
2016 2011 Change 2011-2016 2016 2011 Change 2011-2016

Table 24Industry of Employment by Top Ten Local Government Areas, Philippines-born, Victoria: 2016
Philippines-born (Persons)
LocalGovernment Area Ag
ricult
ure,
fores
try,
fishin
g & m
ining
Manu
factur
ing
Elec
tricity
, gas
, wa
ter &
was
te
Cons
tructi
on
Who
lesale
& re
tail
Acco
mmod
ation
&
Food
Ser
vice
Tran
spor
t, pos
tal,
ware
hous
e
Infor
matio
n, Me
dia,
Telec
ommu
nicati
ons
Finan
ce, In
sura
nce,
Renta
l, Rea
l esta
te
Profe
ssion
al, S
cienti
fic,
Tech
& A
dmin
Supp
ort
Publi
c Adm
in &
Safet
y
Educ
ation
, Tra
ining
, H
ealth
Car
e
Arts,
Rec
reati
on,
Othe
r ser
vices
Not s
tated
(b)
Persons% of total
Brimbank (C) 15 601 18 101 361 253 329 63 234 309 98 945 172 143 3,614 11.1Wyndham (C) 28 535 45 117 432 211 281 70 287 390 135 951 170 120 3,733 11.5Casey (C) 21 598 34 117 339 161 135 48 161 241 60 876 86 153 3,008 9.3Melton (C) 17 411 23 88 233 146 219 51 208 234 98 734 111 78 2,617 8.0Hume (C) 13 291 17 46 172 122 125 12 86 164 66 466 57 75 1,708 5.3Whittlesea (C) 9 181 14 39 134 94 73 27 87 123 59 585 46 60 1,515 4.7Gter Dandenong (C) 10 248 13 41 141 98 47 16 60 130 24 413 39 56 1,317 4.1Kingston (C) - 148 7 26 108 76 31 15 53 79 27 282 40 35 915 2.8Knox (C) - 143 7 24 107 46 34 18 50 77 15 307 30 40 891 2.7Greater Geelong (C) 29 92 7 15 75 100 20 - 16 67 10 239 21 26 710 2.2Other LGAs(c) 473 1,231 81 250 1,157 1,149 383 231 822 1,449 402 4,080 463 448 12,487 38.4
Victoria 615 4,479 266 864 3,259 2,456 1,677 551 2,064 3,263 994 9,878 1,235 1,234 32,515 100.0
Philippines-born (Percentage)
LocalGovernment Area Ag
ricult
ure,
fores
try,
fishin
g & m
ining
Manu
factur
ing
Elec
tricity
, gas
, wa
ter &
was
te
Cons
tructi
on
Who
lesale
& re
tail
Acco
mmod
ation
&
Food
Ser
vice
Tran
spor
t, pos
tal,
ware
hous
e
Infor
matio
n, Me
dia,
Telec
ommu
nicati
ons
Finan
ce, In
sura
nce,
Renta
l, Rea
l esta
te
Profe
ssion
al, S
cienti
fic,
Tech
& A
dmin
Supp
ort
Publi
c Adm
in &
Safet
y
Educ
ation
, Tra
ining
, H
ealth
Car
e
Arts,
Rec
reati
on,
Othe
r ser
vices
Not s
tated
(b)
Persons% of total
Brimbank (C) 0.4 16.6 0.5 2.8 10.0 7.0 9.1 1.7 6.5 8.6 2.7 26.1 4.8 4.0 3,614 100.0Wyndham (C) 0.8 14.3 1.2 3.1 11.6 5.7 7.5 1.9 7.7 10.4 3.6 25.5 4.6 3.2 3,733 100.0Casey (C) 0.7 19.9 1.1 3.9 11.3 5.4 4.5 1.6 5.4 8.0 2.0 29.1 2.9 5.1 3,008 100.0Melton (C) 0.6 15.7 0.9 3.4 8.9 5.6 8.4 1.9 7.9 8.9 3.7 28.0 4.2 3.0 2,617 100.0Hume (C) 0.8 17.0 1.0 2.7 10.1 7.1 7.3 0.7 5.0 9.6 3.9 27.3 3.3 4.4 1,708 100.0Whittlesea (C) 0.6 11.9 0.9 2.6 8.8 6.2 4.8 1.8 5.7 8.1 3.9 38.6 3.0 4.0 1,515 100.0Gter Dandenong (C) 0.8 18.8 1.0 3.1 10.7 7.4 3.6 1.2 4.6 9.9 1.8 31.4 3.0 4.3 1,317 100.0Kingston (C) - 16.2 0.8 2.8 11.8 8.3 3.4 1.6 5.8 8.6 3.0 30.8 4.4 3.8 915 100.0Knox (C) - 16.0 0.8 2.7 12.0 5.2 3.8 2.0 5.6 8.6 1.7 34.5 3.4 4.5 891 100.0Greater Geelong (C) 4.1 13.0 1.0 2.1 10.6 14.1 2.8 - 2.3 9.4 1.4 33.7 3.0 3.7 710 100.0Other LGAs(c) 3.8 9.9 0.6 2.0 9.3 9.2 3.1 1.8 6.6 11.6 3.2 32.7 3.7 3.6 12,487 100.0
Victoria 1.9 13.8 0.8 2.7 10.0 7.6 5.2 1.7 6.3 10.0 3.1 30.4 3.8 3.8 32,515 100.0
(a)This variable is applicable to employed persons aged 15 and over.(b) Includes "Inadequately Described".(c)Other Local Government Areas include "No usual address" and "Unincorporated Victoria".
Industry of Employment(a), Total
Industry of Employment(a), Total
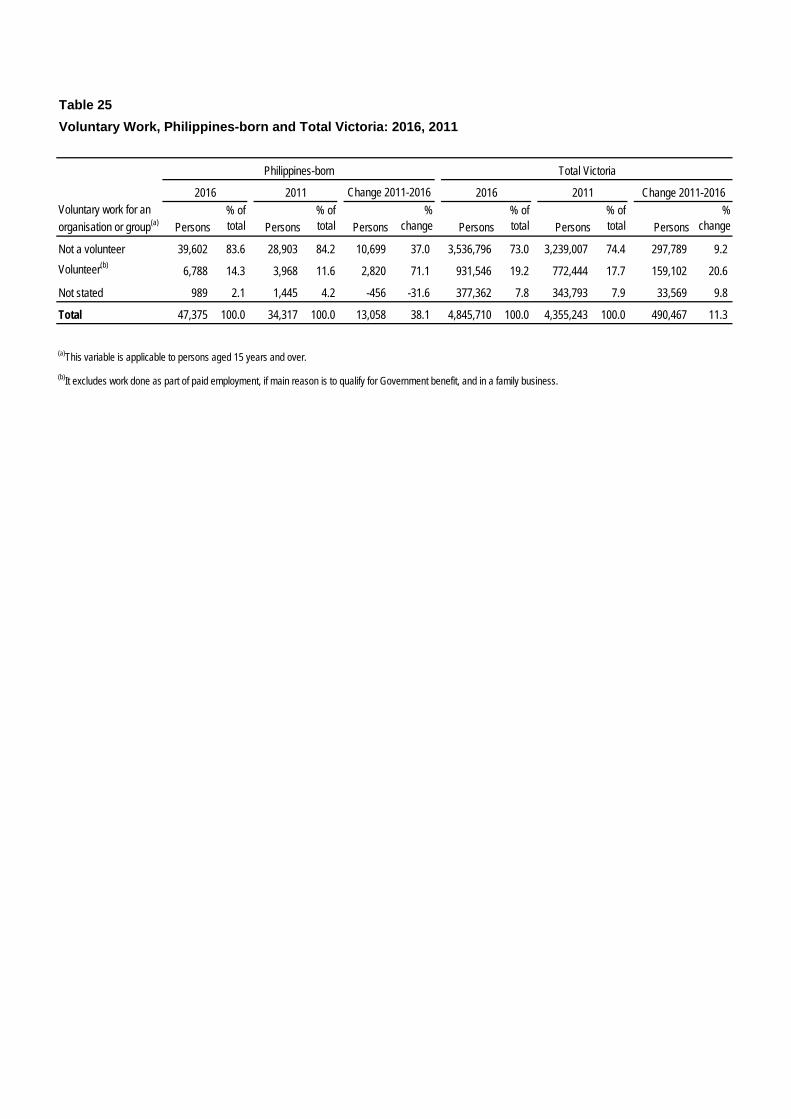
Table 25Voluntary Work, Philippines-born and Total Victoria: 2016, 2011
Persons% of total Persons
% of total Persons
% change Persons
% of total Persons
% of total Persons
%change
Not a volunteer 39,602 83.6 28,903 84.2 10,699 37.0 3,536,796 73.0 3,239,007 74.4 297,789 9.2Volunteer(b) 6,788 14.3 3,968 11.6 2,820 71.1 931,546 19.2 772,444 17.7 159,102 20.6
Not stated 989 2.1 1,445 4.2 -456 -31.6 377,362 7.8 343,793 7.9 33,569 9.8
Total 47,375 100.0 34,317 100.0 13,058 38.1 4,845,710 100.0 4,355,243 100.0 490,467 11.3
(a)This variable is applicable to persons aged 15 years and over.(b)It excludes work done as part of paid employment, if main reason is to qualify for Government benefit, and in a family business.
Voluntary work for anorganisation or group(a)
Philippines-born Total Victoria
2016 2011 Change 2011-2016 2016 2011 Change 2011-2016

Table 26Voluntary Work by Top Ten Local Government Areas, Philippines-born, Victoria: 2016
Persons% oftotal Persons
% oftotal Persons
% oftotal Persons
% oftotal Persons
% oftotal
Brimbank (C) 4,440 77.3 809 14.1 122 2.1 371 6.5 5,746 100.0Wyndham (C) 4,302 75.1 863 15.1 70 1.2 496 8.7 5,726 100.0Casey (C) 3,661 78.0 519 11.1 55 1.2 454 9.7 4,696 100.0Melton (C) 2,997 75.9 623 15.8 43 1.1 287 7.3 3,948 100.0Hume (C) 2,118 80.5 306 11.6 34 1.3 173 6.6 2,630 100.0Whittlesea (C) 1,891 81.9 232 10.1 35 1.5 146 6.3 2,308 100.0Greater Dandenong (C) 1,675 80.0 235 11.2 41 2.0 141 6.7 2,095 100.0Kingston (C) 1,124 81.4 153 11.1 23 1.7 86 6.2 1,380 100.0Knox (C) 1,042 78.3 200 15.0 16 1.2 74 5.6 1,331 100.0Greater Geelong (C) 898 70.9 212 16.7 47 3.7 109 8.6 1,267 100.0Other LGAs(c) 15,454 76.6 2,636 13.1 503 2.5 1,578 7.8 20,163 100.0
Victoria 39,602 77.2 6,788 13.2 989 1.9 3,915 7.6 51,290 100.0
(a)It excludes work done as part of paid employment, if main reason is to qualify for Government benefit, and in a family business.(b)This variable is applicable to persons aged 15 years and over.(c)Other Local Government Areas include "No usual address" and "Unincorporated Victoria".
Total
Philippines-born
Voluntary work for anorganisation or group(a)
Not a volunteer Volunteer(a) Not stated Not applicableb)

Table 27Total Personal Income (Weekly) by Gender, Philippines-born and Total Victoria: 2016
Total personal income, weekly(a) Persons
% of total Persons
% of total Persons
% of total Persons
% of total Persons
% of total Persons
% of total
Negative income 185 1.0 452 1.5 638 1.3 13,009 0.6 14,111 0.6 27,122 0.6
Nil income 1,963 10.8 4,108 14.1 6,070 12.8 188,193 8.0 279,737 11.2 467,934 9.7
$1-149 580 3.2 1,238 4.2 1,819 3.8 83,859 3.6 134,653 5.4 218,506 4.5
$150-$299 733 4.0 1,883 6.4 2,619 5.5 142,347 6.0 207,614 8.3 349,958 7.2
$300-$399 727 4.0 2,062 7.1 2,792 5.9 170,390 7.2 236,491 9.5 406,878 8.4
$400-$499 628 3.5 1,940 6.6 2,564 5.4 149,345 6.3 241,956 9.7 391,308 8.1
$500-$649 888 4.9 2,390 8.2 3,278 6.9 143,307 6.1 217,522 8.7 360,838 7.4
$650-$799 1,660 9.1 3,125 10.7 4,784 10.1 166,657 7.1 199,446 8.0 366,105 7.6
$800-$999 2,477 13.7 3,299 11.3 5,784 12.2 209,859 8.9 194,360 7.8 404,215 8.3
$1,000-$1,249 2,775 15.3 3,101 10.6 5,876 12.4 225,102 9.6 181,940 7.3 407,041 8.4
$1,250-$1,499 1,813 10.0 2,023 6.9 3,833 8.1 158,640 6.7 119,460 4.8 278,098 5.7
$1,500-$1,749 1,328 7.3 1,256 4.3 2,588 5.5 136,031 5.8 90,793 3.6 226,824 4.7
$1,750-$1,999 740 4.1 671 2.3 1,408 3.0 98,252 4.2 54,847 2.2 153,095 3.2
$2,000-$2,999 1,001 5.5 696 2.4 1,700 3.6 154,852 6.6 65,948 2.6 220,801 4.6
$3,000 or more 242 1.3 232 0.8 479 1.0 106,312 4.5 37,568 1.5 143,877 3.0
Not stated 402 2.2 747 2.6 1,145 2.4 207,345 8.8 215,766 8.7 423,108 8.7
Total 18,144 100.0 29,231 100.0 47,375 100.0 2,353,499 100.0 2,492,203 100.0 4,845,710 100.0
(a)Applicable to persons aged 15 years and over.
Philippines-born Total Victoria
Males Females Total Males Females Total
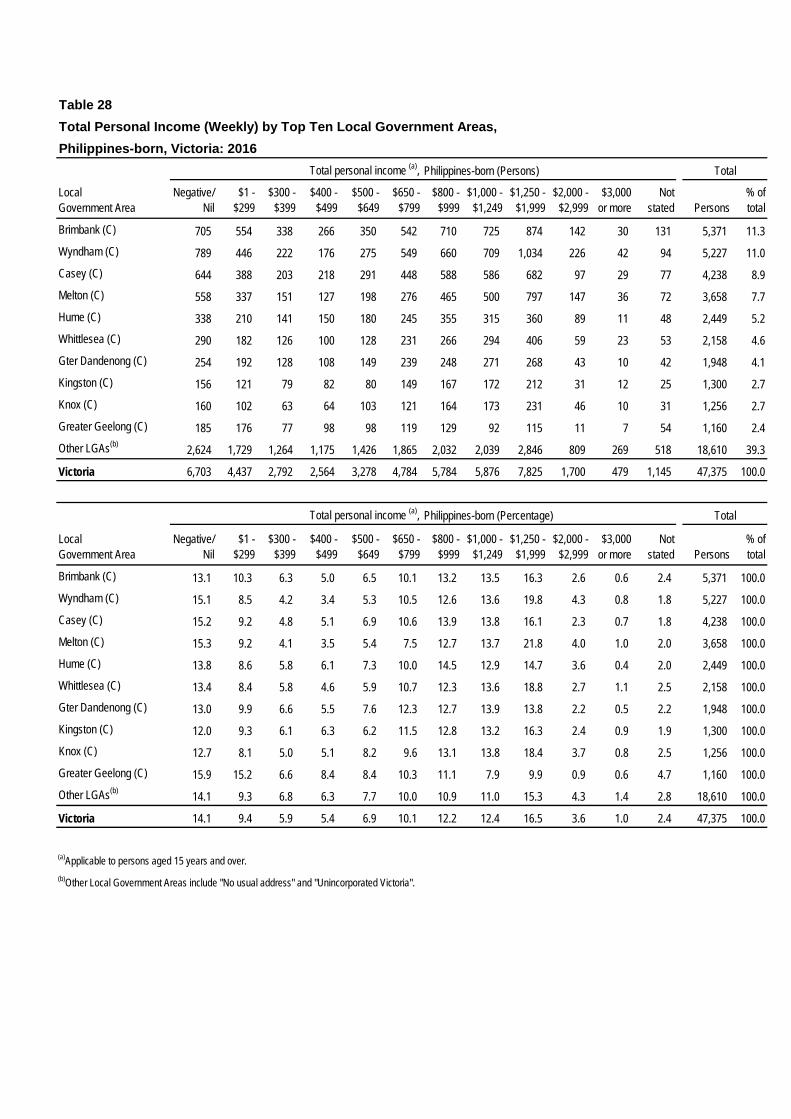
Table 28Total Personal Income (Weekly) by Top Ten Local Government Areas,Philippines-born, Victoria: 2016
Philippines-born (Persons)
Local Government Area
Negative/Nil
$1 - $299
$300 - $399
$400 - $499
$500 - $649
$650 - $799
$800 - $999
$1,000 - $1,249
$1,250 - $1,999
$2,000 - $2,999
$3,000 or more
Notstated Persons
% of total
Brimbank (C) 705 554 338 266 350 542 710 725 874 142 30 131 5,371 11.3Wyndham (C) 789 446 222 176 275 549 660 709 1,034 226 42 94 5,227 11.0Casey (C) 644 388 203 218 291 448 588 586 682 97 29 77 4,238 8.9Melton (C) 558 337 151 127 198 276 465 500 797 147 36 72 3,658 7.7Hume (C) 338 210 141 150 180 245 355 315 360 89 11 48 2,449 5.2Whittlesea (C) 290 182 126 100 128 231 266 294 406 59 23 53 2,158 4.6Gter Dandenong (C) 254 192 128 108 149 239 248 271 268 43 10 42 1,948 4.1Kingston (C) 156 121 79 82 80 149 167 172 212 31 12 25 1,300 2.7Knox (C) 160 102 63 64 103 121 164 173 231 46 10 31 1,256 2.7Greater Geelong (C) 185 176 77 98 98 119 129 92 115 11 7 54 1,160 2.4Other LGAs(b) 2,624 1,729 1,264 1,175 1,426 1,865 2,032 2,039 2,846 809 269 518 18,610 39.3
Victoria 6,703 4,437 2,792 2,564 3,278 4,784 5,784 5,876 7,825 1,700 479 1,145 47,375 100.0
Philippines-born (Percentage)
Local Government Area
Negative/Nil
$1 - $299
$300 - $399
$400 - $499
$500 - $649
$650 - $799
$800 - $999
$1,000 - $1,249
$1,250 - $1,999
$2,000 - $2,999
$3,000 or more
Notstated Persons
% of total
Brimbank (C) 13.1 10.3 6.3 5.0 6.5 10.1 13.2 13.5 16.3 2.6 0.6 2.4 5,371 100.0Wyndham (C) 15.1 8.5 4.2 3.4 5.3 10.5 12.6 13.6 19.8 4.3 0.8 1.8 5,227 100.0Casey (C) 15.2 9.2 4.8 5.1 6.9 10.6 13.9 13.8 16.1 2.3 0.7 1.8 4,238 100.0Melton (C) 15.3 9.2 4.1 3.5 5.4 7.5 12.7 13.7 21.8 4.0 1.0 2.0 3,658 100.0Hume (C) 13.8 8.6 5.8 6.1 7.3 10.0 14.5 12.9 14.7 3.6 0.4 2.0 2,449 100.0Whittlesea (C) 13.4 8.4 5.8 4.6 5.9 10.7 12.3 13.6 18.8 2.7 1.1 2.5 2,158 100.0Gter Dandenong (C) 13.0 9.9 6.6 5.5 7.6 12.3 12.7 13.9 13.8 2.2 0.5 2.2 1,948 100.0Kingston (C) 12.0 9.3 6.1 6.3 6.2 11.5 12.8 13.2 16.3 2.4 0.9 1.9 1,300 100.0Knox (C) 12.7 8.1 5.0 5.1 8.2 9.6 13.1 13.8 18.4 3.7 0.8 2.5 1,256 100.0Greater Geelong (C) 15.9 15.2 6.6 8.4 8.4 10.3 11.1 7.9 9.9 0.9 0.6 4.7 1,160 100.0Other LGAs(b) 14.1 9.3 6.8 6.3 7.7 10.0 10.9 11.0 15.3 4.3 1.4 2.8 18,610 100.0
Victoria 14.1 9.4 5.9 5.4 6.9 10.1 12.2 12.4 16.5 3.6 1.0 2.4 47,375 100.0
(a)Applicable to persons aged 15 years and over.(b)Other Local Government Areas include "No usual address" and "Unincorporated Victoria".
TotalTotal personal income (a),
Total personal income (a), Total

Table 29Housing Tenure Type, Philippines-born and Total Victoria: 2016, 2011
Tenure type(a) Persons% of total Persons
% of total Persons
% change Persons
% of total Persons
% of total Persons
%change
Owned outright 7,499 14.9 6,103 16.4 1,396 22.9 1,458,461 25.8 1,451,442 28.3 7,019 0.5Owned with a mortgage 22,128 44.1 17,735 47.6 4,393 24.8 2,256,272 39.9 2,090,847 40.8 165,425 7.9Being purchased under a shared equity scheme 53 0.1 83 0.2 -30 -36.1 5,284 0.1 11,894 0.2 -6,610 -55.6 Rented 18,551 37.0 12,117 32.5 6,434 53.1 1,415,839 25.0 1,167,974 22.8 247,865 21.2Being occupied rent-free 378 0.8 238 0.6 140 58.8 40,008 0.7 40,226 0.8 -218 -0.5 Being occupied under a life tenure scheme 87 0.2 21 0.1 66 314.3 13,028 0.2 8,976 0.2 4,052 45.1Other tenure type 99 0.2 84 0.2 15 17.9 18,921 0.3 18,973 0.4 -52 -0.3 Not stated 1,082 2.2 664 1.8 418 63.0 358,580 6.3 250,524 4.9 108,056 43.1Not applicable(b) 300 0.6 204 0.5 96 47.1 92,161 1.6 80,696 1.6 11,465 14.2
Total 50,173 100.0 37,249 100.0 12,924 34.7 5,658,565 100.0 5,121,547 100.0 537,018 10.5
(a)This table counts persons in dwellings of a particular tenure type. Tenure type is applicable to occupied private dwellings.
This table only counts persons who were enumerated at their usual residence on Census night.(b)Includes persons counted in "Non-private dwellings" and "Migratory and off-shore areas".
Philippines-born Total Victoria
2016 2011 Change 2011-2016 2016 2011 Change 2011-2016

Table 30Housing Tenure Type by Top Ten Local Government Areas, Philippines-born, Victoria: 2016
Tenure type(a), Philippines-born (Persons)
Local Government Area
Ownedoutright
Ownedmortgage
Being purchased(b) Rented
Rent-free
Life tenure
Other tenure
Not stated
Not applicable(c) Persons
% of total
Brimbank (C) 970 2,452 3 2,065 30 5 3 101 13 5,638 11.2 Wyndham (C) 468 3,488 - 1,571 13 3 4 89 7 5,641 11.2 Casey (C) 458 3,111 10 943 13 6 5 78 3 4,617 9.2 Melton (C) 361 2,732 9 709 8 - 5 57 7 3,898 7.8 Hume (C) 348 1,506 7 645 3 10 4 52 8 2,582 5.1 Whittlesea (C) 339 1,175 4 648 15 - 3 58 10 2,253 4.5 Gter Dandenong (C) 248 719 - 987 16 - 5 55 10 2,045 4.1 Kingston (C) 291 454 - 563 6 7 6 36 6 1,369 2.7 Knox (C) 275 604 - 406 4 - 9 15 5 1,312 2.6 Greater Geelong (C) 212 500 - 453 11 3 - 41 21 1,233 2.5 Other LGAs(d) 3,529 5,387 20 9,561 259 53 55 500 210 19,585 39.0
Victoria 7,499 22,128 53 18,551 378 87 99 1,082 300 50,173 100.0
Tenure type(a), Philippines-born (Percentage)
Local Government Area
Ownedoutright
Ownedmortgage
Being purchased(b) Rented
Rent-free
Life tenure
Other tenure
Not stated
Not applicable(c) Persons
% of total
Brimbank (C) 17.2 43.5 0.1 36.6 0.5 0.1 0.1 1.8 0.2 5,638 100.0Wyndham (C) 8.3 61.8 - 27.8 0.2 0.1 0.1 1.6 0.1 5,641 100.0Casey (C) 9.9 67.4 0.2 20.4 0.3 0.1 0.1 1.7 0.1 4,617 100.0Melton (C) 9.3 70.1 0.2 18.2 0.2 - 0.1 1.5 0.2 3,898 100.0Hume (C) 13.5 58.3 0.3 25.0 0.1 0.4 0.2 2.0 0.3 2,582 100.0Whittlesea (C) 15.0 52.2 0.2 28.8 0.7 - 0.1 2.6 0.4 2,253 100.0Gter Dandenong (C) 12.1 35.2 - 48.3 0.8 - 0.2 2.7 0.5 2,045 100.0Kingston (C) 21.3 33.2 - 41.1 0.4 0.5 0.4 2.6 0.4 1,369 100.0Knox (C) 21.0 46.0 - 30.9 0.3 - 0.7 1.1 0.4 1,312 100.0Greater Geelong (C) 17.2 40.6 - 36.7 0.9 0.2 - 3.3 1.7 1,233 100.0Other LGAs(d) 18.0 27.5 0.1 48.8 1.3 0.3 0.3 2.6 1.1 19,585 100.0
Victoria 14.9 44.1 0.1 37.0 0.8 0.2 0.2 2.2 0.6 50,173 100.0
(a)This table counts persons in dwellings of a particular tenure type. Tenure type is applicable to occupied private dwellings.
This table only counts persons who were enumerated at their usual residence on Census night.(b)Comprises being purchased under a shared equity scheme.(c)Includes persons counted in "Non-private dwellings" and "Migratory and off-shore areas".(d)Other Local Government Areas include "No usual address" and "Unincorporated Victoria".
Total
Total

Table 31Family Composition, Philippines-born and the Total Victorian Population: 2016, 2011
Family composition(a) Persons% of total Persons
% of total Persons
% change Persons
% of total Persons
% of total Persons
%change
Couple family no children 9,412 18.4 6,196 16.3 3,216 51.9 1,113,156 18.8 1,031,510 19.3 81,646 7.9
Couple family with children 30,002 58.5 23,689 62.3 6,313 26.6 2,734,651 46.1 2,521,410 47.1 213,241 8.5
One-parent family 4,148 8.1 3,514 9.2 634 18.0 606,028 10.2 566,579 10.6 39,449 7.0
Other family 783 1.5 452 1.2 331 73.2 58,808 1.0 55,227 1.0 3,581 6.5Not applicable(b) 6,937 13.5 4,148 10.9 2,789 67.2 1,413,976 23.9 1,179,316 22.0 234,660 19.9
Total 51,290 100.0 38,002 100.0 13,288 35.0 5,926,624 100.0 5,354,039 100.0 572,585 10.7
(a)This table counts persons in families classified into different types, applicable to families in family households.(b)Persons living in lone person, group, other non-classifiable or visitor only households, unrelated individuals living in a family household, persons not counted at home on Census night and persons counted in non-private dwellings and migratory and off-shore areas.
Philippines-born Total Victorian population
2016 2011 Change 2011-2016 2016 2011 Change 2011-2016

Table 32Citizenship Status, Philippines-born and the Total Victorian Population: 2016, 2011
Citizenship Persons% of total Persons
% of total Persons
% change Persons
% of total Persons
% of total Persons
%change
Australian 34,960 68.2 26,717 70.3 8,243 30.9 4,838,131 81.6 4,549,575 85.0 288,556 6.3
Not Australian 15,642 30.5 10,743 28.3 4,899 45.6 701,162 11.8 512,654 9.6 188,508 36.8
Not stated 692 1.3 545 1.4 147 27.0 387,331 6.5 291,803 5.5 95,528 32.7
Victoria 51,290 100.0 38,002 100.0 13,288 35.0 5,926,624 100.0 5,354,039 100.0 572,585 10.7
Philippines-born Total Victorian population
2016 2011 Change 2011-2016 2016 2011 Change 2011-2016

Table 33Citizenship Status by Top Ten Local Government Areas,Philippines-born, Victoria: 2016, 2011
Local Government Area Australian
Not Australian
Not stated
Total Persons Australian
Not Australian
Not stated
Total Persons Persons
%change
Brimbank (C) 4,310 1,348 88 5,746 3,893 1,243 84 5,221 417 10.7Wyndham (C) 4,004 1,650 73 5,726 2,631 1,240 48 3,926 1,373 52.2Casey (C) 3,455 1,186 53 4,696 2,339 915 66 3,323 1,116 47.7Melton (C) 2,943 967 36 3,948 1,975 737 49 2,757 968 49.0Hume (C) 2,022 573 35 2,630 1,575 433 16 2,024 447 28.4Whittlesea (C) 1,666 617 25 2,308 1,177 368 16 1,560 489 41.5Greater Dandenong (C) 1,404 664 32 2,095 1,048 480 29 1,558 356 34.0Kingston (C) 992 369 13 1,380 889 236 11 1,134 103 11.6Knox (C) 1,020 291 20 1,331 849 241 17 1,108 171 20.1Greater Geelong (C) 864 388 11 1,267 651 283 15 951 213 32.7Other LGAs(a) 12,280 7,589 306 20,163 9,690 4,567 194 14,440 2,590 26.7
Victoria 34,960 15,642 692 51,290 26,717 10,743 545 38,002 8,243 30.9
(a)Other Local Government Areas include "No usual address" and "Unincorporated Victoria".
Change 2011-2016Australian citizen2016 2011
Citizenship status, Philippines-born

Table 34Core Activity Need for Assistance, Philippines-born and the Total Victorian Population: 2016, 2011
Core activity need for assistance(a) Persons
% of total Persons
% of total Persons
% change Persons
% of total Persons
% of total Persons
%change
Has a need for assistance 1,414 2.8 928 2.4 486 52.4 304,937 5.1 255,497 4.8 49,440 19.4
Does not have need for assistance 49,173 95.9 36,637 96.4 12,536 34.2 5,220,867 88.1 4,821,393 90.1 399,474 8.3
Not stated 705 1.4 440 1.2 265 60.2 400,817 6.8 277,144 5.2 123,673 44.6
Victoria 51,290 100.0 38,002 100.0 13,288 35.0 5,926,624 100.0 5,354,039 100.0 572,585 10.7
(a)Measures the number of people with a profound or severe disability.
Philippines-born Total Victorian population
2016 2011 Change 2011-2016 2016 2011 Change 2011-2016

Table 35Core Activity Need for Assistance by Top Ten Local Government Areas,Philippines-born, Victoria: 2016
Core Activity Need for Assistance(a),
Persons% oftotal Persons
% oftotal Persons
% oftotal Persons
% oftotal
Brimbank (C) 241 4.2 5,413 94.2 83 1.4 5,746 100.0Wyndham (C) 107 1.9 5,537 96.7 79 1.4 5,726 100.0Casey (C) 125 2.7 4,531 96.5 40 0.9 4,696 100.0Melton (C) 113 2.9 3,791 96.0 46 1.2 3,948 100.0Hume (C) 77 2.9 2,520 95.8 30 1.1 2,630 100.0Whittlesea (C) 63 2.7 2,209 95.7 29 1.3 2,308 100.0Greater Dandenong (C) 57 2.7 2,015 96.2 25 1.2 2,095 100.0Kingston (C) 41 3.0 1,321 95.7 20 1.4 1,380 100.0Knox (C) 45 3.4 1,281 96.2 9 0.7 1,331 100.0Greater Geelong (C) 33 2.6 1,213 95.7 19 1.5 1,267 100.0Other LGAs(b) 512 2.5 19,342 95.9 325 1.6 20,163 100.0
Victoria 1,414 2.8 49,173 95.9 705 1.4 51,290 100.0
(a)Measures the number of people with a profound or severe disability.(b)Other Local Government Areas include "No usual address" and "Unincorporated Victoria".
Philippines-born
Local Government Area
Has need for assistance
Does not have need for assistance
Not stated Total

Table 36Usual Address Five Years Ago by Top Ten LGAs, Philippines-born and Total Victoria: 2016
Local Government Area (LGA)
Same as in 2016
Elsewherein Australia
Overseasin 2011
Notstated Total
Same as in 2016
Elsewherein Australia
Overseasin 2011
Notstated Total
Brimbank (C) 3,273 1,328 999 106 5,697 111,473 41,460 15,777 12,654 181,364Wyndham (C) 2,762 1,772 1,100 50 5,684 92,801 69,541 20,949 12,448 195,734Casey (C) 2,173 1,578 829 54 4,637 150,252 91,742 18,136 15,396 275,524Melton (C) 1,989 1,266 641 25 3,927 67,475 41,747 5,659 9,088 123,964Hume (C) 1,426 715 423 40 2,608 103,450 53,388 13,305 11,686 181,835Whittlesea (C) 1,118 677 467 31 2,288 96,943 60,918 13,268 10,212 181,341Greater Dandenong (C) 871 643 517 37 2,067 75,345 37,485 19,216 9,522 141,563Kingston (C) 732 325 307 14 1,373 83,204 41,994 9,033 8,043 142,280Knox (C) 768 311 243 13 1,331 93,189 39,350 6,138 6,420 145,097Greater Geelong (C) 591 366 259 34 1,250 117,028 79,277 6,942 15,838 219,081Other LGAs(b) 7,584 5,874 5,923 499 19,888 2,015,425 1,213,509 263,722 274,964 3,767,626
Victoria 23,287 14,855 11,708 903 50,750 3,006,585 1,770,411 392,145 386,271 5,555,409
(a)This variable is applicable to persons aged 5 years and over.(b)Other Local Government Areas include "No usual address" and "Unincorporated Victoria".
Philippines-born
Usual address five years ago(a) Usual address five years ago(a)
Total Victorian population


© The State of Victoria, Department of Premier and Cabinet 2018 ISBN 978-1-925551-84-6 Online (pdf)
ACCESSIBILITY
If you would like to receive this publication in an alternative format, please contact the Multicultural Affairs and Social Cohesion Division of the Department of Premier and Cabinet Victoria on [email protected].
This publication is only available in PDF format on the internet at www.multicultural.vic.gov.au.
Images by Artificial Studios – Jorge de Araujo, except for front cover middle photo