Embed Size (px)
Citation preview
Victorian Recycling Industries Annual Survey 2013-14ISSN 1836-9901
Contact DetailsSustainability Victoria(03) 8626 8700
Published by Sustainability VictoriaLevel 28 Urban Workshop50Lonsdale StreetMelbourne Victoria 3000Australia.October 2015
While reasonable efforts have been made to ensure that the contents of this publication are factually correct, Sustainability Victoria gives no warranty regarding its accuracy, completeness, currency or suitability for any particular purpose and, to the extent permitted by law, does not accept any liability for loss or damages incurred as a result of reliance placed upon the content of this publication. This publication is provided on the basis that all persons accessing it undertake responsibility for assessing the relevance and accuracy of its content.
The Victorian Recycling Industries Annual Survey 2013-2014 should be attributed to Sustainability Victoria.
The Victorian Recycling Industries Annual Survey 2013-2014 is licensed under a Creative Commons Attribution 3.0 Australia licence. In essence, you are free to copy, distribute and adapt the work, as long as you attribute the work and abide by the other licence terms. To view a copy of this licence, visit: http://creativecommons.org/licenses/by/3.0/au/
Victorian Recycling Industries Annual Survey 2013-14ii
Contents
1. Executive summary....................................................................................................................... 7
2. Introduction................................................................................................................................. 11
3. Total materials recovered for recycling.........................................................................................13
4. Metal.......................................................................................................................................... 21
5. Aggregates, masonry & soil.........................................................................................................24
6. Paper / Cardboard....................................................................................................................... 27
7. Organics..................................................................................................................................... 29
8. Glass.......................................................................................................................................... 32
9. Plastic......................................................................................................................................... 34
10. Rubber..................................................................................................................................... 37
11. Textiles..................................................................................................................................... 39
Appendix A Survey methodology.....................................................................................................41
Appendix B Materials recovered for reprocessing.............................................................................43
Appendix C Participating reprocessors.............................................................................................46
Victorian Recycling Industries Annual Survey 2013-14

Figures
Figure 1 Resource recovery rate of solid waste, Victoria 2004-05 to 2013-14.......................................7
Figure 2 Total waste generation relative to economic and population trends,Victoria 2004-05 to 2013-14...............................................................................................8
Figure 3 Waste generation, Victoria 2004-05 to 2013-14.....................................................................8
Figure 4 Recovery of Food organics, Victoria 2004-05 to 2013-14.......................................................9
Figure 5 Source sectors of secondary-use material received for reprocessing (by weight),excluding imports, Victoria 2013-14....................................................................................9
Figure 6 Metropolitan and regional material recovered in Victoria, 2013-14........................................10
Figure 7 Flow of material for reprocessing, Victoria 2013-14..............................................................11
Figure 8 Resource recovery rate of solid waste, Victoria 2004-05 to 2013-14.....................................13
Figure 9 Waste generation, Victoria 2004-05 to 2013-14...................................................................13
Figure 10 Total waste generation relative to economic and population trends,Victoria 2004-05 to 2013-14.............................................................................................14
Figure 11 Composition of material recovered for reprocessing (by weight),Victoria 2013-14..............................................................................................................15
Figure 12 Source sectors of secondary-use materials received for reprocessing (by weight),excluding imports, Victoria 2013-14 and 2012-13..............................................................16
Figure 13 Material reprocessed* and exported overseas or interstate,Victoria 2004-05 to 2013-14.............................................................................................18
Figure 14 Recovered material exported overseas and interstate by material type, 2013-14.................18
Figure 15 Recovered material remaining in Victoria by material type (excl. Aggregates, masonry & soil material), 2013-14.......................................................18
Figure 16 Composition of Metal recovered for reprocessing (by weight),Victoria 2013-14 and 2012-13..........................................................................................21
Figure 17 Metal recovered for reprocessing, Victoria 2004-05 to 2013-14..........................................22
Figure 18 Source sectors of scrap Metal received for reprocessing (by weight),Victoria 2013-14 and 2012-13..........................................................................................22
Figure 19 Composition of Aggregates, masonry & soil material recovered for reprocessing(by weight), Victoria 2013-14 and 2012-13........................................................................24
Figure 20 Aggregates, masonry & soil material recovered for reprocessing,Victoria 2004-05 to 2013-14.............................................................................................25
Figure 21 Source sectors of Aggregates, masonry & soil material received for reprocessing (by weight), Victoria 2013-14 and 2012-13........................................................................25
Figure 22 Composition of Paper / Cardboard recovered for reprocessing (by weight),Victoria 2013-14 and 2012-13..........................................................................................27
Figure 23 Paper / Cardboard recovered for reprocessing, Victoria 2004-05 to 2013-14......................28
Figure 24 Source sectors of Paper / Cardboard received for reprocessing (by weight),Victoria 2013-14 and 2012-13..........................................................................................28
Figure 25 Organic material recovered for reprocessing, Victoria 2004-05 to 2013-14..........................29
Victorian Recycling Industries Annual Survey 2013-14iv
Figure 26 Composition of Organic material recovered for reprocessing (by weight),Victoria 2013-14 and 2012-13..........................................................................................29
Figure 27 Food organics recovered for reprocessing 2004-05 to 2013-14..........................................30
Figure 28 Garden organics material recovered for reprocessing, Victoria 2004-05 to 2013-14............30
Figure 29 Source sectors of Organic material received for reprocessing (by weight),Victoria 2013-14 and 2012-13..........................................................................................31
Figure 30 Composition of Glass recovered for reprocessing (by weight),Victoria 2013-14 and 2012-13..........................................................................................32
Figure 31 Glass recovered for reprocessing, Victoria 2004-05 to 2013-14..........................................33
Figure 32 Source sectors of Glass received for reprocessing (by weight),Victoria 2013-14 and 2012-13..........................................................................................33
Figure 33 Composition of Plastic recovered for reprocessing (by weight),Victoria 2013-14 and 2012-13..........................................................................................34
Figure 34 Plastic recovered for reprocessing, Victoria 2004-05 to 2013-14........................................35
Figure 35 Source sectors of Plastic received for reprocessing, Victoria 2013-14 and 2012-13.............35
Figure 36 Composition of Plastic received for reprocessing by polymer type, Victoria 2013-14............36
Figure 37 Composition of Rubber recovered for reprocessing (by weight),Victoria 2013-14 and 2012-13..........................................................................................37
Figure 38 Rubber recovered for reprocessing, Victoria 2004-05 to 2013-14.......................................38
Figure 39 Source sectors of Rubber received for reprocessing (by weight),Victoria 2013-14 and 2012-13..........................................................................................38
Figure 40 Composition of Textiles recovered for reprocessing (by weight),Victoria 2013-14 and 2012-13..........................................................................................39
Figure 41 Textiles recovered for reprocessing, Victoria 2004-05 to 2013-14.......................................40
Figure 42 Source sectors of Textiles received for reprocessing (by weight),Victoria 2013-14 and 2012-13..........................................................................................40
Victorian Recycling Industries Annual Survey 2013-14

Tables
Table 1 Total waste generation relative to economic and population trends – past ten years,..............14
Table 2 Total material types recovered for reprocessing, Victoria 2013-14 and 2012-13.....................15
Table 3 Total material types recovered for reprocessing – past ten years,Victoria 2013-14 and 2004-05..........................................................................................16
Table 4 Source sectors of material received by reprocessors, Victoria 2013-14..................................17
Table 5 Summary of end products for reprocessed plastics...............................................................19
Table 6 Total Metal recovered, Victoria 2013-14 and 2012-13...........................................................22
Table 7 Total Aggregates, masonry & soil material recovered, Victoria 2013-14 and 2012-13.............24
Table 8 Total Paper / Cardboard recovered, Victoria 2013-14 and 2012-13.......................................27
Table 9 Total Organic material recovered, Victoria 2013-14 and 2012-13..........................................30
Table 10 Total Glass recovered, Victoria 2013-14 and 2012-13.........................................................32
Table 11 Total Rubber recovered, Victoria 2013-14 and 2012-13......................................................37
Table 12 Total Textiles recovered in Victoria 2013-14 and 2012-13...................................................39
Table 13 Total material types recovered for reprocessing, Victoria 2004-05 to 2013-14......................43
Victorian Recycling Industries Annual Survey 2013-14vi

1. Executive summaryIn 2013-14 Victoria’s reprocessing sector maintained the previous year’s material recovery rate, reaching just below 8 million tonnes of material recovered and achieving a recovery rate of 70% (Figure 1). The total amount of material recovered for recycling in 2013-14 was 7.74 million tonnes, 3.6% less than in 2012-13.
Although the recovery of Metal waste increased by 11% against 2012-13, recovery of Aggregates, masonry & soil – which historically accounts for roughly half of all material recovered in Victoria – decreased by 10% during the same period. Recovery of Organic waste decreased by 5%, the lowest amount of Organic material recovered since 2009-10.
Nevertheless, Victoria retained its mantle as one of the leading states in waste and resource recovery, performing above the national average recovery rate (60%1) largely attributable to increased efficiencies in waste and resource recovery infrastructure and processes.
Figure 1 Resource recovery rate of solid waste, Victoria 2004-05 to 2013-14
55%60% 62% 61% 64% 66% 68% 69% 70% 70%
0%
10%
20%
30%
40%
50%
60%
70%
80%
90%
100%
2004–05 2005–06 2006–07 2007–08 2008–09 2009-10 2010-11 2011-12 2012-13 2013-14
Rec
over
y R
ate
Figure 2 shows that both waste generated per capita and waste generated for each million dollars of Gross State Product (GSP) have continued to decline over the past three years. Despite the number of Victorian residents increasing over this period, the amount of waste generated per capita has declined.
1 Waste Generation & Resource Recovery in Australia - Reporting period 2010-11 (2014)
Victorian Recycling Industries Annual Survey 2013-14
Figure 2 Total waste generation relative to economic and population trends, Victoria 2004-05 to 2013-14
1.97 2.03 1.99 1.96 1.93 2.09
2.28 2.11
2.02 1.91
43.6 43.5 40.6
37.5 36.6 38.3 39.6 35.8
33.7 31.8
-
10
20
30
40
50
60
0.0
0.4
0.8
1.2
1.6
2.0
2.4
2004–05 2005–06 2006–07 2007–08 2008–09 2009–10 2010-11 2011-12 2012-13 2013-14
Was
te p
er $
mill
ion
GS
P (t
onne
s)
Was
te p
er c
apita
(ton
nes)
Waste generated per capita Waste generated per $million GSP
The amount of waste sent to landfill grew 0.5%, increasing from 3.37 million tonnes in 2012-13 to 3.39 million tonnes in 2013-14.The amount of waste diverted from landfill for recycling decreased from 8.02 million tonnes to 7.74 million tonnes or 3.6% (Figure 3).
Figure 3 Waste generation, Victoria 2004-05 to 2013-14
0123456789
10111213
2004–05 2005–06 2006–07 2007–08 2008–09 2009-10 2010-11 2011-12 2012-13 2013-14
Tonn
es (m
illio
n)
total landfill waste – Victoria total recovery – Victoria
Despite the challenges posed by the fluctuating global commodities market and other factors, Victoria’s resource recovery industry has demonstrated resilience, with growth in particular streams (e.g. Metal and Rubber) and declines in others (e.g. Aggregates, masonry & soil and Organics).
1.1 Key increases in materials recovered for reprocessingIn 2013-14, recovered Metal increased to 1.55 million tonnes – the largest amount reported since records began and 11% more than in 2012-13.
After trending downward for three consecutive years, in 2013-14 the recovery of Car bodies increased to 99,000 tonnes from 77,000 tonnes in 2012-13. Although this is an increase of 28% from the previous year, the recovery levels have not yet matched those of 2009-10 when it was as high as 153,000 tonnes.
The recovery of Soil and sand increased by 26% in 2013-14 to 84,000 tonnes. Although a considerable increase since 2012-13, recovery of Soil and sand in 2013-14 was still far from reaching the 170,000
Victorian Recycling Industries Annual Survey 2013-148

tonnes recovered during the 2008-09 period.
For the third year in a row, recovery of Food organics – sourced almost entirely from the ‘Commercial & Industrial’ sector and consisting of by-products from the manufacture of dairy, confectionary, bread and other food stuffs – increased by 34% to 73,000 tonnes in 2013-14. This increase over the past two years is largely due to additional tonnages reported by new organics reprocessors and is indicative of the volatile nature of food organics reprocessing (Figure 4).
Figure 4 Recovery of Food organics, Victoria 2004-05 to 2013-14
0
10
20
30
40
50
60
70
80
2004–05 2005–06 2006–07 2007–08 2008–09 2009-10 2010-11 2011-12 2012-13 2013-14
Tonn
es ('
000)
1.3 Main decreases in materials recovered for reprocessingAfter jumping by 14% from 2011-12 to 2012-13, the recovery of Aggregates, masonry & soil material decreased by 10% in 2013-14, totalling 3.57 million tonnes. A large part of this drop is attributable to a 46% reduction in the recovery of Mixed construction and demolition waste.
Much of this reduction can be attributed to stockpiling of Mixed construction and demolition waste by a major C&D reprocessor resulting in a reduced demand for the material. Rock / excavation stone decreased by 19% while Asphalt recovery also fell by 10%.
Garden organics continued its downward trend, falling by 11% to 359,000 tonnes recovered, a similar amount to 2009-10.
1.4 Sources of material
The Victorian Recycling Industries Annual Survey is a survey of reprocessors, and as a consequence data is collected at the end of the waste system before the material becomes a product. This means that although the survey cannot specify the point-of-origin of materials, it provides a good indication of where recovered material is managed.
Of the material received for reprocessing during 2013-14, 84% was sourced from industry, down from 85% in 2012-13. Of that industry total, 46% was received from the ‘Construction & Demolition’ sector, which decreased its share by 12 percentage points, and 38% came from ‘Commercial & Industrial’ operations, which increased its share by 11 percentage points since 2012-13 (Figure 5).
The contribution of the ‘Municipal’ sector to materials received for reprocessing – primarily sourced from kerbside collections – was up by one percentage point to 16%.
Victorian Recycling Industries Annual Survey 2013-14
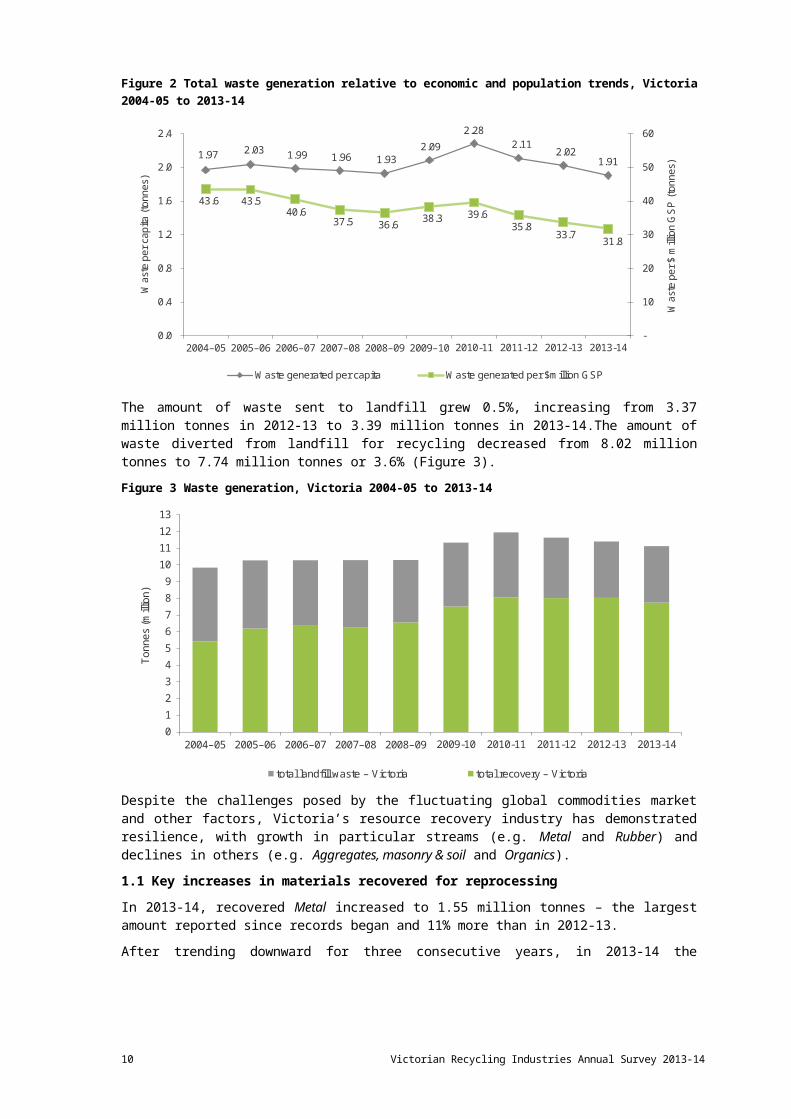
Figure 5 Source sectors of secondary-use material received for reprocessing (by weight), excluding imports, Victoria 2013-14
Municipal16%
Construction & Demolition
46%
Commercial & Industrial
38%
In 2013-14, the proportion of material recovered in Victoria that remained in the State for reprocessing did not change compared to the year before. A total of 84% of all the material recovered was processed in Victoria, while international exports of waste material represented the remaining 16%.
Figure 6 shows that even though the bulk of all material recovered in Victoria ends up in Melbourne for reprocessing or export, a quarter of the total is reprocessed in regional Victoria.
Figure 6 Metropolitan and regional material recovered in Victoria, 2013-14
Regional25%
Metropolitan75%
Note: Due to a lack of data granularity, it is assumed for the purposes of the above graph that all plastics are sent to the
Metropolitan area for reprocessing or export.
Victorian Recycling Industries Annual Survey 2013-1410

2. IntroductionThe Victorian Recycling Industries Annual Survey (VRIAS) is a voluntary census of the Victorian Reprocessing sector. For the 2013-14 VRIAS a total of sixty eight (68) reprocessors were contacted. The responses of sixty two (62) reprocessors were collated and analysed to produce this report.
Each year, Sustainability Victoria collects detailed data on the Victorian reprocessing industry through a voluntary industry-wide survey. The VRIAS provides the central source of information to monitor Victoria’s recycling industry performance.
As well as monitoring the performance of Victoria’s reprocessors and the amount of solid waste diverted from landfill, this survey:
provides an understanding of the current and historical state of materials recovery and reprocessing across a number of sectors and material types;
is used to measure the performance of Victorian government waste strategies;
communicates the achievements of industry to government, business and the community; and
demonstrates the benefits of recycling to industry and the public at large.
Recycling and reprocessing are well-established activities in Victoria. The reprocessing industry recovers a wide range of recyclable material from the waste stream for reuse in the production of commodities such as metal, concrete, plastics, glass and compost. Materials recovered by the reprocessing industry are predominantly from within Victoria, with a small amount received from interstate. Although Victoria’s current reprocessing capacity is predominantly local, some waste material is exported interstate or overseas for reprocessing (Figure 7).
Figure 7 Flow of material for reprocessing, Victoria 2013-14
Victorian Recycling Industries Annual Survey 2013-14

Of the 7.74 million tonnes of material that was recovered in Victoria in 2013-14:
1.5% of the material was received from interstate;
no material was imported from overseas;
16% of the material was exported overseas;
less than 1% of the material was sent interstate; and
84% of the material remained in Victoria.
Material for reprocessing is sourced from three sectors across Victoria: ‘Construction & Demolition’ (C&D), ‘Commercial & Industrial’ (C&I), and ‘Municipal’.
The primary reprocessing industries in Victoria are:
smelters and foundries of steel, aluminium and other non-ferrous metal;
crushing plants and auxiliary screening of concrete, brick, asphalt and related materials;
paper / cardboard and de-inking pulp mills;
composting facilities;
glass product manufacturers;
rubber product manufacturers; and
plastics reprocessors.
These and other reprocessing operations make a significant contribution to the Victorian economy in employment and investment, and generate substantial cost savings in the production of more affordable (but usually similarly effective) recycled materials. Among the environmental benefits of reprocessing materials are:
reduced greenhouse gases (methane emissions) from landfill and energy-intensive primary production processes;
savings in water and electricity in the production of metal, concrete, paper and glass by using recycled feedstock;
savings of raw materials, for example mineral ores used in virgin metal production and timber and oil used in paper production; and
reduced groundwater and soil contamination from landfill, and the preservation of landfill space.
The Victorian Recycling Industries Annual Survey 2013-14 was conducted in September 2014 and January 2015 and sought data from 68 Victorian reprocessors, excluding 54 plastic reprocessors surveyed as part of the 2013-14 National Plastics Recycling Survey2. A total of 62 reprocessors, or 91% responded to the survey. It is estimated that the data collected from respondents accounts for more than 95% by weight of all material recovered in Victoria.
Although Sustainability Victoria has sought to verify information provided in survey returns with individual reprocessors, it is not possible to validate all of the data in this report.
Survey findings are subject to the accuracy of data provided by individual reprocessors, and caution is advised when comparing data. For more information on the survey approach, please refer to the detailed methodology in Appendix A.
2Sustainable Resource Use, 2013-14 National Plastics Recycling Survey
Victorian Recycling Industries Annual Survey 2013-1412

3. Total materials recovered for recycling3.1 Recovery and trendsIn 2013-14, Victoria’s reprocessing sector maintained the previous year’s rate of solid waste recovered for recycling, recovering 7.74 million tonnes of materials and achieving a recovery rate of 70%. (Figure 8).
Figure 8 Resource recovery rate of solid waste, Victoria 2004-05 to 2013-14
55%60% 62% 61% 64% 66% 68% 69% 70% 70%
0%
10%
20%
30%
40%
50%
60%
70%
80%
90%
100%
2004–05 2005–06 2006–07 2007–08 2008–09 2009-10 2010-11 2011-12 2012-13 2013-14
Rec
over
y R
ate
In 2013-14, the amount of waste sent to landfill was 3.39 million tonnes. This represents 0.5% more than in the previous period of 2012-13 (Figure 9). During the same period, the amount of waste diverted from landfill for recycling decreased by 3.6%, from 8.02 million tonnes to 7.74 million tonnes.
Figure 9 Waste generation, Victoria 2004-05 to 2013-14
0123456789
10111213
2004–05 2005–06 2006–07 2007–08 2008–09 2009-10 2010-11 2011-12 2012-13 2013-14
Tonn
es (m
illio
n)
total landfill waste – Victoria total recovery – Victoria
Waste generation per capita fell to 1.91 tonnes in 2013-14, a decrease of 0.11 tonnes per person (5.9%) since 2012-13. The amount of material recovered per capita fell to 1.32 tonnes, which is 0.11
Victorian Recycling Industries Annual Survey 2013-14
tonnes per person or 7% less than 2012-13. Waste generation relative to Gross State Product (GSP) fell by 5.8% in 2013-14 to 31.8 tonnes of waste generated for every million dollars of GSP (Figure 10 and Table 1).
Figure 10 Total waste generation relative to economic and population trends, Victoria 2004-05 to 2013-14
1.97 2.03 1.99 1.96 1.93 2.09
2.28 2.11
2.02 1.91
43.6 43.5 40.6
37.5 36.6 38.3 39.6 35.8
33.7 31.8
-
10
20
30
40
50
60
0.0
0.4
0.8
1.2
1.6
2.0
2.4
2004–05 2005–06 2006–07 2007–08 2008–09 2009–10 2010-11 2011-12 2012-13 2013-14
Was
te p
er $
mill
ion
GS
P (t
onne
s)
Was
te p
er c
apita
(ton
nes)
Waste generated per capita Waste generated per $million GSP
Note: Historical figures have been recalculated and updated using rebased GSP and population figures sourced from the ABS.
Table 1 Total waste generation relative to economic and population trends – past ten years,
Victoria 2004-05 to 2013-14
Report year 04-05 05-06 06-07 07-08 08-09 09-10 10-11 11-12 12-13 13-14
TonnesWaste generated per capita
1.97 2.03 1.99 1.96 1.93 2.09 2.28 2.11 2.02 1.91
TonnesWaste generated per $million GSP
43.6 43.5 40.6 37.5 36.6 38.3 39.6 35.8 33.7 31.8
Tonnes (million)Total Waste Generation 9.84 10.27 10.28 10.29 10.30 11.32 12.34 11.69 11.40 11.13
3.2 Composition of material
The types of solid material recovered for reprocessing in 2013-14 is presented in Figure 11. Aggregates, masonry & soil accounted for 46% of all material recovered for reprocessing by weight, while Metal and Paper / Cardboard accounted for 20% and 18% respectively.
Victorian Recycling Industries Annual Survey 2013-1414

Figure 11 Composition of material recovered for reprocessing (by weight), Victoria 2013-14
Aggregates, masonry & soil
46%
Metal waste20%
Paper waste18%
Organic waste11%
Glass, Plastic, Rubber and Textile waste
5%
A summary of material recovered in Victoria for reprocessing in 2013-14 is shown in Table 2. Trend data for each material type recovered for reprocessing in the past 10 years is reported in Appendix B.
Table 2 Total material types recovered for reprocessing, Victoria 2013-14 and 2012-13
Material type
Total recovery in
Victoria 2013-14
Total recovery in
Victoria 2012-13
Change* since
2012-13
Tonnes (‘000) Tonnes (‘000) (%)
Aggregates, masonry & soil 3,573 3,985 -10%
Metal 1,549 1,390 11%
Paper / Cardboard 1,394 1,394 0%
Organics 827 870 -5%
Glass 164 167 -2%
Plastic 150 152 -1%
Rubber 77 64 21%
Textiles 3 4 -21%
Total 7,739 8,026 -3.6%
Note: Percentage change has been based on actual figures rather than the rounded figures shown above.
After increasing by 14% between 2011-12 and 2012-13, the recovery of Aggregates, masonry & soil material decreased by 10% in 2013-14, totalling 3.57 million tonnes.
In 2013-14, recovered Metal rose to 1.55 million tonnes. This is the largest reported amount since the collection of data began in 1993-94, and 11% more than in 2012-13.
Paper / Cardboard recovered in Victoria maintained the same recovery rate as 2012-13 – 1.39 million tonnes – after decreasing in the previous survey by 16% from 2011-12 to 2012-13.
Table 3 shows that over the past ten years, the recovery of each material category has increased considerably. The one exception to this is the recovery of Textiles, which industry sources indicate is partially due to a decrease in the recovery of waste emanating from the textile manufacturing industry.
Victorian Recycling Industries Annual Survey 2013-14
Further information and analysis of recovery levels for each material type is provided in Sections 4to 11 of this report.
Table 3 Total material types recovered for reprocessing – past ten years, Victoria 2013-14 and 2004-05
Material Type
Total recovery in
Victoria 2013-14
Total recovery in
Victoria 2004-05
Change since
2004-05
Tonnes (‘000) Tonnes (‘000) (%)
Aggregates, masonry & soil 3,573 2,492 43%
Metal 1,549 1,156 34%
Paper / Cardboard 1,394 936 49%
Organics 827 618 34%
Glass 164 102 60%
Plastic 150 94 59%
Rubber 77 22 254%
Textiles 3 4 -16%
Total 7,739 5,427 43%
Note: Percentage change has been based on actual figures rather than the rounded figures shown above. The decision to
compare current data with data from ten years ago reflects increased and continuous improvements in data quality up until 2005-
06.
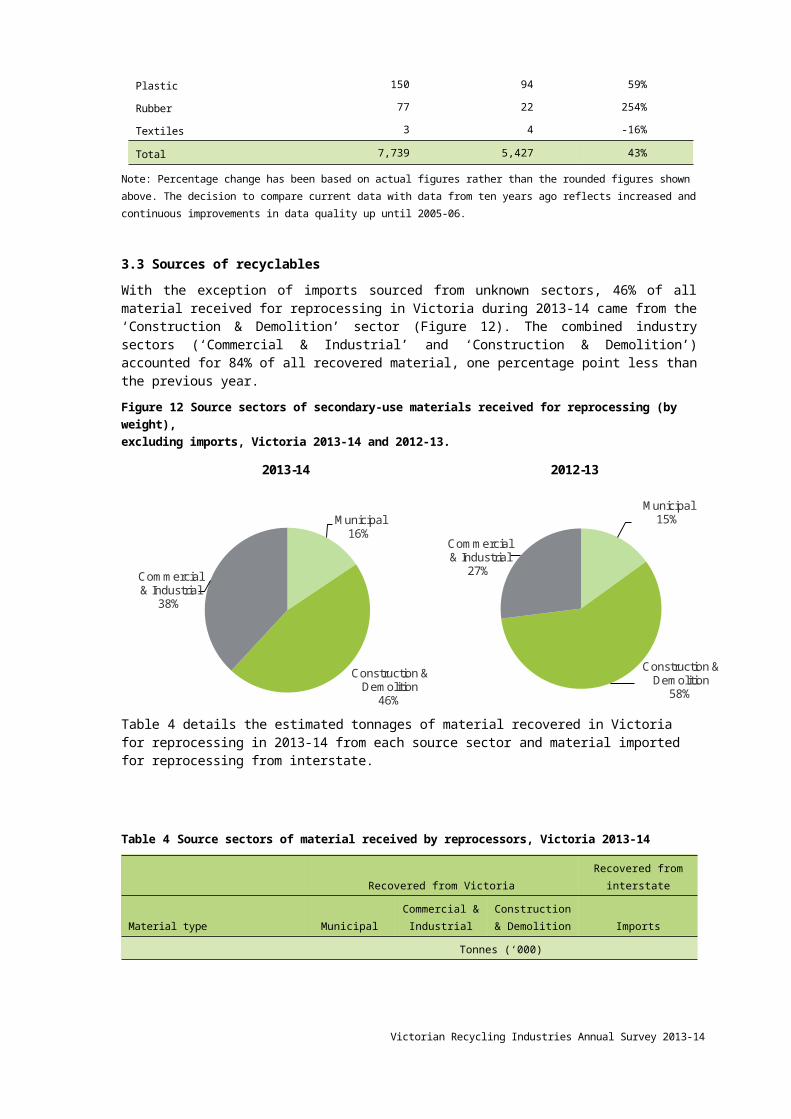
3.3 Sources of recyclables
With the exception of imports sourced from unknown sectors, 46% of all material received for reprocessing in Victoria during 2013-14 came from the ‘Construction & Demolition’ sector (Figure 12). The combined industry sectors (‘Commercial & Industrial’ and ‘Construction & Demolition’) accounted for 84% of all recovered material, one percentage point less than the previous year.
Figure 12 Source sectors of secondary-use materials received for reprocessing (by weight), excluding imports, Victoria 2013-14 and 2012-13.
Municipal16%
Construction & Demolition
46%
Commercial & Industrial
38%
2013-14
Municipal15%
Construction & Demolition
58%
Commercial & Industrial
27%
2012-13
Table 4 details the estimated tonnages of material recovered in Victoria for reprocessing in 2013-14 from each source sector and material imported for reprocessing from interstate.
Victorian Recycling Industries Annual Survey 2013-1416
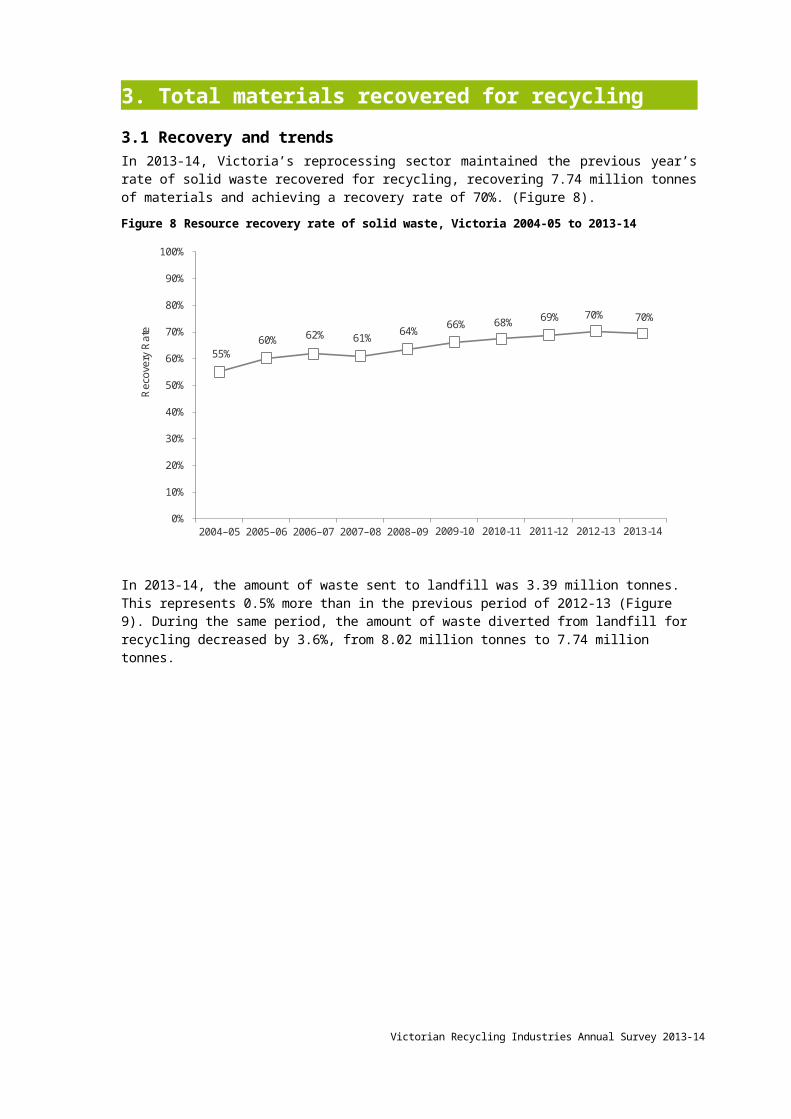
Table 4 Source sectors of material received by reprocessors, Victoria 2013-14
Recovered from Victoria
Recovered from
interstate
Material type Municipal
Commercial &
Industrial
Construction &
Demolition Imports
Tonnes (‘000)
Aggregates, masonry & soil 25 106 3,442 –
Metal 359 1,096 94 13
Paper / Cardboard 252 1,141 – 49
Organic 388 411 27 34
Glass 109 38 17 <1
Plastic 68 82 1 5
Rubber 2 75 – 11
Textiles 3 – – <1
Total 1,207 2,950 3,581 112
Note: Figures reported for the material received by source sector have been extrapolated to include the relative proportions derived from reported data and applied to surveys that did not provide a source sector for the different material types and the export data from the Australian Bureau of Statistics. These proportions were not applied to imports. Figures reported in the table have been rounded to the nearest thousand and individual columns may therefore not add up to the totals reported elsewhere.
3.4 Reprocessing and exportsThe survey results enable comparisons between the quantities of material recovered for reprocessing in Victorian plants and those exported interstate or overseas for reprocessing. While exports have increased steadily over the past six years, Victoria’s current resource reprocessing is still predominantly local (Figure 13). The key materials exported are scrap metal, paper, plastics and rubber, all globally traded commodities used in recycling operations worldwide.
Lower value materials, such as waste from construction and demolition activities, garden organics and glass fines, are rarely, if at all, exported as it is financially prohibitive to do so.
During 2013-14, over 6.43 million tonnes of recovered material remained in Victoria to be reprocessed in local plants. This represents a decrease of 7% over the 6.89 million tonnes reprocessed locally in 2012-13, and accounts for 84% of all recovered material.
By contrast, material exported from Victoria for reprocessing increased by 15% to 1.3 million tonnes, the highest annual Victorian waste export tonnage ever recorded.
This overall increase is mostly due to a considerable growth in exports of Metal waste and Rubber waste by 33% and 118% respectively. Paper / Cardboard, on the other-hand, increased marginally (3%) compared to the previous period.
Not all categories, however, saw an increase in exports during 2013-14. The amount of Organic material exported, for example, decreased by 8%.
It’s thought that most of the recovered material currently exported had previously been sent to landfill, with a proportion of it coming from stockpiles.
Victorian Recycling Industries Annual Survey 2013-14

Figure 13 Material reprocessed* and exported overseas or interstate, Victoria 2004-05 to 2013-14
0
1
2
3
4
5
6
7
8
9
2004–05 2005–06 2006–07 2007–08 2008–09 2009-10 2010-11 2011-12 2012-13 2013-14
Tonn
es (m
illio
n)
Recovered material remaining in Victoria Recovered material exported overseas & interstate
*Note: The two data sources in the above figure combine to create a cumulative total.
Figure 14 depicts the materials sent overseas and interstate for reprocessing, while the proportion of material that remains in Victoria is illustrated in Figure 15. Metal and Paper / Cardboard waste account for the majority of the exported material equating to 88% combined.
Figure 14 Recovered material exported overseas and interstate by material type, 2013-14.
Textile waste<1%
Rubber waste
4%Plastic waste
7%Glass waste<1%
Paper waste48%Organic
waste1%
Metal waste40%
Please note that Aggregates, masonry & soil, does not appear in Figure 14 as no material was exported overseas or interstate for reprocessing
Victorian Recycling Industries Annual Survey 2013-1418
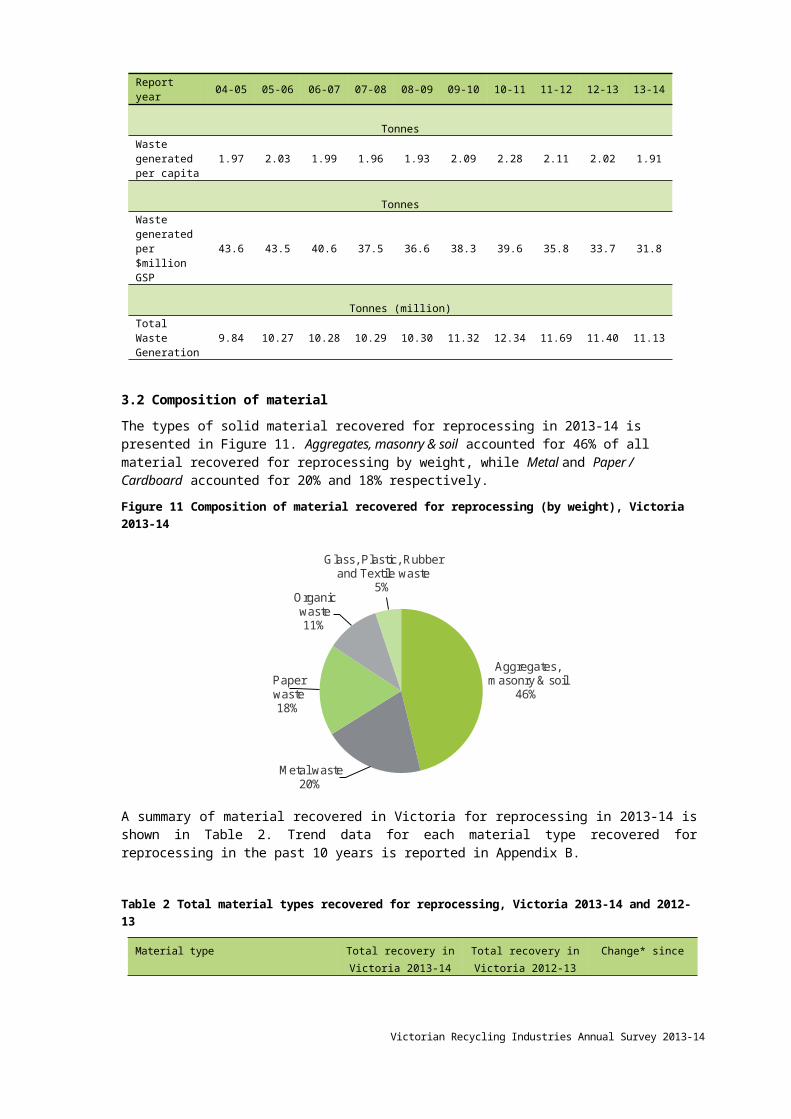
Figure 15 Recovered material remaining in Victoria by material type (excl. Aggregates, masonry & soil material), 2013-14
Textile waste<1%
Rubber waste
1%
Plastic waste
2% Glass waste
6%
Paper waste27%
Organic waste28%
Metal waste36%
3.5 Product marketsOnce reprocessed, materials are directed into different markets according to quality and degree of processing required. Commonly reprocessed industrial materials, such as metal and rubber, are generally sold into the manufacturing industry for production of new metal or rubber products. Recovered glass and paper are usually manufactured back into glass and paper. Although paper can be recycled seven or eight times before it loses its ‘recyclability’, glass bottles and jars can generally be recycled indefinitely.
Aggregates, masonry & soil material is usually directed back into the construction industry as recycled concrete, brick and rubble, which is used to build the load-bearing ‘base’ layers of roads and pavements.
Organic waste is processed at licensed facilities where it is turned into composted soil conditioner and mulch products. Often these materials are then blended with other soil products to be sold by nurseries or used in the landscaping industry. More recycled organic products are now used in high-value applications such as intensive horticulture and viticulture.
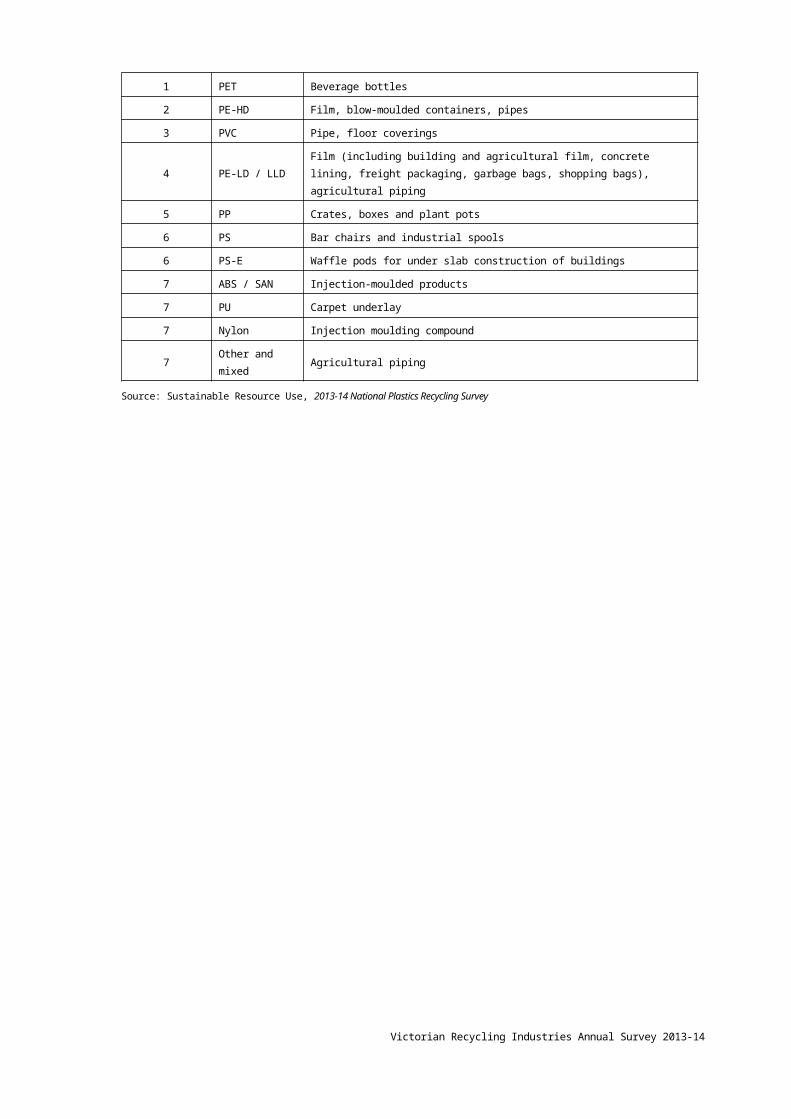
Plastics recovered from the waste stream are reprocessed into an ever-growing range of valuable packaging, construction, household and automotive goods. The 2013-14 National Plastics Recycling Survey listed the main products derived from Australian plastics reprocessing operations (Table 5).
Table 5 Summary of end products for reprocessed plastics
Plastics code Polymer Major uses
1 PET Beverage bottles
2 PE-HD Film, blow-moulded containers, pipes
3 PVC Pipe, floor coverings
4 PE-LD / LLD Film (including building and agricultural film, concrete lining, freight packaging, garbage
bags, shopping bags), agricultural piping
5 PP Crates, boxes and plant pots
6 PS Bar chairs and industrial spools
6 PS-E Waffle pods for under slab construction of buildings
Victorian Recycling Industries Annual Survey 2013-14

7 ABS / SAN Injection-moulded products
7 PU Carpet underlay
7 Nylon Injection moulding compound
7 Other and mixed Agricultural piping
Source: Sustainable Resource Use, 2013-14 National Plastics Recycling Survey
Victorian Recycling Industries Annual Survey 2013-1420
4. Metal4.1 Recovery and trendsVictoria’s scrap metal recovery increased by 11% to 1,549,000 tonnes in 2013-14, the largest annual tonnage recorded.
Continuing the pattern of previous years, Steel (including packaging steel) made up the largest proportion of Victoria’s recovered Metal material in 2013-14, increasing by 11% to over 1.25 million tonnes (Figure 16 and Table 6). Recovery of Car bodies and Non-ferrous metal increased by 28% and 12% respectively, while Batteries fell by 4% continuing to trend downward since reaching a record high of 37,000 tonnes in 2009-10. This is largely due to reprocessing of batteries shifting interstate and as this report surveys Victorian reprocessors, it is not currently possibly to account for the flow of waste batteries out of Victoria.
In 2008-09 Aluminium (incl. cans) dipped to its lowest annual recovery since the 1990s. Since then, this highly valuable and infinitely recyclable material has continued a steady upward trend, reaching just short of 93,000 tonnes in 2013-14. This is a very similar recovery to 2012-13. The bulk of this figure (64,000 tonnes) was exported overseas and, of this, 46% (30,000 tonnes) was exported to China.
Over half of the total Metal exported overseas was received by two countries. Thailand accounted for 37% while Taiwan accounted for 17%. In addition, Metal exported to China and Malaysia represented 10% for each3.
Figure 16 Composition of Metal recovered for reprocessing (by weight), Victoria 2013-14 and 2012-13
Aluminium (incl. cans)7% Batteries
1%Car bodies
6% Non-ferrous
6%Other & mixed metals<1%
Steel (incl. packaging steel)
80%
2012-13
Aluminium (incl. cans)6%
Batteries1%
Car bodies6% Non-
ferrous6%
Other & mixed metals<1%
Steel (incl. packaging steel)
81%
2013-14
3 International Merchandise Trade, Australian Bureau of Statistics 2013-14
Victorian Recycling Industries Annual Survey 2013-14
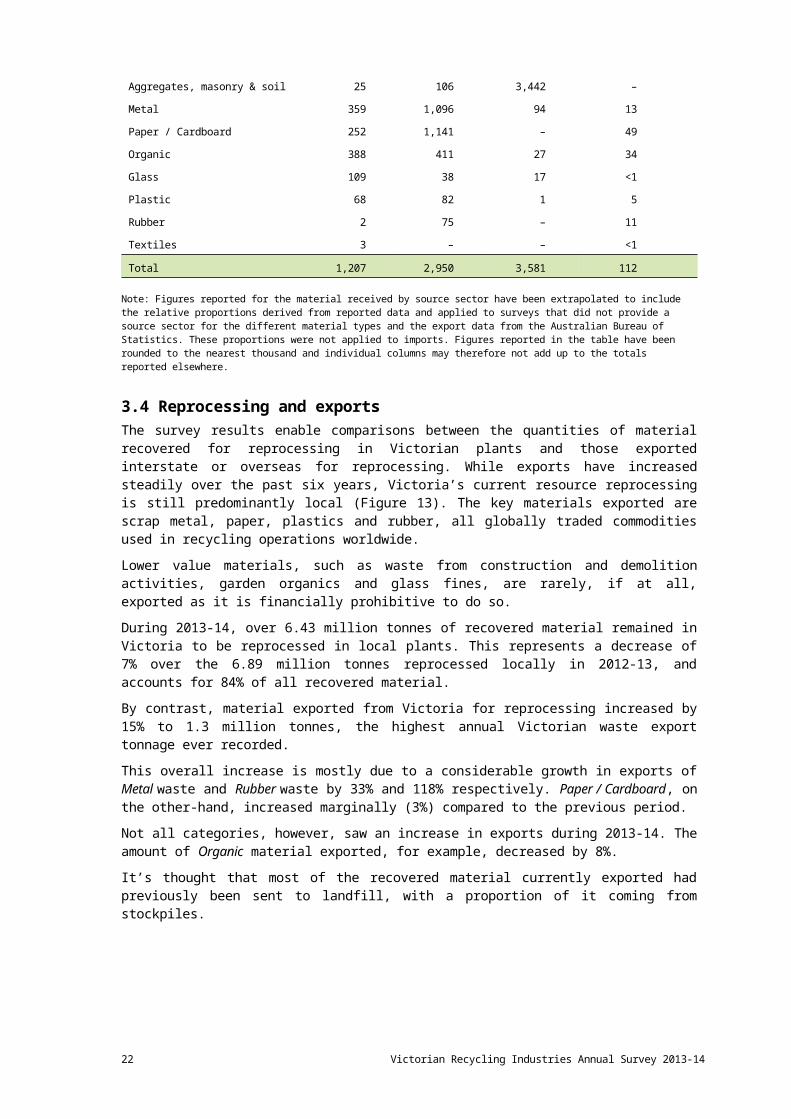
Table 6 Total Metal recovered, Victoria 2013-14 and 2012-13
Category Total recovery in Victoria 2013-14
Total recovery in Victoria 2012-13
Change since
2012-13 Tonnes (‘000) Tonnes (‘000) (%) Aluminium (incl. cans) 93 93 0% Batteries 6 7 -4% Car bodies 99 77 28% Non-ferrous 86 78 12% Other & mixed metal 4 3 31% Steel (incl. packaging steel) 1,258 1,131 11%Total 1,548 1,390 11%
Figure 17 illustrates that, despite significant fluctuations over the past ten years, Metal recovery in Victoria has remained steady since 2009-10.
It should be noted that because global markets for individual metals operate independently from each other, any in-depth survey of Victorian metal recovery should consider each individual metal category in isolation.
Figure 17 Metal recovered for reprocessing, Victoria 2004-05 to 2013-14
0.0
0.2
0.4
0.6
0.8
1.0
1.2
1.4
1.6
1.8
2004–05 2005–06 2006–07 2007–08 2008–09 2009-10 2010-11 2011-12 2012-13 2013-14
Tonn
es (m
illio
n)
4.2 Sources of recyclablesThe ‘Commercial & Industrial’ sector remains Victoria’s principal source of recovered Metal, accounting for 71% of material received for reprocessing across the State. Both the ‘Commercial & Industrial’ and the ‘Municipal’ sectors increased by two percentage points from 2012-13 (Figure 18). Material sourced from the ‘Construction & Demolition’ sector decreased by four percentage points, contributing to just 6% of all Victorian metal recovered.
There were no recovered metal imports reported by any Victorian metal reprocessors in the 2013-14 financial year.
Victorian Recycling Industries Annual Survey 2013-1422

Figure 18 Source sectors of scrap Metal received for reprocessing (by weight), Victoria 2013-14 and 2012-13
Municipal21%
Construction & Demolition
10%
Commercial & Industrial
69%
2012-13
Municipal23%
Construction & Demolition
6%Commercial & Industrial
71%
2013-14
Victorian Recycling Industries Annual Survey 2013-14

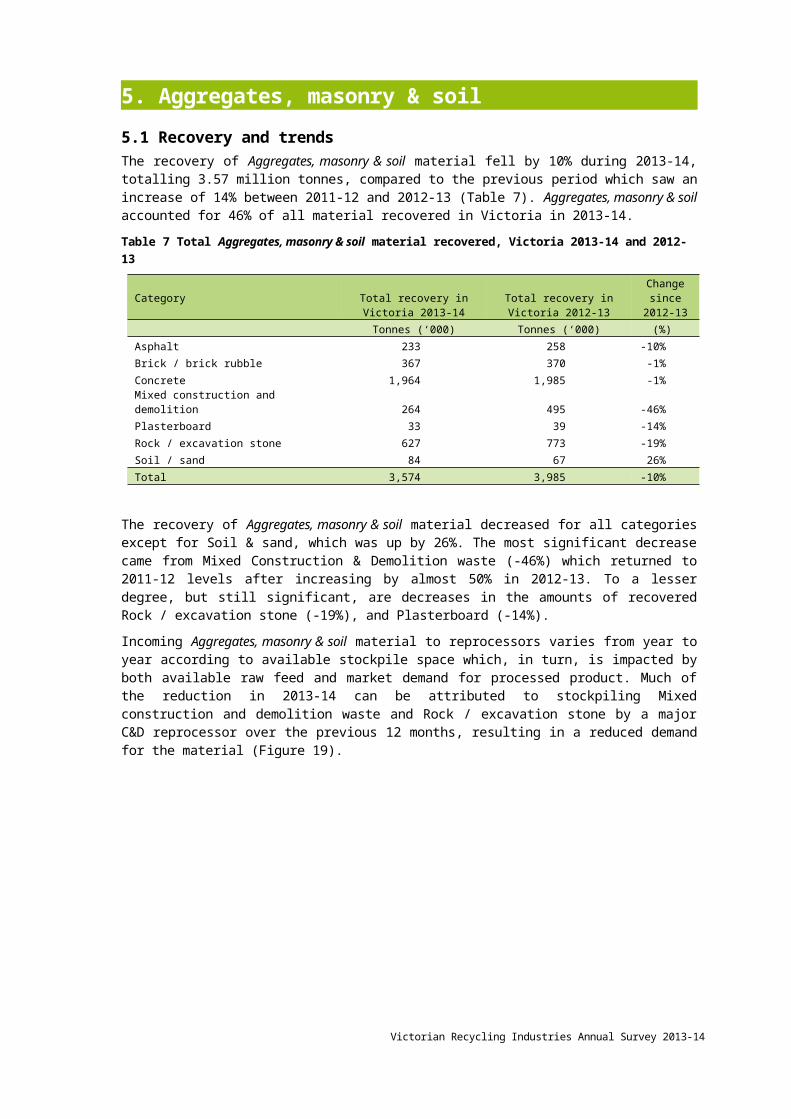
5. Aggregates, masonry & soil5.1 Recovery and trendsThe recovery of Aggregates, masonry & soil material fell by 10% during 2013-14, totalling 3.57 million tonnes, compared to the previous period which saw an increase of 14% between 2011-12 and 2012-13 (Table 7). Aggregates, masonry & soil accounted for 46% of all material recovered in Victoria in 2013-14.
Table 7 Total Aggregates, masonry & soil material recovered, Victoria 2013-14 and 2012-13
Category Total recovery in Victoria 2013-14
Total recovery in Victoria 2012-13
Change since
2012-13 Tonnes (‘000) Tonnes (‘000) (%) Asphalt 233 258 -10%Brick / brick rubble 367 370 -1%Concrete 1,964 1,985 -1%Mixed construction and demolition 264 495 -46%Plasterboard 33 39 -14%Rock / excavation stone 627 773 -19%Soil / sand 84 67 26%Total 3,574 3,985 -10%
The recovery of Aggregates, masonry & soil material decreased for all categories except for Soil & sand, which was up by 26%. The most significant decrease came from Mixed Construction & Demolition waste (-46%) which returned to 2011-12 levels after increasing by almost 50% in 2012-13. To a lesser degree, but still significant, are decreases in the amounts of recovered Rock / excavation stone (-19%), and Plasterboard (-14%).
Incoming Aggregates, masonry & soil material to reprocessors varies from year to year according to available stockpile space which, in turn, is impacted by both available raw feed and market demand for processed product. Much of the reduction in 2013-14 can be attributed to stockpiling Mixed construction and demolition waste and Rock / excavation stone by a major C&D reprocessor over the previous 12 months, resulting in a reduced demand for the material (Figure 19).
Figure 19 Composition of Aggregates, masonry & soil material recovered for reprocessing (by weight), Victoria 2013-14 and 2012-13
Asphalt7%
Brick whole / brick rubble10%
Concrete50%
Mixed construction and demolition waste
12%
Plasterboard1%
Rock / excavation stone
19%
Soil / sand2%
2012-13
Asphalt7%
Brick whole / brick rubble10%
Concrete55%
Mixed construction and demolition waste
7%
Plasterboard1%
Rock / excavation stone
18%
Soil / sand2%
2013-14
Victorian Recycling Industries Annual Survey 2013-1424
Notwithstanding the 46% decrease of recovered Mixed construction and demolition waste, the recovery rate of this material is still indicative of its importance in the creation of a blended product used for road sub-base and drainage. This innovative use of low-value material provides numerous benefits to the construction industry by alleviating the need for time-intensive and costly source separation.
As well as significantly contributing to the reduction of waste to landfill across the State, the use of recycled concrete eases the electricity and water demands of conventional concrete production. It also cuts the cost of on-site processing and disposal into landfill for the ‘Construction & Demolition’ sector, and potentially provides more affordable inputs for civil and commercial construction.
Figure 20 shows the variation in the recovery of Aggregates, masonry & soil material over the past ten years.
Figure 20 Aggregates, masonry & soil material recovered for reprocessing, Victoria 2004-05 to 2013-14
0.0
0.5
1.0
1.5
2.0
2.5
3.0
3.5
4.0
4.5
2004–05 2005–06 2006–07 2007–08 2008–09 2009-10 2010-11 2011-12 2012-13 2013-14
Tonn
es (m
illio
n)
5.2 Sources of recyclablesThe vast majority of Aggregates, masonry & soil material recovered in Victoria (96%) is sourced directly from ‘Construction & Demolition’ sector activity (Figure 21), which provides a steady stream of Concrete, Brick rubble, Asphalt, Rock and Excavation stone. Facilities located close to the Melbourne CBD or urban renewal areas, however, traditionally receive more demolition waste, while facilities near growth areas (such as South Morang and Fisherman’s Bend) receive a greater proportion of construction waste.
Victorian Recycling Industries Annual Survey 2013-14

Figure 21 Source sectors of Aggregates, masonry & soil material received for reprocessing (by weight), Victoria 2013-14 and 2012-13
Municipal1%
Construction & demolition
98%
Commercial & industrial
1%
2012-13
Municipal1%
Construction & demolition
96%
Commercial &
industrial3%
2013-14
Commercial & Industrial
3%
Municipal1%
Victorian Recycling Industries Annual Survey 2013-1426

6. Paper / Cardboard6.1 Recovery and trendsThe amount of paper and cardboard recovered in 2013-14 matched the same level as 2012-13 at 1.39 million tonnes after previously falling by 16% from 2011-12 (Table 8).
Even though exports across most Paper / Cardboard categories were down in 2013-14, Other mixed paper exports increased by 9%, pushing the recovered amount of this category up by 15% from 2012-13. Printing & writing paper exports decreased by 24%, contributing to the total recovered decrease of this category by 52%.
Table 8 Total Paper / Cardboard recovered, Victoria 2013-14 and 2012-13
Category Total recovery in Victoria 2013-14
Total recovery in Victoria 2012-13
Change since
2012-13 Tonnes (‘000) Tonnes (‘000) (%) Cardboard / Packaging paper 621 635 -2% Newsprint / Magazines 171 185 -7% Other (mixed paper) 558 485 15% Printing & writing paper 43 89 -52%Total 1,394 1,394 0%
Although Other mixed paper increased by four percentage points and Cardboard / packaging paper decreased by three percentage points the relative proportions of the various categories that make up Paper / Cardboard recovery remained unchanged compared to 2013-14 (Figure 22).
Figure 22 Composition of Paper / Cardboard recovered for reprocessing (by weight), Victoria 2013-14 and 2012-13
Cardboard / packaging
paper45%
Newsprint / magazines
12%
Other (mixed paper)40%
Printing & writing paper
3%
2013-14
Cardboard / packaging
paper48%Newsprint /
magazines11%
Other (mixed paper)36%
Printing & writing paper
5%
2012-13
Figure 23 indicates that, with the exception on 2011-12 (which can be largely attributed to a spike in exports), recovery of Paper / Cardboard shows a gradual overall increase since 2004-05 and has remained relatively stable over the over the past two years.
.
Victorian Recycling Industries Annual Survey 2013-14
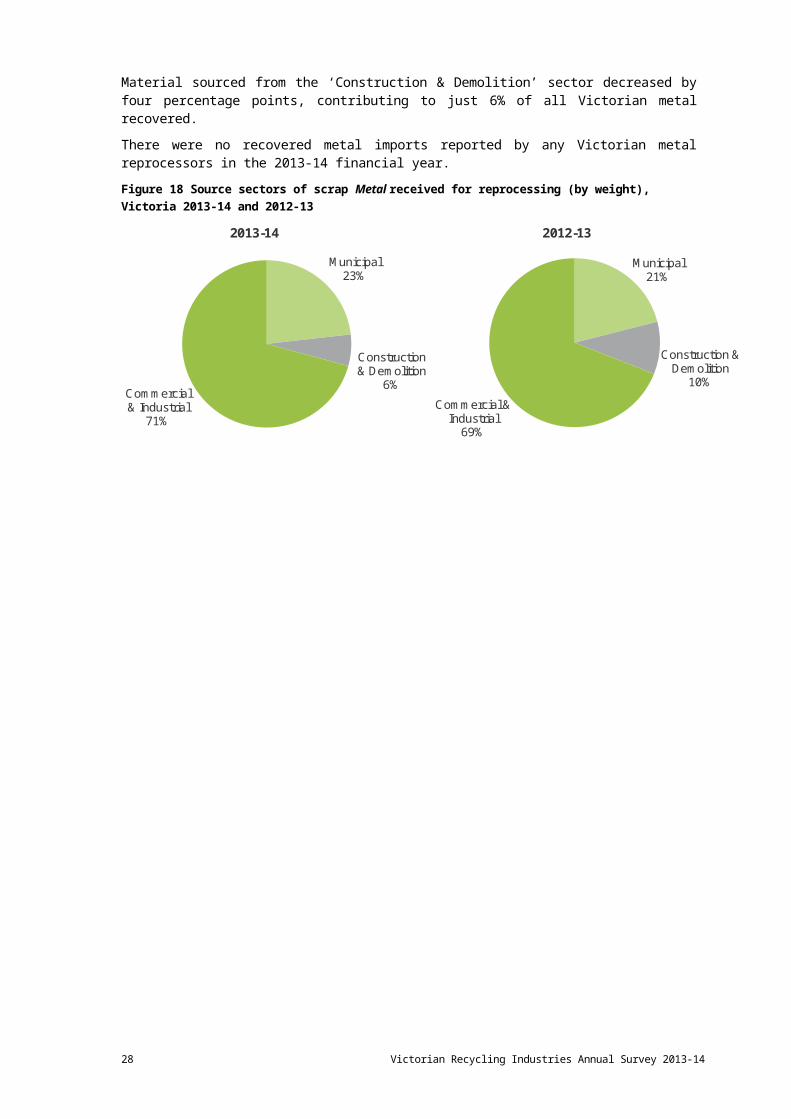
Figure 23 Paper / Cardboard recovered for reprocessing, Victoria 2004-05 to 2013-14
0.0
0.2
0.4
0.6
0.8
1.0
1.2
1.4
1.6
1.8
2004–05 2005–06 2006–07 2007–08 2008–09 2009-10 2010-11 2011-12 2012-13 2013-14
Tonn
es (m
illio
n)
Note: Figures for periods 2004-05 and 2005-06 were over reported and the amounts have not been able to be verified.
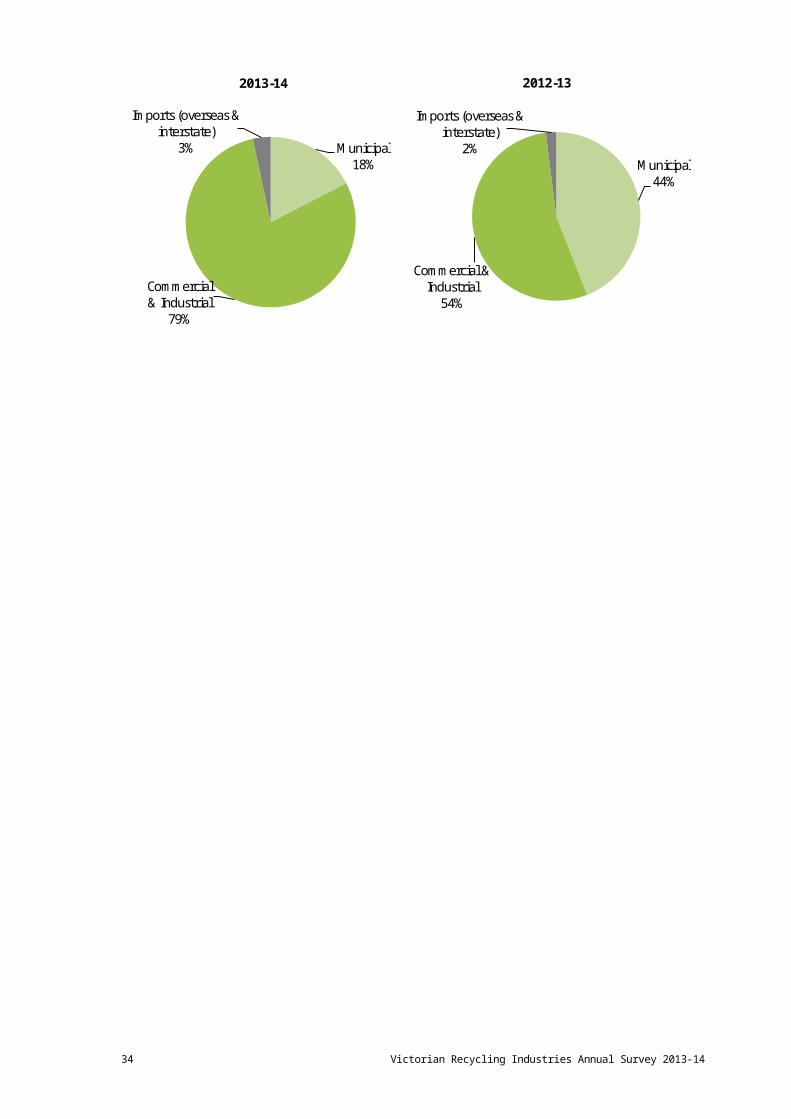
6.2 Sources of recyclablesPaper and cardboard reprocessed in Victoria comes from several different sources, with retailers and industrial facilities traditionally supplying much of the cardboard and paper packaging, while commercial collections from offices and schools account for most of the printing and writing paper.
In 2013-14, the ‘Commercial & Industrial’ sector contributed 79% of the State’s recovered Paper / Cardboard, up from 54% the previous year (Figure 24). This large increase contrasted with a corresponding decrease from the ‘Municipal’ sector. The proportion of recovered paper and cardboard sourced from overseas and interstate increased slightly, from 2% to 3% in 2013-14.
Figure 24 Source sectors of Paper / Cardboard received for reprocessing (by weight), Victoria 2013-14 and 2012-13
Municipal18%
Commercial & Industrial
79%
Imports (overseas & interstate)
3%
2013-14
Municipal44%
Commercial & Industrial
54%
Imports (overseas & interstate)
2%
2012-13
Victorian Recycling Industries Annual Survey 2013-1428
7. Organics7.1 Recovery and trendsOrganic recovery in Victoria fell by 5% in 2013-14, totalling 827,000 tonnes after reaching an all-time high of 978,000 tonnes in 2011-12. This represents the lowest amount of organic material recovered since 2009-10 (Table 9).
Figure 25 shows that since 2004-05, Organics recovery, although fluctuating, is generally trending upwards. Nevertheless, in the past two years this category has seen a decrease in the total amount recovered. Identifying trends in this waste stream poses numerous challenges, among them the impact of natural forces such as long-term drought and legislated water restrictions.
Figure 25 Organic material recovered for reprocessing, Victoria 2004-05 to 2013-14
0
200
400
600
800
1000
1200
2004–05 2005–06 2006–07 2007–08 2008–09 2009-10 2010-11 2011-12 2012-13 2013-14
Tonn
es ('
000)
Of the total Organic material recovered in Victoria, 43% is recovered Garden organics, primarily sourced from municipal kerbside collections (Figure 26). Wood & timber, which accounted for 20% of total organics in 2012-13, decreased to only 14% in 2013-14, while Food organics jumped from 3% to 9%.
Figure 26 Composition of Organic material recovered for reprocessing (by weight), Victoria 2013-14 and 2012-13
Food organics
9%
Garden organics
43%Other & mixed organic waste
17%
Sawdust & other forestry
residuals17%
Wood & timber (other than packaging)
5%
Wood & timber pallets / packaging
9%
2013-14
Food organics
3%
Garden organics
44%Other & mixed organic waste
15%
Sawdust & other
forestry residuals
18%
Wood & timber (other than packaging)
14%
Wood & timber pallets / packaging
6%
2012-13
Victorian Recycling Industries Annual Survey 2013-14

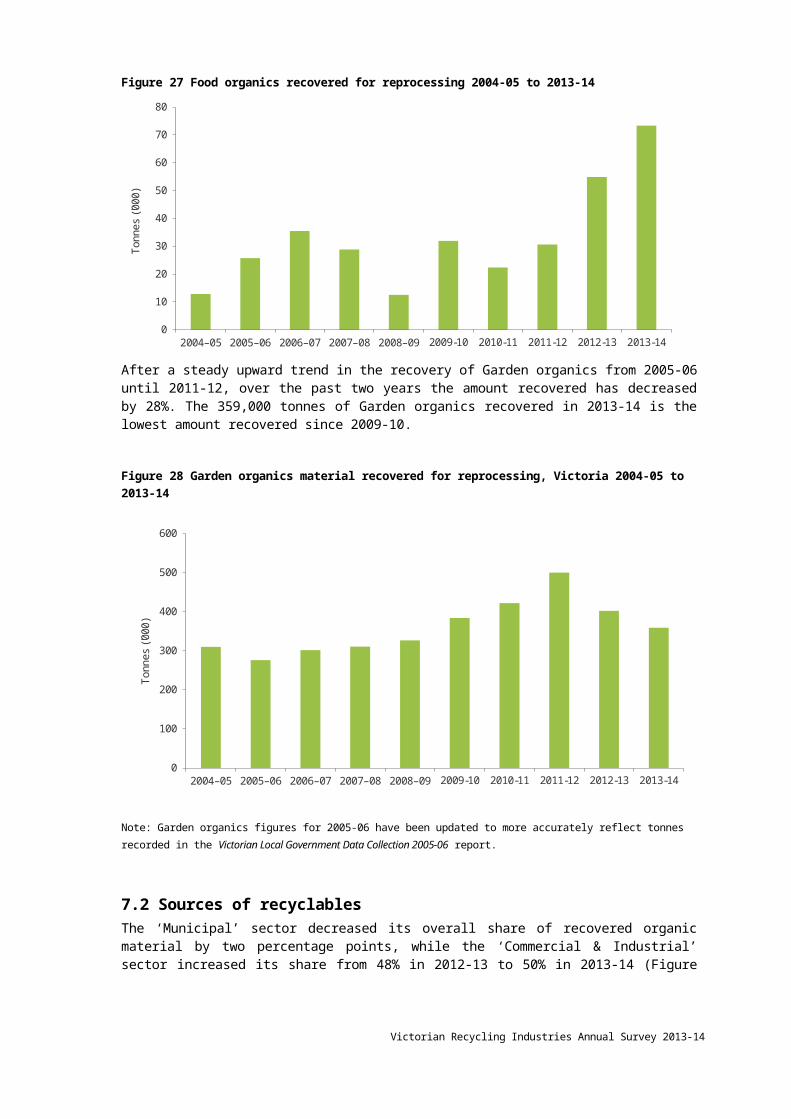
After falling to 22,000 tonnes in 2010-11, the recovery of Food organics saw steady growth, reaching 73,000 tonnes in 2013-14. This represents an increase of 34% from 2012-13. The Other organics category, representing mixed organic material along with manure and sludge, increased by 11% over 2013-14 after falling by 31% over 2012-13. The recovery of Sawdust, Garden organics and Timber decreased by 13%, 11% and 9% respectively (Table 9).
Table 9 Total Organic material recovered, Victoria 2013-14 and 2012-13
Category Total recovery in Victoria 2013-14
Total recovery in Victoria 2012-13
Change since
2013-14 Tonnes (‘000) Tonnes (‘000) (%) Timber 118 129 -9% Food organics 73 55 34% Garden organics 359 402 -11% Sawdust 136 157 -13% Other organics 141 127 11%Total 827 870 -5%
A holistic picture of the recovery of Food organics in Victoria is difficult to ascertain, as much of it is utilised directly by the manufacturing sector which – unlike the companies primarily involved with recycled material – has not traditionally had a data-sharing relationship with government.
As a consequence, the reporting of Food organics recovery has followed a tumultuous path over the past ten years (Figure 27) and the 34% increase in the recovery of this material over the past year can be predominantly explained by the introduction of previously unattainable data.
Figure 27 Food organics recovered for reprocessing 2004-05 to 2013-14
0
10
20
30
40
50
60
70
80
2004–05 2005–06 2006–07 2007–08 2008–09 2009-10 2010-11 2011-12 2012-13 2013-14
Tonn
es ('
000)
After a steady upward trend in the recovery of Garden organics from 2005-06 until 2011-12, over the past two years the amount recovered has decreased by 28%. The 359,000 tonnes of Garden organics recovered in 2013-14 is the lowest amount recovered since 2009-10.
Figure 28 Garden organics material recovered for reprocessing, Victoria 2004-05 to 2013-14
Victorian Recycling Industries Annual Survey 2013-1430

0
100
200
300
400
500
600
2004–05 2005–06 2006–07 2007–08 2008–09 2009-10 2010-11 2011-12 2012-13 2013-14
Tonn
es ('
000)
Note: Garden organics figures for 2005-06 have been updated to more accurately reflect tonnes recorded in the Victorian Local Government Data Collection 2005-06 report.
7.2 Sources of recyclablesThe ‘Municipal’ sector decreased its overall share of recovered organic material by two percentage points, while the ‘Commercial & Industrial’ sector increased its share from 48% in 2012-13 to 50% in 2013-14 (Figure 29). No Garden organics were imported from interstate or overseas for reprocessing in Victoria in 2013-14.
Figure 29 Source sectors of Organic material received for reprocessing (by weight), Victoria 2013-14 and 2012-13
Municipal47%
Construction & Demolition
3%
Commercial & Industrial
50%
Municipal49%
Construction & Demolition
3%
Commercial & Industrial
48%
2012-132013-14
Victorian Recycling Industries Annual Survey 2013-14

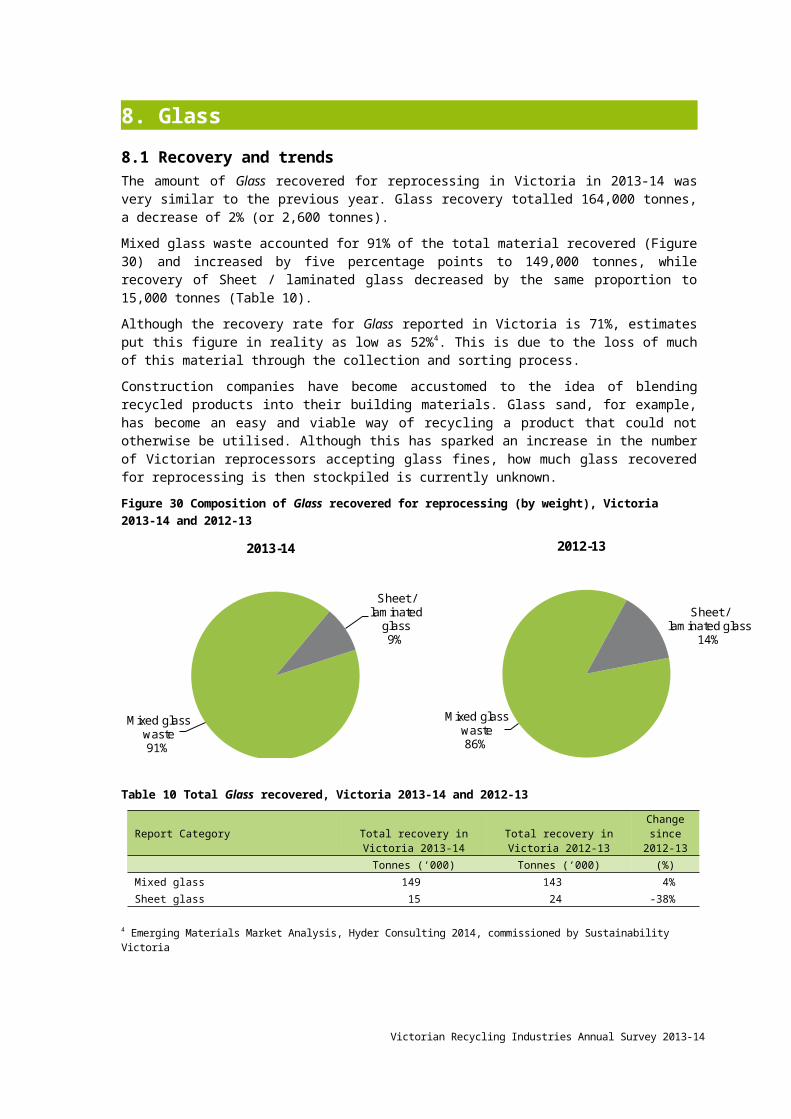
8. Glass8.1 Recovery and trendsThe amount of Glass recovered for reprocessing in Victoria in 2013-14 was very similar to the previous year. Glass recovery totalled 164,000 tonnes, a decrease of 2% (or 2,600 tonnes).
Mixed glass waste accounted for 91% of the total material recovered (Figure 30) and increased by five percentage points to 149,000 tonnes, while recovery of Sheet / laminated glass decreased by the same proportion to 15,000 tonnes (Table 10).
Although the recovery rate for Glass reported in Victoria is 71%, estimates put this figure in reality as low as 52%4. This is due to the loss of much of this material through the collection and sorting process.
Construction companies have become accustomed to the idea of blending recycled products into their building materials. Glass sand, for example, has become an easy and viable way of recycling a product that could not otherwise be utilised. Although this has sparked an increase in the number of Victorian reprocessors accepting glass fines, how much glass recovered for reprocessing is then stockpiled is currently unknown.
Figure 30 Composition of Glass recovered for reprocessing (by weight), Victoria 2013-14 and 2012-13
Mixed glass waste91%
Sheet / laminated
glass9%
2013-14
Mixed glass waste86%
Sheet / laminated glass
14%
2012-13
Table 10 Total Glass recovered, Victoria 2013-14 and 2012-13
Report Category Total recovery in Victoria 2013-14
Total recovery in Victoria 2012-13
Change since
2012-13 Tonnes (‘000) Tonnes (‘000) (%)Mixed glass 149 143 4%Sheet glass 15 24 -38%Total 164 167 -2%
Note: Due to a change in reporting methodology by a major glass reprocessor in 2010-11, the Glass containers category has been
completely subsumed within Mixed Glass waste.
4 Emerging Materials Market Analysis, Hyder Consulting 2014, commissioned by Sustainability Victoria
Victorian Recycling Industries Annual Survey 2013-1432
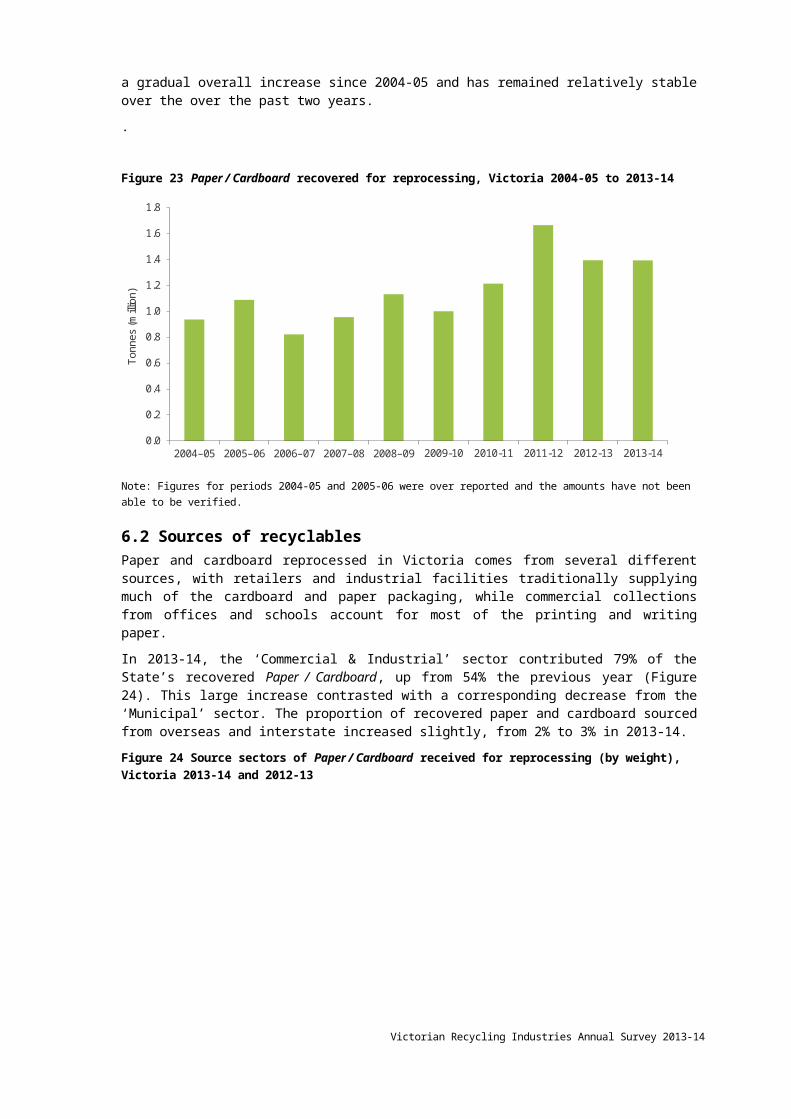
Figure 31 shows that despite a slight downturn in the past two years since 2012-2013, glass recovery has remained relatively steady since 2005-06.
Figure 31 Glass recovered for reprocessing, Victoria 2004-05 to 2013-14
-
50
100
150
200
250
2004–05 2005–06 2006–07 2007–08 2008–09 2009-10 2010-11 2011-12 2012-13 2013-14
Tonn
es ('
000)
8.2 Sources of recyclablesBoth the ‘Municipal’ and ‘Commercial & Industrial’ sectors contribution to the glass received for reprocessing during 2013-14 diminished by three and six percentage points to 66% and 23% respectively. Their share was taken by the ‘Construction & Demolition’ sector, which increased by nine percentage points to 11% (Figure 32).
Figure 32 Source sectors of Glass received for reprocessing (by weight), Victoria 2013-14 and 2012-13
Municipal66%
Construction & Demolition
11%
Commercial & Industrial
23%
2013-14
Municipal69%
Construction & Demolition
2%
Commercial & Industrial
29%
2012-13
Victorian Recycling Industries Annual Survey 2013-14
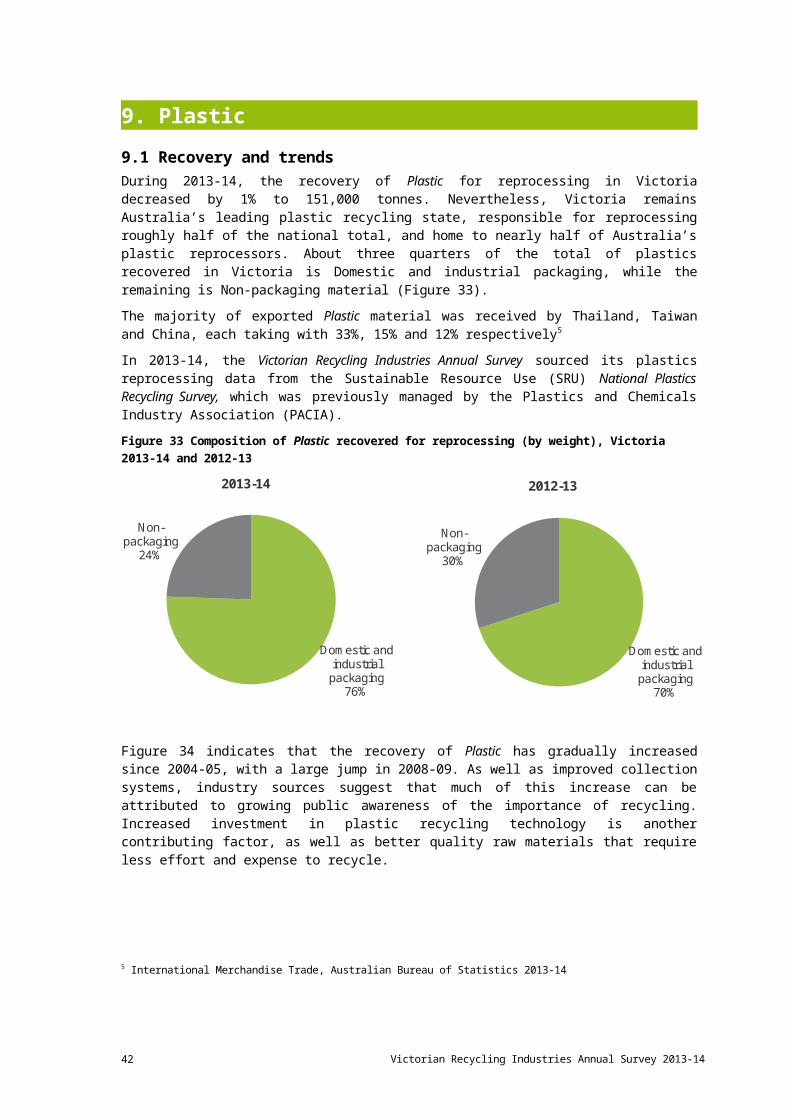
9. Plastic9.1 Recovery and trends During 2013-14, the recovery of Plastic for reprocessing in Victoria decreased by 1% to 151,000 tonnes. Nevertheless, Victoria remains Australia’s leading plastic recycling state, responsible for reprocessing roughly half of the national total, and home to nearly half of Australia’s plastic reprocessors. About three quarters of the total of plastics recovered in Victoria is Domestic and industrial packaging, while the remaining is Non-packaging material (Figure 33).
The majority of exported Plastic material was received by Thailand, Taiwan and China, each taking with 33%, 15% and 12% respectively5
In 2013-14, the Victorian Recycling Industries Annual Survey sourced its plastics reprocessing data from the Sustainable Resource Use (SRU) National Plastics Recycling Survey, which was previously managed by the Plastics and Chemicals Industry Association (PACIA).
Figure 33 Composition of Plastic recovered for reprocessing (by weight), Victoria 2013-14 and 2012-13
Domestic and industrial
packaging76%
Non-packaging
24%
2013-14
Domestic and industrial
packaging70%
Non-packaging
30%
2012-13
Figure 34 indicates that the recovery of Plastic has gradually increased since 2004-05, with a large jump in 2008-09. As well as improved collection systems, industry sources suggest that much of this increase can be attributed to growing public awareness of the importance of recycling. Increased investment in plastic recycling technology is another contributing factor, as well as better quality raw materials that require less effort and expense to recycle.
5 International Merchandise Trade, Australian Bureau of Statistics 2013-14
Victorian Recycling Industries Annual Survey 2013-1434
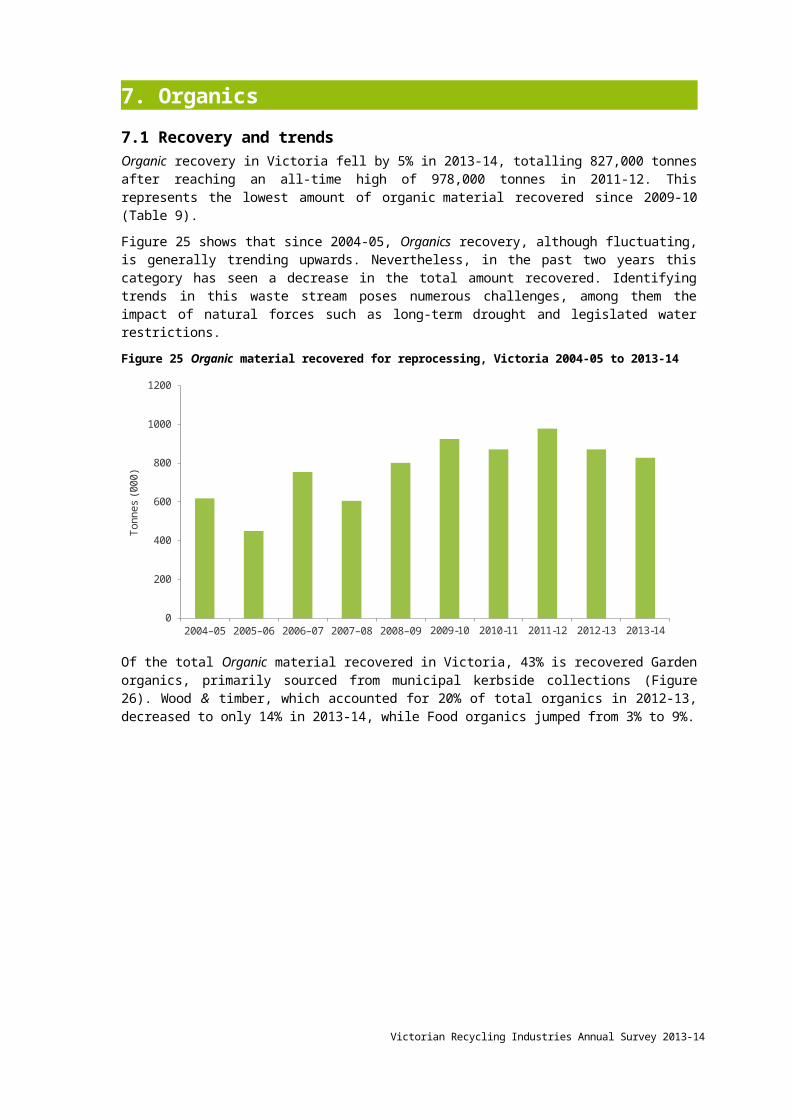
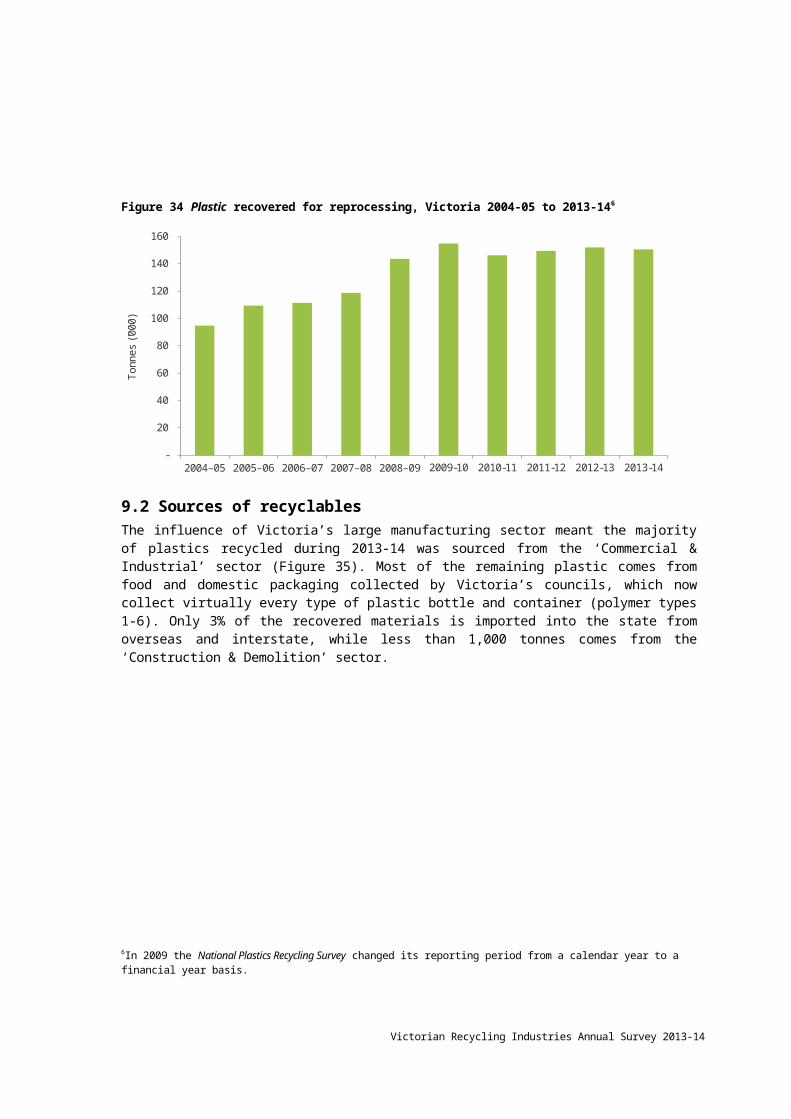
Figure 34 Plastic recovered for reprocessing, Victoria 2004-05 to 2013-146
-
20
40
60
80
100
120
140
160
2004–05 2005–06 2006–07 2007–08 2008–09 2009-10 2010-11 2011-12 2012-13 2013-14
Tonn
es ('
000)
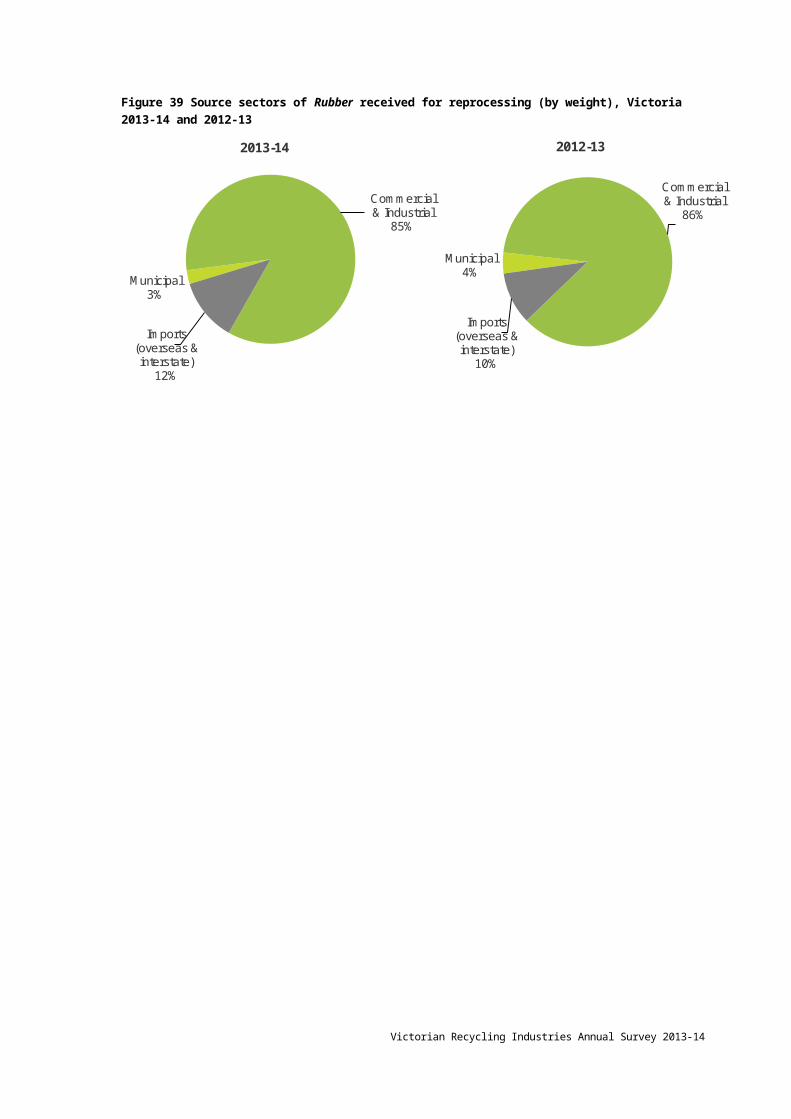
9.2 Sources of recyclablesThe influence of Victoria’s large manufacturing sector meant the majority of plastics recycled during 2013-14 was sourced from the ‘Commercial & Industrial’ sector (Figure 35). Most of the remaining plastic comes from food and domestic packaging collected by Victoria’s councils, which now collect virtually every type of plastic bottle and container (polymer types 1-6). Only 3% of the recovered materials is imported into the state from overseas and interstate, while less than 1,000 tonnes comes from the ‘Construction & Demolition’ sector.
Figure 35 Source sectors of Plastic received for reprocessing, Victoria 2013-14 and 2012-13
Municipal44%Construction
& Demolition<1%
Commercial & Industrial
53%
Imports (overseas & interstate)
3%
2013-14
Municipal41%Construction &
Demolition3%
Commercial & Industrial
51%
Imports (overseas & interstate)
5%
2012-13
Low-density PE-LD / LLD (type 4) and High-density PE-HD (type 2) Polyethylene accounted for half of the recovered plastic in Victoria during 2013-14, while Polyethylene PET (type 1) and Polypropylene PP (5) accounted for 19% each. The remaining 10% of recovered plastics was divided among PVC (type 3), PS (type 6) and other plastics (type 7) (Figure 36).
6In 2009 the National Plastics Recycling Survey changed its reporting period from a calendar year to a financial year basis.
Victorian Recycling Industries Annual Survey 2013-14

Figure 36 Composition of Plastic received for reprocessing by polymer type, Victoria 2013-14
Polyethylene terephthalate
PET (1) 19%
High-density polyethylene PE-HD (2)
30%
Polyvinyl chloride PVC (3)
2%
Low-density polyethylene
PE-LD/LLD (4)21%
Polypropylene PP (5)19%
PS (6)3%
All (7)6%
Victorian Recycling Industries Annual Survey 2013-1436
10. Rubber10.1 Recovery and trendsIn 2013-14, 78,000 tonnes of Rubber was reported as recovered in Victoria, an increase of 21% from the previous year (Table 11). Of the total recovered, 90% consisted of Rubber tyres, while the remaining 10% consisted of Other rubber waste, including tyre buffings and tread ends, uncured rubber and extrusion waste (Figure 37).
Table 11 Total Rubber recovered, Victoria 2013-14 and 2012-13
Report Category Total recovery in Victoria 2013-14
Total recovery in Victoria 2012-13
Change since
2012-13 Tonnes (‘000) Tonnes (‘000) (%)Other rubber 8 18 -56%Rubber tyres 70 47 51%Total 78 64 21%
Recovery of Rubber tyres increased by 51%, which is almost entirely attributable to a 118% increase of rubber exports, from 23,000 tonnes in 2012-13 to 50,000 in 2013-14. One third of total rubber exports were sent to Vietnam, while the Republic of Korea and Malaysia received 18% and 14% respectively7.
A report commissioned by Sustainability Victoria8 estimates that 54% of all end-of-life rubber tyres cannot currently be accounted for. It is believed that this 54% is composed of tyres that are either stockpiled, exported without being declared, or illegally dumped.
Figure 37 Composition of Rubber recovered for reprocessing (by weight), Victoria 2013-14 and 2012-13
Other rubber waste10%
Rubber tyres90%
2013-14
Other rubber waste27%
Rubber tyres73%
2012-13
Figure 38 shows an increasing trend in Rubber recovery in Victoria over the past ten years. Although data has fluctuated over the life of the Victorian Recycling Industries Survey, all of the key rubber reprocessors have provided consistent responses since 2006-07. Despite the estimated 54% of tyre rubber that cannot be accounted for, the rubber recovery totals reported since 2006-07 provide a more accurate reflection of the state of rubber recycling than in previous years.
7 International Merchandise Trade, Australian Bureau of Statistics 2013-148 Emerging Materials Market Analysis, Hyder Consulting 2014, commissioned by Sustainability Victoria.
Victorian Recycling Industries Annual Survey 2013-14

Figure 38 Rubber recovered for reprocessing, Victoria 2004-05 to 2013-14
-
10
20
30
40
50
60
70
80
2004–05 2005–06 2006–07 2007–08 2008–09 2009-10 2010-11 2011-12 2012-13 2013-14
Tonn
es ('
000)
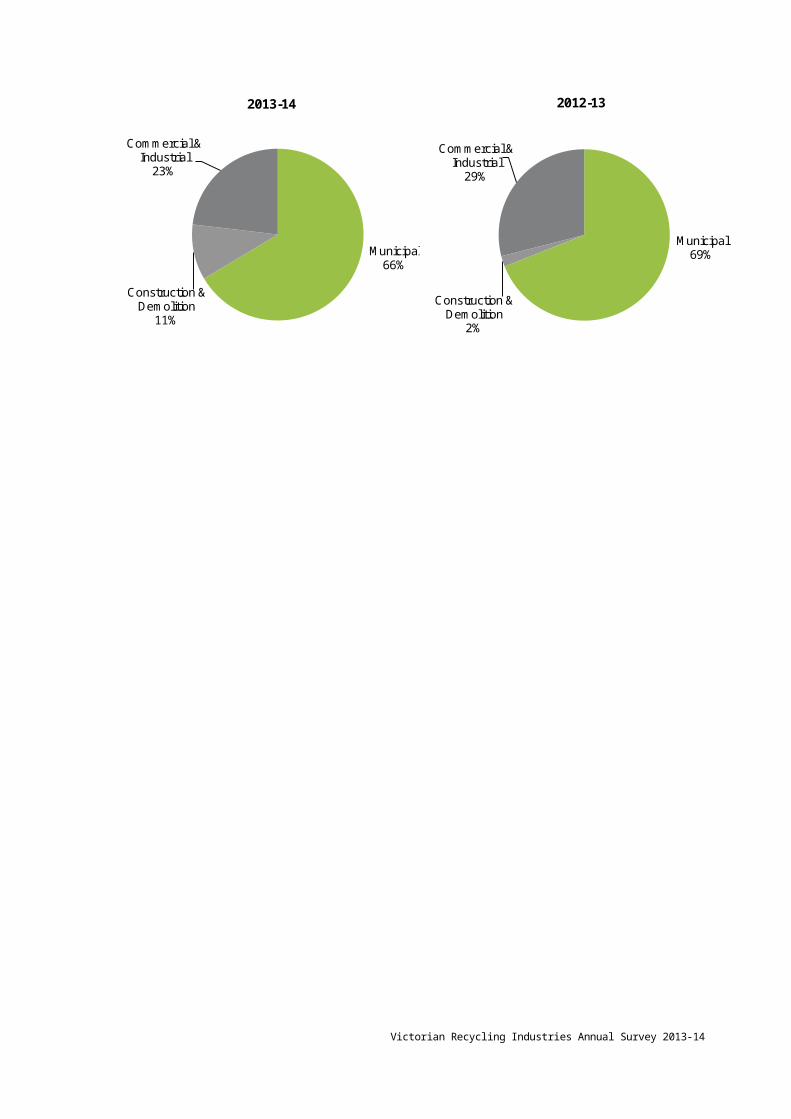
10.2 Sources of recyclablesMost of the rubber reported as received for reprocessing during 2013-14 (85%) was sourced from the ‘Commercial & Industrial’ sector (Figure 39). Because tyres for reprocessing are collected primarily through retailers, it is impossible to gauge the true quantities sourced from the ‘Municipal’ sector by surveying reprocessors alone.
Figure 39 Source sectors of Rubber received for reprocessing (by weight), Victoria 2013-14 and 2012-13
Municipal4%
Commercial & Industrial
86%
Imports (overseas & interstate)
10%
2012-13
Municipal3%
Commercial & Industrial
85%
Imports (overseas & interstate)
12%
2013-14
Victorian Recycling Industries Annual Survey 2013-1438
11. Textiles11.1 Recovery and trendsMattresses no longer account for the majority of the total Textiles category recovered for reprocessing in Victoria in 2013-14 (Table 12). Mattresses accounted for 43% of the total, while Industrial textiles accounted for the remainder 57% (Figure 40).
Although it is believed that clothing disposed of by Victorians continues to be recycled into rags for use in industrial processes, the quantities are currently unknown.
The data collected for this survey does not include clothing re-sold through second hand / charity clothing shops or exported for sale or as relief aid and, while the quantities of recovered clothing that remain in Victoria is unknown, ABS export data indicates that in 2013-14, Victorians exported 54,000 tonnes of recovered clothes overseas to be re-used9.
Table 12 Total Textiles recovered in Victoria 2013-14 and 2012-13
Report Category Total recovery in Victoria 2013-14
Total recovery in Victoria 2012-13
Change on previous
year Tonnes (‘000) Tonnes (‘000) (%)Industrial textiles 1.7 2.2 61%Mattresses 2.3 2.5 -32%Total 4 4.7 2%
Figure 40 Composition of Textiles recovered for reprocessing (by weight), Victoria 2013-14 and 2012-13
Industrial textiles
57%
Mattresses43%
2013-14
Industrial textiles
46%
Mattresses54%
2012-13
Figure 41 shows, with the exemption of 2006-07, how the recovery of Textiles has remained relatively steady since 2004-05.
9 International Merchandise Trade, Australian Bureau of Statistics 2013-14
Victorian Recycling Industries Annual Survey 2013-14

Figure 41 Textiles recovered for reprocessing, Victoria 2004-05 to 2013-14
-
2
4
6
8
2004–05 2005–06 2006–07 2007–08 2008–09 2009-10 2010-11 2011-12 2012-13 2013-14
Tonn
es ('
000)
12.2 Sources of recyclablesThe ‘Municipal’ sector contributed 55% of all materials received by Victoria’s textile reprocessors in 2013-14, a decrease of nine percentage points (Figure 42. The remainder was sourced from the ‘Commercial & Industrial’ sector, including major bed manufacturers and retailers.
Figure 42 Source sectors of Textiles received for reprocessing (by weight), Victoria 2013-14 and 2012-13
Municipal55%
Commercial & Industrial
45%
2013-14
Municipal64%
Commercial & Industrial
36%
2012-13
Victorian Recycling Industries Annual Survey 2013-1440
Appendix A Survey methodologyThe Victorian Recycling Industries Annual Survey 2013-14 was conducted in September 2014 and January 2015 and sought data from 68 Victorian reprocessors, excluding 54 plastic reprocessors surveyed as part of the 2013-14 National Plastics Recycling Survey10.
Each reprocessor was emailed a survey developed for their specific industry category and asked to provide information for the 2013-14 financial year about the amount of material diverted from landfill (recovered) for reprocessing, including:
tonnes received by their Victorian site;
tonnes received from other reprocessing facilities;
tonnes imported or exported for reprocessing, both interstate and overseas;
tonnes stockpiled (unprocessed and processed);
tonnes reprocessed on-site;
amount of material disposed of to landfill due to contamination or as processing waste;
sector/s from which the recovered materials for reprocessing were received;
major products made from their reprocessing operations and the subsequent markets (defined by the ANZSIC code divisions for all materials excluding organics) to which the products are sold;
number of full-time equivalent staff directly employed in the company’s recycling operations; and
levels of expenditure on research and development and capital investment for activities associated with the reprocessing of secondary-use materials.
A total of 62 of the 68 reprocessors responded to the survey, representing a 91% response rate. It is estimated that the 62 responding reprocessors between them recover more than 95% by weight of all material recovered in Victoria.
To avoid double counting, the focus of this survey is only on material recovered for reprocessing and not other stages of the recovered material life cycle, such as collection, sorting and manufacturing. The survey does not include materials that have been collected and baled only, or that have been resold in their original state for reuse, such as clothing sold through second-hand or charity stores. The omission of reused materials is not in any way intended to undervalue this important activity, but is necessary to avoid double counting of data and to provide clear parameters for the quantification of recycling.
Additional information was sought from the Australian Bureau of Statistics on the export of materials from Australia to overseas markets for reprocessing during the 2013-14 financial year. This data aims to capture materials exported from companies not surveyed by Sustainability Victoria, such as export traders.
Data on plastics recovery in Victoria was obtained from the 2013-14 National Plastics Recycling Survey, and incorporated into this report.
Data on solid waste disposed to licensed landfills was sourced from the Environment Protection Authority Victoria’s (EPA’s) landfill levy returns. As stated by the EPA, the figure represents the amount of material accepted at licensed Victorian landfills, excluding material used as cover. The Environment Protection Act 1970 provides a rebate for cover material of 15% (at the relevant municipal rate) for each tonne of material deposited at a landfill. It is noted that some landfills source cover material on site (e.g. from quarrying activities) and that this is not measured in the tonnes of waste received at landfills.
10Sustainable Resource Use, 2013-14 National Plastics Recycling Survey
Victorian Recycling Industries Annual Survey 2013-14
The Victorian Recycling Industries Annual Survey measures and reports on data from reprocessors who respond. No estimates are undertaken for non-responding companies. Due to the voluntary nature of the survey, it is expected that there will be a degree of variation from year to year. Every attempt is made to include the large reprocessing operations to ensure that yearly variations are minimised. Data has been aggregated for reporting purposes at the state level to retain confidentiality.
From 2002-03, the reporting of Food organics recovery data no longer includes any prescribed industrial waste figures, such as meat leftover from rendering processes or grease traps.
Victorian Recycling Industries Annual Survey 2013-1442
Appendix B Materials recovered for reprocessingTable 13 Total material types recovered for reprocessing, Victoria 2004-05 to 2013-14
Material type 2004-05 2005-06 2006-07 2007-08 2008-09 2009-10 2010-11 2011-12 2012-13 2013-14 % change 2012-13 to 2013-14
Metal
Aluminium (incl. cans) 88 83 63 51 32 66 84 57 93 93 0%
Batteries 33 34 15 36 31 37 28 4 7 7 -4%
Car bodies 65 78 120 26 68 153 135 89 77 99 28%
Non-ferrous 19 19 65 77 68 74 70 92 78 87 12%
Other and mixed metal – – 1 206 1 49 6 9 3 4 31%
Steel (incl. packaging steel) 951 1,234 997 955 896 1,028 1,067 1,220 1,131 1,259 11%
Total metal 1,156 1,448 1,261 1,349 1,097 1,408 1,390 1,470 1,390 1,549 11%
Aggregates, masonry & soil
Asphalt 162 139 190 152 225 196 223 229 258 233 -10%
Brick / brick rubble 395 385 438 293 243 518 497 350 370 367 -1%
Concrete 1,477 1,734 1,695 1,717 1,730 2,438 2,175 1,829 1,985 1,964 -1%
Mixed construction and demolition – – 81 111 91 81 167 243 495 265 -46%
Plasterboard 24 27 22 33 37 27 32 34 39 33 -14%
Rock / excavation stone 367 419 505 668 656 452 981 723 773 627 -19%
Soil and sand 68 209 239 72 170 108 118 93 67 84 26%
Total Aggregates, masonry & soil 2,492 2,912 3,170 3,046 3,154 3,823 4,194 3,502 3,985 3,574 10%Victorian Recycling Industries Annual Survey 2013-14

Paper / Cardboard
Cardboard / paper packaging 376 461 389 422 468 196 211 278 635 621 -2%
Newsprint / magazines 200 232 122 132 159 114 137 123 185 171 7%
Printing and writing paper 262 238 73 124 92 44 58 108 89 43 -52%
Telephone books 10 9 10 2 1 – – – – – –
Other (mixed paper) 90 146 236 275 410 644 806 1,157 485 558 15%
Total Paper / Cardboard 936 1,087 821 954 1,131 998 1,213 1,665 1,393 1,393 0%
Organics
Timber 229 84 196 123 158 163 107 112 129 118 -9%
Food organics 13 26 35 29 12 31 22 31 55 73 34%
Garden organics 310 276 302 311 326 384 422 500 402 359 -11%
Sawdust 26 35 144 67 154 127 126 150 157 136 -13%
Other 40 29 77 76 149 216 193 185 127 141 11%
Total Organics 618 449 754 604 801 924 871 978 871 827 -5%
Glass
Glass containers 83 143 188 42 38 – – – – –
Sheet / laminated glass 20 25 14 11 19 19 19 17 24 15 -38%
Mixed glass waste – – – 120 128 137 177 178 143 150 4%
Total Glass 102 167 202 173 185 156 196 195 167 164 -2%
Plastic 94 109 111 118 143 154 146 149 152 151 -1%
Victorian Recycling Industries Annual Survey 2013-1444

Rubber 22 16 29 26 37 44 55 49 64 78 21%
Textiles 3 2 7 3 3 4 5 5 4 3 -21%
Other materials – – – – – – – – – – –
Total all materials 5,427 6,194 6,358 6,277 6,555 7,516 8,069 8,014 8,026 7,739 -3.6%
* Evaluation and cross-referencing of reported and actual data has led to an adjustment of previous financial year data.
Note: Food organics recovery data from 2002-03 no longer includes any prescribed industrial waste figures such as meat leftover from rendering processes or grease traps. Garden organics figures for 2003-04 and 2005-06
have been updated to more accurately reflect tonnes recorded in the Local Government Data Collection Survey 2003-04 and the Victorian Local Government Data Collection 2005-06 report.
Victorian Recycling Industries Annual Survey 2013-14

Appendix C Participating reprocessorsSustainability Victoria would like to recognise and thank the following participants in the Victorian Recycling Industries Annual Survey 2013-14. The list below does not indicate all reprocessors who participated in the survey but, rather, those that agreed to be recognised.
Alex Fraser Group Allstone Quarries Bark King Group
Biomix Branin C&N Ruggiero
Camperdown Compost City Circle Demolition CMA Ecocycle
Corio Waste Management (Western Composting)
Delta Group Enviroflex
Enviromix Gippsland Water Greater Shepparton Resource Recovery Centre
MRI Onesteel Orora Group
Pacific NonWovens Pinegro Products Potters Industries
SITA Resource Co Statewide Waste Sunshine Groupe
Veolia
Victorian Recycling Industries Annual Survey 2013-1446
Sustainability Victoria1300 363 744
Published by Sustainability VictoriaLevel 28 Urban Workshop50 Lonsdale StreetMelbourne Victoria 3000Australia.October 2015
sustainability.vic.gov.au
Victorian Recycling Industry Annual Survey 2012-1347