Embed Size (px)
Citation preview

VIDEO PROGRAMMING COSTS AND CABLE TV PRICES
JEFFREY A. EISENACH, PH.D.†
APRIL 2010
† Managing Director and Principal, Navigant Economics LLC, and Adjunct Professor, George Mason University Law School. I am grateful Kevin Caves and Andrew Card for research assistance on this project, and to several commenters for helpful suggestions. Any remaining errors are my own. Support for this paper was provided by The Walt Disney Company.

CONTENTS
I. Introduction ........................................................................................................................1
II. Programming Costs Are Not Responsible for Cable Price Increases ...........................5
A. Programming Costs Have Decreased Relative to Other Costs ............................... 5
B. Programming Costs Have Decreased Relative to Revenues ................................... 9
C. Programming Costs Have Decreased Relative to Profits ..................................... 12
III. The Changing Market for Video Programming ...........................................................16
A. The Value of Programming to MSOs is Increasing .............................................. 16
B. Programmers’ Costs Have Increased In Response to the Competitive Landscape ............................................................................................................. 19
IV. Market Structure and Competition in the Market for Video Programming .............20
A. The Upstream Market is Highly Competitive ....................................................... 20
B. The Downstream Market is Relatively Concentrated ........................................... 26
V. Conclusions .......................................................................................................................29

I. INTRODUCTION
1. Cable television companies (sometimes referred to as multi-system operators, or
“MSOs”) sell television programming, broadband and telephone services, and ancillary products
(like installation services and DVR rentals) to consumers, typically for a monthly subscription
fee. To create these products, they procure inputs, such as network equipment from equipment
manufacturers, trucks from automobile companies, long distance telephone connections from
other telephone companies, and video programming from cable and broadcast television
producers.
2. Video programming is an especially important input. While broadband and
telephone services generate a growing share of MSO revenues, video (i.e., cable TV service) is
still responsible for the lion’s share of the total; indeed, video remains the MSOs’ “killer app,”
enabling them to dramatically increase revenues (and margins) by selling add-on broadband and
telephone services. Without programming – from 60 Minutes to Dancing with the Stars, from
Monday Night Football to Mad Men – cable television operators literally would not exist in their
present form.
3. Cable operators can and do produce their own programming. For example,
Comcast is one of the leading operators of regional sports networks, as well as owning national
networks such as the Golf Channel, E! Entertainment, and VERSUS;1 and, it is seeking to
acquire NBC. However, most of the programming carried on cable (including both broadcast
programming and cable programming) is produced by unaffiliated companies like News Corp.,
CBS, Viacom, and The Walt Disney Company (“Disney”). MSOs negotiate with programmers
such as these for program rights to cable content, and for retransmission consent rights to
1. Federal Communications Commission, In the Matter of Annual Assessment of the Status of Competition in the Market for the Delivery of Video Programming, Thirteenth Annual Report, MB Docket No. 06-189 (Jan. 16, 2009), Appendix C, Table C-1 [hereafter Thirteenth Annual MVPD Report].
2
broadcast signals.2 For programmers like Fox, NBC and Disney, which own both cable
programming and broadcast stations, it is typical for the negotiations for cable programming and
broadcast signals to occur simultaneously.3
4. As a general matter, cable operators (like any business) would prefer to pay lower
prices for inputs, including programming, since lower input costs would translate into higher
profits. Thus, when it comes time to negotiate for programming, cable operators have in recent
years sought to persuade policymakers (and the public) that programmers are charging “too
much,” and that consumers would be better off if they charged less.4
5. For example, the nation’s second largest cable operator, Time Warner Cable
(“TWC”), recently has been in the news for its efforts to blame programmers for rising cable
rates, no doubt because it has been engaged in a series of negotiations with key suppliers,
including LIN-TV (which operates local broadcast stations) and Fox.5 Indeed, the public
relations web site it created to influence public opinion during its year-end 2009 negotiations
2. Cable and broadcast rights are subject to different legal regimes. For a more complete explanation, see Jeffrey A. Eisenach, The Economics of Retransmission Consent (Washington, DC: Empiris LLC, March 2009).
3. The bundle of rights involved in these negotiations has grown increasingly complex over time. In addition to the basic right to carry video programming in real time, MSOs also acquire rights to distribute programming through Video-on-Demand (VOD) services, rights to related broadband content (e.g., ESPN 3), and so forth. The ability to “multi-purpose” video content has added to its value to MSOs.
4. On occasion, policymakers have even sought to turn public officials into unwitting pawns in their negotiating strategies. In 2003, for example, Cox Cable was highly supportive of Sen. John McCain’s efforts to impose “a la carte” regulation on programming networks, a position strongly opposed by the Walt Disney Company, with which Cox was then engaged in programming negotiations. Once an agreement was reached, Cox immediately dropped its support of Senator McCain’s initiative, admitting openly in testimony before Sen. McCain that its support for his legislation was simply a negotiating ploy designed to “to get the attention of the Walt Disney Company.” See e.g., Jeffrey A. Eisenach and Douglas A. Trueheart, Retransmission Consent and Cable Television Prices (CapAnalysis LLC, March 2005) at 23; and Hearing of the Senate Commerce, Science, and Transportation Committee, “Escalating Cable Rates: Causes and Potential Solutions,” Federal News Service (March 25, 2004), at 32-33.
5. See, e.g., Shira Ovide and Sam Schechner, “Time Warner Cable Fights Program Costs,” The Wall Street Journal (November 25, 2009).

3
with Fox claimed specifically that programming costs might cause cable rates to “increase
significantly.”6
6. How is one to judge such claims? That is, how is one to judge whether the license
fees programmers charge cable companies are “too high” or, alternatively, “too low”? From an
economic perspective, the answer is straightforward: prices set in competitive markets maximize
both economic efficiency and consumer welfare by equating the cost of producing the last unit of
the product to the value consumers place on that same unit. Thus, in the absence of some sort of
market failure (for example, if programmers had monopoly power that allowed them to charge
higher-than-competitive prices), market prices in general are neither “too high” nor “too low,”
but instead “just right.” Accordingly, the first thing economists look for in judging prices is the
existence of market power or other forms of market failure. As I explain below, there is some
evidence that cable operators may have market power vis-à-vis programmers – which might
allow them to demand programming prices below market rates – but there is virtually no
evidence of market power on behalf of programmers. Thus, cable operators’ claims that
programming prices are “too high” do not square with the underlying structure of the
marketplace.
7. Another way of approaching the question is to examine the role licensing fees
play in the economics of MSOs, including changes over time. For example, how much do cable
operators spend on programming relative to other costs, and how do programming costs compare
6. See http://rolloverorgettough.com/faqs (“[I]f we meet the demands requested by these networks, [rates] will increase significantly.”) (viewed December 28, 2009). Inevitably, the MSOs change their tune once negotiations are completed. A few days after TWC reached an agreement with Fox, its web page had been updated to acknowledge that it was “able to reach fair agreements with the TV networks” and to state explicitly that the Fox deal was not responsible for its recent price increases. (“Q: I just received a price increase from TWC. Is this the result of the negotiations? A: No. Programming costs are the largest factor in the price of TV service, but we have not yet determined how our new programming deals will affect prices.”) See http://rolloverorgettough.com/faqs (viewed January 7, 2010).

4
with other financial metrics, such as MSO profits? And, on the programming side, what is
happening to the costs incurred by programmers to produce content in the first place – that is, to
the extent licensing fees have increased in the aggregate, to what extent do they reflect (for
example) changes in programmers’ underlying costs? As I explain below, it is clear on the basis
of these common-sense financial metrics that cable operators’ claims are unjustified:
Programming costs are not rising relative to cable operators’ revenues, profits, or other costs.
8. Moreover, to the extent license fees have risen in the aggregate, the increases are
largely a reflection three factors. First, MSOs are purchasing more programming, and the
programming they are purchasing is of higher quality. Second, programmers themselves are
facing increased costs. Third, the value of programming content to cable operators as a driver of
new business – as measured, for example, by the rising number of broadband and wireline
telephony customers cable operators now serve – is increasing substantially.
9. The remainder of this paper is organized as follows. In Section II, I examine a
variety of financial metrics relating to both programmers and distributors, and demonstrate that
MSOs’ programming costs are falling relative to their revenues, costs, and profits. Thus,
programming costs cannot properly be blamed for driving increases in the prices of cable TV
services. In Section III, I discuss two important contextual factors affecting the value of video
programming: The rising value of content to cable operators associated with their provision of
multiple services (i.e., broadband and telephone); and, the rising prices paid by programmers to
produce video content. In Section IV, I describe the competitive structure of both the
“upstream” side of the market (i.e. programmers) and the “downstream” side (i.e., cable
operators, direct broadcast satellite companies, and other multi-channel video program
distributors, or “MVPDs”), and demonstrate that the upstream side of the market is highly
competitive while the downstream side is relatively concentrated. Programmers are thus not

5
capable of imposing excessive prices or unfair terms on cable operators. Section V provides a
brief summary of my conclusions.
II. PROGRAMMING COSTS ARE NOT RESPONSIBLE FOR CABLE PRICE INCREASES
10. Generally speaking, monthly subscription prices for cable television have
increased more rapidly than inflation in recent years,7 a fact that has led to criticism by some
public officials.8 One of the responses offered by major cable operators, including TWC, has
been that increasing cable rates are caused by rising licensing fees for programming.9 As I
demonstrate in this section, the data do not support this claim.
11. If programming costs are in fact driving cable price increases, we would expect to
see them rising faster than cable company revenues, faster than other components of cable
company costs, and faster than cable company profits. Instead, the opposite is true:
programming costs are declining relative to relevant MSO financial metrics.
A. Programming Costs Have Decreased Relative to Other Costs
12. If increases in cable rates were explained by rising programming costs, then one
would expect to see programming expenses accounting for an increasing share of overall MSO
cost structures. In fact, the data suggest that the opposite is true. Programming costs are declining
as a share of cable operators’ cost structures.
7. Thirteenth Annual MVPD Report at ¶4 (“While competition in the delivery of video programming services has provided consumers with increased choice, better picture quality, and greater technological innovation, prices continue to outpace the general level of inflation.”).
8. See, e.g., Federal Communications Commission, Implementation of Section 3 of the Cable Television Consumer Protection and Competition Act of 1992, Statistical Report on Average Rates for Basic Service, Cable Programming Service, and Equipment, MM Docket No. 92-266, Separate Statement of Chairman Kevin J. Martin (released December 27, 2006).
9. As noted above, such complaints tend to occur during negotiations for programming rights. Ironically, cable operators have also defended rising prices by arguing that they are justified because programming is becoming a better value for consumers. See, e.g., In the Matter of Annual Assessment of the Status of Competition in the Market for Delivery of Video Programming, MB Docket No. 07-269, Comments of the National Cable and Telecommunications Association (May 20, 2009) at 24 (available at http://www.ncta.com/PublicationType/RegulatoryFiling/NCTA-Comments-05-20-09.aspx) (citing “a huge increase in output in terms of the number of channels, the quality and quantity of programming, etc.”).

6
13. To examine the role of programming costs, I gathered data on five publicly traded
cable operators (Adelphia, Charter, Comcast, Knology, and TWC) for which up-to-date
programming cost data are consistently available,10 as reported in Forms 10-K for the years 2003
through 2008.11
14. I calculated the share of costs accounted for by programming costs, taking
weighted averages across companies. As seen in Figures 1 and 2 below, over the past five years,
programming costs have fallen relative to either the cost of revenue or the sum of the cost of
revenue and selling, general, and administrative expenses (“SG&A”).12
10. Data for Adelphia are available for the years leading up to the acquisition of its systems by Comcast and Time Warner (from 2003-2005). Therefore, the industry statistics given below include Adelphia for these years.
11. In some isolated cases, data from earlier years not available in Forms 10-K were supplemented with data derived from analyst reports by SNL Kagan and Morgan Stanley. See SNL Kagan, “Benchmarking Cable MSO Financial Statistics,” 2007 Edition; SNL Kagan, “Media Trends,” 2008 Edition; Morgan Stanley, “Cable Satellite Industry Overview: What Does the Market Expect?” (April 2004); Morgan Stanley, “Cable Satellite Industry Overview: Bundling and the Battle for Basic,” (October 2004).
12. I utilized these two cost categories to ensure comparability across companies. For example, Comcast provides cost of revenue and SG&A data for its cable segment, but does not provide segmented data on depreciation, amortization, or other cost categories. In addition, other cost categories often do not reflect the relevant underlying economics. For example, in 2008, TWC incurred a non-cash impairment of $14.822 billion to reduce the carrying value of its cable franchise rights as a result of its annual impairment testing of goodwill and indefinite-lived intangible assets. If I had included this cost category in my calculations, the share of TWC’s costs accounted for by programming costs would have dipped artificially at the end of the sample period.

7
FIGURE 1: PROGRAMMING COSTS AS A SHARE OF COST OF REVENUE,
MAJOR MSOS
Source: Cable operator 10-Ks; industry reports; Navigant Economics LLC calculations.
15. For these five major MSOs, the share of cost of revenue accounted for by
programming costs declined from 63 percent to 50 percent between 2003 and 2008; during the
same period, the share of cost of revenue plus SG&A accounted for by programming costs
shrank from 42 percent in 2003 to 34 percent in 2008.

8
FIGURE 2: PROGRAMMING COSTS AS A SHARE OF COST OF REVENUE + SG&A,
MAJOR MSOS
Source: Cable operator 10-Ks; industry reports; Navigant Economics LLC calculations.
16. Because TWC recently has taken a particularly aggressive public stance on these
issues, I also examined data on TWC over this same time period. As a result of TWC’s
acquisition of Adelphia assets, I combined data for Adelphia with data for TWC for the years
2003 – 2005 to arrive at pro-forma estimates for a hypothetical consolidated entity (“TWC Pro-
Forma”) that would have existed prior to 2006. Thus, the financial data for TWC Pro-Forma
reflect TWC financials from 2006 forward, and a consolidation of TWC and Adelphia financials
from 2003 – 2005.13
17. I then calculated the share of costs accounted for by programming costs for TWC
Pro-Forma. As shown in Figure 3 below, programming costs have fallen relative to both the cost
13. According to Forms 10-K for Comcast and TWC for the 2006 fiscal year, the two companies gained 1.7M and 3.2M net subscribers respectively as a result of (1) their joint acquisition of Adelphia assets; and (2) swaps of cable systems between Comcast and TWC. I therefore estimated that TWC acquired approximately 65 percent of Adelphia’s subscribers (equal to 3.2/(1.7+3.2)). Therefore, for the years 2003 – 2005, I allocated 65 percent of Adelphia’s subscribers, revenues, and costs to TWC Pro-Forma. See Time Warner Cable, Form 10-K, filed Feb. 23, 2007. See also Comcast Corporation, Form 10-K, filed Feb. 26, 2007.
9
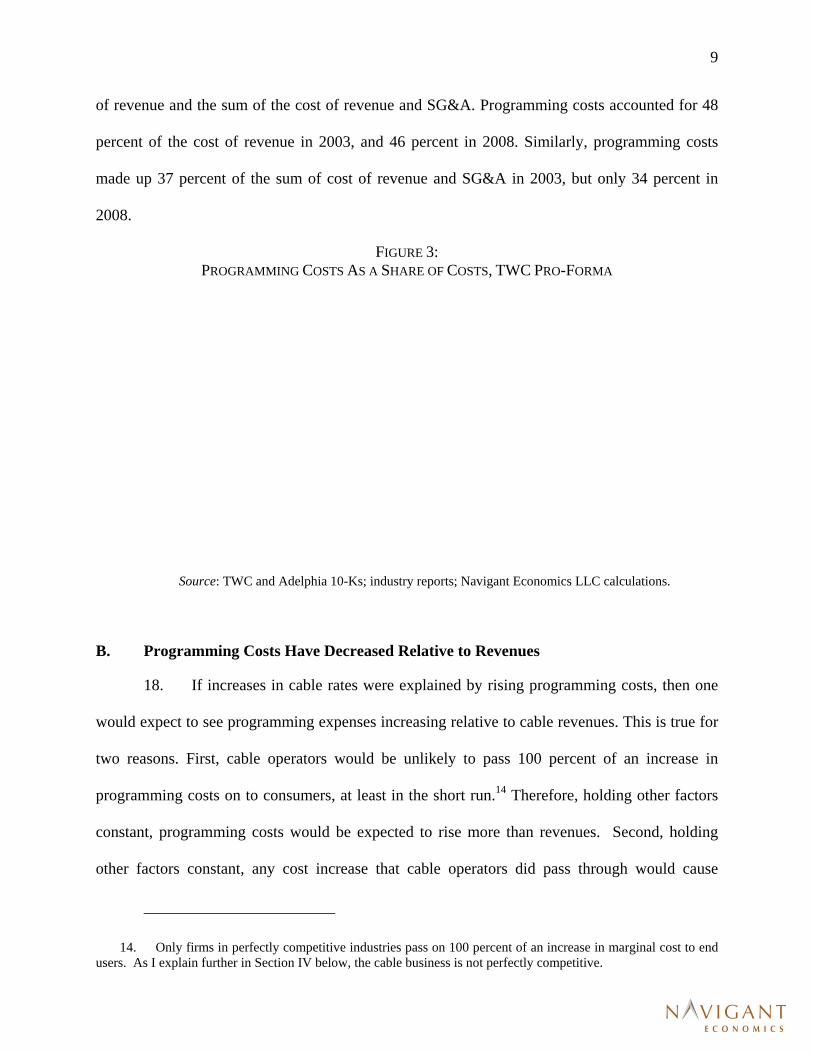
of revenue and the sum of the cost of revenue and SG&A. Programming costs accounted for 48
percent of the cost of revenue in 2003, and 46 percent in 2008. Similarly, programming costs
made up 37 percent of the sum of cost of revenue and SG&A in 2003, but only 34 percent in
2008.
FIGURE 3: PROGRAMMING COSTS AS A SHARE OF COSTS, TWC PRO-FORMA
Source: TWC and Adelphia 10-Ks; industry reports; Navigant Economics LLC calculations.
B. Programming Costs Have Decreased Relative to Revenues
18. If increases in cable rates were explained by rising programming costs, then one
would expect to see programming expenses increasing relative to cable revenues. This is true for
two reasons. First, cable operators would be unlikely to pass 100 percent of an increase in
programming costs on to consumers, at least in the short run.14 Therefore, holding other factors
constant, programming costs would be expected to rise more than revenues. Second, holding
other factors constant, any cost increase that cable operators did pass through would cause
14. Only firms in perfectly competitive industries pass on 100 percent of an increase in marginal cost to end users. As I explain further in Section IV below, the cable business is not perfectly competitive.

10
consumers to reduce their purchases of cable television services. This would cause revenues to
fall, both in absolute terms and relative to programming costs.15 As I show below, the best
available evidence suggests the opposite: cable revenues are rising relative to programming
costs, and in some cases, significantly so.
19. As above, I examined data on the five publicly traded MSOs for which up-to-date
programming cost data are consistently available. I calculated the rate of increase of these
companies’ programming expenses and their total revenues per subscriber per month, again
taking weighted averages across companies, for the period 2003 through 2008. Although
programming expenses for the MSOs increased by approximately 42 percent (from
$15.90/sub/month to $22.55/sub/month), total revenues increased by approximately 55 percent
(from $68.86/sub/month to $106.92/sub/month). Thus, the available evidence indicates that cable
programming expenses are, if anything, decreasing relative to total revenues.
20. The relative increases can also be compared in absolute terms. As shown in
Figure 4, monthly revenues per subscriber per month rose by $38.06 per month between 2003
and 2008, while programming expenses rose by only $6.65. Put differently, for every dollar
increase in programming expenses, MSOs raised total charges to consumers by $5.72.
15. Past research has found the demand for cable to be elastic, which implies that a price increase causes total revenues to fall. See Federal Communications Commission, In the Matter of Implementation of Section 3 of the Cable Television Consumer Protection and Competition Act of 1992 Statistical Report on Average Rates for Basic Service, Cable Programming Service, and Equipment, MM Docket No. 92-266 (Feb. 14, 2001) at ¶48 (estimating the own-price elasticity of demand for cable television at -1.95).

11
FIGURE 4: PROGRAMMING COSTS & REVENUES, PER SUBSCRIBER PER MONTH, MAJOR MSOS
Source: Cable operator 10-Ks; industry reports; Navigant Economics LLC calculations.
21. I also examined data for TWC over this same time period. As before, I combined
data for Adelphia with data for TWC for the years 2003 through 2005 to arrive at estimates for
TWC Pro-Forma, allocating approximately two thirds of Adelphia’s revenues, costs, and
subscribers to TWC Pro-Forma in these years.
22. I then calculated the rate of increase of programming expenses and total revenues
per subscriber per month for TWC Pro-Forma, from 2003 through 2008. As shown in Figure 5,
although programming expenses for TWC Pro-Forma increased by approximately 39 percent
from 2003 to 2008 (from $15.47/sub/month to $21.45/sub/month), total revenues increased by
approximately 49 percent over this same period (from $65.98/sub/month to $98.29/sub/month).
Thus, the available evidence indicates that programming expenses have decreased relative to
revenues for TWC Pro-Forma.

12
23. In absolute terms, for every dollar increase in programming costs TWC incurred
during this period, it raised total charges to consumers by $5.40 ($32.31/$5.98).
FIGURE 5: PROGRAMMING COSTS & REVENUES, PER SUBSCRIBER PER MONTH, TWC PRO-FORMA
Source: TWC and Adelphia 10-Ks; industry reports; Navigant Economics LLC calculations.
C. Programming Costs Have Decreased Relative to Profits
24. I also compared the growth in programming costs over time to the increase in per-
subscriber profitability that MSOs have enjoyed in recent years. If programming cost increases
were a significant factor forcing cable operators to raise rates, other things equal, one would
expect that profits would decline as programming expenses increased.16 Instead, the data suggest
that profitability has increased over time, both in absolute terms and relative to programming
16. As noted above, only perfectly competitive firms pass along 100 percent of price increases.

13
costs. This result is hardly surprising, given that programming costs have declined relative to
both costs and revenues, as documented above.
25. As above, I examined data on the publicly traded MSOs for which up-to-date
programming cost data are consistently available. I calculated the rate of increase of these
companies’ programming expenses and two profitability metrics, gross profit per subscriber and
operating profit per subscriber, from 2003 - 2008.17
26. As shown in Figure 6, although programming expenses for the MSOs increased
by approximately 42 percent (from $15.90/sub/month to $22.55/sub/month), MSO gross profits
increased by approximately 59 percent (from $39.02/sub/month to $62.05/sub/month). Operating
profits for the MSOs increased by approximately 68 percent over this same interval (from
$24.52/sub/month to $41.22/sub/month). Thus, the available evidence suggests that profitability
has increased substantially relative to programming costs for MSOs – exactly the opposite of
what should have transpired if programming expenses had forced MSOs to raise cable prices.
17. Gross profit is computed as total revenues net of total costs of revenue. Operating profit is computed as total revenues net of total costs of revenue and SG&A. As noted above, the use of SG&A ensures comparability across companies, and eliminates cost categories that to not reflect the relevant underlying economics.

14
FIGURE 6: PROGRAMMING COSTS & PROFITABILITY METRICS, PER SUBSCRIBER PER MONTH,
MAJOR MSOS
Source: Cable operator 10-Ks; industry reports; Navigant Economics LLC calculations.
27. As with the other metrics examined above, I also examined profitability metrics
for TWC over this same time period. As before, I combined data for Adelphia with data for
TWC for the years 2003 – 2005 to arrive at estimates for TWC Pro-Forma.
28. I then calculated the rates of increase of gross profit and operating profit per
subscriber per month for TWC Pro-Forma, and compared them to increases in TWC Pro-
Forma’s operating costs. As shown in Figure 7, although programming expenses for TWC Pro-
Forma increased by approximately 39 percent from 2003 to 2008 (from $15.47/sub/month to
$21.45/sub/month), gross profits increased by approximately 53 percent over this same interval
(from $33.74/sub/month to $51.75/sub/month). Moreover, operating profits increased by

15
approximately 49 percent (from $23.71/sub/month to $35.44/sub/month). Thus, the available
evidence suggests that TWC Pro-Forma’s profitability has increased substantially in recent years,
both in absolute terms and relative to programming expenses. In absolute terms, for every dollar
increase in programming expenditures TWC incurred over this period, its gross profits rose by
$3.01 ($18.01/$5.98).
FIGURE 7: PROGRAMMING COSTS & PROFITABILITY METRICS, PER SUBSCRIBER PER MONTH,
TWC PRO-FORMA
Source: TWC and Adelphia 10-Ks; industry reports; Navigant Economics LLC calculations.

16
III. THE CHANGING MARKET FOR VIDEO PROGRAMMING
29. In recent years, the value of video programming to cable operators has increased.
In part, as noted above, this is simply a function of the fact that MSOs are purchasing more
programming, and higher quality programming, which is valued by consumers.18 In addition,
MSOs have benefited from their ability to use video services to draw subscribers to other product
offerings, such as wireline telephony and high-speed internet. MSOs are increasingly relying on
bundles of services offered through their networks to increase average revenues per customer. By
offering multiple services over the same network, cable operators can defray their fixed costs
over a broader revenue base and boost profitability. Thus, bundling increases the value of video
programming, because the potential for marketing wireline telephony and high-speed data
increases the expected profitability of attracting additional video subscribers to the network. At
the same time as the value of programming to MSOs has been rising, the costs of producing
high-quality programming have also risen.
A. The Value of Programming to MSOs is Increasing
30. Virtually all major cable operators and local telephone companies now compete in
the marketplace as multi-product firms. Comcast, Cox, Mediacom, TWC, AT&T and Verizon,
for example, all offer broadband and wireline telephony services in addition to video
programming, often marketed to consumers in “double-play” and “triple-play” bundles. In
addition to its value as a stand-alone product, video programming is an essential input into these
multi-product lineups, as consumers who subscribe to a given video provider on the basis of its
programming offerings are more likely to subscribe to one or more bundled services as well.
31. While video programming still accounts for the majority of major MSOs’
revenue, the share of overall revenue attributable to broadband and telephony services is growing
18. The MSOs acknowledge as much; see n. 9 above.

17
rapidly, as shown in Figure 8. For example, Comcast’s revenue from high-speed data services
has more than doubled over the past four years, increasing from $2.9 billion in 2004 to $7.2
billion in 2008.19 Over the same period, Comcast’s revenue from residential telephony more than
quadrupled, from $620 million to over $2.6 billion.20
FIGURE 8: SHARE OF REVENUE BY PRODUCT, MAJOR MSOS, 2004-2008
Source: Cable operator 10-Ks; industry reports; Navigant Economics LLC calculations.
32. Like other major MVPDs, Time Warner Cable derives an increasing share of its
total revenue from HSD and telephony. TWC’s revenue from HSD increased from $1.6 billion in
2004 to $4.2 billion in 2008, an increase of over 150 percent over four years.21 Similarly, TWC’s
revenue from telephony services increased from $29 million in 2004 to $1.6 billion in 2008.22
19. For 2008 figure, see Comcast Corporation, Form 10-K, filed Feb. 20, 2009. For 2004 figure, see Comcast Corporation, Form 10-K, filed Feb. 26, 2007.
20. Id. 21. For 2008 figure, see Time Warner Cable, Form 10-K, filed Feb. 20, 2009. For 2004 figure, see Time
Warner Cable, Form 10-K, filed Feb. 23, 2007. 22. Id.

18
Figure 9 illustrates the growth in revenue for TWC attributable to HSD and telephony services
over time.
FIGURE 9: SHARE OF REVENUE BY PRODUCT, TIME WARNER CABLE, 2004-2008
Source: Time Warner Cable 10-Ks; Navigant Economics LLC calculations.
33. Time Warner Cable has made marketing double- and triple-play services a focus
of its business strategy,23 including developing services that are available only to customers who
purchase multiple products, including advanced caller ID and the ability share photos via video-
on-demand service.24 Table 1 shows the percentage of TWC customers who purchase services as
part of a double or triple-play bundle.
23. Time Warner Cable Inc., Form 10-K, filed Feb. 20, 2009, at 9 (“In addition to selling its services separately, TWC is focused on marketing differentiated packages of multiple services and features, or ‘bundles’ for a single price. TWC offers bundled services to both its residential and commercial customers and, increasingly, these customers subscribe to two or three of TWC’s primary services. TWC customers who subscribe to a bundle receive a discount from the price of buying the services separately as well as the convenience of a single monthly bill.”).
24. Id at 9-10.

19
TABLE 1: TIME WARNER CABLE, DOUBLE AND TRIPLE-PLAY SUBSCRIBERS, 2006-2008
2006 2007 2008
Total Subscribers (000’s) 14,565 14,626 14,582
Double-play Customers (000’s) 4,647 4,703 4,794
Double-play % 31.9% 32.2% 32.9%
Triple-play Customers (000’s) 1,523 2,363 3,099
Triple-play % 10.5% 16.2% 21.3% Source: Time Warner Cable Inc., Form 10-K, filed February 20, 2009, at 10.
34. As shown in Table 1, by 2008, more than half of TWC’s customers subscribed to
two or more services, and virtually all of them subscribed to video. For example, over 80
percent of TWC’s residential telephony subscribers were triple-play subscribers.25
B. Programmers’ Costs Have Increased In Response to the Competitive Landscape
35. Economists and regulators alike have observed that the content aired by national
programming networks has improved in both quality and variety in recent years.26 Consumers
can choose between more shows, news, and specialized programming than ever before, and can
often view desired programs in High Definition formats. Sports enthusiasts, for example, can
watch a greater number of games and associated pre and post-event coverage than in years past,
from more leagues in the United States and abroad, and from college and high school ranks. The
flip side of this increase in the quality and scope of programming, however, is that the costs
incurred by networks to produce original content and to secure the rights to sporting and other
events have increased as well.27
25. Id at 7-10; Navigant Economics LLC calculations. 26. Cable operators agree. See n. 9 above. 27. SNL Kagan, “The Economics of Basic Cable Networks,” 2008 Edition, at 15 (“There has been a slight
acceleration in the last two years as there has been a shift to more original programming, with programming [costs] as a percentage of revenue rising from the 44%-45% range during 2001-2005 to the 46-47% range in 2006 and 2007.”).

20
IV. MARKET STRUCTURE AND COMPETITION IN THE MARKET FOR VIDEO PROGRAMMING
36. License fees for video programming are set in bilateral negotiations between
content creators and content distributors (referred to hereafter as multichannel video
programming distributors, (“MVPDs”), which includes MSOs, satellite platforms, and local
exchange carriers that provide video services). As the discussion below demonstrates, there are
far more programming networks than MVPDs, and concentration, properly measured, is much
higher among MVPDs than programmers. Moreover, cable operators increasingly have grouped
their operations into local “clusters” of systems, which, as explained further below, gives them
significant market power in negotiating for local content, such as retransmission rights for
broadcast stations or program rights for regional cable networks.
37. As of 2008, nearly three quarters of all MVPD subscribers received video
programming from one of only four major multi-channel video distributors, cable companies
Comcast and Time Warner Cable, and satellite providers DIRECTV and EchoStar.28 On the
other hand, the market for programming is highly fragmented, with more than 500 different
national programming networks, dozens of additional regional networks, and over 1,700 local
broadcast TV stations.
A. The Upstream Market is Highly Competitive
38. The upstream side of the video programming market is highly competitive. The
more than 565 programming networks are owned by a large number of different firms, and no
single company controls networks that account for more than about 16 percent of the market.
Moreover, the market has experienced, and continues to experience, substantial entry, including
entry (and exit) by MSOs, which can and do own and operate their own programming networks.
28. SNL Kagan, “Broadband Cable Financial Databook,” 2009 Edition.

21
In such a market, there is simply no basis for believing programmers have the ability to charge
higher-than-competitive prices.
39. The FCC reports that, in 2006, there were 565 satellite-delivered national
programming networks, an increase of 34 networks over the 2005 total of 531 networks.29 This
rapid entry – a six percent increase in the number of national networks in the course of just one
year – indicates that barriers to entry in the marketplace are low, and incumbent programmers are
under constant threat of competition from new as well as existing networks. As shown in Figure
10, the number of satellite-delivered networks has grown consistently in recent years.
29. Thirteenth Annual MVPD Report at ¶186.

22
FIGURE 10: NUMBER OF SATELLITE-DELIVERED PROGRAMMING NETWORKS, 2000-2006
Source: Thirteenth Annual MVPD Report at ¶20; Federal Communications Commission, In the Matter of Annual Assessment of the Status of Competition in the Market for the Delivery of Video Programming, Twelfth Annual Report, MB Docket No. 05-255 (Mar. 3, 2006), at ¶157; Federal Communications Commission, In the Matter of Annual Assessment of the Status of Competition in the Market for the Delivery of Video Programming, Eleventh Annual Report, MB Docket No. 04-227 (Feb. 4, 2005), at ¶145; Federal Communications Commission, In the Matter of Annual Assessment of the Status of Competition in the Market for the Delivery of Video Programming, Tenth Annual Report, MB Docket No. 03-172 (Jan. 28, 2004), at ¶17; Federal Communications Commission, In the Matter of Annual Assessment of the Status of Competition in the Market for the Delivery of Video Programming, Ninth Annual Report, MB Docket No. 02-145 (Dec. 31, 2002), at ¶13; Federal Communications Commission, In the Matter of Annual Assessment of the Status of Competition in the Market for the Delivery of Video Programming, Eighth Annual Report, CS Docket No. 01-129 (Jan. 14, 2002), at ¶13. Note: 2004 and prior years are not strictly comparable to 2005-6. 40. The competitiveness of the programming market has also been affected by the
rapid increase in programming choices and accompanying audience fragmentation. As shown in
Figure 11, for example, the highest-rated television show in 1950 (Texaco’s “Star Theater”)
captured over 60 percent of the prime-time audience; as recently as the 1980s it was typical for
top-rated shows to capture ratings in the 30s. By the turn of the century, however, the top-rated
show had fallen to less than a 20 percent rating, and the decline is continuing.

23
FIGURE 11: DECLINE IN AUDIENCE SHARES OF MOST POPULAR PROGRAMS
Source: Adam Thierer and Grant Eskelsen, Media Metrics: The True State of the Modern Media Marketplace (The Progress & Freedom Foundation, 2008) at 58, citing Nielsen Media Research.
41. Competition has affected every aspect of the programming business. As shown in
Figure 12, cable networks have consistently taken share from broadcast networks, and are
projected to continue taking share in the future.

24
FIGURE 12: ACTUAL AND PROJECTED BROADCAST VS. BASIC CABLE VIEWING SHARES
(1980-2018)
Source: SNL Kagan, “Broadband Cable Financial Databook”, 2008 Edition.
42. As shown in Table 2, concentration of network ownership is low by traditional
antitrust standards, and falling: The top six media “conglomerates” have combined prime-time
audience shares of under 75 percent, and the Herfindahl-Hirschman Index (the most commonly
used measure of industry concentration) is below 900 – that is, well within the range the
Department of Justice considers “unconcentrated.”30
30. See U.S. Department of Justice and U.S. Federal Trade Commission, Horizontal Merger Guidelines (1997) at 15-16.

25
TABLE 2: PRIME TIME AUDIENCE SHARES (PERCENT) AND HERFINDAHL-HIRSCHMAN INDICES FOR THE SIX
LEADING MEDIA “CONGLOMERATES” (2000-2006) 2000 2001 2002 2003 2004 2005 2006Time Warner 14 13 14 13 12 11 11News Corporation 8 9 8 12 10 10 10NBC Universal 12 11 12 12 11 12 12Disney 18 16 15 14 14 15 16Viacom 5 6 7 6 7 8 8CBS 15 16 15 14 13 14 14Combined Share 72 71 71 71 67 70 71HHI Index 978 919 903 885 779 850 881
Source: Share data from Nielsen Media Research and Wolzien LLC as reported in Michael Nathanson, et. al., Big Thinking on Small Caps: As Primetime Content Distribution Expands, Will Local Broadcasters Go The Way of Your Local Record Store? (Bernstein Research, January 17, 2007), at Exhibit 1.
43. Ownership of video programming content is diverse as well as unconcentrated.
Of the 565 national networks identified by the FCC in 2006, only 84 (14.9 percent) were
affiliated with a cable MSO,31 and only 124 (22 percent) were affiliated with a DBS provider or
with a national broadcast television network. Put differently 357 of the 565 networks (63.2
percent) are unaffiliated with either a broadcast network or an MVPD.32
44. While relatively few cable networks are owned by MSOs, it is also true that most
of the top MSOs, including Comcast, Cox, Cablevision, Advance/Newhouse, and, until 2009,
Time Warner, own cable programming networks.33 From an economic perspective, the fact that
cable operators like Comcast and Cox can and do compete directly with independent
programmers like Disney and Viacom is an indicator that programmers do not have the ability to
charge cable operators higher-than-competitive prices – since, if they attempted to do so, the
cable operators could shift toward self-provisioning. Thus, MVPD ownership of programming
31. Thirteenth Annual MVPD Report at ¶20, and Appendix C, Table C-1. This figure includes the 30 networks wholly owned by Time Warner, which was then the parent company of Time Warner Cable.
32. Id. 33. Id at ¶186.

26
networks would act as a constraint – if one were necessary – on the exercise of market power by
programmers.34
45. In this context, Time Warner Cable’s recent spin-off from parent Time Warner
Inc., despite Time Warner Inc.’s ownership of several major programming networks (including
CNN, TNT and the Cartoon Network),35 is an indication that TWC does not believe
programmers have market power. If TWC were truly concerned about the ability of
programmers to charge excessive rates, it would presumably have resisted the spin-off in order to
continue to avail itself of lower prices from its affiliated programming. Yet, at the time the
transaction was announced, Time Warner President and CEO Jeff Bewkes stated unambiguously
that, “After the transaction, each company will have greater strategic, financial and operational
flexibility and will be better positioned to compete.”36
B. The Downstream Market is Relatively Concentrated
46. In contrast to the upstream (sellers) market, the downstream (buyers) market for
video programming is characterized by high levels of concentration among a few major MVPDs.
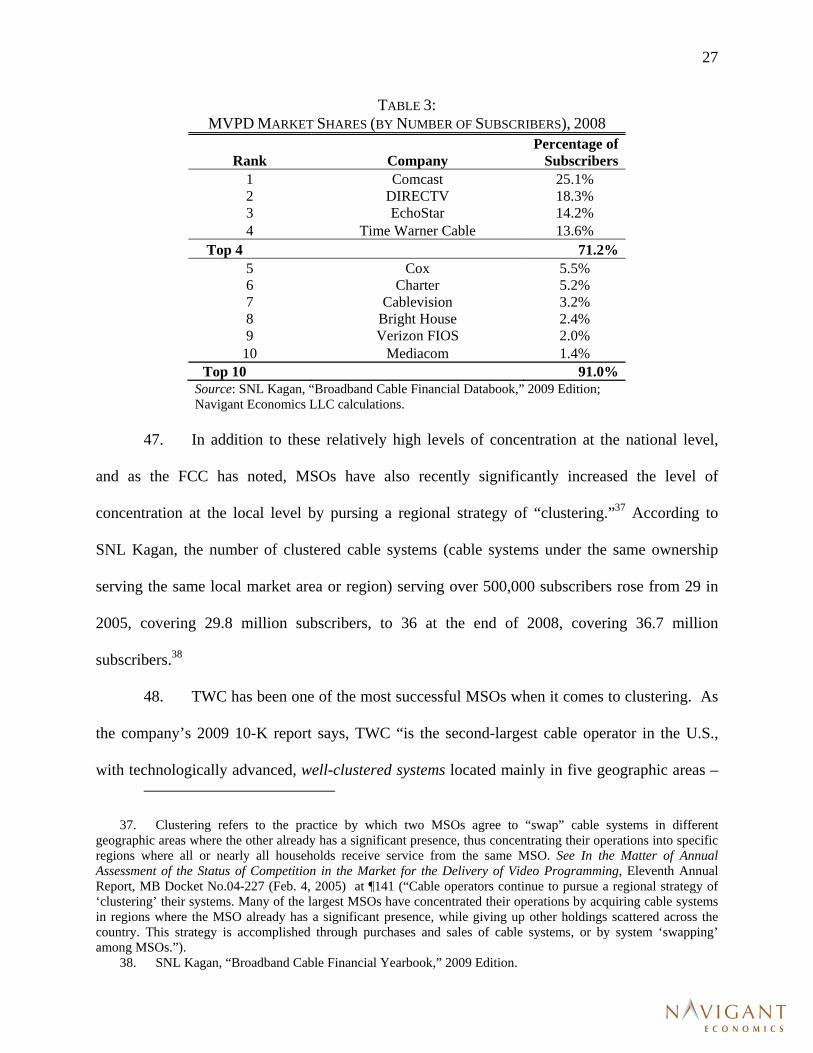
As shown in Table 3, below, in 2008, the four MVPDs with the largest subscribership –
Comcast, Time Warner Cable, DIRECTV, and EchoStar – served 71.2 percent of all MVPD
subscribers. The top ten MVPDs serve 91 percent of subscribers.
34. Moreover, academic studies have shown that, other things equal, a cable operator is more likely to carry MVPD affiliated programming (regardless of whether it is affiliated with that cable operator or a different MVPD) than to carry other programming. See, e.g., Tasneem Chipty, “Vertical Integration, Market Foreclosure, and Consumer Welfare in. the Cable Television Industry,” American Economic Review 91 (2001) 428.
35. See note 33. 36. See Time Warner Cable, “Time Warner and Time Warner Cable Agree to Separation,” Press Release
(May 21, 2008) (available at http://files.shareholder.com/downloads/TWX/315037497x0x197385/344b58ac-cb91-4625-8ca9-c0c0dc886810/newrelease.pdf). If programmers had significant market power over MVPDs, one would expect far more vertical integration than is observed, as firms sought to avoid the problem economists refer to as “double marginalization,” which occurs when an upstream firm charges higher-than-competitive prices to a downstream firm which also possesses market power. For a simple explanation of double marginalization, see http://faculty.haas.berkeley.edu/rjmorgan/Double%20Marginalization%20v2.ppt#276,19,Other Issues.
27
TABLE 3: MVPD MARKET SHARES (BY NUMBER OF SUBSCRIBERS), 2008
Rank CompanyPercentage of
Subscribers 1 Comcast 25.1% 2 DIRECTV 18.3% 3 EchoStar 14.2% 4 Time Warner Cable 13.6%
Top 4 71.2% 5 Cox 5.5% 6 Charter 5.2% 7 Cablevision 3.2% 8 Bright House 2.4% 9 Verizon FIOS 2.0%
10 Mediacom 1.4% Top 10 91.0%
Source: SNL Kagan, “Broadband Cable Financial Databook,” 2009 Edition; Navigant Economics LLC calculations.
47. In addition to these relatively high levels of concentration at the national level,
and as the FCC has noted, MSOs have also recently significantly increased the level of
concentration at the local level by pursing a regional strategy of “clustering.”37 According to
SNL Kagan, the number of clustered cable systems (cable systems under the same ownership
serving the same local market area or region) serving over 500,000 subscribers rose from 29 in
2005, covering 29.8 million subscribers, to 36 at the end of 2008, covering 36.7 million
subscribers.38
48. TWC has been one of the most successful MSOs when it comes to clustering. As
the company’s 2009 10-K report says, TWC “is the second-largest cable operator in the U.S.,
with technologically advanced, well-clustered systems located mainly in five geographic areas –
37. Clustering refers to the practice by which two MSOs agree to “swap” cable systems in different geographic areas where the other already has a significant presence, thus concentrating their operations into specific regions where all or nearly all households receive service from the same MSO. See In the Matter of Annual Assessment of the Status of Competition in the Market for the Delivery of Video Programming, Eleventh Annual Report, MB Docket No.04-227 (Feb. 4, 2005) at ¶141 (“Cable operators continue to pursue a regional strategy of ‘clustering’ their systems. Many of the largest MSOs have concentrated their operations by acquiring cable systems in regions where the MSO already has a significant presence, while giving up other holdings scattered across the country. This strategy is accomplished through purchases and sales of cable systems, or by system ‘swapping’ among MSOs.”).
38. SNL Kagan, “Broadband Cable Financial Yearbook,” 2009 Edition.

28
New York State (including New York City), the Carolinas, Ohio, southern California (including
Los Angeles) and Texas.”39 Of the 50 largest system clusters reported by SNL Kagan, 17 are
owned by TWC, including two of the top 10 – Los Angeles and New York City.40
49. Clustering directly increases the bargaining power of MSOs in negotiations for
both regional (e.g., regional sports networks) and local content (e.g., broadcast signals).
Bernstein Research notes that the negotiation of programming rights is often a function of local
market share, and that as a result of clustering, cable operators often dominate local markets.41 A
cable operator’s refusal to carry a local programming network can have devastating effects on
the programmer, as MSOs and programmers realize losses asymmetrically. As Bernstein
Research explains, “subscribers leave distributors [MSOs] only slowly, while advertising
revenues [to programmers] are lost right away.”42 Moreover, because local and national rights
negotiations are often combined, the increased leverage clustering gives MSOs in local and
regional negotiations translates into increased leverage over national programming rights as well.
50. To summarize this section, the evidence demonstrates that the upstream side of
the market for programming is highly competitive. There are more than 500 networks, no single
firm controls more than about 15 percent of all programming, and the number of competitors is
increasing; that is, the market structure is unconcentrated, and there are no barriers to entry. On
the other hand, the downstream market is relatively concentrated at both the national level and
the local level, where clustering has resulted in MSOs controlling large shares of local video
distribution markets. Moreover, MVPDs can and do produce their own programming, but
generally choose not to do so – a clear indication they are not paying supra-competitive prices.
39. Time Warner Cable Inc., Form 10-K, filed February 20, 2009, at 1 (emphasis added). 40. SNL Kagan, “Broadband Cable Financial Yearbook,” 2009 Edition. 41. Bernstein Research, Cable and Satellite: Asymmetrical “Retrans” Leverage Favors Cable Over Satellite
And Telcos, (March 21, 2006) at 1. 42. Id.

29
V. CONCLUSIONS
51. MSOs have strong incentives to drive tough bargains with video programmers:
Lower input prices translate directly into higher profits. It is therefore not surprising that they
seek to enlist the support of both customers and government officials in their negotiations, by
claiming that programming costs are the cause of higher cable rates. As this report demonstrates,
however, programming costs are actually falling when compared with cable revenues, cable
profits, and other elements of cable costs. Moreover, the competitive nature of the programming
business suggests that programmers are not capable of charging higher-than-competitive license
fees. Finally, while cable operators’ total expenditures on programming have risen in recent
years, they are the first to agree that they – and their customers – are getting their money’s worth,
in the form of more choices and higher program quality. In short, while negotiations between
programmers and cable operators are, and are likely to remain, hard headed, the results are
benefiting consumers.