Embed Size (px)
Citation preview

This is an Accepted Manuscript, which has been through the Royal Society of Chemistry peer review process and has been accepted for publication.
Accepted Manuscripts are published online shortly after acceptance, before technical editing, formatting and proof reading. Using this free service, authors can make their results available to the community, in citable form, before we publish the edited article. We will replace this Accepted Manuscript with the edited and formatted Advance Article as soon as it is available.
You can find more information about Accepted Manuscripts in the Information for Authors.
Please note that technical editing may introduce minor changes to the text and/or graphics, which may alter content. The journal’s standard Terms & Conditions and the Ethical guidelines still apply. In no event shall the Royal Society of Chemistry be held responsible for any errors or omissions in this Accepted Manuscript or any consequences arising from the use of any information it contains.
Accepted Manuscript
Analyst
www.rsc.org/analyst
View Article OnlineView Journal
This article can be cited before page numbers have been issued, to do this please use: K. J. Son, A.
Rahimian, D. Shin, C. Siltanen, T. Patel and A. Revzin, Analyst, 2015, DOI: 10.1039/C5AN01648G.

Journal Name
ARTICLE
This journal is © The Royal Society of Chemistry 20xx J. Name., 2013, 00, 1-3 | 1
Please do not adjust margins
Please do not adjust margins
Received 00th January 20xx,
Accepted 00th January 20xx
DOI: 10.1039/x0xx00000x
www.rsc.org/
Microfluidic compartments with sensing microbeads for dynamic
monitoring of cytokine and exosome release from single cells
Kyung Jin Sona, Ali Rahimian
a, Dong-Sik Shin
a,c, Christian Siltanen
a, Tushar Patel
b and Alexander
Revzina,†
Monitoring activity of single cells has high significance for basic science and diagnostic applications. Here we describe a
reconfigurable microfluidic device for confining single cells along with antibody-modified sensing beads inside 20 picoliter
(pL) microcompartments for monitoring cellular secretory activity. An array of ~7000 microchmabers fabricated in the
roof of the reconfigurable microfluidic device could be raised or lowered by applying negative pressure. The floor of the
device was micropatterned to contain cell attachment sites in registration with the microcompartments. Using this set-up,
we demonstrated detection of inflammatory cytokine IFN-γ and exosomes from single immune cells and cancer cells
respectively. The detection scheme was similar in both cases: cells were first captured on the surface inside the
microfluidic device, then sensing microbeads were introduced into the device so that, once the microcompartments were
lowered, single cells and microbeads became confined together. The liquid bathing the beads and the cells inside the
compartments also contained fluorescently-labeled secondary antibodies (Abs). The capture of cell-secreted molecules
onto microbeads was followed by binding of secondary antibodies – this caused microbeads to become fluorescent. The
fluorescence intensity of the microbeads changed over time, providing dynamics of single cell secretory activity. The
microdevice described here may be particularly useful in the cases where panning upstream of sensing is required or to
analyze secretory activity of anchorage-dependent cells.
Introduction
Traditional cell ensemble measurements mask functional and
phenotypic heterogeneities among cell populations, which is
critical for comprehensive understanding of cellular networks1-
3. In particular, secretory activities of individual cells may
correlate with pathological developments and may provide
important information for disease diagnosis. Therefore,
analysis of single cellular secretory activities has drawn
tremendous interest from biology/medicine researchers in
recent years. Enzyme-linked immunospot (ELISpot) assay,
relying on a colorimetric enzymatic reaction of antibodies, is
one of the most extensively used methods for measuring the
cellular secretory activities in vitro4. Although ELISpot is
sensitive enough to detect low frequency single cells, this
assay does not provide temporal information about cell
secretions. In addition, it utilizes large volumes of cells and
reagents. The flow cytometry combined with intracellular
staining is another traditional means of detecting protein
expression at the single cell level. However, this approach is
not compatible with live cells and reports on intracellular
accumulation rather than secretion of molecules. Micro- and
nano-technology approaches are particularly well suited for
single cell analysis. A number of approaches including
microwells5-7
, droplets8, traps
9, and tubes
10 have been
developed for capture and analysis of single cells. In addition,
it is possible to retrieve desired single cells from devices by
various means11-15
. Of particular note is the prior work aimed
at developing microcompartments for capturing single cells in
proximity of antibodies (Ab) specific to cell-secreted signals16-
18. While any secreted protein may be detected using this
method, these devices focused on profiling cytokine secretions
from single immune cells. Cytokine capture Ab molecules
were either immobilized in the array form16, 18
or were
uniformly distributed on the surface on the cell capture
compartment17
. After cell secretion experiment the devices
were stained with secondary antibodies to reveal presence of
captured cytokines. While very useful, this strategy for single
cell analysis offers limited temporal information about cell
secretion.
Page 1 of 10 Analyst
123456789101112131415161718192021222324252627282930313233343536373839404142434445464748495051525354555657585960
Ana
lyst
Acc
epte
dM
anus
crip
t
Publ
ishe
d on
05
Oct
ober
201
5. D
ownl
oade
d by
Uni
vers
ity o
f C
alif
orni
a -
Dav
is o
n 22
/10/
2015
19:
23:5
2.
View Article OnlineDOI: 10.1039/C5AN01648G

ARTICLE Journal Name
2 | J. Name., 2012, 00, 1-3 This journal is © The Royal Society of Chemistry 20xx
Please do not adjust margins
Please do not adjust margins
Another strategy for single cell analysis is to encapsulate
single cells inside microdroplets alongside Ab-functionalized
microbeads and fluorescently labeled secondary Abs8, 19, 20
.
Secreted molecules become captured on microbeads; this in
turn leads to binding of secondary Abs and appearance of
fluorescence signal. Importantly, the signal appears
dynamically without the need for secondary labeling or
staining. While encapsulating cells inside droplets is exciting,
there may be applications that benefit from having cells bind
to surfaces prior to analysis, for example those involving
anchorage dependent cells or those requiring isolation of
specific cellular subsets from a heterogeneous mixture.
Previously, our lab has developed reconfigurable
microfluidic compartments that were used in conjunction with
peptide-modified hydrogel structures for monitoring protease
release from single cells14
. However, this previous device relied
on the proteolytic cleavage of peptides for generating the
signal and was not easily adaptable to the detection of other
types of secreted molecules. In the present study, we describe
a more general strategy for monitoring single cell secretions by
combining reconfigurable microcompartments and Ab-
modified microbeads. The principle of operation of the device
is shown in Fig. 1. The microcompartments were molded in
the roof of the reconfigurable microfluidic device. The roof
may be raised or lowered by applying and releasing negative
pressure, thus opening or closing compartments. Cells are
captured on the micropatterned floor of the device after which
microbeads are flowed into the device and become entrapped
inside the compartments upon actuation of the reconfigurable
microfluidic device. In addition to single cells and microbeads,
compartments contained free-floating fluorescent secondary
Abs. Microbeads captured cell-secreted molecules and
became fluorescent upon binding of secondary Ab molecules
from solution (Fig. 1). One demonstration of this microsystem
was to capture single CD4 T-cells and monitor release of
interferon (IFN)-γ over time. Analysis of IFN-γ release from
CD4 T-cells is used clinically for diagnosis of TB exposure21
and
being able to dynamically monitor release of this cytokine may
provide valuable information about this disease. In another
demonstration, this microsystem was used for detection of
exosome release from hepatocellular carcinoma (HCC) cells.
Exosomes are nanovesicles (diameter: 30 – 150 nm) secreted
by a variety of healthy and malignant cell types 22-25
and have
recently garnered attention for their diagnostic potential26-28
.
The microsystem developed here allowed us to monitor
exosome release dynamically with single cell resolution.
Overall, this paper describes a general strategy for dynamic
monitoring of secretory activity from single cells. It may be
combined in the future with cell retrieval approaches to
enable function-based sorting of single cells.
Materials and Methods
A. Materials
Streptavidin coated polystyrene particles (diameter = 5.0 – 5.9
μm) were obtained from Spherotech (Lake Forest, IL).
Biotinylated rabbit anti-human CD63 antibodies (anti-CD63 Ab-
biotin) and PE-conjugated rabbit anti-human CD63 antibodies
(anti-CD63 Ab-PE) were purchased from Bioss (Woburn, MA).
Biotinylated goat anti-human IFNγ antibodies (anti-IFNγ-
biotin), PE-conjugated mouse anti-human IFNγ antibodies
(anti-IFNγ-PE) and Alexa 488-conjugated anti-human IFNγ
antibodies (anti-IFNγ-488) were purchased from R&D Systems
(Minneapolis, MN). Mouse anti-human CD4 antibodies (anti-
CD4 Ab) were obtained from Beckman Coulter (Miami, FL).
CellTrackerTM
Blue CMAC Dye was purchased from Thermo
Fisher Scientific, Inc. (Waltham, MA).
Phorbol 12-myristate 13-acetate (PMA) and ionomycin
were obtained from Sigma-Aldrich. Phosphate buffered saline
(PBS) was purchased from TEKnova (Hollister, CA). Glass slides
(75 × 25 mm2) and cover glasses (24×30×0.13 mm) were from
Fig. 1 Microcompartment arrays for isolating single cells and sensing beads for monitoring cellular secretory activity. (a) Drawing of the reconfigurable microfluidic device, and (b) microscope images showing cells and cells with sensing beads encapsulated inside the compartment. Blue arrows and red arrows in (b) indicate cells stained with CellTracker and beads, respectively. Scale bar = 30 µm. (c)
Individual compartment consisting of single cells and sensing beads surrounded by PE-labelled detection antibodies as reporter molecules. Once released by cells, target molecules diffused inside the chamber, bound to sensing bead, causing fluorescence increase on bead surface via sandwich assay.
Page 2 of 10Analyst
123456789101112131415161718192021222324252627282930313233343536373839404142434445464748495051525354555657585960
Ana
lyst
Acc
epte
dM
anus
crip
t
Publ
ishe
d on
05
Oct
ober
201
5. D
ownl
oade
d by
Uni
vers
ity o
f C
alif
orni
a -
Dav
is o
n 22
/10/
2015
19:
23:5
2.
View Article OnlineDOI: 10.1039/C5AN01648G

Journal Name ARTICLE
This journal is © The Royal Society of Chemistry 20xx J. Name., 2013, 00, 1-3 | 3
Please do not adjust margins
Please do not adjust margins
Fisher Scientific (Pittsburgh, PA). All other chemicals were
purchased from Sigma (St. Louis, MO) or Aldrich Chemicals
(Milwaukee, WI). MATLAB (MathWorks Inc., Natick, MA) and
COMSOL Multiphysics (COMSOL, Inc., Burlington, MA) were
used for modeling of antibody binding, and calculating the
cellular secretion rates.
CD4+ T cells were isolated (cell purity = ~ 95%) from
human PBMCs drawn from healthy donors by negative
selection using Human CD4+ T Cell Enrichment Kit (Stemcell
Technologies, Vancouver, BC, Canada) according to the
manufactures instructions, and cultured in serum-free X-Vivo
15 medium with Gentamicin (Lonza, Walkersville, MD) and 1%
(v/v) penicillin-streptomycin at 37 °C in a humidified 5% CO2
atmosphere. The stimulation of CD4+ T cells was carried out by
PMA (50 ng mL-1
) and Ionomycin (1μg mL-1
). A human hepato
carcinoma cell line, HepG2 (American Type Culture Collection
(ATCC), Manassas, VA) were cultured in EMEM (Eagle’s
Essential Minimum Medium, ATCC, Manassas, VA) medium
supplemented with 10% (v/v) fetal bovine serum and 1% (v/v)
penicillin-streptomycin at 37 °C in a humidified 5% CO2
atmosphere. Exosomes derived from HepG2 cells were
isolated from the supernatant of 24 h FBS starved cultured
cells utilizing ExoQuick reagent (System Bio Sciences, Mountain
view, CA), and Amicon Ultra-15 centrifugal filters (EMD
Millipore, Billerica, MA). The supernatant was clarified by
vacuum filtration using the Steriflip® filter unit 0.22 μm
Millipore Express PLUS (PES) membrane (EMD Millipore,
Billerica, MA). Then the samples were concentrated by
centrifugation at 3000g for 30 minutes in Amicon ultra-15
centrifugal filters at 4°C, then buffer exchanged with PBS
through an extra centrifugation step with the same setting,
then incubated overnight with ExoQuick at 4°C. After 16 h of
incubation the solutions were centrifuged at 1500g for 30
minutes at 4°C. The pellet containing the exosomes was re-
suspended in PBS. BCA protein assay (Life Technologies, Grand
Island, NY), and Zeta Potential/Particle Sizer (PSS.NICOMP-
Particle sizing systems, Santa Barbara, CA) were used to
evaluate the quality of isolated particles. A cell culture
chamber was built on a Nikon eclipse Ti fluorescence
microscope (Nikon Instruments, Inc.) for live-cell analysis,
maintaining the environmental conditions for optimal growth
and functioning of cells during experiment. The temperature of
our device was controlled by Tokai Hit Thermo-E microscope
heating stage (Tokai Hit, Japan) while 5% CO2 was supplied to
the incubator.
B. Preparation of antibody-functionalized microbeads
Streptavidin-coated microbeads were used as reporters for
cellular secretory activities by being functionalized with
biotinylated capture antibodies through biotin-streptavidin
interactions. Prior to functionalization, microbeads were
washed with PBS three times via a centrifugation (at 10,000 rcf
for 2 min, Centrifuge 5424, Eppendorf, Hambrug,
Germany)/washing protocol. 0.1mg of streptavidin-microbeads
(~1.4 � 106 beads) were incubated with 30 μL of biotinylated
capture antibodies (0.05 mg mL-1
in PBS) for 2 h at room
temperature or overnight at 4°C, followed by rinsing with PBS
by a centrifugation/washing protocol. After blocking with 1%
BSA for 30 min at room temperature, antibody-microbeads
were used immediately or stored for up to 2 weeks at 4°C.
C. Fabrication of reconfigurable microfluidic device
Reconfigurable microfluidic device having a reversibly
collapsible array of subpicoliter chambers was prepared via a
multilayer soft lithography as described in previous reports29,
30. Briefly, the pre-polymer solution of polydimethylsiloxane
(PDMS; Sylgard 184, Dow Corning), mixed at a 10: 1 curing
(weight) ratio, was poured onto a photoresist patterned
substrate and placed under vacuum to remove air bubbles.
The two-layer microfluidic device is composed of a bottom
flow layer (400 µm thickness) and a top control layer (1 cm
thick). The control layer was baked first for 30 minutes at
70°C, and the flow layer was baked for 20 minutes while holes
were punched for the control layer. Then, the two layers were
carefully aligned by eye and adhered together. Finally, the
devices were baked for one hour to become fully cured.
Afterward, the devices were cut out and used for experiments.
It is well-known that PDMS is permeable to gases including
oxygen but is impermeable to proteins. To reduce nonspecific
binding of proteins to the PDMS surface, we blocked the
surface with 1% bovine serum albumin (BSA) for 1 h at room
temperature before experiments.
The working principle of a reconfigurable device is
described in Fig. 2. When vacuum is applied to the upper flow
layer of device, the reversibly collapsible flow layer is raised
and red fluorophore is distributed throughout (open
configuration). On the other hand, when vacuum is released
and positive pressure is applied to the upper flow layer (close
configuration), the flow layer descended from roof to the
substrate, generating an array of compartments with a volume
of ~ 20 pL that limits the diffusion of analytes between
chambers, and amplifying the signal.
D. Surface patterning with cell capture moieties
The glass substrates were cleaned in an oxygen plasma
chamber (YES-R3, San Jose, CA, USA) at 300 W for 15 min and
then incubated in 3% (v/v) 3-aminopropyltriethoxysilane
(APTES) in absolute ethanol for 2 h at room temperature in the
moisture-controlled environment. The slides were flushed with
fresh ethanol to remove non-covalently bound APTES, dried
under nitrogen, and then cured at 100°C for 2 h. Then, the
slides were further incubated in 2.5% (v/v) glutaraldehyde (GA)
in PBS for 2 h at room temperature, followed by rinsing with DI
water and dried under nitrogen. GA-modified substrates were
used immediately or placed in a desiccator until future use. To
Fig. 2 Drawing of the reconfigurable microfluidic device (upper
images), and optic/fluorescence images (lower images) illustrating the working principle using red fluorophore, PE.
Page 3 of 10 Analyst
123456789101112131415161718192021222324252627282930313233343536373839404142434445464748495051525354555657585960
Ana
lyst
Acc
epte
dM
anus
crip
t
Publ
ishe
d on
05
Oct
ober
201
5. D
ownl
oade
d by
Uni
vers
ity o
f C
alif
orni
a -
Dav
is o
n 22
/10/
2015
19:
23:5
2.
View Article OnlineDOI: 10.1039/C5AN01648G

ARTICLE Journal Name
4 | J. Name., 2012, 00, 1-3 This journal is © The Royal Society of Chemistry 20xx
Please do not adjust margins
Please do not adjust margins
define the site for cell attachment, the GA-modified surfaces
were patterned with cell capture moieties using our
reconfigurable microfluidic devices (FIG. S-1(a)). For cytokine
detection from T cells, anti-CD4 Abs (0.2 mg mL-1
) were used as
cell capture moieties, while collagen I (0.1 mg mL-1
, BD
Biosciences, San Jose, CA) being used for exosome detection
from HepG2 cells. Once a reconfigurable microfluidic device
was aligned over the GA-modified slides, the vacuum was
applied to the control layer (open configuration), facilitating
flow-in of cell capture moieties. Then, vacuum was released so
that the flow layer with a chamber array descended on the
slide (close configuration), keeping a solution of cell capture
moieties inside the confined chambers for 1.5 h at room
temperature. After rinsing with PBS in the open configuration,
the surface was blocked with 1% BSA for 1 h at room
temperature to prevent nonspecific binding of cells. The
presence of cell capture moieties patterns on surface was
verified using PE-labelled secondary antibodies verifying that
the size of cell capture moiety patterns is similar to that of
mocrocompartments (diameter = 30 μm for T cells and 40 μm
for HepG2 cells) as shown in FIG. S-1(b).
E. Constructing calibration curves for IFN-γ and exosomes
To assess signal vs. analyte concentration relationship,
calibration curves were generated by challenging antibody-
microbeads with different concentrations of recombinant
cytokines or isolated exosomes. First, microbeads
functionalized with IFN-γ capture (c)Ab (5.68�105 particles)
were exposed to 20 μL of solution containing PE-labelled
detection (d)Abs (25 μg mL-1
) as well as recombinant IFN-γ
(with various concentrations ranging from 0 to 200 ng mL-1
) in
the 0.5 mL tube, and immediately, infused into the microfluidic
device. The saturated fluorescence signals from microbeads
were detected at t = 60 min. Similarly, exosome cAbs (anti-
CD63 Abs) containing microbeads (2�104 particles) were
challenged to 20 μL of solution containing PE-labelled dAbs (25
μg mL-1
) and isolated exosomes (0 – 60 ng mL-1
) in the 0.5 mL
tube, and infused to the microfluidic device. Isolated
exosomes, more specifically the protein content of exosomes,
were quantitated by BCA protein assay kit. Even though the
concentration determined by BCA assay refers the protein
content of exosomes rather than exosomes themselves, BCA
assay has been used to provide information on the quantity of
isolated exosomes31, 32
. Fluorescence signals were observed for
3 h.
F. Cell capture and detection
A reconfigurable microfluidic device with the cell capture
moieties-patterned substrate was employed for real time
monitoring of single cellular secretory activities. It is of note
that the single cell trapping efficiency inside the microfluidics
depends on cell density as well as flow rate and the optimal
conditions for cell density or flow rate depend on the cell type.
Compared to suspension cells, adherent cells were seeded
with a lower density at a higher flow rate to achieve higher
single cell capture efficiency.
To detect cytokine secretion from T cells, cells suspended
in serum-free X-vivo medium (~1�106 cells mL
-1) were infused
into the device in open configuration at 2 µL min-1
for 60 min.
Unbound T cells were removed by washing with serum-free
medium at 25 µL min-1
for 30 min. Subsequently, antibody-
microbeads (2.84 � 107 particles mL
-1) and PE-labelled
detection antibodies (25 μg mL-1
) suspended in mitogenic
solution containing 50 ng mL-1
of PMA and 1 μg mL-1
of
Ionomycin in serum-free X-vivo medium were introduced into
the channel at 10 μL min-1
for 5 min. After the control layer of
the microfluidic device was collapsed (closed configuration),
time-lapse images of fluorescence signals on antibody-
microbeads were acquired at 30 min intervals for a total of 6 h
at exposure time of 0.2 msec. The viability of T cells
encapsulated in bead containing chambers during the
measurement was confirmed using LIVE/DEAD
viability/cytotoxicity assay as shown in FIG. S-2.
In a similar manner, we also monitored the exosome
production from HepG2 cells. HepG2 cells were suspended in
serum-free EMEM medium with a concentration of 1�105 cells
mL-1
and introduced into the device in open configuration at 5
µL min-1
for 20 min, followed by washing unbound cells with
serum-free medium at 25 µL min-1
for 30 min. Antibody-
microbeads (2.84 � 107 particles mL
-1) and PE-labelled
detection antibodies (25 μg mL-1
) suspended in serum-free
medium were injected into the channel at 10 μL min-1
for 5
min, and fluorescence signals on microbeads encapsulating
with cells in chambers were monitored in the close
configuration of device. Time-lapse images of sensing chamber
arrays were acquired at 30 min intervals for a total of 12 h at
exposure time of 0.2 msec. We carried out control
experiments and determined that fluorescent antibodies were
not photobleached during microscopy observation.
Results and Discussion
This paper describes a reconfigurable microfluidic device
integrated with sensing microbeads to enable dynamic
monitoring of cell-secreted molecules at the single cell level.
Detection of IFN-γ from individual CD4 T-cells and exosomes
from single hepatocellular carcinoma cells was demonstrated.
A. Antibody-functionalized microbeads as sensing elements
In the current study, we utilized streptavidin-coated
microbeads as sensing elements for monitoring cellular
secretory activities. Any biotinylated biomolecules (e.g.
Fig. 3 Fluorescence intensities of anti-IFN-γ cAb-beads after incubating with different concentrations of recombinant human
IFN-γ (conc. = 0 – 200 ng mL-1
) and PE-labelled anti-IFN-γ dAb (conc. = 5 μg mL
-1) for 60 min, verifying cytokine detectability using anti-
IFN-γ cAb-beads.
Page 4 of 10Analyst
123456789101112131415161718192021222324252627282930313233343536373839404142434445464748495051525354555657585960
Ana
lyst
Acc
epte
dM
anus
crip
t
Publ
ishe
d on
05
Oct
ober
201
5. D
ownl
oade
d by
Uni
vers
ity o
f C
alif
orni
a -
Dav
is o
n 22
/10/
2015
19:
23:5
2.
View Article OnlineDOI: 10.1039/C5AN01648G

Journal Name ARTICLE
This journal is © The Royal Society of Chemistry 20xx J. Name., 2013, 00, 1-3 | 5
Please do not adjust margins
Please do not adjust margins
antibodies, peptides, or aptamers) can be conjugated onto
microbeads via streptavidin-biotin interaction. Microbeads are
also advantageous from the standpoint of offering larger
surface area for loading capture antibodies. For example, a
microbead with diameter of 5 μm (typically used in our
experiments) has a surface are of 78.5 μm2 whereas flat
surface with the same diameter has an area of 19.6 μm2. Prior
to engaging in cell analysis, we characterized signal vs. analyte
concentration relationship (Fig. 3). In these experiments,
microbeads conjugated with IFN-γ cAbs were exposed to
various concentrations of recombinant IFN-γ ranging from 0 to
200 ng mL-1
inside the microfluidic device. The fluorescence
signal was created by incubating microbeads with PE-labelled
dAb. The calibration curve shown was used to determine that
linear range of the biosensor extended to 200 ng mL-1
. The
limit of detection (LOD) was determined to be 21.4 ng mL-1
based on signal-to-noise characteristics (S/N = 3)33
, while
notable signal was observed from 12.5 ng mL-1
of recombinant
IFN-γ. The binding capacity of Ab-functionalized microbeads is
one of the most critical factors, not only determining the
lifespan of the sensor but also having an influence on the
conservation equation which will used for numerical
simulation in following sections. We conducted ELISA (Enzyme-
linked immunosorbent assay) experiment as well as
fluorescence-based sandwich assay in order to determine the
binding capacity, which is one of the important parameters for
simulation (see the supporting information for detail). FIG. S-3
demonstrates single IFNγ sensing microbead can capture
0.0175 pg (= 0.00102 fmol) of IFNγ molecules.
B. Numerical simulation to determine cell secretion rates
By encapsulating single cells with sensing microbeads as
well as detection antibodies, we were able to observe the
increase in bead fluorescence over time, implying the
capturing of cell-secreting targets on beads (FIG. 5). By
comparing the calibration curve in FIG. 3 to the fluorescence
signals from single cell containing microcompartment, the
average amount of cell-secreted cytokines can be roughly
estimated at a specific time point. For instance, the estimated
average amount of cytokines secreted from single high-
secretor (FIG. 5(a)) can be determined to be 0.00030 pg cell-1
h-1
at t = 6 h and 0.00022 pg cell-1
h-1
at t = 3 h. Unlike
calibration experiment, the concentration of single-cell
secreted cytokines varies over time and diffusion of cytokines
from cell surface also affects signal, which hinders us from
establishing more accurate cell secretion rates. Numerical
simulation was performed in this paper to analyze the
dynamics of target detection using microbead-incorporating
microfluidic system, and to determine the cell secretion rate.
We developed a mathematical model accounting for cellular
secretory activities, the diffusion-based transport of cell-
secreting molecules, detection antibodies and sensing beads,
and the binding of those molecules related to detection
reaction as illustrated in FIG. 4. A single cell (diameter = 6 μm)
confined in a chamber (diameter = 30 μm, height = 30 μm) was
assumed to secrete targets at a constant rate, Rsec (event 1 in
FIG. 4), therefore, the total quantity of targets secreted from
the cells can be described as follow:
��� � ��� (1)
where nAg is the total number of cell-secreted targets, and t is
the incubation time. Even though cell secretion rate tends to
fluctuate in time34
, this simplified modeling with the
assumption of a constant rate may provide useful information
for understanding the dynamics of diffusion and detection of
targets in the current system.
Free-floating molecules, including cell-secreted molecule
(Ag), detection antibody (dAb) and sensing bead (Bead)
containing capture antibody (cAb), diffuse inside the closed
microcompartment (event 2 – 4):
����
�� ����
���� (2)
�����
�� �����
����� (3)
����
��
������
�� ������
������ (4)
where [X] is the concentration of X in the chamber and DX is
the diffusion coefficient of X. In this study, diffusion of sensing
bead is negligible since the concentration of beads is
insignificant. When cell-secreted targets (Ag) encounter
capture antibodies (cAb) on the bead, they form the target-
antibody complex (Ag-cAb) (event 5) as follow:
cAb + Ag ��������
����������
cAb-Ag
where kon1 and koff1 are the association and dissociation
constants, respectively. This target-capture antibody complex
(cAb-Ag) binds to detection antibody (dAb), forming the
product complex, cAb-Ag-dAb, which is closely correlated to
signal (event 6):
cAb-Ag + dAb ��������
����������
cAb-Ag-dAb (P)
Similarly, the binding reactions between targets (Ag) and
detection antibody (dAb) (event 7) and between capture
Fig. 4 Drawing describing cellular secretory activities (event 1), the diffusion-based transport of cell-secreting molecules (event 2), detection antibodies (event 3) and sensing beads (event 4), and
the binding of those molecules related to detection reaction (event5 – 8).
Page 5 of 10 Analyst
123456789101112131415161718192021222324252627282930313233343536373839404142434445464748495051525354555657585960
Ana
lyst
Acc
epte
dM
anus
crip
t
Publ
ishe
d on
05
Oct
ober
201
5. D
ownl
oade
d by
Uni
vers
ity o
f C
alif
orni
a -
Dav
is o
n 22
/10/
2015
19:
23:5
2.
View Article OnlineDOI: 10.1039/C5AN01648G

ARTICLE Journal Name
6 | J. Name., 2012, 00, 1-3 This journal is © The Royal Society of Chemistry 20xx
Please do not adjust margins
Please do not adjust margins
antibody (cAb) and target-detection antibody complex (Ag-
dAb) (event 8) can be described as:
Ag + dAb ��������
����������
Ag-dAb
cAb +Ag -dAb ��� ����
���� �����
cAb-Ag-dAb (P)
For simplifying the simulation, we assumed that binding
reaction associated with capture antibody (cAb) takes place in
a thin layer (thickness = 20 nm) of streptavidin-biotinylated
antibodies formed on the bead’s surface, called the reaction
region. Therefore, [cAb], [cAb-Ag], and [P] are the
concentration of capture antibodies, target-capture antibody
complex, and product complex in the reaction region. On the
other hand, [Ag], [dAb], and [Ag-dAb] indicate the
concentration of target, detection antibody, target-detection
antibody complex in the microcompartment.
The binding reactions are modeled by the first-order
Langmuir kinetics and can be described as follows:
����
�� −������� ��� + �����(�$ − ��� −
�% ) − ������� ���� + �����('$ − ���� − �% ) (5)
����
�� −������� ��� + �����(�$ − ��� −
�% ) − ��� ��� ('$ − ���� − �% ) + ���� �% (6)
�����
�� −����(�$ − ��� − �% )���� +
������% − ������� ���� + �����('$ − ���� − �% ) (7)
��%
�� ����(�$ − ��� − �% )���� − ������% +
��� ��� ('$ − ���� − �% ) − ���� �% (8)
where B0 is the initial concentration of immobilized capture
antibodies in the reaction region (total binding sites on beads)
and I0 is the initial concentration of detection antibodies in the
chamber. The binding capacity of antibody-functionalized
beads was determined by ELISA and fluorescence-based
sandwich assay as described in supporting information (FIG. S-
3). The equations (1 – 8) were numerically solved to obtain the
concentration profile for cell-secreted cytokines and to
simulate the rate of cytokine secretion from single cells using
COMSOL Multiphysics 4.3. We assumed that 1) convection
inside the microcompartment is negligible; and 2) initial
concentration of secreted molecules is negligible ([Ag]t=0 = 0).
The values of parameters used in the simulation are
summarized in Table 1.
Table 1. Values of parameters used in the simulation
Density of total binding sites, B0 0.00102 fmol per bead
Concentration of initial detection
antibodies, I0
0.000662 fmol per
compartment
Diffusion coefficient of target
(IFNγ), DAg 1.40 � 10
-6 cm
2 s
-1
Diffusion coefficient of detection
antibody, DdAb 5.82 � 10
-7 cm
2 s
-1
Dissociation binding constant, Kd
= koff/kon (estimated)
Binding between target and
capture antibody (#1 and #4)
1nM (kon = 1�106 M
-1 s
-1,
koff = 1�10-3
s-1
)
Binding between target and
detection antibody (#2 and #3)
0.5nM (kon = 2�106 M
-1 s
-1,
koff = 1�10-3
s-1
)
By assuming cytokine secretion rate Rsec, the concentration
profile of [P] can be obtained by solving equation (1 – 8),
generating theoretical signal which is linearly related to the
concentration of [P] in the reaction region. With iterative
method to match experimental data to theoretical signal,
cytokine secretion rate Rsec was determined with a percent
root mean square deviation (RMSD) of ~ 5 %.
C. Monitoring cytokine secretion of single CD4+ T cells
Cytokine secretion of single CD4+ T cells was analyzed using
our microfluidics containing sensing antibody-beads. CD4+ T
cells were isolated from human PBMCs, stained with
CellTracker Blue dye to be distinguished from sensing beads,
and captured onto the anti-CD4 Ab modified surfaces with a
single cell capture efficiency of 45.1 ± 5.8% (two cells =
20.4±3.2%; three cells = 8.8±1.9%; no cell = 22.1±2.7%, n =
655). Next, solution containing mitogens, sensing microbeads
and fluorescently-labelled detection antibodies was
introduced into the microfluidic device. The vacuum was then
released, lowering microcompartments and isolating single
cells with sensing beads as well as detection antibodies inside
the compartments. Among the chambers encapsulating single
T cells (n = 295), 29.8% (n = 88) of chambers contained single
sensing beads, 6.1% (n = 18) contained two beads, 1.4% (n = 4)
contained three beads, and 62.7% (n = 185) contained no bead,
which follows the Poisson distribution (see supporting
information for detail). We examined the effects of the
number of beads per compartment on the fluorescence signal
emanating from one bead to find out if the fluorescence signal
is dependent on the number of beads. Our modeling (FIG.S-4)
and experiments revealed that per bead fluorescence in multi-
bead/single cell compartments was not appreciably different
from fluorescence single bead/single cell compartments. This
may be explained by the fact that only a small fraction of
cytokine molecules are captured on beads and have the
detection Ab form sandwich that leads to fluorescence. This
observation allowed us to exploit not only the chambers
having single cell and single bead but also those having single
cell and multibeads for getting information on cytokine
secretion, we demonstrated that the number of encapsulated
beads might have its least impact on signals using numerical
simulation as seen in FIG. S-4. In this paper, therefore, we
analyzed the signals from chambers having single cells and at
least one bead (n = 110).
We monitored cytokine secretion from mitogenically
activated T cells as well as quiescent T cells for 6 h and
analyzed the fluorescence intensities of sensing beads. It has
been shown previously that stimulation with PMA/Ionomycin
stimulation triggers production of cytokines such as IFN-γ from
T-cells35
. Upon stimulation with PMA and ionomycin, 19.1% (n
Page 6 of 10Analyst
123456789101112131415161718192021222324252627282930313233343536373839404142434445464748495051525354555657585960
Ana
lyst
Acc
epte
dM
anus
crip
t
Publ
ishe
d on
05
Oct
ober
201
5. D
ownl
oade
d by
Uni
vers
ity o
f C
alif
orni
a -
Dav
is o
n 22
/10/
2015
19:
23:5
2.
View Article OnlineDOI: 10.1039/C5AN01648G
Journal Name ARTICLE
This journal is © The Royal Society of Chemistry 20xx J. Name., 2013, 00, 1-3 | 7
Please do not adjust margins
Please do not adjust margins
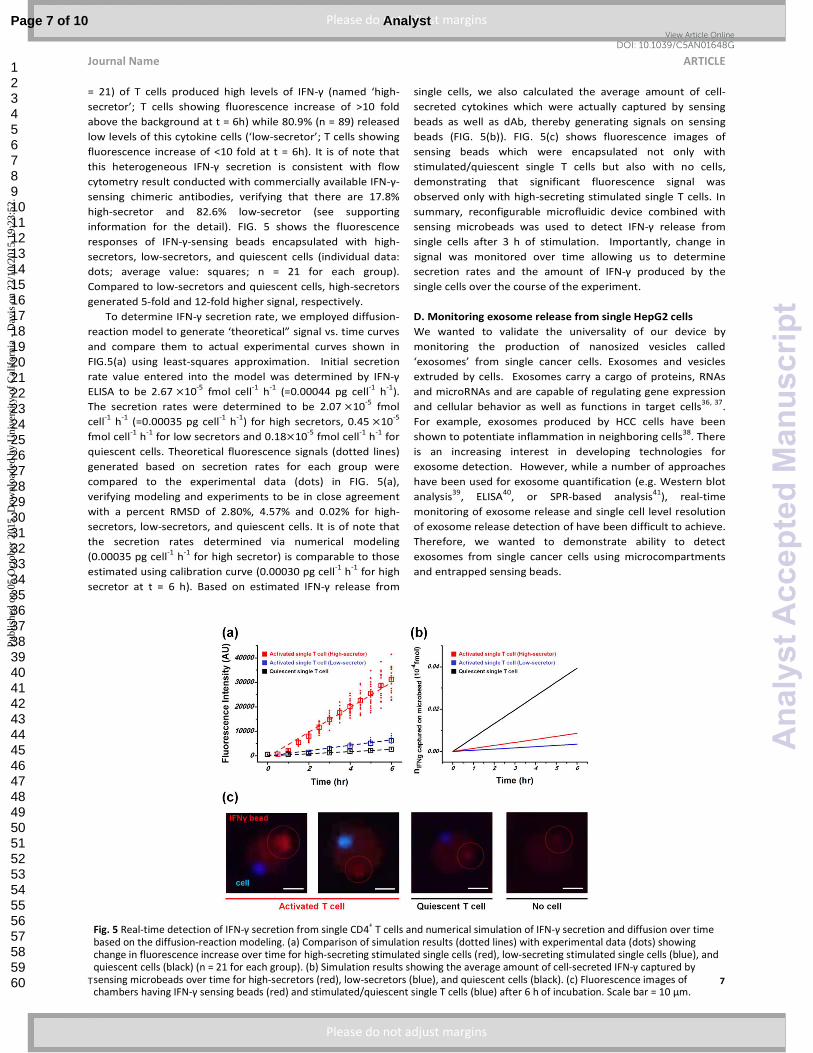
= 21) of T cells produced high levels of IFN-γ (named ‘high-
secretor’; T cells showing fluorescence increase of >10 fold
above the background at t = 6h) while 80.9% (n = 89) released
low levels of this cytokine cells (‘low-secretor’; T cells showing
fluorescence increase of <10 fold at t = 6h). It is of note that
this heterogeneous IFN-γ secretion is consistent with flow
cytometry result conducted with commercially available IFN-γ-
sensing chimeric antibodies, verifying that there are 17.8%
high-secretor and 82.6% low-secretor (see supporting
information for the detail). FIG. 5 shows the fluorescence
responses of IFN-γ-sensing beads encapsulated with high-
secretors, low-secretors, and quiescent cells (individual data:
dots; average value: squares; n = 21 for each group).
Compared to low-secretors and quiescent cells, high-secretors
generated 5-fold and 12-fold higher signal, respectively.
To determine IFN-γ secretion rate, we employed diffusion-
reaction model to generate ‘theoretical” signal vs. time curves
and compare them to actual experimental curves shown in
FIG.5(a) using least-squares approximation. Initial secretion
rate value entered into the model was determined by IFN-γ
ELISA to be 2.67 �10-5
fmol cell-1
h-1
(=0.00044 pg cell-1
h-1
).
The secretion rates were determined to be 2.07 �10-5
fmol
cell-1
h-1
(=0.00035 pg cell-1
h-1
) for high secretors, 0.45 �10-5
fmol cell-1
h-1
for low secretors and 0.18�10-5
fmol cell-1
h-1
for
quiescent cells. Theoretical fluorescence signals (dotted lines)
generated based on secretion rates for each group were
compared to the experimental data (dots) in FIG. 5(a),
verifying modeling and experiments to be in close agreement
with a percent RMSD of 2.80%, 4.57% and 0.02% for high-
secretors, low-secretors, and quiescent cells. It is of note that
the secretion rates determined via numerical modeling
(0.00035 pg cell-1
h-1
for high secretor) is comparable to those
estimated using calibration curve (0.00030 pg cell-1
h-1
for high
secretor at t = 6 h). Based on estimated IFN-γ release from
single cells, we also calculated the average amount of cell-
secreted cytokines which were actually captured by sensing
beads as well as dAb, thereby generating signals on sensing
beads (FIG. 5(b)). FIG. 5(c) shows fluorescence images of
sensing beads which were encapsulated not only with
stimulated/quiescent single T cells but also with no cells,
demonstrating that significant fluorescence signal was
observed only with high-secreting stimulated single T cells. In
summary, reconfigurable microfluidic device combined with
sensing microbeads was used to detect IFN-γ release from
single cells after 3 h of stimulation. Importantly, change in
signal was monitored over time allowing us to determine
secretion rates and the amount of IFN-γ produced by the
single cells over the course of the experiment.
D. Monitoring exosome release from single HepG2 cells
We wanted to validate the universality of our device by
monitoring the production of nanosized vesicles called
‘exosomes’ from single cancer cells. Exosomes and vesicles
extruded by cells. Exosomes carry a cargo of proteins, RNAs
and microRNAs and are capable of regulating gene expression
and cellular behavior as well as functions in target cells36, 37
.
For example, exosomes produced by HCC cells have been
shown to potentiate inflammation in neighboring cells38
. There
is an increasing interest in developing technologies for
exosome detection. However, while a number of approaches
have been used for exosome quantification (e.g. Western blot
analysis39
, ELISA40
, or SPR-based analysis41
), real-time
monitoring of exosome release and single cell level resolution
of exosome release detection of have been difficult to achieve.
Therefore, we wanted to demonstrate ability to detect
exosomes from single cancer cells using microcompartments
and entrapped sensing beads.
Fig. 5 Real-time detection of IFN-γ secretion from single CD4+ T cells and numerical simulation of IFN-γ secretion and diffusion over time
based on the diffusion-reaction modeling. (a) Comparison of simulation results (dotted lines) with experimental data (dots) showing change in fluorescence increase over time for high-secreting stimulated single cells (red), low-secreting stimulated single cells (blue), and quiescent cells (black) (n = 21 for each group). (b) Simulation results showing the average amount of cell-secreted IFN-γ captured by
sensing microbeads over time for high-secretors (red), low-secretors (blue), and quiescent cells (black). (c) Fluorescence images of chambers having IFN-γ sensing beads (red) and stimulated/quiescent single T cells (blue) after 6 h of incubation. Scale bar = 10 μm.
Page 7 of 10 Analyst
123456789101112131415161718192021222324252627282930313233343536373839404142434445464748495051525354555657585960
Ana
lyst
Acc
epte
dM
anus
crip
t
Publ
ishe
d on
05
Oct
ober
201
5. D
ownl
oade
d by
Uni
vers
ity o
f C
alif
orni
a -
Dav
is o
n 22
/10/
2015
19:
23:5
2.
View Article OnlineDOI: 10.1039/C5AN01648G

ARTICLE Journal Name
8 | J. Name., 2012, 00, 1-3 This journal is © The Royal Society of Chemistry 20xx
Please do not adjust margins
Please do not adjust margins
Microbeads were functionalized with Abs against CD63,
one of the most abundant transmembrane proteins found on
exosomes. Microbeads conjugated with biotinylated anti-CD63
cAbs (106 particles mL
-1) were challenged with different
concentrations of exosomal protein content (0 to 60 ng mL-1
)
and 5 μg mL-1
of PE-labelled detection antibodies (dAb) for 3 h.
FIG. 6(a) displays the fluorescence response of exosome-
sensing beads with linear range extending to 60 ng mL-1
(R2 =
0.904) and the LOD of 3.3 ng mL-1
. The capture of exosomes by
beads was visualized using transmission electron microscopy
(TEM). FIG. 6(b) demonstrates presence of exosomes on a
representative microbead after 3h incubation inside a
microcompartment containing single cancer cell.
Furthermore, exosome production of single cancer cells
was monitored over time as shown in FIG. 6(c). As a negative
control, HepG2 cells were treated with 10 μM GW4869, an
agent that inhibits exosome production but does not cause
cytotoxicity in the short term42
. HepG2 cells were captured on
40 μm diameter islands patterned on the floor of the
microfluidic device and then incubated with anti-CD63 cAb-
beads as well as PE-labelled anti-CD63 dAbs for 12 h. FIG. 6(c)
shows change in fluorescence signal due to capture of
exosomes from single HepG2 cells, indicating that exosome
production from single HepG2 cells occurs in heterogeneous
manner. Additional fluorescence images of beads and single
cells were shown in FIG. S6. Importantly, change in
fluorescence did not occur when HepG2 cells were pretreated
with GW4869 (FIG. 6(c)). We estimated the average amount
of cell-secreted exosomes captured on the sensing beads by
comparing the fluorescence signals from cells (FIG. 6(c)) to
those from isolated exosomes (FIG. 6(a)).
Limited information on exosomes, such as molecular
weight, binding site density, association/dissociation constants
hampered modeling of exosome secretion dynamics.
Therefore, we estimated the average quantity of exosomes
secreted by single HepG2 cells over the course of 12 h using
calibration curve. For better fitting, the log-log model was
applied to the calibration curve (R2=0.995). This quantity of
exosomes was based on the protein content and was
estimated to be 0.92±0.29 fg. We previously determined
protein content to vary from 10.4 to 53.4 ng per 107 particles
(data not shown), indicating that the average amount of
exosomes secreted from single HepG2 cells after 12 h was
(0.17 – 0.89)�102 particles.
Conclusions
This paper describes the use of reconfigurable microfluidics
and sensing microbeads for dynamic monitoring of lipid
particles (exosomes) or proteins released from single cells. Ab-
functionalized microbeads were co-entrapped with single cells
inside picoliter scale microcompartments. Fluorescently-
labeled secondary Abs were also present inside the
microcompartments. As secreted cytokines or exosomes
became captured on the microbeads, secondary Abs attached
to the microbeads causing bead fluorescence to increase as a
Fig. 6 Real-time detection of exosome production from single HepG2 cells. (a) Calibration curve with isolated exosomes. Fluorescence intensities of anti-CD63 cAb-beads (10
6 particles mL
-1) after incubating with varying concentrations of isolated exosomes (conc. of
exosomal protein = 0 – 60 ng mL-1
) and PE-labelled anti-CD63 dAb (conc. = 5 μg mL-1
) for 3 hr. The concentration of isolated exosomes was determined by BCA assay. (b) Transmission electron microscopic images of bead (negative control) and bead incubated with isolated exosomes for 3 hr. (c) Time-lapse fluorescent images of anti-CD63 cAb-bead over time for single HepG2 cell encapsulated in chambers
(Scale bar = 20 μm) and fluorescence change over time for single HepG2 cells (red, n = 12) and single GW4869-treated HepG2 cells (blue, n = 7).
Page 8 of 10Analyst
123456789101112131415161718192021222324252627282930313233343536373839404142434445464748495051525354555657585960
Ana
lyst
Acc
epte
dM
anus
crip
t
Publ
ishe
d on
05
Oct
ober
201
5. D
ownl
oade
d by
Uni
vers
ity o
f C
alif
orni
a -
Dav
is o
n 22
/10/
2015
19:
23:5
2.
View Article OnlineDOI: 10.1039/C5AN01648G

Journal Name ARTICLE
This journal is © The Royal Society of Chemistry 20xx J. Name., 2013, 00, 1-3 | 9
Please do not adjust margins
Please do not adjust margins
function of time. We demonstrated utility of this strategy for
the detection of IFN-γ release from single T-cells and exosome
secretion from single cancer cells. In the future, this approach
may be extended to detect multiple cell-secreted signals and
may be combined with cell retrieval to enable function-based
sorting of single cells.
Acknowledgements
Financial support for this work was provided by grants from
the NSF. In addition, we gratefully acknowledge the funding
provided by “Research Investments in Science and Engineering
from UC Davis.”
References
1. R. Zenobi, Science, 2013, 342, 1243259.
2. R. Satija and A. K. Shalek, Trends in immunology, 2014, 35,
219-229.
3. S. J. Altschuler and L. F. Wu, Cell, 2010, 141, 559-563.
4. A. M. Malyguine, S. Strobl, K. Dunham, M. R. Shurin and T.
J. Sayers, Cells, 2012, 1, 111-126.
5. A. J. Torres, A. S. Hill and J. C. Love, Analytical chemistry,
2014, 86, 11562-11569.
6. T. Sun, J. Kovac and J. Voldman, Analytical chemistry,
2014, 86, 977-981.
7. H. Zhu, G. Stybayeva, J. Silangcruz, J. Yan, E. Ramanculov,
S. Dandekar, M. D. George and A. Revzin, Analytical
Chemistry, 2009, 81, 8150-8156.
8. V. Chokkalingam, J. Tel, F. Wimmers, X. Liu, S. Semenov, J.
Thiele, C. G. Figdor and W. T. S. Huck, Lab on a chip, 2013,
13, 4740-4744.
9. D. Di Carlo, L. Y. Wu and L. P. Lee, Lab on a chip, 2006, 6,
1445-1449.
10. E. J. Smith, S. Schulze, S. Kiravittaya, Y. F. Mei, S. Sanchez
and O. G. Schmidt, Nano Lett, 2011, 11, 4037-4042.
11. J. H. Choi, A. O. Ogunniyi, M. D. Du, M. N. Du, M.
Kretschmann, J. Eberhardt and J. C. Love, Biotechnol
Progr, 2010, 26, 888-895.
12. B. D. Plouffe, M. A. Brown, R. K. Iyer, M. Radisic and S. K.
Murthy, Lab on a chip, 2009, 9, 1507-1510.
13. D. S. Shin, J. You, A. Rahimian, T. Vu, C. Siltanen, A.
Ehsanipour, G. Stybayeva, J. Sutcliffe and A. Revzin,
Angew Chem Int Edit, 2014, 53, 8221-8224.
14. K. J. Son, D. S. Shin, T. Kwa, J. You, Y. Gao and A. Revzin,
Lab on a chip, 2015, 15, 637-641.
15. W. S. Yeo, M. N. Yousaf and M. Mrksich, J Am Chem Soc,
2003, 125, 14994-14995.
16. C. Ma, R. Fan, H. Ahmad, Q. Shi, B. Comin-Anduix, T.
Chodon, R. C. Koya, C. C. Liu, G. A. Kwong, C. G. Radu, A.
Ribas and J. R. Heath, Nature medicine, 2011, 17, 738-743.
17. N. Varadarajan, B. Julg, Y. J. Yamanaka, H. B. Chen, A. O.
Ogunniyi, E. McAndrew, L. C. Porter, A. Piechocka-Trocha,
B. J. Hill, D. C. Douek, F. Pereyra, B. D. Walker and J. C.
Love, J Clin Invest, 2011, 121, 4322-4331.
18. Y. Lu, J. J. Chen, L. Y. Mu, Q. Xue, Y. Wu, P. H. Wu, J. Li, A.
O. Vortmeyer, K. Miller-Jensen, D. Wirtz and R. Fan,
Analytical chemistry, 2013, 85, 2548-2556.
19. L. Mazutis, J. Gilbert, W. L. Ung, D. A. Weitz, A. D. Griffiths
and J. A. Heyman, Nat Protoc, 2013, 8, 870-891.
20. T. Konry, A. Golberg and M. Yarmush, Scientific reports,
2013, 3.
21. A. Cattamanchi, R. Smith, K. R. Steingart, J. Z. Metcalfe, A.
Date, C. Coleman, B. J. Marston, L. Huang, P. C. Hopewell
and M. Pai, Jaids-J Acq Imm Def, 2011, 56, 230-238.
22. M. Logozzi, A. De Milito, L. Lugini, M. Borghi, L. Calabro,
M. Spada, M. Perdicchio, M. L. Marino, C. Federici, E. Iessi,
D. Brambilla, G. Venturi, F. Lozupone, M. Santinami, V.
Huber, M. Maio, L. Rivoltini and S. Fais, PloS one, 2009, 4,
e5219.
23. H. W. King, M. Z. Michael and J. M. Gleadle, BMC cancer,
2012, 12, 421.
24. A. Bobrie, M. Colombo, G. Raposo and C. Thery, Traffic,
2011, 12, 1659-1668.
25. G. Raposo and W. Stoorvogel, J Cell Biol, 2013, 200, 373-
383.
26. J. Skog, T. Wurdinger, S. van Rijn, D. H. Meijer, L. Gainche,
M. Sena-Esteves, W. T. Curry, Jr., B. S. Carter, A. M.
Krichevsky and X. O. Breakefield, Nature cell biology,
2008, 10, 1470-1476.
27. W.-h. Liu, L.-n. Ren, X. Wang, T. Wang, N. Zhang, Y. Gao,
H. Luo, N. Navarro-Alvarez and L.-j. Tang, J Cancer Res Clin
Oncol, 2015, DOI: 10.1007/s00432-015-1943-0, 1-12.
28. S. Lemoinne, D. Thabut, C. Housset, R. Moreau, D. Valla,
C. M. Boulanger and P. E. Rautou, Nat Rev Gastro Hepat,
2014, 11.
29. M. A. Unger, H. P. Chou, T. Thorsen, A. Scherer and S. R.
Quake, Science, 2000, 288, 113-116.
30. B. Mosadegh, C. H. Kuo, Y. C. Tung, Y. S. Torisawa, T.
Bersano-Begey, H. Tavana and S. Takayama, Nature
physics, 2010, 6, 433-437.
31. J. M. Street, P. E. Barran, C. L. Mackay, S. Weidt, C.
Balmforth, T. S. Walsh, R. T. A. Chalmers, D. J. Webb and J.
W. Dear, J Transl Med, 2012, 10.
32. J. L. Welton, S. Khanna, P. J. Giles, P. Brennan, I. A. Brewis,
J. Staffurth, M. D. Mason and A. Clayton, Mol Cell
Proteomics, 2010, 9, 1324-1338.
33. G. L. Long and J. D. Winefordner, Analytical chemistry,
1983, 55, A712-&.
34. Y. Gao, Q. Zhou, Z. Matharu, Y. Liu, T. Kwa and A. Revzin,
Biomicrofluidics, 2014, 8, 021501.
35. I. Olsen and L. M. Sollid, J Immunol Methods, 2013, 390,
106-112.
36. H. Valadi, K. Ekstrom, A. Bossios, M. Sjostrand, J. J. Lee
and J. O. Lotvall, Nat Cell Biol, 2007, 9, 654-U672.
37. G. Camussi, M. C. Deregibus, S. Bruno, C. Grange, V.
Fonsato and C. Tetta, Am J Cancer Res, 2011, 1, 98-110.
38. T. Kogure, W. L. Lin, I. K. Yan, C. Braconi and T. Patel,
Hepatology, 2011, 54, 1237-1248.
39. G. van Niel, G. Raposo, C. Candalh, M. Boussac, R.
Hershberg, N. Cerf-Bensussan and M. Heyman,
Gastroenterology, 2001, 121, 337-349.
40. M. Logozzi, A. De Milito, L. Lugini, M. Borghi, L. Calabro,
M. Spada, M. Perdicchio, M. L. Marino, C. Federici, E. Iessi,
D. Brambilla, G. Venturi, F. Lozupone, M. Santinami, V.
Huber, M. Maio, L. Rivoltini and S. Fais, PloS one, 2009, 4.
41. H. Im, H. L. Shao, Y. I. Park, V. M. Peterson, C. M. Castro,
R. Weissleder and H. Lee, Nature biotechnology, 2014, 32,
490-U219.
42. J. Li, K. Liu, Y. Liu, Y. Xu, F. Zhang, H. Yang, J. Liu, T. Pan, J.
Chen, M. Wu, X. Zhou and Z. Yuan, Nature immunology,
2013, 14, 793-803.
Page 9 of 10 Analyst
123456789101112131415161718192021222324252627282930313233343536373839404142434445464748495051525354555657585960
Ana
lyst
Acc
epte
dM
anus
crip
t
Publ
ishe
d on
05
Oct
ober
201
5. D
ownl
oade
d by
Uni
vers
ity o
f C
alif
orni
a -
Dav
is o
n 22
/10/
2015
19:
23:5
2.
View Article OnlineDOI: 10.1039/C5AN01648G

ARTICLE Journal Name
10 | J. Name., 2012, 00, 1-3 This journal is © The Royal Society of Chemistry 20xx
Please do not adjust margins
Please do not adjust margins
Page 10 of 10Analyst
123456789101112131415161718192021222324252627282930313233343536373839404142434445464748495051525354555657585960
Ana
lyst
Acc
epte
dM
anus
crip
t
Publ
ishe
d on
05
Oct
ober
201
5. D
ownl
oade
d by
Uni
vers
ity o
f C
alif
orni
a -
Dav
is o
n 22
/10/
2015
19:
23:5
2.
View Article OnlineDOI: 10.1039/C5AN01648G