Embed Size (px)
Citation preview

ATENEO DE MANILA UNIVERSITY
Graduate School of Business
Rockwell Center, Makati City
A Strategic Management Paper
On
Solutions Incorporated
Submitted to:
Prof. Edgar Juan Surtida III, MBA
STRAMA M09 (SY 2012-2013)
Submitted by:
Anna Theresa B. Yu
MBA Candidate
Submitted on:
August 24, 2013

TABLE OF CONTENTS
LIST OF TABLES ………………………………………………………………............... 4EXECUTIVE SUMMARY ……………………………………………………………….... 61. INTRODUCTION ……………………………………………………………………. .. 82. RESEARCH DESIGN AND METHODOLOGY ……………………………………. 10
2.1. Research Design ……………………………………………………............... 10
2.2. Scope and Limitations ………………………………………………………… 11
3. MACROENVIRONMENTAL ANALYSIS …………………………………………... 123.1. Economic Forces ……………………………………………………… 12
3.2. Political Forces ………………………………………………………… 18
3.3. Social/Cultural Forces ………………………………………………… 20
3.4. Environmental Forces ………………………………………………… 21
3.5. Technological Forces ………………………………………………… 22
4. INDUSTRY, MARKET AND COMPETITOR ANALYSIS ………………………….. 244.1. Value Chain & Waterfall …………………………………………….. 24
4.2. Porter’s 5 Forces Model …………………………………………….. 31
4.3. Strategic Positioning Analysis & Recommendation ……………… 38
4.4. Market Share, Size and Growth Trends …………………………… 41
4.5. Market Analysis ………………………………………………………. 44
4.6. Competitive Profile Matrix (CPM ……………………………………. 58
4.7. External Factor Evaluation (EFE) Matrix …………………………… 82
5. COMPANY ANALYSIS ……………………………………………………………….. 835.1. Company Vision and Mission Statement …………………………… 83
5.2. McKinsey’s 7S Framework …………………………………………… 86
5.3. Company Internal Audit ………………………………………………. 98
5.4. Key Financial Ratio Analysis ………………………………………… 111
5.5. Internal Factor Evaluation (IFE) Matrix ……………………………... 116
6. STRATEGY FORMULATION ………………………………………………………… 1236.1. Strengths, Weaknesses, Opportunities, Threats (SWOT) ……….. 123
6.2. Strategic Positioning & Action Evaluation (SPACE) ………………. 133
6.3. Boston Consulting Group (BCG) Matrix …………………………….. 136
6.4. Grand Strategy Matrix …………………………………………………. 137
6.5. GE McKinsey Model …………………………………………………… 140
6.6. Internal-External (IE) Matrix …………………………………………… 141
2 | Page

6.7. Summary of Strategies ………………………………………………… 142
6.8. Quantitative Strategic Planning Matrix (QSPM) …………………... 142
7. STRATEGIC OBJECTIVES & RECOMMENDED STRATEGIES ………………… 1517.1. Recommended Vision and Mission Statement …………………… 151
7.2. Recommended Strategic Objectives ……………………………….. 154
7.3. Recommended Strategies ……………………………………………. 155
7.4. Recommended Departmental Programs & Actions ………………. 165
7.5. Financial Projections …………………………………………………. 161
8. STRATEGY EVALUATION, MONITORING & CONTROL ……………………….. 1688.1. Strategy Map ………………………………………………………….. 168
8.2. Balance Scorecard …………………………………………………... 170
8.3. Contingency Planning ………………………………………………... 174
9. FINAL REMARKS ……………………………………………………………………… 17510. REFERENCES ………………………………………………….................................. 17611.[10.] APPENDICES ………………………………………………………………………….. 179
11.1.[10.1.] Tables ………………………………………………………….. 179
11.2.[10.2.] Financial Statements …………………………………………. 191
3 | Page

List of Tables and Figures
Tables
Title PageTable 3.1 5-Year Philippine GDP …………………………………………..………. 11Table 3.2 Some Economic Indicators as they relate to the Insurance Industry… 13Table 4.1 Number of Licensed Insurance Brokers from 2007 to 2011 ………… 32Table 4.2 Share and Value of Key Business Lines ……………………………… 49Table 4.3 Pricing Strategies …………………………………………………………. 52Table 4.4 Competitive Profile Matrix ………………………………………………. 75Table 4.5 EFE Matrix of Solutions …………………………………………………. 81Table 5.1 Company Vision Evaluation ……………………………………………… 83Table 5.2 Company Mission Evaluation ……………………………………………. 84Table 5.3 Key Financial Ratios based on Solutions 2012
Financial Statements (Consolidated) …………………………. 107Table 5.4 Solutions Historical Working Capital and Working Capital
Ratio (consolidated) ……………………………………………. 108Table 5.5 Liquidity Ratios of Solutions and Key Competitors ……………………. 110Table 5.6 Activity Ratios of Solutions and Key Competitors ……………………... 111Table 5.7 Leverage ratios of Solutions and Key Competitors ……………………. 112Table 5.8 Profitability Ratios of Solutions and Key Competitors ………………… 113Table 5.9 Year-on-Year Growth of Solutions and Key Competitors …………….. 115Table 5.10 Solutions IFE Matrix Table ………………………………………………. 121Table 6.1 Solutions’ Market Share of Main Business Lines relative to Market Leaders 135Table 6.2 Industry Attractiveness ……………………………………………………. 139Table 6.3 Brand Unit Strength ………………………………………………………. 139Table 6.4 Solutions IE Matrix ………………………………………………………… 140Table 6.5 Solutions: Summary of Strategies ……………………………………… 141Table 6.6-A Quantitative Strategic Planning Matrix (QSPM) – Cohort 1
(Market Penetration Strategies) ………………………………… 142Table 6.6-B Quantitative Strategic Planning Matrix (QSPM) – Cohort 2
(Product Development Strategies 1) …………………………… 144Table 6.6-C Quantitative Strategic Planning Matrix (QSPM) – Cohort 3
(Product Development Strategies 2) …………………………… 146Table 6.6-D Quantitative Strategic Planning Matrix (QSPM) – Cohort 4
(Market development and Horizontal Integration Strategies) .. 148Table 7.1 Target Sales in the next 10 years (in Php Millions) ……………………. 153Table 7.2 Development of a 10-Year Sales Targets……………………………….. 160Table 7.3 Target portfolio mix (in terms of revenue from new business) ………. 161Table 7.4 Target number of events and sales people requirements …………….. 162Table 7.5 Pro-forma Income Statement for years 2014-2018 (in Php Millions) … 163Table 7.6 Pro-forma Balance Sheet for years 2014-2018 (in Php Millions) …….. 164Table 7.7 Pro-forma Cash Flow for years 2014-2018 (in Php Millions) …………. 166Table 10.1 Employment of Major Industry Group, Philippines:
April 2012 and 2013 (in Thousands Except Rates) ……………. 178Table 10.2 Number of employees by Region and Firm Size (2011) .……………. 179Table 10.3 Number of Establishments and Total Employment by Industry
and Employment Size (2011) …………………………………… 180Table 10.4 Affiliations of Top Brokers ……………………………………………….. 181Table 10.5 Portfolio Concentration of Top Brokers ………………………………… 182Table 10.6 Ratio to the whole portfolio per line of main competitors …………….. 182Table 10.7 Total Premiums placed by Insurance Brokers by Line of
Business (in Php Millions) ……………………………………….. 183Table 10.8 Market Growth per Line of Business (based on Total Premiums
Placed by Insurance Brokers)……………………………………. 183Table 10.9 Growth of Commission Income per Line of Business ………………… 184Table 10.10 Average Commission Rate per Line of Business ……………………. 184Table 10.11-A Industry Ranking in terms of Total Premiums Placed (in Php Million) 185Table 10.11-B Total Premiums Placed in EB Lines by Top Brokers (in Php Million) 185
4 | Page

Title Page
Table 10.12-A Industry Ranking and Market Share in terms of Total Premiums Placed 186Table 10.12-B Industry Ranking and Market Share in terms of Total Premiums
Placed (consolidated) ……………………………………………. 186Table 10.12-C Market Share in Terms of Premiums Placed in EB Lines and Ratio
to Portfolio by Top Brokers (in Php Million) ……………………. 187Table 10.13-A Industry Ranking and Annual Growth ……………………………..... 188Table 10.13-B Industry Ranking and Annual Growth (consolidated) …………….. 188Table 10.14 Total Commissions and Average Commission rate of
Top Brokers (in Php Millions) ……………………………………. 189
Figures
Figure 3.1 5-Year Philippine GDP Growth and Inflation rates …………………… 12Figure 3.2 Employment by Major Industry Group, Philippines: April 2013 (partial) 14Figure 3.3 Employment by Region, Philippines: April 2013 (preliminary) ………. 14Figure 3.4 Number of Establishments in the Philippines (MSME, 2011) ………… 15Figure 3.5 Philippine Labor Force by Age Group (April 2012, 2013), in Thousands 19Figure 4.1 Value Chain Map ………………………………………………………….. 23Figure 4.2 Waterfall chart ……………………………………………………………… 23Figure 4.3 Perceptual Map for Insurance Broker Industry (Philippines) …………. 37Figure 4.4-A Market Segments – Small, Medium and Large Enterprises
(SMLEs) by Sector and by Region ………………………………. 45Figure 4.4-B Market Segments – Medium and Large Enterprises (MLEs)
by Sector and by Region ………………………………………… 46Figure 4.4-C Market Segments – Small and Medium Enterprises (SMEs)
by Sector and by Region ………………………………………… 47Figure 4.5 Distribution Channel Map ………………………………………………… 54Figure 5.1 Solutions Organization Chart .……………………………………………. 89Figure 5.2 Account Management Team Dynamics ………………………………… 90Figure 5.3 Solutions Standard Performance Appraisal Program (A Two-Way Approach) 95Figure 5.4 Solutions Organizational Chart during its early years ………………… 100Figure 5.5 Solutions Employees’ Perception on Corporate Culture and
Work Environment …………………………………………………. 102Figure 5.6 Solutions’ Employee Profile in terms of Service years (as of end-2012) 103Figure 5.7 Solutions’ Employees’ Perception on Job Satisfaction ………………… 103Figure 5.8 Sample of Solution’s client’s Testimony on Service Quality …………… 106Figure 6.1 Solutions SPACE Matrix …………………………………………………… 132Figure 6.2 Solutions BCG Matrix …………………………………………………….... 135Figure 6.3 Solutions Grand Strategy Matrix …………………………………………. 138Figure 6.4. Solutions’ GE McKinsey Matrix ………………………………………….. 139
5 | Page

EXECUTIVE SUMMARY
Solutions Incorporated is a local insurance broker with a consulting practice, actually
composed of two legal entities but managed as one. It is a member of Abelica Global, an
international network of actuarial and management consulting firms with offices worldwide. It is
also a member of Regional Network alliances (RNA), a network of independent brokers in Asia.
Solutions’ expertise is human resources and risk management with a focus in employee
benefits. It provides insurance broking services in the areas of Life, Accident and Health,
Property, Casualty and Motor Fleet Insurance. As complement, it also provides consulting
services in the areas of financial planning, actuarial services with a focus on retirement benefits,
and Third Party Administration. It is ranked number 12, 6 and 3 in terms of total premiums
placed in all lines, employee benefit lines and Accident and Health lines, respectively. Ninety
nine percent (99%) of its current client portfolio is insurance placements for corporate life,
accident and health lines and related value-added services.
Due to rising Philippine economy, Solutions is in an industry with a 5-year compounded
annual growth rate (CAGR) of 17%. However, due to strong rivalry in an industry dominated by
global players, conglomerates and bank affiliates, the growth of revenue (commissions and
fees) is not as fast as the premiums placed. In 2011, average commission rate in all lines was
at 10% while the top 2 players were charging 5% commission rate on the average. There is
also a trend to consolidate purchasing decisions globally where global players are well
positioned. Even locally, there is also an increasing trend where cost focused procurement
departments are being made part of the decision making process for insurance placements
even for employee benefits. This has been traditionally handled by the Human Resources and
sometimes Finance Department. There are also quite a number of providers (insurers and
HMOs) in the market. These collective phenomena commoditize insurance products,
strengthening the purchasing power of buyers such that providers are more than willing to
concede on terms and conditions regardless of the intermediary or even directly with the clients.
Innovations on technology opened opportunities for faster delivery of quality service and more
meaningful and accurate information regarding plan use and industry trends.
Solutions has a moderate competitive profile with a score of 2.46. Its major strength is
its strong technical expertise making it easier to negotiate reasonable, rationalized and
competitive offerings with the providers as well as provide clients with in-depth analysis and
6 | Page

professional advice. It can also leverage its reputation in the industry for quality service
especially in terms of assisting clients on their day to day concerns with regards the use and
administration of their insurance plans including database administration and audit of
processes, documents and other paraphernalia related to the administration of the plan. Its
major weakness is its lack of a robust marketing and sales team that could plan and execute
strategic marketing activities to increase brand awareness, create unique service offering
packages, and explore untapped markets not captured by global players, banks and
conglomerates. Because of this internal weakness, Solutions is faced with a large client
portfolio concentration risk with clients composed of a few large multi-national corporations
(MNCs), which are also at risk of being captured by the global players when global consolidation
is eventually imposed by these MNCs.
The CPM score is consistent with Solutons’ EFE and IFE scores of 2.25 and 2.40,
respectively. Solutions’ responsiveness to market opportunities and threats will be highly
dependent on how they will be able to develop their marketing team which could study the
market, segment this properly and design value offerings for these target market while using
their technical strength and mature backroom, which should be backed with the latest
innovations on technology. As relationship is crucial to success in this industry, strategic
alliances and more long-term relationships should be formed. It should be noted that while
market share of Solutions has not been increasing, the firm has continued to be very financially
stable and profitable.
The various strategy formulation tools point to combined market penetration and product
development as most attractive strategies for Solutions. The key element of the recommended
strategies is the strengthening of its internal infrastructure through the development of a strong
integrated IT system with proper IT support for ease of administration, more real-time interaction
with key stakeholders and improvements in servicing quality and time. Additionally for wider
reach of communication, Solutions needs to establish a strong marketing and sales team and
consider re-focusing efforts to providing services to local companies especially SMEs which
should enable Solutions to gain market share and manage a good portfolio mix. Strategic
alliances with providers and clients should also be forged.
With these strategies in place, Solutions is expected to gain momentum, increase its
sales by 15% annually in the next five year with a target revenue of Php 166M by 2018, have
7 | Page

good client portfolio mix with SMEs gaining a portion (around 15% in by end of 5 years) and
continue to be profitable maintaining its target net profit margin of 15% to 20%.
8 | Page

1. INTRODUCTION
The organization that is the subject of this paper is composed of two legal entities –
Solutions, Incorporated – a consulting firm – and Solutions Insurance Brokers, Inc. – an
insurance broker, which are managed as one organization, i.e. both have same set of owners,
corporate officers, and board of directors. For simplicity, the organization is referred to in this
paper as “Solutions” or “the Company” and will be discussed as one, focusing on the insurance
broking services as the main service offering while taking in consideration the consulting
services as value-added services.
Solutions was started with an aspiration to find services that wereis not yet available in
the market. While brokers were just expected to “place” insurance covers for their clients based
on what clients instruct them to do, the owners of the Company envisioned brokers to be more
of consultants rather than just “placersorder takers” of insurance policies. In this basic principle
the Company was founded with two legal entities: the insurance brokerage firm and the
consulting firm complementing it. “The business began with four core lines: insurance broking,
employee benefits and actuarial consulting and risk management. The risk management side of
the business was expected to complement the non-life insurance broking side while the
employee benefits consulting was expected to complement the employee benefits broking.”
(Herrera, 2009)
The Company was incorporated in 1993 and started operations in 1994. The first office
was in a small condominium studio unit in Legaspi village. The only furnitures were a couple of
working desks that also serve as the dining table. One or two computers, a telephone, fax
machine. The first employees were the messenger/driver and an administrator who later was
offered to become one of the owners herself. The founders are called partners but the Company
is a corporation and legally functions as a corporation. On the Company’s first year, three of the
partners worked full-time and one worked part-time. It was selected as health care consultants
of Procter & Gamble, Citibank, Amkor Technology Phils. and EasyCall Communications. By
1997, the Company transferred out of the Makati Central Business District to its current location
at a mixed residential and commercial area in Santiago Village, Makati City. It first rented a
house, which the Company turned into an office. By year 2000, the Company was able to
purchase the rented office. In 2006, the Company purchased the adjacent lot, which paved way
9 | Page

for a major renovation and construction of the current two-story building that now houses more
than 50 employees and a data center of its own.
The firm’s approach is client-centered and results-oriented with a bias in favor of long-
term partnerships. The firm believes that it provides the best service to clients whose strategic
goals and culture the firm understands.
The firm provides insurance broking services in the areas of: Life, Accident & Health –
Corporate, Individual, and Worksite (Salary Deduction) Plans; Property, Casualty and Marine;
and Motor Fleet. Ninety nine percent (99%) of its current client portfolio, however, is currently
on Corporate Life, Accident and Health.
To offer more value to its clients, the Company also provides consulting services in the
areas of: Actuarial Services, Health Care Management, Financial Planning Advice, Employee
Benefits Advice, and Third Party Administration.
Solutions is a member of Abelica Global, an international network of financially and
legally independent consulting and actuarial firms with offices in major cities worldwide. It is
also member of the Regional Network Alliance (RNA), an organization of independent, owner-
managed insurance brokers in the region, providing creative and cost-effective insurance and
risk management solutions across international borders. Representatives are based in China,
Hong Kong, Malaysia, Singapore, Thailand, Indonesia and the Philippines.
Currently, in its 19th year of operations, Solutions has a manpower complement of more
than 50 employees and three managing directors (also the senior consultants of the firm), who
are the remaining three out of four founding partners of the firm. It has invested in its own office
space in Makati and has over 60 corporate clients. It has one office in Metro Manila with no
operations in other parts of the country. Its target market is employers and organizations, which
value their physical and human assets enough to value the professional advice and services
offered to them by the Company.
Solutions has a combined revenue of Php 90M with a net worth of more than Php 44M.
Solutions is one of the top insurance brokers in the industry with strong presence in the
employee benefits lines covering life insurance, accident and health including HMOs. In fact, it
10 | Page
has ranked not lower than top 3 in accident and healthcare insurance in terms of total premiums
for the past three years while ranking 12th based on all lines. It has 2.8% market share in terms
of total premium placed by insurance brokers in all insurance lines, 6% market share in
employee benefit lines (i.e. Life, Accident and Health), and 11% market share in Accident and
Health.
2. RESEARCH DESIGN AND METHODOLOGY
2.1. Research Design
Data used in the external analysis were obtained from various sources. Demographic
analysis of the population, employee force as well as business establishments mostly refers to
the National Statistics Office (NSO), National Statistical Coordination Board (NSCB),
Department of Labor and Employment (DOLE), and Department of Trade and Industry as
sources. Key economic indicators and trends are based on publications NSCB, Bangko Sentral
ng Pilipinas (BSP), National Economic and Development Authority (NEDA) and Asian
Development Bank. General news and current events were sourced from articles released by
ABS-CBN News, Business Mission, Philippine Daily Inquirer, Chinese Business News, Manila
Standard, Manila Bulletin and Philippine Start. International online news publications were also
referred to like Forbes.com and CNN.
Most of the industry data were obtained from the Insurance Commission of the
Philippines annual reports since 2006, official circulars, and special (and more detailed) reports
on broker rankings based on premiums placed and commissions earned. Data was also
obtained from publications of the Philippine Insurers and Reinsurers Association.
Copies of the audited financial statements for years 2009 to 2012 of key competitors
were obtained from the Securities and Exchange Commission. Other key information are
obtained from the IC Annual Reports, websites, and interviews with providers and clients.
Internal data from the Company was obtained with the permission and assistance of the
senior management of the Company. An organization climate survey was conducted by the
author in coordination with the functional HR of the Company. The President, business
development and operations leads were also consulted. Audited financial statements,
11 | Page

employee benefit handbooks, historical documents and several other confidential documents
were referenced as basis of this paper. Other inference made by the author in this paper are
based on the author’s actual observations of the organization and the industry during its course
of employment with the Company.
The 13th Edition of Strategic Management Concepts and Cases by Fred R. David was
used as the primary reference for the strategic formulation tools used in this study.
2.2. Scope and Limitations
Majority of the industry data is based on the annual reports available in the Insurance
Commission. As of this writing, the most recent consolidated report is for the year 2011. It is
also noted that while the insurance broker industry is regulated by the Insurance Commission
and that some data are compiled by the regulator for public use, the compilation is not as
extensive as what the IC has done for the insurance providers. As such, industry averages,
specifically on financials, are just inferred based on the data gathered from the major players
composing at least 40% of the whole industry.
Most of the discussions of this paper, specifically on market segmentation, products and
strategies are limited to the operations affecting the insurance broking arm since majority of the
offerings is coming from this operation. This does not indicate though that such discussions may
not be applicable to the consulting arm. It is assumed in this study that the consulting services
provided by the consulting arm of the Company are used as value-added service for the broking
arm, a business opening opportunity (i.e. foot in the door), as well as for revenue accounting
purposes. Internal data are highly confidential and as such, management of the Company has
requested that discussions regarding this paper are treated as such and that all written copies
are retrieved upon the fulfillment of the author’s academic requirements. All analysis and
conclusion derived by the author of this paper does not in any way represent the Company’s
views unless specifically indicated.
12 | Page

3. MACROENVIRONMENTAL ANALYSIS
3.1. Economic Forces3.1.1. Growth in Gross Domestic Product (GDP)
The global financial instability has been staggering for the last years. The most recent
Eurozone and US economic slowdown leads to cost reduction measures by corporations.
However outlook for the Philippines remains promising.
Table 3.1 5-Year Philippine GDP
2013 2012 2011 2010 2009
GDP Growth 6% (forecast) 6.6% 3.9% 7.6% 1.1%
Source: National Statistics Coordination Board
Asian Development Banks (ADB), in its ADB Outlook 2013 is forecasting that Philippines could
maintain its growth at around 6% for the next 2 years.1 This is still consistent with its long-term
projection of 6% up to 2020 and a little lower at 5.5% from 2021 to 2030.2
Importance: The growth of the industry is primarily dependent on the growth of its
primary providers, which are the insurance companies and HMOs, as well as the growth of
different industries evidenced by the increasing number of establishments and employers. The
growth of these industries should create demand for insurance coverage for the growing
physical and human assets. This poses as an opportunity for the insurance brokers especially
in targeting consulting services and insurance placements for the growing number of
establishments. For as long as there is growth in the GDP, it is expected that the insurance
industry will be able to also maintain its growth. In fact, the insurance broker industry has
outperformed GDP by more than 10% in the past. However, it should be noted that ideally,
there should be a constant need for insurance and healthcare coverage regardless of economic
growth or decline.
1 ADB. 2013. Asian Development Outlook 2013. Manila. retrieved from http://www.adb.org/countries/philippines/economy).2 Asian Development Bank: Long-Term Projections of Asian GDP and Trade, 2011
13 | Page

3.1.2. Inflation rate
Headline inflation is down to 2.8% as of June 2013 from 3.2% in 2012 (refer to Figure
3.1). Long-term forecast by the Bangko Sentral ng Pilipinas (BSP) indicates inflation will be
within three to five percent (3 to 5%) target range.3
Importance: Medical costs, salaries, wages are driven by inflation rate. Generally, as
inflation rate stays flat or decreases, prices are tempered and as such there are more
opportunities for corporations and individuals to release funds for insurance protection.
Specifically, the main service of the Company is in the Accident and Health lines, and
that the commission is usually premium-based. The main driver of the healthcare plan premium
is the medical cost. Medical inflation as tracked by the insurers and Health Maintenance
Organizations (HMOs) ranged from 10% to 15% in the last three to five years. Future
projections stay at around 8% to 10%. Usually, the medical inflation used by the insurance
industry and HMOs has been double to triple the headline inflations rate.
Figure 3.1 5-Year Philippine GDP Growth and Inflation rates (Year-on-Year, all items, 2006=100)4
The Company also uses inflation rate as one of the bases for decisions regarding increases in
salaries,
wages
3 “BSP’s Tetangco expects policy rate to remain unchanged through 2014 Southeast Asia”, Business Mirror, 30 July 2013 retrieved from http://www.businessmirror.com.ph/index.php/en/business/banking-finance/17181-bsp-s-tetangco-expects-policy-rate-to-remain-unchanged-through-2014-southeast-asia on 3 August 2013.
4 Retrieved from http://www.nscb.gov.ph/secstat/d_price.asp on 30 July 2013
14 | Page
2009 2010 2011 2012 20130.0%
1.0%
2.0%
3.0%
4.0%
5.0%
6.0%
7.0%
8.0%
4.1%3.8%
4.6%
3.2%
2.8% (as of June)
1.1%
7.6%
3.9%
6.6%6.0%
(forecast)
Inflation Rate GDP

and benefits, which comprise the major expense by the company, being in a service industry.
Most of the projections on other expenses also uses inflation rate as basis. Additionally, the cost
of insurance (Health insurances in particular) is strongly driven by inflation as well.
3.1.3. Per Capita Expenditure for Life / Non Life Insurance, Life sum insured as %GDP,
Insurance Coverage5
Per capita expenditure on insurance shows how much is spent for life (includes life,
accident and health covered by insurance companies but excluding health premium by HMOs)
or non-life insurance as a percentage of GDP. Per capita expenditure for life insurance cover
has grown from Php 859 to Php 916 from 2007 to 2011 which is a measly 1.6% growth
compounded annually while per capita expenditure for non-life insurance has grown 5.6%
compounded annually during the same period from Php 221.6 in 2007 to 275.1 in 2011.
Regardless, combined premium is only 1.15% of the GDP and 0.87% of the Gross National
Product (GNP) in 2011.
Table 3.2 Some Economic Indicators as they relate to the Insurance Industry
2011 2010 2009 2008 2007
Per capita expenditure (Php)
Life 916.6 752.4 620.8 628.6 859.2
Non-Life 275.1 247.8 224.6 230.9 221.6
Life sum insured as % of GDP 30.80% 25.56% 27.41% 25.99% 26.48%
Life sum insured as % of GNP 23.28% 19.18% 20.65% 20.53% 21.14%
Premiums (Life & Non-Life)
as % of G D P 1.15% 1.04% 1.02% 0.01% 1.44%
as % of G N P 0.87% 0.78% 0.77% 0.01% 1.15%
Estimated Life Insurance Coverage 18.29% 16.09% 13.90% 14.01% 13.63%
Source: http://www.insurance.gov.ph
5 Insurance Commission Report 2011
15 | Page

Importance: This is relevant in order to see the growth of the insurance industry and its
national value. A rising per capita expenditure for insurance indicates the rising demand for
insurance. Since the revenue stream of the firm is premium-based, the future of the enterprise is
dependent on the growth of the insurance industry.
3.1.4. Number of employees nationwide
The DOLE reported that as of April 2013, total employment nationwide is at 37.82M, a
little lower than last year’s 37.84M. As shown in Table 10.1, the decrease is mostly because of
the 5% decrease of employment in agriculture group, which comprise around 31% of the total
employment (11.8M). Industry group (6.1M), which includes mining and quarrying,
manufacturing, electricity, gas, water and construction, posed a 3.8% growth. Services group
(19.9M) posed a 1.9% growth, most of which came from accommodation and food services
activities.
Source: LABSTAT Updates, Vol. 17. No. 10, June 2013, Bureau of Labor and Employment Statistics, Department of Labor and Employment
On a per region report, Region 4-A gets the highest number of employment at 4.7M
(12.5% of total), followed by NCR (12%) then Region 3 at 3.9M (10.4%).
16 | Page
Figure 3.3 Employment by Region, Philippines: April 2013 (preliminary), all figures in Millions except rates
NCR; 4.524; 12%CAR; 0.763; 2%
Region 1; 1.897; 5%
Region 2; 1.538; 4%
Region 3; 3.946; 10%
Region 4-A; 4.719; 12%
Region 4-B; 1.24; 3%Region 5; 2.312; 6%Region 6; 2.939;
8%
Region 7; 2.94; 8%
Region 8; 1.901; 5%
Region 9; 1.399; 4%
Region 10; 1.941; 5%
Region 11; 1.789; 5%
Region 12; 1.701; 4%Caraga; 1.06; 3%ARMM; 1.21; 3%
Figure 3.2 Employment by Major Industry Group, Philippines: April 2013 (partial), all figures in Thousand except rates
Agriculture11,84431%
Industry608316%
Services1989353%

Importance: Knowing the potential market size in terms of number of potential
employees is significant especially in prospecting for insurance placements pertaining to
corporate employee benefits. Data on the specific industries where these employees are and
its geographical spread would be helpful in market segmentation purposes.
3.1.5. Number of establishments
Based on the statistics on the website of Department of Trade and Industries (DTI), as of
2011 count, there are 820,255 business enterprises operating in the Philippines, of which 99.6%
are micro, small, and medium enterprises (MSMEs) and the remaining 0.4% are large
enterprises (over 200 employees). Of the total number of MSMEs, 91% (743,250) are micro
enterprises (below 10 employees), 8.6% (70,222) are small enterprises (10 to 99 employees),
and 0.4% (3,287) are medium enterprises (100 to below 200 employees).
Based on Table 10.2 showing the number of employees per region and firm size, the
biggest employee force is in the National Capital Region with 1.44 Million in MSMEs and 1.3
Million in the Large Enterprises. This is followed by Region 4A (CALABARZON) with around
947 Thousand employees, 53% of which come from the MSMEs.
Figure 3.4 Number of Establishments in the Philippines (MSME, 2011)
Source: NATIONAL STATISTICS OFFICE. Micro Industry and Trade Statistics Department. Small Statistical Sampling and Operations Division Medium. (http://www.dti.gov.ph)
17 | Page
MICRO; 743250; 91%
SMALL; 70222;
9%
MEDIUM; 3287; 0%LARGE; 3496; 0%
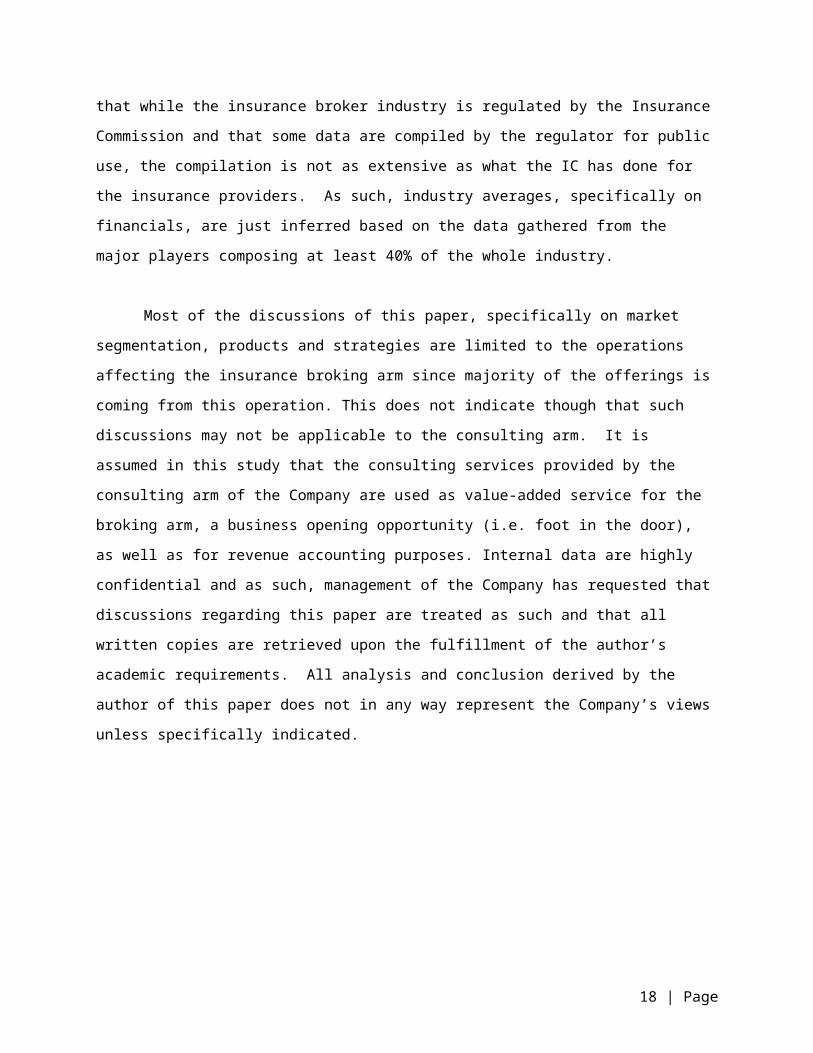
Table 10.3 shows the number of establishments and corresponding employee force by
industry. 47% of establishments is coming from the Wholesale and Retail Trade and Repair of
Motor Vehicles and Motorcycles which employs 23% of total employment (1.49M) and 94% of
these are micro enterprises. Manufacturing comprises 14% of total establishments employing
1.37M of 22% of total employee force. 89% from manufacturing industry are micro enterprises.
Importance: The target market of the industry as a whole are the insurance buying
people, most specifically the corporations which need insurance protection for their physical and
human assets. Knowledge of how big the number of establishments are, and their spread
nationwide is most relevant in decisions concerning distribution strategies, geographical
presence and market segmentation. HMOs and Life insurance companies are estimated to have
covered around 7M beneficiaries for healthcare coverage. This is only around 15% of what
Philhealth is covering for the formal sector alone (which is around 24M by end of 2011)6. This is
indicative of a big opportunity for market penetration.
Specifically for the micro to small industries, while insurers and HMO providers have
already started to develop products to cover, the pricing and terms for these products are still
prohibitive. In life insurance and health care insurance, pricing for groups under 100 heads
would be more like pricing for individual buyers – age-based, limited coverage, stricter
underwriting. As such, penetration in these industries should still be small posing a big
opportunity to the industry. The experience in non-life insurance is similar. Because of the
small size of the micro and small establishments, utilization experience would be more volatile
and thus pricing could be prohibitive. Unless there is serious effort to pool the experience of the
micro to small industries for a more stable pricing, penetration for these groups would still be
low. Moreover, SMEs would need one-stop shops that could cater to all their insurance needs
as they do not have capacity and expertise to deal with and negotiate with a different providers
making the role of an insurance broker more important in this industry.
6 Philippine Health Insurance Corporation Annual Report, 2011
18 | Page

3.2. Political Forces
3.2.1. Expected signing into law of the Revised Insurance Code by 2013
The Insurance Code of the Philippines (ICP) is the bible of the insurance industry. The
current ICP is already 38 years old. The new code (to be signed in August 2013) is expected to
usher the industry to become more globally competitive and globally compliant. One of the
most important provisions with a big impact to the industry is the imposition of a higher
capitalization requirement for insurance companies (i.e. Php 250M in 2013, Php 550M in 2016,
Php 900M in 2019 and Php 1.2B in 2022)7.
The capitalization requirement for insurance brokers was increased requiring new
brokers to have paid-up capitalization and net worth of Php 20 Million while existing brokers
must have net worth of Php 10 Million. For brokers with both insurance and re-insurance
operations, the capitalization requirements are Php 25M for existing brokers and Php 50 Million
for new entrants. Table 3.1 in the next section shows the decline in numbers of the licensed
insurance brokers in the Philippines.
Importance: The imposition of high capitalization requirements to the providers would
pave way to consolidation of the players and in the future, consumers will only deal with big
players. This would affect the bargaining power of suppliers and buyers in the future. With big
players gaining strength, the bargaining power of suppliers would eventually increase.
Consolidation of the insurance brokers would also be expected. This is already
happening as seen in the declining number of licensed insurance broker (in Table 3.1). With
this consolidation, competition will be stronger.
7 Que, Emmanuel R., “Exciting time for Philippine Insurance”, Philippine Insurers and Reinsurers Association, retrieved from http://www.pirainc.org/index.php?option=com_content&view=article&id=170:exciting-time-for-philippine-insurance&catid=54:chairmans-messages&Itemid=239 on 3 August 2013
19 | Page

3.2.2. Retirement Law and Compliance with the Philippines Accounting Standard 19
(PAS 19)
Republic Act 7641 is the law in the Philippines that requires all employers to give
mandatory retirement benefit to all regular employees. Since employers need to comply to this
anyway, there is an incentive for them to formally set up their retirement plans and fund this as
part of their employee benefits package.
PAS 19 is an accounting standard that details the reporting requirement when it comes
to disclosures and recognitions of retirement liability to the firm’s financials.
Importance: The core offering of the consulting business, which complements the
employee benefits positioning of the bigger insurance broking operation, is to provide advice on
the retirement plan establishment, maintenance and valuation which is this law ensures that
there is a need for this certain offering (at least as part of the whole service offering for
employee benefits). Further, there are also opportunities for the insurance brokers to offer
some insurance products to supplement the retirement fund of the employees.
Lastly, compliance requirement ensures the demand for the service pertaining to the
actuarial valuation of retirement plans, which is the complementary service offering under the
employee benefits core competence of Solutions.
3.2.3. BIR’s imposition of RMC No. 16-2013 clarifying the tax implications and
recording of deposits/advances for expenses by Taxpayers
This particular memorandum from BIR imposes an E-VAT on the all receipted payments
of customers including deposits for revolving funds. The only exemption is if the customer a
zero-rated and VAT-exempt (on expenses) enterprise.
Importance: This tax ruling affects the Third Party Administration business of the
Company which involved revolving fund set-up for the client where payment for benefits and
administration fees are charged. With the new ruling, the Company should be able to come up
with an agreement with its customers on how to set up their revolving fund without having to
shell out for more tax expenses than necessary yet still being able to comply with the tax rule.
20 | Page

3.3. Social/Cultural Forces
3.3.1. Managing different generations of the labor force
The most recent labor survey (April 2013) of the Department of Labor and Employment
(DOLE) showed that total labor force already reached 40.9 Million, of which 37.8 Million is
employed. Almost 50% of the labor force are born post 1980s, which some describes as the
Generation Y.
Figure 3.5 Philippine Labor Force by Age Group (April 2012, 2013), in Thousands
Employers are concerned nowadays on how to deal with the Generation Y labor force.
Jonathan De Santos, in his article “Generation Y Not?” published in Chinese Business
Philippines, said that “Generation Y employees no longer subscribe to the old formula of
working at the same company until retirement”.8 This generation is said to be the reason why
employers nowadays spends so much in order to integrate work-life balance into their human
resource and employee benefits program and hopefully get the retention that they wish.
Importance: Since the corporations and employers are the “bulk” buyers of insurance
coverage, usually because they provide employee benefits, the volume of the contract (i.e. total
8 De Santos, Jonathan P., “Generation Y Not”, China Business Philippine, July 2010 retrieved from http://chinabusinessphilippines.com/index.php?option=com_content&view=article&id=897:generation-y-not&catid=1:cover-feature&Itemid=60 on 3 August 2013
21 | Page
2013
2012
0% 10% 20% 30% 40% 50% 60% 70% 80% 90% 100%
15-24 8,952
15-24 9,061
25-34 10,961
25-34 10,747
35-44 8,973
35-44 8,849
45-54 6,843
45-54 6,825
55-64 3,698
55-64 3,657
65 + 1,478
65 + 1,504
contract value) will be based on the number of employees that will be covered by the policy and
the range of the benefits covered by the policy. These would be dependent on how employers
perceive the value of insurance vis-à-vis its employment policies, which would be dependent on
their employee demographic profile. This is also an opportunity for the insurance brokers to
provide professional advice on what is the best package for certain demographic profile and
match this with the current offerings in the market or negotiate packages with providers.
3.3.2. The Filipino “Pakikisama” culture
The Filipinos are known for the values of “malasakit”, “pakikisama” and “utang na loob”.
“Malasakit” is seen as going the extra mile. Filipinos appreciate the extra service provided by its
providers. In “pakikisama” and “utang na loob”, Filipinos appreciate cultivation of deep
relationship that fosters loyalty. As such, a lot of the corporations, when dealing with suppliers,
are usually resistant or slow to change.
Importance: This aspect of the Filipino culture is important in understanding the
significance of the relationships in doing business, most especially in the insurance industry
where business relationships are closely connected to personal relationships. Specifically for
intermediaries like brokers, there is always the advantage of the incumbent unless there is a
strong driver to change the incumbent, usually because of large discrepancy in cost or in value
added service.
3.4. Environmental Forces
3.4.1. Increased awareness of effects of natural calamities and recent epidemics
While investment analysts say that the country’s economic fundamentals are robust and
as such, the Philippines will still be economically viable, the natural calamities brought about
specifically by the typhoons Frank in 2008, Ondoy and Pepeng in 2009, then with Juan in 2010
have had devastating effects in the insurance industry. A lot of claims have been filed.
Recent epidemics (Avian Flu, AH1N1, dengue) as well as increase in lifestyle diseases
and diseases linked to pollution encourages employers to offer more comprehensive life and
health insurance coverage.
22 | Page

Importance: Customers’ increasing awareness of their need order for protection of their
properties against the natural calamities like flood and earthquake creates increasing demand
for comprehensive insurance coverage like fire and car insurance. Trend on increasing lifestyle
diseases and epidemics also creates demand for advice on health and life insurance coverage
most especially as part of an employee benefit package.
Increased awareness of the environment degradation also pushes corporations and
individuals to step back and review how their operations are using up these scarce natural
resources. While there is no legal impediment to electrical and water wastage, for example,
corporations put in operational measures to conserve water and energy through more efficient
shift scheduling, more stringent protocols for use of air conditioning units, etc.
3.5. Technological Forces
3.5.1. Massively online trend
According to George Satell of Forbes.com, a lot of the activities now are going massively
online9. This has invaded politics, educational institutions, and corporations’ operations that the
way of doing things has been re-shaped.
There is an increase reliance on technology when it comes to communication. As such,
clients expect faster turn-around times for feedbacks because of emails, cell phones,
blackberry, etc. For example, service like claim adjudication may already be crashed to three
working days instead of the usual 30 working days because online uploading direct to the
employee’s bank accounts are already possible. It is almost a standard that hotlines are
available 24/7. In PricewaterhouseCopper’s global insurance industry study, it pointed out that
“advances in in software and hardware are transforming ‘big data’ [i.e., real-time data] into
actionable insights” enabling the industry to change its business model from reactive to
preventive.10
9 Satell, Greg. “5 Trends That Will Drive The Future Of Technology”, Fobes.com, 13 March 2013. Retrieved from http://www.forbes.com/sites/gregsatell/2013/03/12/5-trends-that-will-drive-the-future-of-technology/ on 7 August 201310 “PwC Insurance 2020: Turning change into opportunity”, PricewaterhouseCoopers International Limited, January 2012.
23 | Page

Importance: This has to be seriously considered during the review and implementation
of the Company’s marketing and operations. Because of recent technological trends, clients
now are knowledge hungry. The very accessible worldwide web is the first place that the clients
go to when researching about a service provider or even for searching for employees and
employer. As such, web presence is very crucial. A survey done by Jobstreet.com in
September 2011 showed that online job portal is the top preference for job searching followed
by referrals and visiting company web pages.
Specifically for Solutions, there was an increased inquiry on its services from prospective
clients who look for providers through the internet. Online marketing and selling of services
could be considered. Operations should also consider an integrated portal to close the
communication gap with clients and providers and facilitate data sharing. Challenges in
fulfillment of service level agreement should be addressed because of higher expectations due
to technological capabilities.
While the Company would want to use technology as much as possible to ensure almost
real-time service delivery to its clients, the Company should also consider securing its data in
order to protect data confidentiality, including planning the security and redundancy of its data
center and completion of its business continuity plan.
This increased transparency might be seen by some in the industry as the shifting of
power from brokers to consumers because of increased offering visibility. This can be
considered true in retail and even small enterprise use cases were offerings can be generalized
to the general mass market requirements. However, Solutions’ business is essentially dealing
with businesses that require a degree of customization. What is cost effective for one customer
might be too costly for another. A benefit deemed valuable to one company might not be
beneficial to another.
24 | Page

4. INDUSTRY, MARKET AND COMPETITOR ANALYSIS
4.1. Value Chain & Waterfall
Figure 4.1. Value chain map
Figure 4.2 Waterfall chart: value per Php 1 revenue11
4.1.1.
11 Estimates based on financials of insurance brokers covering around 40% of the market.
25 | Page
Plan Administratio
Needs Analysis
Comprise around 40% of gross revenue
Set-up: Market Study, Capability
Inventory and Infrastructure
Building
Total Cost is around 10%.
After-sales Service
Total Cost is around 5%.
Plan Installation /
Total Cost would most probably be around 10%.
Total cost is 10% of gross revenue
Comprise around 5% of gross revenue
MarketingProposal Preparation
Development of Customized Service Offering
Setup
Marketi
ng
Needs
Ana
lysis
Propos
al Prep
aratio
n
Plan/P
rojec
t Insta
llatio
n
Plan A
dmini
strati
on
Compa
ny M
argin
Total
-
0.20
0.40
0.60
0.80
1.00
1.20
.40 0.10
0.05 .10
.05 .10
0.20 1.00

4.1.2. Set-Up: Market Study, Capability Inventory and Infrastructure Building
The core offering of the insurance broker and consultant is the value of the solutions
that it recommends to its clients. These solutions would include the professional advice
coming from the consultants backed by technology. It is essentially a service industry. To give
highly competent advice, consultants are hired and/or developed who are/to be competent
regarding the industry, business lines, risk management, and with skills for high customer
orientation, critical thinking and innovation. Solutions are also constantly adjusted against
changing the market landscape, product innovation and technology. Based on the review of
financial statements of various insurance broking firms, total salaries and benefits alone
constitute around thirty (40) to forty (50) percent of the revenues (of which, 10% - 15% would
usually be coming from for the administrative support).
A study of the market is then done which involves scoping of insurance products
available in the market and prospect engagement for initial needs analysis. Service offering is
packaged. Network is built through accreditation of providers and allied partners to support the
service offerings. Finally, processes and systems (includes new software tools) are put in
place to complete the infrastructure.
4.1.3. Marketing
Marketing activities are planned and implemented to communicate the service offerings to the customers. This could be done through the company’s website, through
corporate events and other promotional activities. The primary purpose of these marketing
activities is to create awareness of the company’s service offerings in the context of customer needs, product availability and ecosystem developments, and build a network
that will be tapped. As such, marketing involves prospect mining and appointment acquisition,
and then eventually, review of service offerings vis-à-vis customer feedback.
Distribution channels are set up. These usually involve internal sales team directly
selling to the customers (individuals or corporations). Branches could be set-up in strategic
areas. E-commerce may be used as a distribution strategy, especially for retail products like
individual motor car insurance, fire insurance, life insurance and the like. Another channel
would be through allied partners which could offer the company’s services to their clients. In
26 | Page
this case, revenue share or referral fees may be paid, depending on the agreement with the
partners.
4.1.4. Development of Customized Service Offering: Needs Analysis and Proposal
Preparation
Data is gathered and processed in order to gain further insight on the gap that needs to
be addressed and customize the service offering. This information will also be used to obtain
costing from the provider. For insurance broking, this is done once a broker appointment is
acquired. There is a substantial degree of customization. This is one of the important values of
insurance brokers and consultants that may not be totally replaced through full automation.
This is where consultants analyze the risks unique to its clients and occasionally use industry
level proxies. Review of the requirements is done taking into account client’s (corporate)
objectives, (business) risk exposures and existing products in the market. This is where
innovative solutions come in – solutions which may not be off-the shelf solutions available in
the market and that needs further negotiation with providers and possibly needing special
customized set-up. This is where brokers differ from agents. Brokers or consultants, should
ideally recommend the best solution – which may not be necessarily through insurance. These
can be other risk management strategies or a combination thereof. Agents, since they
represent the insurance provider, would naturally push the insurance products of the company
they represent.
This is also where the network of the broker and its knowledge of the industry become
valuable as it matches the provider and its solution to the needs of its client. A proposal is
prepared based on the service inclusions including time, effort and resources expected to be
utilized for the project. Under insurance broking, proposal is prepared based on the price, terms
and conditions negotiated with various providers. Recommendation is based on the competitive
analysis, evaluation of the provider capacity and client-provider matching.
4.1.5. After-sales Service: Project Installation and Project Administration
Once the contract is in place, the project is launched. For insurance broking, this
involves actual placement of the policy, review of the policy contract and other related
27 | Page

administration requirements needed to set-up the account like compliance with Anti-Money
Laundering Act (AMLA), set-up of database, enrollment campaign, actual enrollment (if
corporate account), development of information materials, release of IDs, certificates,
orientation of employees for employee benefit plans and release and audit of billing statements.
If necessary, this is when processes and systems may be customized.
After-sales service extends to customer service during the rest of the policy period. This
involves plan administration, going concerns like database management, problem solving,
claims facilitation and monitoring especially for difficult (out of the box) claims, day to day
liaising and audit of the service level agreement (SLA) with providers. Insurance brokers could
leverage its portfolio and personal relationship with providers in order to arrange for better claims settlement, sometimes ex-gratia settlement (i.e. claims not payable by the policy but is
settled for business consideration), longer payment credit term and other special concessions
which may not be approved without the broker’s intervention.
Another value of the broker in after-sales is the regular report/s that it provides its clients
that show analysis of the client’s utilization of its plan (usually for employee benefit accounts
like healthcare, life and motor car fleet). Pertinent analytics are done in order to usage
behaviors and recommendations are done to institute cost control measures or modification of
the plan design, if necessary. This is where technology could prove valuable – technology that
is capable of churning out analytics and technology that is capable of sharing these information
and reports to the clients when they need them.
4.1.6. Key Findings and Insights
4.1.6.1. Set-up
The key elements to the sales of the service in this industry are the talents. The broking
industry is very reliant on the consultants and the most value comes from the advice of these
consultants. Based on interviews with key personnel of the Company, “advice” has been the
value proposition and point of differentiation of Solutions when it was founded as other players
then were just doing insurance placements. However, more and more brokers now are also
positioned as consultants. Solutions hire and develop its account officers and consultants.
28 | Page

There is no formal team in the firm that scouts the market for all the product offerings by
the providers and insurers. In Solutions, this is done ad-hoc by account management teams as
instructed by the business development head.
IT infrastructures are in-housed developed. However, in Solutions, these IT softwares
are all separated with their separate results integrated manually. The data centers as well as
the in-house developed softwares are huge investments by the firm.
Solutions’ provider accreditation process is not yet formal and standardized.
Relevance. The largest investment of the firm is its talents. Next is its IT infrastructure.
As the market (clients, products, providers) grows and matures, there is a need for the firm to
continually update and upgrade its talents and infrastructures.
Most clients are now heavily reliant on technology for communication and sharing of
data. The Company should move towards integration and fully optimization of its IT
infrastructure.
Finally, to be able to give complete advice to the clients, there is a need to be able to
study all the products available in the market. A repository of such information should be
developed and regularly updated. A separate product development team or marketing team
should be established and developed to do this full time.
4.1.6.2. Marketing
The Company’s has little investment in marketing and sales. It does not even have a
formal marketing and sales team to support the marketing plan of the firm unlike its multinational
counterparts like Marsh, Aon and Jardine which have substantial spending on promotions
through sponsorships of local corporate events like (PMAP, BPAP conventions, etc.). These
global players also have strong global and/or regional marketing team that pushes the sales of
its services globally. Institutional collateral business are big revenue stream for brokers with
captured market (e.g. Anchor as subsidiary of San Miguel gets all the San Miguel firms, most
big banks have their own broker firms) . Most local brokers like Solutions rely more on network
29 | Page

through own relationships, network of key investors, referrals of clients or key contact person
transferring to other firms.
Relevance. Just like commodity products, awareness of the broker is one of the keys to
getting prospective clients to consider the firm as a broker. Marsh, Aon and Jardine which
usually set up booths in HR conventions get to inform prospective clients of their existence and
their services. While there is no data as to what are their close rates based on these efforts,
there are anecdotal evidence that accounts are captured through these activities. However, it
should be noted that even with close to zero marketing investment (less than 1% of revenues)
by Solutions, it has acquired accounts through referrals and was able to hold on to its top
position in the EB market. There is a big opportunity to grow if formal marketing plan and efforts
is exerted.
The Company should consider investing in developing a marketing support team which
can do regular market research and analytics to support the business development team.
Another not so expensive strategy is to enhance the Company website. This should aim to give
as much information to prospective clients about the services of the firm, for them to be able ask
and receive proposal as quickly as possible, and to educate them. Partnership with other firms
could be used for below the line marketing strategy like partnership with wellness centers,
clinics, pharmacies and event organizers.
4.1.6.3. Development of Customized Service Offering
Those with consulting practice get ahead most especially those with risk management
and employee benefits consulting offerings like Aon and Marsh. For example, Marsh can hedge
on partial use of Mercer’s industry benchmark survey with regards compensations and benefits
in which companies from different industries pay to join. It also uses this capability to offer free
(but limited) benchmark “surveys” through professional associations like PMAP and BPAP.
Prospect firms nowadays are particular with the competitiveness of the benefits they provide
their labor force which makes these benchmark studies valuable.
Solutions, in particular, has technical capability to process and analyse company data
because of its in-house actuarial team led by a healthcare and retirement expert. Its reputation
is good with the top providers most especially with HMOs and Life insurance providers.
30 | Page

Because of this technical capability, it is able to provide unique solutions, check provider pricing
and negotiate a reasonable, rationalized and sustainable deal for the client.
Relevance. The Company currently has no capability to run industry surveys.
However, it has competence to run benchmark studies using its own portfolio while
supplementing it with surveys from providers. Prospect companies who currently have no
benchmark data may prefer competition with benchmark data. Industry-specific (global and
local) knowledge is crucial in this stage. Large companies, however, usually already participate
in Towers Watson regular survey.
One possible solution to address this gap is to participate and buy industry data, or to
build capability for this. The Company may start with building an analytics team to process all
internal data which are currently decentralized to different account management teams.
This is also an opportunity for the Company as only one other firm has an internal
actuarial team. In fact, it is the only firm with an actuarial team which is actively involved and
tapped in the negotiations for HMO and insurance policies. This should be the selling point
which could be emphasized in the Company’s future marketing efforts.
4.1.6.4. After-Sales Service
Here, companies should strongly build competence which are essential to servicing the
clients like risk management, problem solving capabilities, critical thinking and innovation and
operational efficiency.
The reputation of Solutions in the industry is that it has the best placement and after-
sales service. Not a lot of brokers have backroom operations set-up to efficiently support the
client needs through-out the contract and fulfill SLAs which are above industry standards. This
is where brokers have opportunities to intermingle its operations with its clients’ and create
dependency that would hopefully make it hard for the clients to transfer to competition.
Relevance. This is the stage where aside from advice, speed and accuracy is crucial in
delivering service. It is also noted that the Company’s differentiation has slowly shifted from “the
best advice” to “speed and accuracy”. Right now, the Company is investing on people to ensure
31 | Page

SLAs are met and proper audit of the SLAs is done. This is crucial as “speed and accuracy”
can be addressed with full automation. The Company should already consider fully automating
processes which do not need a lot of judgment call so it can focus on building its expertise
through developing more capable industry experts. The challenge now is how to innovate the
service delivery to address new concerns like paperless transactions, cyber security, and
business continuity, to name a few.
The Company should also consider completion of its standardization of its practice and
processes in order to reduce its ramp up time, when needed.
4.2. Porter’s 5 Forces Model
4.2.1. Industry Definition
The Insurance Code of the Philippines defines an insurance broker as follows:
“Any person who for any compensation, commission or other thing of value acts or aids in any
manner in soliciting, negotiating or procuring the making of any insurance, on behalf of an
insured other than himself, shall be an insurance broker within the intent of this Code, and shall
thereby become liable to all the duties, requirements, liabilities and penalties to which an
insurance broker is subject.” (Insurance Code of the Philippines (ICP), Sec. 301) This means
that insurance brokers are not exclusive “agents” of any provider rather they are intermediaries
that look for the best provider in the market for their clients, i.e. "the broker acts completely
autonomously and represents the interests of its customers"12.
In contrast, an insurance agent works for compensation (also in the form of
commission) through soliciting insurance contracts on behalf of any insurance company. (ICP,
Sec. 300) They are contractually obligated to represent one insurer or to represent several in
the case of a general agency for non-life insurance.
What is common to both (insurance agents and brokers), at least in practice here in
the Philippines, is that while agents and brokers represent opposite parties to the insurance
contract, both get compensation in terms of commission from the insurers and HMO providers
12 Maas, P. (2010). How Insurance Brokers Create Value – A Functional Approach. Risk Management & Insurance Review, 13(1), 1-20
32 | Page

(hereafter called “provider/s”). In addition, as insurance brokers and agents are regulated by
the Insurance Commission (“IC”), there is a code of conduct which may or may not be explicitly
written in the Insurance Code but are highly expected to be upheld by the agents and brokers.
In fact, Section 305 of the Code allows the Insurance Commissioner to suspend or revoke the
license of any agent or broker based on various reasons if he finds that the insurance
broker/agent “has been guilty of fraudulent or dishonest practices”.
Through the years, insurance broking has evolved from just mere negotiating with
providers on behalf of the clients to a more proactive and high-level consulting business as well
as providing many other value-added services, not captured by the original definition of the ICP.
Broker’s compensation have already been flexible such that it can be paid on a fee for service
basis and may not necessarily be included in the traditional pricing of the insurance product
premium anymore.
4.2.2. Rivalry of Competition: Strong
There is decreasing number of competitors. Based on the IC reports, number of licenses
insurance brokers has been decreasing in the last 5 years from 93 in 2007 to 63 in 2011. The
Insurance Commission has set substantial capitalization requirement, raising this to Php 10
Million for existing brokers, forcing those who cannot meet the requirements to downgrade to
agency status or close shop or be bought out by larger players. IC has also set an initial
capitalization requirement of Php 20M paid up capital for new entrants so few new players are
expected. In fact, the industry may see more consolidation or more global players to enter the
local market through acquisition.
The market leaders are either the top global players (Marsh, Aon) or backward
integrated insurance brokers of financial institutions (HSBC, Citicorp, BDO) or conglomerates
(Anchor of San Miguel, Unicon of JG Summit), which have captured market.
The demand for insurance brokers is still on the upside. The average growth in total
premiums place in the last 5 years is 17% (22% in Life, 16% in Non-Life) from Php 18.6 Billion
in 2007 to Php 36.2 Billion in 2011. (IC Report, 2011)
33 | Page

Undercutting commission rates are being done by both big and small players alike.
However, big players have more capacity to undercut commission rates as most of their client
portfolio as global accounts, which are usually jumbo accounts. In 2011, average commission
rate in all lines is 10% while the top 2 players are charging 5% commission rate on the average.
Buyers can switch brokers easily but usually tends to stay with the existing ones unless there is
a compelling reason to shift. However, active global activities compel local firms to comply
should global appointment of broker is done.
Insurance products being sold are not highly differentiated and as such, price
competitiveness plays a big role in the success of the capturing clients. Brokers now
differentiate through their own service offering.
Engagement is based highly on reputation and relationship. Majority of the licensed
brokers are headquartered in Metro Manila.
Table 4.1 Number of Licensed Insurance Brokers from 2007 to 2011
Year 2011 2010 2009 2008 2007
Number of Licensed Insurance Brokers 63 69 75 80 93
(Decrease) -8% -8% -6% -14% -7%
Source: Insurance Commission
4.2.3. Potential for New Entrants: Weak
The insurance industry is highly regulated. Insurance brokers need to apply for an
insurance license from the Insurance Commissioner. The capitalization requirement for
insurance brokers was increased in 2006 as indicated in the circular issued by the Insurance
Commission (IC) in April 24, 2006 (IMC No. 1-2006) requiring new brokers to have paid-up
capitalization and net worth of Php 20 Million. To function as both an insurance and re-
insurance broker, capitalization was increased from Php 25 Million to Php 50 Million. Another
requirement by the IC is that representative by the brokering firm should have at least 10 years
of experience in the industry or it must attend a seminar and pass a licensing exam.
34 | Page

The number of insurance brokers did not increase in the last 6 years. From 100 in 2006,
it is down to 63 in 2011 (IC Reports 2006-2011) which is an average of 9% decrease per year in
total number of licensed brokers. As mentioned in the previous section, those that cannot fulfill
the capitalization requirement are either demoted to agency or general agency status or get
bought out or get liquidated.
In the Philippines, small brokerage firms may compete with larger ones especially if
target market and competence is highly focused and specialized. Brokerage, however, is a
relationship business more than anything else. As such credibility and reputation is slow to
build. Current players leverage on current relationships, networks and sometimes, captured
market.
Moreover, current players (especially the small ones) are focusing more on customer
service, retention, innovation in service and new ways to bring in business, as global players are
very active in increasing its market share through aggressive marketing activities. In pricing,
differentiation would only be on the amount of commission tucked into the premium. Technical
expertise in pricing may also be used as leverage although there are limited number of
brokering firms with this competence.
Commission rates have gone down from double digit 14% on the average for all lines to
10%. For EB lines, this is lower (9%). The top 2 players covering around 32% of market share
is charging 5% commission of total premiums booked, on the average.
4.2.4. Bargaining Power of Suppliers: Moderate
The major suppliers are the insurance companies and the HMOs. As of 11 February
2013, there are 30 licensed life insurance companies, 76 non-life insurance companies and 4
composite (i.e. offering both life and non-life products)13.
HMO providers are less than 20 and still consolidating with the top 3 HMOs covering
around 50% of the market. Ten (10) years ago, there are fewer players that could dictate the
industry pricing. Now, there are small players which could dive prices for the sake of gaining
market share. There are ample choices of providers and that insurance, seen as cost, is slowly
13 www.insurance.gov.ph
35 | Page

being commoditized, especially by large companies. With this phenomenon, providers are more
willing to negotiate policy terms, conditions and pricing with or without a broker, sometimes even
unmindful of who the broker is.
In the Philippines, HMOs and Life insurance companies usually hire actuaries to head
their pricing team. Pricing model is usually actuarially developed, usually based on utilization.
As such, providers usually have little lee-way to deviate from the pricing model. For Non-Life
insurance companies, a lot of the products are already tariff-based as imposed by the Philippine
Insurers and Reinsurers Association (PIRA) making the non-life market more conducive for
reciprocal business. For non-tariffed products, pricing is more arbitrary although portfolio
experience may still be a reference. Non-Life insurance companies are not yet required to hire
casualty actuaries to help them do the pricing of their products.
Brokers usually maintain relationship with the providers. Providers, in return, provide
incentives like awarding of top brokers, special trips abroad, etc. In healthcare, brokers may
“compete” with HMOs and insurers by providing Third Party administration service.
There is currently increased activity of provider direct sales force. Based on interviews
with key personnel of two major providers, number of accounts by the direct sales are a little
higher than the brokers but in terms of volume (in terms of premium), the total from brokers is
higher indicating the bigger size of accounts brought in by insurance brokers. Moreover, since
brokers are supposed to be “neutral” in terms of loyalty to any provider, this makes the
bargaining power of broker strong, in terms of leveraging its portfolio with the providers.
As this business is highly dependent on the use of technology to improve the servicing
accuracy and turnaround time to improve customer perception, IT service providers are also a
major supplier to the business. These service providers provide the key technology solutions
and ensure their availability and performance to ensure that the brokers meet their customer
KRA/KPIs. Switching cost is usually high because training of IT staff and other user of the
systems is high for acquiring new systems.
4.2.5.
36 | Page

4.2.6. Bargaining Power of Buyers: Moderate
There are many buyers in the insurance broking industry. In the Philippines, large
customers of insurance brokers are corporations, and other special groups like NGOs,
cooperatives, home owners association etc. There are also many individual clients but these,
most probably would be coming from high net worth individuals especially for buyers of
individual life and property insurance.
There is current trend of consolidating activities of global and multinational firms which is
a threat to local players as local counterparts of the global firms (client) would normally comply,
i.e. they would appoint the local partner of the global broker regardless of value offering. Large
corporations also usually leverage their size (i.e. premium volume) to get premium discounts.
There is increasing trend for procurement department being part of the decision making
insurance placement even for employee benefits, when in the past, only are only decided by the
Human Resources and sometimes Finance Department.
While large corporations have strong bargaining power, smaller ones have no such
volume that they can use as bargaining leverage. As such, smaller corporations would still rely
on insurance brokers to negotiate for them and use the broker’s expertise to recommend to
them solutions that could address their risk management and/or employee benefits concerns.
However, regardless of size of the establishment, while the clients can always acquire
insurance policies from insurers and HMOs directly, the brokers use their expertise and
provider network to negotiate and acquire proposals from different providers and compare the
packages and combinations thereof that would be the best fit to their customers. Brokers with
technical expertise may even do their own pricing of the plan/product that could validate the
basis and assumptions of the proposed price of the providers and use this as point of
negotiation. Customers may also need other services like recommendation of solutions that
may not necessarily need insurance, and after-sales support by the brokers, which they may
not be able to get by directly dealing with providers like review of contract/policy, assistance in
interpretation of the contract provisions from an “impartial” consultant, negotiating difficult claims
and audit of provider SLAs, amongst any others.
37 | Page

Lastly, switching cost is usually low as initial engagement is usually free of fees and the
fees of insurance brokers are usually premium-based, i.e. commissions are released after the
premium is paid as a percentage of the premium. Overall, the bargaining power of the buyers is
assessed as moderate.
4.2.7. Potential for Substitutes: Moderate
Alternatives to getting an insurance broker is to directly engage the providers or go
through their insurance agents. For individual buyers, going through an insurance agent is
practical since agents can give more personalized service in terms of account handling
(products are not personalized since this should be off-the rack products) for the volume of
servicing requirement of an individual buyer. For corporate buyers, where service requirements
are resource-heavy, agents would not be a real threat.
Meanwhile, insurance companies and HMO are also building their own direct sales
people. When insurers and providers are technology-enabled, going direct will be made
convenient. This is specifically true for mass consumers buying off-the rack products like motor
car insurance, fire insurance and the like. There will be more transparency, e.g. during claim
settlement, real-time monitoring of claim could be made possible. However, for corporate
buyers, servicing requirements go beyond transaction services that automation may not be able
to address like customer-specific solutions, personalized service, negotiations and mostly
technical advice. Integration of multi-line solutions may not also be available if dealing with just
one provider, which may be done by the broker.
Based on IC, total premiums placed by the brokers comprised only of around 34% of
the total market in 2011. This means that the rest, about two-thirds, are either direct or placed
by agents.
The value of going through a broker is that clients (buyers) may have access to different
insurers or providers through them. The brokers have the expertise to conduct a thorough
review of the comparison of the providers and the merits of each plan and/or solution.
38 | Page

4.3. Strategic Positioning Analysis & Recommendation
Most meaningful strategic group is the mix of captured market and strength in Employee
Benefits (EB) lines. A perceptual map for the Insurance Broker Industry is shown in the Figure
4.3
Figure 4.3: Perceptual Map for Insurance Broker Industry (Philippines)
The x-axis shows the strength of the firms in placing insurance coverage pertaining to
employee benefits as evidenced by a mix of its market share and client portfolio concentration.
Weak means the firm’s core competency does not include EB lines. Very strong means they are
the top of mind firms when you ask corporations and providers about who they know as brokers
39 | Page

for HMO, Life and Accident. EB advice is the core competency of Solutions. Just as the
primary insurance market is mainly segregated by the type of insurance they are selling, it is
also possible that brokers concentrate in a few types of product lines to sell depending on their
resources. As such, it is meaningful to look at a strategic group using the mix of just a group of
lines (e.g. EB only or non-EB only) and captured market. It should be noted that EB market is
Solution’s strength and original positioning.
The y-axis indicates the captured market through affiliations. This indicates to the size of
the market acquired by the firms mainly because of their affiliations. Low means the firm has no
captured market such that marketing and selling efforts are crucial to gain market share. High
position means that the firm has a captured market, usually because of vertical integration
strategy of mother firms. Trickle down to local market due to global/regional appointments is
also considered as captured market, in this positioning. Captured market is the main value of
being affiliated with a global or regional network. Specifically for global players with operations
in the Philippines like Marsh and Aon, headquarters primarily initiates marketing and selling
efforts. In addition, industry figures show that local institutional relationships also gain market
share like what banks did with their backward integration strategy (i.e. putting up an insurance
broking to sell bancassurance products and capture their clients). Some big conglomerates
also follow the same strategy like San Miguel with Anchor Insurance Brokers and JG Summit
with Unicon Insurance. Table 10.4 shows the list of top brokers (in terms of premiums placed)
in the Philippines and their affiliations.
Using the captured market - strength in EB variable mix, Solutions is strategically
positioned in the strategic group along with Gotuaco Del Rosario and Lacson who are local
firms and with concentration lies in selling EB Lines and along with global players like Jardine
and Howden (Accette) whose captured market because of its global affiliations is not as strong.
Table 10.5 shows portfolio mix of the main competitors in terms of premiums placed.
The advantages of such positioning are:
1) Focus on resources. Training the staff to be competent in all lines of business
would entail resources. While the basic insurance elements are the same for all lines, the
business model, selling techniques and relationship investment are different. They have
40 | Page

different markets too. In order to capture all lines and be strong in all of them, usually, different
lines are handled by separate departments. Solutions is currently not structured for this.
2) Provider relationship. There are 76 non-life insurers, 30 life insurers, 4 composite
life/non-life and around 30 HMO providers. Dealing with all of them needs more diverse
expertise, and as such more resources especially people. Strategic partnership with a selected
few would be beneficial to the Company. Continuous market study on provider offerings, and
capabilities as well as continuous dialogue with providers is needed to ensure that wide array of
products are introduced to the clients that would fit their requirements.
3) Client relationship focus. Naturally, EB lines are handled by the Human Resources
department who is the buyer. For Non-EB, these are usually handled by purchasing or finance.
Although there is a growing trend right now that even EB lines go through purchasing, it is still
the HR department, which is the decision makers, sometimes with a concurrent approval of
Finance which handles the enterprise’s budget. Focusing in building relationships with the HR
contacts is strategic. There are a lot of networking venues where brokers may be exposed to
HR people like People Management Association of the Philippines (PMAP), HR Philippines and
Business Processing Association of the Philippines, which are among the big and known ones.
One of the weaknesses of this positioning is the lack of capability of the firms to
maximize its client potential once they only concentrate with one side of the business. It is
intuitively logical for a client to integrate suppliers for ease of negotiation. Volume of business
would give them leverage. As such, having wide offering of services would be strategic in this
sense. Another disadvantage is the threat of losing business to strong provider of other lines,
which is related to maximizing client potential. If client is dealing with several brokers handling
different lines in the company, it is natural for the stronger broker to outbid the other in order to
get the other lines. Non-EB lines usually are handled by the finance department, which also
handles the purse and who usually has a strong influence in the decision making of the
company. It would be a strategic move if brokers could cultivate strong relationship with both
the Finance and HR, and if necessary the Purchasing head of a firm.
Recommendation: Over the medium to long term, it would be strategic for Solutions to
do the following:
41 | Page

1) Beef up the development of its Non-EB team more specifically on the high level placements
that requires risk management advice. It could start with capturing that business from its
current client pool to maximize the profitability of its clients.
2) Create a targeted marketing plan to penetrate the local industries: specifically large and medium enterprises, and if sales team is large enough, it could penetrate the small
industries.
3) Consider strengthening its regional network and maybe even tap a global network that
would provide a possible pool of captured market through global appointments in order to
protect its multinational clients (MNCs) and capture other MNCs when opportunity arises.
4) Develop and strengthen partnerships with allied partners that could offer related valued
services to clients. Allied partners could be wellness centers, dentals networks,
pharmaceutical companies, pharmacies, or car shop networks. Solutions should be able to
come up with a mutually beneficial partnership that is cost effective. This strategy could
also help in making the Company’s marketing efforts cast a wider net in terms of geography
and industry reach using the partner’s collaborative marketing activities.
5) Consider e-commerce as a distribution strategy. Develop an online site where costumers
may interact by providing the information needed for proposal generation. Solutions could
create a “consumer” product together with a partner provider (to underwrite), which could be
sold easily on-line. Consumers could compare products features and prices online. With
this, the firm could take advantage of the electronic channels, mostly through social media.
The target market for this strategy are individual buyers, micro and small enterprises.
4.4. Market Share, Size and Growth Trends
According to IC Report 2011, insurance brokers placed a total of Php 36.2 Billion (15.6B
from EB and 20.6B from Non-EB) in premiums which account for around 34% of the total
market premiums. This is not inclusive of the premiums booked by direct sales and agents with
the HMOs. HMOs are currently not regulated although there are discussions of putting them
under the Insurance Commission like the rest of the life and non-life insurers. This makes the
34% overstated as premiums reported by insurance brokers include premium placed with HMOs
while the IC have no such similar report coming from the HMOs. Table 10.7 shows the total
premiums place by line of business.
42 | Page

Table 10.8 shows the market growth in terms of premium place by insurance brokers in
2007 until 2011 based on IC reports during this period. The table shows that the industry is
growing in double digits in the last 5 years (13% in 2007, 23% in 2008, 37% in 2010 and 25% in
2011) except in 2009 where it shrunk by 9%. Average growth in years 2007 to 2011 is 18% p.a.
(33% A&H; 22% in EB; 16% in NEB) with a five (5) – year compounded annual growth rate of
17% (22% A&H; 20% in EB; 15% in NEB).
While the total premium volume is growing in double digits, the growth in commission
income (i.e. main revenue stream for insurance brokers) is slower. Growth in total commissions
is 11% on the average for the last 5 years. It is declining in the last 3 years (14%, 12%, 11% for
years 2009-2011). Table 10.9 shows the growth in total commission income per line of
business. In 2011, total premiums grew by 25% but commission income only grew by 11%.
During the same year, total premium for EB lines grew by 43% (57% for Life, 33% for A&H) but
corresponding commission income only grew by 9% (23% for Life, 0% for A&H). Total
premiums for NEB lines, on the other hand, grew by 14% in 2011 while commissions grew 13%
during the same year.
Total commission in 2011 is Php 3.7 Billion for a total premium placement of Php 36.2
Billion or an average of 11% commission rate as shown in Table 10.10. Commission rates have
decreased for most lines. For EB lines, it has decreased from 14% (Life – 18%, A&H – 13%) on
the average in 2009 to 9% in 2011 (Life – 9%, A&H – 9%). For Non-EB lines, commission rates
also decreased on the average from 13% in 2009 to 11% in 2011.
Solutions has declined in rankings in terms of total premiums placed from number 6 in
2007 down to number 12 in 2011. Top 3 are Marsh Philippines, HSBC Insurance Brokers and
AON Philippines. All other firms in top 10 in 2011 are either global players, affiliates of banks or
conglomerates or have strong institutional ties like Gotuaco del Rosario as noted in Table
10.11-A. The fastest growth came from HSBC Insurance brokers, which is ranked below top 10
in 2009 to Number 3 in 2010 and number 2 in 2011.
The five (5)-year compounded annual growth rate (CAGR) of whole market for EB lines
is 20% as of 2011. Top 1 and 2 (Marsh and HSBC) have 5-year CAGR of 49% and 99.5%,
respectively as shown in Table 11-B.
43 | Page

There are 69 licensed insurance brokers in 2011, and as such market share is expected
to be spread thinly among all the players. Market leaders Marsh and HSBC Insurance Brokers
are the only firms that breached the 10% level with markets shares 19% and 12%, respectively
as shown in Table 10.12-A.
The industry is consolidating. Market share of the market leaders is growing and gaining
market share. Market share of the top 3 grew from 25% in 2007 to 41% in 2011; Top 5 from
50% to 56%; Top 10 from 65% to 75% while total of all firms ranked below 10 shrunk from 35%
to 25% as shown in Table 10.12-B. Even globally, consolidation is happening as Marsh &
Mclennan just finished its largest purchase in 2012 of Alexander Forbes in South Africa.14
Consolidation is more apparent in EB lines as top 2 players, Marsh and HSBC, get 18%
and 29% market share respectively. The rest have market share below 10% as shown in Table
10.12-C.
The top players are experiencing double digit growth (in terms of premiums placed)
while smaller players have decreasing growth, which are mostly lower than the total market
growth. The 5-year compounded annual growth rate of the market is 17% as of 2011 while
Solutions’ is slower 7.7%, the reason that it lost market share. Gotuaco, a key competitor has
grown 14.1% (5-yr CAGR), still lower than market although in 2011 it has grown by 30% while
market’s growth is at 25% as shown in Table 10.13-A. In 2011 alone, the growth of Top
3/5/10/below 10 are 32%/38%/33%/7% as shown in Table 10.13-B.
The average commission rate of top 2 market leaders with total market share of 32% is
5% undercutting the rest of the market which averages 12.5%. Average of total market is 12%.
On the average, commission rates dropped from 14% in 2007 down to10% in 2011 with. Total
commission income has a 5-year CAGR of 10.9% as of 2011 as shown in Table 10.14.
Relevance:
The measly 34% share of insurance brokers in total premium of the insurance industry
shows there are still opportunities for brokers to get a larger share of the market. This also
points to scale as opportunities are available due to growth. Solutions must be able to respond
14 Top Global Insurance Brokers. (2013). Best's Review, 114(3), 42-45.
44 | Page

to this opportunity and should be poised to scale as promptly as it can. The Company may
need to review partnerships and alliances and review potential Mergers & Acquisitions (M&A)
opportunities.
Consolidation of market players and double-digit growth of bigger players is a sign that
scale (in terms of technology and internal processes) is necessary to continue to grow. The
larger brokers are in a position to handle these potentially large accounts particularly in the BPO
space. This emphasizes the scale requirements.
Industry growth is mostly driven by the growth of the employee benefits lines, which are
very dependent on the employment situation of the country as well as the growing need of the
corporation to put importance on employee benefit packages due to competition on hiring and
retention of employees.
The continuing reduction in commission rates reflects the need to align with customer
expectations with respect to premiums particularly for non-EB (that does not require too much
servicing). The firm must review its cost structure to ensure it can still be profitable in this new
regime. This also reflects that deals are now larger in value and therefore customers expect to
pay a low percentage in premium but still payout a substantial payment because of their size.
As such, scalability of operations is crucial.
4.5. Market Analysis
4.5.1. Market Segments
One of the ways to segment the market for insurance brokers, whose target market are
mostly corporations and employers, is to break down the establishment population based on its
size in terms of employee base then further break this down to its industry group and by its
geographic location.
Referring back to Figure 3.4 and Tables 2 and 3, micro enterprises comprise 91% of the
total establishments while the rest are shared by small, medium and large enterprises (SMLEs).
Of the 77 thousand SMLEs, 28% is from Wholesale and Retail Trade including Repair of
45 | Page

Motorcycles and Motor Vehicles, 16% is form manufacturing, 15% from Accommodation and
Food Services and the rest are less than 10% each. In terms of geography, 43% of the SMLEs
are in NCR, 12% in Region 4-A, 9% in Region VII and 30% in the rest of the regions.
Figure 4.4-B and 4.4-C show the breakdown by sector and by region of MLEs and
SMEs, respectively. MLEs numbering to 2,448 are comprised of 28% Manufacturing, 14%
Wholesale and Retail Trade, 14% Administrative and Support Services (where BPOs are
grouped), 8% Education and 36% Other sectors. Geographically, 46% of MLEs are located in
NCR, 16% in Region 4-A, 9% in Region VII, 7% in Region III, 5% in Davao Region and 18%
scattered in the rest of the regions. SMEs numbering to 17,900 are comprised of 29%
Wholesale and Retail Trade, 16% Accommodation, 15% Manufacturing, 9% Education, 7%
Financial and Insurance Activities and 24% from the rest of the sectors. Geographically, 43% of
the SMEs are in NCR, 11% in Region 4-A, 9% in Region III, 7% in Region VII, 5% in Region VI,
5% in Davao Region and 20% in the rest of the regions.
SMEs – All eyes are on the growth of the SMEs which comprise 9% of the total
establishments in the country and employ around 2.1M, which is 33% of the total employed
population. The SMEs are vulnerable of losing employees to large companies, with a more
well-benchmarked compensation and benefits package. This will be aggravated by the
upcoming regional market integration. While SMEs would want to give a better package, they
would need information and advice on how to do this. In terms of negotiation with the providers,
they cannot leverage on their size to negotiate better and sustainable rates. Also because of
their size, their utilization experience would mostly be volatile year on year because of the small
size of the premiums that they would pay their providers.
46 | Page

Figure 4.4-A. Market Segments – Small, Medium and Large Enterprises (SMLEs) by Sector and by Region
47 | Page
Micro; 743250; 91%
Small; 70222; 9%
Medium;
3287; 0%
Large; 3496; 0%
Wholesale and Retail Trade;
Repair of Motor Vehicles and Motorcycles
2187228%
Manufacturing1195216%
Accommodation and Food Service Activities
1151815%
Education68569%
Financial and Insurance Activ-
ities53077%
Others1950025%
SML per sector
SML per region
- 5,000
10,000 15,000
20,000 25,000
30,000 35,000
40,000

Figure 4.4-B. Market Segments – Medium and Large Enterprises by Sector and by Region
48 | Page
Manufacturing192328%
Wholesale and Re-tail
Trade;
Re-pair of
Mo-tor Ve-hi-
cles and Mo-tor-cy-cles95214%
Administrative and Support Service Activities
93114%
Ed-uca-tion5298%
Others244836%
-
500
1,000
1,500
2,000
2,500
3,000
3,500

Figure 4.4-C. Market Segments – Small and Medium Enterprises (SMEs) by Sector and by Region
49 | Page
Wholesale and Retail Trade;
Repair of Motor Vehicles and Motorcycles
2147729%
Accommodation and Food Ser-vice Activities
1143316%
Manufacturing1092815%
Education66289%
Financial and Insurance Activi-
ties51437%
Others1790024%
-
5,000
10,000
15,000
20,000
25,000
30,000
35,000

Business Process Outsourcing (BPOs) – The fast emergence of the BPOs in the
Philippines helped boost the employment sector. This is part of the Administrative and Support
sector seen in previous graphs. According to World Bank, the BPO industry grew by 18% in
revenue in 2012 (USD 18 Billion) and provided about 800,000 direct jobs and over 3 million
indirect jobs.15 The outlook of IT & Business Process Association of the Philippines (IBPAP) is
that the industry will sustain its growth at an average rate of 15% per annum that will generate
1.5M new jobs by 201616. In employee-benefits, healthcare and life insurance is part of the
hiring package and applicants are already sophisticated enough to demand for such coverages.
Manufacturing – The growth of manufacturing in the Philippines has accelerated to
5.4% in 2012 mostly coming from strong demand for food, wearing apparel and tobacco
products (World Bank, 2013). According to Philippines Economic Zone Authority (PEZA)
Promotions and Public Relations Group Manager Elmer H. San Jose, the growth in PEZA
investments during the first five months of 2013 is primary driven by the electronics sector
coming from Japan.17 Growth in infrastructure developments between Clark Freeport (CFZ)
and Subic Bay Freeport Zone (SBPZ) opens up more opportunities for investment in
manufacturing18.
Growth is faster for labor-intensive manufacturing. For labor-intensive group,
compensation may be of more value to the employees over employee benefits except if the
benefit is positioned to be immediately visible like . In healthcare, cost may be differentiated
when geographical location is considered.
Accommodation and Food Services – Based on the 2010 Annual Survey of Philippine
Business and Industry, 79.1% (11,815) of the total establishments under accommodation and
food services come from restaurants and mobile food services activities, which accounts for
15 World Bank: Philippine Economic Update – Accelerating Reforms to Meet the Jobs Challenge, May 2013, retrieved from http://www.worldbank.org/content/dam/Worldbank/document/EAP/Philippines/Philippine_Economic_Update_May2013.pdf on 3 August 201216 “The Philippines: Better business process outsourcing” retrieved from http://www.bpap.org/media-room/214-the-phil-better-business-process-outsourcing on 20 July 2013.17 Philippine Business Report, “PEZA Investments rise 89.7%”, July 2013, Vol. 24 No. 07, Department of Trade and Industry Philippines.18 Lowe, Aya, “PH Manufacturing industry on the mend”, 23 April 2013, Rappler Beta retrieved from http://www.rappler.com/business/industries/27294-ph-manufacturing-industry-on-the-mend on 31 July 2013
50 | Page

74.4% (215,033) of total employees under this sector. However, the same subsector has the
lowest revenue to cost ratio of Php 1.32 :Php 1 while average for the industry is Php 1.35. 19
Other Trends. Global firms are slowly consolidating its processes, mostly with global
purchasing. Even for local industries, even employee benefits are now commoditized such that
healthcare and insurance coverage are placed through procurement.
Relevance to the Company: Solutions, being a local company would be well
positioned to target the local industries, specially the small and medium enterprises, and maybe
some local large ones. Solutions could use its current membership with a regional and global
network as a branding strategy in terms of the scope and depth of advice it can provide its
clientele.
While the businesses are essentially fragmented, there are efforts to unite them as
several associations are organized to capture common and best practices, experiences and
sentiments of a specific sector or subsector and gain more insights on how the sector or
subsector would move forward and be competitive. With proper resource allocation and
capability building, Solutions should be able to approach the specific target sectors through
these associations (e.g. SEIPI, BPAP, etc.). For micro and small enterprises, Solutions could
consider approaching several providers to support an insurance package that would cover
Solution’s portfolio as a whole while Solutions enroll these enterprises as part of the portfolio.
This could be done per industry or per general location.
4.5.2. Key Products and Services
Table 4.2. Share and Value of Key Business Lines
Business Line Value (in terms of Premiums*), % ShareLife Insurance (EB) Php 6.86B , 19%Accident and Health (EB) Php 8.76B, 24%Motor Vehicle (NEB) Php 3.066B, 8%Fire (NEB) Php 7.742B, 21%Third Party Administration (TPA) -consolidated data not available-
*Premiums based on 2011 figures as reported by the Insurance Commission
19 National Statistics Office, Special Release No. 2013-02 retrieved from http://www.census.gov.ph/old/data/sectordata/aspbi10new_sectitx.html on 9 August 2013
51 | Page

Life Insurance. The five (5)-year Compounded Annual Growth Rate as of 2011 for this
line is 18%. For corporate accounts, the increase in premium is dependent mostly on increases
in benefits or salaries. A large part of the market though is coming from individuals and
bancassurance clients as evidenced by the big market share of brokers with bank affiliations
(i.e. total market share of BDO, Citicorp and HSBC Brokers combined is 86%).
Relevance to the Company: The life insurance line may not be the target product to push
except as an extension service for corporate clients that the firm is handling. While servicing is
easy, the rates are also low and as such, there is little to maneuver in terms of commission.
The margins are higher but volume is needed in order to become profitable.
Accident and Health Insurance. The five-year CAGR as of 2011 for this line is 22% for
this line. This could mean two things: 1) more employees and individuals are getting accident
and healthcare coverage, or 2) price for accident and healthcare insurance is increasing fast. It
is safe to conclude that most of the premium is coming from HMO and health insurance or
corporation as part of their employee benefits. As corporations grow and more corporations are
set up, the market for this product will grow with it.
Relevance to the Company: As this is the core service offering of the firm, it is important
that the market for this product is captured and/or exploited by the firm. It should be noted
though that while the market for this product grew by 33% in 2011 and 22% CAGR in the last 5
years, Solutions have only grown the line by 22% in 2011 and with 5-year CAGR of 8% as of
that year.
Motor Vehicle Insurance. The five-year CAGR as of 2011 is 11% for this line. There
was a decrease in 2009 which may have been the effect of Ondoy but it is growing in double
digits ever since. The top three brokers with highest market share shares around 50% of the
market. The broker with highest market share is BDO insurance broker, which is probably due
to its captured market from car loans offered by its affiliate bank. Market for this product will
continue to grow as expanding middle class encourages the growth of the automobile industry.
Relevance to the Company: There is only one broker with affiliate bank in the top three.
This means that a great majority of the motor car insurance policies are still being place by
independent brokers or directly procured (in case of BPI M/S for BPI car loan clients). The firm
52 | Page

may be able to capture some market share if it pushes a group motor car insurance policy with
preferential rates to its current clients.
Fire Insurance. CAGR in the last 5 years is 17%. There was also a decrease in 2009,
which is also the effect of Ondoy but it has grown 61% in 2010 (right after Ondoy) and 29% in
2011. Typhoon and Flood coverage have the biggest loss in terms of claims. After Ondoy and
Pepeng, medium- to large- sized companies started to purchase property insurance. The IC is
currently proposing mandatory fire insurance for SMEs as requirement for business permit. In
addition, rising construction activities in the real estate will also drive the sales for property
insurance including fire insurance.
Relevance to the Company. Rising number of construction projects for condominium
units and townhouses opens a huge opportunity for selling fire insurance that covers contents
only to “renters” and owners of these units. This can also be packaged as group insurance with
preferential rates and sold to employees of corporations and to corporations that provides in-
house home financing assistance to their employees.
Third Party Administration. There is a growing trend of enterprises shifting from
insured plan to self-insured plan most especially in healthcare in terms of financing the plan.
The Third Party Administrator will be paid an administration fee to administer the fund and
claims of the members. Based on informal interviews with key personnel of two major HMOs in
the country, TPA as a form of financing is growing based on the growth of their TPA accounts.
There are also companies that supplements HMO and health insurance plans for their
employees with coverage for outpatient medicines, maternity benefits or other top-up benefits
that are not covered by the HMOs and insurers, and which needs Third Party administrators.
With the advent of “paperless” transactions, there is also a trend that claims settlement can be
directly credited to member’s bank accounts.
Relevance to the Company. For brokers, administration fee charged in placing TPA
accounts with providers have typically lower returns with almost the same service requirements.
If this is the trend in the market, the firm needs to review its revenue and cost model.
The firm may offer TPA services for these types of requirement as it has already developed an
IT software and processes to support the service offering. It can develop partnerships with
53 | Page

banks in order to address the paperless transaction requirements of the clients. Partnerships
with other allied providers like clinics and drugstores may also be considered to enhance the
value-added benefit of being a Third Party Administrator. These partnerships may also be used
to push the service to the market.
4.5.3. Competitor’s Pricing Strategies
Pricing of the insurance products are mostly based on the risk of the interest insured,
and these are determined by the insurers (life or non-life) and HMOs. For none-life products,
most of the basic products have either minimum rates imposed by the Insurance Commission or
tariffed rates agreed with the PIRA. For life products, basic pricing model is pre-approved also
by the IC. HMO rates are more flexible with its pricing model. Negotiated prices by brokers
would theoretically just vary depending on the commission that the broker is charging on top of
the premium. In practice, aside from the commission assumption, pricing could vary based on
the ability of the broker to negotiate the price of the plan. Some brokers have technical
capability to argue the basis of the pricing as well as the pricing model itself.
Table 4.3 Pricing Strategies
Competitor Pricing Strategy Price
All Lines EB NEB
Market Average (based on 2011): 10% 9% 11%
Gotuaco Commission rates are generally lower than market average
9% 8% 10%
Lacson Commission rate for EB generally lower (most probably because it has its own TPA offering)
11% 8% 15%
Howden Commission rate generally higher than market 13% 10% 17%
Jardine* Commission rate higher than market 11% 11% 11%
Marsh* Lower commission rates for jumbo accounts (goes for volume)Consulting fee instead of commissionsNet of commissions (global settlement)
5% 6% 5%
Aon* Lower commission rates for jumbo accounts(AON can go lower than 5% for big accounts in EB.)
9% 13% 7%
*For benchmark
54 | Page

The standard practice is for commissions to be computed as a percentage of the basic
premiums. Variations to this practice would be to impute a fix commission per head or per
account in the pricing of the plan. Premiums paid by the customers already include the
commissions of the brokers, which is paid by the insurer or HMO providers when the policy is
paid. Some may require payment of consulting or service fees directly to them by the
customers while waiving the commissions on the premium.
Relevance to the Company: Market average commission rate is 10% to 15% for EB
lines and higher for non-EB lines. At 5%, the Company needs to scale its operations and find
operational efficiency in order to sustain the profitability of the enterprise. The Company may
also consider a fee-based revenue model (in contrast with commission-based model) to add
flexibility to the pricing of its service offerings.
4.5.4. Distribution Channels
The industry standard it to push the service offerings directly to the market through its
own sales force, and most of these have presence in just one geographical area, i.e. Metro
Manila. There are players which have already branched out to key cities in the country like
Cebu, Davao and Bacolod. Global players also have global or regional sales team that does
the selling in the global or regional headquarter level. When the business is closed in that level,
the local partners will only do placement and after-sales.
Another channel is to sell its services through the web. There are “commodity” products
like motor car insurance, travel insurance, and the like in which pricing considerations may
already be automated and can be easily sold via e-commerce. HSBC Insurance Brokers are
doing this now through the HSBC portal. The target market for this distribution channel is
usually individual buyers or small enterprises. The advantage of using this channel is its
geographical reach and lean sales personnel requirements. The disadvantage is its lack of
personal touch and as such, after-sales customer service support should still be in place for the
customers to talk to when needed. “Commodity” insurance products are usually sold by
insurance agents.
55 | Page

Figure 4.5 Distribution Channel Map
Another channel that the industry may consider is to push its products through its allied
partners, if available. For example, a partner multi-specialty clinic could sell some off-the rack
products of the company to its clients. Currently, this is not yet done in the market.
It is also important to note it is market practice that employee benefit lines and non-
employee benefit lines are sold by separate teams. As already mentioned in previous sections
of this paper, the technical expertise and relationship/network requirements for these lines are
different, and as such, most companies have separate teams doing different lines.
Relevance to the Company: Currently, all of Solutions’ sales are coming from direct
sales from its own business development team. In fact, Solutions does not have formal sales
personnel whose only job is to sell. The business development team also wears an account
management hat which has direct involvement with the administration of account during the
whole policy period. With the market growth possibilities and the way the market is re-shaping,
the Company should consider investing in a real sales team to do the selling and separate the
sales job from the fulfillment job. Solutions could also consider branching out to other cities
which are currently growing either through putting up a sales representative office or through
merger and acquisition of broker firms with presence in these areas.
56 | Page
E-Commerce
Own Sales People
Allied PartnersDirect
Consultants / Insurance Broker
Regional / Global Sales

Solutions should also consider enhancing its website to provision for e-commerce. This
channel would be apt for the Company’s mass marketing products that are in-house developed.
Furthermore, it would still be advantageous for Solutions to continue its practice of
managing client per account regardless of the lines. Selling may be initiated by any consultant
regardless of specialty in collaboration with practice leaders for such lines. This would make
cross-selling efficient.
4.5.5. Marketing and Promotions
Generally, insurance brokers rely on the sales though strong personal and institutional
relationships with clients, usually the key decision makers in corporations and other enterprises.
Insurance brokers connected to banks and conglomerates rely on placements made for their
own captured market. Brokers connected to conglomerates like Anchor (San Miguel) and
Unicon (JG Summit Group) do not need external marketing and promotions. Brokers connected
to banks use the infrastructure of their parent company to sell insurance products to the bank’s
clients. Most of the marketing efforts are targeted to corporations, which bring in volume
business and which usually need the value-added services of the brokers in terms of advice,
scope or range of provider connection and after-sales service.
Gotuaco. Most of the marketing and selling efforts are made through meeting prospects
face to face leveraging on the business relationships of its patriarch Ambassador Albert Del
Rosario (Metro Pacific Group). In the past, Gotuaco launched a TVC in youtube casting
children who role played a group of business people discussing what an insurance broker does.
GRA also launched its Purple Cow product for SMEs and created a standalone website for this.
Lacson. Similar to Gotuaco, marketing and selling efforts are for face to face meeting
with prospects. Additional promotions are made through their accredited hospital, clinics and
dental network as well as car shops. It has used social media by putting up a facebook page
where it posts their services and company events. Amongst the key competitors, Lacson has
the most robust website in terms of content. It even has a facility to gather data for key products
(motor car and fire insurance) which enables them to release a proposal within 24 hours.
57 | Page

Howden. Formerly Accette and recently bought by the Howden Group based in UK,
Howden is poised to ramp up its operations in the Philippines through massive global and
regional marketing and sales efforts similar to what other strong global players like Marsh and
Aon do. Locally, the Zuellig group still owns the vast a substantial minority stake inof the
company, the network of which still provides most of the revenue stream for Howden.
Jardine / Marsh / Aon. Most of the global players have invested in more “mass
marketing” strategy like sponsorship in major corporate events like PMAP / BPAP and SEIP
conventions. Here they set-up booth where they can collect prospective clients’ contact details,
do some promotional advice. They also have expanded their sales branches outside Metro
Manila and now have presence in Cebu and Davao.
Marsh uses its Mercer connection to co-sponsor seminars that discuss industry trends
targeted to corporations. Marsh/Mercer has partnered with P&A Grant Thornton in these
endeavors. Globally, Marsh has twitter account that releases industry news.
Relevance. Currently, Solutions has not done any formal marketing campaign to push
its service offerings to the market. In fact, Solutions does not even have a sales team. For the
longest time, it has just dependent on referrals and key contacts calling in for assistance when
they transfer employers. In the past, it has organized seminars that discuss trends on Human
Resources like setting up of flexible benefit plans and retirement plans.
The Company need to take into consideration geographical presence as corporations
with dispersed sites would want that their suppliers would have presence where most of their
sites are located for easier servicing.
In order to compete with the big player like Marsh and Aon in the same market space
(i.e. large multinational corporationMultinational Corporations), Solutions needs to have stronger
global alliance. However, Solutions may also consider leaving that market space to the global
players and concentrate marketing and promotion efforts to target local medium to large-sized
firms. These are the firms which need not comply with the directions/mandate from global
headquarters. As such, Solutions should beef up promotional activities in order to re-introduce
itself to the public and create brand awareness. There is value to strategic partnership with
training and event organizers that target local companies in their corporate seminars and
58 | Page

workshops. These activities could be used to mine prospects and do some below the line
marketing activities like targeted email blasts, mail and post cards and flyering.
Some local advertising and media coverage may be done. As the company is nearing its
20th anniversary in 2014, it may be apt time to start releasing press releases about the company
during contract signing with clients, and other corporate event leading to the anniversary.
The Company should also consider enhancing its website capacity for e-commerce
where it can push its mass marketing products.
4.6. Competitive Profile Matrix (CPM)
4.6.1. Key Competitors
The three main competitors of Solutions are Gotuaco del Rosario Insurance Brokers,
Inc., Lacson and Lacson Insurance Brokers, Inc. and Howden Philippines (formerly Accette
Insurance Brokers, Inc.). These three are in the strategic group determined by the strength of
the firm in Employee Benefits line as well as the presence of a captured market due to the firms’
affiliation. Gotuaco and Lacson are both local, similar to Solutions. Accette was then part of a
regional player until it was bought by the Howden group in 2011. For benchmark purposes, the
CPM analysis also shows the ratings of the other (global) players which are currently strong in
EB lines as well. In actual experience, the global players are the usual direct competitors of
Solutions during bidding for clients.
4.6.1.1. Gotuaco Del Rosario Insurance Brokers, Inc. (Gotuaco)
Market Share, in terms of total premiums placed
(Total Premiums / Total Commissions):
Rank 7 in terms of Premiums placed
3.9% all lines (Php 1.41 B / Php 123 M)
5.2% EB lines (Php 0.819 B / Php 65 M)
2.9% NEB Lines (Php 0.591 B / Php 59 M)
7.6% A&H (Php 0.761 B / Php 60 M)
59 | Page

Like Solutions, GRA is a local insurance broker. It is a member of several global
network of brokers (Assurex Global, Globex International) and global employee benefits
consulting network (International Benefits Network). It is the only local insurance broker, which
is not part of a local conglomerate, and which is in the top 10 (in terms of market share). It is
also known that through the business connections of its founder and president, Ambassador
Albert del Rosauro, that they were able to acquire a lot of their current big clients including
PLDT, SMART, and Meralco.
4.6.1.2. Lacson & Lacson Insurance Brokers, Inc.
Market Share, in terms of total premiums placed
(Total Premiums / Total Commissions):
• Rank 17 in terms of premiums placed
• 1.3% all lines (Php 0.478 B / Php 52 M)
• 1.7% EB lines (Php 0.27 B / Php 21 M)
• 1% NEB Lines (Php 0.21 B / Php 31 M)
• 3% A&H (Php 0.263B / Php 20 M)
Lacson and Lacson is also local insurance broker which has been in the industry for 40
years. It is a member of a global network of brokers, Worldwide Brokers Network. It has
developed its own network of Hospitals and Clinics to support its Third Party Administration
offering. It has also developed its own network of accredited car shops in order to support its
car insurance package. It is well capitalized at Php 50 Million, one of the highest in the industry.
It also has a re-insurance license.
4.6.1.3. Howden Insurance and Reinsurance Brokers (Phils.), Inc.
Market Share, in terms of total premiums placed
(Total Premiums / Total Commissions):
• Rank 15 in terms of premiums placed
• 1.6% all lines (Php 0.56 B / Php 74 M)
• 1.9% EB lines (Php 0.30 B / Php 30 M)
• 1.3% NEB Lines (Php 0.27 B / Php 44 M)
• 2.7% A&H (Php 0.236 B / Php 20 M)
60 | Page

Howden was formerly the Singapore-based broker Accette Insurance, which is part of
the Zuellig Group. Accette was bought by Hyperion Insurance in 2011 as part of its growth
strategy and to push Howden broking (its insurance broking arm) to become of Asia Pacific’s
leading insurance broker. As a local player, Howden has been in top 10 brokers of the major
HMOs in the Philippines. HMO premiums is more than 50% of the A&H portfolio. It
differentiates itself through its IT-based service management. It provides self-insurance solution
supported by Howden Technology Services.
4.6.1.4. Other players (for benchmarking purposes)
a) JLT Philippines
Market Share, in terms of total premiums placed
(Total Premiums / Total Commissions):
• Rank 10 in terms of premiums placed
• 3.5% all lines (Php 1.27 B / Php 142 M)
• 3.3% EB lines (Php 0.51 B / Php 57 M)
• 3.7% NEB Lines (Php 0.756 B / Php 85 M)
• 5.5% A&H (Php 0.48 B / Php 53 M)
Jardine Lloyd Thompson is also a global broker, ranked top 7 globally. Locally,
JLT offers insurance and reinsurance broking. Like Solutions, it has also positioned
itself as “consultants” and thus offer risk and claims management advice. In the past,
JLT has been visible as corporate sponsor in HR events like PMAP and HR Philippines
convention. It has also been consistently awarded as top broker of major HMO and
insurance companies in the Philippines.
b) Marsh Philippines
Market Share, in terms of total premiums placed
(Total Premiums / Total Commissions):
• Rank 1 in terms of premiums placed
• 19% all lines (Php 6.938 B / Php 359 M)
• 18% EB lines (Php 2.775 B / Php 159 M)
• 20% NEB Lines (Php 4.193 B / Php 200 M)
• 30.5% A&H (Php 2.666 B / Php 145 M)
61 | Page

Marsh Philippines is number 1 broker with largest market share not only in all
lines but specifically in the employee benefit lines (i.e. life, accident and health) which is
the main service offering of Solutions. In addition, Marsh is top global broker which in
the past has acquired accounts through global appointment. It has taken over several
multinational and big accounts of Solutions through global appointments. Because of its
size, it has the capacity to undercut commissions in order to provide prospects and
clients with lower cost.
c) Aon Insurance and Reinsurance Brokers, Inc.
Market Share, in terms of total premiums placed
(Total Premiums / Total Commissions):
• Rank 3 in terms of premiums placed
• 9% all lines (Php 3.273 B / Php 306 M)
• 8% EB lines (Php 1.274 B / Php 161 M)
• 10% NEB Lines (Php 2.000 B / Php 145 M)
• 13.1% A&H (Php 1.143 B / Php 140 M)
Just like Marsh, Aon Philippines is top 3 broker and also part of a top global
broker that in the past has acquired accounts through global appointment. It is also
capable of undercutting its commission structure in order to protect and acquire
corporate accounts. It has currently acquired a multinational firm account from Solutions
through global appointment.
4.6.2. Critical Success Factors (CSF)
CSF #1: Strength of International Corporate relationship / NetworkImportance Weight: 5%
This refers to the strength of the network globally and its influence to local decision
making.
Global network is very important for global players like Aon, Marsh and Jardine where
global firms with large physical and human assets are captured through international/global
appointments. For local firms looking for insurance advisers or brokers, the advantage of
62 | Page

having a global broker is more on the perceived “reputation” because they are global. Of course,
there is value to having access to global practice that could be used and customized locally.
For local brokers with global firms as clients, the challenge is how to retain the local
appointment in the face of the threat of global appointment. However, if the value proposition
and service differentiation is strong and compelling, it would help build a case for the local
partners to use to defend against the global mandate. While the volume of premiums that is
usually attributed to global firms is high, for local brokers like Solutions, it would matter more if
efforts are concentrated in pushing the services to the local firms which have no bias towards
brokers without strong international network although going with an international “brand” could
be a bonus.
CSF #2: Strength of Local institutional relationship including reciprocal businessImportance Weight: 13%
This refers to formal connections and business relationships to organizations and
institutions.
As insurance brokerage is mainly a relationship business, it is important that a broker
firm establish formal business relationships with organizations that will eventually become loyal
clients mainly because of these connections. Reciprocal businesses usually are strong bonds
that are rarely broken unless there is a compelling reason to do otherwise. This is important in
retaining and acquiring corporate clients, which have big impact in the premiums because of
volume.
CSF #3: Strength of Local personal relationshipImportance Weight: 10%
This refers to relationships with key contacts, which may be decision makers or
influencers in the purchase of insurance policies.
Personal relationships with key contacts like HR, finance and even the executive
positions like CEOs or director are also crucial to client acquisition. These key contacts may
appoint the broker of their choice whenever they transfer firms. This is also a key factor, most
especially for local brokers like Solutions. The impact may not be as strong as an institutional
63 | Page

relationship as corporations tend to stay with the current broker unless there is a compelling
reason to do otherwise but this is key in growing the network base. At least for Solutions, strong
personal network has brought in more than 90% of its current revenues.
CSF #4: Marketing and Sales Team Geographical Reach including presence in different industriesImportance Weight: 15%
This refers to extent of which the marketing and sales activities reach the target market
geographically. This factor is assigned one of the highest weights because the growth
possibilities of the current market are large and there is a large untapped market (i.e. SMEs) just
because nobody seek them out and sell the services to them.
There are more than 60 brokers in the market. The top ones have either captive market
or have strong global connections. For local players, in order to compete and get a sizable
market share, there has to be active marketing activities all throughout its lifetime in order to
expand its network. A strong sales forces which are doing field work, visiting prospects and
planting seeds for long-term relationships is crucial to client acquisition.
In addition, while most of the local industries are still in the National Capital Region, key
cities in the country are also booming and may need expert advice from consultants with
regards management of their risk and employee benefits.
CSF #5: Track Record and Reputation Importance Weight: 10%
This refers to historical experience of the clients of the service and technical advice
rendered by the firm. This is also an indication of the Company’s brand equity and strength.
Consulting and Insurance broking are mainly service selling. The product being sold is
offered by the primary insurance or HMO provider. Reputation in this industry is based on
consistent delivery of quality service through professional (and usually technical) advice given
and assistance in the day to day administrations of the policy or project.
64 | Page

In corporate purchasing, it is rule of thumb that there should be at least three proposals
being compared and considered. As there are currently more than 60 brokers in the
Philippines, a broker firm or consultant with a strong brand recall should be able to get that one
slot in the comparative matrix. Being the top-of-mind advisor is important for initial engagement.
However, track record may be important to large firms but not as important to smaller ones.
CSF #6: Price competitivenessImportance Weight: 15%
This refers to the cost usually negotiated by the broker firms for their clients or cost of
the consulting project.
As insurance policies are mainly a cost component of a business enterprise, cost is one
of the most crucial factors in closing an account. The importance of this factor is highlighted
even more as corporations integrate all purchasing activities to their procurement team, the
main key performance indicator of which is usually to acquire products and services at lowest
cost and at best quality. This is crucial as commissions (revenue for the brokers) or consulting
fees are taken into account when pricing an insurance offering or project.
CSF #7: Service & Capabilities – Technical AdviceImportance Weight: 12%
Insurance, which is a risk management tool, involves policies and contracts that are very
technical. The consultants giving advice should be technically competent on how to package
the coverage in order meet the needs of its clients. Technical expertise is also needed in
interpreting the provisions of the policy. Technical expertise should be a core competency of a
consultant. In the past, this could have earned a higher weight as technical advice could be
used as a differentiation point. However, a lot of the players already claim that they too can
offer valuable advice to the client. The challenge now to the client is to determine how good
(quality – relevance, local applicability, practicability, long-term effect) the advice they will be
getting from their brokers.
65 | Page

CSF #8: Service & Capabilities – Range of ServicesImportance Weight: 10%
This refers to the richness of the offerings that can be done the broker firm. There are
non-life or non-EB lines under which, policies for motor car, fire, fidelity and surety, engineering,
marine insurance and a lot more are sold. Life or EB lines cover life, accident and health.
There are a lot of insurance lines which can be sold in the market. These can be sold to
institutions or individuals. While the basic insurance principles apply to all lines, provisions,
technicalities, even claims handling as well as selling strategies differ depending on the line.
Some brokers offer limited products while some offer the whole spectrum of insurance products
as well as other auxiliary services like Third Party Administration, Risk Management and
Employee benefits consulting and many other specialized consulting services. The range of
products or services offered can be a strength of a broker although depending on the strategy,
niche marketing may also work.
CSF #9: Service & Capabilities – Transaction Competence, Innovation and Information TechnologyImportance Weight: 10%
This refers to how the broker handles day to day transactions like enrollment of
members, inquiries, claims, etc. This includes innovation on the processes and information
technology used to support the processes.
Apart from the initial market study and insurance placement, bulk of servicing in
insurance broking is done after the sale is made, i.e. day to day maintenance of the account.
Especially under employee benefits, members are enrolled and disenrolled each time there are
changes in hiring and/or life changes in the members status. In property insurance, property
database should be updated each time upgrades or new insurable item is purchased. Claims
processing including settlement should be handled efficiently. The broker firm should be
competent in handling these transactions and innovation mostly in the use of information
technology is crucial in achieving efficiency in these operations.
66 | Page

4.6.3. Solutions’ Critical Success Factor Ratings
CSF #1: Strength of International Corporate relationship / Network (1)Solutions is part of two networks: Abelica global which covers employee benefits and
Regional Network Alliance (RNA) which is a network of independent brokers in the Southeast
Asian Region. The reach of Abelica is global while RNA is regional. Abelica is known in the US
as Milliman, which is strong in its EB practice, which is aligned to Solutions’ strength.
Membership to this network is used by Solutions as a branding strategy more than a selling
strategy. However, the current trend for most global firms right now is to consolidate decisions
on the headquarters level, which shifts the importance of a global network from branding to
selling.
CSF #2: Strength of Local institutional relationship including reciprocal business (1)Solutions do not have strong institutional relationships although one of the directors is
now a director in PMAP, one of the largest associations of HR in the Philippines. However, it is
yet to be seen whether this particular relationship would enhance the firm’s client portfolio.
CSF #3: Strength of Local personal relationship (3)Solutions rely more on personal networks in acquiring clients since the firm does not
have a strong institutional relationship nor it acquired accounts through global referrals and/or
appointments. Most of the accounts acquired are through key contacts who transfer firms and
bring Solutions with them as their insurance broker or through personal connections. So far, the
strength of its local personal relationships has sustained the business even without a formal
sales force. The rate is 3 because the local personal relationships are limited to the network of
its three owners, only one of which is actively selling.
CSF #4: Marketing and Sales Team Geographical Reach including presence in different industries (1)Two (2) to Three (3) senior consultants are assigned to do business development but
there is no team to plan and support marketing activities. Since the inception of the business,
Solutions has just relied on its personal relationships with key people in the industry to grow its
business. No formal marketing and sales activities is done.
67 | Page

CSF #5: Track Record and Reputation (3)Feedback from various providers indicate that they prefer working with Solutions
because of Solution’s technical expertise especially in understanding provider’s pricing as well
as the structure of our support team which corroborates with the provider’s administration and
account management team. However, Solutions as a boutique firm has a minimum to none
press releases and marketing activities such that it maintains its exclusivity and thus the brand
is not as known and widespread in the market.
CSF #6: Price competitiveness (3)Solutions is able to negotiate pricing because of its technical (actuarial) team. This is
basically Solutions main strength. It also has fiscal control over its expenses which makes the
business profitable even when industry’s strong rivalry are pushing down prices. Its average
commission is 7%, just a little above the market leaders (Marsh and HSBC at 5%) and below
the market average of 10%. However, for consulting projects like Retirement Plan, Solutions is
pricing above the market (at least for local companies where only compliance is the
requirement).
CSF #7: Service & Capabilities – Technical Advice (4)Solutions has a strong technical team which includes actuaries. Its team has more than
100 years of healthcare and insurance experience in the insurance industry although its size
and original positioning has limited its advice to employee benefits, which earns it a rating of 3.
CSF #8: Service & Capabilities – Range of Services (2)Service offering is strong in EB lines, i.e. Life, Accident and Healthcare. Market share in
A%H is 11%, Life is 1% while market share for other lines are below 1%. There are major
accounts for Motor Car fleet insurance but not much in terms of market share (i.e. less than
1%). Despite this, Solutions is ranked 12 with 99% of its portfolio with A&H lines. Other
offerings consist of Employee Benefits Consulting, Third party Administration, and Actuarial
Consulting. Solutions has also done health policy projects as part of its advocacy for helping
the government uplift public health care. The limited and focused range of services is due to its
original boutique positioning which is why the rating is 2.
CSF #9: Service & Capabilities – Transaction Competence, Innovation and Information Technology (4)
68 | Page

Solutions, as an organization, is structured such that the account management and
support services team comprise almost 90% of the manpower. Investments on data center and
technology is also substantial in order to have capability for data storage and processing
however there should be a move to full automation in order to re-focus training of personnel
from transaction management to high-level consulting.
4.6.4. Gotuaco’s Critical Success Factor Ratings
CSF #1: Strength of International Corporate relationship / Network (1)Gotuaco is a member of three global networks (International Benefits Network, Assurex
Global, Globex International). However, these three networks are not as know and strong in
terms of branding and corporate relationship. Like Solutions, it is part of alliances of
independent brokers in contrast with Marsh, Aon and Jardine which are owned by the
multinational firm. Global appointments for independent broker networks usually are rare.
Referrals from a network co-member would be more standard.
CSF #2: Strength of Local institutional relationship including reciprocal business (4)Gotuaco has benefited through the institutional connections of its founder and president
Ambassador Arthur del Rosario the biggest of which is its connections with the Metro pacific
group (i.e. A. del Rosario is one of the directors in PLDT). Its local jumbo accounts include
PLDT, SMART and Meralco.
CSF #3: Strength of Local personal relationship (4)The strength of Gotuaco’s personal relationships also springs mainly from the
connections of its patriarch. In addition, Gotuaco is one of the pioneers in the industry, and as
such, has built a substantial network that it can tap. Despite being a purely local company and
not part of a bank or a conglomerate, it ranked number 7 indicative of the strength of its
personal relationships and the business it brings in.
CSF #4: Marketing and Sales Team Geographical Reach including presence in different industries (3)Gotuaco has sales representatives in key cities while concentration of its business
development is still in Metro Manila.
69 | Page

CSF #5: Track Record and Reputation (3)Gotuaco is not known for its consulting practice and after sales service. However, the
brand is quite strong by the virtue of being the pioneer in the industry (close to 50 years) and its
connection to Amb. Del Rosario.
CSF #6: Price competitiveness (2)Gotuaco has no actuarial team that is technically capable of negotiating rates with the
providers. However, it does use its strong relationship with providers for competitive pricing.
Pricing is close to market standard. Ave. commission is at 9%
CSF #7: Service & Capabilities – Technical Advice (2)Gotuaco has no known technical team that supports its operations. However, it does
bring in global experience through its three global network.
CSF #8: Service & Capabilities – Range of Services (2)Gotuaco has at least 5% market share in 5 lines (Fire – 5%, Ocean Marine – 7%, Marine
Hull – 6%, Fidelity & Surety – 6%, A&H – 9%). Its portfolio is around 42% EB and 58% EB.
However, its capabilities are only limited to insurance placement. It just launched a 3-in-1
employee benefit package targeted for SMEs. So far, this is one of its kind in the market.
CSF #9: Service & Capabilities – Transaction Competence, Innovation and Information Technology (1)
Per anecdotal accounts from common clients and providers, Gotuaco employees are
more marketing and selling rather than support services. Based on provider feedback, Gotuaco
usually just transfer to providers the handling of day-to-day transactions.
4.6.5. Lacson’s Critical Success Factor Ratings
CSF #1: Strength of International Corporate relationship / Network (1)Lacson and Lacson is a member of the Worldwide Broker Network. Like Solutions, it is
part of alliances of independent brokers in contrast with Marsh, Aon and Jardine which are
owned by the multinational firm. Global appointments for independent broker networks usually
are rare.
70 | Page

CSF #2: Strength of Local institutional relationship including reciprocal business (2)Lacson has developed institutional relationships with its network of hospital and car
shops nationwide.
CSF #3: Strength of Local personal relationship (2)Lacson is also one of the pioneers in the industry (around 40 years). Similar to Gotuaco,
it has built an adequate personal network that it can tap. Despite being a purely local company
and not part of a bank or a conglomerate, it ranked number 17 out of more than 60 brokers.
CSF #4: Marketing and Sales Team Geographical Reach including presence in different industries (3)Lacson has offices in Cebu and Bacolod which extend its reach to the bustling South
and the only local insurance broker with its own accredited hospital, clinics and motor car shops
nationwide.
CSF #5: Brand Equity- Track Record and Reputation (2)Lacson, by virtue of being one of the pioneers in the industry has established some
reputation and some brand awareness but not as strong as Gotuaco’s and the global players.
CSF #6: Price competitiveness (2)Average commission is around 11%, a little higher than the average market rate.
Lacson has large placements for Ocean Marine Insurance, in which it averages around 25% in
commission which pulls up the revenue of its client portfolio even if its A&H line, which is still the
majority of its portfolio only averages 7.5% in commission rate.
CSF #7: Service & Capabilities – Technical Advice (1)Lacson has no known technical team that supports its operations.
CSF #8: Service & Capabilities – Range of Services (3)Lacson has a wide range of offering including TPA service with its own network of
providers. It also has its own accredit shops supporting its own Motor Car policies. It is one of
the few insurance brokers that can place Kidnap and Ransom cover, mainly because it also
carries a reinsurance license and can place this directly with the reinsurers.
71 | Page

CSF #9: Service & Capabilities – Transaction Competence, Innovation and Information Technology (3)
Because of its TPA business (offering almost the same service as medical insurance
and HMO), Lacson has created its own internal system to support its transaction-heavy service
offering.
4.6.6. Howden’s Critical Success Factor Ratings
CSF #1: Strength of International Corporate relationship / Network (3)Howden Philippines is one of the newest member of the Howden insurance group which
is looking at strengthening its presence in Asia Pacific region. Currently, global appointment of
global clients is not yet maximized but the global outlook is that it would be in the future.
CSF #2: Strength of Local institutional relationship including reciprocal business (2)Howden still retains its reciprocal business through its connections with the Zuellig
group, which remains the big minority shareholder of the firm.
CSF #3: Strength of Local personal relationship (2)The heads of Howden’s non-life and employee benefits divisions have more than 50
years of combined insurance experience but all of them are with insurance providers. What
relationship they have would mostly be through brokers and/or their own sales force. Stronger
network from personal relationships would most probably come from their CEO, Augusto Toledo
which came from the finance industry.
CSF #4: Marketing and Sales Team Geographical Reach including presence in different industries (3)Howden currently has operations in Metro Manila and Cebu. Its marketing group are
divided into four (4): 1) non-life insurance, 2) employee benefits, 3) Reinsurance – Government,
and 4) Reinsurance Industrial.
CSF #5: Brand Equity - Track Record and Reputation (2)The group has provided broking service in the Philippines for around 36 years since it
was still known as Zuellig Insurance Brokers. Then it changed its identity to Accette before it
72 | Page

was purchased by the Hyperion Insurance Group in 2011. The new brand is still in its building
stage in the Philippines.
CSF #6: Price competitiveness (1)The firm has no actuarial team that is technically capable of negotiating rates with the
providers although its key people have underwriting background and came from insurers which
should provide them stronger relationship with current providers. However, based on the IC
report, their average commission rate is above market standard at 13%. Even for EB lines which
comprise 53% of its portfolio, Howden’s average commission rate is 10%, which is a little bit
higher than market’s 9%.
CSF #7: Service & Capabilities – Technical Advice (2)Howden brings in the capability of its global firm in terms of technical expertise.
However, this is not as strong yet as Marsh’s and Aon’s.
CSF #8: Service & Capabilities – Range of Services (3)Howden has balanced portfolio with at least 1% market in almost all lines except Marine
Hull and Engineering. Its portfolio is around 47% EB and 53% EB. It offers all lines of insurance
line including Medical Malpractice, Commercial Crime and Crisis & Security Risk Management.
It also has Reinsurance capacity.
CSF #9: Service & Capabilities – Transaction Competence, Innovation and Information Technology (3)
Howden is not yet known for its backroom capability that support its after sales service.
However, it is pushing to the market an online solution (from its parent company) that allows
members access to data and information about their healthcare benefits. If Howden will be able
to successfully link this system to the providers’, this automation solution would be a big
differentiator in terms of speed in data sharing with the clients.
73 | Page

4.6.7. Benchmark Critical Success Factor Ratings of other Global PlayersCSF JLT Marsh Aon
#1. Strength of International Corporate relationship /
(3) Jardine is one of the top brokers globally although acquisition of global clients is not as strong as the top 2 (Marsh and Aon) especially those with presence here in the Philippines.
(4) Marsh is one of the top brokers globally. A lot of their global corporate clients in the Philippines are acquired through global appointments.
(4) Aon is also one of the top brokers globally. Like Marsh, a lot of their global corporate clients in the Philippines are acquired through global appointments.
#2. Strength of Local institutional relationship including reciprocal business
(1) Like Solutions, Jardine does not have strong institutional relationships.
(3) Marsh is very active in working with various organizations. As an example, it has partnered with P&A Grant Thornton in offering Seminars in Employee benefits and taxes in order to capture corporate clients. It also has a strong presence in various HR and BPO groups.
(4) Aon was part of the Ayala group in the past before it was fully merged to the global Aon group. As such, corporations affiliated with the Ayalas are their captured market. Aon has also used reciprocal business deals with their local and global providers.
#3. Strength of Local personal relationship
(3) Like Marsh, it uses its large sales team to cultivate its network and make its presence felt in the market.
(3) Marsh through its wide marketing and selling group should be able to exploit their personal connections in order to acquire clients.
(3) Similar to Marsh, it uses its large sales team to cultivate its network and make its presence felt in the market.
#4. Marketing and Sales Team Geographical Reach including presence in different industries
(3) Aside from Metro Manila, Jardine has branched out in Cebu which became their hub for the South provinces.
(4) Marsh not just has provincial reach but its regional and global marketing and sales team are aggressive in selling to global companies and “hand-over” to the local partners the business of the local counterparts.
(3) Similar to other global players, Aon is able to set up its provincial branches. It also has a strong global and regional marketing team but not as strong as Marsh.
#5. Brand Equity - Track Record and Reputation
(3) None to minimal after sales service and not so strong technical advice. Although they are also one of the top global brokers so they have also a strong brand recall with key contact persons in the firms.
(4) Currently, the reputation of Marsh is that they bring in big accounts but with minimal after sales service. However, they do have a strong employee benefits team in terms of technical expertise as well as ample portfolio in order that enables them to benchmark study. Since they are a top global broker, they are always top of mind in intermediaries circle. They have also merged with Mercer which is a top employee benefits consultant globally and in the Philippines.
(4) Same as Marsh. In addition, their past connection with the Ayala’s have also helped strengthen their brand.
74 | Page

Critical Success Factor Ratings of other Global Players (cont.)
CSF JLT Marsh Aon
#6. Price competitiveness (2) No known actuarial team that is technically capable of negotiating rates with the providers. Pricing is close to market standard. Ave. commission is at 11%.
(4) Marsh is able to undercut its commission to as low as more than half the market standard commission due to volume, i.e. 5% commission vs. Industry 10%). Marsh has also used “retainer” structure instead of commissions in order to take out the commissions portion in the insurance product pricing. Lastly, there are instances where fees are paid out globally so Marsh is able to get proposals from providers net of commission.
(3) Same as Marsh but not as aggressive (comm. At 9%). However, there are instances, especially when the account is global, that they can dive its commission rates and give up part of their commissions just to retain the account.
#7. Technical Advice (3) Jardine brings in the capability of its global firm in terms of technical expertise. However, this is not as strong as Marsh and Aon.
(3) Marsh brings in the capability of its global firm in terms of technical expertise. It also has Mercer as its consulting arm.
(4) Aon brings in the capability of its global firm in terms of technical expertise. Most of the high-level technical advice and decisions are made either by their senior consultants or the global practice leader.
#8. Range of Services (4) Jardine has at least 5% market share in 4 lines (Ocean Marine - 6%, A&H - 5%, Engineering - 10%, Miscellaneous - 8%). Its portfolio is around 60% NEB and 40% EB. It has non-life international pooling and reinsurance capabilities and can place insurance against risks from petrochemicals, power and refining and crime.
(4) Marsh has double digit market share in 5 lines (Fire – 11%, Ocean Marine – 14%, A&H – 30%, Engineering – 62% and Miscellaneous – 15%). Its portfolio is around 60% Non-EB and 40% EB lines. In addition, they have strong Employee Benefits arm in Mercer.
(4) Aon has double digit market share in 3 line (Fire – 18%, Ocean Marine – 20%, and A&H – 13%). Its portfolio is around 61% Non-EB and 39% EB lines. It has insurance and reinsurance placements and HR consulting and outsourcing services.
#9. Transaction Competence, Innovation and Information Technology
(1) Same feedback as Marsh. (1) Based on informal feedbacks from providers and former clients, Marsh employees are more marketing and selling rather than support services. According to some providers, Marsh usually let the providers handle day-to-day transactions while they do minimal audit (if any). It rides along the global Information Technology innovations which they use as competitive advantage in selling to their clients.
(1) Same feedback as Marsh.
75 | Page

4.6.8. Competitive Profile Matrix (CPM)
‘
The CPM shows that Solutions is above average (2.46) in terms of the critical success
factors of the industry. Its major weakness is the sustainability of its network as well as its
marketing reach. Its major strength is its service capability, expertise and reputation for quality
service.
It is shown in the CPM that market leaders are able to capture big market shares
because of they are strong in the areas where Solutions is weak.
Solutions needs to review its primary target market (implicitly suggested by the CPM, i.e.
go local corporations), develop a unique value offering for this PTM and build capacity by
developing its marketing team to execute the marketing plan. Solutions also has to decide if it
needs to branch out to have nationwide coverage or focus on the already saturated Mega
Manila market. Its internal operations already haves the systems in place but it just needs to
ensure that it can scale fast to be able to move with business growth. Solutions has to be
careful in not losing its advantage in price competitiveness, technical know-how and after-sales
service (transaction competence). Currently, Solutions can promise speed and accuracy to its
clients because the backroom is fully supported by human assets. In the future, the Company
should seriously move to automation of processes and services that can be automated so it can
concentrate in building more capacity for selling and technical expertise which are more
valuable and more critical.
76 | Page

Table 4.4. Competitive Profile Matrixbenchmarking purpose only
Solutions GRA Lacson Howden Jardine Marsh AonCRITICAL SUCCESS
FACTORS Wt RateWtd
Score RateWtd
Score RateWtd
Score RateWtd
Score RateWtd
Score RateWtd
Score RateWtd
ScoreRelationship / Network:
Corporate International 5% 1 0.05 1 0.05 1 0.05 3 0.15 3 0.15 4 0.2 4 0.2Local Institutional including reciprocal business
13% 1 0.13 4 0.52 2 0.26 2 0.26 1 0.13 3 0.39 3 0.39
Local Personal 10% 3 0.3 4 0.4 2 0.2 2 0.2 3 0.3 3 0.3 3 0.3Marketing and Sales Team reach
15% 1 0.15 3 0.45 3 0.45 3 0.45 3 0.45 4 0.6 3 0.45
Brand Equity: Track Record / Reputation
Includes Historical Service & 10% 3 0.3 3 0.3 2 0.2 2 0.2 3 0.3 4 0.4 4 0.4Technical Advice and communication of these to the market
Price competitiveness 15% 3 0.45 2 0.3 2 0.3 1 0.15 2 0.3 4 0.6 3 0.45Service & Capabilities
Technical (e.g. Risk Management Competence, Medical Expertise, Problem Solving, Company-, Industry- Knowledge)
12% 4 0.48 2 0.24 1 0.12 2 0.24 3 0.36 3 0.36 4 0.48
Range of Services / Products (including strength in each)
10% 2 0.2 2 0.2 3 0.3 3 0.3 4 0.4 4 0.4 4 0.4
Transaction Competence, Innovation and Information Technology
10% 4 0.4 1 0.1 3 0.3 3 0.3 1 0.1 1 0.1 2 0.2
TOTAL100% 2.46 2.56 2.18 2.25 2.49 3.35 3.27
RANK 5 3 7 6 4 1 2Industry Ranking 12 7 17 15 10 1 3
Notes:Weight: 0% - Least Important, 100% Most Important Critical Success FactorRating score: 4 - major strength, 3 – minor strength, 2 – minor weakness, 1- major weakness
77 | Page

4.7. External Factor Evaluation (EFE) Matrix4.7.1. Opportunities and Importance Weight
O1. Increase GDP growth drives more businesses which are the primary purchasors of insurance. (Macro - Economic); Weight – 10%
Historically, GDP growth shows a corresponding market growth. It is very conservative
already to target at least growth equal to GDP. Market is growing by 13% more than GDP
growth in years 2007 to 2011. Even if market just grows the same as the GDP growth rate, that
would translate to around Php 3 Billion in premiums or around 300 M in commissions. If market
continues to grow by 17%, that would be a growth of more 6 Billion per year in premiums and
600 M in commissions. For Solutions, a 6% growth (same as GDP) would translate to 5.4M of
revenues but if it wants to keep up with the market growth at around 17%, revenue target
growth would be around at least 15M year on year.
O2. Large presence of SMEs (Around 32,000 in NCR / 73,500 Philippines) that could be captured even without global affiliations. (Macro-Economic); Weight – 15%
For every 1% capture of SMEs in NCR is estimated to produce Php 50 to 70M in
premiums and around Php 5 to 7M in commissions for employee benefits placement alone. This
could double for nationwide penetration. If the industry makes 10% penetration (e.g. top 10 will
get 1% each), this should translate to Php 50 to 70M in commissions for NCR alone. This is the
space where local brokers can thrive as most SMEs would be from local industries and would
have no pressure from global counterparts to appoint global brokers. This is also the less
served market because of the size and effort to reach out to this market. For Solutions, it could
start targetting 1% penetration in the next 2 years then increase to 5 to 10% penetration in the
NCR in the next 3 to 5 years (10 to 20 M in revenues).
O3. Increased activity of Global Players (EB consultants and brokers) means increase in demand for broker services locally. (5 Forces, Market Analysis); Weight – 10%
Global players with large corporations employing around 700-800 on the average could
contribute around 50M of premiums and 0.5M of commissions for employee benefits alone for
78 | Page
one firm. For a 10% nationwide penetration of large companies, assuming most of these are
global, this should translate to more than 150M in commissions. However, while the impact to
the industry is high, most of the large global players would go through global brokers or have
enough muscle and capability to go direct. This is the reason why, for local brokers like
Solutions, this opportunity could be exploited using existing network and strong relationship but
further marketing expense may only be advisable if this is targeted and well thought of.
O4. Increase in perceived value of employee benefits as HR acquiring and retention tool (Market Analysis, Value Chain); Weight – 15%
There is a large need of providing healthcare and life insurance plans (some would
provide motor car plans), and retirement benefit to the employee force. This should maintain or
increase premiums as benefits are enhanced. Right now, the average premium hovers around
7,000 to 8,000 per employee for employee benefits. Just a 5% increase in premiums will
translate to around 35 to 40 commission income per employee. For an account of 500
employees with around 2 dependents each, that would generate around Php60,000 more in
commission. For Jumbo accounts of more than 1,000 employees, that would be more than
100K per account. Based on current market share of EB, this opportunity should translate 60 -
75M in total commissions. For Solutions, this has a big impact most especially that the
company is focused in offering Employee Benefits-related services. For insurance broking
alone, 11% market share for Accident and Health, would translate to more than 8M in revenue.
This could be more with a targeted marketing strategy.
O5. Fast growing BPO segment and improving status of the manufacturing industry (Market Analysis); Weight – 5%
Increase in BPO industry means more jobs and an increase in purchasing power.
Opportunity for the company to earn more sales. Growth of around one (1) million more
workers in the BPO industry would mean around Php 7 Billion in additional premiums from this
sector alone or 700M in commissions by 2016. (potential 70M in revenues by 2016 at 10%
market share)
79 | Page

4.7.2. Threats and Importance Weight
T1. Market leaders undercutting commissions would drive commission rates down (5 Forces, Market Analysis); Weight – 15%
Currently, Solutions is averaging 7 to 8% commission per account. If market leaders
continue to drive down commission rates, Solutions may be forced to cut down its commissions
in order to stay competitive. The effect would be around 20-25 M potential loss in revenue.
There could be ways to maintain its current commission rate if customers would agree that the
value offering of Solutions is worth the premium that it would be paying. This means that
Solutions needs to enhance its bouquet of offerings and ensure that its value proposition and
differentiation are well communicated to its target market.
T2. Increased Consolidation of Multinational Clients (5 Forces, Market Analysis);
Weight – 20%
This has the highest importance weight since 87% of the current client portfolio of
Solutions are Multi-national Companies (MNCs) in terms of revenue generated. Service offering
should be really compelling for the local management to be able to defend its preference to stay
with a local broker and not participate with the global appointment, should international
appointment is done as a global initiative. This has been done in the past.
T3. Increased activity of Provider direct sales force competes with intermediaries
(5 Forces); Weight – 10%
Usually, those that could afford to go direct are also the big clients, usually the MNCs,
which can leverage their size and their name in order to strong arm providers to do the value
added service provided by the brokers by themselves. These are also the companies in which
the procurement department and its HR are very strong with industry expertise already.
Currently, around 50% of the portfolio of the top HMO providers is placed by intermediaries.
80 | Page

4.7.3. Opportunities and Responsiveness Ratings
O1. Increase GDP growth drives more businesses which are the primary purchasors of insurance. (Macro - Economic); Rating – 1
The Company has no formal marketing and sales team to be able to go out to the
market and make the market aware of its presence.
O2. Large presence of SMEs (Around 32,000 in NCR / 73,500 Philippines) that could be captured even without global affiliations. (Macro-Economic, Market Anaylsis);
Rating – 1
Current network of the business development team comes from MNCs. More effort
should be made in order to cultivate relationships with local companies and their key decision
makers. In addition, to be able to make the SME portfolio profitable, volume of business is key
which means more SMEs to sell to that needs a bigger pool of sales force in the field that
Solutions current has none.
O3. Increased activity of Global Players (Risk and EB consultants and brokers) means increase in demand for broker services locally. (5 Forces, Market Analysis); Rating –
2
The strength of the current global network (Abelica Global) where Solutions is affiliated
with is on Employee Benefits Consulting. In terms of reciprocal business, the network has not
yet produced a substantial increase in revenue. In terms of insurance broking, the RNA network
where Solutions belongs to covers only the Southeast Asian region. Most of the Global players
in the Philippines would have headquarters in North America, India and even Japan. The
default behaviour of these global players would be to partner with global consultants and
brokers too, the mandate of which usually comes from the headquarters. Solutions always
need to leverage on their reputation for technical expertise, service delivery and strong personal
ties in order to overcome global appointment challenges.
O4. Increase in perceived value of employee benefits as HR acquiring and retention tool (Market Analysis, Value Chain); Rating – 4
81 | Page

Solutions has top notch consultants who are technically trained and known to be experts
in the industry. As consultants, this is a big differentiator in terms of credibility of advice.
However, Solutions need to beef up the upgrade of expertise of its second generation leaders
and consultants in order to scale better and for better succession plan as its current senior
consultants are already planning their retirement.
O5. Fast growing BPO segment and improving status of the manufacturing industry (Market Analysis); Rating – 2
Solutions currently has a good portfolio of big BPOs and manufacturing firms which can
vouch for the service quality by the company. However, there are no formal networking
activities in the pipeline that is aimed to mine and take advantage of these current relationships.
This sector also expects 24x7 servicing capabilities, which Solutions should consider building.
4.7.4. Threats and Responsiveness Ratings
T1. Market leaders undercutting commissions would drive commission rates down (5 Forces, Market Analysis); Rating – 4
Solutions has the capability of countering this threat. It currently has its own internal
actuarial team that could validate provider pricing and thus negotiate a better price without
sacrificing the profitability of the account. On top of this, Solutions should strive to be more
efficient in its operations and automate processes, whenever possible.
T2. Increased Consolidation of Multinational Clients (5 Forces, Market Analysis);
Rating – 1
Current network of the business development team comes from MNCs. More effort
should be made in order to cultivate relationships with local companies and their management.
T3. Increased activity of Provider direct sales force competes with intermediaries
(5 Forces, Value Chain); Rating – 3
82 | Page

There is a need for the intermediaries to maintain efficient operations that could delivery
value offering to the clients in order to compete with the direct sales team of the providers.
Solutions has to maintain a substantial portfolio with its provider network and maintain its long-
term partnership in order to ensure provider cooperation. Solutions is constantly reviewing and
enhancing its processes and systems in order to maintain its target operational cost.
4.7.5. EFE Matrix
Table 4.5. EFE Matrix of Solutions
Opportunities SourceImportance Weight (0%
to 100%)
Responsiveness Rating Weighted
Score(1 to 4)
O1Increase GDP growth drives more businesses which are the primary purchasors of insurance.
Macro Economic 10% 1 0.10
O2
Large presence of SMEs (Around 32,000 in NCR / 73,500 Philippines) that could be captured even without global affiliations
Macro Economic,
Market Analysis
15% 1 0.15
O3
Increased activity of Global Players (EB consultants and brokers) means increase in demand for broker services locally.
5 Forces, Market
Analysis10% 2 0.20
O4Increase in perceived value of employee benefits as HR acquiring and retention tool
Market Analysis,
Value Chain15% 4 0.60
O5Fast growing BPO segment and improving status of the manufacturing industry
Market Analysis 5% 2 0.10
ThreatsImportance Weight (0%
to 100%)
Responsiveness Rating Weighted
Score(1 to 4)
T1Market leaders undercutting commissions would drive commission rates down
5 Forces, Market
Analysis15% 4 0.60
T2 Increased Consolidation of Multinational Clients
5 Forces, Market
Analysis20% 1 0.20
T3Increased activity of Provider direct sales force competes with intermediaries.
Value Chain, 5 Forces 10% 3 0.30
Total 100% 2.25
Solutions is moderately responsive (with a rating of 2.25) to the opportunities and threats
posed by the market environment. Perhaps, its strongest weapons are its consultants who are
experts in their fields as well as its continuing activities to standardize operations for easier
83 | Page

scaling. The Company, however, should accelerate its training and development program to
produce more technically competent consultants or hire them soon. The Company is definitely
lacking in its efforts to respond to the expanding market opportunities because of its very thin
support for its business development team in terms of human resource capacity, formal and
measurable performance indicators and marketing and sales activities. It is clear that there are
opportunities with SMEs and companies outside NCR that can be further capitalized with better
coverage.
5. COMPANY ANALYSIS
5.1. Company Vision and Mission Statement
5.1.1. Solutions’ Vision Statement
The inward focused vision statement of Solutions has already evolved since it started its
operations almost 20 years ago. It was noted that the vision statement is not found in any
company collateral including its employee manual. The vision is sometimes mentioned during
the Company’s annual kick-off during the first month of each year attended all its regular
employees. The current (ten-year old) vision statement is:
“To be the incubator for the best minds in employee benefits advice and insurance
placement in the country.”
5.1.2. Solutions’ Mission Statement
Unlike the vision statements, the Company’s mission statement is often found in
Solutions’ brochures, corporate profiles and employee manual:
“Our mission is to help our clients in achieving their corporate goals by providing
services of the best possible value in the areas of: actuarial services, employee benefit advice
and insurance placement.”
84 | Page

5.1.3. Review of Vision and Mission Statements
Table 5.1 Company Vision Evaluation
Parameter Yes / No Why
Does it clearly answer
the question: What do
we want to become?
Yes It states that the firm wants to be the incubator of best
minds…
The vision adeptly describes the kind of relationship it wants to
develop with its clients, business partners and employees.
Is it concise enough
yet inspirational?
Yes The vision inspires the employees of the firm as it describes
how the Company values its employees – it wants to incubate
the best minds. The best minds to give advice.
Is it aspirational? Yes The firm challenges itself to be able to continue gaining
expertise to be able to impart to all its stakeholders, i.e. to be
the incubator of best minds. This is a big challenge.
Does it give clear
indication as to when it
should be attained?
No The vision is not time-bound and it does not have to be. It is
also is not bounded by how many minds are to be incubated
which it should not limit itself to as well.
85 | Page

Table 5.2 Company Mission Evaluation
Parameter Yes / No If yes, which part of the statement
1. Customers Yes The mission states that the clients have corporate goals,
which means that the target customers of the firm are
corporations.
2. Products &
services
Yes The mission states that the services provided will be on the
areas of actuarial services, employee benefit advice and
insurance placement.
3. Markets No While the mission refers to corporations as its clientele, it does
not clearly define what kind of corporation it wishes to tap.
This is likely because every company will have employees and
likely need some form of employee benefits.
4. Technology No There is no explicit reference to how technology will be used
in its mission.
5. Concern for
survival, growth,
profitability
No Being the advisor of choice does not necessarily translate to
highest market share or that the firm will grow. It only means
that the company wants to be top of mind when it comes to
the services it offers. It is vague on how this translates to
actual clients.
6. Philosophy Yes “… services of the best possible value”. The standard, value
and expectation for excellence are clear.
7. Self-concept YesNo In order to provide service of best value (i.e. advise), it is
inherent to the mission that the competitive advantage of the
firm is its strong expertise. This is a clear description of what it
aims to be – “provider of best value”. The scope is just
vague, i.e. is this just referring to local expertise? Global?This
also ties in neatly into the vision statement.
8. Concern for
employees
No How employees are value is not explicitly mentioned in the
mission statement rather it is stated in the vision statement.
86 | Page

9. Concern for nation
building
No There was no reference to how the firm would be instrumental
to building the nation.
5.2. McKinsey’s 7S Framework
5.2.1. Strategy
5.2.1.1. Client retention strategy. Entrench business process with client’s to
strengthen dependency of the client and increase value.
Conclusion. This is helpful and effective as this strategy creates the rationale of why
client would want to retain its relationship with the Company. Better integration of processes
with the use of the appropriate proper people, processes and technology allows Solutions to
cleanly fit into its customer’s workflow. In order to maintain this, Solutions should periodically do
satisfaction surveys and Focus Group Discussion (FGD) with clients to gather more insights on
how to match its service offerings including technology to its clients’ business processes and
plans for the future. As there is increasing risks of losing multinational clients to global brokers
or provider’s direct sales, there is a need to strategize on how to cultivate new business from
prospective clients that are from different markets.
[5.2.1.2.] Client growth through product development. Solutions was able to
develop mass marketing products (particularly motor car and fire insurance) that are priced
lower than the market but with more benefit features. This is done in close partnership with the
customer. In the end, these offerings are additional business for Solutions and also serve as
additional benefits granted by the customer to its employees.
Conclusion. While the packages are attractive, there are minimal sales because there
is no integrated marketing strategy on how to push this to the market. The business
development team should make targets and action plans on the implementation of this program.
The company should consider promotional activities like flyering or on-site FAQs during one of
client’s company-wide activities or roll-outs.
87 | Page

5.2.1.2.[5.2.1.3.] Market Penetration. Do networking activities through participation
in Association like PMAP, Finnex, etc. Data mining for prospects is also done using contacts
from the membership directories of some associations following this through with cold calls to
establish a foot in the door.
Conclusion. Networking activities can be effective in building network but this is
currently not fully utilized. Instead of just joining as a member, it might be more strategic if
Solutions, instead, partner with this organizations, lend its technical expertise in coming up
and/or sponsoring seminars, workshops and events. Greater visibility for its key consultants
should be created as speakers and resource persons for these activities.
In this industry, where trust is the foremost basis of the business relationship, doing a
cold call will not be effective. It may be more effective to demonstrate the expertise rather than
sell it. Solutions should consider sponsoring talks, trainings and workshops with its primary
target market as audience.
5.2.1.3.[5.2.1.4.] Other Product / Service Offering development activities. Solutions developed a new line of offering through its TPA services which addresses some of
the servicing needs of the clients in terms of administering some of its healthcare and/or car
loan benefits on top of the regular plan covered by the insurers/HMOs.
Conclusion. This is effective. This give more value added service to the client and this
is an additional competency / service offering in the portfolio. This should be strengthened,
grown and more technological and process innovation should be incorporated. A primary driver
for customers to move into TPA services is scale. Solutions is able to provide the required scale
with the key of enhance people, processes and technology.
5.2.2. Structure
Solutions has around 3 to 4 hierarchical level from the ranks to the President. It is fairly
a flat organization as shown in Figure 5.1. Since the organization is relatively small, one person
may assume one or more functional roles (e.g. Business Development may also be Project or
Account Management Lead, or Operations Lead may also handle Account Management, or the
88 | Page

IT Function lead may also be handled by one Account Management Lead). Depending on the
functional role of the employee, he or she could have more than one immediate superior.
The way the organization is structured now, it has three (3) major divisions:
1) Business Development, 2) Account Management Team and 3) Shared administrative
services. Business Development is in charge of selling to prospects. Once a sale is closed,
the account is turned over to an account / project lead who is provided by the operations lead
with an account management team that will service the account. The Account Management
Team Leader (which is a coordination function, hence the dotted line in Figure 5.1) will assign
the account to one Account Officer / Technical Associate and a back-up Account assistant. The
Support Services Team Leader, who handles the central pool of administrative clerks, will
assign a staff to support the account.
The rest of the Shared administrative services teams are cost centers.
The service offering and operations were structured in such a way that the Company is
organized with heavy backroom complement but with very thin business development
(marketing and sales) team. Currently, more than 95% of the organization is composed of
backroom support (account management teams, support teams, shared services like
accounting and administration teams). Less than 5% of the organization is into business
development or marketing or sales. In addition, Business Development leads (i.e. the closers)
are also the Account Management Leads (i.e. fulfillment) with their involvement in fulfillment
mostly in relationship management, management of high-level concerns and renewal of
business.
Accounts are assigned depending on the team’s current load with considerations on the
preference of the account lead. As such, an account management team may handle different
accounts headed by different Account Leads. This is where the reporting line get complicated
most of the time. It could happen that simultaneous tasks may be required by different account
leads, in which the account management team, especially the Team Leader would have
difficulty managing. The Operations Lead, who is the direct and functional manager of all Team
Leaders, would ideally intervene. Figure 5.2 is a graphical representation of the dynamics of the
Account Management Team.
89 | Page

ConclusionThe relative flatness of the organization is theoretically effective in terms of efficiency in
communication lines. Being a flat organization, the firm has the advantage of being able to
cascade its implementation plans rapidly. Its line managers (the Team Leaders) are empowered
to plan and decide on its team’s performance while being guided by the company-wide
standards. At least, at this level alone, decision-making is fast.
One of the challenges of a flat organization isin the career development of its employee.
force mostly iThis creates challenges in terms of communicating to the employees how they are
developed for bigger roles as promotions comes rarely in terms of positionin terms of career
progression and their place in the company.
Multi-functional roles in matrix organizations, especially for key employees, may seem
efficient in terms of man hours but may not be as effective due to lack of focus. It would still be
ideal to minimize multiple reporting linessuperior, if this cannot be totally avoided. This is to
ensure that miscommunication is minimized. This should also take the burden from the
employee for choosing which project/task to prioritize without anybody questioning his/her
loyalty. Responsibility is difficult to share.
A robust backroom is apt in necessary order to support the major offerings of the firm,
which is placement of healthcare and life insurance and retirement plan valuation. This
structure is ideal in order to create value in terms of high quality and fast turnaround for after
sales service. For non-life insurance (the lines that the firm is not actively pushing), after sales
support could be leaner. However, Solutions should consider automating as much processes
as possible so administrative servicing would be leaner in terms of clocking man-hours and
focus human assets in relationship management and high-level technical consulting.
Since the business is mainly based on relationship with clients, it is helpful that the
person who closed the deal is visible all throughout the project or contract. However, there
have been organizations which could successfully transition their new projects/accounts to a
different “fulfillment team” whereby focusing the resources of its new business / business
development team. The Company should carefully consider and review the viability of this
structure and formally create a business development team that does product development,
marketing and sales to support the strategy of the firm.
90 | Page

Finally, a full-time HR manager should be hired in order to meet the demands of
recruitment and full HR services including but not limited to training and development of
personnel and payroll.
91 | Page

Figure 5.1 Solutions Organization Chart
92 | Page
Figure 5.2. Account Management Team Dynamics
5.2.3. Systems
The Company currently has no integrated enterprise wide resource planning system. It
has in-house developed sales reporting systems for both the commission-based revenue
business and the fee-based business, which are separate systems. Accounting systems are
also not integrated. The HRIS and payroll systems are also separate. Likewise, payrolls are
done by different processors depending on the level of the staff.
Standard procedures and templates for major processes like proposal generation, plan
placement and launch and plan maintenance was developed for the EB business while the
Company is currently documenting the standards procedures for the NEB lines. Full
manualization of procedures and standards for the business lines is ongoing. Other
administrative processes are not yet documented like standards and criterion for procurement
and accreditation of business partners and suppliers.
The Company has its in-house data center, which stores all the electronic files pertaining
to business operations and clients. There is a move for more secure data storage and
redundancy to comply with the new data privacy law as well as the information security
standards of the clients.
93 | Page
Account Lead 3
More than 2
“bosses” per Team
LeaderAccount Lead 2
Account Lead 1
OPS Lead
President
TL
TL
TL

Conclusion. Existing systems in place may not be adequate anymore most especially
if operations should scale fast to support the business needs. Using separate systems could
also lead to inefficiency. In-house developed systems are ideal for ease of customization when
needed. However, the current reporting systems need a lot of improvements in terms of
adequacy in the reports generated, absence of built-in analytics, ease of cascading to the
people, support as well as regular update of the system.
Sales reports, Account Receivables, Account Payables and other pertinent reports that
could aid in cash planning, capital budgeting and sales reporting should be made available not
just to the managers but down to the ranks to foster company-wide acknowledgement of
responsibilities and measurable and objective Key Performance Indicators (KPIs).
Manualization Documentation of the standards areis encouraged. Band backroom
procedures (i.e. accounting, admin.) need to be documented and put into a manual for regular
review and update for ease of cascading, scaling and auditing.
While procurement practice is fairly controlled by virtue of the authority matrix, the
undocumented standards and policies would eventually be inadequate. Standard supplier
screening / accreditation should be developed and implemented together with the procurement
standards.
Lastly, the Company should consider outsourceoff-shoring the data center. Regardless
of the physical location of the data center, the Company needs to periodically test and evaluate
the security policy implementation as well as perform crisis simulation.
5.2.4. Style
Senior management can be autocratic or participative depending on the situation. When
the situation is urgent and need crisis management, they are autocratic. Otherwise, they
usually ask inputs from the middle / line managers to reach to an agreement or consensus.
There are activities like during annual kickoffs where senior management needs to be
charismatic or transformational to inspire the staff.
94 | Page

Middle managers, especially those in the support teams use bureaucratic and
transactional styles of leadership because their processes are already defined and they can
seldom deviate from these processes.
Conclusion. The current style is adequate. However, the Company should review how
to accelerate leveling up of management and leadership capabilities of the middle managers to
poise for possible ramp up of business operation as well as for succession planning purposes.
The most effective style, at least in terms of building confidence, developing people and
empowering people is the participative style. Bright ideas can sometimes spring from the
people from the line. Line managers should also be transformational to inspire commitment
and full engagement from their staff.
5.2.5. Staff
Solutions has a manpower complement of around 50 with an average turnover rate of
9.8% in the last 5 years.
Training and DevelopmentAs mentioned in the previous sections, the organization is relatively flat. Horizontal
promotions are normal especially for line and middle managers. Promotions in these positions
would oftentimes be in the form of additional line function or role.
The Company provides various learning opportunities as follows:
On-the-job training vis-à-vis Coaching and mentoring.
In-house training and Learning sessions.
External Seminars and conferences like annual conventions by a professional
association, short course seminars and workshops
Membership in professional association like People Management Association of the
Philippines and Actuarial Society of the Philippines
Continuing education programs like short courses offered by the Insurance Institute of
Asia and the Pacific (IIAP)
Financial and study leave incentives for accreditation exams (e.g. Certified Investment
Solicitor, Licensed Agent, Associateship and Fellowship exams for actuaries, etc.)
95 | Page

The Human Resource has identified standard training modules for the employees, more
specifically for the account management personnel. Team leaders are given the
recommendatory authority to identify the skill sets (technical and soft skills) needed for their
people. Individual employees are encouraged to suggest the training and/or classes that they
believe they need for their development. Final recommendation will come from HR with approval
of the management.
One observation is that there is a tendency to set aside training because of the volume
of work.
Conclusion. The training and development program is effective but development
program need to be formalized and policized documented for proper implementation. Strict
implementation is encouraged in order for the training needs of the employees are not
compromised because of work load and team load balancing concerns.
The current training and development is conducive for people who are motivated and
understands his or her value in a flat organization. Sometimes, it is difficult to retain good and
valuable employees if there is no explicit promotion in terms of elevation of title and/or roles.
“Implicit” promotions have to be carefully communicated. Also, with a flat organization, it is
sometimes difficult to see things beyond a possible red circle unless communication of the
career development is clear and timed correctly.
Performance Appraisal / Evaluation
All appointments into the Company are made subject to a probationary period of six
calendar months. After three months a review meeting takes place between the post holder and
his/her direct supervisor or line manager to discuss progress. At the end of the probationary
period, and subject to a satisfactory report by the direct supervisor, employee is notified in
writing that he/she successfully completed his/her probationary period.
Performance evaluation for regularized employees is done annually, with a provision to
do mid-year evaluation, as deemed necessary by the management. All employees self-rate
96 | Page

based on how they believe they have performed for the year against the Key Result Areas and
Objectives planned and agreed upon at the start of the year. Standard rating is provided.
Employees are also given the opportunity to evaluate their competencies vis a vis requirements
for their position or for possible promotion. A simple diagram of approach to performance
appraisal is shown in Figure 5.3.
The immediate supervisors or managers rate their subordinates. A one-on-one interview
with each staff is done to communicate the rating and explain the development plan and
expectations for the coming year. The outcome of the performance appraisal would include the
following:
Evaluation of the employee’s current level of performance
Establishment of the employee’s performance rating
Stated performance expectations and goals for next year
Identification of key performance areas needing improvement or enhancement
Assessment of training and development needs
Specifically for the account management team including the support service team,
forced ranking is done for similar positions like Administrative Clerks, Account Officers, Account
Assistants and Technical Associates, which is done in order to align rating standards across
teams. This is done in a series of meetings by the Account Management Team Leaders
including the Support Services Team Leader. They also do peer review amongst themselves.
The peer review process involves each team lead giving each of the other team leads rating for
each Key Result Area (KRA). The rates are consolidated and presented to all team leads and
each has the opportunity to defend and question each rating, in which time a benchmark activity
and performance for each KRA is agreed upon. Alignment of rates is done until all team leads
agree to all the ratings given to them.
Consolidated ratings are submitted to the senior management for further validation and
approval. Account Leads incorporate their inputs to the ratings of the employees based on their
experience with the how the accounts are managed.
The senior management also does their own self-appraisal and peer review.
97 | Page

Figure 5.3 Solutions Standard Performance Appraisal Program (A Two-Way Approach)
Conclusion. The Company needs to standardize the key performance indicators and
measures of the staff. Quantity and quality measures should be equally present and evaluated.
Performance Appraisal for the company plays a vital role as it does not only discusses the
current performance of the member of staff but it also talks about the necessary actions needed
to be done by that particular employee to improve more regarding his/her performance. In this
way employee is aware what he/she needs to do if she wants to be promoted or if she’s already
on the verge of losing her job.
98 | Page
Identification of key performance areas needing improvement or enhancement
Assessment of training and development needs
Stated performance expectations and goals for next year
Establishment of the employee’s performance rating
Evaluation of the employee’s current level of performance
Outcome
Strategic Alignment including Organization Management
Critical Thinking and Process Management
Interpersonal and Communication Skills
Applied Technical Skills
Learning, Flexibility and Innovation
Business Line ExpertiseCustomer Focus
Competencies
Learning and Supervision
Analysis and Report Preparation
Compliance including Data Management
Business Development
Customer Service and Relationship Management
Key Result Areas
Employee Self-Rating & Supervisor Validation and Assessment

5.2.6. Skills
Solutions’ core competency is the technical expertise of its consultants and well-known
customer service by the whole servicing team. As such, the competencies where the staff are
measured, as shown in Figure 5.3, are the following: 1) Customer Focus, 2) Business Line, 3)
Expertise, 4) Learning, Flexibility and Innovation, 5) Applied Technical Skills, 6) Interpersonal
and Communication Skills, 7) Critical Thinking and Process Management, and 8) Strategic
Alignment and Organization Management. Naturally, there is bias towards Technical Skills and
Critical Thinking.
During performance appraisal period, the staff are required to indicate their development
plans for the competencies where they need improvement.
Conclusion. Recruitment is key in making sure the skills appropriate for the job fits the
new recruit. It is imperative for the HR in charge to take time to craft clear, detailed job
responsibilities and skill requirements, which would give the applicants more clarity and
incentive to apply if they perceive a possible job fit. While the Company values technical skills,
its current structure allows 95% of its staff to be involved in backroom instead of doing high-level
consulting advisory. This should be seriously reviewed. As mentioned in previous sections of
this paper, the Company should seriously consider automating as much processes as possible
in order to slowly shift the structure to “expert”-heavy rather than backroom heavy.
Furthermore, while the rating scale is partial towards technical competencies, the
company should also be able to craft a career managerial path for personnel with excellent
customer service and relationship management skills.
5.2.7. Shared Values and Superordinate Goals
The mission of the Company is regularly communicated during the annual kick-off as
well as during employee orientation. Supporting this mission are the four basic principles which
have become the basis of why the Company was established and how this is currently
managed. These principles are:
Caliber of Consultants. This articulates how Solutions values expertise based on
academic credential, industry experience and reputation.
99 | Page

Professionalism. It is highly important that advice coming from the consultants is free of
any conflicted interests and as such, the Company is managed by its own employees to
maintain this independence.
Creativity and Flexibility. The Company offers unique solutions for each client using
the latest and appropriate technology and industry best practice.
Results-Orientation. Servicing is focused on the results, i.e. the corporate objectives of
the clients. As such, Solutions is present from the get-go until the conclusion of the project.
In addition, each employee is also encouraged to review their own personal goal in life
and evaluate the alignment of these to the company’s. This is done during the annual kick-off,
usually during the time that tactical plans are done.
Conclusion. Articulation of the Company’s values and constant reminder of such to the
employees are helpful. This encourages alignment of the employees to the organization. It is an
unwritten philosophy of the senior management / owners of the company that it wants to
promote the happiness of their employees and as such, it would support their endeavor towards
their life goals, regardless if it is done within Solutions or outside Solutions. It would be more
helpful if specific objectives of the company will be regularly shared as well.
5.3. Company Internal Audit
Management Audit.
Strategic management. The Company has a strategic planning process in place. This
is done three-prong. Every three to five years, the directors of the company convene for a
strategic planning review and creation of new directions for the Company. Annually, the
managing principals of the Company meets to review and update the long-term strategy set by
the board of directors. The last leg is the tactical planning done company-wide involving all
regular employees during the Company’s annual kick-off during the first month of the calendar
year. The planning involves review and update of the existing strategic plan and alignment of
team goals as well as personal goals to the Company goals. The supervised life planning helps
in the alignment and also serves as apt intervention tool, the ultimate objective of which when
done Company-wide is to drive Company performance.
100 | Page

The Company-wide planning fosters employee empowerment. It is also a venue for
employees to affirm their roles in the future of the firm and nurtures their sense of ownership
and responsibility for the firm.
By third quarter of the year, the Company reviews its client portfolio aiming to identify
which of the current accounts are at risk and plan on how to retain them.
During its past strategic planning sessions, the management did some environment scan
by looking at major economic indices like GDP growth and inflation rates. It review growth of
major industries and identified which industries it want and can penetrate. It discussed updates
on regulations and business trends.
During the last two to three strategic planning sessions, Competitive Profile Matrix was
used to evaluate the performance of the organization with respect to the identified competitors.
The senior management identified key critical success factors, which were used to rate the
organization and competitors.
Ansoff model was also used in order to prioritize the strategies for implementation.
Company Objectives and Goals. At the top management level, target revenues and
bottom line are set during the strategic session and reviewed for final presentation to the board
during the board meeting. The targets are reviewed quarterly and presented to the board again
during its 1st quarter meeting. Revenue targets are cascaded down to the Account
Management Team Leader level who are responsible for monitoring and updating the revenue
targets.
On the quality targets, standards are set, and specially customized per client, if
applicable. Regular monitoring schedules and reports are in place. Performance is being
reported during the regular operations meeting where causal review of non-compliance is done
and special interventions are discussed and agreed upon, if necessary for organization-wide
implementation. There is no institutionalized reward or sanction system for compliance or non-
compliance to standards but performance is reviewed annually and incentives are given to
performers.
101 | Page

On the team level, weekly meetings are done for reporting of the status of services of
each account or project. The team meetings cover day to day concerns that are pending,
special transactions that have been handled, learnings, discussion of solutions on the team
level. Decision whether escalation is needed is also done at this level.
Management planning. Broad implementation plan for the identified strategies are
done on the senior management level. The plan involves resource plan (which includes
staffing, IT / MIS support, other resources) needed to implement the strategy. For example, in
the 2012 Strategic Planning, it was discussed how to increase the capacity of each in terms of
positions to be filled, training needed, re-organization needed to come up with a shared services
team. There was a discussion on how to introduce a more customer friendly, and customer-
empowered web system as a competitive advantage.
Tactical plans are usually done during the company’s annual kick-off held every 3rd or
4th week of January. There is no formal written plan required from the teams.
On the team (line) level, the team leaders have a certain lee way to plan on how to
manage their teams. The team leaders are given free hand in planning the individual team
member load in terms of complexity of accounts, with a final approval and confirmation by the
project manager or consultant in charge. Based on the most recent organization climate survey
done in 2013, 54% of the employees agree that their workload is appropriate. There seems to
be a big chunk of the work force that perceived that they are over loaded.
In addition, in terms of quality of the work done by the teams, it is left to the team leaders
to implement the company-wide standards (whether formally written standards or unwritten but
understood standards based on the corporate values and principles). Based on the recent
employee survey, 85% agree that the work processes implemented are efficient however only
42% agree that work is completed on time. It goes back to the work load problem.
Delegation of Authority. Authority is delegated well although managers and team
leaders, including senior management, in some level, still micro-manage the individual tasks of
the employees. Organization wide, an authority matrix was set up, which was presented and
approved by the board of directors. The authority matrix defines specific decision processes and
the level of participation of the different functional roles and hierarchy to complete the process.
102 | Page

Since the organization is small, a manager could be assigned to have multiple functions, e.g. an
account team leader could also be the IT manager, or the Compliance officer, etc. The
established authority matrix is useful in clarifying roles, responsibilities and authority of the
employees, most especially those with cross-functional responsibilities. It also serves as a
guide on how to delegate authority properly.
Organizational structure. The current structure is heavily skewed towards the
backroom support which makes sense as one of the main value propositions of the company is
unparalleled service. However, a review of the current structure may be timely for purposes of
1) focusing resources of business development and marketing lead consultants, and 2) ease of
reporting for fulfillment teams (i.e. account management teams).
The organization structure of the Company has evolved as its strategy and vision
evolved. Since the firm was established until its 19th year in 2013, it already underwent several
reorganizations while maintaining its mission. When the firm started its operations, its
consultants only handle the accounts of their own line expertise. The two major lines are
Employee Benefits (under which are Life Insurance, Accident and Health) and Non-Employee
Benefits (under which are Motor Care Fleet, Property and Casualty Insurance, Marine, etc.).
Each Consultant – expert would have a team of account officers under them that service the
clients. All clerical tasks like billing and ID cards validations are done the account administrative
clerks who are under an Admin. Head. This simple organization structure is shown in Figure
5.4.
Figure 5.4. Solutions Organizational Chart during its early years
103 | Page

However, as clients’ requirements become more sophisticated and the services they
require from the firm span across lines, handling of the account became more cumbersome for
the client. For example, if a client requires insurance for healthcare (under Employee Benefit)
and motorcar fleet (under Non- Employee Benefit), the client would be talking to at least two (2)
consultants and consequently, two account officers.
Moreover, growth in employee benefits servicing has been phenomenal as employers
compete in terms of robustness of their employee benefits. Couple this with the boom of the
Business Processing Operations (BPO) industry, management felt that while the profit margins
for the Non-EB lines are high, growth would be in the EB lines. The consultants were
challenged to cross-sell and learn other lines. As such, the organization structure was
revamped and training scheme for account officers were developed to enable them to handle all
lines.
The concept of “Account Management” was born. The idea is for the client to be able to
be serviced by just one account management team in order to develop professional relationship,
loyalty and confidence. Each account officer is now trained and expected to handle all
insurance requirements of the client he or she handles. As the business grew, the need to
scale was apparent. At some point, team leaders were appointed to lead different account
management teams. The latest organization chart is shown in Figure 5.1 in the previous
section.
The current structure is heavy on backroom support. Business development team is thin
and not currently prioritized in terms of staffing, training and development. The current structure
supports business retention strategy more than business acquisition. Management needs to
review this.
Human Resources
Job specification. The currently filled positions have clear job descriptions and job
specifications. Senior management is currently reviewing and evaluating the job positions.
Based on the most recent employee survey, 84% agree that roles and responsibilities
within the team are understood. The rest have neutral response. However, only 2 of 3
104 | Page

employees perceive that employees of Solutions have the right skill sets to perform their job
functions. This has to be addressed in the recruitment process as well as training and
development.
Employee morale. Based on the most recent organizational climate survey, 77%
believe that morale is high in Solutions with 23% having neutral responses. Figure 5.5 below
shows that responses of employees regarding questions on the company culture and work
environment are most skewed to the right, i.e. high scores of 4 and 5 (agree and strongly agree)
to the positive statements about the corporate culture.
Figure 5.5 Solutions Employees’ Perception on Corporate Culture and Work Environment (Scores: 5 Strongly Agree, 4 Agree, 3 Neutral, 2 Disagree, 1 Strongly Disagree)
Employee turnover and absenteeism. Current turnover is high. There is growing
concern on how to retain employees in key positions (i.e. management trainee material). The
average turnover rate in the last 5 years is 9.8%. For an organization of around 50, this means
around 5 separations per year. Based on DOLE survey, separation rate under finance and
insurance is only 2.28% during the last quarter of 2012. The turnovers are mostly on the first 2
years of stay in the company. Currently, more than 40% of the workforce has completed more
than 5 years with the company and around 12% has completed more than 10 years. In a sense,
the company is able retain its employee force enough to age the workforce.
105 | Page
1 2 3 4 50
5
10
15
20
25
30
Employees speak highly about Solutions.I enjoy being a part of Solutions.The organization values diversity.I feel valued as an employee.Morale is high in Solutions.I feel a sense of belonging to the community.I believe everyone is treated fairly in my team.Employees have a good balance between work and personal life.

Figure 5.6. Solutions’ Employee Profile in terms of Service years (as of end-2012)
There are indications though that a review of the training and development program as
well as the recruitment standards should be done in order to keep key personnel. While the
most recent satisfaction survey is still generally skewed favorable scores, Figure 5.7 below
shows that there are items which are flattening which indicate that employees are not as
satisfied with their current job anymore. This should be a signal to management with regards
turnover expectations.
Figure 5.7. Solutions’ Employee Perception on Job Satisfaction (Scores: 5 Strongly Agree, 4 Agree, 3 Neutral, 2 Disagree, 1 Strongly Disagree)
106 | Page
1 2 3 4 50
5
10
15
20
25
30
I enjoy coming to work.I have a sense of security in my job.I have the opportunity to do what I do best everyday.My workload is appropriate.I would refer others who are seeking employment to Solutions.I plan to be working for Solutions a year from now.

While the company has strict rules in filing vacation leaves and sick leaves, there is a
growing concern regarding absenteeism most especially on the key account officer level.
Unscheduled leaves and increasing number of sick leaves have negative effects on team
capacity. This should partly explain why 46% of employees scored 3 and below when asked if
workload is appropriate.
Organizational Reward and Control Mechanism. Bonuses and Merit increases are
based on the Annual Performance Review, Corporate performance and future expectations.
The system for reward can still be improved. Senior management is currently reviewing the job
competencies which are compensable taking into account corporate philosophy, values and
competitive strategy.
Marketing Audit
Market Segments and Positioning. The Company, specifically its business
development team does not formally follow the STP (segmentation, targeting, positioning)
process in segmenting its target market although efforts have been made to identify which
industries will be approached and which size of the company is acceptable. Solutions has
always maintained its primary target market, which is employers and that account growth
strategy will be to tap the employees of these employers.
In terms of expertise, Solutions consultants are known in the industry. However, there is
a need for the experts to grow in size in order to service more clients. Currently, these experts
are both developing new businesses at the same time overseeing management of each account
closed (i.e. the closers are also the fulfillers). They may be spreading themselves too thin. In
terms of revenue per senior consultant, this is around 30M per senior consultant or 23M per
principal. For the longest time, Solutions, a local company, has battled head on with global
players like Marsh and Aon which are much bigger in size and with stronger network.
Based on total premiums placed for all lines, Solutions’ market share has decreased
from 4.4% in 2007 to 2.8% in 2011. Based on total premiums placed for EB lines, Solutions’
market share decreased from 10.1% in 2007 to 6.4% in 2011. Based on total premiums place
for Accident and Health, Solutions’ market share also decreased from 20% in 2007 to 11% in
2011.
107 | Page

Sales Organization. For the current capacity of the organization, whatever informal
sales team it has had to be adequate, otherwise it could have not gotten new business at all
since it does not have any captured market. The limitation of the current sales / business
development team is its scalability. With the cutthroat competition in the market and aggressive
marketing of the market leaders, the sales team may lack manpower and other resources to
catch a wider net.
Based on the current organizational structure, the “sales team” in Solutions is the
business development team. At any given time, there are only two to three consultants selling
who have concurrent account management / project lead functions. As of end-2012, average
gross revenue per sales people is Php 30 M. Average number of Corporate Account per sales
people is 24. Average revenue from new business per “sales people” in 2012 is around Php 7
to 8 M.
. As mentioned in the section under organization structure, the business development
team in charge of acquiring new business is the same team that oversees the fulfillment of the
service level agreements which limits the team’s capability to sell actively. This is evident in the
client portfolio mix of the organization which currently has a large concentration risk, i.e. 30% of
the revenue stream comes from just one group of company and the top 3 clients could account
for almost 50% of the revenue stream. This concentration risk could be addressed by a more
active sales team bringing in more new business, diluting the concentration risk of the current
portfolio.
Pricing and Quality. For broking services, the average commission rate for the industry
is 10% of whole portfolio. Solutions’ average is lower. There are accounts where the company
is forced to absorb a larger or standard scope of services with reduced commission in order to
protect the current accounts from competition. For services pertaining to retirement plans, this
is currently always above market and is positioned against global players like Towers Watson
and Mercer. For compliance projects, pricing is not acceptable. The Company should consider
packaging its retirement plan services with the broking services.
In terms of quality of service delivery, while the organization is quite known for its
excellent service in the market, it currently experiences lapse in delivering these services on
time. This is an indication that the current manpower loading may not be adequate anymore
108 | Page

since processes are already in place. This also indicates a need for more automation in the
process due to the volume of tasks.
Regularly, the company asks its top clients to write a testimony on the quality of service
delivery by Solutions. A sample testimony is shown in Figure 5.8 below.
Figure 5.8 Sample of Solution’s client’s Testimony on Service Quality
The most recent organizational climate survey also showed how employees perceive the
quality of services delivered to the customers. 92% agree that the company is focused on
delivering high-quality service while 72% agree that the company’s services meet its customer’s
expectations. However only 51% agree that customers regularly feedback to the company
about the good services delivered to them. In addition, only 59% of the employees agree that
services are delivered on time (41% is neutral about this issue while 5% says that services are
not delivered on time).
Other Marketing Activities. The firm does not have a formal promotion, advertising and
publicity strategy. The firm has a static website which has information about the company, its
services, description of its selected projects and network/partners. The website is found in
www.solutions-phils.com.
The only “promotional” collateral the firm has is the corporate profile that it gives out to
its clients and prospects. The firm seldom gives sponsorships in events, which offers
opportunity for advertisement of the company’s services.
109 | Page

In the past, the firm has organized seminars regarding topics about recent employee
benefit trends (e.g. seminar on flexible benefits, retirement benefits, etc.). Historically, these
activities showcase the expertise of the company’s consultants and broaden the network of the
company. However, it has been more than five years since the company has held one.
Budgeting is effective. Solutions has always been conservative in terms of budgeting
and in its actual spending for its operations. What it does is to budget using conservative
estimates of the sales, usually not even taking into account organic growth of its clients. The
budget is reviewed at least quarterly.
Marketing plan lacks action plans and close monitoring of the implementation of these
plans. The company has difficulty in the implementation of its marketing plans because it
currently has only two (2) sales people (business development team) without a support team.
The firm’s marketing managers are the heads of the business development team. They
have no formal training in marketing but they have some experience in selling and developing
business relationships. The educational background of the business development team is
management and science courses. Only one has training in selling. The other has technical
training.
Finance / Accounting Audit
The firm has strong financial ratios most especially its liquidity ratios, profit margins,
Earnings Per Share (EPS) and Return On Equity (ROE) as shown below:
Table 5.3 Key Financial Ratios based on Solutions 2012 Financial Statements (Consolidated)
Liquidity ratios: Current - 5.18; Quick- 4.65
Activity ratios: Asset Turnover- 1.8; AR T/O -104.8
Profitability Ratios: Gross profit margin: 62%; Net profit Margin – 29%; ROE –
239%; EPS – 320+
110 | Page

In 2012, Solutions’ retained earnings is 4 times the total liabilities and 5 times the current
liabilities (40.2M Retained Earnings, 10.5M Total Liabilities, of which 8.3M is current). Solutions
has not incurred any debts yet from any financial institutions. For equity, its capitalization is
currently sufficient (Capital - 10M Broking, 1M Consulting) with a net worth of more 44M
(combined). This is in compliance with the Insurance Commission regulation of 10M in net
worth for existing insurance brokers. In fact, Solutions, if it decides in the future, could re-apply
for its re-insurance license (the requirement is at least 25M net worth). The organization has
more than sufficient working capital. Historical working capital ratios is shown in Table 5.4.
Table 5.4. Solutions Historical Working Capital and Working Capital Ratio (consolidated)
Year Working Capital(in Php Millions)
Working Capital Ratio
2012 34.7 5.182011 26.1 5.832010 18.9 5.03
The Company has no formally written policy on capital budgeting. Any capital budgeting
expense is discussed and approved by the senior management vis-à-vis the Company’s sales
and expense forecast and reported to the Board. The Company’s financials are being reviewed
at least quarterly.
The firm’s president is currently assuming the function of Chief Finance Officer. She is
well trained in Finance. The internal support is an accounting supervisor who is still being
trained for more finance-related responsibilities.
Operations
The most important asset of the Company is its human assets. As such, supply of these
assets should always be sufficient and development should be continuous. Current recruitment
capabilities are not as robust as there is no dedicated recruitment team in the Company. On the
average, it takes the Company 14 working days to fill out the rank and file level and one to two
months to fill supervisor to manager level.
111 | Page

The property and the building where the office resides is owned by the firm. There are
no warehouse facilities. Equipment pertains to the air conditioning units, central servers in the
on-site data center, personal computers in each of the employee’s work stations, other
electronic equipment for productivity like photocopying machines, printers, scanners, etc. All
these have standard replacement cycles and service maintenance cycles. There is no inventory
of goods being sold. Inventory pertains to supplies used and fixed assets acquired by the
company. The firm has a standard for monitoring the inventory of fixed assets.
Solutions’ head office is in Makati where most of the business is, right now. However,
there more dispersal of the businesses, i.e. more office space rising in Taguig, businesses
branching out to the South and major key cities, growth of the Ecozones in the South – Laguna,
Cavite, Cebu, Bacolod, Iloilo and the North – Bulacan, Pampanga, Baguio where the
Company’s presence is absent.
The Company is currently developing its in-house IT team although there might be a
need to hire an IT manager with a formal IT training since this role is being assumed by a
technical person who is concurrently doing account management and business development.
Technology and Information Systems
For the Company’s current service offering and purpose, the present technology support
is adequate and somehow competitive but this can be improved. There is already increasing
clamor of more accessibility of information (information sharing) as well as more stringent
security to protect data confidentiality and data redundancy. If Solutions can address this in the
near future, this could be used as a differentiation strategy.
In terms of budgeting and forecasting, the current sales reporting system is being used
by managers to crunch actual sales data (amount and timing per account) but other information
needed to put in details are crunched separately from different and separate monitoring tools
(outside the current information system). This has to be integrated in the future.
Sales data (invoicing and payment) are recorded as they come. Solutions may need to
review the operations and might need to consider batch updating if and when the volume
requires this.
112 | Page

Other information like client and supplier information are updated (in the database) only
during special occasions when gifts are sent out to the key contact personnel. Regular update
is done separately by the Account Management people in their own client information sheets.
Concerns about the scope of information being captured by the information system and the
timing are discussed during the operations meeting where all functional managers attend.
Currently, the information systems were designed as solution to speed up transactions.
Majority of the users of the information system are on the clerical level. Reports generated by
the system are used by supervisors and managers. However, the system’s capabilities should
be enhanced based on the changing requirements of customers which demand for more
transparent and available data with access to reports and some analytics. Based on client
feedback, Solutions is able to glean at the technology support that is being offered by the
competition to the market vis-à-vis current requirements of the client. Most of those capable to
offer more sophisticated automated solutions, however, are global players. They obtain the IT
tools from their global partners. However, local players may also develop their own solution.
As discussed in previous sections, there is no dedicated Chief Information Officer as this
role is assigned to one manager with other functions. This has to be addressed in the near
future especially when the Company decides for more sophisticated information technology
systems to support its operations and service offerings.
5.4. Key Financial Ratio Analysis 5.4.1. Liquidity Ratios
Table 5.5 Liquidity Ratios of Solutions and Key Competitors
Solutions Key Competitors Key Competitor's
Ave.
Industry Ave.*
2012 2011 2010 Gotuaco (2012)
Lacson (2012)
Howden (2011)**
(2011) (2011)
Current 5.18 5.83 5.03 0.996 1.23 1.12 1.09 3.86Quick 4.67 4.64 3.52 0.962 1.21 0.89 0.99 1.97
Notes:* Industry Average is based on financials of key competitors and benchmarked competitors (global players) which account for around 40% market share, weighted by revenues in 2011** 2012 F/S of Howden is not yet available
113 | Page

Solutions is highly liquid compared to its key competitors and to the rest of the industry.
Overall, the industry seems to have a lot of cash readily available.
Possible Strategy or Action. Since almost 50% of the expenses are in salaries, wages
and benefits, the timing and amount periodically may be projected almost exactly. It is strategic
for Solutions to come up with a cash position policy in order to free up cash for possible
investments that could maximize interest income.
5.4.2. Activity RatiosTable 5.6 Activity Ratios of Solutions and Key Competitors
Solutions Key Competitors Key Competitor'
s Ave.
Industry Ave.*
2012 2011 2010 Gotuaco (2012)
Lacson (2012)
Howden (2011)
(2011) (2011)
Fixed Assets turnover 11.0 13.8 24.5 46.1 2.1 22.4 18.7 38.2Total Assets turnover 1.8 1.9 1.7 0.3 0.1 0.3 0.2 0.9AR turnover 104.8 47.6 41.8 0.4 0.3 0.5 0.4 4.8Average collection period 3.5 7.7 8.7 947.6 1397.0 693.2 1024.9 392.7
Notes:* Industry Average is based on financials of key competitors and benchmarked competitors (global players) which account for around 40% market share, weighted by revenues in 2011** 2012 F/S of Howden is not yet available
Solutions has lower Fixed Assets Turnover as it owns the property where its office is
located. This was a strategic move for the company to prove to the public its commitment to
stay active in the industry and continue its value offering. It was also a practical move in order to
stabilize the Company’s operations. Solutions also owns its own data center where all the data
is housed and stored. This is also a major investment for the company.
Solutions has better turn over ratios than competitors and industry. This could be
attributed also to its policy to only collect the commission income and fees rather than collect
the whole premium payment from the clients. As such, booked account receivables are the
account receivables pertaining to the revenue excluding the portion of the premium which are
due to the insurers and providers.
114 | Page

Even the average collection period is better than key competitors and industry because
of the policy. However, this number (for Solutions), may not show the actual A/R scenario with
the clients. Solution's numbers show only the A/R collection period in collecting the commission
income from the providers as majority of the revenues are from commission income.
Possible Strategy or Action. One option for Solutions is to outsource its Data Center in
order to free up resources which is not its core business. However, this option should be
studied thoroughly especially in handling security issues and data confidentiality issues.
It would also be strategic for Solutions to invest heavily in an integrated IT solution that
has a tool in monitoring both the A/Rs from the client as well as A/Rs from the providers. The IT
solutions should have a facility to come up with a periodic report of all collectibles per client
consolidating all existing lines of business. This could also be used as a differentiation against
going direct to different providers.
5.4.3. Leverage RatiosTable 5.7 Leverage ratios of Solutions and Key Competitors
Solutions Key Competitors Key Competitor's
Ave.
Industry Ave.*
2012 2011 2010 Gotuaco (2012)
Lacson (2012)
Howden (2011)
(2011) (2011)
Debt to total assets ratio 0.19 0.24 0.26 0.89 0.78 0.81 0.82 0.54Debt to equity ratio 0.24 0.45 0.35 8.06 3.51 4.36 5.03 2.42Long term debt to equity ratio 0.05 0.27 0.18 0.09 0.74 0.07 0.29 0.08
Notes:* Industry Average is based on financials of key competitors and benchmarked competitors (global players) which account for around 40% market share, weighted by revenues in 2011** 2012 F/S of Howden is not yet available
Solutions also has very few liabilities, which can be easily paid off because it is cash
rich. It has no long term obligations aside from the retirement plan of its employees which
currently has its own retirement fund. Compared to key competitors and the rest of the Industry,
Solutions benefited from its policy to let the clients pay directly to the providers, doing away with
the liability of remitting collected premiums to the provider. There are only few exceptions to
this policy. Instead, Solutions was able to maximize its collection efforts by also using the
115 | Page

collection arm of the providers. Solutions was also able to avoid booking large liabilities
pertaining to premiums payable to insurers since these go direct to them per Solutions policy.
Possible Strategy or Action. Solutions may use its financial strength as leverage for
future capital infusion requirements, if needed.
5.4.4. Profitability RatiosTable 5.8 Profitability Ratios of Solutions and Key Competitors
Solutions Key Competitors Key Competitor'
s Ave.
Industry Ave.*
2012
2011
2010 Gotuaco (2012)
Lacson (2012)
Howden (2011)
(2011) (2011)
Operating profit margin 41% 28% 24% 6% 31% -22% 1% 24%Net profit margin 29% 14% 8% 5% 33% -7% 6% 18%Return on total assets 53% 27% 15% 1% 5% -3% 1% 28%Return on stockholders' equity 70% 37% 19% 13% 21% -12% 3% 51%
Dividends per share 59.1 72.0110.
0 30.0 8.0 - 8.5 208.1Notes:* Industry Average is based on financials of key competitors and benchmarked competitors (global players) which account for around 40% market share, weighted by revenues in 2011** 2012 F/S of Howden is not yet available
Not all brokers monitor the gross profit margin. A lot do not segregate the direct cost
from the operating expenses. In this industry, direct cost would usually include salaries, wages
and benefits by the servicing personnel and usually this includes senior consultants. Solutions
is outperforming competitors (at least for those who track this). This could mean that
competitors may have higher compensation or higher number of senior consultants / key
personnel.
Solutions has also outperformed key competitors and the industry in terms of operating
profit margin. This could show that Solutions’ operations is as efficient as it gets. For those with
regional presence, cost for travel is around 3 to 5% of sales. Gotuaco has unusually high travel
expense which covers more than 10% of sales. They could be really beefing up their
international alliance. It is also unusual that not all brokers show a separate item for its
marketing expense that includes advertising and promotions. Solutions' marketing expense is
116 | Page

less than 1% of the revenues and even with representation and travel expenses, these amounts
to less than 2% of sales.
Similar to previous discussion, Solution has high asset turnover and consequently, high
ROA because its assets is not bloated with premium receivables from clients which are payable
to the providers.
Solutions has higher ROE than key competitors although it currently has the lowest
capitalization. Key competitors have higher capitalization because they carry both insurance
and reinsurance licenses and as such, they are required by the Insurance Commission to
maintain at least a net worth of Php 25 Million. Solutions, having only an insurance license,
while having a net worth allowing it to also carry a re-insurance license, is only required to
maintain a net worth of Php 10M.
The industry average is weighted towards high dividend paid out by the global players to
its shareholders, usually to the parent company. Amongst the local players, Solutions has
outperformed its competitors.
Possible Strategy or Action. In the long run, it would be strategic for Solutions to invest
in a management training program that would produce future leaders and senior consultants of
the company. With the way the market is growing three to four senior consultants in any given
time may not be enough to build the capacity and expertise that the market needs. Solutions
should at least double the number of consultants in the next two to three years and triple in the
next five to ten years.
Solutions should budget at least 5% of its sales to beef up its marketing activities in
order to capture more clients, especially those which are outside its existing personal network
and create long-term partnerships and strategic alliances with providers what would add value
to its product/value offerings.
Solutions might want to also re-consider carrying a reinsurance license in the future (it
has carried this in the past but dropped it because it is not actively selling this service).
117 | Page
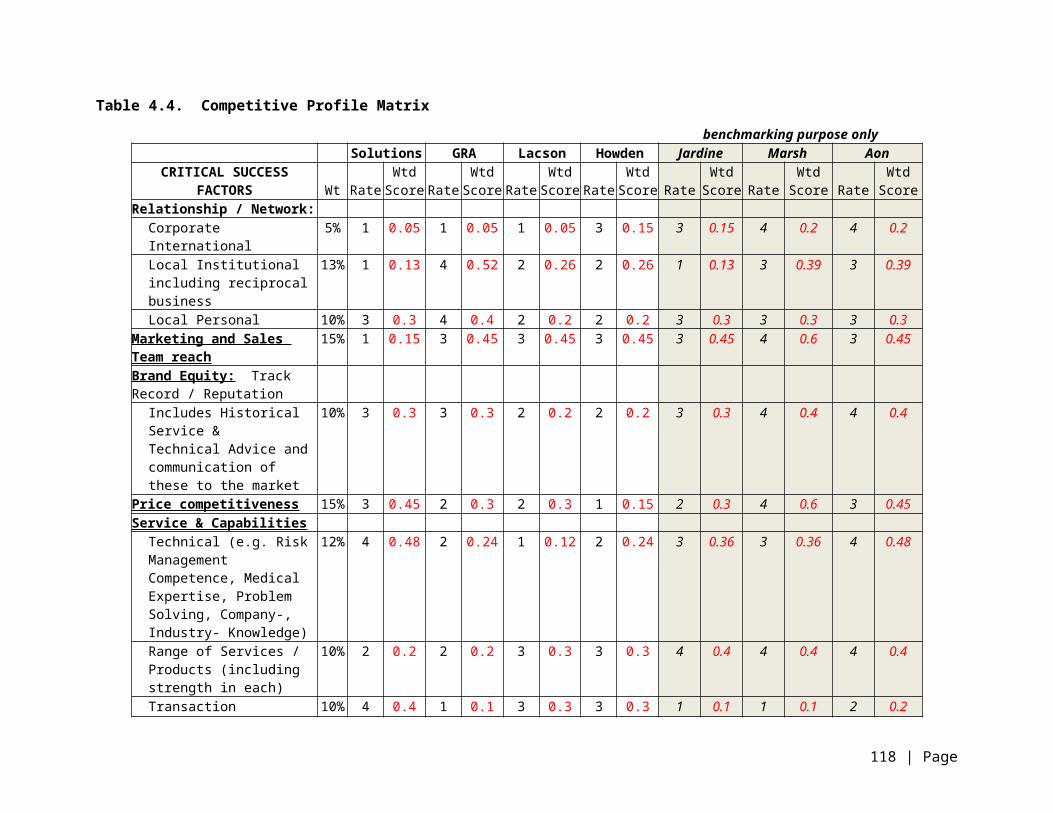
5.4.5. Growth RatesTable 5.9 Year-on-Year Growth of Solutions and Key Competitors
Solutions Key Competitors Key Competitor's
Ave.
Industry Ave.*
2012 2011 2010 Gotuaco (2012)
Lacson (2012)
Howden (2011)
(2011) (2011)
Sales 19% 11% 7% 17% 30% 74% 24% 12%Net income 144% 89% -46% 32% 130% -189% -66% -8%Earning per share 200% 89% -46% 32% 130% -122% -43% -3%Dividends per share -18% -35% 267% 71% 0% na
Notes:* Industry Average is based on financials of key competitors and benchmarked competitors (global players) which account for around 40% market share, weighted by revenues in 2011** 2012 F/S of Howden is not yet available
Solutions sales growth is not as high compared to key competitors despite it being the
most profitable. As shown in the market analysis, Solutions' revenue growth is lagging as the
market is already growing by 17% compounded in the last 5 years. Further analysis of
Solutions client portfolio reveals that revenues from one group of companies (global) comprise
around 30% of its current sales. The situation is similar in the past which makes the revenue
stream volatile due to high concentration risk. This is shown in the growth of net income over
the years.
Possible Strategy or Action. Solutions should invest heavily in the development of its
business development (marketing and sales) team in order to develop new market which is not
vulnerable to global appointments. This new market (most probably the local industries) would
be medium to large sized local companies. Penetration of such markets should dilute the
concentration risk of the current client portfolio of Solutions.
5.5. Internal Factor Evaluation (IFE) 5.5.1. Strength Ratings and Importance Weight
S1. Good Servicing reputation; Weight – 15%; Rating - 4
This is one of the highest in weight. This is a core competency in the service industry
most especially for business where after sales service is active and contact with the clients has
lasting effect and meaning during after sales.
118 | Page

This is a major strength of Solutions as it is reputed to have strong service oriented
processes and people. Base on both providers and clients’ feedback, Solutions is one of the
broker firms (if not only) who is able to administer the plan effectively and really adds on value in
terms of servicing the needs of the clients in collaboration with the providers. Value-added
services that are visible to the clients and providers include audit of all documents, materials
and agreements from both providers and clients. It also include technical advice on policy
provisions, negotiation with the providers for difficult claims and policy terms and conditions.
There was even one MNC client of Solutions which was able to convince global to retain a local
broker because of Solutions servicing capabilities.
S2. Strong technical team (in terms of industry reputation of consultant’s expertise
including availability of technical team); Weight – 15%; Rating - 4
This is one of the highest in weight. This is also a core competency in this industry
where technical advice is ideally the value that is offered and paid for by the clients. The
stronger and more expansive the technical knowledge offerings are, the more it would be easier
to differentiate against the competitors. It should be noted that unlike transactional expertise,
development of technical expertise may not be as easily developed and imitated. Not even full
automation can compete against real people with real talents and know-how.
Solutions’ founders and senior consultants have reputation as experts in the field of
employee benefits, risk management and actuarial consulting. The staff's training are also
geared towards technical training. The training just needs to be policized and formally and
regularly executed. Solutions should also grow the technical team’s capacity through targeted
recruitment.
S3. Presence of Broking and Consulting practice; Weight – 5%; Rating – 3
With flexibility that this gives, not only in pricing but also in service offering, the presence
of these major lines of business could give more value on the service offerings and an as such,
differentiation by the company.
119 | Page

This is just a minor strength of Solutions. While there is expertise by the senior
consultants in a wide range of areas in management, most specially in Human Resources,
Employee Benefits and Risk Management, capacity was not built in order to support large
numbers of clienteles to be able to service concurrent projects.
S4. Market leader in one of the major lines (employee benefits, commercial, individual);
Weight – 5%; Rating – 4
As a market leader, at least in a major line of business, brand equity and reputation is
solidified. This makes it easier to venture to different lines when existing expertise operations
supporting the main line of business is already in place, efficient and effective.
This is a major strength of Solutions as it is one of the market leaders (for local,
independent brokers) in the placement of employee benefit plans like healthcare and life
insurance plans. This makes the company attractive not only in the client perspective but also
in the provider space. Usually, more concessions are made available for large portfolios. The
values of these concessions are transferred to Solution's clients.
S5. With access to global knowledge through international alliance while maintaining
independence; Weight – 5%; Rating – 3
As a local company, affiliation with a global network can be a brand promise. This
indicates broad repository of knowledge and customized innovative advice incorporating local
circumstances.
International alliance is a minor strength which should be improved and maximized in the
near future. Sharing of knowledge and best practices must be regular and possible solutions
and support of these solutions is not yet operationalized.
120 | Page

5.5.2. Weakness Ratings and Importance Weight
W1. Under-utilized international alliances; Weight – 5%; Rating – 2
The value of international alliance for local brokers positioned to capture the local market
is more on branding but valued services and presence locally is more important. However, with
globalization and upcoming ASEAN market integration, there is opportunity to grow the
business through these alliances.
This is a minor weakness. So far, the firm's portfolio has grown even with under-utilized
international alliance. However, there are big opportunities for differentiation in terms of
product/service offering development if these alliances are maximized. Further, business
opportunities could open if international network is also strong specifically for corporations with
global connections.
W2. Absent institutional relationship with under-utilized personal network; Weight – 10%;
Rating - 1
While the choice of a consultant and/or insurance broker is based on trust, the market is
slowly professionalizing the choice of the broker/consultant based on rationalized criteria. As
such, communication of the value proposition and service offerings become more important
than strength of institutional relationship or personal network but current industry practice based
on relationship should still prevail at least in the next 3 to 5 years.
Similar to strength of international alliance, so far, the firm's portfolio has grown even
with the absence of institutional relationship. However, there are big opportunities for
differentiation in terms of product/service offering development if these relationships are
cultivated and developed. Sales reach could also be maximized with the help of institutional
partners.
W3. Weak support for business development team and no formal marketing and sales
plan and activities; Weight – 10% ; Rating – 1
121 | Page

This is assigned with relatively high weight because targeting local companies, which is
bigger in number but smaller in size, would need more physical persons to reach out as well as
careful market segmentation and product/service package development.
This is a major weakness of Solutions. While the organization structure provisions for
marketing staff to support the business development efforts, there is none for the longest time.
As such, there is no regular data mining for possible prospects, no formal market segmentation
and marketing plan is done and executed.
W4. Limited range of services; Weight – 5%; Rating – 2
A wide range of service offerings could give flexibility in terms of packaging services
based on client needs and requirements and thus, client acquisition. Further, it could cement
client relationship when they are more dependent on the service provider.
Currently, the Company's portfolio is composed of more than 90% employee benefits
consulting and/or broking-related revenues and most of these is coming from placements of
healthcare plans of employees. There is a big opportunity to mine the current client pool for
more businesses under different line of businesses but operations is not fully built to address
such requirement and no firm strategy is planned and executed to do this. However, it should
be noted that the current structure is based on the original positioning of the Company as
boutique firm focused on employee benefits services. This positioning gave the Company focus
that it needs while it is growing.
W5. Risky client portfolio mix; Weight – 20%; Rating – 1
This is assigned with the highest weight since internally, concentration risk in terms of
portfolio mix is high. Currently, around 30% of the portfolio is accounted for by just one group of
companies, which is also a global company. There is a big challenge to retain this account or
grow the business by around 20% annually in the next 5 years just to dilute this risk.
This is a major risk to the Company and as such, a major weakness. More than 80% of
the portfolio is composed of accounts from the MNCs. Since there is already a trend for MNCs
122 | Page

doing global appointments, this is a real threat to the Company unless there is a viable move to
affiliate with another strong global player.
W6. Limited geographical scope; Weight – 5%; Rating – 2
This is assigned a minimal weight for now. However, since most of the insurance
brokers and consultants are in Metro Manila, it would be a differentiating factor to actually have
presence in the rest of the key cities of the country in order to capture the growing market in
those areas.
Solutions only operates in Metro Manila. This is just a minor weakness for now since the
current portfolio of the company are all Manila-based and most of these are multi nationals.
However, operationally, it might already be strategic to slowly set up operations in the Central
Luzon and the South starting with the locations where current geographically dispersed clients
are located.
5.5.3. IFE Matrix
The scores in Table 5.10 show that Solution’s rating of 2.40 is consistent with its market
position in the industry. While the company enjoys a good reputation based on the quality of
service delivery, customer service and technical expertise of its consultants who gives relevant
and timely advice, its market share has not grown as much because of its limited capacity to
push its service offering to the market. This is also consistent with its CPM score.
Solutions also has to decide which market it want to focus on growing as currently, it is
not positioned to capture the global players anymore based on its current capacity and strength
of its global affiliation.
To maintain its profitability, protect its current client base and grow it, Solutions must
consider several market penetration and product development strategies and by developing a
strong marketing and sales team and unique service offerings to push to the market. It should
also use its global, regional network and consider alliances with strategic partners to develop
and introduce new product offerings in the market.
123 | Page

Table 5.10. Solutions IFE Matrix Table
Internal Factor Source ImportanceWeight (%)
Firm's Rating(1 to 4)
WeightedScore
Strengths (3 or 4)
S1. Good Servicing reputation Internal Auditand 7S 15% 4 0.60
S2. With strong technical team 7S 15% 4 0.60
S3. Presence of Broking and Consulting practice 7S 5% 3 0.15
S4. Market leader in one of the major lines (employee benefits, commercial, individual)
Internal Audit and 7S 5% 4 0.20
S5. With access to global knowledge through international alliance while maintaining independence.
7S 5% 3 0.15
Weaknesses (1 or 2)
W1. Under-utilized international alliances 7S 5% 2 0.10
W2. Absent institutional relationship with under-utilized personal network 7S 10% 1 0.10
W3. Weak support for business development team and no formal marketing and sales plan and activities
Internal Audit, 7S and
Financials10% 1 0.10
W4. Limited range of services Internal Audit and 7S 5% 2 0.10
W5. Risky client portfolio mix Internal Audit and Financials 20% 1 0.20
W6. Limited geographical scope Internal Audit and 7S 5% 2 0.10
Total 100% 2.40
Ratings: 4 = Major Strength, 3 = Minor Strength, 2 = Minor Weakness, 1 = Major Weakness
The Company should be able to use its technical expertise as leverage and release
sales people to the field to seriously sell its service offering
In order to address limitation on geographical reach, the Company could consider
merger and acquisition with local players already in the target cities where it want to have
presence. It could also utilize any strategic alliance with providers that it can develop.
124 | Page

6. STRATEGY FORMULATION6.1. Strengths, Weaknesses, Opportunities, Threats (SWOT)
6.1.1. Strength – Opportunity Strategies (S.O. Strategies)
Strengths OpportunitiesS1: Good Servicing reputationS2: With strong technical team; senior consultants ‘ expertise are known in the industryS3: Presence of broking and consulting practiceS4: Market leader in one of the major lines (employee benefits, commercial, individual)S5: With access to global knowledge through international alliance
O1: Increase GDP Growth drives more businesses which are the primary purchasors of insurance. These new businesses, in fact, are springing, not only in Metro Manila but in major cities nationwide.O2: Large Presence of SMEs (around 32,000 in NCR / 73,500 Philippines) that could be captured even without global affiliations.O3: Increase in demand for broker services locally due increased activity of Global players (EB consultants and brokers) .O4: Increase in perceived value of employee benefits as HR acquiring and retention tool.O5: Fast growing BPO segment and improving status of the manufacturing industry.
S.O. StrategiesSO1. Invest in developing a strong marketing and sales team of at least 5 consultants
with as much support personnel including at least 2 technical people to ramp up marketing
activities focusing resources in gaining audience with the local industries. Beef up networking
activities like providing seminars targeted to these local industries. Seminars could be co-
organized with established events/seminars organizers. (S1, S2, S4, O1, O2, O3, O5)
SO2. Develop unique service/product packages to cross-sell and upsell to existing
customers. There is a need to strengthen alliances with providers that will support these
packages. (S3, S4, S5, O1, O4)
SO3. Create “global” packages through existing and/or new international networks to
sell to local companies (with decision makers here in the Philippines) who are global or plans to
go global (e.g. RFM, Unilab, etc.). (S3, S5, O3)
S04. Invest on an integrated IT system to address more efficient and simplified processes as
well as security requirements by clients. This should focus on 1) bridging communication
between provider and clients and closing the geographical challenges, 2) accessibility and
availability of information and reports considering growing concerns in data confidentiality and
125 | Page

security, and 3) business intelligence mining for business development and operations planning.
(S1, O2, O5)
6.1.2. Strength – Threat Strategies (S.T. Strategies)
Strengths ThreatsS1: Good Servicing reputationS2: With strong technical team; senior consultants ‘ expertise are known in the industryS3: Presence of broking and consulting practiceS4: Market leader in one of the major lines (employee benefits, commercial, individual)S5: With access to global knowledge through international alliance
T1: A lot of brokers especially the Market Leaders are undercutting commissions would drive commission rates downT2: Increased consolidation of multinational clients.T3: Increased activity of provider direct sales force competes with intermediaries.
S.T. Strategies
ST1. Invest in a regular marketing study in order to periodically review the company’s
value proposition vis-à-vis market needs and trends. As needed, review and revise all marketing
materials and focus communication on increasing emphasis of the value (financial and non-
financial impact) provided by servicing, particularly with respect to on the ground support and
value added technical analysis offerings. (S1, S2, T1, T2, T3)
ST2. Intensify brand-building efforts through advertising, PR events including developing
a more long-term CSR program. (S1, S3, T3)
ST3. Consider merger and/or acquisition with a local broker with strong NEB portfolio,
which also affiliated with top global broker, e.g. Winebrenner and Iñigo affiliated with Willis (3rd
global), or Philinsure affiliated with Peter Gallagher (S4, T2)
6.1.3. Weakness – Opportunity Strategies (W.O. Strategies)
Weakness OpportunitiesW1: Under-utilized international alliancesW2: Absent institutional relationshipW3: Weak support team for business development and no formal marketing plan / activitiesW4: Limited Range of servicesW5: Risky customer portfolio mixW6. Limited geographical scope
O1: Increase GDP Growth drives more businesses which are the primary purchasors of insurance. These new businesses, in fact, are springing, not only in Metro Manila but in major cities nationwide.O2: Large Presence of SMEs (around 32,000 in NCR / 73,500 Philippines) that could be captured even without global affiliations.O3: Increase in demand for broker services locally due increased activity of Global players (EB
126 | Page

consultants and brokers) .O4: Increase in perceived value of employee benefits as HR acquiring and retention tool.O5: Fast growing BPO segment and improving status of the manufacturing industry.
W.O. Strategies
WO1. Create “global” packages through existing and/or new international networks, and
look at potential for supporting Philippine multinationals (e.g. RFM, Unilab, etc.) within the
region with a alliance offering. (W1, O3)
WO2. Form strategic alliances with providers that offer complementary services like Car
Dealers to sell motor car insurance, Stock Brokers to sell Insurance Life policies, Real Estate
Brokers for property insurance, Real Estate Developers for engineering insurance, HR
consultant for EB placements, Travel agents for travel linsurance, or Auditor and CPAs for
retirement plan consulting, Training and Seminar Institutes which hosts seminars and
workshops. (W2, W4, W5, O1)
WO3. Invest in developing a strong marketing and sales team of at least 5 consultants
with as much support personnel including at least 2 technical people to ramp up marketing
activities focusing resources in gaining audience with the local industries. Beef up networking
activities like providing seminars targeted to these local industries. Seminars could be co-
organized with established events/seminars organizers. (W3, W5, O2, O5)
WO4. Develop partnerships with service providers which could add value to the present
service offerings like partnership with pharmaceutical companies or pharmacies, optical shops,
dental clinics, multi-specialty clinics and wellness centers (like discounts, or preferred rates, or
cash-less availments). (W4, O2, O4)
WO5. Design offerings/packages specifically for SMEs, which value one stop shop services.
(W4, W5, O1, O2)
WO6. Increase business development particularly aligned to new product areas with
focus on using EB as a hiring and retention tool like co-branding membership cards with certain
customers and providers (ie. additional benefits outside of standard HMO). (W3, W4, O1, O4,
O5)
127 | Page

WO7. Consider merger and/or acquisition with a local broker with strong NEB portfolio,
which also affiliated with top global broker, e.g. Winebrenner and Inigo affiliated with Willis (3rd
global), or Philinsure afiliated with Peter Gallagher (W4, W5, O3)
W08. Consider setting up a sales branch in Central Luzon and/or in the South where a
lot of economic zones are being developed (Clark, Subic, Laguna or Cavite, Cebu, Bacolod,
Davao) or consider merger and/or acquisition with a local broker firm with presence in these
cities. (W6, O1)
6.1.4. Weakness – Threat Strategies (W.T. Strategies)
Weakness ThreatsW1: Under-utilized international alliancesW2: Absent institutional relationshipW3: Weak support team for business development and no formal marketing plan / activitiesW4: Limited Range of servicesW5: Risky customer portfolio mixW6. Limited geographical scope
T1: A lot of brokers especially the Market Leaders are undercutting commissions would drive commission rates downT2: Increased consolidation of multinational clients.T3: Increased activity of provider direct sales force competes with intermediaries.
W.T. Strategies
WT1. Create “global” packages through existing and/or new international networks, and
look at potential for supporting Philippine multinationals (e.g. RFM, Unilab, etc.) within the
region with a alliance offering. (W1, T2)
WT2. Revisit relationship with providers and consider partnership in creating certain
products targeted for particular market segments, particularly local SMEs and High Net Worth
Individuals. (W2, W5, T3)
WT3. Develop a strong business development team which will revisit current product
pricing strategy to align with current offering levels at an institution business development level.
Focus on providing more value added components into the product mix and unbundling service
offerings. (W3, W4, T1)
128 | Page
WT4. Consider merger and/or acquisition with a local broker with strong NEB portfolio,
which also affiliated with top global broker, e.g. Winebrenner and Iñigo affiliated with Willis (3rd
global), or Philinsure affiliated with Peter Gallagher. (W4, W5, T2)
WT5. Invest on an integrated IT system to address more efficient and simplified
processes as well as security requirements by clients. This should focus on 1) bridging
communication between provider and clients and closing the geographical challenges, 2)
accessibility and availablity of information and reports considering growing concerns in data
confidentiality and security, and 3) business intelligence mining for business development and
operations planning. (W3, W4, T1, T3)
WT6. Consider setting up a sales branch with skeleton support in the South where a lot
of economic zones are being developed (Laguna or Cavite, Cebu, Bacolod, Davao) or consider
merger and/or acquisition with a local broker firm with presence in these cities. (W6, T1, T3)
6.1.5. Grouping of SWOT Strategies
6.1.5.1. Market Penetration Strategies
SO1/WO3. Invest in developing a strong marketing and sales team of at least 5
consultants with as much support personnel including at least 2 technical people to ramp up
marketing activities focusing resources in gaining audience with the local industries. Beef up
networking activities like providing seminars targeted to these local industries. Seminars could
be co-organized with established events/seminars organizers. (S1, S2, S4, O1, O2, O3, O5,
W3, W5)
Solutions has always focused on gaining audience through referrals and most of them
are with large corporations, and incidentally these are Multinationals companies. With its trophy
clients (80% of portfolio are MNCs), Solutions is poised to enter the local market space through
more active marketing of its services. Advertising could be made during a co-sponsored event
like seminar on PFRS for SMEs together with Accounting Compliance for Retirement Plan
valuation or Trends on Employee benefits or Healthcare plan and financing, etc. It would be
beneficial for Solutions to co-organize the events with established organizers like Center for
Global Best Practices (CGBP) or ARIVA in order to maximize their network.
129 | Page

There is a need to build the business development team capacity through hiring
marketing and sales professionals. In the past, business development has always been done
by the principals and senior consultants with just a budget/target in mind. Solutions has to
consider whether it would impose variable incentives for the sales team. Because of the rising
rivalry of competition, market segmentation and targeted marketing activities must already be
done. These activities need a robust support team.
ST1. Invest in a regular marketing study in order to periodically review the company’s
value proposition vis- à -vis market needs and trends. As needed, review and revise all marketing
materials and focus communication on increasing emphasis of the value (financial and non-
financial impact) provided by servicing, particularly with respect to on the ground support and
value added technical analysis offerings . (S1, S2, T1, T2, T3)
There are comments from prospects that when they read the corporate profile of
Solutions at the company’s website, they have a hard time determining what Solutions really is.
It would be easier to sell a service of the company if the value proposition is clear and this is
usually made real clear if it can be quantified. This should be the first order of the day.
ST2. Intensify brand-building efforts through advertising, PR events including developing
a more long-term CSR program. (S1, S3, T3)
Currently, Solutions is banking on word of mouth by current clients and accredited
providers in disseminating its brand equity. With the way the market is expanding, it would be
strategic for Solutions to start advertising its value offerings through development of a market-
sensitive website and through promotions in the events where target market is usually found. It
would also intensify Solution’s brand equity if its CSR program is more compact, long-term and
grassroots-centered with the aim of nation-building unlike its current annual outreach program.
A strategic social entrepreneur partner or corporate partner could be considered.
WO2. Form strategic alliances with providers that offer complementary services like Car
Dealers to sell motor car insurance, Stock Brokers to sell Insurance Life policies, Real Estate
Brokers for property insurance, Real Estate Developers for engineering insurance, HR
consultant for EB placements, Travel agents for travel insurance, or Auditor and CPAs for
130 | Page

retirement plan consulting, Training and Seminar Institutes which hosts seminars and
workshops. (W2, W4, W5, O1)
Since Solutions has little to none Sales team, it would be beneficial for it to have
strategic alliances with institutional partners which would multiply its “sales force” through them
without having to build a very large sales force by itself. With a favorable forecast on the
economic growth in the future, there is a market for individuals with high net worth and SMEs
which could be captures through these alliances. Solutions just have to strike a mutually
beneficial agreement for this collaboration in order to preserve its values and reputation as well
as intellectual assets.
6.1.5.2. Product Development Strategies
SO3 / WO1 / WT1. Create “global” packages through existing and/or new international
networks to sell to local companies (with decision makers here in the Philippines) who are
global or plans to go global (e.g. RFM, Unilab, etc.). (S5, O3) / (W1, O3) / (W1, T2)
In anticipation of the ASEAN Economic Community in 2015 and its possible effect to the
globalization or regionalization plans of the local companies, it is a good time for Solutions to
finally sit down with its regional network (RNA) and collaborate on how to package a “regional”
or “global” insurance plans especially for employee benefits and sell this to the local companies
going regional/global. The idea is to package plans that can be supported anywhere in the
ASEAN or eventually globally. For global package, Solutions could tap Abelica Global. The key
here is that the decision makers would be local, i.e. selling is outbound since Solutions cannot
(for now) compete with inbound selling, i.e. global appointments where decisions are made
outside the Philippines.
SO2. Develop unique service/product packages to cross-sell and upsell to existing
customers. There is a need to strengthen alliances with providers that will support these
packages. (S3, S4, S5, O1, O4)
Since over 80% of Solutions portfolio is MNCs, which is very vulnerable to global
appointments and most probably in favor of global competitors, it would be strategic for
131 | Page

Solutions to increase the client’s dependency on their advice through cross-selling other
products of value to the clients like a motor car insurance or property insurance for their
individual employees with preferred fleet rate and favorable paying scheme. Solutions could
also develop in-house wellness packages (spa, annual check-up, discounts in optical shops,
etc.) through strategic partnerships with these providers.
WO4. Develop partnerships with service providers which could add value to the present
service offerings like partnership with pharmaceutical companies or pharmacies, optical shops,
dental clinics, multi-specialty clinics and wellness centers (like discounts, or preferred rates, or
cash-less availments). (W4, O2, O4)
As briefly mentioned in SO2, Solutions could develop a “loyalty card” for its clients
through partnerships with service providers. The cards may be co-branded with the corporate
client (i.e. logo of Solutions and Corporate client is shown in the card) for stronger branding and
value to the clients. Solutions need to explore acceptable deals with these service providers
that is both mutually beneficial. Solutions need to consider the cost of doing this (on top of
printing of cards). Several “packages” that could be developed and offered to clients depending
on the amount of placement.
WO5. Design offerings/packages specifically for SMEs, which value one stop shop
services (W4, W5, O1, O2)
Solutions can use its technical and business development team to brainstorm with
providers (especially healthcare, life and property insurers) to make a special package only for
Solutions to sell and targeted to SMEs. Solutions could consider 1) EB package covering
healthcare, life and personal accident insurance and retirement package, 2) Business package
that covers, CGL, Fire, Motor car and Appraisal, 3) Wealth package that covers individual life
insurance and mutual funds package.
WO6. Increase business development particularly aligned to new product areas with
focus on using EB as a hiring and retention tool like co-branding membership cards with certain
customers and providers (i.e. additional benefits outside of standard HMO). (W3, W4, O1, O4,
O5)
132 | Page
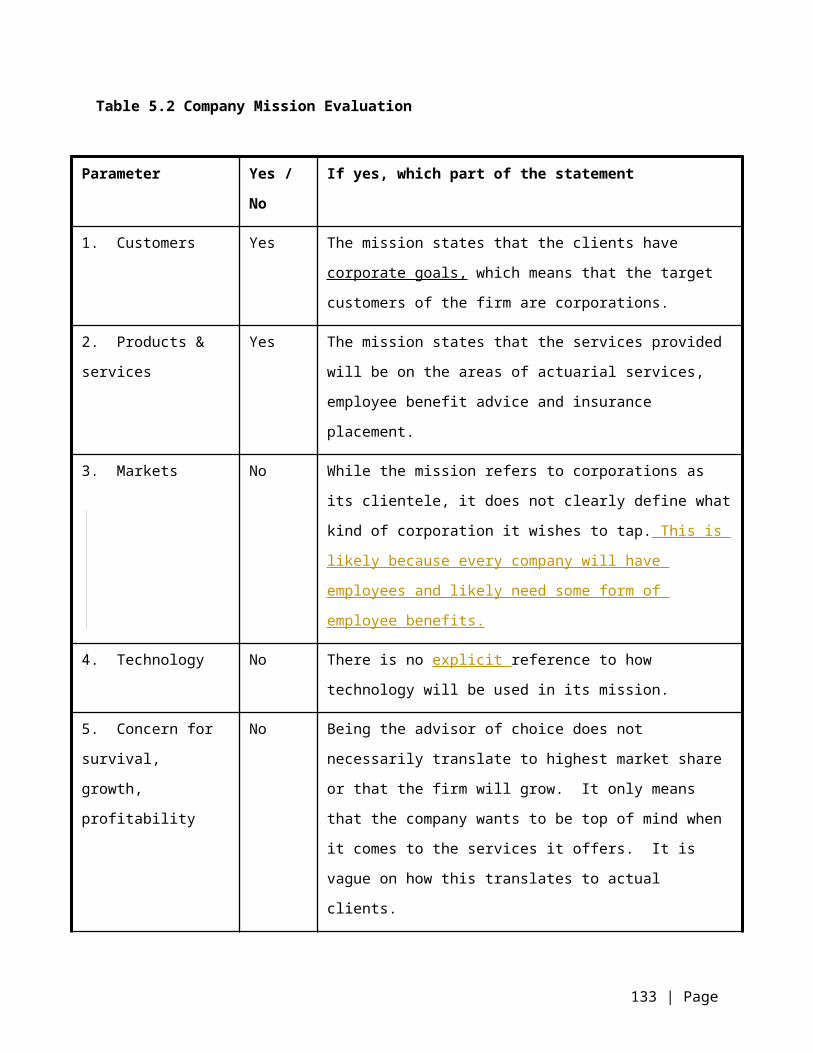
Solutions currently has a Third Party Administration service. Solutions could enhance this
offering through talking to the major banks to arrange for a paperless and check-less
transactions when settling claims. A cost-effective deal could be arranged with a promise of
volume portfolio. Similarly, WO4 strategy may be packaged accordingly and used as a
retention tool if also positioned as Corporate branding for the client.
WT2. Revisit relationship with providers and consider partnership in creating certain
products targeted for particular market segments, particularly local SMEs and High Net Worth
Individuals. (W2, W5, T3)
Solutions can use its technical and business development team to brainstorm with
providers (especially healthcare, life and property insurers) to make a special package only for
Solutions to sell and targeted to SMEs and High Net Worth individuals.
WT3. Develop a strong business development team which will revisit current product
pricing strategy to align with current offering levels at an institution business development level.
Focus on providing more value added components into the product mix and unbundling service
offerings. (W3, W4, T1)
Another differentiation strategy is to veer away from the common commission based
revenue stream. This could be done by packaging the broking end-to-end services to smaller
scopes to empower the clients to choose which scope of services they want to pay for. With
this, valuable insights on client preferences and needs may be mined to study for future product
development and adjustments on the operations.
SO4/WT5. Invest on an integrated IT system to address more efficient and simplified
processes as well as security requirements by clients. This should focus on 1) bridging
communication between provider and clients and closing the geographical challenges, 2)
accessibility and availability of information and reports considering growing concerns in data
confidentiality and security, and 3) business intelligence mining for business development and
operations planning. (W3, W4, T1, T3)
133 | Page

As more and more companies go paperless, and Service Level Agreements become
more stringent, it is crucial for Solutions to an integrated IT solution that could streamline
processes and give more value to the client in terms of consolidating pertinent information and
reports, easier liaising between client and providers. The solution could also be a tool to mine
customer preferences, prospects, etc.
6.1.5.3. Market Development Strategies
WO8/WT6. Consider setting up a sales branch with skeleton operations in the South
where a lot of economic zones are being developed (Laguna or Cavite, Cebu, Bacolod, Davao)
or consider merger and/or acquisition with a local broker firm with presence in these cities. (W6,
O1) / (W6, T1, T3)
Around 55% of SME establishments are situated outside Metro Manila. For Medium
enterprises alone, this translates to more than 200 thousand employees outside Metro Manila.
It would be easier to reach out to the market when Solutions has presence there. Solutions
could consider building branches or sales office in Central Luzon or down south or
acquire/merge with a broker firms already there. Currently, top local firms with presence in the
South are Lacson and Lacson and Philinsure.
6.1.5.4. Horizontal Integration Strategies
ST3 / WO7 / WT4. Consider merger and/or acquisition with a local broker with strong
NEB portfolio, which also affiliated with top global broker, e.g. Winebrenner and Inigo affiliated
with Willis (3rd global), or Philinsure affiliated with Peter Gallagher (S4, T2) / (W4, W5, O3) /
(W4, W5, T2)
Even if the strategy will be focused on penetrating the local market, Solutions still need
to protect its current portfolio, more than 80% of which are MNCs. As such, it would still be
strategic for Solutions to intensify its global network. However, since Solutions value
proposition included global knowledge but with independence in advice, Solutions may only tap
networks of independent brokers like Willis and Peter Gallagher. These top global broker
networks, however, already have representatives in the Philippines. Solutions could either push
134 | Page

for them to change representatives (which is hard to do unless the value proposition is
compelling) or consider merger and/or acquisition of these Philippine representatives.
Also, these local brokers have rich portfolio in the Non-EB lines while Solutions is strong in EB
lines. Together, the range of services and capabilities would be richer and stronger.
WO8 / WT6. Consider setting up a sales branch in Central Luzon or in the South where
a lot of economic zones are being developed (Laguna or Cavite, Cebu, Bacolod, Davao) or
consider merger and/or acquisition with a local broker firm with presence in these cities. (W6,
O1) / (W6, T1, T3)
Around 55% of SME establishments are situated outside Metro Manila. For Medium
enterprises alone, this translates to more than 200 thousand employees outside Metro Manila.
It would be easier to reach out to the market when Solutions has presence there. Solutions
could opt to build branches down south or acquire/merge with a broker firms already there.
Currently, top local firms with presence in the South are Lacson and Lacson and Philinsure.
6.2. Strategic Positioning & Action Evaluation (SPACE)
Figure 6.1 Solutions SPACE Matrix
9
8
7 x =
6 y =
5
4
3
2
1
-7 -6 -5 -4 -3 -2 -1 0 1 2 3 4 5 6 7
-1
-2
-3
-4
-5
-6
-7
-8
-9
2.55
3.55
FS
ES
CA IS
Conservative Aggressive
Defensive Competitive
6.2.1.
135 | Page
6.2.2. Internal Strategic Position
FINANCIAL STRENGTH (FS) – Rating: +1 (worst) to +6 (best) RATINGSLiquidity: Solutions has better liquidity than the competitors as Solutions benefits from its policy to let the clients pay directly to the providers, doing away with the liability of remitting collected premiums to the provider and carrying premiums which are not its real assets. Solutions' liquidity and quick ratios are 5.18 and 4.67 (2012), respectively compared to key competitors which are just above 1:1 on the average. It's working capital in 2012 was more than Php 34M.
6
Net worth: Solutions has net worth of more than Php 44M complying to the minimum requirement of the Insurance Commission of Php 10M for existing insurance brokers. The rest of the key competitors have net worth of more than 60M while global players have net worth of more than 100M. Most of these have higher net worth because they also carry re-insurance license which requires them to have at least Php 25M net worth per IC rule.
5
ROE: Solutions has ROE of 37% and 70% 2011 and 2012 while key competitors have 3% on the average in 2011 and 17% in 2012. This is almost at par with ROEs of global players.
6
Ease of Exit: Solutions has allied products and services (i.e. TPA, consulting) of its own. The customers, network, process, tools and systems for these customized products are already in place. This makes it attractive to potential acquirers who want to enter these areas. Purchasing Solutions is a quick way to enter that space.
6
Total 23Average 5.75
COMPETITIVE ADVANTAGE (CA) – Rating: -1 (best) to -6 (worst)Customer service: Technical Advice and Service Quality: Solutions founders and senior consultants have reputation as experts in the field of employee benefits, risk management and actuarial consulting. Solutions is also reputed to have strong service oriented processes and people. There are anecdotal evidences coming from both providers and clients about how Solutions, as one of the brokers (if not only) who is able to administer the plan effectively and really adds on value in terms of servicing the needs of the clients in collaboration with the providers. There was even one MNC client of Solutions which was able to convince global to retain a local broker because of Solutions servicing capabilities.
-1
Information Technology: Solutions has in-house developed systems customized for it unique organization structure and operations. However, there is a need to review and enhance these systems in order to comply with new trends in data management as well as security. Solutions also has to explore providing clients integrated tools for data accessibility and communication.
-3
Strength and sustainability of network (global, institutional, personal): Solutions, for the longest time, has no formal marketing and sales team and yet it has breached top ten in EB and A&H lines after 10 years in the industry with players with at least 10 to 20 years head start. This is a testimony of the strength of its personal relationship. However, this needs to be backed up with more formal marketing activities for sustainability.
-4
Range of services / expertise: Solutions has focused on consulting with regards human resources and particularly employee benefits including placement of insurance aligned to such lines as shown in its portfolio which 99% EB lines. It is slowly developing its TPA offering.
-4
Strategic location and Market/Sales Reach: Solutions has located itself in the Makati area where most of the businesses are. However, key competitors have already branched out in key cities nationwide to capture the growing business in these cities.
-4
Total -16Average -3.20
136 | Page

6.2.3. External Strategic Position
ENVIRONMENTAL STABILITY (ES) – Rating: -1 (best) to -6 (worst)GDP Growth and Economic Stability: Future market growth would be rapid as more businesses are set up due to economic activities. GDP was 6.6% in 2012 and is forecasted to maintain around 6% for the next 2 years. (ADB, 2013) This would mean more opportunities for insurance coverage that could be brokered by the insurance brokers.
-1
Technological changes: There is growing reliance on technology not only in terms of efficiency in the internal operations to address challenges in fulfilment of service level agreement that is becoming steeper, but also in the way marketing and selling of the services as well as sharing of information between all stakeholders.
-4
Global integration of procurement: There is growing trend for an integrated global procurement decision which makes global positioning strategic in terms of capturing global clients which also includes Filipino companies going global.
-4
Large number of establishments in the Philippines: In 2011 alone, there are more than 820 thousand establishments all over the Philippines. In the employee benefits business, there is value in giving advice as to how employers could pay for and/or cover the benefits of their employees and be more competitive. On the non-employee benefits area, there is value in providing advice on risk management most especially the appropriateness on when and what to cover through insurance.
-2
Total -11Average -2.2
INDUSTRY STRENGTH (IS) – Rating: +1 (worst) to +6 (best)Regulated by Insurance Commission: The regulating body (IC) gives credibility to the industry as IC enforces standards, requirements and Corporate Governance compliance by all licensed brokers.
6
Profit Potential: Insurance broking and consulting does not require huge capital investment in terms of fixed assets except for the capital requirement imposed by the Insurance Commission. As such, profit potential is high. Based on 2011 experience and companies comprising 40% of market share, net profit margin is averaging more than 15%. Traditional revenue stream for pure insurance placement has no exposure to claims from the customers/policyholders, passing on all risk to the HMO provider and insurers.
4
Entry barrier: The capitalization requirement imposed by the IC poses as an entry barrier to the industry (20M for insurance or re-insurance broker license, 50M for insurance and re-insurance licenses). IC also requires certain number of years of professional experience for the soliciting agent/s representing the broker firm.
5
Growth potential: As the insurance industry grows driven by more economic activities, there is always opportunities for the brokers to offer their value added service in terms of advice, placement and after sales customer service to the consumers. Broker placement is around 34% of the total market premiums (IC Report 2011). This shows opportunity to get a larger share of the market. However, brokers need to differentiate in its value offering in order to compete with the direct sales and agents of HMOs and insurance providers. While premium grew by 17% (CAGR) in the last 5 years, growth in commission is lower (11% 5-year CAGR).
4
Competitive intensity: The industry is consolidating. Despite the growth in premiums placed and commissions. Licensed insurance brokers shrunk from 93 in 2007 to just 63 in 2011 based on the IC Report. Licensed re-insurance brokers were recorded at 23 in 2011 from 32 in 2007. Market share of the market leaders is growing, eating up the market share of the small players. Top 3 market share grew from 25% in 2007 to 41% in 2011; Top 10 from 65% to 75% while total of all firms ranked below 10 shrunk from 35% to 25%.
4
Total 23Average 5.75
X - Axis (CA average + IS average) 2.55Y- Axis (ES average + FS average) 3.55
137 | Page

Based on the analysis, Solutions falls within the Aggressive profile quadrant. Solutions is
in an excellent position to use its internal strengths to take advantage of external opportunities,
overcome internal weaknesses and avoid external threats. Feasible strategies are market
penetration, market development, product development, backward integration, forward
integration, horizontal integration, diversification, or a combination strategy. (David, 2009)
6.3. Boston Consulting Group (BCG) Matrix Table 6.1 Solutions’ Market Share of Main Business Lines relative to Market Leaders
NameBrand Market
ShareLeader Market
ShareRelative
Market ShareBrand Sales
ValueBrand % Profit
ShareMarket Growth
RateA&H 11.79% 32.50% 36.26% 65.66 77.6% 21.8%Life 4.55% 15.82% 28.77% 4.28 8.5% 17.9%Motor Vehicle 0.26% 28.28% 0.91% 1.26 4.8% 10.8%Fire 0.02% 22.01% 0.09% 0.21 0.7% 16.7%Inland Marine 0.11% 34.93% 0.33% 0.10 0.5% 10.4%TPA* 10.00% 50.00% 20.00% 4.00 7.0% 20.0%
Notes:1. Total Market Size was adjusted to exclude Banks2. Similarly, Market Leader also exclude Banks3. *Figures for TPA are estimates. This is relatively new service offering by Solutions.4. The rest of the products have negligible sizes.
Figure 6.2 Solutions BCG Matrix
0.00%20.00%40.00%60.00%80.00%100.00%-50.0%
-40.0%
-30.0%
-20.0%
-10.0%
0.0%
10.0%
20.0%
30.0%
40.0%
50.0%
Motor Vehicle A&H Fire Life Inland Marine TPARelative Market Share
Mar
ket G
row
th
138 | Page
Question MarkStar
DogCash Cow

Question Mark to Stars: A&HThis is Solutions' best long-run opportunity for growth and profitability. Investment
should be focused on this service to strengthen capabilities and plans for differentiation and
strengthen dominance in the market.
Strategies: Backward, Forward or Horizontal Integration, market penetration, market
development, product development
Question Marks: Life, TPA, Motor Vehicle, Fire and the rest of the linesSince the industry is growing in double figures, it is understandable that most of the
product lines' growth is also on the upside. Specifically for Solutions, it has bigger chunk of the
pie for Life insurance placements (which come from corporate clients) and TPA (mostly
adjudication and management of claims for top up medical benefits provided by corporate client
to their employees).
Strategies: Market Penetration, Market Development, Product Development, Divestiture.
Solutions would have bigger market share in all product lines if market size is limited to
local players, which is not part of a conglomerate (i.e. set-up as backward integration strategy of
the parent company). If this is done, A&H, Life and TPA would probably be the stars and the
rest are question marks.
6.4. Grand Strategy Matrix6.4.1. FUTURE MARKET GROWTH: RAPID
Future market growth would be rapid as more businesses are set up due to economic
activities. GDP was 6.6% in 2012 and is forecasted to maintain around 6% for the next 2 years
(ADB, 2013). In the past, the insurance broker industry has outperformed GDP by more than
10%. Analysis of the market growth as of end 2011 alone shows that the total premiums placed
by insurance brokers grew by 17% compounded annually for the past 5 years because of more
than 25 to more than 30% growth in 2011 and 2010, respectively. In Employee benefit lines,
Accident and Health is seen to grow at an annual rate of 22% (CAGR) in the last 5 years. This
should come from rapid hiring or employees by growing industries, specifically the Business
Processing Operations and some manufacturing industries. In the non-employee benefit lines,
aviation insurance and engineering insurance tops the growth with a 5-year CAGR of 42% and
139 | Page

24% respectively. New entrants in the airline industry and real estate growth are driving the
growth of these two lines.
However, while the total premium volume is growing in double digits, the growth in
commissions (revenue) is slower. Growth in total commissions is 11% on the average for the
last 5 years. It is declining in the last 3 years (14%, 12%, 11% for years 2009-2011). This
indicates that the market is highly competitive. In fact, market study shows that the industry is
consolidating. Market leaders are gaining market shares while small players share has gone
down. In the last five years, the number of licensed brokers has gone down from 93 to barely 63
in number. Entry of new players is not as rampant as a new regulation on steeper capitalization
requirement was imposed by the Insurance Commission.
There is current trend of consolidating activities of global / multinational firms that
creates volatility in the client portfolio of local players when global appointments of global broker
are done. On the other hand, there are opportunities for local players partnering with local
companies who are poised to go regional because of the ASEAN Economic Community in 2015
and eventually global. Most of the insurance placement and consulting activities are in Metro
Manila while key cities outside Metro Manila are currently growing. There are also opportunities
for the value offering outside Metro Manila.
6.4.2. COMPETITIVE POSITION OF THE FIRM: WEAK
Solutions is currently in a weak competitive position, with a market share of 3%. It is
ranked 12 in terms of premiums placed although there is only one local player (Gotuaco Del
Rosario) in the top 10 which has no captive market due to vertical integration strategy by the
parent company. The rest are either global players, subsidiaries of banks or conglomerates.
Solutions also lags behind in terms of market growth with a 5-year CAGR of 7.7%
compared to market's 17%. Gotuaco's market share of 4% has been growing 14.1% (5-Year
CAGR) in the last 5 years. Jardine also has 3% market share with growth of 13.2 in the last 5
years. However, in terms of financials, Solutions seems to have the strongest ratios and
highest profit ratios with net profit margin of 29% compared to 19% average of the key
competitors in 2012 and 14% over 6% un 2011.
140 | Page

This is also supported by the Company's relatively average EFE and IFE scores of 2.25
and 2.40, respectively. The CPM analysis shows that the company falls behind the top key
competitor Gotuaco in terms of total score (2.12 versus 2.69), specifically in strength of
institutional networks, sales and marketing reach, and range of services offered to the market.
Figure 6.3 Solutions Grand Strategy Matrix
Quadrant II Quadrant I1. Market development 1. Market development2. Market penetration 2. Market penetration3. Product development 3. Product development4. Horizontal integration 4. Forward integration5. Divestiture 5. Backward integration6. Liquidation 6. Horizontal integration
7. Concentric diversification
Quadrant III Quadrant IV1. Retrenchment 1. Concentric diversification2. Concentric diversification 2. Horizontal diversification3. Horizontal diversification 3. Conglomerate diversification4. Conglomerate diversification 4. Joint ventures5. Divestiture6. Liquidation
SLOW MARKET GROWTH
RAPID MARKET GROWTH
WEAK COMPETITIVE
POSITION
STRONG COMPETITIVE
POSITION
Solutions
The company falls under the second quadrant, with a rapid market growth but a weak
competitive position. The recommended strategies are market development, market
penetration, product development, horizontal integration, divestiture, and liquidation.
141 | Page
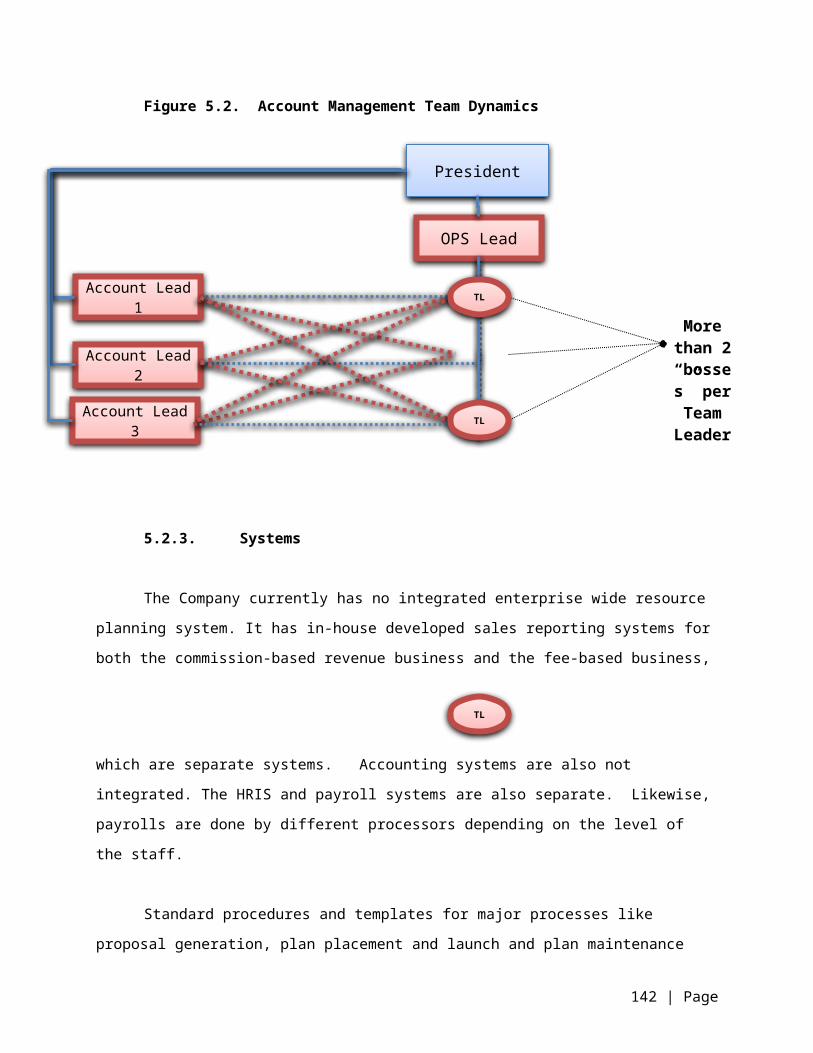
6.5. GE McKinsey ModelTable 6.2 Industry Attractiveness
FactorImportance
Weight
A&H Life Motor Car Fire TPAOther Non-
Life/EB Lines
RateWtd.
Score RateWtd.
Score RateWtd.
Score RateWtd.
Score RateWtd.
Score RateWtd.
Score
1 Industry Growth 25% 4 1.00 3 0.75 2 0.50 3 0.75 3 0.75 1 0.25
2 Industry Size 25% 4 1.00 3 0.75 2 0.50 4 1.00 2 0.50 4 1.00
3 Competition Intensity 15% 2 0.30 3 0.45 3 0.45 2 0.30 4 0.60 1 0.15
4 Industry Profitability 25% 2 0.50 4 1.00 3 0.75 3 0.75 3 0.75 4 1.00
5 Industry Life Cycle 10% 4 0.40 2 0.20 2 0.20 3 0.30 4 0.40 2 0.20
Total Score 100% 3.20 3.15 2.40 3.10 3.00 2.60Attractiveness rating scale: 1-least attractive, 2-attractive, 3-more attractive, 4-most attractive
Table 6.3 Brand Unit Strength
FactorImportance
Weight
A&H Life Motor Car Fire TPAOther Non-
Life/EB Lines
RateWtd.
Score RateWtd.
Score RateWtd.
Score RateWtd.
Score RateWtd.
Score RateWtd.
Score1 Brand Equity: Track
Record, Reputation, Historical Service
10% 4 0.40 4 0.40 3 0.30 2 0.20 4 0.40 1 0.10
2 Service Capabilities - Technical, Product/service portfolio, Transaction competence, Innovation
31% 4 1.24 4 1.24 3 0.93 3 0.93 4 1.24 2 0.62
3 Strength of Network 22% 3 0.66 3 0.66 1 0.22 1 0.22 2 0.44 1 0.224 Marketing & sales
capability / reach 17% 1 0.17 1 0.17 1 0.17 1 0.17 1 0.17 1 0.17
5 Price competitiveness 20% 4 0.80 4 0.80 4 0.80 2 0.40 4 0.80 2 0.40
Total Score 100% 3.27 3.27 2.42 1.92 3.05 1.51 Competitiveness rating scale: 1-major weakness, 2-minor weakness, 3-minor strength, 4-major strength
Figure 6.4. Solutions’ GE McKinsey Matrix
1.0 2.0 3.0 4.0 1.00
2.00
3.00
4.00
A&HLifeMotor CarFireTPAOthers
Business Unit Strength
Indu
stry
Att
racti
vene
ss
142 | Page
The current position of each line of business is as follows:
A&H Strong Business Unit, Attractive industry Life Strong Business Unit, Attractive industry Motor Car Average Business Unit, Average industryFire Weak Business Unit, Attractive industry TPA Strong Business Unit, Attractive industryOthers Weak Business Unit, Average industry
The desired future position of each line of business is as follows:
A&H Stronger positioning with growth in market shareLife Stronger positioning with growth in market shareMotor Car Stronger positioning, with growth in market shareFire Stronger positioning, with growth in market shareTPA Stronger positioning, with growth in market shareOthers Short to mid-term: Need not sell aggressively but maintain portfolio for
clients and/or prospects who need the product or serviceLong term: Can build more capacity (like train personnel) if future market becomes attractive in order to sell aggressively.
Strategies: To grow the business lines, recommended strategies are market penetration,
product development, market development and horizontal integration. For weak positioned
offerings, while the strategy is not to sell actively, these can be packaged together with stronger
products.
6.6. Internal-External (IE) Matrix Table 6.4 Solutions IE Matrix
TOTAL IFE RATING2.40
TOTAL EFE
RATING
2.25
IFE = 2.40EFE= 2.35
Strong3.0 to 4.0
Average2.0 to 2.99
Weak1.0 to 1.99
High3.0 to 4.0 I II III
Medium2.0 to 2.99 IV V VI
Low1.0 to 1.99 VII VIII IX
Based on the matrix, Solutions should hold and maintain its strategies. Recommended
strategies are market penetration and product development.
143 | Page

6.7. Summary of Strategies Table 6.5 Solutions: Summary of Strategies
STRATEGY OPTIONS SWOT SPACE IE GRAND BCGGE
McKinsey TOTALForward Integration x x 2Backward Integration x x 2Horizontal Integration x x x x x 5Market Penetration x x x x x x 6Market Development x x x x x 5Product Development x x x x x x 6Concentric Diversification x 1Conglomerate Diversification 0Joint Venture 0Retrenchment / Cost Improvement 0Divestiture x x 2Liquidation x 1
Based on different strategy formulation tools, the most pertinent and suitable strategies
for Solutions are: Market Penetration, Product Development, Market Development and possibly
Horizontal Integration techniques.
Based on the QSPM (refer to Table 6.6), the most attractive strategies are market
penetration and product development techniques. With the kind of industry and market as well
as the situation of the company, both market penetration and product development may be
implemented simultaneously upon building the capacity requirements of such strategies.
6.8. Quantitative Strategic Planning Matrix (QSPM)
Based on the recommended strategy techniques in Table 6.5, there are 14 possible
strategies (4 market penetrations, 8 product development, 2 market development and horizontal
integrations strategies) identified from the SWOT analysis that may be considered and
evaluated for their attractiveness in terms of feasibility and ease of implementation. These 14
strategies were grouped into four cohorts (grouped by similarity of strategies) and forced ranked
within its cohort. Table 6.6-A, -B, -C and -D show the rates within cohort 1 (market penetration
strategies), cohorts 2 and 3 (product development strategies), and cohort 4 (market
development and horizontal integration strategies), respectively.
144 | Page

Table 6.6-A. Quantitative Strategic Planning Matrix (QSPM) – Cohort 1 (Market Penetration Strategies)Market Penetration
KEY FACTORS
SO1/W03. Invest in developing a strong marketing and sales team of at least 5 consultants with as much support personnel including at least 2 technical people to ramp up marketing activities focusing resources in gaining audience with the local industries. Beef up networking activities like providing seminars targeted to these local industries. Seminars could be co-organized with established events/seminars organizers. (S1, S2, S4, O1, O2, O3, O5, W3, W5)
ST1. Invest in a regular marketing study in order to periodically review the company’s value proposition vis-à-vis market needs and trends. As needed, review and revise all marketing materials and focus communication on increasing emphasis of the value (financial and non-financial impact) provided by servicing, particularly with respect to on the ground support and value added technical analysis offerings. (S1, S2, T1, T2, T3)
ST2. Intensify brand-building efforts through advertising, PR events including developing a more long-term CSR program. (S1, S3, T3)
WO2. Form strategic alliances with providers that offer complementary services like Car Dealers to sell motor car insurance, Stock Brokers to sell Insurance Life policies, Real Estate Brokers for property insurance, Real Estate Developers for engineering insurance, HR consultant for EB placements, Travel agents for travel insurance, or Auditor and CPAs for retirement plan consulting, Training and Seminar Institutes which hosts seminars and workshops. (W2, W4, W5, O1)
WEIGHT AS TAS AS TAS AS TAS AS TAS
Opportunities•O1: Increase GDP Growth drives more businesses which are the primary purchasors of insurance. These new businesses, in fact, are springing, not only in Metro Manila but in major cities nationwide.
10% 4 0.4 2 0.2 3 0.3 1 0.1
•O2: Large Presence of SMEs (around 32,000 in NCR / 73,500 Philippines) that could be captured even without global affiliations.
15% 4 0.6 2 0.3 3 0.45 1 0.15
•O3: Increase in demand for broker services locally due increased activity of Global players (EB consultants and brokers) .
10% 4 0.4 2 0.2 3 0.3 1 0.1
•O4: Increase in perceived value of employee benefits as HR acquiring and retention tool.
15% 0 0 0 0 0 0 0 0
•O5: Fast growing BPO segment and improving status of the manufacturing industry.
5% 4 0.2 2 0.1 3 0.15 1 0.05
Threats•T1: A lot of brokers especially the Market Leaders are undercutting commissions would drive commission rates down 15% 0 0 0 0 0 0 0 0•T2: Increased consolidation of multinational clients. 20% 3 0.6 4 0.8 2 0.4 1 0.2•T3: Increased activity of provider direct sales force competes with intermediaries. 10% 4 0.4 1 0.1 2 0.2 3 0.3
145 | Page

Total Weight 100%Market Penetration
KEY FACTORS
SO1/W03. Invest in developing a strong marketing and sales team of at least 5 consultants with as much support personnel including at least 2 technical people to ramp up marketing activities focusing resources in gaining audience with the local industries. Beef up networking activities like providing seminars targeted to these local industries. Seminars could be co-organized with established events/seminars organizers. (S1, S2, S4, O1, O2, O3, O5, W3, W5)
ST1. Invest in a regular marketing study in order to periodically review the company’s value proposition vis-à-vis market needs and trends. As needed, review and revise all marketing materials and focus communication on increasing emphasis of the value (financial and non-financial impact) provided by servicing, particularly with respect to on the ground support and value added technical analysis offerings. (S1, S2, T1, T2, T3)
ST2. Intensify brand-building efforts through advertising, PR events including developing a more long-term CSR program. (S1, S3, T3)
WO2. Form strategic alliances with providers that offer complementary services like Car Dealers to sell motor car insurance, Stock Brokers to sell Insurance Life policies, Real Estate Brokers for property insurance, Real Estate Developers for engineering insurance, HR consultant for EB placements, Travel agents for travel insurance, or Auditor and CPAs for retirement plan consulting, Training and Seminar Institutes which hosts seminars and workshops. (W2, W4, W5, O1)
WEIGHT AS TAS AS TAS AS TAS AS TAS
Strengths•S1: Good Servicing reputation 15% 4 0.6 2 0.3 3 0.45 1 0.15•S2: With strong technical team; senior consultants ‘ expertise are known in the industry. 15% 4 0.6 2 0.3 3 0.45 1 0.15•S3: Presence of broking and consulting practice 5% 4 0.2 2 0.1 3 0.15 1 0.05•S4: Market leader in one of the major lines (employee benefits, commercial, individual) 5% 4 0.2 2 0.1 3 0.15 1 0.05S5: With access to global knowledge through international alliance 5% 4 0.2 2 0.1 3 0.15 1 0.05
Weaknesses•W1: Under-utilized international alliances 5% 0 0 0 0 0 0 0 0•W2: Absent institutional relationship 5% 3 0.15 1 0.05 2 0.1 4 0.2•W3: Weak support team for business development and no formal marketing plan / activities 10% 4 0.4 2 0.2 3 0.3 1 0.1•W4: Limited Range of services 10% 3 0.3 2 0.2 1 0.1 4 0.4•W5: Risky customer portfolio mix 20% 4 0.8 3 0.6 1 0.2 2 0.4•W6. Limited geographical scope 5% 0 0 0 0 0 0 0 0
Total Weight 100%
Sum Total Attractiveness Score 6.05 3.65 3.85 2.45
146 | Page

AS score: 1=not acceptable, 2=possibly acceptable, 3=probably acceptable, 4=most acceptable.
Table 6.6-B. Quantitative Strategic Planning Matrix (QSPM) – Cohort 2 (Product Development 1)Product Development
KEY FACTORS
SO3 / WO1 / WT1. Create “global” packages through
existing and/or new international networks to sell
to local companies (with decision makers here in the Philippines) who are global or plans to go global (e.g.
RFM, Unilab, etc.). (S5, O3, W1, T2)
WO5. Design offerings/packages
specifically for SMEs, which value one stop shop
services (W4, W5, O1, O2)
SO2. Develop unique service/product packages to cross-sell and upsell to
existing customers. There is a need to strengthen alliances with providers that will support these
packages. (S3, S4, S5, O1, O4)
WT2. Revisit relationship with providers and consider
partnership in creating certain products targeted for particular market segments, particularly
local SMEs and High Net Worth Individuals. (W2, W5,
T3)
WEIGHT AS TAS AS TAS AS TAS AS TAS
Opportunities•O1: Increase GDP Growth drives more businesses which are the primary purchasors of insurance. These new businesses, in fact, are springing, not only in Metro Manila but in major cities nationwide.
10% 2 0.2 3 0.3 4 0.4 1 0.1
•O2: Large Presence of SMEs (around 32,000 in NCR / 73,500 Philippines) that could be captured even without global affiliations.
15% 1 0.15 4 0.6 2 0.3 3 0.45
•O3: Increase in demand for broker services locally due increased activity of Global players (EB consultants and brokers) .
10% 3 0.3 2 0.2 4 0.4 1 0.1
•O4: Increase in perceived value of employee benefits as HR acquiring and retention tool.
15% 3 0.45 2 0.3 1 0.15 4 0.6
•O5: Fast growing BPO segment and improving status of the manufacturing industry.
5% 4 0.2 2 0.1 3 0.15 1 0.05
Threats•T1: A lot of brokers especially the Market Leaders are undercutting commissions would drive commission rates down 15% 0 0 0 0 0 0 0 0•T2: Increased consolidation of multinational clients. 20% 4 0.8 3 0.6 2 0.4 1 0.2•T3: Increased activity of provider direct sales force competes with intermediaries.
10% 3 0.3 4 0.4 2 0.2 1 0.1
Total Weight 100%
147 | Page

148 | Page

Product Development
KEY FACTORS
SO3 / WO1 / WT1. Create “global” packages through
existing and/or new international networks to sell
to local companies (with decision makers here in the Philippines) who are global or plans to go global (e.g.
RFM, Unilab, etc.). (S5, O3, W1, T2)
WO5. Design offerings/packages
specifically for SMEs, which value one stop shop
services (W4, W5, O1, O2)
SO2. Develop unique service/product packages to cross-sell and upsell to
existing customers. There is a need to strengthen alliances with providers that will support these
packages. (S3, S4, S5, O1, O4)
WT2. Revisit relationship with providers and consider
partnership in creating certain products targeted for particular market segments, particularly
local SMEs and High Net Worth Individuals. (W2, W5,
T3)
WEIGHT AS TAS AS TAS AS TAS AS TAS
Strengths•S1: Good Servicing reputation 15% 2 0.3 3 0.45 4 0.6 1 0.15•S2: With strong technical team; senior consultants ‘ expertise are known in the industry. 15% 4 0.6 3 0.45 2 0.3 1 0.15•S3: Presence of broking and consulting practice 5% 2 0.1 3 0.15 4 0.2 1 0.05•S4: Market leader in one of the major lines (employee benefits, commercial, individual) 5% 1 0.05 2 0.1 4 0.2 3 0.15S5: With access to global knowledge through international alliance 5% 4 0.2 2 0.1 3 0.15 1 0.05
Weaknesses•W1: Under-utilized international alliances 5% 4 0.2 2 0.1 3 0.15 1 0.05•W2: Absent institutional relationship 5% 0 0 0 0 0 0 0 0•W3: Weak support team for business development and no formal marketing plan / activities 10% 0 0 0 0 0 0 0 0•W4: Limited Range of services 10% 1 0.1 3 0.3 4 0.4 2 0.2•W5: Risky customer portfolio mix 20% 1 0.2 4 0.8 2 0.4 3 0.6•W6. Limited geographical scope 5% 0 0 0 0 0 0 0 0
Total Weight 100%
Sum Total Attractiveness Score 4.15 4.95 4.4 3
AS score: 1=not acceptable, 2=possibly acceptable, 3=probably acceptable, 4=most acceptable.
149 | Page

150 | Page

Table 6.6-C. Quantitative Strategic Planning Matrix (QSPM) – Cohort 3 (Product Development 2)Product Development
KEY FACTORS
WO4. Develop partnerships with service providers which
could add value to the present service offerings like
partnership with pharmaceutical companies
or pharmacies, optical shops, dental clinics, multi-
specialty clinics and wellness centers (like discounts, or preferred
rates, or cash-less availments). (W4, O2, O4)
WO6. Increase business development particularly aligned to new product
areas with focus on using EB as a hiring and retention
tool like co-branding membership cards with certain customers and providers (ie. additional
benefits outside of standard HMO). (W3, W4, O1, O4,
O5)
WT3. Develop a strong business development team which will revisit current product pricing strategy to align with
current offering levels at an institution business
development level. Focus on providing more value
added components into the product mix and
unbundling service offerings. (W3, W4, T1)
SO4/WT5. Invest on an integrated IT system to
address more efficient and simplified processes as well as
security requirements by clients. This should focus on
1) bridging communication between provider and clients and closing the geographical
challenges, 2) accessibility and availability of information and reports considering growing
concerns in data confidentiality and security, and 3) business
intelligence mining for business development and
operations planning. (S1, W3, W4, O2, O5, T1, T3)
WEIGHT AS TAS AS TAS AS TAS AS TAS
Opportunities•O1: Increase GDP Growth drives more businesses which are the primary purchasors of insurance. These new businesses, in fact, are springing, not only in Metro Manila but in major cities nationwide.
10% 4 0.4 3 0.3 1 0.1 2 0.2
•O2: Large Presence of SMEs (around 32,000 in NCR / 73,500 Philippines) that could be captured even without global affiliations.
15% 3 0.45 1 0.15 2 0.3 4 0.6
•O3: Increase in demand for broker services locally due increased activity of Global players (EB consultants and brokers) .
10% 2 0.2 3 0.3 1 0.1 4 0.4
•O4: Increase in perceived value of employee benefits as HR acquiring and retention tool.
15% 3 0.45 4 0.6 1 0.15 2 0.3
•O5: Fast growing BPO segment and improving status of the manufacturing industry.
5% 3 0.15 2 0.1 1 0.05 4 0.2
Threats•T1: A lot of brokers especially the Market Leaders are undercutting commissions would drive commission rates down 15% 2 0.3 1 0.15 3 0.45 4 0.6•T2: Increased consolidation of multinational clients. 20% 0 0 0 0 0 0 0 0•T3: Increased activity of provider direct sales force competes with intermediaries.
10% 3 0.3 2 0.2 1 0.1 4 0.4
Total Weight 100%
151 | Page
Product Development
KEY FACTORS
WO4. Develop partnerships with service providers which
could add value to the present service offerings like
partnership with pharmaceutical companies
or pharmacies, optical shops, dental clinics, multi-
specialty clinics and wellness centers (like discounts, or preferred
rates, or cash-less availments). (W4, O2, O4)
WO6. Increase business development particularly aligned to new product
areas with focus on using EB as a hiring and retention
tool like co-branding membership cards with certain customers and providers (ie. additional
benefits outside of standard HMO). (W3, W4, O1, O4,
O5)
WT3. Develop a strong business development team which will revisit current product pricing strategy to align with
current offering levels at an institution business
development level. Focus on providing more value
added components into the product mix and
unbundling service offerings. (W3, W4, T1)
SO4/WT5. Invest on an integrated IT system to
address more efficient and simplified processes as well as
security requirements by clients. This should focus on
1) bridging communication between provider and clients and closing the geographical
challenges, 2) accessibility and availability of information and reports considering growing
concerns in data confidentiality and security, and 3) business
intelligence mining for business development and
operations planning. (S1, W3, W4, O2, O5, T1, T3)
WEIGHT AS TAS AS TAS AS TAS AS TAS
Strengths•S1: Good Servicing reputation 15% 3 0.45 2 0.3 1 0.15 4 0.6•S2: With strong technical team; senior consultants‘ expertise are known in the industry. 15% 1 0.15 3 0.45 4 0.6 2 0.3•S3: Presence of broking and consulting practice 5% 2 0.1 3 0.15 4 0.2 1 0.05•S4: Market leader in one of the major lines (employee benefits, commercial, individual) 5% 3 0.15 1 0.05 2 0.1 4 0.2S5: With access to global knowledge through international alliance 5% 1 0.05 3 0.15 2 0.1 4 0.2
Weaknesses•W1: Under-utilized international alliances 5% 0 0 0 0 0 0 0 0•W2: Absent institutional relationship 5% 4 0.2 3 0.15 1 0.05 2 0.1•W3: Weak support team for business development and no formal marketing plan / activities 10% 3 0.3 2 0.2 4 0.4 1 0.1•W4: Limited Range of services 10% 4 0.4 3 0.3 1 0.1 2 0.2•W5: Risky customer portfolio mix 20% 0 0 0 0 0 0 0 0•W6. Limited geographical scope 5% 4 0.2 2 0.1 1 0.05 3 0.15
Total Weight 100%
Sum Total Attractiveness Score 4.25 3.65 3 4.6
AS score: 1=not acceptable, 2=possibly acceptable, 3=probably acceptable, 4=most acceptable.
152 | Page

Table 6.6-D. Quantitative Strategic Planning Matrix (QSPM) – Cohort 4 (Market Development and Horizontal Integration)
Market Development / Horizontal Integration
Horizontal Integration
KEY FACTORS
WO8/WT6. Consider setting up a sales branch with skeleton operations in the South where a lot of
economic zones are being developed (Laguna or Cavite, Cebu, Bacolod, Davao) or consider merger
and/or acquisition with a local broker firm with presence in these cities. (O1, W6, T1, T3)
ST3 / WO7 / WT4. Consider merger and/or acquisition with a local broker with strong NEB portfolio, which also affiliated with top global broker, e.g. Winebrenner and
Inigo affiliated with Willis (3rd global), or Philinsure affiliated with Peter Gallagher (S4, T2, O3, W4, W5)
WEIGHT AS TAS AS TAS
Opportunities•O1: Increase GDP Growth drives more businesses which are the primary purchasors of insurance. These new businesses, in fact, are springing, not only in Metro Manila but in major cities nationwide.
10% 2 0.2 3 0.3
•O2: Large Presence of SMEs (around 32,000 in NCR / 73,500 Philippines) that could be captured even without global affiliations.
15% 3 0.45 2 0.3
•O3: Increase in demand for broker services locally due increased activity of Global players (EB consultants and brokers) .
10% 2 0.2 3 0.3
•O4: Increase in perceived value of employee benefits as HR acquiring and retention tool.
15% 0 0 0 0
•O5: Fast growing BPO segment and improving status of the manufacturing industry.
5% 3 0.15 2 0.1
Threats•T1: A lot of brokers especially the Market Leaders are undercutting commissions would drive commission rates down 15% 0 0 0 0•T2: Increased consolidation of multinational clients. 20% 1 0.2 3 0.6•T3: Increased activity of provider direct sales force competes with intermediaries.
10% 2 0.2 3 0.3
Total Weight 100%
153 | Page

Market Development / Horizontal Integration
Horizontal Integration
KEY FACTORS
WO8/WT6. Consider setting up a sales branch with skeleton operations in the South where a lot of
economic zones are being developed (Laguna or Cavite, Cebu, Bacolod, Davao) or consider merger
and/or acquisition with a local broker firm with presence in these cities. (O1, W6, T1, T3)
ST3 / WO7 / WT4. Consider merger and/or acquisition with a local broker with strong NEB portfolio, which also affiliated with top global broker, e.g. Winebrenner and
Inigo affiliated with Willis (3rd global), or Philinsure affiliated with Peter Gallagher (S4, T2, O3, W4, W5)
WEIGHT AS TAS AS TAS
Strengths•S1: Good Servicing reputation 15% 2 0.3 3 0.45•S2: With strong technical team; senior consultants ‘ expertise are known in the industry. 15% 2 0.3 3 0.45•S3: Presence of broking and consulting practice 5% 2 0.1 3 0.15•S4: Market leader in one of the major lines (employee benefits, commercial, individual) 5% 3 0.15 4 0.2S5: With access to global knowledge through international alliance
5% 0 0 0 0
Weaknesses•W1: Under-utilized international alliances 5% 0 0 0 0•W2: Absent institutional relationship 5% 0 0 0 0•W3: Weak support team for business development and no formal marketing plan / activities
10% 0 0 0 0•W4: Limited Range of services 10% 2 0.2 3 0.3•W5: Risky customer portfolio mix 20% 2 0.4 3 0.6•W6. Limited geographical scope 5% 3 0.15 1 0.05
Total Weight 100%
Sum Total Attractiveness Score 3 4.1
AS score: 1=not acceptable, 2=possibly acceptable, 3=probably acceptable, 4=most acceptable.
154 | Page

Based on the scores from the QSPM, the top five (5) most attractive strategies are the
following:
Rank CohortGeneral Strategy Strategy Score
1 1 Market Penetration
SO1/W03. Invest in developing a strong marketing and sales team of at least 5 consultants with as much support personnel including at least 2 technical people to ramp up marketing activities focusing resources in gaining audience with the local industries. Beef up networking activities like providing seminars targeted to these local industries. Seminars could be co-organized with established events/seminars organizers. (S1, S2, S4, O1, O2, O3, O5, W3, W5)
6.05
2 2 Product Development
WO5. Design offerings/packages specifically for SMEs, which value one stop shop services (W4, W5, O1, O2)
4.95
3 3 Product Development
SO4/WT5. Invest on an integrated IT system to address more efficient and simplified processes as well as security requirements by clients. This should focus on 1) bridging communication between provider and clients and closing the geographical challenges, 2) accessibility and availability of information and reports considering growing concerns in data confidentiality and security, and 3) business intelligence mining for business development and operations planning. (S1, W3, W4, O2, O5, T1, T3) 4.60
4 2 Product Development
SO2. Develop unique service/product packages to cross-sell and upsell to existing customers. There is a need to strengthen alliances with providers that will support these packages. (S3, S4, S5, O1, O4)
4.40
5 3 Product Development
WO4. Develop partnerships with service providers which could add value to the present service offerings like partnership with pharmaceutical companies or pharmacies, optical shops, dental clinics, multi-specialty clinics and wellness centers (like discounts, or preferred rates, or cash-less availments). (W4, O2, O4)
4.25
7. STRATEGIC OBJECTIVES & RECOMMENDED STRATEGIES7.1. Recommended Vision and Mission Statement
7.1.1. Recommended Vision Statement
“We want to be an incubator of the most innovative solutions and best minds in risk
management, employee benefits and insurance placement in the Philippines –through
developing our people and through our collaboration with our clients and providers.
We want to be the preferred consultants of the employers, organizations and individuals
that recognize the value of expertise and quality service.
155 | Page

We want to lead in quality of service and business relationships at all times.
We will be the preferred partner of the top five (5) reputable insurance and healthcare
providers by year 2020.”
The revised above is bolder and affirms the Company’s confidence in its expertise and
caliber of consultants. The timeline makes the goal more real and establishes a sense of
urgency. The first three vision statements reveal how the Company plans to achieve its
mission, i.e. to be the top of mind choice consultant, to be known for its excellent service, and to
develop its stakeholders.
Evaluation:
Parameter Yes / No Why
Does it clearly answer the question: What do we want to become?
Yes For it customers: as a preferred consultantsFor its people and partners: as incubator of most innovative solutions and best mindsAlso – to be the leader in quality of service and business relationship and to consequently be the top broker of the top providers
Is it concise enough yet inspirational?
Yes The vision inspires the employees of the firm as it describes how the Company values its employees – it wants to incubate the best minds. The best minds to give advice.This is also inspirational to the customers as well, as it states how it values its clients through collaboration and education.
Is it aspirational? Yes The firm aims to be the advisor of choice. It aspires to be always ahead in terms of knowledge and wisdom to come up with the most innovative solutions (in terms of technology, process, acceptability).
Does it give clear indication as to when it should be attained?
Yes It gives the company 7 years (until 2020) to build a strong portfolio partnering with equally strong providers.
7.1.2. Recommended Mission Statement
“Our mission is to help our clients in achieving their corporate goals and enhancing their
business by providing advice and services of the best possible value based on strong local
156 | Page

expertise with global support in the areas of: risk management, human resources and insurance
placement with focus on employee benefits. We are the preferred partner leading the industry
in terms of innovation, quality service, long-term alliance and profitability.”
Evaluation:
Parameter Yes / No
If yes, which part of the statement
1. Customers Yes The mission states that the clients have corporate goals, which means that the target customers of the firm are corporations.
2. Products & services Yes The mission states that the services provided will be on the areas of risk management, human resources and insurance placement with focus on employee benefits.
3. Markets Yes The revised mission statement already describes which market segment the Company wishes to tap. The implication is that the Company will not involve itself on a price war if cost alone is the criteria of the customer. The aim of the Company is to deal with no-nonsense customers who would appreciate the value of the advice provided to them by professional consultants.
4. Technology Yes The statement mentions that it will lead the industry in innovation. The use of technology is already implicit.
5. Concern for survival, growth, profitability
Yes The statement mentions that the company will also lead the industry in profitability. Further, it mentions long-term alliance which addresses its commitment for the survival of its business enterprise and its business partners.
6. Philosophy Yes “… services of the best possible value”. The standard, value and expectation for excellence are clear.
7. Self-concept Yes The mission statement affirms that the basis of its value proposition is its strong local expertise with global support, pointing to its global network.
8. Concern for employees Yes The mission, by saying that the value is delivered by “strong local experts” gives testament to how it sees and values its employees. This is strengthened by the vision statement saying that the firm will be the incubator of minds.
9. Concern for nation building Yes In a way, the Company addresses the concept of nation building by making it their mission to “enhance the business” of their clients and affirming that it will stay profitable.
157 | Page

7.2. Recommended Strategic Objectives
The following are the recommended strategic objectives of the Company:
To grow sales revenue by 13% to 15% p.a. in the next 5 years, and 19% to 20% p.a.
afterwards (i.e. achieve sales revenue of around 150M by 2018 and 370M by 2023) while
maintaining its net profit margin or around 15% to 20%. Exposure for any one client should
be maintained at 10% as a long-term objective. This is to be executed by expanding product
portfolio offerings, market reach (regional/international) and existing customer coverage.
(Financial)
This is a critical objective for company in order to address its client portfolio
concentration risk (currently one group of companies contributed to 30% of total revenues),
which is one of its major weaknesses and at the same time grow its sales as fast or faster than
the industry is growing.
Table 7.1 Target Sales in the next 10 years (in Php Millions)
Period 0 1 2 3 4 5 6 7 8 9 10Year 2013 2014 2015 2016 2017 2018 2019 2020 2021 2022 2023Projected Revenue 80.9 93.4 106.8 122.8 144.6 166.3 193.4 222.5 261.1 310.8 370.1
Renewal 82.5 95.2 108.8 125.1 147.4 169.5 197.2 226.7 266.1 316.8New Business 10.9 11.6 13.9 19.5 18.9 24.0 25.3 34.4 44.7 53.2Growth 15.3% 14.4% 15.0% 17.8% 15.0% 16.3% 15.0% 17.4% 19.1% 19.1%
Revenue from group with highest concentration
25.0 26.0 27.0 28.1 29.2 30.4 31.6 32.9 34.2 35.6 37.0
Concentration exposure 31% 28% 25% 23% 20% 18% 16% 15% 13% 11% 10%
To maintain market share (around 2.2% based on estimated 2013 revenues and market
size) by creating and developing go to market strategies involving better use of partnerships
and channels, brand building and A&P initiatives and working with allied industries.
(Marketing)
The continuing economic growth (especially spreading this nationwide) and growing
sophistication and competition in employee benefits as well as technological advances open up
158 | Page

a lot of opportunities for product and service innovations as well as capturing existing and new
markets. The results will definitely tie up with the financial objectives. This should also address
a lot of identified weaknesses and complement the company’s strengths.
To strengthen and increase capacity and expertise of all teams. Emphasis shall be placed in
key areas like: sales and marketing teams to support new go to market activities and
expanded market coverage, information technology to enhance capabilities that take
advantage of new technology, and business development to support the development of
products and services. (People)
This should reinforce the strengths of the company especially its technical expertise.
Since the core competency is the selling of advice, in order to differentiate from the market, an
off the rack training program should be supplemented heavily by in-house and customized
formal training and development program. High retention, especially with technical personnel,
which includes marketing and sales, should be targeted. This strategy should also address
capacity building to support the marketing objectives.
7.3. Recommended Strategies
Based on the QSP Matrix, the most attractive strategies for the Company come from
market penetration and product development strategies. The top 3 strategies are listed below.
SO1/W03. Invest in developing a strong marketing and sales team of at least 5
consultants with as much support personnel including at least 2 technical people to ramp up
marketing activities focusing resources in gaining audience with the local industries. Beef up
networking activities like providing seminars targeted to these local industries. Seminars could
be co-organized with established events/seminars organizers. (S1, S2, S4, O1, O2, O3, O5,
W3, W5)
People properly trained in executing go to market activities have to be developed in
order to fulfill market expansion objectives. Continuous cycle of creation, review and
enhancement is necessary to keep the product portfolio mix up to date. The necessary people
need to be up to speed with the basics of the current offerings, competitive offerings, offerings
159 | Page

of allied industries/partners/downstream participants and various market specific
customer/upstream participant needs and expectations.
Awareness of the company's brand is still pretty low and there is room to improve this.
With better awareness, more opportunities can be generated and reputational recall can
improve existing closure rates. Insights from PR activities in corporate events will allow us to
create appropriate and customized offerings (more relevant) targeting our areas of market
expansion which include SMEs and HNW individuals. Together with these allied industries,
Solutions can offer enhanced products and services aligned to their common customer base
better utilizing their combined strengths.
WO5. Design offerings/packages specifically for SMEs, which value one stop shop
services (W4, W5, O1, O2)
Targeted offerings to SMEs are strategic in growing revenues as they are a key growth
area in the economy who are increasingly considering Solutions' products as total
compensation enhancers or retention tools.
In addition, collaborating with SMEs could be a kind of advocacy for nation building. A
strong reputation related to the advancement of this industry could enhance the Company’s
brand equity.
SO4/WT5. Invest on an integrated IT system to address more efficient and simplified
processes as well as security requirements by clients by enhancing organic IT capability. This
should focus on 1) bridging communication between provider and clients and closing the
geographical challenges, 2) accessibility and availability of information and reports considering
growing concerns in data confidentiality and security, and 3) business intelligence mining for
business development and operations planning. (S1, W3, W4, O2, O5, T1, T3)
Today's discriminating customer continues to expect more and more within a shorter and
shorter period of time from their providers. The use of information technology and the proper
people to build and maintain them is critical to fulfill these customer needs and maintain a
competitive edge in the industry.
160 | Page
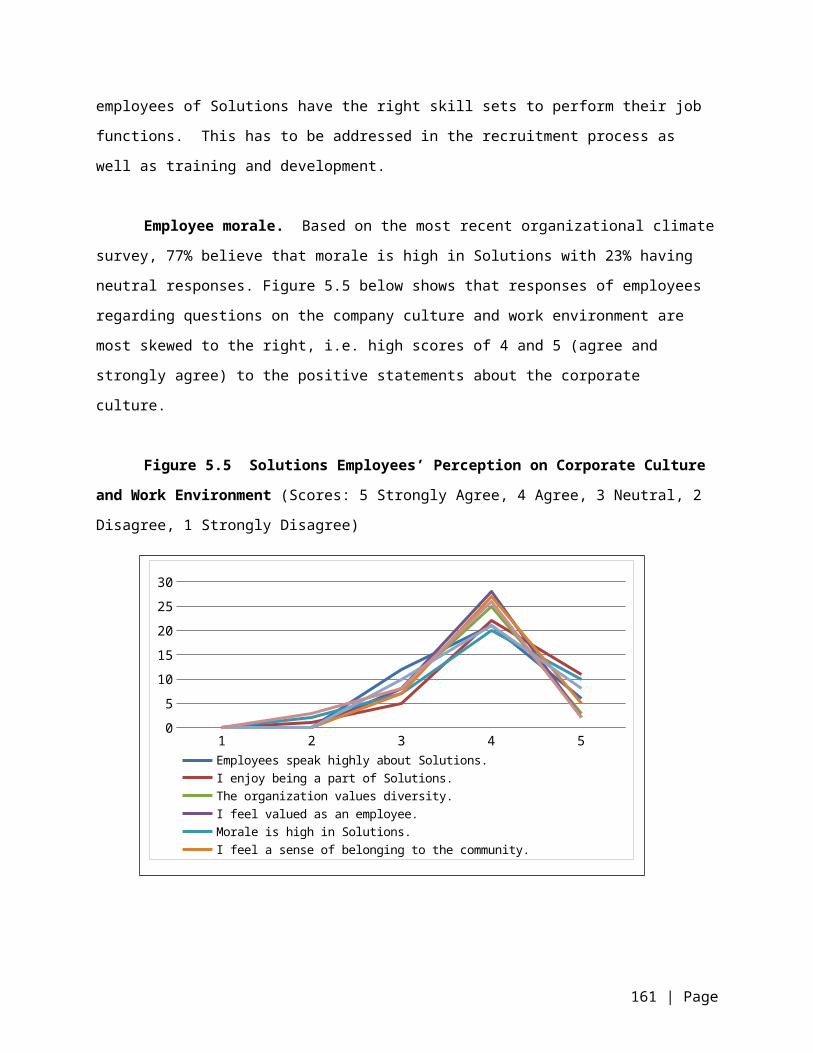
7.4. Recommended Departmental Programs & Actions
Strategy #1. Invest in developing a strong marketing and sales team of at least 5
consultants with as much support personnel including at least 2 technical people to ramp up
marketing activities focusing resources in gaining audience with the local industries. Beef up
networking activities like providing seminars targeted to these local industries. Seminars could
be co-organized with established events/seminars organizers.
Business Development – Product Development, Marketing and Sales
Action / Program Who When
1) Develop concrete business development activities,
performance measures and evaluation.
Bus. Dev't Head 3Q 2013
2) Together with HR, develop a training and development
program for the bus dev't team.
Bus. Dev't Head 3Q-4Q 2013
3) Line up networking activities. Measure effectivity and
efficiency of these activities by monitoring closure rates.
Bus. Dev't Head 3Q-4Q 2013
Human Resources
Action / Program Who When
1) Recruit marketing and sales team. Recruitment
Head
3Q-4Q 2013
2) Define retention and incentive programs aligned with
the new go to market strategies (ie. territory/new segment
based incentives)
HR head 3Q-4Q 2013
Finance, Accounting and Admin.
Action / Program Who When
1) Ensure availability of suppliers and vendors for go to
market activities (ie. events, speakers).
Admin. Head 1Q-2Q 2014
Strategy #2. Design offerings/packages specifically for SMEs, which value one stop
shop services
161 | Page
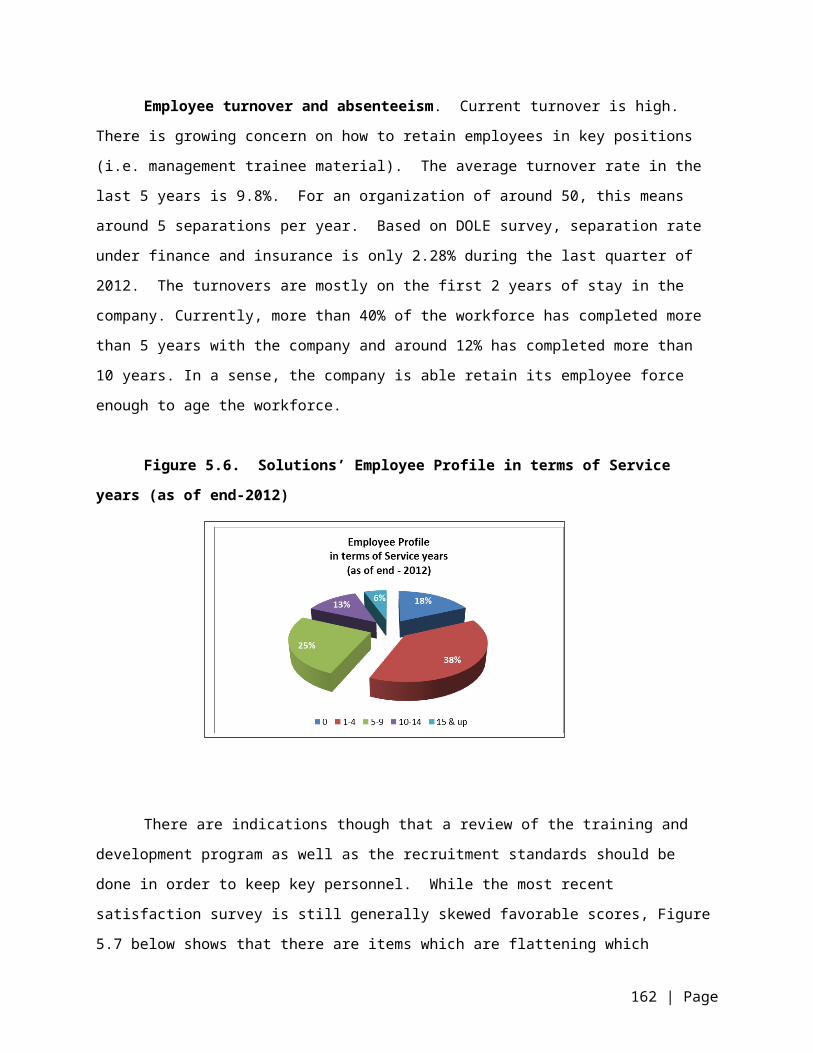
Business Development – Product Development, Marketing and SalesAction / Program Who When
1) Do FGD with SMEs coming from different industries to
get insight as to their requirements and circumstances.
Bus. Dev't Head 4Q of 2013
2) Scope available products in the market. Design an all-
in-1 business product based on available prducts
packaged into 1. Discuss with partners for support. Test
Market. Adjust offering based on feedback from Test
Market.
Bus. Dev't Head 1Q-2Q of
2014
3) Indicate sales objectives. Launch Product through
promotional event/s. Do monthly review of sales and
market penetration. Review product/service offering
annually.
Bus. Dev't Head 3Q of 2014
4) Adjust sales target as necessary. Coordinate with
Human Resources for increasing capacity.
Bus. Dev't Head 2015 - 2016
Human Resources
Action / Program Who When
1) Hire at least 2 marketing assistants and 1 technical staff
to do market analytics. Consider hiring 1 to 2 more sales
people (with prior experience in the industry) to build sales
support capacity.
Recruitment
Head
3Q 2013 /
Sales people -
1Q-2Q 2014.
2) Coordinate with Bus. Dev't Team for the training and
development program for the new team. Plan on incentive
and retention schemes for the sales people. / Coordinate
with the Operations Team for a review of the measurement
of after sales support performance. Consider an incentive
scheme for this aligned with the sales.
HR head 3Q-4Q 2013
3) Coordinate with Bus. Dev't and Operations Heads for
plans in ramping up capacity. Consider development of
high level consultants as sales people - at least 2 more (for
a total of 3 to 4). Increase technical staff to support market
analysis and analytics requirements.
HR head 4Q 2014 -
2016
162 | Page

Operations - Account Mgt. and Support
Action / Program Who When
1) Complete standardization of all operational areas for
faster ramp up time.
Ops Head 1Q 2014
2) Review and consider simplifying authority matrix for
different groups aligned with product / service areas to
allow specialization (ie. breaking sales function from
fullfillment function).
Ops Head 1Q 2015
3) Coordinate with Business Dev't regarding backroom
capacity requirements aligned with sales targets to ensure
compliance with SLAs.
Ops Head 4Q 2014 -
2016
Finance, Accounting and Admin.
Action / Program Who When
1) Allocate budget for sales and marketing expense
including incentives.
Finance Head 4Q 2013
2) Allocate budget for capex to cover IT system
development and upgrade.
Finance Head 4Q 2013
3) Create a cash management system to ensure cash
flow is managed by coordinating with Business Dev't and
Operations regarding revenue and expense timings and
also to plan placement in various investment vehicles to
maximize interest income.
Accounting Head 4Q 2013
IT Support
Action / Program Who When
1) Improve / upgrade Sales recording/reporting system
to be able to generate reports on Sales and Collection
targets and if possible Prospect penetration. Eventually
upgrade information management capabilities from
reporting to analytics.
IT Head (in
coordination with all
Unit Heads)
1Q 2014
2) Create a web tool that will support marketing activities
focusing on ease of data gathering, online FAQs and
IT Head 2Q 2014
163 | Page

customer feedback. Create facilities for customer self-
care that allow for greater scalability.
3) Review data center capacity including security
measures. Consider alternatives for redundancy and
business continuity plan.
IT Head 1Q 2015
Strategy #3. Invest on an integrated IT system to address more efficient and simplified
processes as well as security requirements by clients by enhancing organic IT capability. This
should focus on 1) bridging communication between provider and clients and closing the
geographical challenges, 2) accessibility and availability of information and reports considering
growing concerns in data confidentiality and security, and 3) business intelligence mining for
business development and operations planning.
Human Resources
Action / Program Who When
1) Recruit skilled IT personnel. Emphasis to be placed on
analytics.
Recruitment
Head
1Q 2014
Operations
Action / Program Who When
1) Create performance measures for sub-contracted
services and solutions particularly for IT.
Ops Head 1Q - 2Q 2014
Finance, Accounting and Admin.
Action / Program Who When
1) Ensure availability of IT sub-contractors for various sub-
systems necessary to execute planned programs and
strategies.
Admin. Head
(with IT Head)
1Q-2Q 2014
IT Support
Action / Program Who When
1) Ensure proper quality and delivery management
programs are in place particularly for monitoring sub-
IT Head 2014-2015
164 | Page

contracted work. Software development should be sub-
contracted when possible. However, business design and
analysis must be done in-house to ensure appropriate
level of domain expertise is present during development.
7.5. Financial Projections7.5.1. Sales Projections for 2014-2018
As pointed out from previous sections, the major weaknesses of the Company are its
lack of a robust and well-trained marketing and sales team and a well-defined target market
which is aligned to the capability and positioning of the Company. As such, the three major
strategies outlined in the previous section are expected to address these.
Sales targets were computed with the initial goal of addressing the large concentration
risk in the Company’s client portfolio. The target is to dilute the 30 to 31% concentration to at
most 10% in the long-term while maintaining its market share. To do this, the Company needs
to grow by 15% compounded annually in the next 5 years to decrease the concentration to 18%
at the end of five years then growth by 17% compounded annually in revenues to further reduce
the concentration to 10% by the end of ten years as shown in Table 7.2 below.
Table 7.2 Development of a 10-Year Sales Targets
Estimate ProjectionsPeriod 0 1 2 3 4 5Year 2013 2014 2015 2016 2017 2018Sales (in Php M) 80.9 93.4 106.8 122.8 144.6 166.3
Revenue from 1 jumbo account 25.0 26.0 27.0 28.1 29.2 30.4as a %age of Total Sales 30.9% 27.8% 25.3% 22.9% 20.2% 18.3%
Target sales growth 15.3% 14.4% 15.0% 17.8% 15.0%Estimated Market Share 2.2% 2.1% 2.1% 2.1% 2.2% 2.2%
Period 6 7 8 9 10Year 2019 2020 2021 2022 2023Sales (in Php M) 193.4 222.5 261.1 310.8 370.1
Revenue from 1 jumbo account 31.6 32.9 34.2 35.6 37.0as a %age of Total Sales 16.4% 14.8% 13.1% 11.4% 10.0%
Target sales growth 16.3% 15.0% 17.4% 19.1% 19.1%Estimated Market share 2.2% 2.2% 2.2% 2.3% 2.4%
165 | Page

While the market has grown 17% annually as of 2011, the assumption in this projection
is that it would taper down a bit to around 15% in the long run (maybe even lower) as
competition even with direct sales and agents gets stiffer. Deferring the more aggressive sales
growth in years 6 onwards gives time for the Company to develop its marketing and sales team.
Strategy #1 recommends capacity building of the marketing and sales team.
Accounts are classified in terms of employee size of establishments. A portfolio mix was
assumed. Strategy #2 targets development of an SME portfolio. Naturally, in order for the
SME portfolio to contribute considerably to the whole portfolio, the sales should be able to catch
a wider net for most of its marketing activity because of smaller size of accounts. Strategy #3
which involves development of an integrated IT system that includes possible e-commerce
capability should be able to support such activities.
Table 7.3. Target portfolio mix (in terms of revenue from new business)
ClassificationAve.
EmployeeHeadcount
2014 2015 2016 2017 2018
Jumbo 2000 20% 10% 10% 10% 10%Large 500 50% 50% 40% 40% 40%SME: 30% 40% 50% 50% 50%
Medium 150 27% 36% 45% 44% 43%Small 25 3% 4% 5% 6% 7%
Target number of Accounts (new business)Classification 2014 2015 2016 2017 2018ALL 44 56 76 110 109Jumbo 1 1 1 1 1Large 10 10 9 12 11SME: 33 45 66 97 97
Medium 17 23 34 45 41Small 16 22 32 52 56
Other assumptions are as follows:
Ave. Family Count: 1.5 (i.e. participation rate of one dependent per 2 employees)
Ave. Premium per Person: Php 7,000 for Medium to Jumbo, Php 5,000 for Small
Commission Rate: 7.5% for Jumbo, 10% for Small to Large
Strategy #1 also indicates how the team should be able to ramp up its prospecting and
selling activities, i.e. to hold events that capture mass audience. Usually, these would be
166 | Page

corporate seminars, trainings and workshops. Table 7.4 below shows the number of events
needed to be launched with mass audience assuming a close rate of 10% for medium to jumbo
accounts and 5% for small accounts. The strategy is to divide the sales efforts and as such, the
sales team to Large-Jumbo and Small-Medium accounts. A target number of prospects per
event is assumed.
The capacity of a sales person is measured in terms of the number of prospects met in a
month. The assumption in the projection four (4) for large to jumbo accounts and twenty (2) for
small to medium accounts.
Table 7.4 Target number of events and sales people requirements
2014 2015 2016 2017 2018Number of Prospects (Annual) 600 707 897 1230 1152
Jumbo 10 10 10 10 10Large 100 100 90 120 110Medium 170 230 340 450 410Small 320 367 457 650 622
Number of Sales Person Needed 6 6 7 8 8Large-Jumbo 3 3 3 3 3Small-Medium 3 3 4 5 5
Number of Prospects per eventLarge-Jumbo 20 20 20 20 20Small-Medium 100 100 100 100 100
Number of Events in a year 11 0 0 0 0Large-Jumbo 6 6 5 7 6Small-Medium 5 6 8 11 10
167 | Page

7.5.2. Projected Income Statement
Table 7.5 Pro-forma Income Statement for years 2014-2018 (in Php Millions)
Period 0 1 2 3 4 5Year 2013 2014 2015 2016 2017 2018Revenues 80.94 93.36 106.77 122.76 144.58 166.27Expenses
Salaries, wages, benefits 43.38 51.35 58.72 67.52 79.52 91.45Retirement Benefit 2.91 3.44 3.93 4.52 5.33 6.13Marketing Expense 0.06 3.80 3.20 3.68 4.34 4.99Depreciation and
amortization 1.28 2.09 2.70 2.87 2.81 2.98Training and Education 0.76 0.93 1.07 1.23 1.45 1.66Other General Expenses 11.60 10.52 11.88 13.49 15.66 17.82Total Expenses 59.97 72.14 81.50 93.30 109.09 125.02
Operating Income 20.97 21.23 25.26 29.45 35.49 41.25Other Income 0.00 0.00 0.00 0.00 0.00 0.00Income Before Tax 20.97 21.23 25.26 29.45 35.49 41.25Taxes 6.28 6.36 7.56 8.82 10.63 12.35Net Income 14.69 14.87 17.70 20.63 24.86 28.90Net Profit Margin 18.1% 15.9% 16.6% 16.8% 17.2% 17.4%
The income statement for the base year, 2013, is based on the internal projections by
the Company. The assumption for increases in salaries, wages and benefits as well as
professional fees and director’s fees is 5% each year. Significant increases are in the budgets
for salaries, marketing expense and training. For salaries, this is higher of 55% of revenues and
the 5% increase from previous year. This is to ensure that human resource capacity grows as
sales grow. Marketing expense is assumed at 3% of target sales except for 2014 where
additional marketing expense is booked to provision for the 20th anniversary of the Company.
Training and education is also increased to at least 1% of the sales. The Company does not
pay rent, unlike its competitors, since it owns the building where its office is located. Retirement
expense is estimated using the current ratio of the expense to the salaries, wages and benefits.
The rest of the expenses are projected with the same ratio as the average ratio of the expenses
in the past 3 years over the revenues.
The resulting net income margin is above 15%, which is the target margin for the
Company.
7.5.3. Projected Balance Sheet for 2014-2018
168 | Page

The balance sheet for year 2014 to 2018 is shown in Table 7.6.
Table 7.6 Pro-forma Balance Sheet for years 2014-2018 (in Php Millions)
Period 0 1 2 3 4 5Year 2013 2014 2015 2016 2017 2018Assets
Current AssetsCash 32.63 21.45 16.60 22.77 31.18 41.58Trade and other Accounts Receivables 1.55 1.79 2.05 2.35 2.77 3.19Financial asset at fair value through profit
or loss (FVPL) 1.62 1.62 1.62 1.62 1.62 1.62Creditable withholding taxes - net 1.29 1.48 1.70 1.95 2.30 2.64Total Current Assets 37.09 26.35 21.97 28.69 37.87 49.04
Non-current AssetsProperty and Equipment - Net 7.36 11.67 20.01 17.99 16.03 13.90Deferred Tax Assets 3.55 3.55 3.55 3.55 3.55 3.55Other Non-Current Asset 0.13 0.13 0.13 0.13 0.13 0.13Total Non-Current Assets 11.04 15.34 23.69 21.67 19.70 17.57
Total Assets 48.13 41.69 45.66 50.36 57.57 66.61
Liabilities and Stockholders EquityCurrent Liabilities
Accrued Expense, Accounts payable and other liabilities 6.65 7.67 8.78 10.09 11.88 13.67
Non-Current LiabilitiesRetirement benefit Liabilities 1.99 0.43 (0.64) (1.12) (0.79) 0.34
Total Liabilities 8.64 8.10 8.14 8.97 11.10 14.00Stockholders' equity
Share Capital 11.00 11.00 11.00 11.00 11.00 11.00Treasury shares (6.16) (4.92) (3.69) (2.46) (1.23) 0.00Retained Earnings / (Deficit)
Beginning Balance 40.22 33.31 26.18 28.88 31.52 35.38Cash Dividends (21.60) (22.00) (15.00) (18.00) (21.00) (24.00)Net Income/(Loss) After Tax for the Year 14.69 14.87 17.70 20.63 24.86 28.90
Total Retained Earnings 33.31 26.18 28.88 31.52 35.38 40.27Accumulated Comprehensive Income 1.33 1.33 1.33 1.33 1.33 1.33
Total Equity 39.49 33.59 37.52 41.39 46.48 52.61
Total Liabilities and Stockholders' Equity 48.13 41.69 45.66 50.36 57.57 66.61
169 | Page

The Account Receivables is projected using an average collection period of 7 days. This
is lower than industry average because of the Company’s policy to let the clients pay directly to
the providers. As such, the Company does not carry any assets which are not its real assets.
With this policy, AR turnover is higher because the average settlement of commissions by the
providers is around 7 days. The Account Payables is computed assuming days payable of 30
days and using revenues instead of cost of goods sold. Property and Equipment is net of
depreciation and amortization. This already include capital investments on IT infrastructure
amounting to around Php 9.78M in the next 5 years and building renovations of around Php10M
to build more office space as shown in the Cash Flow Position in Table 7.7.
The rest of the non-current assets and liabilities are maintained except for the net
retirement liability which was computed based on target contributions to the retirement fund
(refer to Table 7.7 for the cash flow position), assumed retirement expense recognized in the
income statement and zero gains and losses recognized in the other comprehensive income.
Treasury shares are assumed re-purchased at cost in the next 5 years. Dividends are
assumed paid to minimize tax exposure to the Company (i.e. retaining 100% paid up capital
based on Revenue Memorandum Circular 35-2011, dated August 17, 2011). The Company has
the option to increase its paid up capitalization and pay out stock dividends instead of cash
dividends. This should most likely be the scenario when the IC would eventually increase the
capitalization requirements are it has done in the past.
170 | Page

7.5.4. Projected Cash Flow for 2014-2018
Table 7.7 Pro-forma Cash Flow for years 2014-2018 (in Php Millions)
Period 0 1 2 3 4 5Year 2013 2014 2015 2016 2017 2018CASH FLOWS FROM OPERATING ACTIVITIESIncome before income tax 20.97 21.23 25.26 29.45 35.49 41.25Adjustments for:
Retirement benefits 2.91 3.44 3.93 4.52 5.33 6.13Depreciation and
amortization 1.28 2.09 2.70 2.87 2.81 2.98Operating income before working capital changes 25.15 26.76 31.90 36.84 43.62 50.35Decrease (increase) in:Receivables (0.47) (0.24) (0.26) (0.31) (0.42) (0.42)Creditable withholding taxes 0.14 (0.20) (0.21) (0.25) (0.35) (0.34)Increase (decrease) in accounts payable andother current liabilities (1.66) 1.02 1.10 1.31 1.79 1.78Net cash generated from operations 23.16 27.35 32.53 37.60 44.65 51.37Contributions made to the retirement fund (4.08) (5.00) (5.00) (5.00) (5.00) (5.00)Income tax paid (6.28) (6.36) (7.56) (8.82) (10.63) (12.35)Net cash provided by operating activities 12.81 15.99 19.97 23.78 29.02 34.02CASH FLOWS FROM AN INVESTING ACTIVITYAdditions to property and equipment (0.36) (6.40) (11.05) (0.85) (0.85) (0.85)CASH FLOWS FROM FINANCING ACTIVITIESAcquisition of treasury shares 2.84 1.23 1.23 1.23 1.23 1.23Dividends paid (21.60) (22.00) (15.00) (18.00) (21.00) (24.00)Cash used in financing activities (18.76) (20.77) (13.77) (16.77) (19.77) (22.77)NET INCREASE IN CASH (6.31) (11.18) (4.85) 6.17 8.41 10.41CASH AT BEGINNING OF YEAR 38.93 32.63 21.45 16.60 22.77 31.18CASH AT END OF YEAR 32.63 21.45 16.60 22.77 31.18 41.58
171 | Page

8. STRATEGY EVALUATION, MONITORING & CONTROL8.1. Strategy Map
172 | Page
Learning and Growth Perspective
Internal Processes Perspective
Customer Perspective
Financial Perspective
Invest on an integrated IT system to address more efficient and simplified processes and security including recruitment of skilled IT
personnel.
Create an open culture that encourages innovation and promotes empowered
employees.
Increase capacity: Improve competencies by developing and growing high-level
consultants and their range of expertise and developing the business development team
Improve SLA and Service Delivery quality and response
time.
Develop and strengthen partnerships with allied industries and providers to provide value-added features for customers
Increase targeted marketing effortsIntensify brand building efforts
Improve client retention rate to 98%.
Increase customer confidence in our advice.
Grow current portfolio through designing products for cross-
selling and upselling.
Penetrate SME industry. Design packages specific to this
market.
Maintain market share in the next 5 years
Target net profit margin of 15%-20% p.a.Grow sales by 15% p.a. in the next 5 years (~166 M by 2018)
VISION We want to be an incubator of the most innovative solutions and best minds in risk management, employee benefits and insurance placement in the
Philippines –through developing our people and through our collaboration with our clients and providers. We want to be the preferred consultants of the employers, organizations and individuals that recognize the value of expertise and quality service. We want to lead in quality of service and business relationships at all times. We will be the preferred partner of the top five (5) reputable insurance and healthcare providers by year 2020.

Financial – The Company’s vision entails that the Company continue to be financially viable in
order to continue to deliver quality advice and service to all its stakeholders. The financial
strategies should be able to address the large client portfolio concentration risk that the
Company is currently facing while maintaining its target margins.
Customer – It is time for the Company to actively seek our prospective customers in untapped
market which could help in increasing its market share. It also has to mine more revenues from
its current client base, which has large potential for more organic growth in terms of cross-sold
service offerings. Client retention should also be a major goal in order to build much deeper
and long-term relationship with client partners.
Internal Processes – The Company needs to enhance its infrastructures especially its internal
processes and strategic partners to be able to support its strategies of giving more value to its
clients. It has to address its current structural weakness of having no formal marketing and
sales team that takes of growing the portfolio as well as ensuring that the market gets to know
the Company’s service offerings.
Learning and Growth – Intensifying the Company’s infrastructure boils down to the
development of the Company’s talents and technology that will the core supplier of the
Company’s solutions offered to its clients.
173 | Page

8.2. Balance Scorecard
8.2.1. Financial Perspective
Objective Key Performance Index or Measure Target Resp. WhenMeet TargetWarningBelow Target
D = DriverA = AccountableC = ConsultedI = Informed
1. Grow sales by 15% p.a. in the next 5 years (~166M by 2018)
Measure: Sales Growth15% and Up10% to below 15%Below 10%
15% D = Bus. Dev’tA = OperationsC = ManagementI = Finance
2014-2018(Check Quarterly)
Measure: Revenue from New Business from New Accounts over Total Revenue
10% and above5% to below 10%Below 5%
10% D = Bus. Dev’tA = Bus. Dev’t and OperationsC = ManagementI = Finance
2. Target net profit margin of 15%-20% p.a.
Measure: Net Profit Margin15% and Up10% to below 15%Below 10%
15% to 20%
D = ManagementA = OperationsC = FinanceI = Bus. Dev’t
2014-2018(Check Quarterly)
174 | Page

8.2.2. Customer Perspective
Objective Key Performance Index or Measure Target Resp. WhenMeet TargetWarningBelow Target
D = DriverA = AccountableC = ConsultedI = Informed
1. Maintain Market Share in the next 5 years
Measure: Market Share in EB 2.2% and Up2% to below 2.2%Below 2%
2.2% D = Bus. Dev’tA = OperationsC & I = Management
2018(Check Annually)
2. Penetrate SME industry. Design packages specific to this market.
Measure: % of revenues from SME over total client portfolio
10% and Up5% to below 10%Below 5%
10% D = ManagementA = OperationsC = FinanceI = Bus. Dev’t
2018(Check Quarterly)
3. Grow current portfolio through designing products for cross-selling and upselling.
Measure: Cross-selling & Upselling rate (additional revenue / previous year’s revenue )
1% and Up0.5% to below 1%Below 0.5%
1% D = Bus. Dev’tA = OperationsC = ManagementI = Finance
2018(Check Quarterly)
4. Improve client retention rate to 98%.Increase customer confidence in our advice.
Measure: Retention rate (revenue from renewals (exclusive of organic growth) / previous year’s revenue)
98% and Up90% to below 98%Below 90%
98% D = OperationsA = OperationsC = Bus. Dev’t and Mgt.I = Finance
2015(Check Quarterly)
Measure: Customer Satisfaction Rate (0 to 4 rating)
3 and above2 to below 3Below 2
3(through annual survey)
D = OperationsA = OperationsC = Bus. Dev’t and Mgt
2014(Check Annually)
175 | Page

8.2.3. Internal Processes Perspective
Objective Key Performance Index or Measure Target Resp. WhenMeet TargetWarningBelow Target
D = DriverA = AccountableC = ConsultedI = Informed
1. Intensify brand building efforts
Measure: Number of PR Events inc. seminars and Ad campaigns in a year
12 and above6 to below 12Below 6
12 (at least once a month)(Adjust based on sales target)
D = Bus. Dev’tA = Bus. Dev’tC = ManagementI = Finance
2014-2018(Check quarterly)
2. Increase targeted marketing efforts
Measure: Number of new products/packages launched in a year
2 and Up10
2 and up D = Bus. Dev’tA = Bus. Dev’tC = Management and OperationsI = Finance
2014-2018
Measure: Number of qualified leads from PR events / Close Rate
120 and above / 10% MLE, 5% Small100 to below 120 / Less than 10%/5%Below 100 / Less than 10%/5%
120 (Closure rate may be
adjusted depending on size of closed
accounts)
D = Bus. Dev’tA = Bus. Dev’tC = ManagementI = Management
2014(Check monthly; with yearly adjustments)
3. Develop and strengthen partnerships with allied industries and providers to provide value-added features for customers
Measure: Number of MOAs signed with allied partners
5 and above1 to 40
5D = Bus. Dev’tA = Bus. Dev’tC = ManagementI = Management
2014-2018(Check
monthly)
4. Improve SLA, Service Delivery quality and response time
Measure: SLA hit rate (i.e. %age TAT SLAs are achieved)
99% and Up90% to below 99%Below 90%
99% D = OperationsA = OperationsC = Bus. Dev’t and Mgt.
2014-2018(Check Quarterly)
Measure: Mean response time for customer concerns
Within 24 hoursAbove 24 hours to 48 hoursAbove 48 hours
With 24 hours
D = OperationsA = OperationsC = Bus. Dev’t and Mgt.
2014-2018(Check quarterly)
Measure: Number of Customer complaints per Month
1 and below2 to 4Above 4
1 and below D = OperationsA = OperationsC = Bus. Dev’t and Mgt.
2014-2018(Check
monthly)
176 | Page

8.2.4. Learning and Growth Perspective
Objective Key Performance Index or Measure
Target Resp. When
Meet TargetWarningBelow Target
D = DriverA = AccountableC = ConsultedI = Informed
1. Increase capacity: Improve competencies by developing and growing high-level consultants and their range of expertise and developing the business development team
Measure: Ave. Length of Promotion of key employees
2 – 3 years and belowmore than 3 to 5 yearsMore than 5 years
2 to 3 years D = HRA = OperationsC = Management
2014-2018
Measure: Number of man-hours for employee training per employee per year
100 hours and above75 hrs. to below 100 hrs.Below 75 hours
100 hours and above
D = HRA = OperationsC/I = Management
2014-2018 (re-evaluate quarterly)
Measure: Number of accounts per consultant
10 and below11 to 2020 and above
10 and below
D = ManagementA = OperationsC/I = Bus. Dev’t / HR
2014-2018
Measure: Number of accounts per account officer
5 and below6 to 10Above 10
5 and below(to be adjusted based on size and complexity of accounts)
D = OperationsA = OperationsC/I = Mgt / HR / BD
2014 – 2018
Measure: Number of suggestions from employee
1 idea per week1 idea per monthBelow 1 idea per month
1 idea per week
D = ManagementA = OperationsC = FinanceI = Bus. Dev’t
2014-2018
Measure: Over-all employee satisfaction (0 to 4 rating)
3 and above2 to below 3Below 2
3 and above (through annual survey)
Measure: System on-time completion rate (in terms of % on-time achievement)
90 to 100%75 to 90%Below 75%
90 to 100% on-time achievement of milestones
D = OperationsA = ITC = ManagementI = Finance
2014-2018
177 | Page

8.3. Contingency Planning8.3.1. Downside Potential Eventso Fall short of establishing target number of prospects
Increase marketing activities through more participation in corporate events.
It is critical that a good distribution of events is selected. It is common to have
the same groups of prospects attend particular clustering of events. It is
critical to find as many events outside the typical clusters.
Increase number of sales person in the field. It is also crucial to select the
sales person depending on her assigned market segment. Different kinds of
sales people are more appropriate for different segments.
o Close rate (120%) is not met
Increase target prospects and improve deal qualification process.
Review package and selling spiels through post-mortem analysis of unclosed
accounts. Adjustments must be segment conscious and should avoid
adjustments against outliers.
o Client retention rate is not met
Increase new business targets.
Do post-mortem analysis for lost accounts. Determine rationale for churn and
review process against this data. Adjustments must be segment conscious
and should avoid adjustments against outliers.
Plan for client ‘buy back’ based on the post-mortem analysis. Strategies must
consider rationale for churn.
Ensure operations are as efficient and lean as it gets. Use IT systems
effectively. Constantly, review people, process and technologies.
o Target revenue not met
Provide additional sales and market development program. Also determine
additional events and activities to execute. Sales plans should also be
reviewed.
Consider M&A strategy for wider sales reach.
Review which portfolio is underperforming and possibly change portfolio
targets.
8.3.2. Upside Potential Eventso Participation rate for corporate sponsored events higher than expected
178 | Page

Mine more possible clients. If necessary, hire more sales people to capture
all possible prospects.
Apply stricter deal qualification to allow better prioritization. Lower qualified
leads can always be revisited later.
o Close rate is higher than expected
Ramp up operational scalability to ensure infrastructure is ready and capable
when new business are closed. Review existing SLAs.
Accelerate training and development program of human assets.
o Client retention is higher than expected
Cross-sell more products / service offerings to current clients.
Ramp up operational scalability to ensure infrastructure is ready and capable
when new business are closed. Review existing SLAs.
Develop client loyalty incentives.
o Target revenue more than expected
Assess profitable portfolio.
Reallocate sales and marketing efforts to key serviceable segments. This
should have factored in operation capability.
Continue balancing portfolio across industries and account sizes.
Consider going global or regional..
Party!
179 | Page

9. REFERENCES
1) ADB. 2013. Asian Development Outlook 2013. Manila. retrieved from
http://www.adb.org/countries/philippines/economy).
2) Asian Development Bank: Long-Term Projections of Asian GDP and Trade, 2011
retrieved from http://www.iadb.org/intal/intalcdi/PE/2011/09482.pdf on 17 August 2013
3) Bangko Sentral ng Pilipinas website: www.bsp.gov.ph
4) Bureau of Internal Revenue of the Philippines, RMC No. 16-2013 on “ Clarifying the
Tax Implications and Recording of Deposits/Advances for Expenses Received by
Taxpayers not covered by Revenue Memorandum Circular No. 89-2012”, February 8,
2013
5) Business Mirror, “BSP’s Tetangco expects policy rate to remain unchanged through
2014 Southeast Asia”, 30 July 2013 retrieved from
http://www.businessmirror.com.ph/index.php/en/business/banking-finance/17181-bsp-s-
tetangco-expects-policy-rate-to-remain-unchanged-through-2014-southeast-asia on 3
August 2013.
6) David, Fred R. Strategic Management: Concept and Cases. 13th Edition. 2010.
7) De Santos, Jonathan P., “Generation Y Not”, China Business Philippine, July 2010
retrieved from http://chinabusinessphilippines.com/index.php?
option=com_content&view=article&id=897:generation-y-not&catid=1:cover-
feature&Itemid=60 on 3 August 2013
8) Garth, Denise, “The Insurance Tipping Point: Innovation and transformation”, Journal of
Insurance Operations”, 3 January 2011 retrieved from
http://www.jiops.com/01/2011/the-insurance-tipping-point-innovation-and-
transformation/ on 3 August 2013
9) Herrera, Maria Elena B. February 2008. Organization Change: Systems, Processes and
Mental Models.
10) Herrera, Maria Elena B. 7 April 2009. Work-Life Goal Congruence and Job Satisfaction.
11) Hill, Nick, “10 tips for successful marketing for SME brokers”, Business Toolbox, Dec
2009 -Jan 2010. www.niba.com.au.
12) IBAP, “The Philippines: Better business process outsourcing” retrieved from
http://www.bpap.org/media-room/214-the-phil-better-business-process-outsourcing on
20 July 2013.
180 | Page

13) “PwC Insurance 2020: Turning change into opportunity”, PricewaterhouseCoopers
International Limited, January 2012
14) Insurance Brokers Industry Profile: Global. (2012). Insurance Brokers Industry Profile:
Global, 1-36.
15) Insurance Commission Report Annual Reports from 2006 to 2011
16) Insurance Commission of the Philippines website: www.insurance.gov.ph
17) Insurance Institute of Asia and the Pacific. 2007. 156th Basic Non-Life Insurance
Course.
18) Insurance Memorandum Circular No. 1-2006. “Capitalization Requirements for
Insurance Brokers and Reinsurance Brokers. Retrieved from www.insurance.gov.ph
19) LABSTAT Updates, Vol. 17. No. 10, June 2013, Bureau of Labor and Employment
Statistics, Department of Labor and Employment, Philippines.
20) Lowe, Aya, “PH Manufacturing industry on the mend”, 23 April 2013, Rappler Beta
retrieved from http://www.rappler.com/business/industries/27294-ph-manufacturing-
industry-on-the-mend on 31 July 2013
21) Maas, P. (2010). How Insurance Brokers Create Value—A Functional Approach. Risk
Management & Insurance Review, 13(1), 1-20.
22) National Statistics Coordination Board website: www.nscb.gov.ph
23) National Statistics Office.;l; Micro Industry and Trade Statistics Department. Small
Statistical Sampling and Operations Division Medium. (http://www.dti.gov.ph)
24) National Statistics Office, Special Release No. 2013-02 retrieved from
http://www.census.gov.ph/old/data/sectordata/aspbi10new_sectitx.html on 9 August
2013
25) Philippine Business Report, “PEZA Investments rise 89.7%”, July 2013, Vol. 24 No. 07,
Department of Trade and Industry Philippines.
26) Philippine Health Insurance Corporation Annual Report 2011
27) Purple Cow.ph website, http://purplecow.ph/
28) Que, Emmanuel R., “Exciting time for Philippine Insurance”, Philippine Insurers and
Reinsurers Association, retrieved from http://www.pirainc.org/index.php?
option=com_content&view=article&id=170:exciting-time-for-philippine-
insurance&catid=54:chairmans-messages&Itemid=239 on 3 August 2013
29) Satell, Greg. “5 Trends That Will Drive The Future Of Technology”, Fobes.com, 13
March 2013. Retrieved from http://www.forbes.com/sites/gregsatell/2013/03/12/5-
trends-that-will-drive-the-future-of-technology/ on 7 August 2013
181 | Page

30) Solutions Insurance Brokers, Inc. / Solutions Incorporated Employee Handbook, 2007.
31) Solutions Insurance Brokers, Inc. / Solutions Incorporated Corporate Profile, 2011.
32) Solutions Insurance Brokers, Inc. / Solutions Incorporated Organizational Climate
Survey, 2013.
33) Tajon, Paul Edwards E. and Leynes, Vandervilt, “IT and BPO Industry”, Sectoral
Studies Division (Tourism and BPO Industries) Infrastructure and Services Industries,
Department Board of Investments, April 2012.
34) The Insurance Code of the Philippines, 1988 edition
35) Top Global Insurance Brokers. (2013). Best's Review, 114(3), 42-45.
36) World Bank: Philippine Economic Update – Accelerating Reforms to Meet the Jobs
Challenge, May 2013, retrieved from
http://www.worldbank.org/content/dam/Worldbank/document/EAP/Philippines/
Philippine_Economic_Update_May2013.pdf on 3 August 2012
37) www.aon.com
38) www.asia.marsh.com
39) www.gra-insurancebrokers.com
40) www.howdengroup.com
41) www.jltgroup.com
42) www.llibi.com
182 | Page

10. APPENDICES10.1. Tables
Table 10.1. Employment of Major Industry Group, Philippines: April 2012 and 2013 (in Thousand Except Rates)
2013p 2012 GrowthAgriculture 11,844 12,468 -5.0%
Industry 6,083 5,859 3.8%Services 19,893 19,513 1.9%
Total 37,820 37,840 -0.1%P - PreliminarySource: LABSTAT Updates, Vol. 17. No. 10, June 2013, Bureau of Labor and Employment Statistics, Department of Labor and Employment
183 | Page

Table 10.2. Number of employees by Region and Firm Size (2011)
REGION EMPLOYMENT SIZE (MSME)
TOTAL Number of Establishments
TOTAL Total Employment
MICRO SMALL MEDIUM LARGE MICRO SMALL MEDIUM LARGE
Philippines 820,25
5 743,25
0 70,22
2 3,287 3,49
6 6,345,742 1,778,353 1,642,492 451,56
1 2,473,336
National Capital Region (NCR) 213,59
4 180,18
3 30,31
3 1,478 1,62
0 2,743,094 496,685 740,981 201,60
9 1,303,819 Cordillera Administrative Region (CAR) 15,311 14,459 796 29 27 73,678 29,818 16,948 3,978 22,934
Ilocos Region 43,495 41,457 1,933 66 39 157,711 88,599 42,631 8,805 17,676
Cagayan Valley 24,281 23,263 969 29 20 79,908 48,808 19,574 3,826 7,700
Central Luzon 83,476 76,827 6,187 265 197 463,297 174,998 141,765 37,109 109,425
CALABARZON 123,17
3 114,29
3 7,805 464 611 947,500 251,208 190,549 64,377 441,366
MIMAROPA 22,822 21,749 1,033 23 17 73,570 44,689 20,400 3,028 5,453
Bicol Region 26,772 25,034 1,647 55 36 120,866 60,708 35,509 7,653 16,996
Western Visayas 47,300 43,394 3,608 164 134 270,527 104,386 79,689 22,033 64,419
Central Visayas 50,411 45,138 4,692 248 333 480,745 113,141 110,885 33,986 222,733
Eastern Visayas 18,405 17,285 1,051 43 26 80,644 41,742 21,405 5,774 11,723
Zamboanga Peninsula 27,272 25,751 1,421 53 47 111,449 53,413 30,137 7,302 20,597
Northern Mindanao 29,873 27,085 2,564 115 109 200,738 66,315 56,100 16,206 62,117
Davao Region 40,327 36,748 3,263 159 157 274,930 90,994 72,467 22,271 89,198
SOCCSKSARGEN 31,637 29,716 1,788 57 76 163,266 65,001 39,074 8,147 51,044
Caraga 13,892 12,893 933 31 35 73,580 30,075 19,281 4,288 19,936 Autonomous Region in Muslim Mindanao (ARMM) 8,214 7,975 219 8 12 30,239 17,773 5,097 1,169 6,200
Source: NATIONAL STATISTICS OFFICE. Micro Industry and Trade Statistics Department. Small Statistical Sampling and Operations Division Medium. (http://www.dti.gov.ph)
184 | Page

Table 10.3. Number of Establishments and Total Employment by Industry and Employment Size (2011)
2009PSIC INDUSTRY EMPLOYMENT SIZE (MSME)
TOTAL Number of Establishments
TOTAL Total Employment
MICRO SMALL MEDIUM LARGE MICRO SMALL MEDIUM LARGE
Agriculture Forestry and Fishing 5,124 3,559 1,277 140 148 175,547 13,027 36,216 19,074 107,230
Mining and Quarrying 570 356 162 18 34 42,682 1,354 5,059 2,353 33,916
Manufacturing 112,789 100,837 10,029 899 1,024 1,373,367 253,945 270,123 124,524 724,775Electricity Gas Steam and Air Conditioning Supply 753 212 344 101 96 75,793 991 11,149 14,633 49,020Water Supply; Sewerage Waste Management and Remediation Activities 1,058 533 466 34 25 34,984 2,441 13,322 4,870 14,351
Construction 2,994 1,602 1,140 119 133 143,902 6,382 34,431 16,338 86,751Wholesale and Retail Trade; Repair of Motor Vehicles and Motorcycles 384,031 362,159 20,920 557 395 1,487,681 806,164 430,900 75,987 174,630
Transportation and Storage 6,248 4,243 1,758 129 118 154,229 16,298 46,532 17,300 74,099Accommodation and Food Service Activities 105,208 93,690 11,243 190 85 575,978 241,907 272,452 24,960 36,659
Information and Communication 19,630 18,085 1,340 103 102 167,170 33,836 38,434 13,753 81,147
Financial and Insurance Activities 28,742 23,435 5,023 120 164 411,198 85,883 91,323 15,875 218,117
Real Estate Activities 6,486 5,094 1,304 49 39 69,462 15,857 30,477 6,801 16,327Professional Scientific and Technical Activities 18,356 16,287 1,913 77 79 155,723 42,908 44,353 10,307 58,155Administrative and Support Service Activities 19,118 15,884 2,303 281 650 756,600 41,102 63,431 39,119 612,948
Education 15,227 8,371 6,327 301 228 332,483 33,583 158,971 41,840 98,089Human Health and Social Work Activities 30,878 29,145 1,480 122 131 168,275 50,568 38,705 17,367 61,635
Arts Entertainment and Recreation 13,223 12,163 997 30 33 72,881 28,354 19,467 4,091 20,969
Other Service Activities 49,820 47,595 2,196 17 12 147,787 103,753 37,147 2,369 4,518
Total 820,255 743,250 70,222 3,287 3,496 6,345,742 1,778,353 1,642,492 451,561 2,473,336Source: NATIONAL STATISTICS OFFICE. Micro Industry and Trade Statistics Department. Small Statistical Sampling and Operations Division Medium. (http://www.dti.gov.ph)
185 | Page

Table 10.4. Affiliations of Top Brokers
Ranking Company Affiliation Reach Remarks
ALL EB1 2 Marsh Philippines, Inc. Marsh & McLennan Global player Merged with Mercer Consulting,
Number 1 Global (Based on 2012 Revenues)
2 1 HSBC Insurance Brokers (Phils.), Inc.
HSBC Bank Captured market
3 4 Aon Philippines Inc. (Ayala Aon)
AON Hewitt Global player Number 2 Global (Based on 2012 Revenues)
4 7 BDO Insurance Brokers, Inc. BDO Bank Local Captured market5 3 Citicorp Fin. Services & Ins.
Brokerage Phils.Citibank N.A. Global affiliation Captured market
6 9 Anchor Insurance Brokers San Miguel Corp. Local Captured market7 6 Gotauco Del Rosario Ins.
Brokers, Inc.International Benefits Network, Assurex Global, Globex International
Global network Institutional relationships
8 * Lockton Phils. Lockton Global Global network Captured market9 11 Unicon Insurance Brokers
CorporationJG Summit Group Local Captured market
10 8 Jardine Lloyd Thompson Ins. Brokers, Inc.
Jardine Lloyd Global player JLT Group - #7 global
11 * Intertrade Insurance Brokers Westcourt General Insurance Brokers
Asia and Pacific Based in Australia
12 5 Solutions Insurance Brokers, Inc.
RNA Regional Alliance and Abelica Global
Regional and Global
Affiliation with RNA is more NEB / Abelica is for consulting
13 18 Philpacific Ins. Brokers & Managers, Inc. (Philinsure)
Wells Fargo Global Broker Network andArthur Gallagher
Global network With regional offices (Manila, Cebu, Davao); With reinsurance license
Gallagher - #4 globalWells Fargo - #5 Global
15 10 Accette Insurance Brokers, Inc. (Howden)
Howden Broking Group Global player Local player acquired by global player
16 12 Lacson & Lacson Insurance Brokers, Inc.
Worldwide Broker Network Global network
17 13 Winebrenner & Inigo Insurance Associates, Inc
Willis Group Global network with Captured marketNumber 3 Global (Based on 2012 Revenues)
18 14 Taishan Insurance Brokers (Phils.), Inc.
Kuok Group Regional affiliation with Captured Market
* 15 Ra Roco Insurance Brokers, Inc.
None Local
Ranking based on Total Premiums placed in 2011 (IC Report, 2011)* not part of top 20
Table 10.5. Portfolio Concentration of Top Brokers
186 | Page

Ranking Company Portfolio portion of:ALL EB EB Non-EB1 2 Marsh Philippines, Inc. 40% 60%2 1 HSBC Insurance Brokers (Phils.), Inc. 100% 0%3 4 Aon Philippines Inc. (Ayala Aon) 39% 61%4 7 BDO Insurance Brokers, Inc. 32% 68%5 3 Citicorp Fin. Services & Ins. Brokerage Phils. 63% 37%6 9 Anchor Insurance Brokers 37% 63%7 6 Gotauco Del Rosario Ins. Brokers, Inc. 58% 42%8 * Lockton Phils. (Alexander Forbes) 2% 98%9 11 Unicon Insurance Brokers Corporation 22% 78%
10 8 Jardine Lloyd Thompson Ins. Brokers, Inc. 40% 60%11 * Intertrade Insurance Brokers 1% 99%12 5 Solutions Insurance Brokers, Inc. 99% 1%13 18 Philpacific Ins. Brokers & Managers, Inc.
(Philinsure)11% 89%
15 10 Accette Insurance Brokers, Inc. (Howden) 53% 47%16 12 Lacson & Lacson Insurance Brokers, Inc. 56% 44%17 13 Winebrenner & Inigo Insurance Associates, Inc 32% 68%18 14 Taishan Insurance Brokers (Phils.), Inc. 48% 52%* 15 Ra Roco Insurance Brokers, Inc. 88% 12%Ranking based on Total Premiums placed in 2011 (IC Report, 2011)* not part of top 20
Table 10.6. Ratio to the whole portfolio per line of main competitorsEB NEB
Life A&H Fire Ocean Marine
Inland Marine
Marine Hull Aviation F&S MV Eng. Misc
Solutions 4% 95% 0% 0% 0% 0% 0% 0% 1% 0% 0%
Gotuaco 4% 54% 26% 3% 1% 2% 1% 4% 4% 1% 2%
Lacson
Howden 11% 42% 14% 1% 1% 0% 2% 1% 19% 2% 7%
Jardine 2% 38% 1% 3% 0% 2% 0% 0% 4% 33% 17%
Marsh* 2% 38% 12% 1% 0% 0% 0% 1% 3% 37% 5%
Aon* 4% 35% 42% 3% 1% 1% 1% 2% 4% 2% 7%
TOTAL 19% 24% 21% 1% 1% 2% 2% 2% 8% 12% 7%Notes: 1) Ratio based on Total Premiums placed in 2011 (IC Report, 2011)2) *Only here for benchmark purposes
187 | Page

Table 10.7. Total Premiums placed by Insurance Brokers by Line of Business (in Php Millions)
2011 2010 2009 2008 2007
EB: 15,613 10,927 7,974 10,053 7,961Life 6,858 4,356 2,196 5,416 4,131A&H 8,755 6,571 5,778 4,637 3,830
NEB: 20,597 18,012 13,193 12,860 10,634Fire 7,742 5,994 3,720 4,508 3,653
Motor Vehicle 3,066 2,743 2,276 2,374 2,142Ocean Marine 543 644 445 497 403
Inland Marine 331 130 266 125 175Marine Hull 553 686 566 454 410
Aviation 798 732 651 670 100Fidelity & Surety 851 671 525 507 512
Engineering 4,189 4,983 2,883 2,105 1,852Misc 2,524 1,430 1,862 1,619 1,388
ALL 36,209 28,939 21,167 22,913 18,595Growth 25% 37% -8% 23% 13%Source: Insurance Commission Reports 2007-2011
Table 10.8. Market Growth per Line of Business (based on Total Premiums Placed by Insurance Brokers)
CAGR(5 years) Annual Growth
2011 2010 2009 2008 2007
EB: 20% 43% 37% -21% 26% 27%Life 18% 57% 98% -59% 31% 37%
A&H 22% 33% 14% 25% 21% 17%NEB: 15% 14% 37% 3% 21% 4%
Fire 17% 29% 61% -17% 23% 2%Motor Vehicle 11% 12% 21% -4% 11% 17%
Ocean Marine 10% -16% 45% -10% 23% 22%Inland Marine 10% 155% -51% 112% -28% -13%
Marine Hull 0% -19% 21% 25% 11% -25%Aviation 42% 9% 13% -3% 572% -29%
Fidelity & Surety 12% 27% 28% 3% -1% 7%Engineering 24% -16% 73% 37% 14% 30%
Misc 8% 76% -23% 15% 17% -19%ALL 17% 25% 37% -8% 23% 13%
188 | Page

Table 10.9. Growth of Commission Income per Line of Business
Ave. in the last 5 yrs.
2011 2010 2009 2008 2007
Total Commissions (in Php Million) 3,690 3,296 2,899 2,938 2,524
EB: 11% 9% 12% -6% 22% 19%Life 14% 23% 31% -29% 17% 31%A&H 11% 0% 2% 13% 28% 10%
NEB: 11% 13% 15% 2% 13% 12%Fire 9% 16% 25% -9% 19% -4%
Motor Vehicle 12% 13% 19% -3% 4% 26%Ocean Marine 11% 5% 40% -26% 23% 12%
Inland Marine 18% 76% -37% 73% -9% -11%Marine Hull 4% -31% 7% 63% 9% -26%
Aviation 40% -12% 16% 9% 154% 32%Fidelity & Surety 20% 36% 24% -8% 5% 43%
Engineering 20% -14% 24% 71% -2% -Misc 3% 46% -21% -7% 29% -35%
ALL 11% 12% 14% -1% 16% 15%
Table 10.10 Average Commission Rate per Line of Business
Ave. in the last 5 yrs.
2011 2010 2009 2008 2007
EB: 12% 9% 11% 14% 12% 12%Life 12% 9% 12% 18% 10% 11%A&H 12% 9% 11% 13% 14% 13%
NEB: 11% 11% 11% 13% 14% 15%Fire 13% 8% 9% 12% 11% 11%
Motor Vehicle 10% 22% 22% 22% 22% 23%Ocean Marine 22% 20% 16% 17% 20% 20%
Inland Marine 19% 15% 22% 17% 21% 17%Marine Hull 18% 8% 10% 11% 8% 9%
Aviation 9% 4% 4% 4% 4% 10%Fidelity & Surety 5% 24% 22% 23% 26% 24%
Engineering 24% 6% 6% 8% 7% 8%Misc 7% 12% 14% 14% 17% 15%
ALL 12% 10% 11% 14% 13% 14%
189 | Page

Table 10.11-A. Industry Ranking in terms of Total Premiums Placed (in Php Million)CAGR 2011 2010 2009 2008 2007
Rank Premium Rank Premium Rank Premium Rank Premium Rank PremiumMarket Size 17.0% 36,209 28,939 21,167 22,913 18,595Solutions Insurance Brokers, Inc. 7.7% 12 1,013 12 833 10 759 11 589 6 811Marsh Philippines, Inc. (g) 28.7% 1 6,968 1 5,314 1 3,037 3 2,490 2 2,298Hsbc Insurance Brokers (Phils.), Inc. (b) 90.4% 2 4,469 3 2,664 * 547 * 380 * 245Aon Philippines Inc. (g) 7.1% 3 3,273 2 3,207 2 2,351 2 2,563 3 2,181Bdo Insurance Brokers, Inc. (b) 12.6% 4 3,231 4 2,439 3 1,700 1 4,617 1 2,517Citicorp Fin. Services & Ins. Brokerage Phils. (b)
7.4% 5 2,262 10 963 4 1,404 4 1,803 4 2,066
Anchor Insurance Brokers (c) 24.8% 6 1,701 9 992 12 584 9 658 9 565Gotauco Del Rosario Ins. Brokers, Inc. 14.1% 7 1,410 7 1,083 6 1,032 7 841 5 812Lockton Phils. (Alexander Forbes) (g) 17.6% 8 1,310 6 1,132 7 952 12 489 11 474Unicon Insurance Brokers Corporation (c) 45.8% 9 1,301 8 1,027 8 886 8 792 * 223Jardine Lloyd Thompson Ins. Brokers, Inc. (g)
13.2% 10 1,266 5 1,666 5 1,036 5 1,073 7 731
Intertrade Insurance Brokers (g) 9.7% 11 1,069 11 914 9 845 6 988 8 715Philpacific Ins. Brokers & Managers, Inc. 17.8% 13 724 13 789 11 674 10 637 10 518Others 8.0% 6,212 5,914 5,359 4,992 4,438
*not in top 10; (g) Global; (b) Bank affiliate; (c) ConglomerateSource: Insurance Commission Reports 2007-2011
Table 10.11-B. Total Premiums Placed in EB Lines by Top Brokers (in Php Million)CAGR 2011 2010 2009 2008 2007
Rank Premium Rank Premium Rank Premium Rank Premium Rank PremiumMarket Size for EB 20% 15,613 10,927 7,974 10,053 7,961
Solutions Insurance Brokers, Inc. 8.1% 12 1,005 12 822 10 744 11 578 6 803Marsh Philippines, Inc. 49.0% 1 2,775 1 1,641 1 1,016 3 676 2 535Hsbc Insurance Brokers (Phils.), Inc. 99.5% 2 4,450 3 2,643 * 510 * 340 * 163Aon Philippines Inc. 19.1% 3 1,274 2 1,102 2 951 2 742 3 636Bdo Insurance Brokers, Inc. -10.9% 4 558 4 400 3 214 1 3,129 1 1,694Citicorp Fin. Services & Ins. Brokerage Phils.,
-2.1% 5 1,422 10 954 4 1,403 4 1,802 4 2,065
Anchor Insurance Brokers 14.0% 6 412 9 301 12 239 9 322 9 261Gotauco Del Rosario Ins. Brokers, Inc. 20.8% 7 819 7 642 6 577 7 421 5 380Lockton Phils. (Alexander Forbes) 27.6% 8 32 6 49 7 14 12 14 11 12Unicon Insurance Brokers Corporation 53.2% 9 288 8 152 8 117 8 105 * 9Jardine Lloyd Thompson Ins. Brokers, Inc.
26.8% 10 510 5 395 5 374 5 335 7 221
Intertrade Insurance Brokers 10.2% 11 10 11 8 9 8 6 9 8 7
Philpacific Ins. Brokers & Managers, Inc. 7.6% 13 80 13 77 11 76 10 65 10 58Others 11.0% 1,978 1,741 1,732 1,512 1,117
Source: Insurance Commission Reports 2007-2011
190 | Page

Table 10.12-A. Industry Ranking and Market Share in terms of Total Premiums Placed2011 2010 2009 2008 2007
Rank MS Rank MS Rank MS Rank MS Rank MSMarket Size (in Php Million) 36,209 28,939 21,167 22,913 18,595Solutions Insurance Brokers, Inc. 12 3% 12 3% 10 4% 11 3% 6 4%Marsh Philippines, Inc. 1 19% 1 18% 1 14% 3 11% 2 12%Hsbc Insurance Brokers (Phils.), Inc. 2 12% 3 9% 3% 2% 1%Aon Philippines Inc. 3 9% 2 11% 2 11% 2 11% 3 12%Bdo Insurance Brokers, Inc. 4 9% 4 8% 3 8% 1 20% 1 14%Citicorp Fin. Services & Ins. Brokerage Phils. 5 6% 10 3% 4 7% 4 8% 4 11%Anchor Insurance Brokers 6 5% 9 3% 12 3% 9 3% 9 3%Gotauco Del Rosario Ins. Brokers, Inc. 7 4% 7 4% 6 5% 7 4% 5 4%Lockton Phils. (Alexander Forbes) 8 4% 6 4% 7 4% 12 2% 11 3%Unicon Insurance Brokers Corporation 9 4% 8 4% 8 4% 8 3% 1%Jardine Lloyd Thompson Ins. Brokers, Inc. 10 3% 5 6% 5 5% 5 5% 7 4%Intertrade Insurance Brokers 11 3% 11 3% 9 4% 6 4% 8 4%Philpacific Ins. Brokers & Managers, Inc. 13 2% 13 3% 11 3% 10 3% 10 3%Others 17% 20% 25% 22% 24%
*not in top 10** Rank based on total premiums – all lines
Table 10.12-B. Industry Ranking and Market Share in terms of Total Premiums Placed (consolidated)
2011 2010 2009 2008 2007
Market Size (in Million Pesos) 36,209 28,939 21,167 22,913 18,595
Top 3 41% 39% 28% 24% 25%
Top 5 56% 50% 43% 52% 50%
Top 10 75% 71% 64% 69% 65%
Below top 10 25% 29% 36% 31% 35%
191 | Page

Table 10.12-C. Market Share in Terms of Premiums Placed in EB Lines and Ratio to Portfolio by Top Brokers (in Php Million)
2011 2010 2009 2008 2007Rank MS RP Rank MS RP Rank MS RP Rank MS RP Rank MS RP
Market Size of EB Lines (in Php Million) 15,613 43% 10,927 38% 7,974 38% 10,053 44% 7,961 48%
Solutions Insurance Brokers, Inc. 12 6% 99% 12 8% 99% 10 9% 98% 11 6% 98% 6 10% 99%
Marsh Philippines, Inc. 1 18% 40% 1 15% 31% 1 13% 33% 3 7% 27% 2 7% 23%
Hsbc Insurance Brokers (Phils.), Inc. 2 29% 100% 3 24% 99% * 6% 93% * 3% 90% * 2% 67%
Aon Philippines Inc. (Ayala Aon) 3 8% 39% 2 10% 34% 2 12% 40% 2 7% 29% 3 8% 29%
Bdo Insurance Brokers, Inc. 4 4% 17% 4 4% 16% 3 3% 13% 1 31% 68% 1 21% 67%
Citicorp Fin. Services & Ins. Brokerage Phils.,
5 9% 63% 10 9% 99% 4 18% 100% 4 18% 100% 4 26% 100%
Anchor Insurance Brokers 6 3% 24% 9 3% 30% 12 3% 41% 9 3% 49% 9 3% 46%
Gotauco Del Rosario Ins. Brokers, Inc.
7 5% 58% 7 6% 59% 6 7% 56% 7 4% 50% 5 5% 47%
Lockton Phils. (Alexander Forbes) 8 0% 2% 6 0% 4% 7 0% 1% 12 0% 3% 11 0% 2%
Unicon Insurance Brokers Corporation 9 2% 22% 8 1% 15% 8 1% 13% 8 1% 13% * 0% 4%
Jardine Lloyd Thompson Ins. Brokers, Inc.
10 3% 40% 5 4% 24% 5 5% 36% 5 3% 31% 7 3% 30%
Intertrade Insurance Brokers 11 0% 1% 11 0% 1% 9 0% 1% 6 0% 1% 8 0% 1%
Philpacific Ins. Brokers & Managers, Inc.
13 1% 11% 13 1% 10% 11 1% 11% 10 1% 10% 10 1% 11%
Others 13% 32% 1% 29% 1% 32% 1% 30% 1% 25%MS – Market Share; RP – Ratio to the whole portfolio
192 | Page

Table 10.13-A. Industry Ranking and Annual Growth
CAGR 2011 2010 2009 2008 20075 yr Rank Growth Rank Growth Rank Growth Rank Growth Rank Growth
Market Size (in Php Million) 36,209 28,939 21,167 22,913 18,595Market Growth 17.0% 25% 37% -8% 23% 13%Solutions Insurance Brokers, Inc. 7.7% 12 22% 12 10% 10 29% 11 -27% 6 16%Marsh Philippines, Inc. 28.7% 1 31% 1 75% 1 22% 3 8% 2 16%Hsbc Insurance Brokers (Phils.), Inc. 90.4% 2 68% 3 387% * 44% * 55% * 37%Aon Philippines Inc. (Ayala Aon) 7.1% 3 2% 2 36% 2 -8% 2 18% 3 -6%Bdo Insurance Brokers, Inc. 12.6% 4 32% 4 43% 3 -63% 1 83% 1 41%Citicorp Fin. Services & Ins. Brokerage Phils.,
7.4% 5 135% 10 -31% 4 -22% 4 -13% 4 30%
Anchor Insurance Brokers 24.8% 6 71% 9 70% 12 -11% 9 16% 9 0%Gotauco Del Rosario Ins. Brokers, Inc.
14.1% 7 30% 7 5% 6 23% 7 4% 5 11%
Lockton Phils. (Alexander Forbes) 17.6% 8 16% 6 19% 7 95% 12 3% 11 -19%Unicon Insurance Brokers Corporation
45.8% 9 27% 8 16% 8 12% 8 255% * 13%
Jardine Lloyd Thompson Ins. Brokers, Inc.
13.2% 10 -24% 5 61% 5 -3% 5 47% 7 8%
Intertrade Insurance Brokers 9.7% 11 17% 11 8% 9 -14% 6 38% 8 6%Philpacific Ins. Brokers & Managers, Inc.
17.8% 13 -8% 13 17% 11 6% 10 23% 10 63%
Others 8.0% 5% 10% 7% 12% 5%
Table 10.13-B. Industry Ranking and Annual Growth (consolidated)
2011 2010 2009 2008 2007
Market Size (in Php Million) 36,209 28,939 21,167 22,913 18,595
Market Growth 25% 37% -8% 23% 13%
Top 3 32% 88% 9% 15% 6%
Top 5 38% 57% -21% 23% 18%
Top 10 33% 51% -14% 30% 14%
Below top 10 7% 11% 6% 11% 10%
193 | Page
Table 10.14. Total Commissions and Average Commission rate of Top Brokers (in Php Millions)
CAGR 2011 2010 2009 2008 2007(5 yr) Rank Com. ACR Rank Com. ACR Rank Com. ACR Rank Com. ACR Rank Com. ACR
Market Size 10.9% 3,690 10% 3,296 11% 2,899 14% 2,938 13% 2,524 14%Solutions Insurance Brokers, Inc.
6.3% 12 72 7% 12 65 8% 10 55 7% 11 45 8% 6 59 7%
Marsh Philippines, Inc. 17.2% 1 359 5% 1 305 6% 1 258 9% 3 226 9% 2 176 8%
Hsbc Insurance Brokers (Phils.), Inc.
50.3% 2 238 5% 3 121 5% * 49 9% * 41 11% * 33 14%
Aon Philippines Inc. (Ayala Aon)
10.4% 3 306 9% 2 295 9% 2 277 12% 2 251 10% 3 228 10%
Bdo Insurance Brokers, Inc. 31.5% 4 510 16% 4 379 16% 3 241 14% 1 337 7% 1 177 7%
Citicorp Fin. Services & Ins. Brokerage Phils.,
-5.1% 5 242 11% 10 319 33% 4 358 25% 4 449 25% 4 410 20%
Anchor Insurance Brokers 13.3% 6 78 5% 9 64 6% 12 46 8% 9 42 6% 9 47 8%
Gotauco Del Rosario Ins. Brokers, Inc.
9.0% 7 123 9% 7 133 12% 6 117 11% 7 98 12% 5 88 11%
Lockton Phils. (Alexander Forbes)
13.9% 8 111 8% 6 98 9% 7 76 8% 12 59 12% 11 47 10%
Unicon Insurance Brokers Corporation
26.9% 9 160 12% 8 119 12% 8 97 11% 8 76 10% * 59 27%
Jardine Lloyd Thompson Ins. Brokers, Inc.
6.8% 10 142 11% 5 122 7% 5 135 13% 5 117 11% 7 98 13%
Intertrade Insurance Brokers 10.9% 11 362 34% 11 309 34% 9 286 34% 6 334 34% 8 229 32%
Philpacific Ins. Brokers & Managers, Inc.
7.5% 13 85 12% 13 75 9% 11 69 10% 10 67 11% 10 518 100%
Others 4.8% 902 15% 893 15% 833 16% 798 16% 353 8%
ACR = Average Commission RateRanking based on Total Premiums PlacedSource: Insurance Commission Reports 2007-2011
194 | Page

10.2. Financial Statements
195 | Page