Embed Size (px)
Citation preview

BSc Financial Economics: International FinanceAutumn 2013Anne Sibert ©2013
LECTURE 3: THE MUNDELL-FLEMING MODEL
The aim of this lecture is to understand the open-economy Mundell-Fleming model. However, this model is complicated so, as a learning strategy, the first section of the lecture considers the simple closed-economy version of the Mundell-Fleming model known as the IS-LM model. In the next section, the more complicated Mundell-Fleming model is introduced.
I. THE CLOSED ECONOMY IS - LM MODEL
The IS-LM model is a one-period model with no uncertainty.1 There is only one good and it can be used for consumption or it can be invested to provide future capital. In the simplest version of the model, the price of the single good is fixed. It is possible to choose the units in which the good is measured so that no generality is lost if it is supposed that the price is equal to one.2 This section begins with an overview of the model and then proceeds to discuss the markets in more detail. The overall equilibrium is analysed and finally, the impact of expansionary government policies is presented.
I.A. Overview of the Model
This subsection provides an overview of the IS-LM model. It describes the inhabitants of the model and the markets that they trade in.
I.A.1. The inhabitants of the model
The economy is inhabited by firms, households and the government. Each of these is described in turn.
I.A.1.a. firms
1 The IS-LM model first appeared in a 1936 paper by John R. Hicks that attempted to explain mathematically the work of John Maynard Keynes.2 Suppose, for example, that the single good costs five pounds per kilogram. Then a unit of the good is defined to be one-fifth of a kilogram.
1
Learning Objectives for the Mundell-Fleming model lecture
To understand the assumptions behind the model To be able to derive and demonstrate the properties of the IS, LM and BP curves of the
model To be able to demonstrate graphically the effects of monetary and fiscal policy on the
relevant endogenous variables To understand how the policy makers’ ability to carry out a policy and the effectiveness of
a policy can depend on their choice of exchange rate regime

In this simple version of the IS-LM model, firms do two things. First, they adjust their inventories to meet current demand for the good. If demand exceeds supply, they draw down their inventories. If supply exceeds demand, they add to their inventories. The second thing that firms do is to invest. It is important to be careful about the terminology here. Firms invest; households save. When a firm invests, it purchases output to be used in future production processes (which are not modeled because this is a one-period model).
I.A.1.b. The households
Households own the firms and, hence, they own the output of the firms (which is, thus, the same as their income). It is supposed that they solve two problems. First, they decide how much of this output to consume and how much save. Then, they decide how to allocate their savings between money and interest-bearing bonds. In more elaborate versions of the IS-LM model, the households would supply labour. However, in this simple version the labour market is ignored.
I.A.1.c. The government
The government purchases goods. It finances its purchases by taxing, printing money or by borrowing (issuing bonds). Taxes, however, are ignored here. The government does not make any explicit decisions that depend on variables such as output or the interest rate. Instead, we take the actions of the government as given or as exogenous.
I. A. 2. The markets
From subsection I.A.1, it is apparent that there are three markets: The goods market, the money market, and the bond market. Each of these is considered in turn.
I.A.2.a. The goods market
Equilibrium in the goods market requires that the demand for the good be equal to the supply. The demand for the good is the amount demanded by households (consumption) plus the amount demanded by firms (investment) plus the amount purchased by the government. Supply is determined by firms adjusting inventories so that supply is equal to demand. That is, the supply of the good is whatever is demanded. This probably seems too good to be true. The IS - LM model is a Keynesian model. A key assumption in a Keynesian model is that there are unemployed resources. In a more elaborate Keynesian model the unemployed resources are unemployed workers, but here they are inventories. The key idea is that if policy makers can get demand to go up, then the unemployed resources will become employed and output will go up.3
I.A.2.b. The money market
3 In the more elaborate version where the unemployed resource is labour it is supposed that the nominal wage is contractually fixed and that it is fixed at too high a level to clear the labour market. If the government can raise prices by following an expansionary policy, this will lower the real wage (equal to the nominal wage divided by the price) and firms' demand for labour will increase. Thus, employment and output will both go up, albeit at the cost of some inflation.
2

Equilibrium in the money market requires that the demand for money be equal to the supply. Households demand money, rather than interest-bearing bonds, because they can use it for transacting. The government chooses the supply of money.
I.A.2.c. The bond market
Equilibrium in the bond market requires that the demand for bonds equal the supply of bonds. Households demand bonds because they pay interest. Bonds are supplies by the government, although we could think of firms and households supplying them as well.
I.A.2.d. Walras' law
Those of you who have seen the IS - LM model before may be thinking, "Bond market? I don't remember any bond market!" The market was there, but fortunately, it can be ignored. This is because of a handy result from microeconomics called Walras law. An implication of Walras law is that if there are N markets and N - 1 of these markets clear, then the Nth market clears as well. Here there are three markets: the goods market, the money market, and the bond market. If two of them (the goods market and the money market) clear, then the third market (the bond market) must clear as well. Thus, happily, the bond market can be ignored.
I.B. The Model
In this subsection the IS-LM model is presented in detail. First the goods market is discussed and then the money market. Finally, the overall equilibrium is specified.
I.B.1. The goods market
Goods market clearing requires that output is equal to consumption (by households), investment (by firms) and government purchases. Thus,
11\* MERGEFORMAT ()
where Y is output, C is consumption, I is investment and G is government spending. Equation (1) is referred to as the national accounting identity.4
Households divide their income, which is equal to output, between savings and consumption. It is assumed that consumption is a function of income.
22\* MERGEFORMAT ()
4 As previously mentioned, output and income are the same thing here. In a real-world economy the firms use their output to pay wages, interest and dividends. Thus their output is equal to the wage and investment income of the households. Note also that it makes no difference whether we view, say, Y as the volume of output or the value of output because the price is equal to one.
3

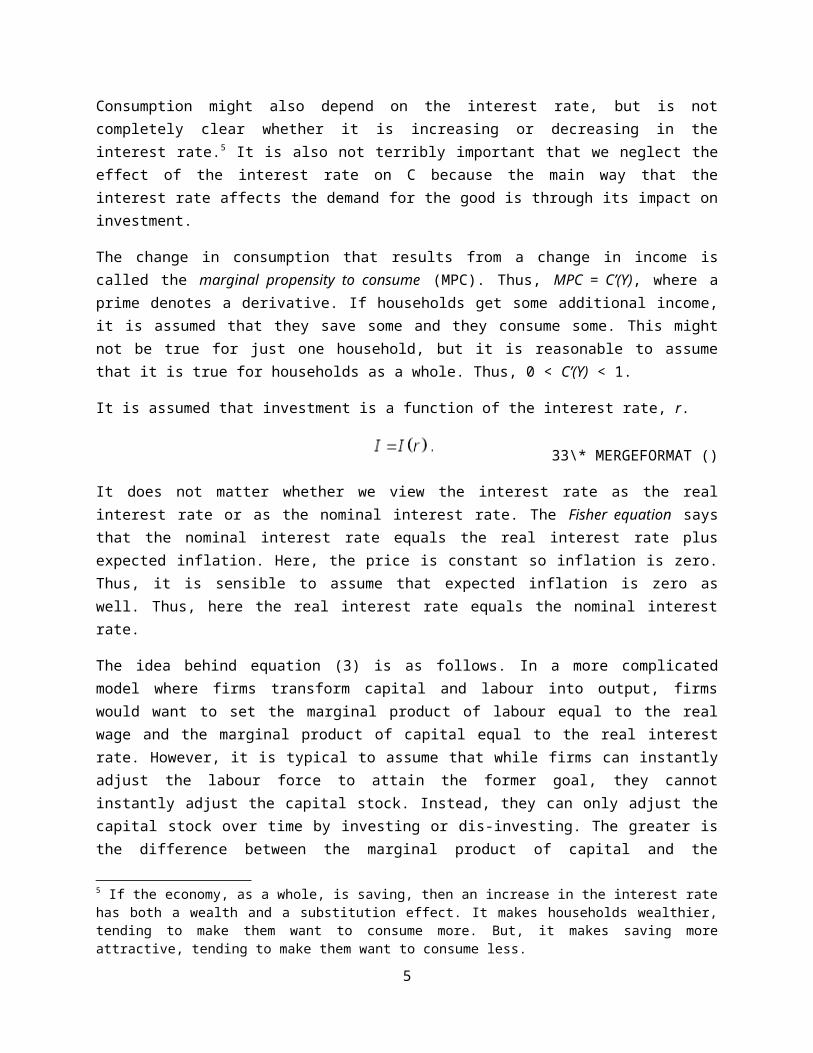
Consumption might also depend on the interest rate, but is not completely clear whether it is increasing or decreasing in the interest rate.5 It is also not terribly important that we neglect the effect of the interest rate on C because the main way that the interest rate affects the demand for the good is through its impact on investment.
The change in consumption that results from a change in income is called the marginal propensity to consume (MPC). Thus, MPC = C’(Y), where a prime denotes a derivative. If households get some additional income, it is assumed that they save some and they consume some. This might not be true for just one household, but it is reasonable to assume that it is true for households as a whole. Thus, 0 < C’(Y) < 1.
It is assumed that investment is a function of the interest rate, r.
33\* MERGEFORMAT ()
It does not matter whether we view the interest rate as the real interest rate or as the nominal interest rate. The Fisher equation says that the nominal interest rate equals the real interest rate plus expected inflation. Here, the price is constant so inflation is zero. Thus, it is sensible to assume that expected inflation is zero as well. Thus, here the real interest rate equals the nominal interest rate.
The idea behind equation (3) is as follows. In a more complicated model where firms transform capital and labour into output, firms would want to set the marginal product of labour equal to the real wage and the marginal product of capital equal to the real interest rate. However, it is typical to assume that while firms can instantly adjust the labour force to attain the former goal, they cannot instantly adjust the capital stock. Instead, they can only adjust the capital stock over time by investing or dis-investing. The greater is the difference between the marginal product of capital and the interest rate, the more they would want to invest. If the marginal product of capital is viewed as fixed in the short run, then the lower is the interest rate, the more the firm would like to invest. Thus, I’(r)< 0.
It is assumed that government expenditures G are given. Thus, substituting equations (2) and (3) into equation (1) yields:
44\* MERGEFORMAT ()
Equation (4) is the condition for equilibrium in the goods market. It can be represented graphically by a device known as the IS curve. It is known as the IS curve because Y = C + I + G implies that the firms’
investment, I, is equal to the economy’s saving, S, which is equal to Y – C – G.
Definition 1. Given G, an IS curve is a graph of the combinations of r and Y such that equation (4) holds.
5 If the economy, as a whole, is saving, then an increase in the interest rate has both a wealth and a substitution effect. It makes households wealthier, tending to make them want to consume more. But, it makes saving more attractive, tending to make them want to consume less.
4
This IS curve is graphed with the interest rate on the vertical axis and output on the horizontal axis. To see how this works it is useful to first consider an example. Suppose that C = a + bY where 0 < b < 1 and that I = c – dr, where d > 0. Then equation (4) becomes
This is an equation for a line with the negative slope – (1 – b)/d.
Graphically, this is depicted in Figure 1 below.
Figure 1. The IS Curve
There are two key features of the IS curve and the first is that it slopes down. To see this, suppose that the economy is at some arbitrary point on the IS curve. (Draw it in and call it point A) Now suppose that Y is increased so that the economy is moved to the right of point A on the IS curve. Then, looking at equation (4), we see that Y > C(Y) + I(r) + G because although C goes up when Y goes up, it goes up less than Y does because the MPC is less than one. Thus, to the right of point A on the IS curve there is excess demand in the goods market – that is, demand exceeds supply. To restore equilibrium the interest rate must fall so that I goes up and Y = C(Y) + I(r) + G again. Thus, the new point on the IS curve is to the southeast of point A, not to the northeast as it would be if the IS curve sloped up.
Each IS curve is drawn for a particular value of G. Or, in other words, there is a different IS curve corresponding to each value of G. The second key feature of the IS curve is that an increase in G (an expansionary fiscal policy) shifts the curve up or out from IS0 to IS1, as is shown in Figure 2.6 To see this, suppose we are on the old IS curve, IS0 in Figure 2, and G goes up. Then for every value of r, we now have Y < C(Y) + I(r) + G. To restore equilibrium, we need a higher value of Y for any value of r.
6 If there were taxes in the model, then an expansionary fiscal policy would be any combination of changes in government spending and taxes that had the effect of increasing demand and shifting the IS curve out.
5

Figure 2. An Expansionary Fiscal Policy Shifts the IS Curve Out
I. B. 2. The money market
Money market clearing requires that money demanded by households is equal to money supplied by the government.
55\* MERGEFORMAT ()
where M is the money supply and L is the demand for money (liquidity).
It would be more accurate to say that households have a demand for real balances, that is, they have a demand for a given amount of purchasing power in the form of money. However, the price level here is fixed at one so the demand for a (nominal) amount of money is the same thing as the demand for real balances.
The more income households have, the more transactions they make. Hence, the higher is their demand for money. Households hold their savings in the form of money or bonds. Bonds pay a positive rate of interest. Thus, the opportunity cost of money is the foregone interest. For this reason, the demand for money is decreasing in the interest rate. Thus,
66\* MERGEFORMAT ()
where L is increasing in Y and decreasing in r.
The money supply is assumed to be exogenous. Substituting equation (6) into equation (5) yields:
77\* MERGEFORMAT ()
6

Equation (7) is the condition for equilibrium in the money market. We represent this graphically by a device known as the LM curve.
Definition. Given M, an LM curve is a graph of the combinations of r and Y such that equation (7) holds.
Similarly to the IS curve, the LM curve is graphed with the interest rate on the vertical axis and output on the horizontal axis. To see how this works it is useful to first consider an example. Suppose that
As is the IS curve, the LM cure is graphed with the interest rate on the vertical axis and output on the horizontal axis. To see how this works it is useful to first consider an example. Suppose that L = eY – fr, where e > 0 and f > 0. Then equation (7) becomes r = (eY – M)/f.
This is an equation for a line with the
positive slope e/f.
Graphically, this is depicted in Figure 3 below.
Figure 3. The LM Curve
There are two key features of the LM curve and the first is that it slopes up. To see this, suppose that the economy is at some arbitrary point on the LM curve. (Draw it in and call it point B) Now suppose that Y is increased so that the economy is moved to the right of point B on the LM curve. Then, looking at equation (7), we see that M < L(Y,r) to the right of point B because money demand is increasing in Y. Thus, to the right of point B there is excess demand in the money market. To restore equilibrium the interest rate must rise so that L goes up and M = L(Y,r) again. Thus, another point on the LM curve is to the northeast of point B, not to the southeast, as it would be if the LM curve sloped down.
Each LM curve is drawn for a particular value of M. Or, in other words, there is a different LM curve corresponding to each value of M. The second key feature of the LM curve is that an increase in M shifts the curve down or out from LM0 to LM1, as is shown in Figure 4. This is because if M goes up, then there is excess supply at the old LM curve. To increase demand to meet the increased supply there needs to be a higher Y for each r.
7

Figure 4. An Expansionary Monetary Policy Shifts the IS Curve Out
I. B. 3. Equilibrium
Equilibrium in both the goods market and the money market occurs at the unique (Y,r) where the IS and LM curves intersect. This is shown in Figure 5.
Figure 5. Equilibrium in the IS-LM Model
Equilibrium in Figure 5 occurs at the output and interest rate pair (Y0,r0). What happens if the economy is not at the equilibrium? It is assumed that output adjusts to clear the goods market and the interest rate adjusts to clear the money market. Thus, if the economy is to the right (left) of the IS curve, then there is excess supply (demand) in the goods market and output falls (rises) to clear the goods market. If the economy above (below) the LM curve then there is excess supply (demand) in the money market and the interest rate falls (rises) to clear the money market. This is indicated by the arrows in Figure 6:
8

Figure 6. Restoration of Equilibrium
I. C. Expansionary Policies
This subsection considers expansionary fiscal and monetary policies in the IS-LM model. These policies are simple to analyse graphically. It is important to note, however, that by equation (4), the only things that can shift the IS curve are a change in government spending or a change in preferences or technology that change the shape of the consumption or investment function. By equation (7), the only things that can shift the LM curve are a change in the money supply or a change in preferences or technology that changes the money demand function.
I.C.1. Expansionary Fiscal Policy
An expansionary fiscal policy – that is an increase in G – shifts the IS curve out from IS 0 to IS1, as is shown in Figure 7. This is the end of the story: there are no further shifts in either the IS or the LM curve. As seen in Figure 7, this causes the interest rate to rise from r0 to r1 and output to rise from Y0 to Y1. As output is higher, consumption must be higher and as the interest rate is higher, investment must be lower. Thus, increased government spending raises output by employing idle resources (here, inventory), but it also displaces or “crowds out” private investment.
9

Figure 7. Expansionary Fiscal Policy
How do we get from one equilibrium to another? We can tell the following story to go with Figure 7. The increase in government spending causes excess demand in the goods market. Output rises to clear the goods market. This causes excess demand in the money market and the interest rises to clear the money market. This lowers investment, dampening some of the excess demand in the goods market.
I.C.2. Expansionary Monetary Policy
An expansionary monetary policy – that is an increase in M shifts the LM curve out from LM0 to LM1, as is shown in Figure 8.7 This is the end of the story: there are no further shifts in either the IS or the LM
curve. As seen in Figure 8, this causes the interest rate to fall from to and output to rise from to
. As output is higher, consumption must be higher and as the interest rate is lower, investment must be higher.
7 The central bank might increase the money supply through an open market operation, where it purchases government bonds for money.
10

Figure 8. Expansionary Fiscal Policy
I.C.3 Why the Expansionary Policies Work Here
The IS-LM model produces the happy result that governments can increase output by using expansionary monetary and fiscal policies. Sadly, this is a result of the implausible assumptions of the model.
As noted before, expansionary policies work in this Keynesian IS-LM model because there are idle resources in the form of inventories. If the government can just get demand to go up, then the idle resources will be brought into use and supply will rise to meet demand. The price is fixed so there is no inflation. This works in a one-period model where there are sufficient inventories: obviously in the real world there would be limitations on using inventories to expand output.
In a more elaborate version of the IS-LM model where the idle resources are unemployed workers and nominal wages are fixed, an expansionary monetary policy would work by causing inflation that would lower real wages and cause more workers to be employed and output would go up. Today there is near consensus among research economists that governments cannot use monetary policy to systematically increase employment and output. That workers and firms would anticipate the government’s action and increase the nominal wage to offset the inflation.
II. THE MUNDELL-FLEMING MODEL
This section analyses an open economy version of the IS-LM model known as the Mundell-Fleming Model.8 It begins with an overview of the model.
II.A. Overview of the Model
8 The Mundell-Fleming model first appeared in the early 1960s and is due (independently) to the Nobel prize winning economist Robert Mundell, a professor at Columbia University, and to Marcus Fleming, who was an economist at the International Monetary Fund.
11

The Mundell-Fleming model has two regions: the home country and the rest of the world. There are two goods: a good produced by the home country and a good produced by the rest of the world. The home country is assumed to be small compared to the rest of the world in the sense that it cannot affect either the world interest rate or the foreign (that is, rest of the world) currency price of the foreign good.
A new variable in the Mundell-Fleming model is the exchange rate, denoted by e and defined as the home-currency price of the foreign currency. Thus, an increase in e is a depreciation of the home currency and a decrease in e is an appreciation of the home currency. If the exchange rate is fixed then an increase in the official rate e is a devaluation of the home currency and a decrease in the official rate e is a revaluation.
The Mundell-Fleming model has four types of inhabitants: home consumers, home firms, the home government and the rest of the world. Home consumers own the output of the home firms and they split this income into consumption of the home good, consumption of the foreign good (their imports) and savings. Savings are held in the form of home money and home and foreign bonds. Home firms decide how much to invest and sell their output to residents of the home country and residents of the rest of the world (exports). The home government chooses whether to let the exchange rate float or whether to fix it and it conducts monetary and fiscal policies.
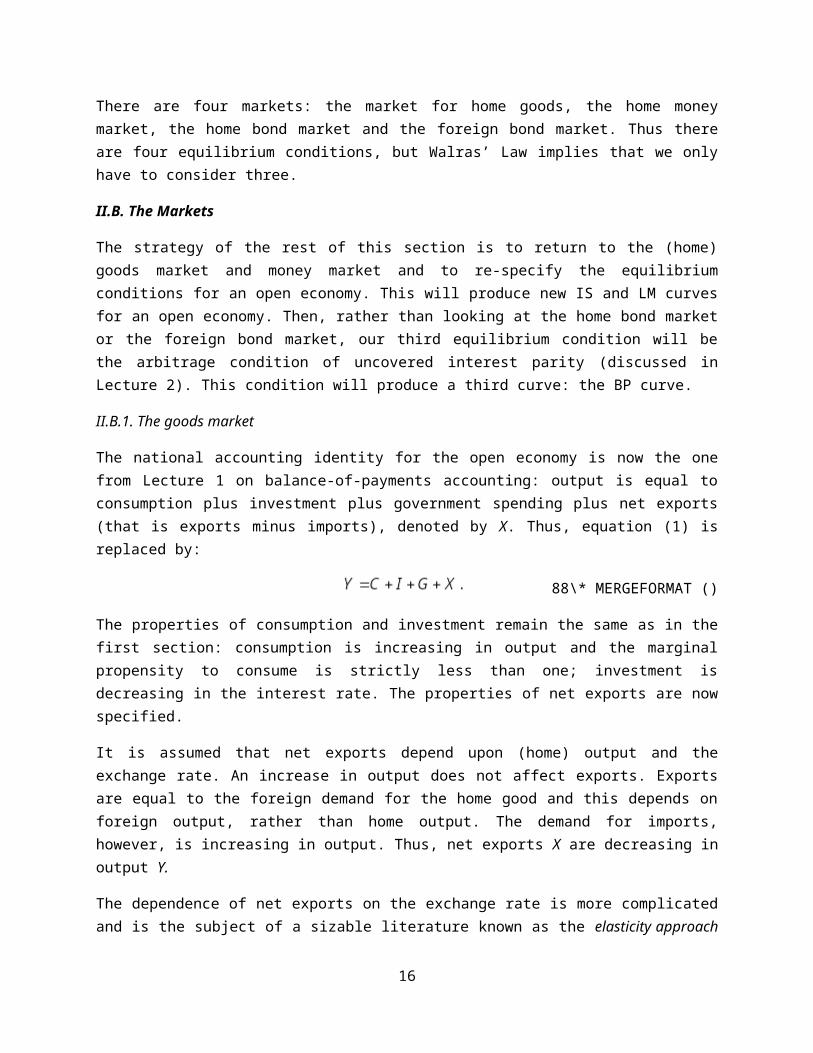
There are four markets: the market for home goods, the home money market, the home bond market and the foreign bond market. Thus there are four equilibrium conditions, but Walras’ Law implies that we only have to consider three.
II.B. The Markets
The strategy of the rest of this section is to return to the (home) goods market and money market and to re-specify the equilibrium conditions for an open economy. This will produce new IS and LM curves for an open economy. Then, rather than looking at the home bond market or the foreign bond market, our third equilibrium condition will be the arbitrage condition of uncovered interest parity (discussed in Lecture 2). This condition will produce a third curve: the BP curve.
II.B.1. The goods market
The national accounting identity for the open economy is now the one from Lecture 1 on balance-of-payments accounting: output is equal to consumption plus investment plus government spending plus net exports (that is exports minus imports), denoted by X. Thus, equation (1) is replaced by:
88\* MERGEFORMAT ()
The properties of consumption and investment remain the same as in the first section: consumption is increasing in output and the marginal propensity to consume is strictly less than one; investment is decreasing in the interest rate. The properties of net exports are now specified.
12

It is assumed that net exports depend upon (home) output and the exchange rate. An increase in output does not affect exports. Exports are equal to the foreign demand for the home good and this depends on foreign output, rather than home output. The demand for imports, however, is increasing in output. Thus, net exports X are decreasing in output Y.
The dependence of net exports on the exchange rate is more complicated and is the subject of a sizable literature known as the elasticity approach to the balance of payments. In the previous section, it did not matter whether the variables in equation (1) were measured in volumes or values because they were all home variables and the home price was equal to one. Here, however, net exports are equal to exports (of the home good) minus imports (of the foreign good). So, it does matter whether the variables in equation (8) are measured in volumes or values because imports are a foreign good and the home-currency price of the foreign good is not generally equal to one. Thus, suppose that the variables in equation (8) are measured in terms of their value in home currency. For output, consumption, investment, government spending and exports this is the same as their volume. But, for imports this is equal to the volume of imports multiplied by the home currency price of the foreign good.
It is assumed that the foreign-currency price of the foreign good is fixed at one, just as the home-currency price of the home good is fixed at one. It is also assumed that the law of one price (discussed in Lecture 2) holds. Then the home-currency price of the foreign good is equal to the exchange rate. Thus, net exports are equal to the volume of exports minus the product of the volume of imports and the exchange rate. Now the problem arises. An increase in the exchange rate (a depreciation of the home currency) increases the price of the foreign good relative to the price of the home good. This should increase the volume of exports (as the foreign demand for the home good goes up) and it should decrease the volume of imports (as the home demand for the foreign good goes down). But, net exports do not necessarily rise as a result because the product of the exchange rate and the volume of imports does not necessarily fall.
The elasticity approach to the balance of payments literature derived conditions (which as you might guess depended on the home and foreign elasticities of demand for imports and exports) for a depreciation (or devaluation) of the home currency to increase net exports and a voluminous empirical literature tested whether or not these conditions held. The literature is now regarded as misguided for considering these demand functions in isolation, rather than as part of the economy as a whole. However, its conclusion was that in the short run, volumes do not adjust much in response to a change in the exchange rate so that in the short run the important result of an increase in the exchange rate is that the value of imports rises because their price rises and net exports fall. In the longer run (perhaps quarters or years), volumes adjust and this effect outweighs the price effect. An increase in the exchange rate causes net exports to rise. This is the assumption used here.
To summarise, X = X(Y,e), where X is decreasing in Y and increasing in e. Thus, equation (4) is replaced by
99\* MERGEFORMAT ()
13

Similarly to the previous section, the IS curve is the graph of the combinations of r and Y such that equation (9) holds. As before the IS curve slopes down. To see this suppose that if the economy is on the IS curve and that output goes up, moving the economy to the right of the IS curve. Then consumption goes up, but not as much as output does (the MPC is strictly less than one) and net exports go down. So the left-hand side of equation (9) goes up more than the right-hand side of equation (9) and the economy is in the region of excess supply in the goods market. To restore equilibrium, the interest rate must fall so that investment, and hence the right-hand side of equation (9) rises. Thus, a second point on the IS curve is to the southeast, not the northeast of the first one.
As before the location of the IS curve depends on , but now it also depends on e. An increase in the exchange rate increases net exports and hence it increases the right-hand-side of equation (9). Thus, an increase in the exchange rate acts just as G does. A key feature of the IS curve is that either an increase
in or an increase in e causes the IS curve to shift out.
II.B.2. The money market
Fortunately, modifying the money market is easier than modifying the goods market. It assumed that home residents do not hold foreign money and that foreign residents do not hold home money. The demand for home money is then the same as in the previous section. The equilibrium condition continues to be given by equation (7) and the LM curve is as before.
II.B.3 The bond market
We have added an additional market to the IS-LM model: the market for foreign-currency bonds. Therefore, we need an additional equilibrium condition. It is assumed that capital is perfectly mobile across countries. That is, there are no restrictions on home residents holding foreign-currency bonds or on foreign residents holding home-currency bonds and it is costless to exchange home-currency bonds for foreign-currency bonds and vice versa.
A key assumption of the Mundell-Fleming model is that home-currency and foreign-currency bonds are perfect substitutes. That is, market participants care solely about their expected return. Thus, uncovered interest parity holds. Since nominal and real interest rates are the same thing in this model with zero home-price and zero foreign-price inflation, uncovered interest parity implies
1010\* MERGEFORMAT ()
where r* is the world interest rate (that is, the interest rate on foreign-currency bonds) and e’ is next period’s exchange rate (the one that would prevail if there were a next period in the model). It is further assumed that market participants have a simple type of adaptive expectations: they believe that the future exchange rate is the same as the current exchange rate. This is an unattractive assumption: in the model of Lecture 4 it will be assumed that market participants’ anticipate the future. The consequence of the assumption that e = e’ is that equation (10) can be written as
14

1111\* MERGEFORMAT ()
The simple equilibrium condition of equation (11) gives us the third curve in the Mundell-Fleming model: the BP curve.9
Figure 9. The BP Curve
An interpretation of this curve is that if the home interest rate is above the BP curve, then the whole world wants to hold only home-currency bonds and not foreign-currency bonds. All of the world’s capital is on the verge of flowing into the home country and the country has a balance of payments surplus. Likewise, if the home interest rate is below the BP, then the whole world wants to hold only foreign-currency bonds and not home-currency bonds. All of the capital is on the verge of flowing out of the home country and the country has a balance of payments deficit. Balance of payments equilibrium requires that the economy be on the BP curve (and, hence, gives the curve its name).
II.C. Equilibrium in the Mundell-Fleming Model
In the IS-LM model, equilibrium was given by the intersection of the IS and the LM curves. In the Mundell-Fleming model it requires intersection of the IS, LM and BP curves. While it was clear that, unless something strange was going on, there was an intersection of the IS and LM curves. It is less obvious how the three curves intersect. What causes them to intersect depends on the exchange rate regime: on whether there are floating or fixed exchange rates.
II.C.1. Equilibrium when the exchange rate floats
In a floating exchange rate regime the market determines the exchange rate. As before, it is assumed that output adjusts to clear the goods market and that the interest rate adjusts to clear the money market. It is further assumed that the exchange rate adjusts to produce balance of payments equilibrium. If the economy is above (below) the BP curve, then it is in the region of balance of payments surplus (deficit). Then its currency appreciates (depreciates) to produce balance of payments equilibrium. This means that e goes down (up).9 This curve is sometimes called the FE curve.
15
To see this, consider Figure 10, below. The intersection of the IS and LM curves produces a home interest rate that is below the world interest rate. The economy is below the BP curve in the region of balance of payments deficit. Thus, the currency depreciates. A depreciation causes the IS curve to shift out. Thus, the IS curve in Figure 10 below shifts out until it intersects the LM and BP curve. Thus, when the exchange rate floats, the economy must be at the intersection of the LM and BP curves. The exchange rate then adjusts to ensure that the IS curve passes through this intersection.
Figure 10. Balance of Payments Deficit
II.C.2. Equilibrium when the exchange rate is fixed
When the exchange rate is fixed the government chooses a value for e. It must then intervene to ensure that this rate prevails. It has two policy tools: monetary and fiscal policy. But, in practice fiscal policy is too slow. Thus, it uses its monetary policy to ensure that the exchange rate does not move from its fixed value. To do this it intervenes in the foreign exchange market, buying and selling the home currency (for foreign currency) to ensure that the supply of the home currency equals the demand for the home currency at the fixed rate. It must be willing to buy or sell any amount of the home currency at the fixed rate.
Suppose that the economy is as in Figure 10 above. In the absence of central bank intervention the currency would depreciate. Thus, the central bank must intervene in the foreign exchange market, purchasing its home currency and selling its foreign exchange reserves.10 When it purchases its home currency, it reduces the stock of outstanding home currency and the LM curve shifts in until it intersects with the IS and BP curves. Thus, when the exchange rate is fixed, the economy must be at the intersection of the IS and BP curves. The money supply then adjusts to ensure that the LM curve intersects with the IS and BP curves at that point.
The equilibrium conditions in the Mundell-Fleming model are given by equations (7), (9) and (11). The discussion in this subsection implies that when the exchange rate floats, the two exogenous variables (the variables given by the model) are G and M and the three endogenous variables (the variables that
10 In practice its ability to do this is limited by the size of its stock of foreign exchange reserves.
16

are determined in the model) are Y, r and e. When the exchange rate is fixed, the two exogenous variables are G and e and the three endogenous variables are Y, r and M.
II.D. Expansionary Policies in the Mundell-Fleming Model
This section considers expansionary monetary and fiscal policies in the Mundell-Fleming model. The ability of the government to carry out these policies and their effectiveness will be seen to depend on the exchange rate regime.
II.D.1. Expansionary policies when the exchange rate floats
This section considers expansionary policy when the exchange rate is market determined. As in section I, an expansionary fiscal or monetary policy will cause the IS or the LM curve to shift out. This will then cause the home interest rate (determined by the intersection of the post-shift IS and LM curves) to be above or below the world interest rate and the economy will be in the region of balance of payments surplus or deficit. As a result the currency will appreciate or depreciate to eliminate the deficit and this will cause the IS curve to shift so that it intersects with the BP and LM curves.
II.D.1.a. An expansionary fiscal policy with a floating exchange rate
The expansionary fiscal policy causes the IS curve to shift out. This causes the intersection of the IS and LM curves to be above the BP curve. This is the region of balance of payments surplus. Thus, the currency appreciates and the IS curve shifts back in to its original position. This is shown in Figure 11 below.
Figure 11. An Expansionary Fiscal Policy with a Floating Exchange Rate
As a result of the expansionary fiscal policy there is no change in output or the interest rate. Thus, there is no change in consumption or investment. The home currency has appreciated. By equation (9), net exports must have gone down by the same amount that government spending went up. Thus, when the
17

exchange rate floats, the government finds that fiscal policy is ineffective at increasing output. The increase in government spending has no effect on output; it just crowds out net exports.
II.D.1.b. An expansionary monetary policy with a floating exchange rate
The expansionary monetary policy causes the LM curve to shift out. This causes the intersection of the IS and LM curves to be below the BP curve. This is in the region of balance of payments deficit. Thus, the currency depreciates. This causes the IS curve to shift out to intersect with the new LM curve and the BP curve. This is shown in Figure 12 below.
Figure 12. An Expansionary Monetary Policy with a Floating Exchange Rate
The expansionary monetary policy causes output to go up, the interest rate to remain unchanged and the currency to depreciate. Consumption goes up because output goes up. Investment is unchanged because the interest rate is unchanged. By equation (9), Y – C has gone up and I + G is unchanged; hence net exports must have gone up.
II.D.2. Expansionary policies when the exchange rate is fixed
This section considers expansionary policy when the exchange rate is fixed. As in section I, an expansionary fiscal or monetary policy will cause the IS or the LM curve to shift out. This will then cause the home interest rate to be above or below the world interest rate and the economy to be in the region of balance of payments surplus or deficit. As a result there will be pressure on the currency to appreciate or depreciate and the central bank must intervene in the foreign exchange market, buying or selling the home currency to eliminate the deficit and to maintain the fixed exchange rate. This will cause the LM curve to shift so that it intersects with the BP and IS curves.
II.D.2.a. An expansionary fiscal policy when the exchange rate is fixed
18

The expansionary fiscal policy causes the IS curve to shift out. This causes the intersection of the IS and LM curves to be above the BP curve. The home interest rate is higher than the world interest rate. This is the region of balance of payments surplus. There is pressure on the home currency to appreciate. The central bank intervenes in the foreign exchange market, selling the home currency. This causes the LM curve to shift out to intersect with the BP and new IS curve. This is shown in Figure 13 below.
Figure 13. An Expansionary Fiscal Policy when the Exchange Rate is Fixed
The expansionary fiscal policy causes output to go up and, thus, consumption goes up. The interest rate is unchanged and, thus, investment is unchanged. The exchange rate is fixed and output went up, hence, net exports must be lower. Since the central bank sold the home currency, it bought foreign currency: its foreign exchange reserves went up.
II.D.2.b. An expansionary monetary policy when the exchange rate is fixed
The expansionary monetary policy causes the LM curve to shift out. This causes the intersection of the IS and LM curves to be below the BP curve. The home interest rate is below the world interest rate. This is in the region of balance of payments deficit. There is pressure on the home currency to depreciate. The central bank must intervene the foreign exchange market, using its foreign exchange reserves to purchase its own currency. This causes the LM curve to shift back to its original position.11
11 This result depends on the country being small and, thus, unable to influence the world interest rate.
19

It is not that monetary policy is ineffective when the exchange rate is fixed (as is fiscal policy when the exchange rate floats). The central bank is not able to pursue an expansionary monetary policy. If it tries to increase the money supply (by purchasing home bonds) it is then immediately forced to decrease the money supply back to its original level by selling foreign exchange reserves. This is an important result in international finance: a country with internationally mobile capital and a fixed exchange rate cannot pursue an independent monetary policy. If it tries, it will just lose foreign exchange reserves.12
12 The only exception to this very general result might be for a large country with an important reserve currency. When the United States followed an expansionary monetary policy under the Bretton Woods system, central banks in the rest of the world intervened to maintain their pegged exchange rates with the dollar.
20