Embed Size (px)
Citation preview
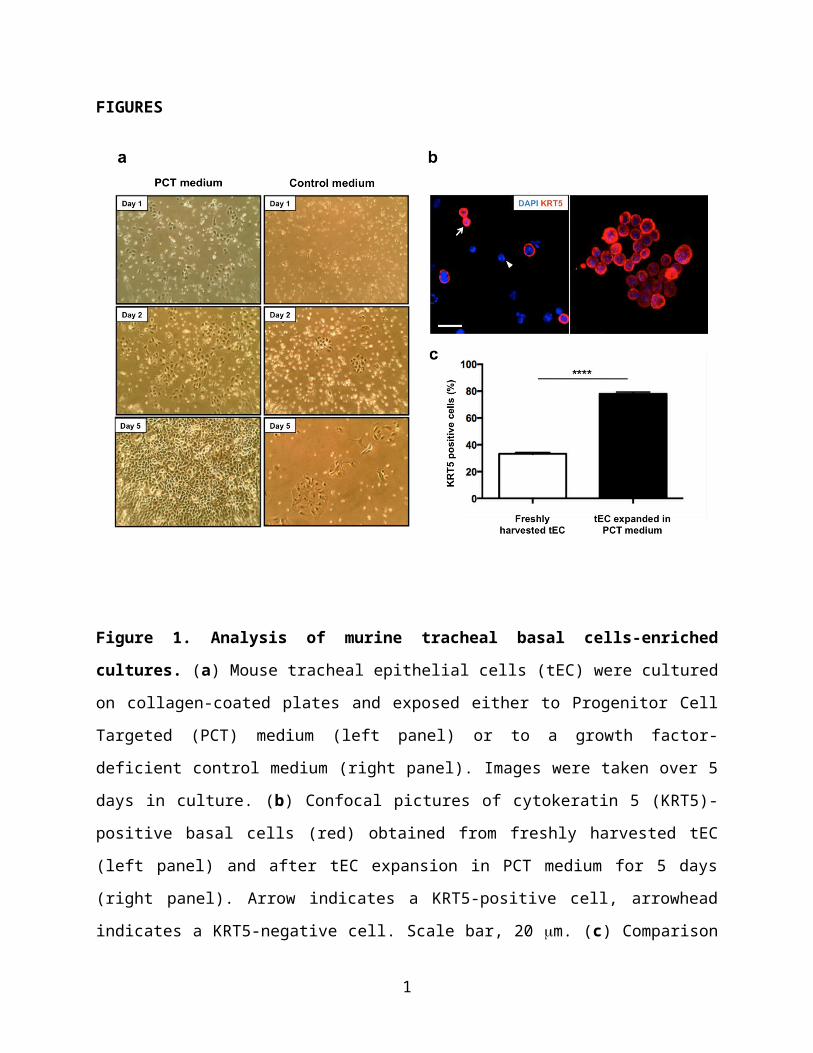
FIGURES
Figure 1. Analysis of murine tracheal basal cells-enriched cultures. (a) Mouse tracheal
epithelial cells (tEC) were cultured on collagen-coated plates and exposed either to Progenitor
Cell Targeted (PCT) medium (left panel) or to a growth factor-deficient control medium (right
panel). Images were taken over 5 days in culture. (b) Confocal pictures of cytokeratin 5 (KRT5)-
positive basal cells (red) obtained from freshly harvested tEC (left panel) and after tEC
expansion in PCT medium for 5 days (right panel). Arrow indicates a KRT5-positive cell,
arrowhead indicates a KRT5-negative cell. Scale bar, 20 m. (c) Comparison of the relative
proportions of KRT5-positive basal cells obtained from freshly harvested tEC (n=3 separate
preparations) and following tEC expansion in PCT medium (n=6 well/group). Cell quantification
was determined from cytospins. Data are presented as mean ± SEM; **** p<0.0001.
1

Figure 2. FACS analysis of basal cells-enriched cultures transduced with F/HN-SIV-GFP.
To obtain basal cells-enriched cultures, murine tracheal epithelial cells (tEC) were expanded in
progenitor cell targeted (PCT) medium. When ~70% confluent, cells were transduced with
F/HN-SIV-GFP using a multiplicity of infection (MOI) of 100. Negative control cells were
exposed to PCT medium without vector addition (n=3/group). tEC obtained from EGFP
transgenic mice were used as positive control (n=6). Three days post infection cells were
analysed by fluorescence-activated cell sorting (FACS) for quantification of GFP-expressing
cells. (a) Schematic representation of the protocol used for ex vivo transduction of basal cells-
enriched cultures. (b) Transduction efficiency of F/HN-SIV in basal cells-enriched tEC cultures.
Data are presented as mean ± SEM; **** = p<0.0001.
2

Figure 3. Detection of cytokeratin 5-positive basal cells transduced with F/HN-SIV vector.
Basal cells-enriched cultures were obtained from a mixed population of tracheal epithelial cells
(tEC) expanded in PCT medium, which is selective for airway progenitor cells. At ~ 70%
confluence, cells were transduced with F/HN-SIV-GFP vector (MOI 100) for 3 days.
Representative confocal images of basal cells-enriched cultures double-stained with antibodies
against cytokeratin 5 (KRT5) and GFP are shown. Arrows and arrowheads indicate two
examples of KRT5/GFP double positive cells. Scale bar, 40 µm.
3

Figure 4. Polidocanol-induced nasal epithelial injury and repair. A single bolus (5 µl) of 2%
(vol/vol) polidocanol (PDOC) was infused into the murine left nostril by nasal sniffing. Samples
were analysed at 1 and 7 days post detergent treatment. (a) Representative image of the nasal
septum 24 hr after PDOC injury. An anti-cytokeratin 5 (KRT5) antibody (brown) was used to
confirm that the basal cell layer on the side exposed to detergent (L, arrowhead) remained intact.
DAB (3,3'-diaminobenzidine) and haematoxylin staining. (b) Widespread disruption of the
epithelium along the nasal turbinates was also observed (representative picture). (c) After 7 days,
the nasal epithelium on the damaged side (L) appeared largely restored, with regions (black
arrow) with ciliated cells not fully differentiated as compared to the undamaged counterpart (R).
Haematoxylin and eosin staining. C: cartilage; R: right nostril; L: left nostril. Scale bars, 50 µm.
4

Figure 5. F/HN-SIV transduction of murine nasal epithelial cells following polidocanol
preconditioning. One day post-treatment with 5 µl 2% (vol/vol) polidocanol (PDOC), mice
(n=4/group/time-point) were perfused with 100 μl F/HN-SIV-GFP vector (108 TU/mouse).
Control mice were treated with the virus only (no-PDOC). Nasal sections were analysed by
confocal microscopy 3 and 14 days after virus transduction. Top and bottom boxes on the left
side display representative pictures of nasal epithelium in PDOC-treated mice at 3 and 14 days
post vector transfection, respectively. Clusters of GFP-positive cells, consisting of putative basal
cells (arrowheads, detection based on morphology and localisation) and of epithelial cells could
be observed, with cilia clearly detectable at 14 days post infection (arrow). Clusters with no
GFP-positive basal cell were also detected (star). The top and bottom boxes on the right side
show representative pictures of nasal epithelium of control mice (no-PDOC) at 3 and 14 days
post-transduction. No GFP expression was detected at 3 days while interspersed GFP-positive
epithelial cells were observed after 14 days. Arrows indicate cilia. Scale bar, 20 µm.
5

Figure 6. Quantification of transduced GFP-expressing basal cells. Mice were perfused with
100 µl F/HN-SIV-GFP (108 TU/mouse) 24 hr after receiving 5 µl of 2% (vol/vol) polidocanol
(PDOC). Control mice were not pre-treated with PDOC (no-PDOC). Quantification of GFP-
positive basal cells (identification based on morphology and location within the epithelial layer)
was performed at 3 and 14 days post viral infection and the relative proportions were compared.
n=4 mice/group/time point. Data are presented as mean ± SEM. * = p<0.05; ** = p<0.01.
6

Figure 7. GFP and cytokeratin 5 expression in polidocanol-preconditioned murine nasal
epithelium at 14 days post F/HN-SIV-GFP transduction. Representative image of murine
nasal epithelium 14 days post infection with 100 μl F/HN-SIV-GFP vector (108 TU/mouse).
Mice were preconditioned with 5 µl of 2% (vol/vol) polidocanol (PDOC) 24 hr prior to viral
infection. Arrowhead indicates colocalization of cytokeratin 5 (KRT5) and GFP signals in a
transduced basal cell. Scale bar, 20 µm.
7

8