Embed Size (px)
Citation preview
Seismic Risk Control of Nuclear Power Plants using Seismic Protection Systems in Stable Continental Regions: the UK case
Index
1. Introduction........................................................................................................................1
2. Objectives and methodology…..........................................................................................4
3. Structural models………………………………………………………………………... 6
3.1 Sample nuclear reactor building……………………………………………….. 63.2 Definition and properties of structural models………………………………... 73.3 Fragility analysis………………………………………………………………..103.4 Soil-structure interaction………………………………………………………..11
4. Definition of seismic input and risk assessment calculations…………………………... 13
5. Scenario-based IDA and unacceptable performance surfaces…………………………... 19
6. Discussion and Conclusions …...……………………………………………………….. 26
6.1 Discussion………………………………………………………………………266.2 Conclusions……………………………………………………………………..28
References…………………………………………………………………………………..30
i

Keywords
Nuclear power plant; seismic risk analysis; seismic isolation; energy dissipation; incremental
dynamic analysis; United Kingdom
1. Introduction
Nuclear power plays a crucial role in energy supply in the world: around 15% of the
electricity generated worldwide is provided by nuclear power stations avoiding around 2.5
billion tonnes of CO2 emissions (Meiswinkel et al., 2013). The seismic design of new nuclear
power plants (NPPs), in order to ensure their safe seismic performance, has received much
greater research interest after the Fukushima Dai-ichi accident (Hirano et al., 2012).
Currently, it is estimated that around 20% of nuclear reactors worldwide are operating in
areas of significant seismic activity (WNA, 2014). In the UK, a tectonically stable continental
region that possesses medium-to-low seismic activity (Musson, 1996), strong earthquakes
capable of jeopardising the structural integrity of NPPs, although infrequent, can still occur
(Musson, 2014). Despite that no NPP has been built in the UK after 1995, a New Build
Programme intended to build 16 GW of new nuclear capacity by 2030 is currently under way
(NIA, 2012). The necessity of correctly assessing all aspects regarding seismic safety of new
generation NPPs in the UK has become a vital issue for the industry (Weightman, 2011). This
article is intended to make a contribution towards that aim.
Seismic protection systems (SPS), such as elastomeric-based bearings and energy dissipation
devices, have been successfully used in more than 10,000 applications (Martelli et al., 2012).
However, only two reactor buildings have been designed with such technology: Koeberg
NPP in South Africa and Cruas NPP in France (Forni et al., 2012). Although these two
applications were designed more than 40 years ago, extensive research has been conducted
since then in order to include SPS in NPPs (Medel-Vera and Ji, 2014). In the UK, laboratory
1

tests were carried out in early 1990s on small-scale specimens of low-damping rubber
bearings and viscous dampers for applications in Liquid-Metal-Cooled Reactors (LMRs)
(Austin et al., 1991). Nowadays, several new projects of isolated reactors in medium-to-low
seismic areas are currently under way: (i) the Jules Horowitz Reactor (JHR) currently under
construction in Cadarache, France (Bignan et al., 2011); (ii) the International Thermonuclear
Experimental Reactor (ITER), also under construction in Cadarache, France (Syed et al.,
2014); (iii) APR1400, currently under construction in South Korea (Lee et al., 2015).
Additionally, some other prominent projects of Generation IV reactors are currently in their
early stages: (i) the Advanced Sodium Technological Reactor for Industrial Demonstration
(ASTRID) to be built in France (CEA, 2012); and (ii) the Advanced Lead Fast Reactor
European Demonstrator (ALFRED) to be built in Romania (Alemberti et al., 2014). All these
applications of reactors consider the use of different types of elastomeric-based bearings:
JHR and ITER share the same design of low-damping rubber bearings (Sollogoub, 2014),
APR1400 uses lead-rubber bearings (Lee et al., 2015), and ASTRID and ALFRED will use
lead-rubber bearings and/or high-damping rubber bearings (Forni, 2015; Moretti and
Pasquali, 2013). Additionally, other approaches to seismically protect reactor buildings
without isolating the entire nuclear island have been investigated: e.g. the Russian VVER-
1000 has been the subject of studies that propose the use of high performance viscous
dampers to protect its critical components in future applications (Kostarev et al., 2003). This
work investigates the suitability of several SPS that can be used in next generation UK
reactors subjected to the seismic conditions of the British Isles.
In this work, a sample NPP reactor building based on a 1000 MW Pressurised Water Reactor
building equipped with three different types of SPS was analysed: (i) an isolated nuclear
island using low-damping rubber bearings plus viscous dampers; (ii) an isolated nuclear
island using lead-rubber bearings, and (iii) a non-isolated nuclear island using only viscous
2
dampers located at the critical components of the NPP. The efficiency of these SPS was
assessed to achieve possible risk reduction for both rock and soil sites in comparison with a
conventional NPP. The risk was calculated following the methodology for seismic
probabilistic risk assessment (SPRA) for NPPs in the UK reported by Medel-Vera and Ji
(2016a). A representative location of a UK nuclear site was selected and the risk was initially
assessed for the single scenario that contributes most strongly to the hazard of such a site.
Then, the variation of risk is studied for different controlling scenarios, following a proposed
scenario-based incremental dynamic analysis (IDA). Scenario-based IDA, as introduced in
this article, aims at the generation of surfaces for the unacceptable performance of NPPs in
the UK as a function of earthquake magnitude (Mw) and distance-to-site (Repi). Unacceptable
performance surfaces can be a substantial contribution to the UK nuclear industry in order to
provide insights as how the seismic risk varies when the NPP is subjected to most (or all)
dominant scenarios of the selected nuclear site.
This work is organised as follows: Section 2 describes the two specific objectives of this
article and the methodology used. Section 3 provides details about the structural models and
their mechanical properties, including the definition of the SPS analysed and the modelling of
the soil-structure interaction. Additionally, description of the fragility curves used to
characterise the critical components of the sample NPP building is provided. Section 4
presents the seismic input definition for the choice of the nuclear site and summarises the risk
assessment calculations performed. Section 5 provides a step-by-step definition of scenario-
based IDA and the estimation of unacceptable performance surfaces. Section 6 discusses
further aspects regarding the appropriateness of SPS for NPPs in the UK and advantages and
limitations of scenario-based IDA and presents the conclusions from this study.
3
2. Objectives and Methodology
This work has two specific objectives: (a) to determine an efficient approach of SPS to
reduce the seismic risk of NPPs buildings subjected to the UK seismic conditions including
the influence of the foundation soil; and (b) to investigate how the reduction in seismic risk
of NPPs buildings changes when considering several or all dominant scenarios for the
particular site selected.
All analyses carried out in this work were made considering a simplified structural model
based on a 1000 MW Pressurised Water Reactor building. Such a structural model was used
to define two types of models: (1) a conventional NPP and (2) a seismically protected NPP.
The former models the reference case, i.e. a traditionally built fixed-to-the-ground NPP
(Model 1 hereafter), whereas the latter comprises three models that use different types of
seismic protection devices suitable for NPPs. The following devices were analysed: (a) low-
damping rubber bearings (LDRB) in combination with linear viscous dampers (LVD) aimed
at adding a 10% critical (viscous) damping (Model 2a hereafter); (b) lead-rubber bearings
(LRB), aimed at adding a 20% critical (hysteretic) damping (Model 2b hereafter); and finally,
(c) linear viscous dampers located at the critical components of the NPP, aimed at adding
30% critical (viscous) damping for each local device (Model 2c hereafter). Then, a site was
selected that is typical UK NPP site with relatively moderate seismicity, including two types
of foundation soil: (i) generic rock site and (ii) generic soil site. The efficiency in reducing
the seismic risk of the NPPs was made using the methodology of SPRA reported by Medel-
Vera and Ji (2016a). In order to give answer to the first objective of this article, the risk was
assessed considering the single scenario (moment magnitude, epicentral distance) that
contributes most strongly to the hazard of the site selected. Figure 1 summarises the tasks
performed to comply with Objective (a) of this work.
4

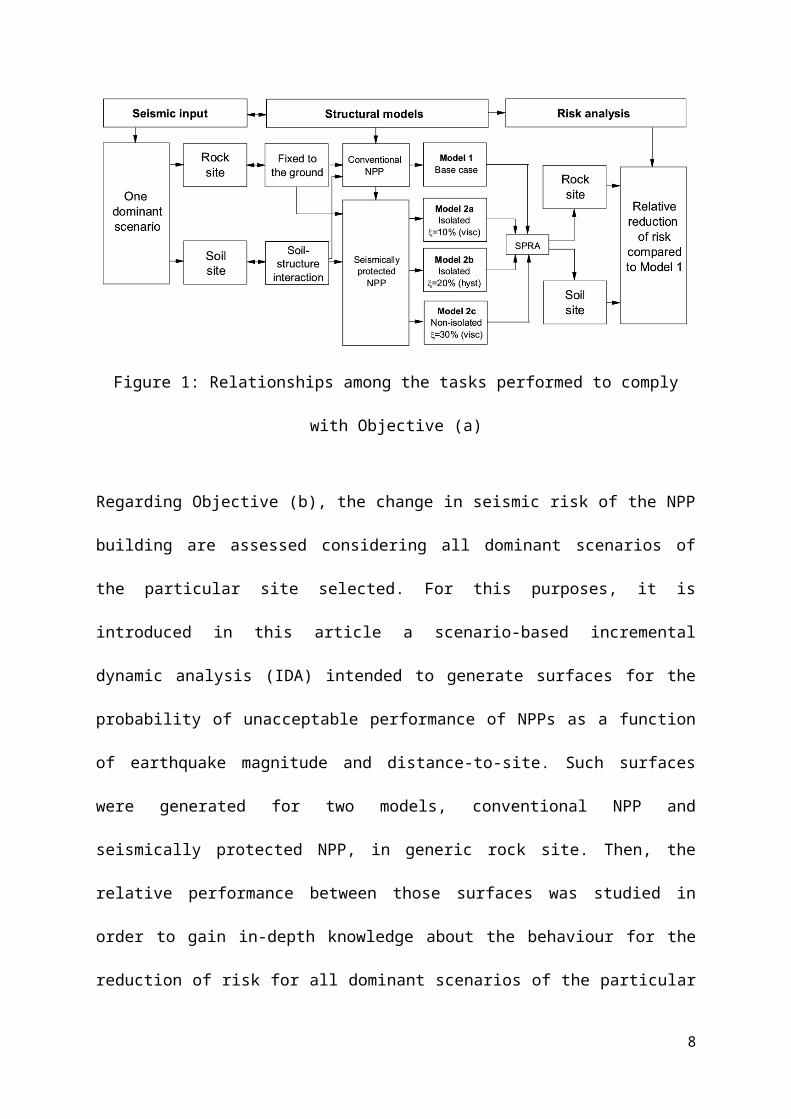
Figure 1: Relationships among the tasks performed to comply with Objective (a)
Regarding Objective (b), the change in seismic risk of the NPP building are assessed
considering all dominant scenarios of the particular site selected. For this purposes, it is
introduced in this article a scenario-based incremental dynamic analysis (IDA) intended to
generate surfaces for the probability of unacceptable performance of NPPs as a function of
earthquake magnitude and distance-to-site. Such surfaces were generated for two models,
conventional NPP and seismically protected NPP, in generic rock site. Then, the relative
performance between those surfaces was studied in order to gain in-depth knowledge about
the behaviour for the reduction of risk for all dominant scenarios of the particular site
selected. Figure 2 summarises the tasks performed to comply with Objective (b) of this work.
Figure 2: Relationships among tasks performed to comply with Objective (b)
5
3. Structural Models3.1 Sample Nuclear Reactor Building
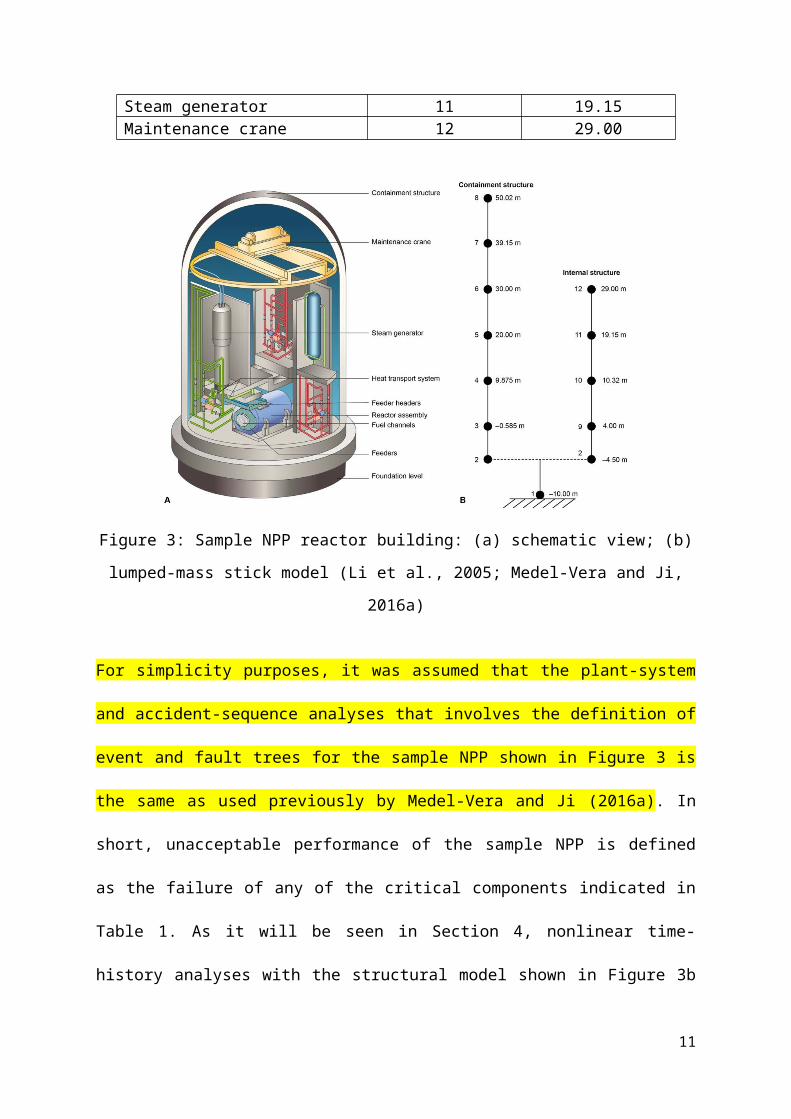
All structural models used in this work were based on a 1000 MW Pressurised Water Reactor
(PWR) shown schematically in Figure 3a. This sample nuclear reactor building is composed
of two structural units: (i) the containment structure (CS), composed of a post-tensioned
concrete cylindrical wall, and (ii) the internal structure (IS), to which the critical key
components of the NPP are attached. These structural units are independent from each other;
hence, they are only connected at the foundation level. The height of the CS and IS are 60 m
and 39 m, respectively, whereas the total weight of the reactor building is approximately
62,000 ton. Figure 3b shows the simplified structural model of the sample NPP used in this
work. Both the CS and IS are modelled as lumped-mass stick models that are the same in
both horizontal directions. Fundamental periods of vibration of the CS and IS are 0.23 s and
0.18 s, respectively. This model has been previously used and validated by the authors for
SPRA for NPPs in the UK (Medel-Vera and Ji, 2016a).
Following Huang et al. (2011; 2010), risk assessments of NPPs are focused on their critical
components supported by the IS. These components control the cost of a NPP project in
terms of design, analysis, construction, testing and regulatory aspects. The critical
components of the sample NPP, node assignment in the structural model and their location
related to the foundation level are summarised in Table 1.
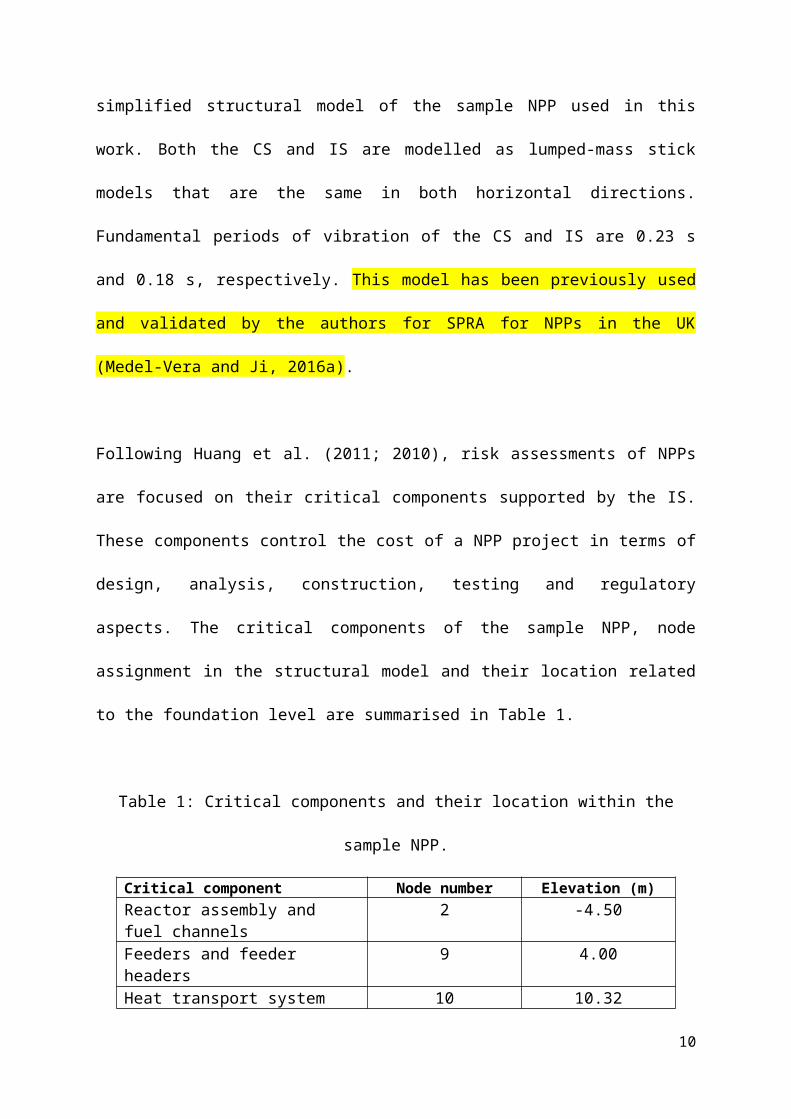
Table 1: Critical components and their location within the sample NPP.
Critical component Node number Elevation (m)Reactor assembly and fuel channels 2 -4.50Feeders and feeder headers 9 4.00Heat transport system 10 10.32Steam generator 11 19.15Maintenance crane 12 29.00
6
Figure 3: Sample NPP reactor building: (a) schematic view; (b) lumped-mass stick model (Li
et al., 2005; Medel-Vera and Ji, 2016a)
For simplicity purposes, it was assumed that the plant-system and accident-sequence analyses
that involves the definition of event and fault trees for the sample NPP shown in Figure 3 is
the same as used previously by Medel-Vera and Ji (2016a). In short, unacceptable
performance of the sample NPP is defined as the failure of any of the critical components
indicated in Table 1. As it will be seen in Section 4, nonlinear time-history analyses with the
structural model shown in Figure 3b were performed. In this work, bilinear shear hinges with
3% post-yield stiffness were assigned to all stick elements of the IS for the definition of the
structural model. The yield capacity of each hinge was estimated as , where
is the compression concrete strength (assumed as 35 N/mm2) and is the shear area of each
stick of the IS as indicated in Li et al. (2005).
3.2 Definition and Properties of Structural Models
7
The properties and particular characteristics of Models 1, 2a, 2b and 2c are defined in detail
in this section. It is worth mentioning that Models 2a and 2b are intended to provide seismic
isolation to the entire nuclear island, i.e. the CS and IS are supported by a common mat which
in turn is separated from the foundation mat by the interface of isolation where the devices
are located. Certainly, due to the nature of the simplified structural model of the sample NPP
used in this work, the seismic isolators modelled for Models 2a and 2b is an assembly of
isolators, i.e. the entire isolation system, rather than all individual isolators. Figure 4 provides
a graphical summary of Models 1, 2a, 2b and 2c studied in this article. The particular
characteristics of each structural model used in this work are described as follows:
- Model 1 is intended to represent the base case, i.e. the NPP building that uses conventional
construction without any kind of seismic protection device.
- In model 2a, the LDRB system was modelled as a horizontal linear spring as these devices
exhibit a visible linear behaviour in shear with little addition of supplemental damping
(Naeim and Kelly, 1999). The stiffness of the spring was selected in order to obtain a
structural period of Tobj = 2 s. Additional external damping was included at the foundation
level by considering = 10% by means of a linear viscous damper whose force-velocity
governing equation is linear and the force-deformation hysteresis curve has oval shape.
- In model 2b, the LRB system was modelled using a bilinear constitutive relationship with
the properties summarised in Table 2. These properties were calibrated using the direct
procedure stated in Naeim and Kelly (1999) considering: design displacement of ud = 25 cm,
fundamental period of vibration of Tobj = 2 s associated to the effective stiffness (peak-to-
peak loads), critical damping ratio of = 20%, and stiffness ratio of Ku = 10Kd. As models
2a and 2b are seismically isolated, it is appropriate to consider for the internal damping a
lower value than the 5% normally used in seismic analysis of structures. Therefore, the
internal damping was modelled considering = 2% as recommended in Chopra (1995).
8
- Model 2c is intended to analyse the effect of using LVD to seismically protect each critical
component of the sample NPP without the need of isolating the entire nuclear island.
Therefore, five viscous dampers were included in the sample NPP. The damping constants
for each device were calculated using , where ( ) is the
mass of each node of the IS, is the fundamental frequency of vibration of the IS, and is
the critical damping ratio of the devices. In this work, a value of = 30% was used for all
devices. This is a simplified procedure to determine the damping constants for connecting
adjacent buildings using viscous dampers that has been used elsewhere (Patel and Jangid,
2009). As this model does not consider seismic isolation, the internal damping in the structure
was modelled considering the traditional = 5%. It is acknowledged that such a
configuration of dampers may not be possible to materialise in an actual application.
Nevertheless, it is considered to be a first approximation on the use of dampers to protect
critical components.
9

Figure 4: Graphical summary of the structural models with seismic protection systems
studied in this article
Table 2: Design features of the structural models used in this work
Model Seismic Protection System Description1 None Conventional NPP
2a Low-damping rubber bearings (LDRB) + linear viscous dampers (LVD) Tobj = 2 s. = 10% (viscous)
2b Lead-rubber bearings (LRB) Tobj = 2 s. = 20% (hysteretic)ud = 25cm; Ku = 10Kd
2c Linear viscous dampers (LVD) Tobj = 0.18 s. = 30% (viscous) for each device
3.3 Fragility analysis
The estimation of fragility curves for the critical components of the sample NPP used in this
work is addressed in detail in Medel-Vera and Ji (2016a). This section only presents a
summary that allow reproducibility of the fragility curves used in this work. In this regard,
the parameters and results of interest are as follows:
10
- Demand parameter selected: average floor spectral acceleration (AFSA) over a frequency
range from 1 to 33 Hz (i.e. the average of 33 floor spectral ordinates at frequencies from 1 to
33 Hz with increments of 1 Hz).
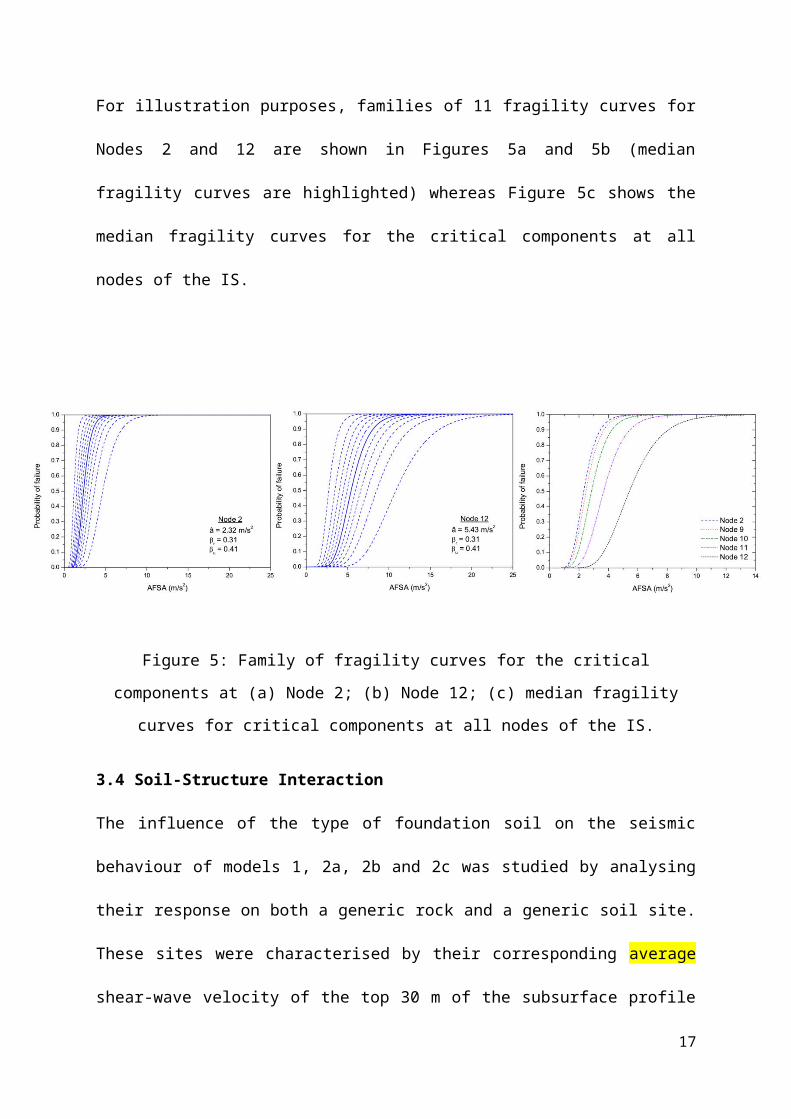
- Deterministic value for each critical component in terms of AFSA: they were estimated
as 2.32, 2.48, 2.85, 3.67 and 5.43 m/s2 for Nodes 2, 9, 10, 11 and 12 respectively.
- Logarithmic standard deviations and : they were estimated as and
.
For illustration purposes, families of 11 fragility curves for Nodes 2 and 12 are shown in
Figures 5a and 5b (median fragility curves are highlighted) whereas Figure 5c shows the
median fragility curves for the critical components at all nodes of the IS.
Figure 5: Family of fragility curves for the critical components at (a) Node 2; (b) Node 12;
(c) median fragility curves for critical components at all nodes of the IS.
3.4 Soil-Structure Interaction
The influence of the type of foundation soil on the seismic behaviour of models 1, 2a, 2b and
2c was studied by analysing their response on both a generic rock and a generic soil site.
These sites were characterised by their corresponding average shear-wave velocity of the top
11
30 m of the subsurface profile ( ). In this work, the rock site was considered to possess
> 760 m/s, whereas for the soil site, it was considered to possess in the region of
360 m/s which is associated to a soft-to-medium soil profile. These definitions are in line
with those made to analyse the influence of the type of soil on the seismic behaviour of other
reactor buildings, e.g. the AP1000 nuclear reactor building (Tuñón-Sanjur et al., 2007).
For the structural models in the rock site, a fixed base connection to the ground was
considered. For the soil site, it is acknowledged that there are currently available thorough
soil-structure interaction (SSI) analyses for nuclear reactors (Elkhoraibi et al., 2014; Ostadan
and Kennedy, 2014; Saxena and Paul, 2012; Saxena et al., 2011). However, such approaches
are out of the scope of this work as this article is intended to provide a first approximation on
the behaviour of NPPs in soil sites in the UK. Therefore, a simple approach to model SSI in
the time domain was followed. Despite several methodologies available to model SSI in the
time domain (Wolf, 1989), a straightforward discrete approach based on soil springs was
implemented in this work. In such a methodology, the interface soil-structure is modelled by
six frequency-independent elastic springs and dampers associated to the six rigid body
degrees of freedom. Such springs and dampers model the dynamic stiffness of the soil located
both underneath and adjoining the embedded portion of the building. In nuclear engineering
research, such an approach has been used previously (e.g. Bhaumik and Raychowdhury
(2013) and Wagenknecht (1987)). In this work, the soil springs proposed by Llambias et al.
(1993) and validated in Llambias (1993) were directly used as they were proposed for PWR
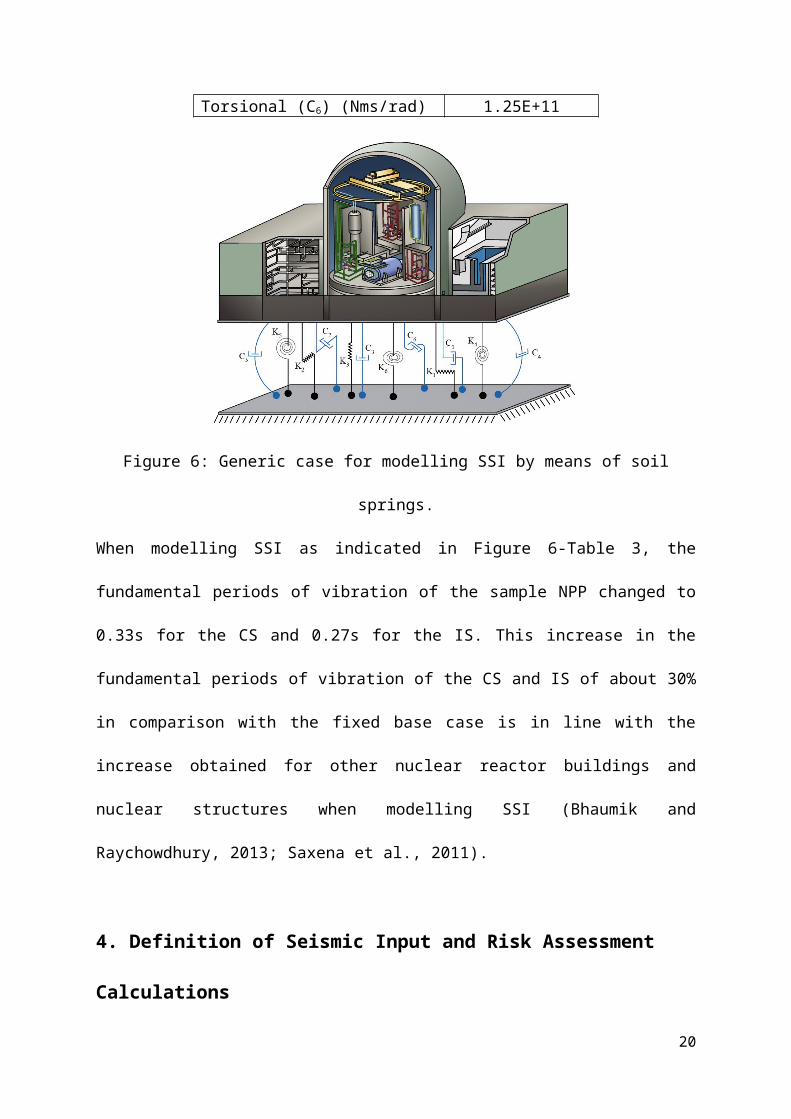
buildings in UK soil sites. Figure 6 shows the generic case for modelling SSI using soil
springs and Table 3 shows the values for such springs proposed by Llambias et al. (1993).
Table 3: Soil springs proposed by Llambias et al. (1993).
Direction Value
12
Stiffness termsTranslational (K1, K2) (N/m) 3.87E+10Vertical (K3) (N/m) 9.27E+10Rotational (K4, K5) (Nm/rad) 2.64E+13Torsional (K6) (Nm/rad) 1.78E+13
Damping termsTranslational (C1, C2) (Ns/m) 1.02E+09Vertical (C3) (Ns/m) 3.39E+09Rotational (C4, C5) (Nms/rad) 2.95E+11Torsional (C6) (Nms/rad) 1.25E+11
Figure 6: Generic case for modelling SSI by means of soil springs.
When modelling SSI as indicated in Figure 6-Table 3, the fundamental periods of vibration of
the sample NPP changed to 0.33s for the CS and 0.27s for the IS. This increase in the
fundamental periods of vibration of the CS and IS of about 30% in comparison with the fixed
base case is in line with the increase obtained for other nuclear reactor buildings and nuclear
structures when modelling SSI (Bhaumik and Raychowdhury, 2013; Saxena et al., 2011).
4. Definition of Seismic Input and Risk Assessment Calculations
The level of seismic hazard of nuclear sites in the UK is defined by a seismic event of an
annual frequency of exceedance of 10-4, corresponding to a return period of 10,000 years
(HSE, 2011). Therefore, it is of interest to determine the scenario (magnitude, distance) that
13
contributes most strongly to the site’s hazard for a 10,000 years return period at the
fundamental period of the base case (Model 1). The hypothetical nuclear site selected for risk
assessments in this work was the town of Holyhead, Anglesey. This site was considered to be
representative of an actual UK nuclear site as the Wylfa Nuclear Power Station was built in a
nearby location in Anglesey (Magnox, 2011). The estimation of the dominant seismic
scenario was taken from the deaggregation of the hazard curve of Holyhead proposed by
Goda et al. (2013) for 10,000 years return period at a structural period of 0.2s (for simplicity,
the hazard defined for a structural period of 0.2s was assumed to be valid for the fundamental
period of the IS equal to 0.18s). The scenario that contributes most strongly the site’s hazard
is an earthquake magnitude Mw 5.3 at a hypocentral distance of 15 km (average between 10
and 20 km). Accelerograms compatible with such a scenario both in rock and soil sites will
be later required to perform time history analysis of the structural models defined in Section
3. For simplicity, it was assumed a very small focal depth; hence .
Accelerograms compatible with this scenario were simulated using the stochastic ground
motion accelerogram model calibrated for NW Europe proposed and validated in Medel-Vera
and Ji (2016b). The model is a set of predictive equations of parameters that define a time-
modulated filtered white noise process. Such a stochastic process is defined by: (i) a 6-
parameter time-modulating function and (ii) a 3-parameter time-varying linear filter. The set
of predictive equations for these parameters were calibrated by means of the random-effects
regression technique using a small dataset of 220 accelerograms recorded in the stable
continental region of NW Europe. The model simulates accelerograms compatible with
seismic scenarios defined by earthquake magnitudes 4<Mw<6.5, distance-to-site
10<Repi<100km and different types of soil (rock, stiff and soft soil). Certainly, the underlying
assumption of using this model is that the nature of accelerograms caused by moderate-to-
14
strong earthquakes in Britain would be similar to those caused in the broader region of NW
Europe due to geographical proximity.
In Medel-Vera and Ji (2016a), it was reported that a suite of 200 accelerograms was sufficient
to estimate the probability of unacceptable performance of NPPs with high statistical
confidence. Following this result, two sets of 200 accelerograms each were simulated for
both rock and soil sites. For illustration purposes, Figure 7 shows a graphical summary of the
two bins of 200 accelerograms each for the rock and soil sites that are compatible with the
seismic scenario that contributes most strongly to the hazard of site selected. Figure 7a shows
a small sample of three simulated accelerograms from each bin. Figure 7b shows the 5%
damped spectral acceleration of 50 simulated accelerograms from each bin. Figure 7c shows
the median, 84th and 16th percentiles of the 200 simulated accelerograms from each bin.
These statistics are compared with those estimated using two GMPEs that have been deemed
to be suitable for use in the UK: Bommer at el. (2007) and Campbell and Bozorgnia (2008).
The former was calibrated for Europe and the Middle East whereas the latter is an NGA
model calibrated for active crustal regions. Both GMPEs were used to define the current
national seismic hazard map for the UK (Musson and Sargeant, 2007).
15
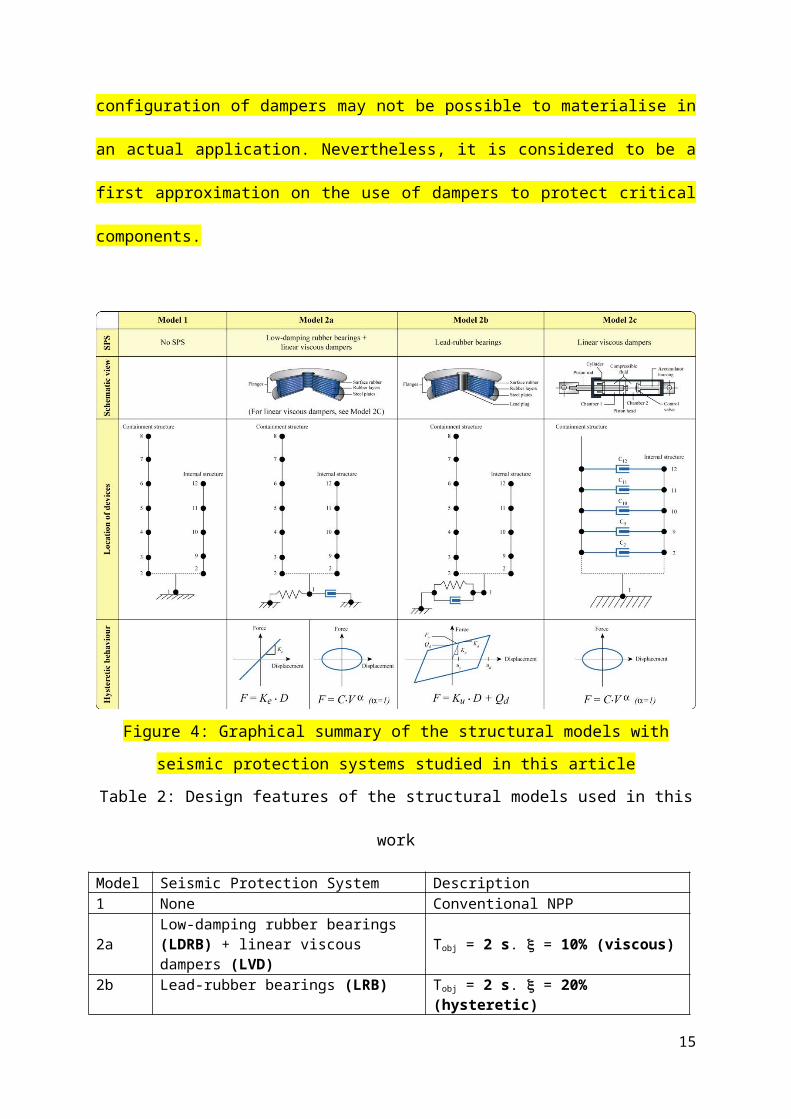
Figure 7: Summary of the accelerogram definition compatible with earthquake magnitude
Mw5.3 at 15km distance in rock and soil sites: (a) sample of three simulations; (b) 5%
damped spectral acceleration of 50 sample simulations; (c) median, 84th and 16th percentiles
of the 200 simulations compared with two GMPEs suitable for UK use.
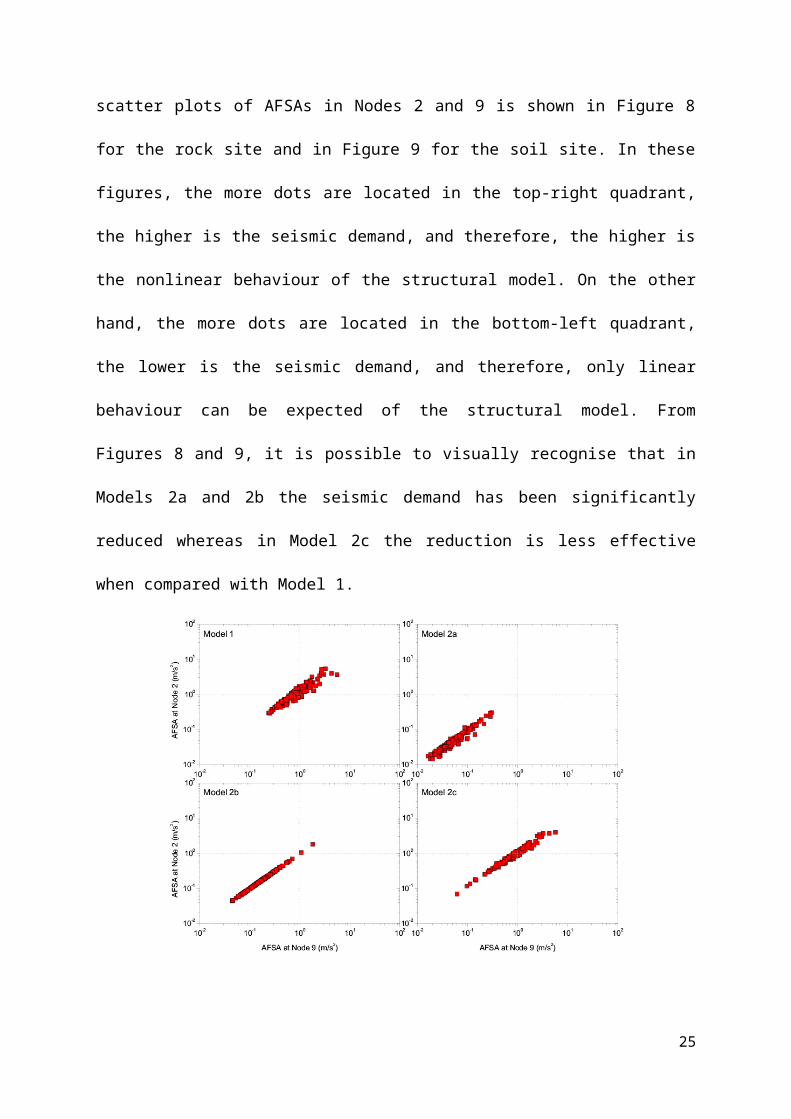
Nonlinear time-history analysis were conducted for Models 1, 2a, 2b and 2c using the two
bins of accelerograms defined in Section 4 for both the rock and soil sites. For illustration
purposes, an example of the damage state for all models as scatter plots of AFSAs in Nodes 2
and 9 is shown in Figure 8 for the rock site and in Figure 9 for the soil site. In these figures,
the more dots are located in the top-right quadrant, the higher is the seismic demand, and
therefore, the higher is the nonlinear behaviour of the structural model. On the other hand, the
more dots are located in the bottom-left quadrant, the lower is the seismic demand, and
therefore, only linear behaviour can be expected of the structural model. From Figures 8 and
9, it is possible to visually recognise that in Models 2a and 2b the seismic demand has been
16
significantly reduced whereas in Model 2c the reduction is less effective when compared with
Model 1.
Figure 8: Scatter plots of AFSAs at Nodes 2 and 9 for all models in the rock site
Figure 9: Scatter plots of AFSAs at Nodes 2 and 9 for all models in the soil site
17
Once the damage state for the four models has been calculated, the seismic risk was assessed.
Full details about the methodology used in this work to assess the seismic risk can be found
in Medel-Vera and Ji (2016a). For the sake of simplicity, this section only presents the results
of performing risk assessment calculations. The methodology requires three input variables to
calculate the seismic risk of NPPs: (i) the number of fragility curves for each critical
component, (ii) the number of observations of the damage state (i.e. the number of
accelerograms used to perform nonlinear time-history analysis), and (iii) the number of trials
required to estimate the statistical distribution of the probability of unacceptable performance
of the NPP. From the results reported by Medel-Vera and Ji (2016a), a sensitivity analysis
showed that a robust estimation of the probability of unacceptable performance of the sample
NPP is obtained when considering: (i) a family of 21 fragility curves for each critical
component, (ii) 200 accelerograms to conduct nonlinear time-history analysis, and (iii) 2000
trials to generate a numerically stable statistical distribution for the probability of
unacceptable performance. Therefore, such values were used when computing seismic risk of
all structural models presented in this work.
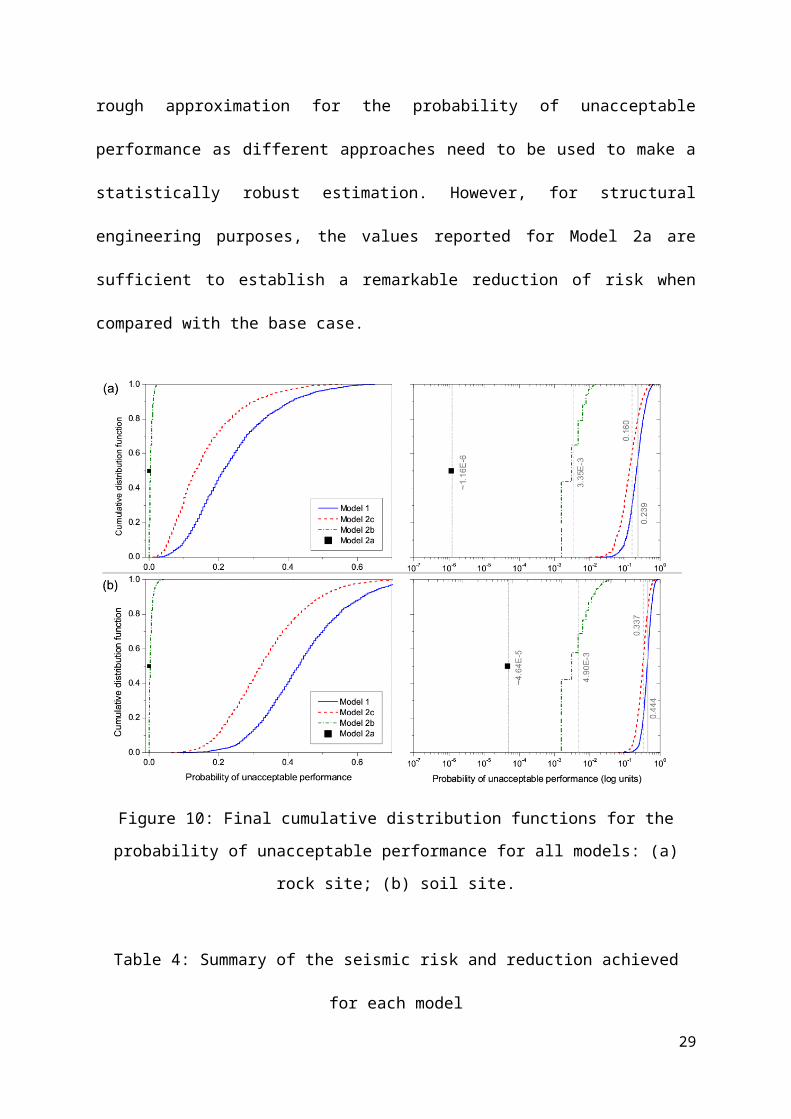
The final cumulative distribution functions for the probability of unacceptable performance
for all models are shown in Figure 10a for the rock site and Figure 10b for the soil site. The
mean value for each distribution was taken as the benchmark value for the seismic risk for
each model; these final values are indicated in Table 4. It is worth mentioning that for Model
2a, it was not possible to obtain a robust estimation of the probability of unacceptable
performance. This is due to the fact that the seismic demand was considerably reduced: the
probability of unacceptable performance obtained was zero when using 200 observations of
the damage state. This does not mean that the probability of unacceptable performance is zero
as the seismic demand, although notably low, is greater than zero (see Figures 8 and 9). This
18

means that the probability of unacceptable performance is an extremely small number that
needs a much greater number of observations of the damage state and trials to be captured by
the methodology used. In order to find a first approximation for the probability of
unacceptable performance of Model 2a, the number of accelerograms was enlarged to 400,
the number of fragility curves was increased to 201 and the number of trials was augmented
to 6000, in order to obtain a value for the probability of unacceptable performance greater
than zero. The values shown in Figure 10 and Table 4 associated to Model 2a are only
intended to give a rough approximation for the probability of unacceptable performance as
different approaches need to be used to make a statistically robust estimation. However, for
structural engineering purposes, the values reported for Model 2a are sufficient to establish a
remarkable reduction of risk when compared with the base case.
Figure 10: Final cumulative distribution functions for the probability of unacceptable
performance for all models: (a) rock site; (b) soil site.
19
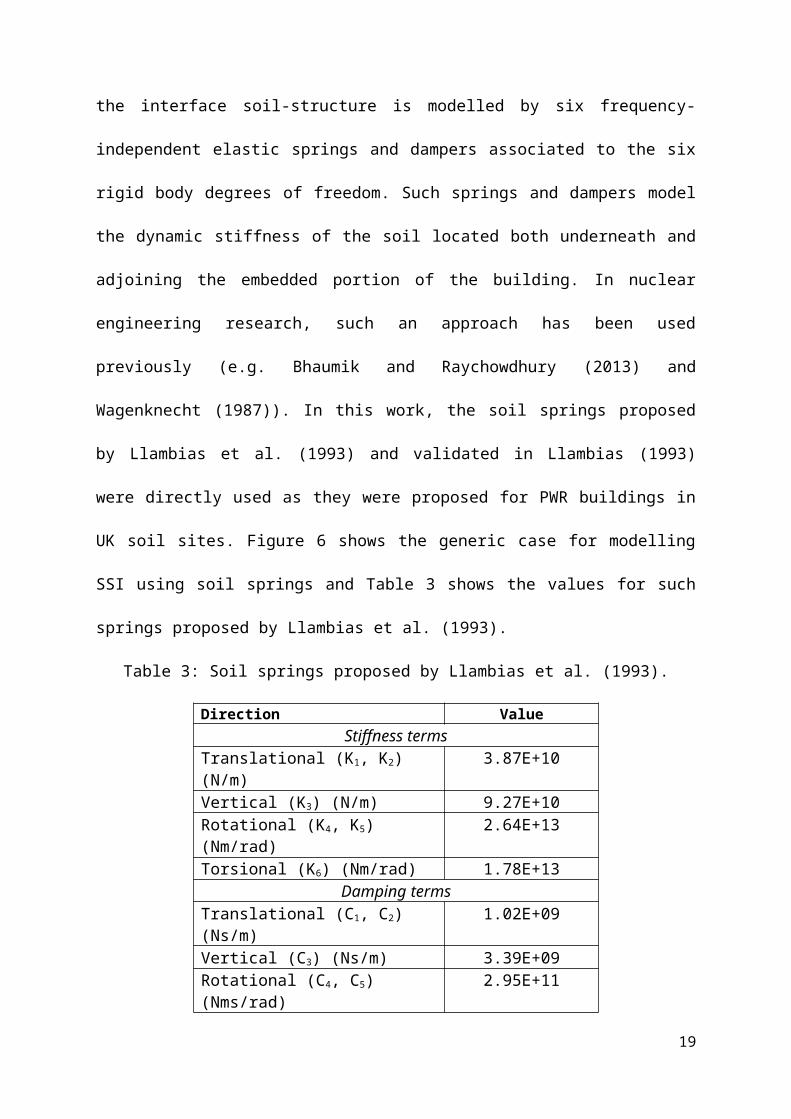
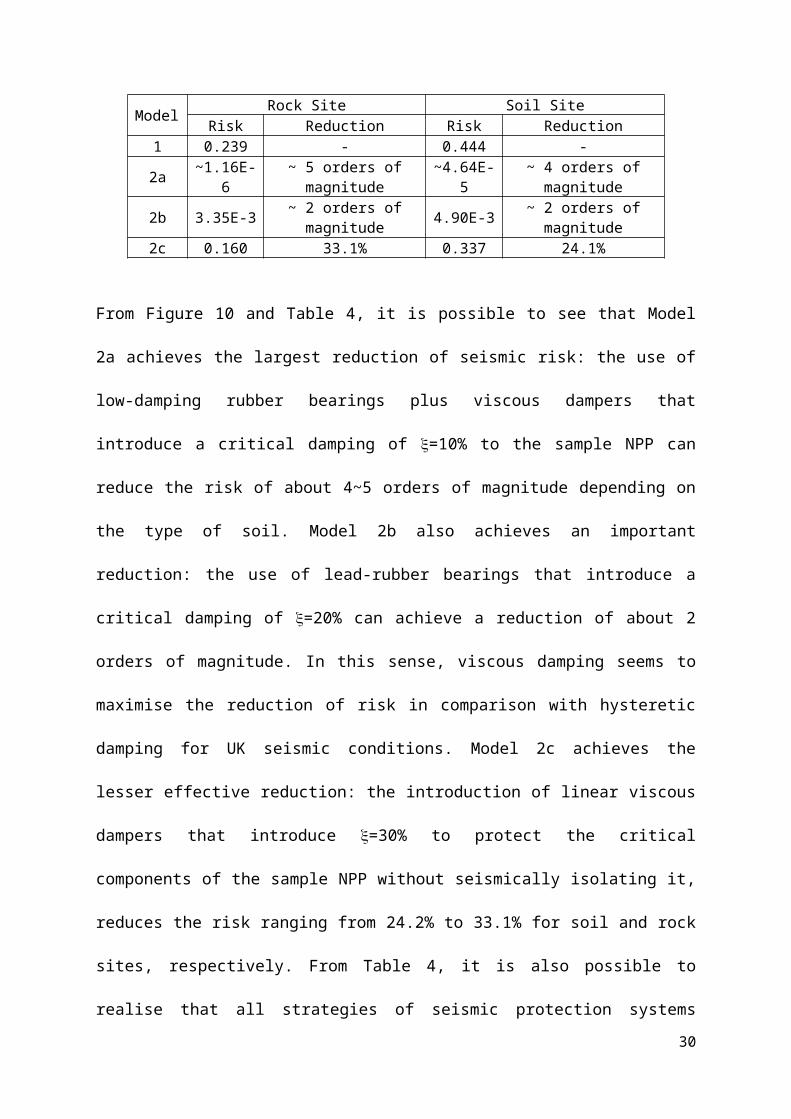
Table 4: Summary of the seismic risk and reduction achieved for each model
Model Rock Site Soil SiteRisk Reduction Risk Reduction
1 0.239 - 0.444 -2a ~1.16E-6 ~ 5 orders of magnitude ~4.64E-5 ~ 4 orders of magnitude2b 3.35E-3 ~ 2 orders of magnitude 4.90E-3 ~ 2 orders of magnitude2c 0.160 33.1% 0.337 24.1%
From Figure 10 and Table 4, it is possible to see that Model 2a achieves the largest reduction
of seismic risk: the use of low-damping rubber bearings plus viscous dampers that introduce a
critical damping of =10% to the sample NPP can reduce the risk of about 4~5 orders of
magnitude depending on the type of soil. Model 2b also achieves an important reduction: the
use of lead-rubber bearings that introduce a critical damping of =20% can achieve a
reduction of about 2 orders of magnitude. In this sense, viscous damping seems to maximise
the reduction of risk in comparison with hysteretic damping for UK seismic conditions.
Model 2c achieves the lesser effective reduction: the introduction of linear viscous dampers
that introduce =30% to protect the critical components of the sample NPP without
seismically isolating it, reduces the risk ranging from 24.2% to 33.1% for soil and rock sites,
respectively. From Table 4, it is also possible to realise that all strategies of seismic
protection systems considered in this work were effective in reducing the risk for UK seismic
conditions; however, the efficiency is always greater in the rock site than the soil site. These
results are stated from a predominantly structural engineering viewpoint and for a stand-alone
seismic risk study. Therefore, they cannot be directly used for conditions different to what
was assumed in this work.
5. Scenario-based IDA and unacceptable performance surfaces
In previous sections, all seismic risk assessments were made considering the single scenario
that contributed most strongly to the hazard of the site selected, namely, an earthquake Mw5.3
20
located at Rhyp=15 km. As mentioned in Section 4, this scenario was obtained as a result of
the deaggregation of the seismic hazard curve of the site selected. Nevertheless, the
determination of the controlling seismic scenario depends on the spatial seismicity modelling
and ground motion modelling when the seismic hazard assessment of the site is conducted.
Goda et al. (2013) reported that for the UK, “dominant scenario events identified based on
different smoothing approaches vary significantly, which may have important implications
for advanced earthquake engineering applications (e.g., response spectral shape and record
selection for nonlinear dynamic analysis)”. For the particular case of the hypothetical nuclear
site selected in this work, namely, Holyhead, Anglesey, Goda et al. (2013) showed that
controlling scenarios for a structural period of 0.2s may fall into scenarios that approximately
comprises magnitudes 4.5 < Mw < 6.5 and distances 10 < Rhyp < 60 km depending on the
spatial seismicity model and the attenuation models used. The modelling of these two effects
plays a role particularly important in low-seismicity regions due to a large uncertainty about
seismological and tectonic knowledge present in these regions (Atkinson and Goda, 2011). It
is therefore desired to know how the seismic risk of the sample NPP used in this work
changes when different controlling scenarios are taken into account. To assess such an effect,
it is proposed to use a scenario-based incremental dynamic analysis (IDA) that is a
straightforward approach based on the conventional IDA. Certainly, scenario-based IDA, as
presented in the following section, is an approach that fits in scenario-based assessments of
risk as described in Medel-Vera and Ji (2016a). Potential applications in intensity- and time-
based assessments are left as a matter of further research.
Conventional IDA (Vamvatsikos and Cornell, 2002, 2004) is a powerful tool used in
structural and earthquake engineering to estimate the dynamic behaviour of a structure that is
forced to cover the complete range of structural response, from elastic behaviour to global
dynamic instability. IDA establishes a relationship between an intensity measure (IM, e.g.
21
PGA, PGV, 5% damped spectral acceleration at the structure’s first-mode period, etc) of a
multiply scaled suite of accelerograms and a damage measure (DM) of the structure, i.e. any
observable structural output due to a given IM (e.g. peak roof drift, maximum peak inter-
storey drift angle, etc.). Although IDA has been widely used in research (e.g. (Liao et al.,
2007; Tagawa et al., 2008; Zareian and Krawinkler, 2007)), its main limitation has been
regarded as the legitimacy of the rather simple approach to monotonically scale
accelerograms to several IMs (Bradley, 2013; Kiani and Khanmohammadi, 2015). Careful
selection of the seed accelerograms is needed to appropriately represent the changing
characteristics of recordings (intensity distribution, frequency content and time duration) for
progressively increasing IMs selected. Extensive literature is currently available aimed at the
efficient selection of records in order to reduce the bias in the structural response (Haselton et
al., 2009). This has led basis for several variations of IDA, e.g. Progressive IDA (Azarbakht
and Dolšek, 2011) that is aimed at the optimal selection of accelerograms reducing the
number of recordings needed in comparison with conventional IDA; and Adaptive IDA (Lin
and Baker, 2013) that adaptively changes the suites of accelerograms at different IM levels to
better reflect the variation of accelerograms’ properties as to be in agreement with the site’s
hazard analysis. In this work, it is proposed to use a Scenario-based IDA for risk assessments
purposes of NPPs. In this sense, the main difference between philosophies between
traditional IDAs and the proposed methodology is that the latter does not seek to estimate the
IM that would produce global dynamic instability of the structure; rather, it intends to
estimate the IM that would produce a 100% of probability of unacceptable performance
which in turn can be defined according to particular performance requirements of the NPP
analysed. Certainly, as the seismic performance required for NPPs is more stringent than for
conventional civil structures, it is expected that for the IM that produces 100% probability of
unacceptable performance, global dynamic instability is still far from being reached.
22
The proposed procedure is explained by means of an example of application. This example
aims at the estimation of the relative reduction of risk between a conventional NPP and its
seismically isolated version for different seismic scenarios. As shown in Section 4, the use of
LDRB in combination with LVD gave the most effective reduction of risk for the particular
scenario analysed. Also, Table 4 demonstrated that for UK conditions, seismic protection
systems were more effective in rock compared to soil conditions. Therefore, Models 1 and 2a
in rock conditions were used in the subsequent example. The following steps were taken to
conduct scenario-based IDA:
(a) Definition of IM: Unlike conventional-type IDAs that normally use only one IM,
scenario-based IDA uses two IMs: earthquake magnitude (Mw) and distance-to-site (Repi). In
this light, the final product of scenario-based IDA is a surface rather than a curve. For the
particular sample NPP used in this work, Repi was increased from 10 km to 60 km in
increments of 10 km. Then, for each Repi, the earthquake magnitude Mw was increased from
4.5 to 6.5 in increments of 0.2. Then, for each scenario defined by the pair (Mw, Repi), bins of
accelerograms were simulated using the stochastic accelerogram model for NW Europe
(Medel-Vera and Ji, 2016b) used also in Section 4, making a total of 66 bins of 400
accelerograms each, i.e. 26,400 simulated accelerograms (it is worth mentioning that 200
accelerograms of each bin were used for Model 1 whereas the 400 recordings of each bin
were used for Model 2a, following the results reported in Section 4). In this sense, instead of
progressively scale accelerograms as is done in traditional IDA methodologies, in the
proposed methodology an epicentral distance is fixed and the earthquake magnitude is
progressively increased to then stochastically simulate accelerograms compatible with that
given scenario. This definition of seismic inputs explicitly guarantees that accelerograms’
properties are preserved when the IMs are increased requiring no scaling, selection and
matching techniques. A small sample of 6 bins of the simulated accelerograms is shown in
23
Figure 11. In this Figure, two accelerograms plus the 5%-damped spectral acceleration of 50
simulations are shown for the bins of magnitudes Mw 4.5, 5.5 and 6.5 for the epicentral
distances Repi 10, 30 and 60 km.
Figure 11: Sample of bins of simulated accelerograms: two simulations plus 5%-damped
response spectra for 50 simulations for the bins of magnitudes Mw 4.5, 5.5 and 6.5 for the
epicentral distances Repi 10, 30 and 60 km.
(b) Definition of DM: As the analysis proposed is intended to use for risk assessments, the
DM used in this work was the mean probability of unacceptable performance of the sample
NPP as defined in Section 4. Nevertheless, it is worth mentioning that the underlying measure
for the seismic demand used to define the probability of unacceptable performance was the
AFSA over a frequency range of 1 to 33 Hz for calculated in all critical components.
24

(c) Assessment of risk: Once the IM and DM are defined, nonlinear time-history analyses
were performed using Models 1 and 2a and the risk was assessed following the methodology
stated in Section 4. For simplicity, the mean value was taken as the benchmark value for the
probability of unacceptable performance for both models.
(g) Generation of unacceptable performance surfaces: After the risk is assessed, the post-
processing of the results basically involves the generation of surfaces of the unacceptable
performance as a function of Mw and Repi. In this example, interpolation of discrete points was
made (i) for the earthquake magnitude in units of 0.1 and (ii) for the epicentral distance in
units of 5 km; hence, the matrix of results (magnitude, distance) is of size 21 x 11. For Model
1, the colour map surface for the mean for the probability of unacceptable performance is
shown in Figure 12. From this figure, it is possible to see that the surface has a nonlinear
behaviour reaching a maximum of 88.2% for the scenario Mw6.5, Repi10 km.
Figure 12: Colour map surface for the mean unacceptable performance of Model 1.
Similarly, for Model 2a, the colour map surface for the mean probability of unacceptable
performance is shown in Figure 13. All scenarios analysed in this figure were within the
linear range of the structural response, reaching a maximum value of 0.13% for the scenario
Mw6.5, Repi10 km. For this scenario, the demand of displacement on the isolation system was
25
less than 7cm for which the devices are expected to fully remain in their elastic range. In this
example, both Figure 12 and 13 must not be taken in absolute terms, but rather, in terms of
the relative performance between them. In this sense, it is of interest to study the behaviour of
the risk reduction for all the scenarios considered.
Figure 13: Colour map surface for the mean unacceptable performance of Model 2a
As it can be of interest to study the behaviour of risk reduction of the sample NPP for all
dominant scenarios, the relative performance shown in Figures 12 and 13 was also analysed.
Figure 14 shows both surfaces of unacceptable performance of Models 1 and 2a in log units
as stacked wire frames. In this figure, it is possible to see that there are several orders of
magnitude separating both surfaces suggesting the effectiveness of the isolation system in
reducing the risk throughout the set of scenarios considered. In order to gain an in-depth
understanding of the reduction of risk, Figure 15 shows a spline-smoothed contour plot for
the reduction of risk defined as the ratio between Models 1 and 2a. In general, this figure
shows that the reduction of risk ranges from 3 to 5 orders of magnitude while for most
scenarios the reduction is in the region of 4 orders of magnitude.
26
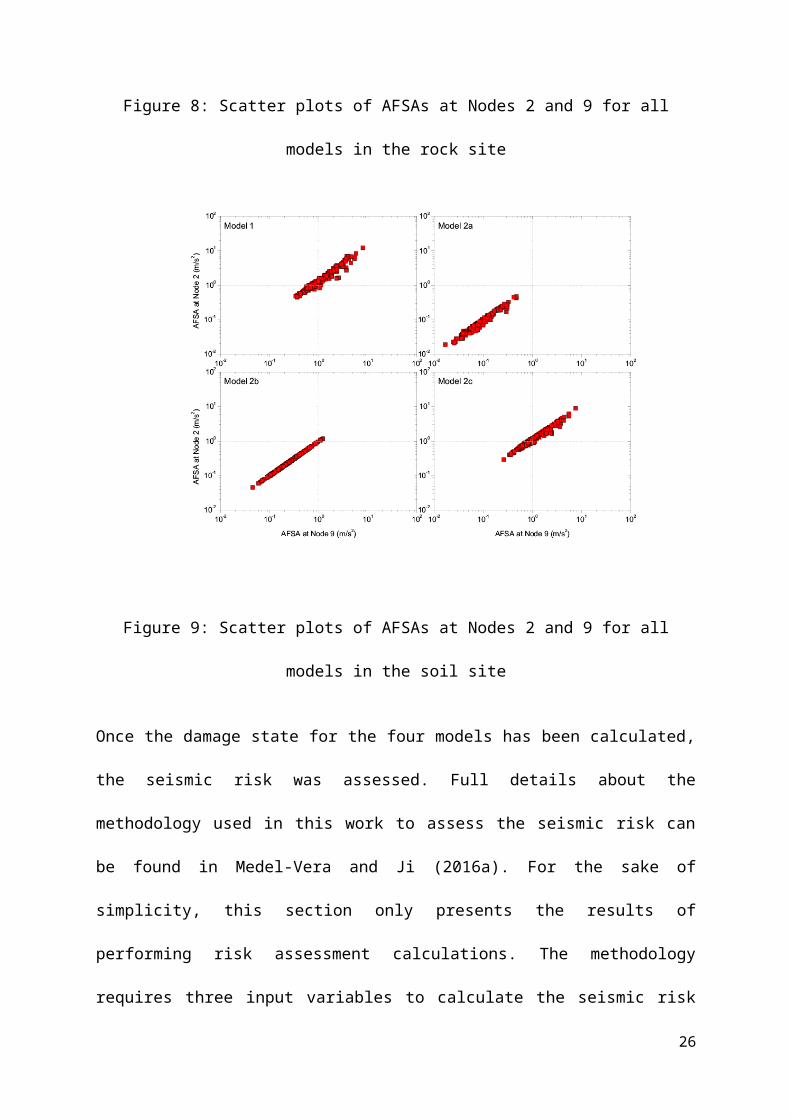
Figure 14: Mean unacceptable performance surface (wire frame) for Models 1 and 2a (in log
scale)
Figure 15: Spline-smoothed contour plot for the reduction of risk between Model 1 and
Model 2a
6. Discussion and Conclusions
6.1 Discussion
* On the determination of the unacceptable performance for seismically isolated models: As
mentioned in Section 4, the seismic demand on critical components of seismically isolated
27
nuclear reactor buildings (in particular Model 2a in this work) is significantly reduced by the
use of isolation devices. This reduction leads to a probability of unacceptable performance
that is an extremely small number which conventional SPRA approaches cannot capture with
total accuracy. These events of exceptionally low probability of occurrence fall into the so-
called rare events simulation domain for which efficient approaches that can adaptively
sample the input are available in the literature. Examples of such procedures are: line
sampling (Schuëller et al., 2004), horseracing simulation (Zuev and Katafygiotis, 2011),
subset simulation (Au and Beck, 2001), etc. Though the values reported in this work for the
probability of unacceptable performance of seismically isolated NPPs are considered
acceptable for structural engineering purposes, adaptive sampling procedures could be used
to improve the accuracy of the values obtained in this work.
* Recommended approach for using SPS in potential NPPs in UK seismic conditions: Results
obtained in this work suggest that for UK seismic conditions, the use of low-damping rubber
bearings and supplemental viscous dampers would be more effective in reducing the seismic
risk than lead-rubber bearings. This result is more in agreement with the approach followed
by the JHR and ITER reactor buildings in contrast with the devices selected for the
APR1400, ASTRID and ALFRED reactor buildings. Also, this result obtained in terms of
probabilistic risk assessment confirms the early attempts (although unfruitful) based on
small-scale experimental tests to encourage the use LDRB and VD in nuclear reactor
buildings in the UK (Austin et al., 1991). The devices recommended for potential nuclear
deployments in the UK have several advantages. Low-damping rubber bearings are: (i)
simple to manufacture as the compounding and bonding process to steel is well understood,
(ii) easy to model, and (iii) their mechanical response is unaffected by rate, temperature,
history, or ageing (Naeim and Kelly, 1999). As these devices are able to dissipate little
energy, a supplementary damping system based on viscous dampers seems to be an efficient
28
alternative. Viscous dampers are: (i) activated at low displacements, (ii) require minimal
restoring force, (iii) easy to model, and (iv) their mechanical properties are largely frequency-
and temperature-independent (Symans et al., 2008). It is worth remembering that this result is
stated from a predominately structural engineering viewpoint and for the stand-alone seismic
risk study presented in this work. Other important aspects such as through-life operational
safety and licensing aspects of the seismic protection systems were not considered in this
work.
* Use of computer time of scenario-based IDA: It is acknowledged that the proposed
methodology of scenario-based IDA to determine unacceptable performance surfaces of
NPPs is computationally demanding. The major task contributing to the use of computer
resources is the realisation of a large number of nonlinear time-history analyses of a structural
model of the NPP. Minor tasks contributing to the use of computer resources are: (i) the
simulation of accelerograms compatible with seismic scenarios of interest and (ii) performing
the analysis of risk (SPRA) for each scenario of interest. For real NPP projects, structural
models could reach several thousands of degrees of freedom possessing a significant amount
of systems, equipment and critical components whose seismic response need to be analysed
in detail. Nevertheless, the extremely high criticality of NPPs projects are deemed worthy of
investing such resources. Nowadays, powerful computational resources are available to the
technical community to perform such extremely demanding tasks, e.g. ARCHER, the UK
National Supercomputing Service, a system that possesses 118,080 processor cores enabling
it to perform 3x10¹⁴ instructions per second.
6.2 Conclusions
The work conducted for this article has led to the following conclusions:
29
* The use of low-damping rubber bearings plus viscous dampers that provide a critical
damping (viscous) of =10% seems to be an effective approach for UK seismic conditions.
This approach was more efficient to reduce the risk than the use of lead rubber bearings that
provide a critical damping (hysteretic) of =20%. This is due to the fact that hysteretic
damping-based systems need to be subjected to a rather significant demand of displacement
in order to develop their full capacity to dissipate energy. A relatively high unused capacity
of energy dissipation of these systems is likely to occur if used in the low seismic
environment of the British Isles. As viscous damping-based systems are generally activated at
low demand of displacements, they are more suitable for the UK seismic conditions.
Regarding the foundation soil, the efficiency in reducing such risk was always greater in rock
conditions in comparison with soil sites.
* Scenario-based IDA is an intuitive and straightforward methodology to study how the
seismic risk of NPPs changes when considering different controlling scenarios. The
procedure simplifies the assembly of accelerograms compatible with the seismic scenarios of
interest by means of direct stochastic simulation. This methodology avoids the use of
procedures normally used in conventional-type IDAs, such as (i) the correct selection of seed
accelerograms in order to avoid bias in the structural response, and (ii) the use of scaling
procedures in order to match spectral shapes predicted by ad-hoc GMPEs. The final product
of scenario-based IDA is a surface rather than a curve as obtained in traditional IDAs as it
provides the probability of unacceptable performance of NPPs as a function of earthquake
magnitude (Mw) and distance-to-site (Repi). The necessity of conducting scenario-based IDA
for NPPs lies on the high uncertainty in determining controlling seismic scenarios in areas of
medium-to-low seismicity. Therefore, it is vital to study how the seismic risk of NPPs
changes by covering the entire range of scenarios likely to occur in the site selected using a
rational approach to model the seismic input. The main disadvantage of scenario-based IDA
30
is that it is very demanding in terms of computer resources. For real NPP projects in which
structural models can reach several thousands of degrees of freedom, the performing of a
high number of nonlinear dynamic analyses of a structural model is the main barrier that
needs to be overcome. Nevertheless, the necessity of making appropriate risk-informed
decisions in mission-critical projects such as nuclear power stations justifies the use of such
expensive technical resources. Nowadays, the advent of supercomputing systems can ease the
performing of such extremely demanding tasks.
* For the example analysed in this work based on a representative UK nuclear site, it was
found that: (i) for conventionally constructed NPPs, the seismic risk rapidly increases with a
nonlinear behaviour especially for scenarios defined by greater magnitudes and shorter
distances; (ii) for seismically isolated NPPs, the seismic risk of the sample NPP is remarkably
reduced as the structural response is always in the linear range for all scenarios analysed. In
terms of the relative performance of these models, it was found that reduction of risk ranges
from 3 to 5 orders of magnitude while for most scenarios the reduction is in the region of 4
orders of magnitude. It can be concluded that the potential use of low-damping rubber
bearings and supplemental viscous dampers would be more effective in reducing the seismic
risk for the new generation of nuclear reactor buildings in the UK.
ReferencesAlemberti, A., Frogheri, M.L., Hermsmeyer, S., Ammirabile, L., Smirnov, M., Takahashi, M., Smith, C.F., Wu, Y., Hwang, I.S., 2014. Lead-cooled Fast Reactor (LFR) Risk and Safety Assessment. White Paper. Revision 8. Generation IV International Forum.Atkinson, G.M., Goda, K., 2011. Effects of Seismicity Models and New Ground-Motion Prediction Equations on Seismic Hazard Assessment for Four Canadian Cities. Bulletin of the Seismological Society of America 101, 176-189.Au, S.-K., Beck, J.L., 2001. Estimation of small failure probabilities in high dimensions by subset simulation. Probabilistic Engineering Mechanics 16, 263-277.Austin, N.M., Hattori, S., Rodwell, E., Womack, G.J., 1991. UK contribution to CEGBEPRICRIEPI program on seismic isolation. Nuclear Engineering and Design 127, 253-264.Azarbakht, A., Dolšek, M., 2011. Progressive Incremental Dynamic Analysis for First-Mode Dominated Structures. Journal of Structural Engineering 137, 445-455.
31
Bhaumik, L., Raychowdhury, P., 2013. Seismic response analysis of a nuclear reactor structure considering nonlinear soil-structure interaction. Nuclear Engineering and Design 265, 1078-1090.Bignan, G., Bravo, X., Lemoine, P.M., Maugard, B., 2011. The Jules Horowitz Reactor: A New European MTR (Material Testing Reactor) Open to International Collaboration: Update Description and Focus on the Modern Safety Approach, IAEA International Conference on Research Reactors: Safe Operation and Effective Utilization. International Atomic Energy Agency, Rabat, Morocco.Bommer, J.J., Stafford, P.J., Alarcón, J.E., Akkar, S., 2007. The Influence of Magnitude Range on Empirical Ground-Motion Prediction. Bulletin of the Seismological Society of America 97, 2152-2170.Bradley, B.A., 2013. A critical examination of seismic response uncertainty analysis in earthquake engineering. Earthquake Engineering & Structural Dynamics 42, 1717-1729.Campbell, K.W., Bozorgnia, Y., 2008. NGA Ground Motion Model for the Geometric Mean Horizontal Component of PGA, PGV, PGD and 5% Damped Linear Elastic Response Spectra for Periods Ranging from 0.01 to 10 Earthquake Spectra 24, 139-171.CEA, 2012. 4th Generation Sodium-Cooled Fast Reactors - The ASTRID Technological Demonstrator. CEA (Commissariat à l'énergie atomique et aux énergies alternatives) - Nuclear Energy Division, Saclay, France.Chopra, A., 1995. Dynamics of Structures. Theory and Applications to Earthquake Engineering. Prentice Hall, New Jersey.Elkhoraibi, T., Hashemi, A., Ostadan, F., 2014. Probabilistic and deterministic soil structure interaction analysis including ground motion incoherency effects. Nuclear Engineering and Design 269, 250-255.Forni, M., 2015. SILER Report Summary, Final Report Summary - SILER (Seismic-Initiated events risk mitigation in LEad-cooled Reactors). European Union, Bologna, Italy.Forni, M., Poggianti, A., Dusi, A., 2012. Seismic isolation of nuclear power plants, Proceedings of the 15th World Conference on Earthquake Engineering.Goda, K., Aspinall, W., Taylor, C.A., 2013. Seismic Hazard Analysis for the U.K.: Sensitivity to Spatial Seismicity Modelling and Ground Motion Prediction Equations. Seismological Research Letters 84, 112-129.Haselton, C., Baker, J., Bozorgnia, Y., Goulet, C.A., Kalkan, E., Luco, N., Shantz, T., Shome, N., Stewart, J.P., Tothong, P., Watson-Lamprey, J., Zareian, F., 2009. Evaluation of ground motion selection and modification methods: predicting median interstory drift response of buildings, PEER Report 2009/01. Pacific Earthquake Engineering Research Center, California, Berkeley.Hirano, M., Yonomoto, T., Ishigaki, M., Watanabe, N., Maruyama, Y., Sibamoto, Y., Watanabe, T., Moriyama, K., 2012. Insights from review and analysis of the Fukushima Dai-ichi accident. Journal of Nuclear Science and Technology 49, 1-17.HSE, 2011. Health and Safety Executive - Office for Nuclear Regulation. T/AST/013 - Issue 4: Technical Assessment Guide - External Hazards.Huang, Y.-N., Whittaker, A., Luco, N., 2011. A probabilistic seismic risk assessment procedure for nuclear power plants: (II) Application. Nuclear Engineering and Design 241, 3985-3995.Huang, Y.-N., Whittaker, A.S., Luco, N., 2010. Seismic performance assessment of base-isolated safety-related nuclear structures. Earthquake Engineering & Structural Dynamics 39, 1421-1442.Kiani, J., Khanmohammadi, M., 2015. New Approach for Selection of Real Input Ground Motion Records for Incremental Dynamic Analysis (IDA). Journal of Earthquake Engineering 19, 592-623.Kostarev, V.V., Petrenko, A.V., Vasilyev, P.S., 2003. A new method for essential reduction of seismic and external loads on NPP's structures, systems and components. Transactions of the 17th International Conference on Structural Mechanics in Reactor Technology (SMiRT 17).Lee, H.-P., Cho, M.-S., Kim, K.-K., Maeng, S.-W., 2015. Development of Laminated Rubber Bearings for the APR1400 Nuclear Power Plant, 23rd Conference on Structural Mechanics in Reactor Technology (SMiRT 23), Manchester, UK.Li, Z.X., Li, Z.C., Shen, W.X., 2005. Sensitivity Analysis for Floor Response Spectra of Nuclear Reactor Buildings (in Chinese). Nuclear Power Engineering 26.Liao, K.-W., Wen, Y.-K., Foutch, D.A., 2007. Evaluation of 3D Steel Moment Frames under Earthquake Excitations. I: Modeling. Journal of Structural Engineering 133, 462-470.
32
Lin, T., Baker, J., 2013. Introducing Adaptive Incremental Analysis: A New Tool for Linking Ground Motion Selection and Structural Response Assessment, 11th International Conference on Structural Safety & Reliability, New York.Llambias, J.M., 1993. Validation of Seismic Soil Structure Interaction (SSI) Methodology for a UK PWR Nuclear Power Station, 12th International Conference on on Structural Mechanics in Reactor Technology (SMiRT 12), Stuttgart, Germany, p. Paper K07/02.Llambias, J.M., Shepherd, D.J., Rodwell, M.D., 1993. Sensitivity of seismic structural response to interpretation of soils data. Soil Dynamics and Earthquake Engineering 12, 337-342.Magnox, 2011. Wylfa: Response to EU stress tests following the events at Fukushima, Japan.Martelli, A., Forni, M., Clemente, P., 2012. Recent Worldwide Application of Seismic Isolation and Energy Dissipation and Conditions for Their Correct Use, Proceedings of the 15th World Conference on Earthquake Engineering, Lisbon.Medel-Vera, C., Ji, T., 2014. Seismic protection technology for nuclear power plants: a systematic review. Journal of Nuclear Science and Technology 52, 607-632.Medel-Vera, C., Ji, T., 2016a. Seismic probabilistic risk analysis based on stochastic simulation of accelerograms for nuclear power plants in the UK. Progress in Nuclear Energy 91, 373-388.Medel-Vera, C., Ji, T., 2016b. A stochastic ground motion accelerogram model for Northwest Europe. Soil Dynamics and Earthquake Engineering 82, 170-195.Meiswinkel, R., Meyer, J., Schnell, J., 2013. Design and Construction of Nuclear Power Plants. Ernst & Sohn, Berlin, Germany.Moretti, G., Pasquali, U., 2013. Seismic Isolation of LFR Reactor Buildings, SILER International Educational Workshop, Rome, Italy.Musson, R.M.W., 1996. The seismicity of the British Isles. Annals of Geophysics 39.Musson, R.M.W., 2014. UK seismic hazard assessments for strategic facilities: a short history. Bollettino di Geofisica Teorica ed Applicata 55, 165-173.Musson, R.M.W., Sargeant, S., 2007. Eurocode 8 seismic hazard zoning maps for the UK. British Geological Survey Technical Report, CR/07/125N.Naeim, F., Kelly, J.M., 1999. Design of seismic isolated structures. From theory to practice. Wiley.NIA, 2012. Capability Report: Capability of the UK Nuclear New Build Supply Chain. Nuclear Industry Association, London.Ostadan, F., Kennedy, R., 2014. Consistent site-response/soil-structure interaction analysis and evaluation. Nuclear Engineering and Design 269, 72-77.Patel, C.C., Jangid, R.S., 2009. Seismic response of dynamically similar adjacent structures connected with viscous dampers. The IES Journal Part A: Civil & Structural Engineering 3, 1-13.Saxena, N., Paul, D.K., 2012. Effects of embedment including slip and separation on seismic SSI response of a nuclear reactor building. Nuclear Engineering and Design.Saxena, N., Paul, D.K., Kumar, R., 2011. Effects of slip and separation on seismic SSI response of nuclear reactor building. Nuclear Engineering and Design 241, 12-17.Schuëller, G.I., Pradlwarter, H.J., Koutsourelakis, P.S., 2004. A critical appraisal of reliability estimation procedures for high dimensions. Probabilistic Engineering Mechanics 19, 463-474.Sollogoub, P., 2014. Seismic Isolation of Nuclear Installations in France, SILER International Educational Workshop, Rome, Italy.Syed, M.B., Patisson, L., Curtido, M., Slee, B., Diaz, S., 2014. The challenging requirements of the ITER anti seismic bearings. Nuclear Engineering and Design 269, 212-216.Symans, M., Charney, F., Whittaker, A., Constantinou, M., Kircher, C., Johnson, M., McNamara, R., 2008. Energy Dissipation Systems for Seismic Applications: Current Practice and Recent Developments. Journal of Structural Engineering 134, 3-21.Tagawa, H., MacRae, G., Lowes, L., 2008. Probabilistic evaluation of seismic performance of 3-story 3D one- and two-way steel moment-frame structures. Earthquake Engineering & Structural Dynamics 37, 681-696.Tuñón-Sanjur, L., Orr, R.S., Tinic, S., Ruiz, D.P., 2007. Finite element modeling of the AP1000 nuclear island for seismic analyses at generic soil and rock sites. Nuclear Engineering and Design 237, 1474-1485.Vamvatsikos, D., Cornell, C.A., 2002. Incremental dynamic analysis. Earthquake Engineering & Structural Dynamics 31, 491-514.
33
Vamvatsikos, D., Cornell, C.A., 2004. Applied Incremental Dynamic Analysis. Earthquake Spectra 20, 523-553.Wagenknecht, E., 1987. Response of a NPP reactor building under seismic action with regard to different soil properties. Nuclear Engineering and Design 104, 187-195.Weightman, M., 2011. Japanese earthquake and tsunami: Implications for the UK nuclear industry. Office for Nuclear Regulation - HM Chief Inspector of Nuclear Installations, Bootle, Merseyside.WNA, 2014. Nuclear Power Plants and Earthquakes, http://www.world-nuclear.org. World Nuclear Association, London, UK.Wolf, J.P., 1989. Soil-structure-interaction analysis in time domain. Nuclear Engineering and Design 111, 381-393.Zareian, F., Krawinkler, H., 2007. Assessment of probability of collapse and design for collapse safety. Earthquake Engineering & Structural Dynamics 36, 1901-1914.Zuev, K.M., Katafygiotis, L.S., 2011. The Horseracing Simulation algorithm for evaluation of small failure probabilities. Probabilistic Engineering Mechanics 26, 157-164.
34