Embed Size (px)
Citation preview
AN ASSESSMENT OF THE MILLENNIUM DEVELOPMENT GOALS (MDGs)
By
Dr. (Mrs.) Grace O. Evbuomwan*Covenant University,
Km. 10, Idiroko Road, Ota, Ogun State, Nigeria.Paper ID: NES-10207 ABJ
E-mail: [email protected] and [email protected]
Phone Numbers: 234-8023096451 and 234-8061550414
ABSTRACT
This paper highlighted the importance of the family in the society as well as the negative impact poverty, war and diseases can have on the development of the family. It went on to review the eight MDGs set in 2000 for attainment on or before 2015 which also targeted the most vulnerable groups in the family (the women and children). Available data from the World Bank and the National Bureau of Statistics revealed that though substantial progress has been made towards attaining the various targets set for the MDGs but, only MDG Goal 3/Target 3A, aimed at gender parity in primary and secondary school was fully met in Nigeria in 2012 as indicated by NBS 2014 national survey results of 1.0 and 1.02 ratio of girls to boys in primary and secondary school at the national level. Nigeria did not meet fully all of the other MDG goals and targets and actually retarded rather than progress with respect to MDG Goal 1/Target 1A, Goal 6/Target 6A and Goal 7/Target 7C. Proportion of the population that had access to improved sanitation facilities for instance, actually declined from 37 per cent in 1990 to 28 per cent in 2012 in Nigeria rather than increase by 50 per cent from the 1990 level. Therefore, a lot still needs to be done in Nigeria and most other developing countries, particularly those in Sub-Saharan Africa, in order to assist families in this part of the world to be able to contribute their quota to economic development in their environment and the world at large. More investments are needed in the education and health sectors and priorities must be given to the vulnerable groups (women and children) as well as very poor families who performed worse.
JEL CLASSIFICATION CODES: I15, I25, I32, J12, J13, J16 and J21
*Paper presented at the 56th Annual Conference of the Nigerian Economic Society (NES), held in Abuja, Nigeria from 11th to 14th October, 2015.
1

1. INTRODUCTION
The family is the most important unit of society and plays an essential role in fulfilling the emotional and physical needs of individuals, which is required for achieving economic and social development. Without a family, children can be hungry, malnourished, homeless, illiterate, unloved. A family provides the safety net for their children, so they can be fed, clothed, sheltered, educated and loved.
The family is a potentially powerful agent for political, economic, cultural and social change, as well as a potent vehicle for the care, protection and development of its members, hence the need to support families by government and other stakeholders in the society. If a society is at war, is suffering natural disasters such as drought, flood or earthquake, is made up of people living primarily in poverty, is a society with a high illiteracy rate, or is experiencing overwhelming negative health conditions such as AIDs or Ebola, of course any family will be negatively affected.
Mutual dependence between the family and development/advancement of families and education cannot be achieved without economic development, poverty eradication and the enforcement of peace and security in the world. This is why at the United Nations Millennium Summit held in New York in September 2000, world leaders adopted the Millennium Declaration, committing their nations to a new global partnership to reduce extreme poverty and setting out a series of time-bound targets, all with a deadline of 2015, which became known as the Millennium Development Goals (MDGs).
In this paper, an assessment of the MDGs will be undertaken against the backdrop of the importance of health and education in the quest to reduce poverty and high unemployment; thereby assisting families to contribute their quota to the overall development of the nation in the spirit of inclusive growth, particularly now that the period for achieving the MDGs is expiring.
The rest of the paper is divided into four parts. Section two presents the theoretical framework for the paper and some literatures reviewed. In section three, the goals and targets of the Millennium Development Goals are highlighted as the benchmark for its assessment which is carried out in section four. Section five summarizes and concludes the paper.
2. THEORETICAL FRAMEWORK AND LITERATURE REVIEW
2.1Theory and Conceptual Framework
This paper is premised on the theory of economic growth and the fundamental role human capital plays in the growth of the economy. Economic growth is the increase in value of the goods and services produced by an economy. It is conventionally measured as the per cent rate of increase in real gross domestic product (GDP). Some economists have defined it as an increase in GDP per capita. Economic growth shifts society’s production possibility frontier up and to the right. The production possibility frontier shows all possible combinations of output that can be produced in a society if all of the society’s scarce resources are fully and efficiently employed (Fapohunda, 2000).
2

2.1.1 Determinants of a nation’s economic growth rate
Economists have spent much time over the past two generations dividing economic growth into that part due to improvements in technology and in social and business organisation that boost the efficiency of labour on one hand and into that part generated by investment in capital to boost the economy’s capital intensity on the other. The consensus is that the lion’s share of economic growth comes from factors that affect the efficiency of labour.
To get some insight into this, we will follow the illustration by Frank and Bernanke (2007), expressing real GDP per person as the product of two terms: average labour productivity and the share of the population that is working. Let Y equal total real output (as measured by real GDP), N equal the number of employed workers, and POP equal the total population. The real GDP per person can be written as Y/POP; average labour productivity, or output per employed worker, equals Y/N; and the share of the population that is working is N/POP. The relationship between these three variables is
Y/POP = Y/N x N/POP.........................................................................................(1)
By cancelling out N on the right-hand side of the equation, the basic relationship is
Real GDP per person = Average labour productivity x Share of population employed. This expression for real GDP per person tells us something very basic and intuitive: The quantity of goods and services that each person can consume depends on (1) how much each worker can produce and (2) how many people (as a fraction of the total population) are working. Furthermore, because real GDP per person equals average labour productivity times the share of the population that is employed; real GDP per person can grow only to the extent that there is growth in worker productivity and/or the fraction of the population that is employed.
2.1.2 Key factors determining average labour productivity in a country
These include the skills and training of workers called human capital. It comprises the talents, education training, and skills of workers. Workers with a large stock of human capital are more productive than workers with less training. Though, workers’ productivity depends not only on their skills and effort but also on the tools they have to work with, the importance of human capital is very apparent as the main driver of productivity. Human capital is analogous to physical capital (such as machines and factories) in that it is acquired primarily through investment of time, energy and money. This is why this paper focuses on the MDGs particularly those targeted at the educational and health sectors which have direct bearing on labour productivity and hence economic growth and development.
2.2 Literature Review
Education and Poverty
United Nations Development Programme (UNDP) studies have shown that meaningful education is the most potent instrument for alleviating poverty and its eventual eradication (UNDP, 1996). Similarly, the National Bureau of Statistics (NBS) has empirical evidence to prove that there is steady decrease in the percentage of the poor as the level of education of the household increases in Nigeria (NBS, 1996). For example, in Nigeria (2003/04) the poverty rate was 69 per cent when the head of the household had no education, 49 per cent if the head completed primary school and only 26 per cent if the head had post-secondary
3

education. This is because education provides the opportunities for the acquisition of the knowledge and skills necessary for gainful employment and /or income generation.
Primary education makes a big difference between being above or below the poverty line. However, Obikaonu (2004) observed that due to the introduction of school fees in most primary and secondary schools in Nigeria in the mid 1990’s, 20 per cent of primary school-age children and 80 per cent of secondary school-age children did not enrol in schools. Worst still, of those that enrolled, about half completed primary school and only half of them continued on to the secondary school level.
Unemployment and Poverty
One of the major macroeconomic objectives of nations is to achieve full employment with a view to increasing the wealth of the nation. Most developed countries have been able to achieve this with low and single digit unemployment rates. Most countries recording high unemployment rates are seen to be grappling with high poverty as well. This has been the case with most developing nations. Egunjobi (2012) empirically established the link between unemployment and poverty in Nigeria. Using the co-integration, error correction modelling and causality test, the author established that, unemployment has a positive influence on poverty while government investment on infrastructures and human investment has a negative influence on poverty. The study therefore recommended that government should intensify the provision of infrastructures and make appropriate policies which will create a conducive environment needed for investment to thrive. In addition, the author (Egunjobi, 2012) recommended that government should provide good education, training and the acquisition of skills required in this modern age as this will generate employment opportunities, increase income, promote higher standards of living and reduce poverty.
Poverty and Health
The fact that education and health hold the key to poverty alleviation and eventual eradication of human poverty has been well documented in the literature. Its neglect through inadequate investment, poor strategy and ineffective implementation has resulted in worsening human poverty in sub-Saharan Africa over the years. For instance, a study on health status, employment and income nexus in sub-Saharan Africa (SSA) using panel data for 16 countries, carried out by Adesoye et.al, 2012, revealed that excessive labour participation by women leads to more incidences of death during pregnancy and child-birth; that higher per capita income reduces the incidence of maternal mortality rate and prevalence of under-five mortality rate; that increase in per capita income enhances overall health status, while labour participation deteriorates health status. The study therefore suggested that government should create better welfare packages that will enhance per capita income; legislate maximum working hours required of female workers; and increase public health investment.
It has also been established that environmental effects of people’s health also affect their incomes (World Bank-IMF, 2008). The economic burden on society caused by poor environmental health (urban and indoor air pollution, water, sanitation and hygiene) has been estimated at about 1.5 to 4 percent of annual GDP.
3. GOALS AND TARGETS OF THE MILLENNIUM DEVELOPMENT GOALS.
In this section a review of the goals and targets of the millennium development goals set for attainment between 1990 and 2015 is undertaken as a basis for the assessment of the millennium development goals in the next section. The MDGs consist of eight goals to be
4
achieved by 2015 in response to the world’s main development challenges. They were drawn from the actions and targets contained in the Millennium Declaration that was adopted by 189 nations and signed by 147 Heads of State and Governments during the UN Millennium Summit in September 2000 (CBN, 2006-2007, and United Nations, 2014).
GOAL 1: ERADICATE EXTREME POVERTY AND HUNGER
Target 1A: Reduce by half the proportion of people living on less than one dollar a day between 1990 and 2015.
Target 1B: Achieve full and productive employment and decent work for all, including women and young people.
Target 1C: Reduce by half the proportion of people who suffer from hunger between 1990 and 2015.
GOAL 2: ACHIEVE UNIVERSAL PRIMARY EDUCATION
Target 2A: Ensure that all boys and girls complete a full course of primary schooling by 2015.
GOAL 3: PROMOTE GENDER EQUALITY AND EMPOWER WOMEN
Target 3A: Eliminate gender disparity in primary and secondary education, preferably by 2005, and at all levels by 2015
GOAL 4: REDUCE CHILD MORTALITY
Target 4A: Reduce by two thirds, the mortality rate among children less than five years between 1990 and 2015.
GOAL 5: IMPROVE MATERNAL HEALTH
Target 5A: Reduce by three quarters, between 1990 and 2015, the maternal mortality ratio.
Target 5B: Achieve, by 2015, universal access to reproductive health.
GOAL 6: COMBAT HIV/AIDS, MALARIA AND OTHER DISEASES
Target 6A: Halt and begin to reverse the spread of HIV/AIDS by 2015.
Target 6B: Achieve, by 2010, universal access to treatment for HIV/AIDS for all those who need it.
Target 6C: Halt and begin to reverse the incidence of malaria and other major diseases by 2015.
GOAL 7: ENSURE ENVIRONMENTAL SUSTAINABILITY
Target 7A: Integrate the principles of sustainable development into country policies and programmes and reverse the loss of environmental resources.
Target 7B: Reduce biodiversity loss, achieving by 2010, a significant reduction in the rate of loss.
5
Target 7C: Reduce by half the proportion of people without sustainable access to safe drinking water and basic sanitation by 2015.
Target 7D: Achieve significant improvement in lives of at least 100 million slum dwellers, by 2020
GOAL 8: DEVELOP A GLOBAL PARTNERSHIP FOR DEVELOPMENT
Target 8A: Develop further an open, rule-based, predictable, non-discriminatory trading and financial system, including a commitment to good governance, development, and poverty reduction both nationally and internationally
Target 8B: Address the special needs of the least developed countries, including: tariff and quota free access for least developed countries’ exports; enhanced programme of debt relief for HIPCs and cancellation of official bilateral debt; and more generous ODA for countries committed to poverty reduction
Target 8C: Address the special needs of landlocked countries and Small Island developing States
Target 8D: Deal comprehensively with the debt problems of developing countries through national and international measures in order to make debt sustainable in the long term
Target 8F: In cooperation with developing countries, develop and implement strategies for decent and productive work for youths
Target 8G: In cooperation with pharmaceutical companies, provide access to affordable essential drugs in developing countries
Target 8H: In cooperation with the private sector, make available the benefits of new technologies, especially information and communications
In order to achieve these goals by the year 2015, poor countries pledged to govern better and invest in their people through health care and education, while the rich countries pledged to support them through aid, debt relief, and fairer terms of trade. How have we fared thus far?
4. AN ASSESMENT OF THE MILLENNIUM DEVELOPMENT GOALS
In this section the indicators specified for measuring the various goals and targets of the MDGs reviewed in the last section will be examined to determine how we have fared in Nigeria since 1990 with the aid of the World Bank and National Bureau of Statistics (NBS) data now that we are at the end of the period for attaining the MDGs.
4.1 Poverty Eradication
One of the indicators for monitoring poverty eradication as set out in Goal 1/Target 1A of the MDGs is the proportion of total population living on less than one dollar per day. However, the international poverty line was raised to 1.25 dollars a day between 1990 and 2015, hence; the comparable data available from the World Bank (WDI, 2015) for this indicator for Nigeria are those for 2004 and 2010. Thus, using 2004 as the base data and comparing with 2010, at 61.8 per cent and 62.0 per cent respectively, the proportion of the Nigerian population below the international poverty line of $1.25 increased by 0.2 percentage points to
6
62 per cent in 2010 rather than decrease by half to say 30 per cent as envisaged by the MDGs. Therefore, Target 1A of the MDGs was missed by Nigeria.
4.2 Unemployment
Target 1B of the MDGs was aimed at achieving full and productive employment and decent work for all, including women and young people. Available data from the World Bank on labour force participation rate in Nigeria shows that fewer women are in employment compared with men at 45 per cent in 2000 compared with 67 per cent for men (table 1). In 2013, the figure increased marginally to 48 per cent for women which further confirm that the situation has not changed significantly. Available data also indicate that the unemployment rate for the young people is higher (WDI, 2015). Target 1B of the MDGs was also not achieved in Nigeria.
4.3 Hunger
Target 1C of the MDGs Goal 1, was aimed at reducing by half the proportion of people who suffer from hunger between 1990 and 2015. According to the National Bureau of Statistics in its 2015 MDGs report, underweight children indicator is an auxiliary variable that can be used to gauge the hunger situation of a country. Its 2014 survey result published in 2015 indicated that the proportion of underweight children was 25.5 per cent that year (2014) compared with 23.1 per cent in 2008 which is an indication that the hunger situation in Nigeria is increasing. Therefore, Target 1C was also missed by Nigeria.
4.4 Achieve Universal Primary Education
Target 2A of the MDGs Goal 2, was aimed at ensuring that all boys and girls complete a full course of primary school by 2015. Available data from the NBS indicated that primary completion rate in Nigeria dropped from 82 per cent in 2004 to 74 per cent in 2014. This is comparable with the World Bank data for Nigeria, which indicated that primary completion rate of relevant age group was 80 per cent for males and 72 per cent for females in 2013 (table 2) as opposed to MDGs Target 2A which was meant to “ensure that, by 2015, children everywhere, boys and girls alike, will be able to complete a full course of primary schooling’’ which is a prerequisite for the progression to secondary and subsequently, tertiary institutions.
The data on education gap by income for Nigeria speaks volume (WDI, 2015). In 2004-13, percentage of primary school age children out of school was 71 for those from the poorest quintile compared with 5 per cent for those from the richest quintile (fig. 1). Similarly, primary completion rate for children from the poorest quintile was 38 per cent compared with 92 per cent for those from the richest quintile (fig. 2).
Thus, average year of schooling for children aged 15-19 was 7 for children from the poorest quintile compared with 11 years for those from the richest quintile. Primary completion rate by gender and area were 84 per cent for male and 72 per cent for female and 94 per cent for urban and 71 per cent for rural. This further confirms the fact that even as recent as 2013, children from poor homes, female children and children from rural areas are less likely to complete primary education compared with children from rich homes, male children and children in the urban areas.
7
Fig. 1: Education Gap by Income
Chil-dren
out of School (%) of total
Primary schoolage chil-dren
0
20
40
60
80
Poorest QuintileRichest Quintile
Source: World Development Indicators, April 2015.
Fig. 2: Primary Completion Rate by Income
Primary Com-pletion Rate (%)
0
10
20
30
40
50
60
70
80
90
100
Poorest QuintileRichest Quintile
Source: World Development Indicators, April 2015.
8
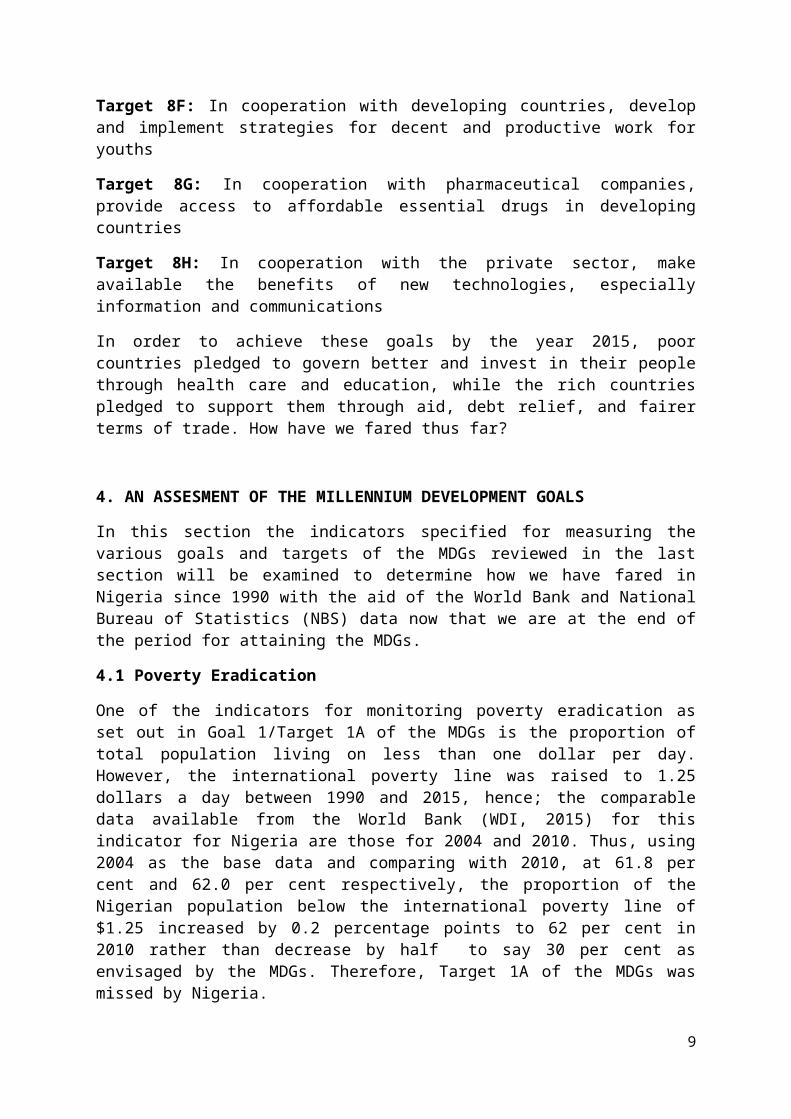
Fig. 3: Primary Completion Rate by Area
Education Gap by Area
0
10
20
30
40
50
60
70
80
90
100
UrbanRural
Source: World Development Indicators, April 2015.
4.5 Gender Disparity in Primary and Secondary School
Target 3A of the MDGs Goal 3, was aimed at eliminating gender disparity in primary and secondary education, preferably by 2005, and at all levels by 2015. Available data from the World Bank indicated that ratio of boys to girls in primary and secondary schools in Nigeria improved from 79 per cent in 1991 to 91 per cent in 2013. Similarly, NBS data indicated that this target was met in Nigeria; as the gender parity data for 2014 was 1.02 and 1.01 for primary and secondary education respectively.
4.6 Reduce Child Mortality
MDGs Goal 4/target 4A was aimed at reducing by two-thirds (2/3), the mortality rate among children less than five years between 1990 and 2015. Significant progress was recorded in the area of child mortality reduction during the MDGs. From 213 in 1990, under five mortality per 1,000 live births came down to 117 in 2013 (table 3) in Nigeria. However, the MDGs target was to reduce under-five mortality rate by two thirds in 2015, which means this target cannot be achieved at the current rate by 2015. Similarly, NBS 2014 survey results confirm the fact that this target was not met with 89 under five deaths recorded out of 1,000 live births in 2014 compared with 201 in 2004. The situation is more precarious in the rural areas than in the urban where 98 and 66 deaths per 1,000 live births respectively, were recorded in 2014 in Nigeria (NBS, 2014).
In addition, data on health gap by income reveal that under- 5 mortality per 1,000 live births was 190 for those in the poorest quintile as against 73 for those in the richest quintile in Nigeria in 2013 (WDI, 2015), which further confirms the need to help the poor even with health issues as with education of their children for inclusive growth to be achieved (fig. 4).
9
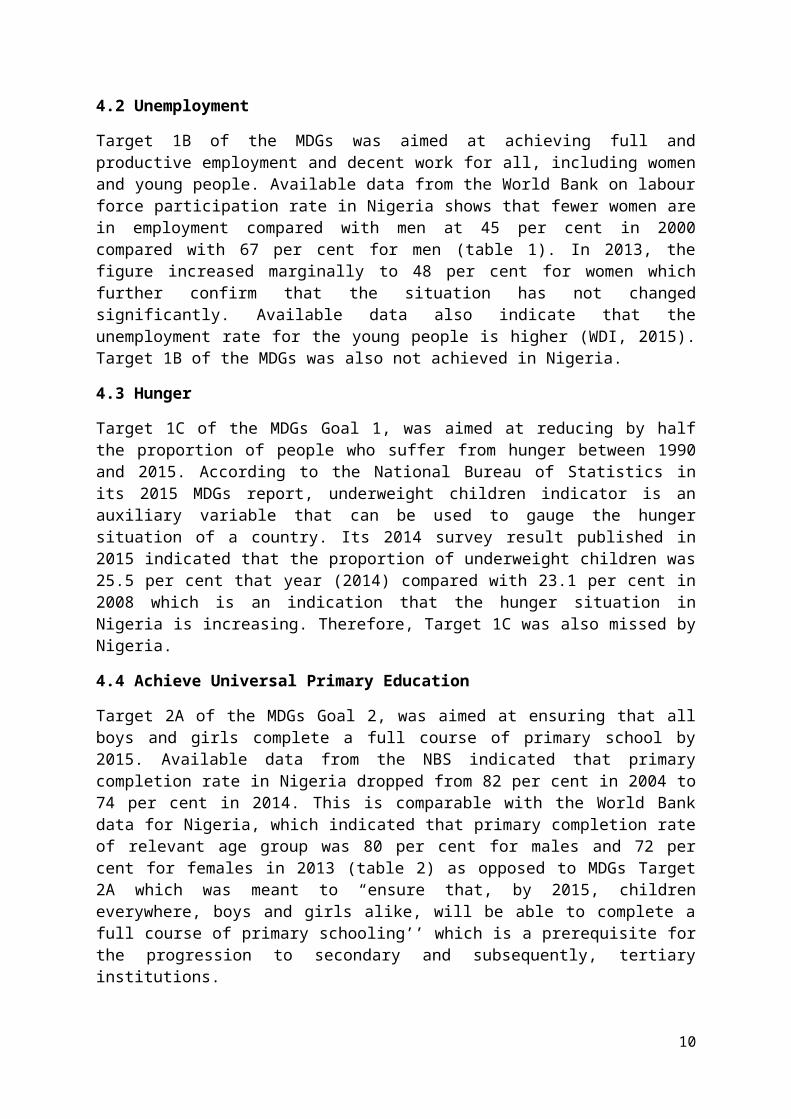
Fig. 4: Health Gap by Income
Under Five Mortal-ity Rate
0
20
40
60
80
100
120
140
160
180
200
Poorest QuintileRichest Quintile
Source: World Development Indicators, April 2015.
4.7 Improve Maternal Health
MDGs Goal 5/Target 5A was aimed at reducing by three quarters (3/4), between 1990 and 2015, the maternal mortality ratio. Available data from the NBS indicated a substantial improvement in maternal mortality rate in Nigeria during the MDGs. From 800 deaths per 100,000 live births, in 2004, maternal mortality rate dropped to 243 in 2014. However, the target of ¾ reductions was not met using 2004 as the base year for which comparable data were available.
4.8 Universal Access to Reproductive Health
Target 5B of the MDGs Goal 5 was aimed at achieving by 2015, universal access to reproductive health. The indicator used is the proportion of pregnant women that were attended to by skilled health staff. Available data from the World Bank put this proportion at 31 per cent in 1990 and it barely increased to 38 per cent in 2007-13 (table 4). Similarly, the NBS 2014 survey revealed that 58.6 per cent of pregnant women were assisted by highly skilled birth attendants, in 2014 from a lower proportion of 36.3 per cent in 2004. Since the MDGs target was 100 per cent coverage by 2015, obviously we cannot meet this target from the foregoing. As always, the pregnant women in the rural areas were less likely to be attended to by highly skilled birth attendants, with 46.6 per cent and 79.2 per cent survey results in 2014 respectively (NBS, 2015).
4.9 Combat HIV/AIDS, Malaria and Other Diseases
Goal 6/Target 6A of the MDGs was directed at halting and begins to reverse the spread of HIV/AIDS by 2015. However, available data from the World Bank prove to the contrary as proportion of Nigerians aged 15-49 years suffering from HIV/AIDS was said to have increased from 1 per cent in 1990 to 3.2 per cent in 2013 out of which women infected
10

constituted 58 per cent in 2013 (table 5). This is not unlikely as most young women in Nigeria do not have knowledge of HIV/AIDS as revealed by NBS 2014 survey results. The proportion of young women aged 15-24 years with knowledge of HIV/AIDS in Nigeria was said to have risen from 18.3 percent in 2004 to 32.4 per cent in 2014. Certainly, 100 percent coverage is the desirable option to halt and begin to reverse the spread of HIV/AIDS. Unfortunately as well, only 20 per cent of Nigerians suffering from HIV/AIDS were said to have access to anti-retroviral drugs in 2013 (WDI, 2015).
4.10 Halt and Begin to Reverse the Incidence of Malaria and other Major Diseases by 2015
Target 6C of the MDGs Goal 6 was aimed at halting and beginning to reverse the incidence of malaria and other major diseases by 2015 worldwide. This target was not achieved in Nigeria as only 38.9 per cent of households owned insecticide treated mosquito nets in 2014 (NBS, 2015). Proportion of children who slept under insecticide treated nets in Nigeria was said to have increased from 2.2 per cent in 2003 to 34.7 per cent in 2014, hence, the prevalence of malaria and its debilitating effects in Nigeria up till now.
Similarly, the incidence of tuberculosis is very high in Nigeria as 338 people out of 100,000 were diagnosed with the disease in 2013 compared with 5 in the Euro Area and 282 in the whole of Sub-Saharan Africa (WDI, 2015). Consequently, as high as 66 per cent of deaths in Nigeria were caused by communicable diseases and maternal, prenatal, and malnutrition conditions as against 24 percent by non-communicable diseases and 10 percent by injuries in 2012 (WDI, 2015) compared with the situation in the rest of the world (fig. 5).
Fig. 5: Causes of Death (% of Population)
Low Income
Lower Middle I
ncome
Low & M
iddle Inco
me
Europe &
Centra
l Asia
Middle Eas
t & North
Africa
Sub-Sa
haran Afric
a
Euro Area
0%10%20%30%40%50%60%70%80%90%
100%
InjuriesSeries3Communicable diseases and maternal,
Source: World Development Indicators, April 2015.
Furthermore, statistics on health expenditures reveal that in Nigeria, health expenditure constitute 3.9 per cent of GDP compared with the world average of 10 per cent in 2013
11
(WDI, 2015). Of more concern is the heavy burden borne by households in Nigeria compared with the world average (Fig. 6).
Fig. 6: Health Expenditure
Public % of Total
Out of Pocket % of
Total
0
10
20
30
40
50
60
70
NigeriaWorld
Source: World Development Indicators, April 2015.
4.11 Ensure Environmental Sustainability
Goal 7/Target7C of the MDGs was meant to reduce by half the proportion of people without sustainable access to safe drinking water and basic sanitation in 2015. Access to improved water sources improved from 46 per cent of the Nigerian population in 1990 to 64 per cent in 2012. On the other hand, access to improved sanitation facilities was said to have declined from 37 per cent of total population in 1990 to 28 per cent in 2012 (table 6). This fact was corroborated by NBS 2014 survey result which showed that access to improved water sources increased from 57 per cent in 2004 to 62.29 per cent in 2014, while access to improved sanitation facilities was said to have declined from 38 per cent in 2004 to 33.3 per cent in 2014. These poor environmental conditions also contribute to the short life span of people in Nigeria in particular where life expectancy at birth in 2013 was as low as 52 years for males and 53 years for females compared with world averages of 69 and 73 years respectively, by gender.
5. SUMMARY AND CONCLUSION
5.1 Summary
As stated in the ECOWAS Poverty Profile, education is a key factor in explaining differences in poverty and an important tool in poverty reduction for the next generations. Less educated people have limited access to sources of income and are highly vulnerable to poverty. At the same time, poor children have lower access to school and their families spend less on their
12
education. In the same vein, inadequate income has a very negative effect on health. Hence, a strong case is made for assistance to poor families in Nigeria who lagged behind most in meeting the MDGs goals and targets.
With the exception of MDG Goal 3/Target 3A, aimed at gender parity in primary and secondary school which was met in Nigeria in 2012 as indicated by NBS 2014 national survey results, Nigeria did not meet all of the MDGs goals and targets.
Population below the international poverty line ($1.25 a day) was still as high as 62 per cent in 2010 compared with 61.8 per cent in 2004 for which comparable data was available rather than being halved as envisaged during the MDGs implementation. Unemployment is still very high and particularly among the youths who constitute the greatest proportion of Nigerian population. As much as 25.5 per cent of our children were underweight in 2014 compared with 23.1 per cent for 2008 for which comparable data was available. This is a manifestation of hunger in the community and that Target 1C which was aimed at reducing by half the proportion of people who suffer from hunger between 1990 and 2015 will not be met in Nigeria at the close of the MDGs.
As regards MDGs Goal 2/Target 2A (Achieve Universal Primary Education), available data confirms the fact that in Nigeria, even as recent as 2013, children from poor homes, female children and children from rural areas are less likely to complete primary school education compared with children from rich homes, male children and children in the urban areas, hence the urgent need to support poor families to get their children educated and break the vicious cycle of poverty engendered by lack of education, primary school education being a prerequisite for secondary and tertiary education .
As regards Goal 4/Target 4A, the MDGs target is to reduce by two thirds, between 1990 and 2015, the under-five mortality rate. Though significant progress has been recorded in the area of child mortality reduction, from 213 per 1,000 births in 1990; it came down to 117 in 2013 in Nigeria (WDI, 2015), it is still about half of its 1990 rate which means this target has also not been achieved. This is obviously as a result of malnutrition and infectious diseases which are all effects of poverty. Similarly, data on health gap by income reveal that under- 5 mortality per 1,000 live births was 190 for those in the poorest quintile as against 73 for those in the richest quintile in Nigeria in 2013, which further confirms the need to help the poor even with health issues as with education of their children for inclusive growth to be achieved.
Significant progress was recorded in Goal 5/Target 5A in Nigeria as maternal mortality ratio dropped from 800 deaths per 100,000 live births in 2004 to 243 in 2014 for which comparable figures were available (NBS, 2015). However, it still fell short of the MDGs target to reduce the maternal mortality ratio by three quarters in 2015. This is as a result of the fact that, prevalence of anaemia in pregnant women is very high and the number of skilled birth attendants is also very low, which calls for purposive intervention in the health sector, to save our mothers who are the managers of the home.
Goal 6/Target 6A, 6B and 6C (Combat HIV/AIDS, Malaria and other diseases) were not met in Nigeria. Target 6A was to halt by 2015 and begun to reverse the spread of HIV/AIDS, unfortunately, the incidence of HIV world over is on the rise as well as in Nigeria where HIV prevalence rate increased from 1.0 per cent of the population in 1990 to 3.2 per cent in 2013 and women’s share of population with HIV was 58 percent. Unfortunately too, the rate of anti-retroviral coverage is still very low among those with HIV with 20 per cent recorded for Nigeria in 2013 compared with 43 percent in Latin America and the Caribbean. Similarly, the
13

incidence of tuberculosis is very high. In Nigeria as much as 338 people out of 100,000 were diagnosed with tuberculosis in 2013. Consequently, over 60 percent of deaths in Nigeria as in the rest of the developing world are as a result of communicable diseases, maternal, prenatal, and malnutrition conditions. Interestingly again, statistics on health expenditures reveal that in Nigeria, health expenditure constitute 3.9 per cent of GDP compared with the world average of 10 per cent in 2013. Of more concern is the heavy burden borne by households in Nigeria (69.3 per cent) compared with the world average of 18.6 per cent out of pocket health expenditure as per cent of total. This is why families especially the poor ones need to be assisted on health issues.
MDGs Goal 7 (Ensure Environmental Sustainability). The target was to halve, by 2015, the proportion of the population without sustainable access to safe drinking water and basic sanitation. Available data indicated that as at 2012 just over a quarter of the Nigerian population had access to improved sanitation facilities compared with 100 percent in the Euro Area. These poor environmental conditions also contribute to the short life span of people in the country, as life expectancy at birth was as low as 52 years for males and 53 years for females (in Nigeria) compared with world averages of 69 and 73 years respectively by gender in 2013. Thus, a lot still needs to be done in Nigeria to meet this goal as well.
5.2 Conclusion
The UN member states are currently in the process of crafting a successor agenda to the landmark MDGs which wraps up in a few months. A new framework, focused on poverty eradication, social inclusion and preserving the health of the planet, is set to be adopted at a special UN summit in New York in September 2015. It is of outmost importance that members from less developed countries like Nigeria, particularly those from sub-Saharan Africa recognise the need to address education, health and gender issues so as to achieve inclusive growth. More investments are needed in the education and health sectors and priorities must be given to the vulnerable groups (women and children).
14

Table 1: Women in Development
Labour Force Participation Rate (% of Ages 15 and older)Male Female Women in
Parliaments (% of total Seats
Population (in Millions)
Female population (% of total)
2000 2013 2000 2013 1990 2014 2013 2013World 79 77 52 50 13 22 7,125.1 49.6Low Income
83 83 67 69 - 21 848.7 50.2
Middle Income
81 78 50 47 13 21 4,970.0 49.2
Lower Middle Income
81 79 39 36 11 18 2,561.1 49.1
Upper Middle Income
81 77 60 56 15 23 2,408.9 49.3
Low & Middle Income
81 79 52 50 13 21 5,818.7 49.3
East Asia & Pacific
83 79 67 63 17 19 2,005.8 48.9
Europe & Central Asia
69 69 46 46 - 18 272.4 51.5
Latin America & Caribbean
81 80 49 54 12 29 588.0 50.8
Middle East & North Africa
74 73 18 20 4 17 345.4 49.7
South Asia
83 81 35 31 6 19 1,670.8 48.5
Sub-Saharan Africa
77 77 62 64 - 22 936.3 50.0
High Income
71 69 51 53 13 26 1,306.4 50.8
Euro Area
65 64 45 50 12 30 337.3 51.1
Nigeria 67 64 45 48 - 7 176.6 49.1
Source: World Development Indicators, 2015.
15
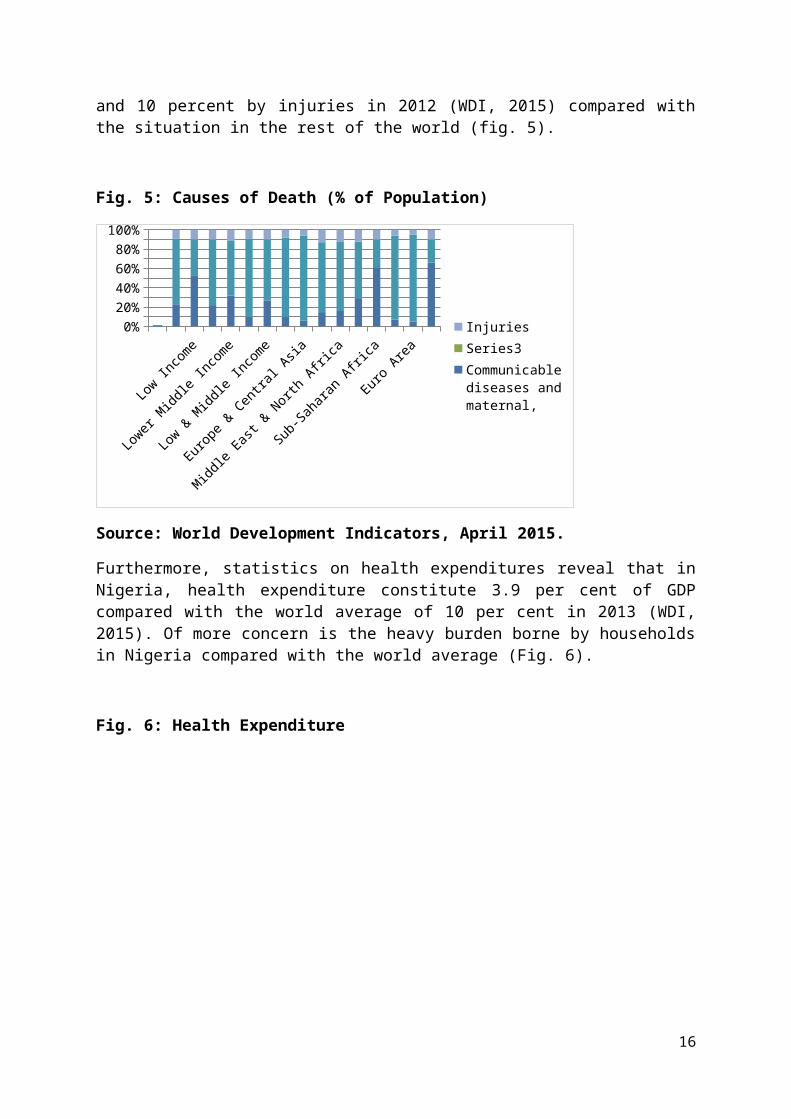
Table: 2 Education Completions
Primary Completion Rate (% of relevant age group)Total Male Female1999 2013 1999 2013 1999 2013
World 81 92 84 93 77 91Low Income 50 71 54 73 46 70Middle Income 83 96 86 96 79 95Lower Middle Income 75 92 81 93 69 90Upper Middle Income 91 102 91 102 90 102Low & Middle Income 78 91 82 92 74 90East Asia & Pacific 89 105 90 105 88 105Europe & Central Asia 94 99 95 99 93 98Latin America & Caribbean 94 95 93 93 96 96Middle East & North Africa
84 95 88 98 80 92
South Asia 68 91 75 92 59 90Sub-Saharan Africa 54 70 59 73 49 66High Income 97 99 97 100 97 98Euro Area 98 98 98 97 98 98Nigeria - 76 - 80 - 72
Source: World Development Indicators, 2015.
16

Table 3: Child Immunization/Mortality Rate
Child Immunization Rate (% of children ages 12-23 months)
Under –five mortality per 1,000 live births
Measles DPT3 Prevalence of Malnutrition (Underweight) % of children under 5 years
Prevalence of Anaemia in children under age 5(%)
1990 2013 2013 2013 2007-13 2011World 90 46 84 84 15 42Low Income
167 76 80 80 21.4 58
Middle Income
87 43 83 83 15.8 43
Lower Middle Income
119 59 76 76 24.4 55
Upper Middle Income
54 20 95 94 2.7 25
Low & Middle Income
100 50 83 82 17.0 46
East Asia & Pacific
59 20 95 93 5.2 25
Europe & Central Asia
56 23 95 94 1.6 31
Latin America & Caribbean
55 18 92 89 2.8 29
Middle East & North Africa
67 26 88 89 6.0 39
South Asia
129 57 75 75 32.5 58
Sub-Saharan Africa
179 92 74 74 21.0 63
High Income
14 6 94 96 0.9 16
Euro Area
10 4 93 97 - 14
Nigeria 213 117 59 58 31.0 71Source: World Development Indicators, 2015
17

Table 4: Maternal Health
Maternal Mortality rate per 100,000 live births
Births Attended by skilled Health Staff (% of total)
Pregnant Women Receiving Prenatal care (%)
Prevalence of Anaemia in Pregnant women (%)
2013 1990 2007-13
2007-13 2011
World 210 - 69 83 38Low Income
440 - 51 76 42
Middle Income
170 - 73 85 39
Lower Middle Income
240 - - 78 47
Upper Middle Income
57 - - 95 26
Low & Middle Income
230 - - 83 39
East Asia & Pacific
75 84 92 95 25
Europe & Central Asia
28 - 97 95 28
Latin America & Caribbean
87 74 92 97 28
Middle East & North Africa
78 - 89 85 30
South Asia
190 - 50 72 52
Sub-Saharan Africa
510 - 49 77 46
High Income
17 - 23
Euro Area
7 - 25
Nigeria 560 31 38 61 58
Source: World Development Indicators, 2015
18

Table 5: Incidence of Diseases
Prevalence of HIV Total (% of Population)
Women’s share of population with HIV (ages 15+)
Anti-retroviral Therapy Coverage (%)
Incidence of Tuberculosis (People per 100,000)
1990 2013 2013 2013 2013Nigeria 1.0 3.2 58 20 338World 0.3 0.8 - - 126Low Income 1.9 2.3 56 38 241Middle Income
- - - - 133
Lower Middle Income
0.3 0.7 47 28 182
Upper Middle Income
- - - - 82
Low & Middle Income
- 1.2 49 36 149
East Asia & Pacific
- - - - 117
Europe & Central Asia
- - - - 66
Latin America & Caribbean
- 0.5 39 43 46
Middle East & North Africa
0.1 0.1 40 13 40
South Asia 0.1 0.3 34 35 186Sub-Saharan Africa
2.3 4.5 58 37 282
High Income - - - - 22Euro Area - - - - -
Source: World Development Indicators, 2015.
19
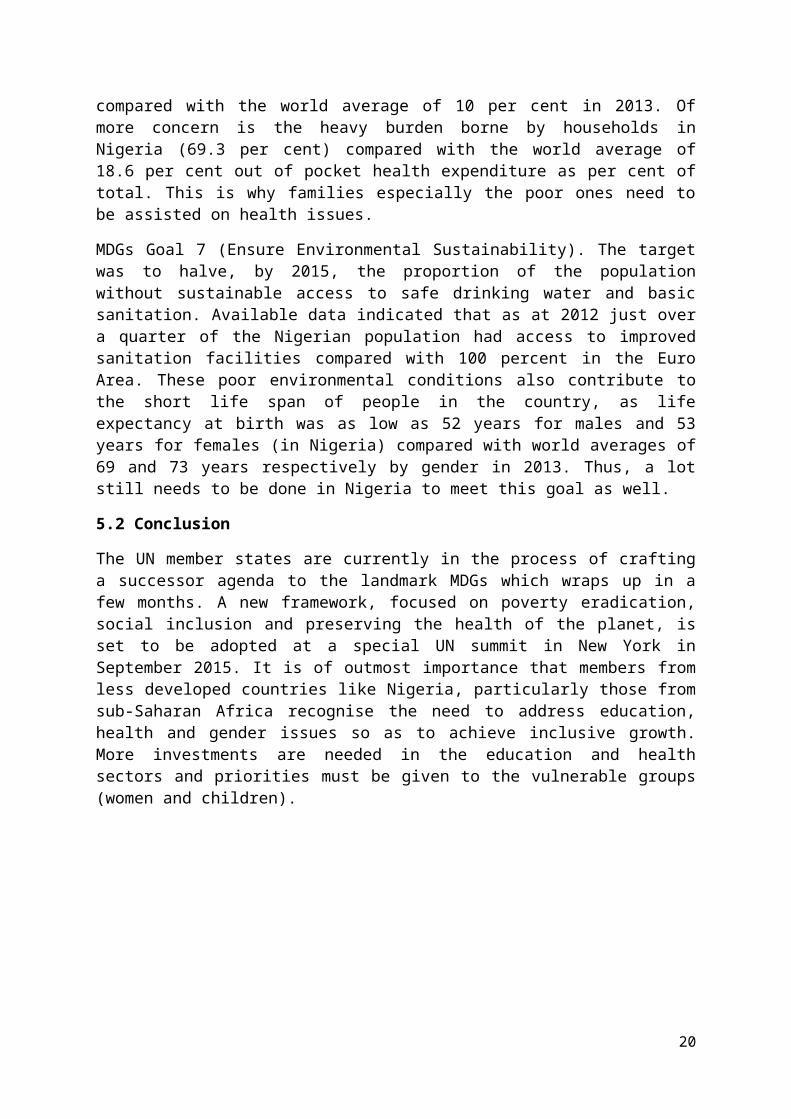
Table 6: Environmental Sustainability Indicators
Life Expectancy at birth (years)
Access to an improved water source(% of Pop)
Access to improved sanitation facilities (% of Pop)
Carbon dioxide emission per capita (metric tons)
Male Female
1990 2012 1990 2012 1990 2010 2013 2013World 76 89 47 64 4.2 4.9 69 73Low Income
51 69 18 37 0.6 0.3 61 63
Middle Income
73 90 37 60 2.0 3.4 68 72
Lower Middle Income
71 88 29 47 1.1 1.6 65 68
Upper Middle Income
75 93 43 74 2.7 5.4 72 76
Low & Middle Income
70 89 35 57 1.8 3.0 67 71
East Asia & Pacific
68 91 30 67 1.9 4.9 72 76
Europe & Central Asia
88 95 87 94 6.8 5.3 69 76
Latin America & Caribbean
85 94 66 81 2.2 2.7 72 78
Middle East & North Africa
87 90 70 88 2.5 3.9 69 74
South Asia
71 91 21 40 0.7 1.4 65 69
Sub-Saharan Africa
48 64 24 30 0.9 0.8 56 58
High Income
98 99 95 96 11.9 11.6 77 82
Euro Area
100 100 99 100 8.3 7.4 79 84
Nigeria 46 64 37 28 0.5 0.5 52 53Source: World Development Indicators, 2015.
20

REFERENCES
Adesoye, B. A. O. E. Maku and A. A. Atanda, 2012. Health Status, Employment and Income Nexus in sub- Saharan Africa: A panel analysis. Selected Papers from the 2012 Annual Conference of the Nigerian Economic Society. Published by the Nigerian Economic Society, Ibadan, Nigeria.
Central Bank of Nigeria, 2006-2007. The Millennium Development Goals (MDGs): Implementation Strategies and Challenges for Nigeria, CBN Briefs, Series No. 2006-2007/10.
Economic Community of West African States Commission: ECOWAS Poverty Profile. Prepared by the Economic Community of West African States (ECOWAS) and the United Nations Statistics Division, Department of Economic and Social Affairs. Printed by the United Nations, New York.
Egunjobi, T. A. 2013. Unemployment and Poverty: Nigerian Evidence. Selected Papers from the 2012 Annual Conference of the Nigerian Economic Society. Published by the Nigerian Economic Society, Ibadan, Nigeria.
Fapohunda, O. J. 2000. Macroeconomics Reading Materials. Lagos: University of Ado-Ekiti, Lagos Centre.
Francis Teal, 2014. Employment Creation, Poverty and the Structure of the Job Market in Nigeria. The Nigerian Journal of Economic and Social Studies. Vol. 56. No. 2, July 2014. Pages 255-283. Published by the Nigerian Economic Society, Ibadan, Nigeria.
Frank, R. H. and Bernanke, B. S. 2007. Principles of Economics. Third Edition. New York: McGraw Hill/Irwin.
National Bureau of Statistics, 1996. Poverty and Welfare in Nigeria.
National Bureau of Statistics, 2015. The Millennium Development Goals Performance Tracking Survey 2015 Report.
Obikaonu, F. C. (2004): Budgeting for the poor in Nigeria: An Analysis of the Impact of Budgetary Allocations and Poverty Alleviation Programmes on the Poor. Leading Issues in Macroeconomic Management and Development. Pages 43 -53. Edited by Abdul-Ganiyu Garba, Festus Egwaikhide and Adeola Adenikinju. Published by The Nigerian Economic Society, Ibadan, 2004.
The World Bank (2008): MDGs & the Environment: Selected Findings from the World Bank-IMF Global Monitoring Report 2008, An Agenda for Inclusive and Sustainable Development. Washington D. C. 2008.
The World Bank (2015): World Development Indicators. Washington D.C. April, 2015.
United Nations Development Programme, 1996. Human Development Report.
United Nations (2014): The Millennium Development Goals Report. New York, 2014.
21