Embed Size (px)
Citation preview
Estimating the costs of supporting the private sector through DFIs
Discussion paper Eurodad

Contents
Acknowledgements......................................................................................................................3
Introduction.................................................................................................................................4
Part 1. Methodological and technical issues................................................................................4
Two key typologies: subsidies and DFIs....................................................................................4
Social opportunity costs versus value of subsidy.....................................................................6
Rate of return as a measure of the public vs private nature of DFIs........................................7
Pipeline approach to measure how much subsidy is passed on...............................................8
Social rate of return.................................................................................................................8
Intangible support....................................................................................................................9
Double-counting.....................................................................................................................10
Part 2. Relevance of this research..............................................................................................11
DFIs to be explored................................................................................................................11
The key aspect of social benefits............................................................................................11
The debate about ODA and other development flows...........................................................11
The role of the private sector in development.......................................................................12
Nature of DFIs’ investments and their contribution to development....................................12
Accountability and transparency of DFIs................................................................................12
Annex – Discussion paper..........................................................................................................14
2

Acknowledgements This report was written by Javier Pereira as part of a research project commissioned by Eurodad’s María José Romero.
Special thanks go to the experts consulted during the course of this research project, including the active participation of some of them in an expert seminar in early June in London: Richard Gower (Foresight Economics), Jane Lethbridge (Public Services International Research Unit, University of Greenwich), Cécile Sangaré (Organisation for Economic Co-operation and Development), Luiz Vieira (Bretton Woods Project), Stephen Spratt (Institute of Development Studies), Matthew Martin (Development Finance International) and Paddy Carter (Overseas Development Institute).
June 2014
3

IntroductionOver recent years, the level of investment managed by Development Finance Institutions (DFIs) has increased significantly. The activities of DFIs have come under increased scrutiny, with several civil society organisations, think-tanks and academics investigating whether they are truly delivering social benefits. Particular emphasis has been placed on whether these benefits are additional, in the sense that they offer an improvement against a counter-factual of ‘no DFI lending.’ However the other side of the equation – the costs of DFIs to the public sector – and in particular the subsidies they receive from taxpayers and pass on to their clients, is relatively underdeveloped.
This report presents a comprehensive framework to assess the costs of DFI operations. Some of the costs that this framework attempts to measure have not been addressed in the existing literature. For example, the financial crisis prompted significant research on the costs of sovereign guarantees provided to banks that were too big to fail, but no research attempts have tried to quantify the extent of sovereign guarantees to DFIs.
This report summarises the findings of a research project commissioned by Eurodad on estimating the costs of supporting the private sector through DFIs. The project was composed of two phases. The first consisted of the preparation of a technical discussion paper that presents methods that could potentially be used to quantify the subsidies DFIs receive (see annex). The second consisted of an expert seminar (held 9 June 2015 in London), convened to discuss a methodology that could be used to improve Eurodad’s understanding of the social costs of DFIs’ operations.
This report is structured as follows. The first part summarises the discussion around the methodology and technical aspects of the research. This part complements and develops some aspects included in the discussion paper. The second part summarises the discussion about how this particular project relates or could help to advance the research agenda on DFIs in different areas. It provides ideas for further research, but more importantly, helps to illustrate the significance of this project.
Part 1. Methodological and technical issuesPart 1 presents the key technical and methodological issues raised in the discussion paper and the seminar. Particular attention is paid to technical obstacles and areas that need to be developed further, and that are important to take into account before applying the methodology that was developed through this project. Two different and very relevant typologies have to be considered as part of this project: a typology of the subsidies and a typology of DFIs.
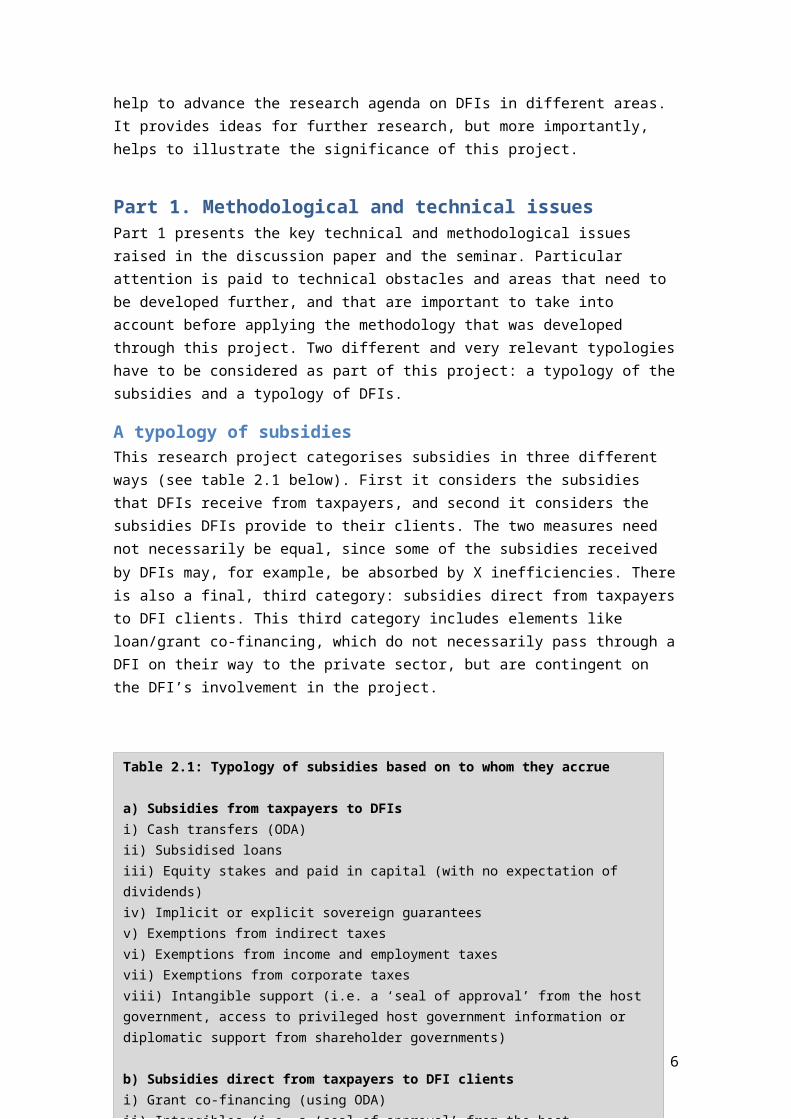
A typology of subsidies This research project categorises subsidies in three different ways (see table 2.1 below). First it considers the subsidies that DFIs receive from taxpayers, and second it considers the subsidies DFIs provide to their clients. The two measures need not necessarily be equal, since some of
4

the subsidies received by DFIs may, for example, be absorbed by X inefficiencies. There is also a final, third category: subsidies direct from taxpayers to DFI clients. This third category includes elements like loan/grant co-financing, which do not necessarily pass through a DFI on their way to the private sector, but are contingent on the DFI’s involvement in the project.
For each channel, we consider in the discussion paper the likely extent of subsidies in this area, we also review potential methods for estimating the subsidy and finally consider data requirements for these methods.
A typology of DFIsThe term “DFI” refers to a range of different institutions and there is not an agreed typology of DFIs. These institutions have different mandates, capital structures and funding strategies which are likely to affect the valuation of their costs and subsidies. In order to apply a methodology to measure the subsidies DFIs receive, it is important to differentiate among different types of DFIs.
5
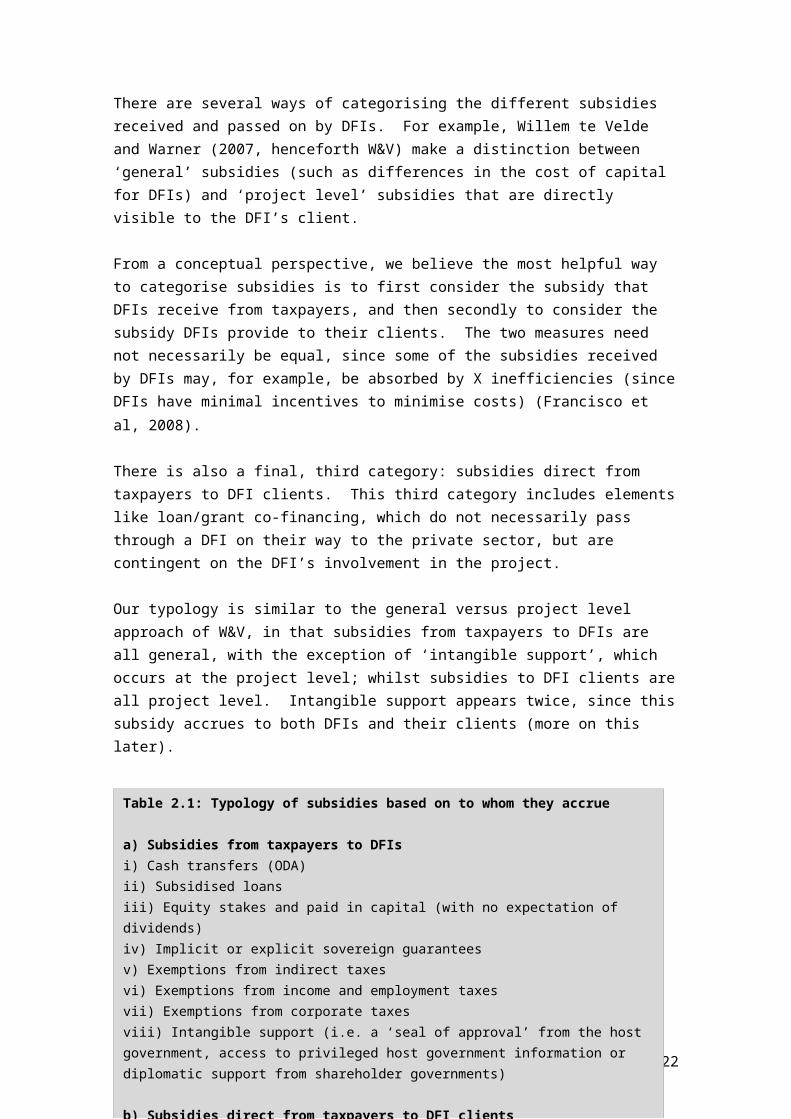
Table 2.1: Typology of subsidies based on to whom they accrue
a) Subsidies from taxpayers to DFIsi) Cash transfers (ODA)ii) Subsidised loansiii) Equity stakes and paid in capital (with no expectation of dividends)iv) Implicit or explicit sovereign guaranteesv) Exemptions from indirect taxesvi) Exemptions from income and employment taxesvii) Exemptions from corporate taxesviii) Intangible support (i.e. a ‘seal of approval’ from the host government, access to privileged host government information or diplomatic support from shareholder governments)
b) Subsidies direct from taxpayers to DFI clientsi) Grant co-financing (using ODA)ii) Intangibles (i.e. a ‘seal of approval’ from the host government, access to privileged host government information or diplomatic support from shareholder governments)
c) Subsidies from DFIs to their clientsi) Interest rate subsidiesii) Longer maturities on loansiii) Grace periods on loansiv) Absorbing exchange rate riskv) Expectation of lower returns on equity stakesvi) Guarantees and risk insurancevii) Lower / Fewer feesviii) Technical Assistance
c)
There are different ways in which DFIs can be classified. The table below provides a simplified overview of DFIs in relation to some key subsidies. This approach could be developed further. In addition, the Organisation for Economic Co-operation and Development (OECD) has already tried to explore existing differences among DFIs. It has, for example, quantified capital contributions and reinvested earnings and dividends.i The OECD has also identified a number of criteria to differentiate DFIs, which would be worth considering in the context of this project:ii
the primary purpose test; operating in Official Development Assistance (ODA) eligible countries; development goal of the institution and evidence of development impact; Untied ODA; additionality test (not being market disturbing); transparency and accountability.
The best way to explore the typology of DFIs would be to apply the methodology to a sample of institutions in order to evaluate existing differences on the basis of hard facts. This exercise would complement and expand the efforts made by the OECD. It could also contribute to shed some light onto fundamental questions such as what exactly a DFI is. Although there are a number of institutions that are generally considered to be DFIs, there is less clarity about others. For example, Compañía Española de Financiación del Desarrollo (COFIDES) provides “cost-effective medium and long term financial support for viable private direct investment projects in foreign countries where there is a Spanish interest” and therefore does not operate under a primarily development mandate. For this reason, the Spanish government does not consider Cofides’ operations as development finance and, also for confidentiality reasons, does not report data to the OECD. However, COFIDES is a founding member of the grouping known as European Development Finance Institutions (EDFI) and several authors consider it a DFI. This illustrates the blurred lines existing between institutions with a developmental mandate and
6

those that promote national interests. It is therefore important to develop a fine-tuned typology of DFIs.
Social opportunity costs versus value of subsidyIt is generally considered that the best way to value the costs incurred by the public sector is measure the social opportunity costs. This is the approach proposed to measure items considered under the headings “subsidies from taxpayers to DFIs” and “subsidies from taxpayers to DFI clients” in the discussion paper (see annex).
However, applying this methodology to “subsidies from DFIs to clients” is not so straightforward as it depends on whether you consider DFIs to behave as part of the public sector or the private sector. If you consider DFIs as a part of the public sector, then you would use the social rate of return to estimate the opportunity costs. In practice, one would be comparing the costs with the possibility of the government investing the money in something else. However, if you consider that they act as private sector entities and are independent from the government, then one cannot compare operations with other public investments and would need to measure the opportunity costs in relation to the commercial rate of return expected instead, i.e. the opportunity costs of other investments that could be made by a private actor.
This question is closely linked to the typology of DFIs discussed in the section above. Some DFIs operate more like private sector institutions (for example the Netherlands Development Finance Company, FMO, does pay dividends) or receive fewer subsidies. There are a number of different features one could consider, whether individually or collectively, in order to assess whether DFIs operate under an official or commercial mandate. For example, it is possible to look at the institution’s mandate in order to assess the balance between what one would typically consider as public endeavours (development, addressing market failures or constrains, etc.) and those of private sector actors.
It is also possible to examine the rates of return of DFIs to evaluate whether they are closer to those of the financial sector or significantly lower and therefore suggest some form of risk absorption or a broader mandate (e.g. including providing public goods, etc.). Another option is to look at governance and financial aspects such as the shareholder structure, government guarantees and the decision-making chain to assess who is in control.
On the basis of Eurodad’s previous research and the findings of this project, we decided to consider DFIs as public institutions, although additional research needs to be conducted and a clear set of criteria need to be developed.
Rate of return as a measure of the public vs private nature of DFIsLooking at the rate of return was considered the most straightforward way to measure the public/private nature of DFIs and provide an answer to the questions above. However, this would imply making a number of assumptions with significant technical and political implications. Using this approach would mean that all differences in rates of return can be attributed to their role or mandate, while the operational costs, internal inefficiencies, and the choice of financial instruments can all have a significant impact on the rates of return.
7

Adjusting for these effects is possible in some cases, but quite difficult in others. Several DFIs report their operational costs, which could help fine tune this methodology. The Belgian DFI, BIO, for example, could be a good example to identify operational costs. Adjusting for other effects would require a detailed portfolio assessment (composition and weight of different instruments and expected rates of return).
There are also implications at the policy level. For example, what does it mean when organisations have high operational costs? If the methodology simply takes operational costs as a measure of efficiency, then the higher the efficiency (the lower the costs), the better. However, higher operating costs could mean they spend more time and research on the project. If the methodology just focuses on efficiency or gives it an edge, then we might be giving a poor mark to DFIs implementing stricter policies or due diligence procedures and/or incentivising DFIs to reduce costs and go for easier projects.
It is important to take into account the costs of DFIs doing their job right. For example, a mandate to invest in local and small companies in developing countries would usually involve higher operational costs than the promotion of national companies because of the transaction costs involved.
In practice, this means that one would need to combine the operational costs with a measure of the additionality of the financial institution (not only financial, but also in terms of delivering results according to their mandate). Since there are likely to be different types of DFIs (see discussion above), this exercise would need to be broken down for DFIs classified within the same category in order to account for the differences.
The bottom line is that more work is needed to understand how much is absorbed in inefficiency and how much is passed on. Moreover, this work would need to be linked with the issue of additionality and the actual impact of DFI projects in order to come up with a constructive analysis and precise recommendations.
Pipeline approach to measure how much subsidy is passed onTheoretically, the result of applying the methodology would be a measure of how much enters in the form of subsidies from the taxpayer into DFIs and how much is passed on as a subsidy to beneficiaries. The differences in both measures could be attributed to internal costs (including inefficiencies and other operational costs; see discussion above for the implications of this).
The possibility of applying this approach depends on having all costs measured from the taxpayer perspective (on the basis of social opportunity costs). If this would not be the case (see discussion “social opportunity costs versus value of subsidy” and on intangible support below), the result would be two measures taken from different reference points. This implies that the pipeline approach could not be used to get a full picture of how subsidies are transferred and used internally.
Social rate of returnThe discussion paper proposes a number of different options to use as a proxy for the social rate of return. It argues that the costs of borrowing by the government could be a conservative and solid approach to this when compared to a rule of thumb or an inflation-based measure.
8

The OECD explained how the grant element is measured for aid related projects and described the recent revision of the discount rate.iii The OECD’s revised discount rates consist of a base factor of 5%, corresponding to the donor funding cost (in line with the methodologies of the World Bank and International Monetary Fund), and a risk-adjusted premium which is dependent on the recipient country. The OECD methodology recognises that in measuring the provider effort it is necessary to take into account both the donor funding cost and the risk associated with the project.
Based on the discussion paper and alternatives discussed during the seminar, it would seem reasonable to adopt the same approach for the following reasons:
it provides a more realistic measure of the social rate of return expected than interest rates, while it remains sensitive to the national context, and
it is an internationally agreed figure and there is reliable data available for every country.
However it remains to be discussed whether this methodology should be applied to the country where the DFI is from, instead of the countries where the projects in the portfolio are taking place. This approach would assume we want to measure the social rate of return in relation to any alternative investment unrelated to development made by the government supporting the DFI (i.e. what is the rate of return of using the money for a different investment, instead of giving it to the DFI). The other approach is to assume that the alternative use of the fund would also be related to development, instead of any government activity. In this case, it would be necessary to estimate rates of return for individual countries in the portfolio. The latter approach would yield a higher figure as rates of return of development projects tend to be higher.
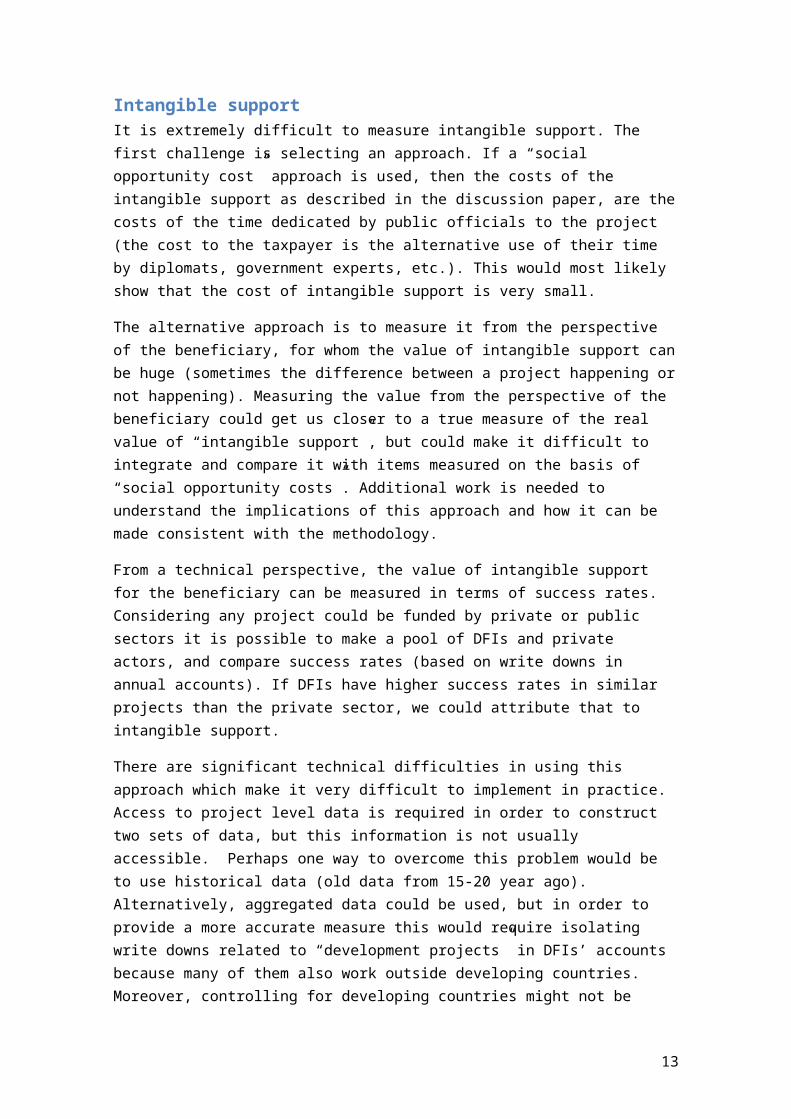
Intangible supportIt is extremely difficult to measure intangible support. The first challenge is selecting an approach. If a “social opportunity cost” approach is used, then the costs of the intangible support as described in the discussion paper, are the costs of the time dedicated by public officials to the project (the cost to the taxpayer is the alternative use of their time by diplomats, government experts, etc.). This would most likely show that the cost of intangible support is very small.
The alternative approach is to measure it from the perspective of the beneficiary, for whom the value of intangible support can be huge (sometimes the difference between a project happening or not happening). Measuring the value from the perspective of the beneficiary could get us closer to a true measure of the real value of “intangible support”, but could make it difficult to integrate and compare it with items measured on the basis of “social opportunity costs”. Additional work is needed to understand the implications of this approach and how it can be made consistent with the methodology.
From a technical perspective, the value of intangible support for the beneficiary can be measured in terms of success rates. Considering any project could be funded by private or public sectors it is possible to make a pool of DFIs and private actors, and compare success
9

rates (based on write downs in annual accounts). If DFIs have higher success rates in similar projects than the private sector, we could attribute that to intangible support.
There are significant technical difficulties in using this approach which make it very difficult to implement in practice. Access to project level data is required in order to construct two sets of data, but this information is not usually accessible. Perhaps one way to overcome this problem would be to use historical data (old data from 15-20 year ago). Alternatively, aggregated data could be used, but in order to provide a more accurate measure this would require isolating write downs related to “development projects” in DFIs’ accounts because many of them also work outside developing countries. Moreover, controlling for developing countries might not be enough as there could also be differences across sectors, which include additional granularity and building a very large dataset. There are also important problems that arise when trying to group projects with a similar level of risk (making groups of projects and countries with a similar level of risk). This requires very detailed data and/or making a number of assumptions.
Another alternative to measure the value of intangible support from the beneficiary perspective would be to compare individual bilateral DFIs with a set of multilateral DFIs. One could argue that multilateral institutions such as the World Bank’s International Finance Corporation (IFC) receive significantly less intangible support since they have a large number of shareholders and a much broader mandate compared to national ones. National governments participating in multilateral institutions are therefore less likely to use their influence (e.g. diplomatic, economic, etc.) to make projects happen in developing countries, especially if we compare them with projects supported by national DFIs and implemented by national companies. In practice, the level of intangible report in projects supported by DFIs is not zero (e.g. they might still have access to expertise, etc.), but it is possible to use multilateral DFIs as a reference framework to estimate the intangible support of national DFIs. Since multilateral DFIs would represent the starting point (level zero), this methodology would result in a conservative estimate.
If we assume that multilateral DFIs receive no support, then, controlling for dissimilarities in portfolio or typology, differences in success rates with bilateral DFIs could be attributed to intangible support and estimated. This alternative is worth exploring in greater depth.
Double-countingThere are two potential instances of double-counting when applying the methodology. One is the direct effect of tax emptions enjoyed by DFIs on the annual accounts. When estimating the costs of corporate income tax, for example, it is important to take into account the effect of such subsidies on profits (i.e. higher taxes would translate into lower benefits and have an impact on other items in the accounts that are used to measure other aspects of the methodology). If tax exemptions are evaluated, then a measure of “true profits” would need to be constructed. In practice, it should be possible to deal with this by making adjustments to the annual accounts.
The other problem has to do with the potential dynamic effects (substitution effects) of some of the advantages enjoyed by DFIs that would be removed. For example, if the methodology evaluates the costs of the guarantee by just comparing two scenarios (with and without
10

guarantee), it would fail to account for any ways in which the institution could partially compensate for this. Accounting for dynamic effects can be extremely complicated in practice.
11

Part 2. Relevance of this researchPart 2 presents the main points discussed over the course of this project in relation to how this particular research project relates or could help to advance Eurodad’s work on DFIs in different areas. In some areas, it complements the discussion started in Part 1. It also introduces a number of additional issues which are not related to the technical aspects of the methodology, but which are key to analysing the relevance of this project.
DFIs to be exploredThis section is closely related to the discussion about DFIs’ typology (see Part 1). It has already been mentioned that the methodology can help shed some light on what a DFI is. In addition to this and with views to future research efforts, participants in the seminar argued that in addition to large DFIs operating at international level, it would be interesting to include small institutions that operate at national, regional or local scales, such as locally owned development banks. These institutions have a different relationship with their clients and local communities and it could be interested to include some examples in a future research sample in order to explore differences in performance.
In addition to providing some necessary information to compare the effectiveness of international and national DFIs, the research could contribute to a better understanding of the challenges and difficulties faced by DFIs when they start operating at an international level. Some experts consider that there is a compromise between the ability to support smaller or targeted projects and the need to keep actual transaction costs under control.
The key aspect of social benefitsThe proposed methodology looks at one side of the equation (social costs) and does not take into account the positive impact and the additionality of the projects implemented by DFIs. The rationale behind this is that compared to the social impact, this is a relatively unexplored area of research where Eurodad can have a greater added value. In addition, addressing both sides of the equation would require an amount of time that is beyond the capacity of this project.
In any case, it is important to acknowledge that this limitation does constrain the analysis of the results. For example, this project alone would not be able to solve questions such as the link between subsidies and actual social impacts (which could make larger subsidies more desirable) or explore the relationship between certain types of DFIs and their actual impact on the ground. Nonetheless, this project has to be seen as a necessary stepping stone towards more comprehensive research on the future role of DFIs.
The debate about ODA and other development flowsThe OECD is currently in the process of modernising the measurement of ODA and working on different ways to quantify development finance above and beyond ODA (new measure of total official support for sustainable development (TOSSD)).
Although this research does not focus on ODA and tries to measure a large number of additional items, it can potentially help to understand different ways in which ODA can be used
12
by DFIs and provide some evidence that can guide future research on how ODA can be used most effectively and efficiently.
The contribution of this project to the discussion on other development flows can be more substantial in the sense that it would provide information about the real costs of DFIs to taxpayers. As mentioned above, this is an area where very little research has been conducted. If these costs are significant, it could provide fuel to positions arguing for more costs to be counted as “development flows”. However, any such claims would be premature. Without a more comprehensive view of the other side of the equation mentioned above (the social impact and the additionality of projects) it would be impossible to establish a link between the costs of DFIs and their contribution to development.
The role of the private sector in developmentThe focus of this report could make a significant contribution to the current debate about the role of the private sector in development. Many DFIs do provide significant support to private sector actors. Improving our understanding of how institutions use and deliver subsidies and combining it with research on their choice of clients (who DFIs support) would provide new evidence to inform this debate. Moreover, this work can be further enriched by including different types of DFIs (including national and local development banks, for example) in the research.
Nature of DFIs’ investments and their contribution to developmentA better understanding of DFIs’ costs and passed on subsidies would, complemented with research on the impact side, encourage the debate about the nature of DFIs’ investments and their contribution to development.
For example, the methodology could help to understand whether DFIs’ investment in certain regions have really been made in the form of transformational investments. The methodology would provide an estimate of the aggregate subsidy in certain regions. This measure could be subsequently compared with data on the industrialisation of the very same regions in order to assess to what extent DFIs have contributed to this. By drawing comparisons among regions, institutions or sectors, and accounting for other factors, researchers could draw important conclusions about which investment strategies are best to deliver transformational change and industrialise countries.
Accountability and transparency of DFIsThe project will yield information about the extent of public (taxpayer) support to DFIs. This could answer existing questions about the level of accountability required of DFIs. It has been mentioned that there are different types of DFIs and that the limits between what a DFI actually is or is not are blurred. Some DFIs operate under a double mandate – i.e. to promote both development and national interest – (see example from COFIDES in Part 1), and face some confidentiality constraints for reporting at the activity-level to the OECD DAC. The same also applies to other DFIs that tend to operate more as independent private sector actors (they also provide very little information about their projects).
Having an actual figure on the level of public support to different DFIs would provide real evidence to evaluate existing calls for transparency and accountability. If the figures show that
13

DFIs receive significant public support despite governments not considering them as DFIs, taxpayers would have strong arguments to request greater accountability and transparency from these institutions.
14

Annex – Discussion paper
Development Finance Institutions and their Subsidies: Towards a methodological framework for assessing their subsidy from
taxpayers, and the extent to which this is passed on to their clients
PROVISIONAL DRAFT
This report has been produced by Foresight Economics for the European Network on Debt and Development (EURODAD), in preparation for a workshop on Tuesday 9th June.
Authors: Richard Goweriv and Ben Gowerv
15
1. IntroductionOver recent years, the level of investment managed by Development Finance Institutions (DFIs) has increased significantly. Partly as a result of this, their activities have come under increased scrutiny, with several civil society organisations, think-tanks and academics investigating whether they are truly delivering social benefitsvi.
However the other side of the equation – their social costs – and in particular the subsidies they receive from taxpayers and pass on to their clients, are poorly understood. The purpose of this paper is to advance the debate in this area by identifying methods that could potentially be used to quantify these subsidies. The literature in this area is relatively undeveloped, but where possible we draw on tried and tested approaches used by other researchers, seeking to combine them into one coherent framework. We focus in particular on subsidies from taxpayers to DFIs.
The remainder of the paper is structured as follows: section 2 sets out a brief typology for subsidies from taxpayers to DFIs and their clients, section 3 outlines three key methodological considerations (individual versus group approaches, estimation of social opportunity cost, and discounting), section 4 examines subsidies from taxpayers to DFIs, section 5 examines subsidies direct from taxpayers to DFI clients and section 6 makes some observations regarding subsidies from DFIs to their clients; section 7 concludes.
2. Typology of SubsidiesThere are several ways of categorising the different subsidies received and passed on by DFIs. For example, Willem te Velde and Warner (2007, henceforth W&V) make a distinction between ‘general’ subsidies (such as differences in the cost of capital for DFIs) and ‘project level’ subsidies that are directly visible to the DFI’s client.
From a conceptual perspective, we believe the most helpful way to categorise subsidies is to first consider the subsidy that DFIs receive from taxpayers, and then secondly to consider the subsidy DFIs provide to their clients. The two measures need not necessarily be equal, since some of the subsidies received by DFIs may, for example, be absorbed by X inefficiencies (since DFIs have minimal incentives to minimise costs) (Francisco et al, 2008).
There is also a final, third category: subsidies direct from taxpayers to DFI clients. This third category includes elements like loan/grant co-financing, which do not necessarily pass through a DFI on their way to the private sector, but are contingent on the DFI’s involvement in the project.
Our typology is similar to the general versus project level approach of W&V, in that subsidies from taxpayers to DFIs are all general, with the exception of ‘intangible support’, which occurs at the project level; whilst subsidies to DFI clients are all project level. Intangible support appears twice, since this subsidy accrues to both DFIs and their clients (more on this later).
16Table 2.1: Typology of subsidies based on to whom they accrue
a) Subsidies from taxpayers to DFIsi) Cash transfers (ODA)ii) Subsidised loans

In summary, there are eight potential channels for public subsidy of DFIs, and ten channels through which DFI clients can benefit from public subsidy (eight of which pass through DFIs).
Intangible support, the last item under headings (a) and (b), differs from the others in two important ways. Conceptually, we can see this support as increasing the probability that DFI-funded project are a success, relative to the case where the private sector finances the project. The benefits therefore accrue to both the DFI (increased likelihood of returns) and the client, all else constant. The second important difference is that intangible support is the main form of subsidy that arises from both host and shareholder governments, rather than solely the shareholder government (the other being certain forms of tax exemptions).
It is also worth noting that some of the subsidy passed on to the private sector by DFIs is intentional, but some may be unintentional, if these private sector beneficiaries are able to exploit information asymmetries, such that DFIs believe projects to be - for example - lower risk than they actually are.
3. Methodological ConsiderationsBefore considering the subsidies themselves, it is worth making three general points about the methodologies we consider.
3.1 DFI by DFI versus group estimatesWherever possible, we seek to identify methodologies that would allow the estimation of subsidy for a specific DFI. However, for some subsidy channels, this is not possible. In these instances, we suggest approaches that would allow an average subsidy across DFIs as a group to be estimated.
3.2 Opportunity CostConceptually, there are two ways of valuing subsidies. The first is to estimate the value of the subsidy to the recipient (i.e. the DFI or private sector client). The second is to estimate the cost of the subsidy to the taxpayer. The two methods will give different figures and the appropriate choice is determined by what you intend to use the numbers for.
If the numbers are going to be set against the social benefits that a DFI delivers, in order to determine whether the social benefits a DFI delivers exceed their social costs, then economic theory is clear that subsidies should be evaluated against the social opportunity costvii of government resources (HMT, 2011). That is, the next best alternative use of that money by the government. If, alternatively, the aim is simply to put a figure on the benefit to the DFI (or private sector), then it may be more appropriate to consider how much money the subsidy saves them (compared with alternative sources of finance).
This is a crucial conceptual point. Guided by the terms of reference, we have taken the former approach for sections 4 and 5, advocating methods that assess the opportunity cost of the
17
Table 2.1: Typology of subsidies based on to whom they accrue
a) Subsidies from taxpayers to DFIsi) Cash transfers (ODA)ii) Subsidised loans
subsidy to taxpayers. A DFI’s subsidy is thus, “the social opportunity cost minus the price the DFI actually pays [for government finance]” (Schreiner and Yaron, 2001: 22).
However, it is not always possible to value subsidies in this way, and the paucity of appropriate methods sometimes forces us into valuing subsidies based on their value to a DFI rather than to taxpayers. We clearly indicate where this is the case.
Furthermore, as our analysis progresses it will become clear that the need to prevent double-counting of subsidies to DFIs means that it is often necessary to estimate both the benefit of the subsidy to the DFI and the social opportunity cost to the taxpayer, which further complicates the analysis.
Finally, it is important to point out that the measure of social opportunity cost chosen forms a crucial assumption in any calculation of subsidy value. And unfortunately, identifying the true social opportunity cost is fraught with difficulty. In practice, authors in this field (such as Schreiner and Yaron, 2001; Nawaz, 2010; and others) have sort to identify an estimate of the social opportunity cost using the following principles: first, accuracy to true opportunity cost. Second, consistency with public analysis measures to facilitate comparison. Third, selecting credible and transparent rates. Fourth, preferring higher rates to lower rates, all else constant.
These authors argue for choosing higher rates, all other things equal, because they are interested in determining whether DFIs (and microfinance institutions, MFIs) could be financially sustainable without subsidy, and choosing high rates therefore adds a degree of conservatism to their conclusions. For this project however, conservatism would imply preferring lower rates to high, as this will produce a more conservative estimate of the subsidy from taxpayers to DFIs. We therefore suggest reversing the fourth principle and preferring lower rates to high.
In the literature, there are five ways in which social opportunity cost has been calculated in relation to DFIs and MFIs (Nawaz, 2010):
1. Using inflation (Rosenberg, Christen and Helms, 1997). 2. Interest rates for treasury bills, sometimes plus a mark up for administrative costs and
reserve requirements (commonly between 2 and 3 percentage points (Yaron, 1992; Warusawitharana, 2014).
3. Using a rule of thumb of 10 or 12 percentage points (Belli et al, 1998; Katz and Welch, 1993).
4. Using the cost of private debt (local prime rate i.e. lending rate) (Nawaz, 2010). 5. Adding a premium for risk to the local prime rate (Benjamin, 1994; Schreiner, 2003).
The first suggests a real opportunity cost of zero once inflation has been accounted for. This is clearly a substantial underestimate (Schreiner, 1997).
The second measure has been the most popular when evaluating DFIs and MFIs (Nawaz, 2010), and is used by several European governments when evaluating their own projects (Warusawitharana, 2014). The assumption here is that the next best thing to do with public
18

funds (other than subsidise DFIs) is not to spend them. Thus the opportunity cost is money saved by not having to issue a government bond. Measures of subsidy that use the deposit rate as a measure of social opportunity cost are lower bounds (Schreiner and Yaron, 2001), since in practice, most practitioners accept that there is almost always a portfolio of potential projects offering higher social (if not always financial) returns than the cost of government borrowing.
The third is used by the World Bank and several governments (Gollier, 2011), it has served to provide assumptive consistency in an area where the true social opportunity cost of public funds, particularly when earmarked for anti-poverty measures, are not agreed upon (Nawaz, 2010). However it is arbitrary, representing “the highest credible lower bound” (Schreiner and Yaron, 2001: 20).
The fourth and fifth rely on the premise that private debt will replace public debt (Nawaz, 2010). This does not measure the opportunity cost to the public purse, and furthermore it does not necessarily measure what it would cost a DFI (rather than an MFI) to raise its capital on private markets. The fifth has more commonly been applied to MFIs than DFIs, with risk premiums based on an MFIs age and profit levels (Schreiner, 1997). As there is no evidence of the same relationship between risk and age for DFIs as MFIs, this measure would lack credibility and transparency.
In line with the principles described above, and placing extra emphasis on the need for this project to offer both conservative and transparent estimates of subsidy, we suggest using option 2 (interest rates on government debt) but without an arbitrary mark up for administrative costs. This provides a transparent and credible lower-bound of social opportunity cost. In the current economic climate, where rates for borrowing are low, the social opportunity cost will be significantly below the 10 or 12 percentage points arbitrarily assigned in the third method, limiting the likelihood that subsidies to DFIs are being overstated and increasing the likelihood that they are understated. The availability of relevant interest rates from the IMF’s International Financial Statistics (IFS) ensures the transparency of this measure.
3.3 Net Present Value versus Annual CostsWe focus primarily on annual measures of subsidy. However, if a multiyear assessment of subsidy is required it will be important to discount these annual flows, providing a net present value (NPV) of subsidy, rather than simply summing all of the annual flows across time. In general, similar methods to those used to identify annual subsidies could be used, but with the additional step of accounting for a discount rate when these annual flows are amalgamated (Schreiner and Yaron, 2001).
4. Subsidies to DFIs from Taxpayers: Estimation Methods by Subsidy ChannelIn this section, we work through the typology in section 3, examining each of the subsidy channels from taxpayers to DFIs. For each channel, we consider the likely extent of subsidies
19
in this area, before reviewing potential methods for estimating the subsidy and finally considering data requirements for these methods.
i) ODA Cash TransfersExtent of Cash TransfersIn general it is clear that whilst DFIs might be involved in the management of ODA funds, or be involved in projects that are co-financed with ODA, “it is unusual for DFIs to have direct control over [ODA]” (W&V). It thus seems likely that very few DFIs are absorbing ODA grants as general income. Instead, where DFIs have access to ODA funds, they are kept as a separate, project-based item that is rarely under the DFIs direct control.
Consequently the issue of ODA subsidies is more relevant to section 5, which considers subsidies from taxpayers direct to DFI clients, contingent on the involvement of a DFI in the project. ODA cash grants are not a common means of subsidising DFIs themselvesviii (Te Velde, 2011). However, below we briefly describe how an ODA cash grant to a DFI from taxpayers would be valued, for cases where this does arise. It may become increasingly important if ODA eligibility criteria relating to private sector instruments are expanded ix.
Potential Methods & Data RequirementsCash transfers represent a subsidy to a DFI. Ths is equivalent to the face value plus the social opportunity cost rate of return, as below. This represents the (social) return that the government could otherwise earn on the ODA.
Sc = T x (1 + m)
Where:Sc = Subsidy to DFI from cash transfersT = Total cash transfers to DFIm = Social rate of return
(ii) Subsidised LoansExtent of SubsidyIt appears unlikely that DFIs typically receive subsidised loans from governments. Several bilateral DFIs do not borrow money at all, and are instead financed entirely by the equity stake of their shareholder government and retained earnings (see Table 3, W&V). And whilst others do borrow money, this is typically by issuing bonds on capital markets, which are bought by private investors (for example two thirds of the IFC’s funding comes through bond issues, IFC, 2014a: 11).
However, the framework for evaluating DFI subsidies put forward by the World Bank includes a method for valuing subsidised loans in their illustrative example (Schreiner and Yaron, 2001). Other authors have used this framework to evaluate subsidies to MFIs (e.g. Nawaz, 2010; Schreiner, 2004), and in keeping with their approach we show how a subsidy like this would be valued below.
20

Potential Methods & Data RequirementsThe subsidy from taxpayers to DFIs through discounted interest rate payments on outstanding loans is calculated by the social opportunity cost minus the actual interest rate received from the DFIsx, multiplied by the value of the loans:
Sl = D x (m - c)
Where:Sl = Subsidy to DFI from loan subsidiesD = Average public debtm = Social rate of returnc = Actual interest rate received
Annual average public debt is half the sum of the start and end debt, assuming that changes in debt occur at a constant pace through the year and given year-end financial accounts.
iii) Equity StakesExtent of SubsidyBilateral DFIs are typically owned by their respective governments through a 100% equity stake (which often also comprises a large proportion of their total funding, alongside retained earnings). Kingombe et al (2011) evaluate the shareholder ownership of DFIs, showing that SwedFund, Norfund, IDC, OPIC, CDC Group and DEG (through the KfW Bankengruppe) are all fully owned by their respective governmentsxi. In addition, our analysis shows the same is true of BIO and IFU.
Similarly, multilateral DFIs are financed to some extent through the equity stakes of member states (although they are also much more likely to be accessing debt markets, such that equity is relatively less important in their funding mix).
As with subsidised loans, the subsidy to DFIs from taxpayers is the difference between expected returns and the social opportunity cost. The return expected on an equity investment is a combination of expected dividends and any profit expected when the stake is sold (Copeland et al 2005). However, it appears that governments typically expect no financial return on their equity investment.
This is for two reasons; firstly, as W&V highlight, DFIs rarely pay dividends to shareholders (the exceptions in their study being MFO and Proparcoxii). There is therefore, no expected return from dividends. Second, DFIs’ typical shareholders (governments) appear not to expect a return at sale either: the few examples where DFIs have actually been sold, such as the spin out of Actis from CDC, have occurred at a level far below market value (Guardian, 2012).
Thus for a DFI that pays no dividend, the subsidy is simply the product of social opportunity cost and average total equity stakes. This improves upon W&V in two ways. Firstly, it is a measure of social opportunity cost rather than merely comparing the rate of return on equity
21
with that of a different financial institution. As Schreiner and Yaron (2001) highlight, approaches that rely on the return on equity, rather than opportunity cost do not fully reflect the subsidy to DFI from public funds. Secondly, it calculates the opportunity cost in a transparent manner, without arbitrarily using one financial institution’s dividend.
In the event that dividends were being paid by a DFI, the subsidy would need to take this into account. As with subsidised interest rates, the dividend may be at a lower rate than a non-subsidised financial institution would provide. Thus the subsidy would be the product of the social opportunity cost minus the dividend paid, multiplied by the average total equity stakes.
Methods and Data AvailabilityWhere no dividends are paid, the public subsidy is simply the social opportunity cost times the public equity stake:
Se = E x m
Where:Se = Subsidy to DFI from equity stakesE = Average total equity stakesm = Social rate of return
As with annual average public debt, annual average equity stakes are half the sum of the start and end stocks, assuming that stocks grow and flows occur at a constant pace through the year and given year-end financial accounts (Schreiner and Yaron, 2001).
Where some dividends are paid:
Sse = E x (m - d)
Where:Se = Subsidy to DFI from subsidised equity stakesE = Average total equity stakesm = Social rate of returnd = Dividend rate paid
Worked Example for subsidised loans and equity stakes (from Nawaz, 2010)Nawaz considers 204 MFIs, using their financial accounts to derive the following:
Table 4.1: Example calculation for subsidised loans and equityVariable Definition MedianAverage public debt(D)
Average annual outstanding concessionary-borrowed funds.
$3300
Average annual equity (E)
Average current (I) and previous year (t-1) equity.
$3900
Actual interest rate (c) Interest cost paid on concessionary 7.2%
22

borrowed funds.Opportunity cost of capital (m)
Market lending rate (in Nawaz’s case).
12.9%
From these the subsidy from ii) subsidised loans and iii) equity stakes can be calculated:
Sl = D x (m - c)= 3300 (12.9% - 7.2%)= $155
Se = E x m= 3900 x 112.9%= $531
While Nawaz (2010) uses the market lending rate as a proxy for opportunity cost, as has been discussed above, a more appropriate measure for this exercise is the interest rate on treasury bonds. If applied to a state-owned DFI then this adaptation is simply a case of using the figures outlined in the IFS.
iv) Implicit or Explicit Sovereign GuaranteesExtent of SubsidyAn implicit or explicit guarantee represents a subsidy because private creditors are likely to lend to DFIs at lower rates than they otherwise would, if the DFI was not backed by a guarantee (W&V). Thus the guarantee lowers DFI borrowing costs on the capital markets.
As such, all DFIs that access the capital markets are likely to benefit to some extent from either an implicit of explicit guarantee from their shareholder governments. This applies in particular to multilateral DFIs, who can sometimes raise a large proportion of their finance through debt issuance. However, it also applies to some bilateral DFIs who access the capital markets (see W&V Table 3) either directly or (as in the case of DEG or Proparco) through a parent organisation.
Potential MethodsThis is an area which has received scant coverage in the literature on DFIs (although it is considered by W&V). However, the Global Financial Crisis has resulted in a significant amount of effort being devoted to a related problem: quantifying the government’s implicit guarantee of systemically important (or ‘too-big-to-fail’, TBTF) banksxiii. The IMF (2014) gives a good summary of the three main approaches taken to solving this problem in the literature.
1. Comparing the financing costs of TBTF institutions (or DFIs in our case) with those of non-TBTF banks (commercial banks). This approach is equivalent to the method advocated by W&Vxiv for estimating the value of a sovereign guarantee to a DFI. The problem with this approach is that it implicitly assumes that all of the differences between a DFI’s borrowing costs and those of another financial institution are driven by the existence of a sovereign guarantee. Unfortunately, this is a weak assumption, since many DFIs also enjoy a much
23

stronger financial position (even without the guarantee) than private sector institutions. As IMF (2014: 6) comment, this approach is “less reliable and can even be misleading… [because it] does not account for possible differences in fundamental characteristics that may drive the spread differential.”
2. Contingent Claims Analysis. This second approach described by IMF (2014) works well for TBTF banks but is not possible for DFIs. It exploits the difference in treatment between shareholders and debt-holders in the event of a government bailout to estimate the value that debt-holders place on the sovereign guarantee. This calculation requires price information for Credit Default Swaps (a certain type of derivative contract) for the institution in question, and these do not exist for DFIs.
3. A Ratings-based approach. First suggested by Haldane (2010), this method exploits the fact than many ratings agencies give two scores for a financial institution – their overall score, and their ‘stand-alone’ rating, the second of which ignores the existence of an implicit or explicit sovereign guarantee. These two ratings can be used to assess how the guarantee affects an institution’s borrowing costs, by reference to bond yields across the ratings spectrum for financial institutions (Noss and Sowerbutts, 2012, use average yields from the Bank of America Merrill Lynch Sterling Corporates Financials Index at each rating). This difference in yield can then be scaled up according to an institution’s ratings-sensitive liabilities (identified from annual accounts data), to give a total figure for the value of the sovereign guarantee to the institution.
This third approach is conceptually straightforward, but requires good judgement – choosing appropriate bond yields to quantify the value of the guarantee, and judging which of an institutions liabilities are sensitive to their credit ratingxv. However, there are several examples of its application in the literature, and it is generally seen as an acceptable method of estimating the approximate value of a sovereign guarantee (IMF, 2014).
24
Box 4.1: Worked example of Ratings-based estimation of value of sovereign guarantee
Data item Source Example Value Long-term credit rating for example DFI
Ratings agency report Aa1
Stand-alone credit rating for example DFI
Ratings agency report A1
Average bond yield for Aa1-rated financials (b)
Bank of America Merrill Lynch Sterling Corporates Financials Index
4%
Average bond yield for A1 rated financials (c)
Bank of America Merrill Lynch Sterling Corporates Financials Index
5%
Estimated impact of sovereign guarantee on yields of DFI’s ratings-sensitive liabilities (d)
d = c – b 1%
DFI’s ratings-sensitive liabilities (e) DFI Annual accounts €61bnImpact of sovereign guarantee on DFI’s annual borrowing costs (f)
f = e x d €610m

However, a strong word of caution is required regarding this approach, because it moves away from a social opportunity-cost based valuation of subsidy. In other words, rather than putting a figure on the ‘next best alternative use’ of support by the government, it quantifies the value of support to the DFI. This is a key weakness.
In a social opportunity cost framework, we need to consider the ‘next best alternative use’ of the government resources used to provide the guarantee. Eliminating the guarantee would theoretically reduce the government’s own borrowing costs, and we could therefore plausibly suggest that the opportunity cost is represented by the reduction in government borrowing costs that would occur were the guarantee not to be provided. However, this is clearly very difficult to estimate, and it does not automatically follow that the amount by which the government’s own borrowing costs would be reduced will be equivalent to the benefit derived by the DFI from the guarantee.
This area thus warrants further investigation. Theoretically we might be able to make an argument for approximate equivalence of the benefit to the DFI and the cost to the taxpayer in this case, but this is likely to require somewhat heroic assumptions regarding the ability of ratings agencies, and the granularity of their ratings. It is beyond the scope of this paper.
Data RequirementsMultilateral DFIs are generally given both a general and ‘stand-alone’ rating by credit rating agencies, such that option 3 above is feasible in their case.
Many bilateral DFIs do not borrow from the capital markets and are therefore not receiving a subsidy through a sovereign guarantee. Partly as a result of the fact that they rarely access capital markets, many have either not received a credit rating (e.g. CDC Group), or have simply been given the credit rating of their host government. For example, according to Standard and Poor’s report on Dutch DFI FMO, “we equalize our ratings on FMO with those on The Netherlands, reflecting our opinion that there is an "almost certain" likelihood that the Dutch government would provide timely and sufficient extraordinary support to FMO in the event of financial distress” (S&P, 2014: 2).
For those who do access the capital markets (or can do so via a parent company), it may still be possible to use the ratings approach if an appropriate proxy organization can be found, and their ratings used instead – such as the parent company. For example, the German DFI, DEG does not receive its own ratings from credit ratings agencies, but its parent company KfW does receive both a general and ‘stand-alone’ rating. It may be that these ratings could be used as a proxy for DEG – subject to identifying if DEG possesses any ratings-sensitive liabilitiesxvi.
In general, it would be more accurate to use the ratings approach for a selection of DFIs and use these figures to give an approximation of the value of sovereign guarantees for other DFIs (scaling according to their ratings-sensitive assets for example), than to use a flawed methodology such as the general difference in bond yields for a DFI versus a commercial bank. However, as pointed out earlier, these valuations can not automatically be treated as estimating the social opportunity cost of providing government support.
25

(v) to (vii) Tax ExemptionsExtent of Exemptions for DFIsBilateral DFIs:In general, the structure of bilateral DFIs, which tend to be constituted as limited companies, means that they are unlikely to be eligible for any tax exemptions other than those specifically mentioned in legislation. In the UK for example, CDC Group’s exemption from corporation tax is explicitly provided for in the CDC Act of 1999. Their staff pay income tax, and they pay other business taxes on property, indirect taxes such as VAT, and so on. Furthermore, the accounts of DEG, IFU, Norfund and BIO show that they pay at least some corporation tax, whilst the legislation and accounts available indicate that they are not exempt from indirect taxes or income taxes (Bio, 2014; DEG, 2014; IFU ; Norfund, 2014).
W&V also provide a table showing the corporate tax exemption status for several DFIs (their table 5). We can be reasonably confident that bilateral DFIs do not receive other beneficial tax exemptions beyond their limited corporation tax privileges.
Multilateral DFIs:Multilateral DFIs, however, appear to benefit from much more wide-ranging tax exemptions.
In the case of the EIB, the organisation and its employees are covered by the Protocol of Privileges and Immunities of the European Communities (EIB, 2013: 39), which states:
“The Union, its assets, revenues and other property shall be exempt from all direct taxes. The governments of the Member States shall, wherever possible, take the appropriate measures to remit or refund the amount of indirect taxes or sales taxes included in the price of movable or immovable property, where the Union makes, for its official use, substantial purchases the price of which includes taxes of this kind. These provisions shall not be applied, however, so as to have the effect of distorting competition within the Union. No exemption shall be granted in respect of taxes and dues which amount merely to charges for public utility services.”
This means that the EIB is exempt from corporation tax and other business taxes (for example on business property). It also means that where possible EU member states must compensate the EIB for indirect or sales taxes on major purchases. However, it is unlikely that compensation for indirect tax bills takes place in reality. Only eight EU Member Statesxvii have systems for issuing VAT compensation or rebates for public bodies and five of these are narrowly defined, focused on either specific sectors (e.g. health) or local government (Jervulund et al, 2013). Furthermore, these countries do not include the location of the EIB’s main office (Luxembourg) and there is no evidence of compensation being received in the EIB’s accounts (EIB, 2014). This does not rule out the possibility of a subsidy related to indirect taxation, but it does indicate that although there is provision for such a subsidy to be received, it is probably not being taken advantage of in practice. Further clarification could potentially be achieved through an EU Freedom of Information request.
26

Finally, the Protocols mean that EIB employees are not subject to income tax in their country of residence, but instead pay income tax to the European Commission (EC) at a rate set down in European legislation. This could represent a cost (income tax foregone) to national governments. However, income tax paid directly to the EC from organizations such as the EIB, reduces the funding needed for the EU budget from member states. So whether this constitutes a subsidy or not depends on whether the tax rate payable to the EC is comparable to national income taxes and whether this leads to a comparable reduction in the funding a member state must provide to the EU budget. Given the complexity of calculating the latter, and the fact that the differences between the EIB income tax system and national income tax systems are likely to be marginal, we regard any subsidy via income tax for the EIB as of second-order concern.
Like the EIB, the IFC is exempt from all taxes, as covered by Article VI of the IFC Articles of Agreement (IFC, 2012), which states:
“The Corporation, its assets, property, income and its operations and transactions authorized by this Agreement, shall be immune from all taxation and from all customs duties. The Corporation shall also be immune from liability for the collection or payment of any tax or duty.” As with the EIB, however, there is little evidence that the IFC has claimed back any forms of indirect tax in practice.
In contrast though, for income tax the IFC seems to be a special case where some but not all employees are exempt from employment taxes (IFC, 2012):
“No tax shall be levied on in respect of salaries or emoluments paid by the Corporation to Directors, Alternates, officials or employees of the Corporation who are not local citizens, local subjects, or other local nationals”
This creates an additional level of complexity that must be addressed in calculating the foregone taxes for the IFC, which is discussed below.
In summary, tax exemptions for DFIs appear to be as follows:
Table 4.2: Tax Exemptions for DFIsTax Exemption: MDFIs: BDFIs:Income Taxes Dependent on institution NoIndirect Taxes Yes in theory, but
unclaimed in reality.No
Corporation Taxes Yes Yes with a few exceptionsxviii
MethodsCalculating the opportunity cost from foregone taxes is relatively simple. For taxes that are paid on an ongoing basis throughout the year, it is half the face value of the tax (to account for accumulation through the year) plus the social rate of return that could be earned with these
27

funds. This reflects the fact that had the government not given the DFI a tax exemption; they could have used that revenue to earn a social return in the year in question.
St = 0.5T x (1 + m)
Whereas for taxes that are paid at the end of the year, it is simply the face value of the tax.
St = T
Where:St = Subsidy to DFI from tax exemptionsT = Total foregone taxm = Social rate of return
However, assessing the amount of foregone tax is problematic. This is different for indirect, income and corporate taxes and so these are dealt with separately below.
(v) Indirect TaxesAs has been discussed there is no indication in the literature or accounts of bilateral DFIs to suggest that they are exempt from indirect taxes. Therefore there seems to be no foregone indirect tax to be calculated from bilateral DFIs.
Multilateral DFIs such as the IFC and EIB are exempt from indirect taxes. However, their exemption requires that they claim back any indirect taxes that they have paid. As this is not mentioned in their accounts or the wider literature, it is unlikely that it is taking place. Therefore again, there seems to be no foregone indirect tax to be calculated.
(vi) Income and Employment TaxesAs has been mentioned above, whilst bilateral DFIs are not exempt from income or employment tax, multilateral DFIs can be. The amount of foregone income and employment tax from multilateral DFIs such as the IFC can be calculated but it requires detailed information on staff levels and salaries.
For the IFC the situation is particularly complicated as local citizens do pay income taxes but non-citizens do not. The IFC takes this into account when setting salary levels, equating salaries on a net-of-tax basis for citizens and non-citizens (IFC, 2014b). Consequently, the only tax foregone is from non-citizen salaries, and the amount foregone per employee is equivalent to the difference between salaries at each employment level for citizens and non-citizens. Calculating the product of this and the number of non-citizens at each salary level would give total foregone taxes.
However, a breakdown of salaries according to citizens and non-citizens or the number of non-citizens at each employment level, are not publicly available. Instead the estimate below is
28

based on information available for the IFC and World Bank. It has been calculated based upon US federal income tax rates:
Table 4.3: Estimating income tax foregone from IFCTotal income tax if no exemptionsxix $81.0m Proportion of staff in head officexx 45%Proportion of locals in head officexxi 25%Proportion of tax exempt in head office 75%Foregone income tax from head office $27.3mProportion of staff in regional offices 55%Proportion of locals in regional officesxxii 85%Proportion of tax exempt in regional offices 15%Foregone income tax from regional offices $6.7m Total foregone income tax $34.0m
(vii) Corporate TaxesAt first glance, the subsidy provided through corporation tax exemptions, is simply the calculation of foregone corporation tax based on annual accounts dataxxiii. W&V use this calculation for the IFC, EBRD and CDC Group.
However, this calculation does not capture the impact of other subsidies on profit. For instance, an income tax exemption would reduce a DFI’s costs, boosting profits. And we have already valued this subsidy in the section above. If we use raw data for profits here then we will be double-counting this subsidy.
This problem can be overcome by using a measure similar to the concept of true profit. True profit is accounting profit minus profit gains (Nawaz, 2010). It is the profit that would be obtained in absence of profit gained through public funds. The profits gained through public funds are not the opportunity cost of public subsidy but the extent to which these benefits increase accounting profit. They are the face value of these benefits.
Thus the calculation for the foregone corporate tax is as below:
Fc = Pt x t
Where:Fc = Foregone corporation taxPt = True profitt = Foregone corporate tax rate
True profit is calculated by the following:
Pt = Pa - Sp
Where:
29

Pt = True profitPa = Accounting profitSp = Profit gaining subsidies
Profit gaining subsidies include the face value of all foregone interest payments, indirect taxes, income and employment taxes and sovereign guarantee gains. Foregone dividends are not included, because dividends are not tax-deductible.
The only additional data necessary for this calculation is the accounting profit, available from DFIs annual accounts and the foregone corporate tax rate, freely available for the country in which a DFI is registered. The rest of the data is derived from previous calculations for other subsidy channels.
It should also be noted that many DFIs will not be earning a profit once subsidies are taken into account (i.e. they are not earning a ‘true profit’) and therefore would not benefit from an additional subsidy via a corporation tax exemption (Yaron, 1992). However, as some DFIs do manage to turn a true profit, this subsidy must nevertheless be taken into account (Schreiner, 1997).
Other corporate taxes. Finally, it is worth highlighting that since MDFIs such as the IFC and EIB appear to be exempt from all taxes, except perhaps where these payments are charges linked with the provision of specific services (such as water, refuse collection etc) they will also benefit from exemptions to local taxes such as business property taxation. These can be important, for example, in the UK, business rates are levied at almost 50% of the rental value of business property (VAO, 2014).
However, the extent and type of business property taxation varies considerably from country to country (UN Habitat, 2013). Furthermore, as these taxes are local in nature, one business could be paying several different forms of property tax in different locations, complicating calculations. And these taxes are also not individually itemised in Annual Accounts, making it very difficult to assess how much a business is paying. This is an area that could be considered further, however, property taxes are likely to be of second-order consideration compared with sovereign guarantees and foregone dividends, for example.
(vi) Intangible SupportWe have already commented briefly on the different nature of intangible support compared with other forms of subsidy. The opportunity cost to taxpayers of intangible support from governments to DFIs is likely to be negligible, given that it consists of little more than providing a ‘seal of approval’ from host governments, access to privileged information or diplomatic support from shareholder governments. The cost of these activities to taxpayers is essentially just a function of civil servants’ timexxiv.
In contrast the benefit of intangible support to a DFI may well be substantial. One way to evaluate this benefit would be to compare the success rate of DFI client projects, with non-DFI
30

client projects of a similar risk, on the assumption that the main effect of intangible support is to increase the likelihood of a project’s success.
Specifically, consider a range of possible project xi to xj, with associated probability of success pi to pj. Intangible support for DFIs mean that when they take on a project, the probability of success increases by a factor y (constant across all projects). If we assume (conservatively) that the private sector and the DFIs choose projects that are on average, of equal risk, then any difference in the success of DFI and private sector projects is due to the factor y.
However, as already mentioned, this approach would value the subsidy according to the perspective of the DFI, rather than the taxpayer.
5. Subsidies direct from taxpayers to DFI’s clientsIn this section, we briefly consider the two types of subsidy provided directly from governments to DFI clients.
(i) Grant Co-FinancingTaxpayers provide subsidies directly to DFI clients through the co-financing of grants (V&W). As was noted in section 4, cash grants in the form of ODA are rarely directly controlled by DFIs. However, DFI clients may benefit from ODA directly from donor governments.
The extent to which DFI clients benefit from ODA directly is difficult to quantify, for two reasons. First, that available data does not show whether ODA is reaching a DFI client. Even the planned improvements to ODA reporting would not provide such detail (OECD, 2014b). Second, establishing whether a project is receiving ODA because it is a DFI client is hard to ascertain unless explicitly stipulated in ODA policy.
(ii) Intangible SupportAs with the intangible support to DFIs from taxpayers, the opportunity cost of intangible support from taxpayers to DFI clients is likely to be negligible. However, the benefits derived by DFI clients from this intangible support may well be substantial – see the preceding discussion in section 4(vi).
6. Subsides from DFIs to their ClientsAt the beginning of this section, it is important to return to our discussion of opportunity cost.
In sections 4 and 5, it is relatively clear that the appropriate way to value subsidies is according to their cost to the taxpayer, thus providing the ‘left-hand side’ of a cost benefit analysis. The figures produced can then be compared with the social benefits that DFIs provide, in order to assess whether they represent a good investment for taxpayers. Consideration of these social benefits is beyond the scope of this project, but this section treads close to the same territory as will become clear below.
31

As before, the key issue is deciding on an appropriate proxy for opportunity cost. This decision rests on the way in which we view DFIs, and the purpose we intend for the numbers. Broadly speaking, we have two options:
1. Consider the DFI to be a private sector entity, maximising their profits. In this case, the DFI’s ‘next-best alternative use’ of their funds is to earn a financial return similar to other financial institutions.
2. Consider the DFI to be an arm of government. In this case, the next best alternative use of a DFIs funds is to earn a social return.
The problem is that neither approach is entirely satisfactory. As the IFC themselves state, “An adequate financial return is… essential, [but the]… IFC also considers returns to society as a whole, including benefits and costs to other stakeholders” (IFC, 2014c: 1). In other words, most DFIs are mandated to pursue both social and financial returns.
If we take the first approach and treat the DFI as a commercial entity, then conceptually, we treat the choice the DFI faces as to either (i) ruthlessly pursue financial returns or (ii) to accept a lower rate of return (potentially in order to generate more social benefits). In this case, (i) becomes the opportunity cost, such that earning a return below opportunity cost (ii) means passing on a subsidy to a clientxxv.
This approach allows us to answer questions such as whether DFIs are acting as commercial banks, or whether they might be making an allowance for social returns by reducing their expectation of financial returns. These are useful questions to answer. However, this approach does not allow us to consider whether DFIs are delivering good value for taxpayer’s money.
If we take the second approach above and treat the DFI as an arm of government, then we treat the social rate of return as the opportunity cost, and compare this with the return earned by the DFI in their lending to the private sector. A subsidy is passed on when they lend at a rate below the social opportunity cost. The implication here is that non-monetary benefits must make up any difference between the social rate of return and the financial return if the investment is to represent good value for taxpayers.
Notice that under this approach, we have slipped into considering the benefits side of the cost-benefit equation. We are implicitly assuming that the benefit to taxpayers equals the financial return earned by DFIs plus any non-monetary benefits they generate. However, this is not necessarily true, because as we discuss in section 4, DFIs rarely if ever pass financial returns back to taxpayers. They normally pay no dividends to shareholder governments, and are often exempt from corporation tax. In this case, it is not clear that the benefits side of the cost benefit analysis should include financial returns earned by DFIs. And in any case, consideration of benefits is beyond the scope of this project.
Finally, there is a third option for valuing the subsidies passed on from DFIs to their clients, and this is from the client’s perspective. In this approach, we would compare the cost of DFI funding to the client with the relevant cost of private funding for the client. This third
32
approach does not value the subsidy from either the government or DFI’s perspective, but it is relevant to discussions of additionality, because it would give an insight into whether DFIs are funding projects that are not otherwise commercially viable. This also relates to the benefits side of the cost-benefit calculation and is therefore not within the scope of this project.
Methods and Data AvailabilityIn each of these cases we can take either a project-by-project or ‘overall DFI’ approach. The former requires DFI projects to be benchmarked against private sector-funded projects of similar risk, so as to compare the funding costs (W&V). This runs up against huge data challenges, because it is frequently very difficult to ascertain the true risk level of projects in order to benchmark them against each other. Furthermore, the interest rates charged by those financing these projects (DFI or private sector) are often not publicly available (W&V).
An ‘overall DFI’ approach is much simpler, and simply requires the comparison of the (expected) rate of return for the DFI in question with either the social rate of return, or a benchmark rate of return for commercial financial institutions (either banks, private equity or venture capital).
Notwithstanding the conceptual problems with approaches 1 and 2 above, they would be operationalised as follows.
Option 1: DFIs treated as commercial entity The subsidy from DFIs to their clients is given by the following equation:
S = A x (m – E(r))
Where:S = Subsidy from DFIsA = Capital Assets (i.e. retained earnings and equity investments)m = benchmark market Rate of ReturnE(r) = DFI’s Expected Return on Assets
Annual accounts offer us an obvious proxy for expected (i.e. risk-adjusted) returns, and this is the return on average capital. This is essentially the return achieved on all of a DFI’s outstanding projects (using the income data presented in their accounts). Since this takes into account the genuine success/failure rate of their projects (since write-downs are included in the income element of the accounts), it accounts for risk, providing an estimate of expected returns.
As a benchmark market rate of return, the expected return on equity for financial institutions in developed countries is generally held to be around a minimum of 12% (see for example Damodaran, 2013, or ABI, 2012). This is a relatively low proxy for those DFIs that are allowed to issue debt on financial markets, because the sovereign guarantee they enjoy would allow them to leverage their capital much more cheaply than a commercial bank, thus earning higher returns. On the other hand, it is probably a high benchmark for DFIs who are not permitted to
33

issue debt (such as CDC Group), and therefore cannot leverage at all. It is also worth noting that the expected return on private equity or venture capital – who invest in riskier projects – is generally far higher, often above 20%.
Overall, Table 6.1 clearly indicates that DFIs are not earning returns on capital in this range. Consequently on this measure, they would be seen as passing on a significant subsidy.
Table 6.1 Return on capital for selected DFIsDFI Return on Capitalxxvi
IFC 6.4%IFU 5.7%Norfund 4.7%CDC Group 4.4%
Option 2: DFIs treated as an arm of governmentUnder this approach we simply exchange the market rate of return in our formula for the social rate of return.
S = A x (m – E(r))
Where:S = Subsidy from DFIsA = Capital Assets (i.e. retained earnings and equity investments)m = Social Rate of ReturnE(r) = Expected Return on Assets
Table 6.1 shows that DFIs are typically earning financial returns in excess of the social rate of return (since typically government borrowing costs for shareholder governments are around 2.5% currently, IMF, 2014).
As previously discussed, there are conceptual problems with both approaches.
7. ConclusionIn this paper we have sought to advance our understanding of the subsidies that DFIs and their clients receive from taxpayers. We focus primarily on subsidies from taxpayers to DFIs, and set out a framework for combining estimates of subsidies provided through different channels, based on their social opportunity cost. This framework includes grants, subsidised loans and tax exemptions.
We also outline a possible method for estimating the value of sovereign guarantees extended to DFIs, but from the perspective of how much this is worth to a DFI, rather than how much it costs the taxpayer to provide. Further work is required to incorporate this into the same social opportunity cost framework as the other forms of subsidy.
34

Regarding intangible support from taxpayers to DFIs, we argue that the cost to taxpayers of providing this support is likely to be low, but the benefit to DFIs may be highly significant, and we sketch out one potential method for estimating the scale of this benefit.
Finally, we also touch on the conceptual difficulties inherent in attempting to assess how much of the subsidy DFIs receive from taxpayers is actually passed onto their clients. The key problem here is identifying the opportunity cost of these funds to the DFI. Again, further work is needed in this area.
35

References
ABI (2012) Investibility of UK Banks. Association of British Insurers, December 2012.
Belli, P., Anderson, J., Barnum, H., Dixon, J., & Tan, J. P. (1998) Handbook on economic analysis of investment operations. Washington, DC: World Bank Publications.
Benjamin, M .P.J r. (1994) Credit Schemes For Microenterprises: Motivation, Design, and Viability. Thesis (PhD), Georgetown University.
BIO (2014) BIO Financial Report 2013. [Online] Available from: http://www.bio-invest.be/en/component/downloads/downloads/105.html [Accessed 27/05/15]
Kingombe, C., Massa, I., & te Velde, D. W. (2011) Comparing Development Finance Institutions Literature Review. Report commissioned by DFID. London: ODI.
Copeland, T. E., Weston, J. F., & Shastri, K. (2005) Financial theory and corporate policy. 3rd Edition. London: Pearson.
CDC (2014) CDC Group PLC: Annual Accounts 2013. [Online] Available from: http://www.cdcgroup.com/Corporate-information/Published-Information/ [Accessed 1/06/15]
Damodaran, A. (2013) Valuing Financial Service Firms. Journal of Financial Perspectives, 1(1), 59-74.
DEG (2014) DEG Annual Report 2014. [Online] Available from: https://www.deginvest.de/International-financing/DEG/Download-Center/Jahresberichte/ [Accessed 27/05/14]
EIB (2013) The EIB Statute and other Treaty Provisions. [Online] Available from: http://www.eib.org/attachments/general/statute/eib_statute_2013_07_01_en.pdf [Accessed 27/05/15]
EIB (2014) EIB Financial Report 2013. [Online] Available from: http://www.eib.org/infocentre/publications/all/financial-report-2013.htm [Accessed 1/06/15]
Francisco, M. (2008) Measuring the performance and achievement of social objectives of development finance institutions. Policy Research Working Paper (No. 4506). Washington, DC: World Bank Publications.
GAO (1995) World Bank and IMF: Pay and Benefits Compared With Those of Other Organizations. US: General Accounting Office.
36

Gollier, C. (2011) Pricing the future: The economics of discounting and sustainable development. Princeton University Press.
Guardian (2012) UK sells share in emerging markets private equity group Actis. The Guardian 2nd May 2012. [Online] Available from: http://www.theguardian.com/global-development/2012/may/02/uk-sells-share-emerging-markets-actis [Accessed 27/05/15]
Haldane, A. (2010) The $100 billion dollar question. [Online] Comments given at the Institute of Refulation & Risk, Hong Kong, 30 March 2010. Available from: http://www.bis.org/review/r100406d.pdf [Accessed 27/05/15]
HMT (2011) The Green Book: Appraisal and Evaluation in Central Government. Treasury Guidance Note. London: TSO
Hoenig, T. (2014) TBTF Subsidy for Large Banks: Literature Review. Federal Deposit Insurance Corporation.
IFC (2011) IFC: Creating Opportunity Where It is Needed Most. [Online] Available from:http://siteresources.worldbank.org/CSO/Resources/CSO_Orientation_onIFC_byAaron.pdf [Accessed 27/5/15]
IFC (2012) Articles of Agreement: Article VI – Status, Immunities and Privileges. [Online] Available from: http://www.ifc.org/wps/wcm/connect/corp_ext_content/ifc_external_corporate_site/about+ifc/articles+of+agreement [Accessed 27/05/14]
IFC (2014a) Big Challenges, Big Solutions: IFC Financials and Projections 2014. Washington, DC: IFC.
IFC (2014b) IFC Annual Report 2014. Washington, DC: IFC.
IFC (2014c) IFC Projects: Benefits to society exceed those to financiers alone by over 50%, with total benefits exceeding costs by 88 cents per dollar invested. Washington, DC: Development Effectiveness Unit.
IFU (2014) IFU Annual Report 2014. [Online] Available from: http://www.ifu.dk/en/service/news-and-publications/publications/kif-annual-report-2014 [Accessed 27/05/14]
IMF (2014) Global Financial Stability Report: Moving from Liquidity- to Growth-Driven Markets. Washington, DC: IMF
37

IRS (2014) Tax Tables 2014. [Online] Available: http://www.irs.gov/pub/irs-pdf/i1040tt.pdf [accessed 1/6/15]
Jervulund, C., Okholm, H., Naess Smith, S., Jespersen, S., Kirk, J., Winiarczyk, M., Möller, A. and Mekonnen, D. (2013) VAT in the Public Sector and Exemptions in the Public Interest. Copenhagen: Copenhagen Economics
Katz, D. A., & Welch, H. G. (1993) Discounting in cost-effectiveness analysis of healthcare programmes. Pharmacoeconomics, 3(4), 276-285.
Moody (2013) Moody’s Affirms KfW IPEX’s Ratings. Global Credit Research, January 17th 2013. Accessible from: https://www.moodys.com/research/Moodys-affirms-KfW-IPEXs-Aa3P-1-ratings-outlook-remains-negative--PR_263913 [Accessed 1/06/15]
Nawaz, A. (2010) Performance of microfinance: the role of subsidies. Savings and Development, 97-138.
Norfund (2014) Norfund Annual Report 2014. [Online] Available from: http://www.norfund.no/norfund-annual-reports/category324.html [Accessed 27/05/15]
Noss, J., & Sowerbutts, R. (2012) The implicit subsidy of banks. Financial Stability Paper (No. 15). London: Bank of England.
Rosenberg, R., Christen, R. P. & Helms, B. (1997) Format For Appraisal of Micro-Finance Institutions. Washington, DC: Consultative Group to Assist the Poorest.
OECD (2014a) Including the cost of using private-sector instruments in ODA. Background Paper. DAC High Level Meeting 15-16 December 2014. OECD Conference Centre Paris.
OECD (2014b) Development Finance: Treatment of Market-Like Instruments in the Statistical Framework Measuring and Monitoring Development Finance. DAC Senior Level Meeting, 7-8 October 2014. OECD Conference Centre Paris
S&P (2014) Research Update: Dutch Development Finance Institution FMO. Ratings Direct, November 5, 2014. [Online] Available from: https://www.fmo.nl/ratings [Accessed 27/05/15]
Schreiner, M. J. (1997) A framework for the analysis of the performance and sustainability of subsidized microfinance organizations with application to Bancosol of Bolivia and Grameen Bank of Bangladesh. Thesis (Phd), Ohio State University.
Schreiner, M. (2003) A Cost Effectiveness Analysis of the Grameen Bank of Bangladesh. Development Policy Review, 21(3), 357-382.
Schreiner, M., & Yaron, J. (2001) Development finance institutions: Measuring their subsidy. Washington, DC: World Bank Publications.
38

UN Habitat (2013) Property Tax Regimes in Europe. Nairobi: UN Human Settlements Programme
VAO (2014) What does rateable value mean? Valuation Office Agency. [Online] Available: http://www.2010.voa.gov.uk/rli/ [Accessed 25/05/15]
Te Velde, D. W. (2011) The Role of Development Finance Institutions in Tackling Global Challenges. London: ODI
Te Velde, D. W., & Warner, M. (2007) The use of subsidies by Development Finance Institutions in the infrastructure sector. London: ODI.
Warusawitharana, M. (2014) The Social Discount Rate in Developing Countries. FEDS Notes. October 9th 2014. [Online] Available from: http://www.federalreserve.gov/econresdata/notes/feds-notes/2014/the-social-discount-rate-in-developing-countries-20141009.html [Accessed 2/06/15]
World Bank (2014) The World Bank Annual Report 2014. [Online] Available from: http://www.worldbank.org/en/about/annual-report [Accessed 25/05/15]
Yaron, J. (1992) Assessing Development Finance Institutions; A Public Interest Analysis (No. 174). Washington, DC: World Bank Publications.
39
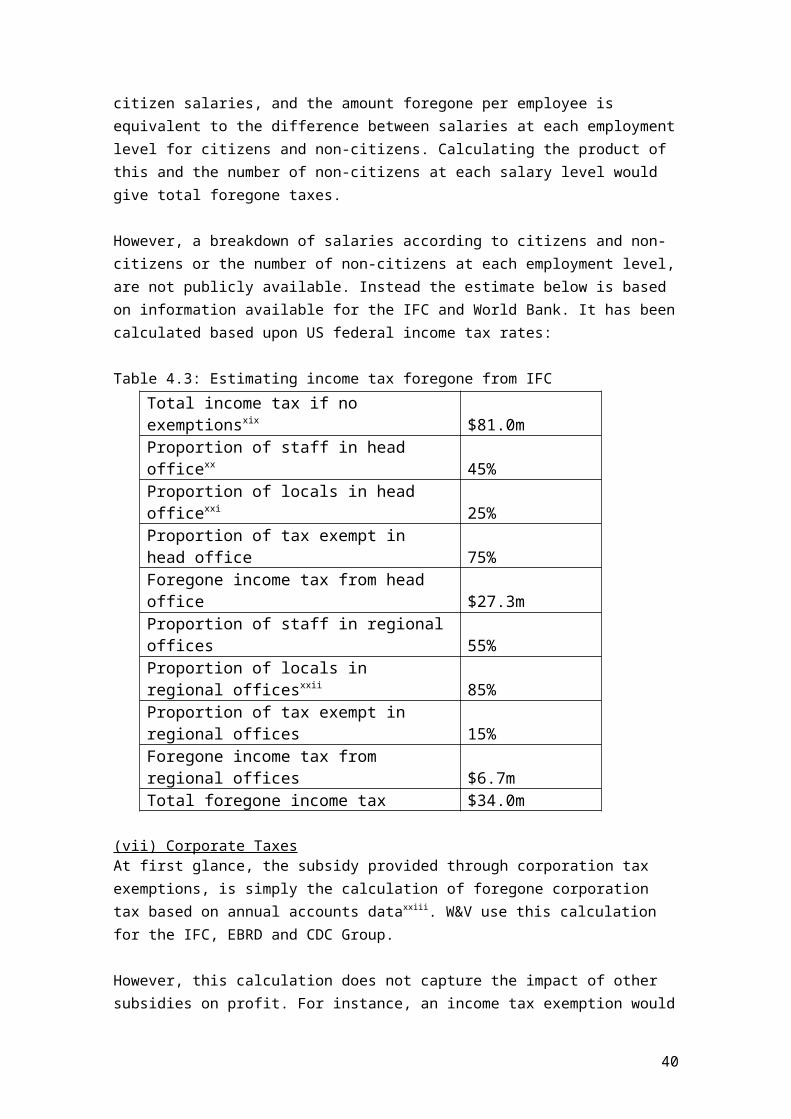
i http://www.oecd.org/officialdocuments/publicdisplaydocumentpdf/?cote=DCD/DAC%282015%2915&docLanguage=En ii http://www.oecd.org/officialdocuments/publicdisplaydocumentpdf/?cote=DCD/DAC/STAT/RD%282015%293/RD5&docLanguage=En iii http://www.oecd.org/dac/OECD%20DAC%20HLM%20Communique.pdf iv Richard is the Director of Foresight Economics, a consultancy specialising in economics, policy analysis and strategy. He previously worked as an Economic Advisor in the UK’s Government Economics Service, leading a team of economists working on international trade reform, the EU’s Common Agricultural Policy and the G20’s food price volatility workstream. v Ben will shortly be joining Elixirr Consulting Services, he is currently completing an MSc in Global Governance at University College London having previously worked for the Actuarial and Insurance Management Solutions Department practice at PricewaterhouseCoopers.vi And in particular, whether these benefits are additional, in the sense that they offer an improvement against a counter-factual of ‘no DFI lending’.vii Sometimes called the full economic cost, or economic opportunity cost. viii Some governments have recorded their equity stakes in DFIs (such as DEG) as ODA (Kingombe et al, 2011). However, the issue of equity is dealt with separately under section 4.iii.ix See recent discussions of the DAC (OECD, 2014a).x The risk of nonpayment is inconsequential since DFIs are themselves underwritten by governments, see section 4(iv).xi Some governments have recorded their equity stakes in DFIs (such as DEG) as ODA (Kingombe et al, 2011).xii It is worth noting that unlike public shareholders, dividends foregone to private shareholders do not constitute a subsidy to DFIs for two reasons. First, they do not constitute a public source of finance. Second, because it is assumed they trade their own resources (even below market value) according to their own benefit-cost analysis (Schreiner, 2003)xiii For a brief literature review, see Hoenig (2014).xiv W&V also suggest imputing a commitment fee for government’s callable capital as a way of measuring the sovereign guarantee, but this approach assumes that a government’s support for a DFI is limited to their existing capital commitments. In reality, the existence of a sovereign guarantee strongly implies that governments would go far beyond this if the DFI was in financial distress. xv Noss and Sowerbutts (2012) suggest that ratings sensitive liabilities include “the sum of deposits from other financial institutions, some financial liabilities designated at fair value (debt securities, deposits), and certain debt securities in issue (commercial paper, covered bonds, other debt securities and subordinated debt)”xvi See Moody’s ratings (Moody, 2013) xvii Austria, Denmark, Finland, France, Netherlands, Portugal, Sweden and the UK.xviii Such as FMO which is not exempt and DEG which is partially exempt.xix Based upon IFC’s number of staff (IFC, 2011); salary structure; employees at each grade (IFC, 2014b) and US Federal Income Tax rates (IRS, 2014).xx From IFC (2011)xxi Based on latest available breakdown of World Bank nationalities (GAO, 1995)xxii Based upon World Bank figures for locally employed in country offices (World Bank, 2014).xxiii Since corporation taxes are typically paid at the end of the year, or in quarterly instalments from six months after the year has started to six months after it finishes, we do not need to take the social rate of return into account.xxiv Unless we assume that these activities automatically disadvantage other projects, in which case this would need to be taken into account.xxv Note that the passing on of a subsidy does not in itself guarantee that the client is delivering a social return.xxvi From IFC (2014b), IFU (2014), Norfund (2014), CDC (2014).