Embed Size (px)
Citation preview
Hiring the Right Employees:
Trial Employment, Social Networks, and Post-Entry Outcomes
Adina D. SterlingStanford University
Graduate School of Business
June 8, 2015
Very Preliminary Draft: Do Not Cite or Circulate Without Permission
Hiring the Right Employees
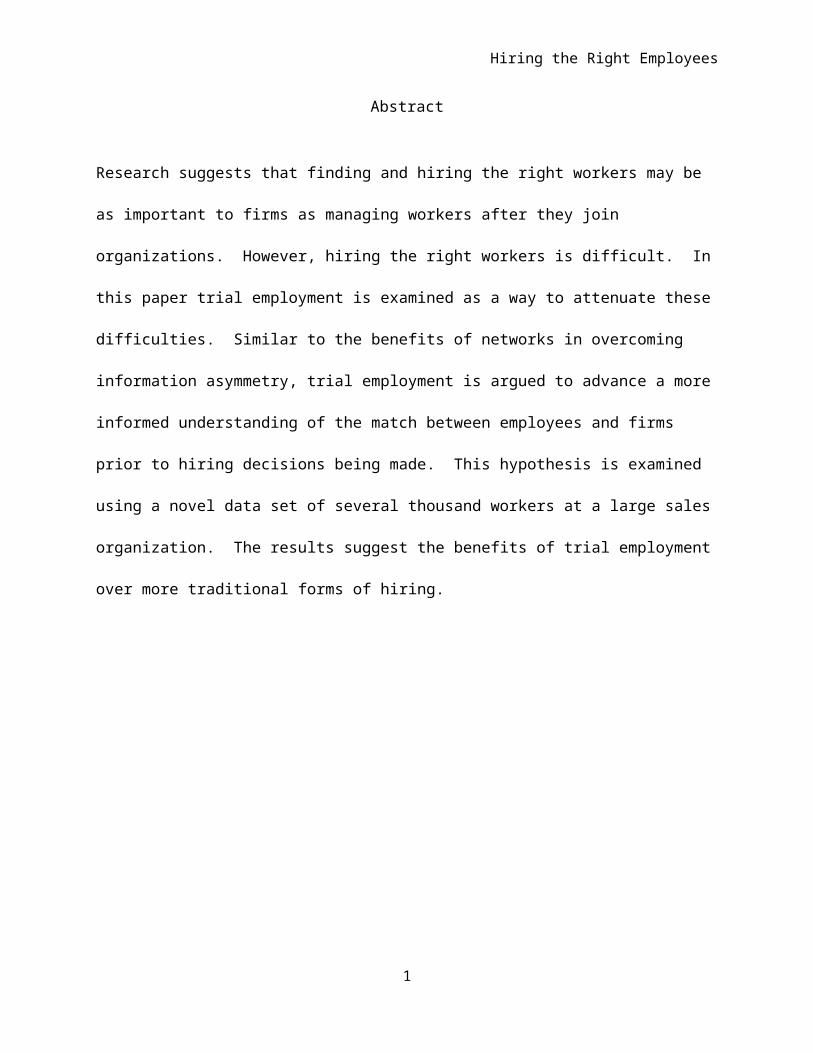
Abstract
Research suggests that finding and hiring the right workers may be as important to firms as
managing workers after they join organizations. However, hiring the right workers is difficult.
In this paper trial employment is examined as a way to attenuate these difficulties. Similar to
the benefits of networks in overcoming information asymmetry, trial employment is argued to
advance a more informed understanding of the match between employees and firms prior to
hiring decisions being made. This hypothesis is examined using a novel data set of several
thousand workers at a large sales organization. The results suggest the benefits of trial
employment over more traditional forms of hiring.
1

Hiring the Right Employees
Finding and hiring the right workers is one of the most fundamental challenges facing firms,
with some suggesting it may at least as important as the management of human capital with
incentives after employees are hired (Oyer and Schaefer, 2011). One primary line of research on
how firms find and hire the right workers focuses on the use of social networks to match job-
seekers to employers. Research suggests networks positively aid in employer-employee matching
due to both selection and treatment. Specifically, social networks may positively affect hiring
because employees search through their social contacts to find the ones with the right skills and
abilities, helping firms economize on the costs of selection (see Ioannides and Loury, 2004 for a
review). Additionally, social contacts may make new employees better through treatment effects –
that is, by providing informal mentoring and training to new recruits that reduces the cost of
training (Fernandez, Castilla, and Moore, 2000).
While the studies documenting the advantages of networks are prevalent, research has
begun to emerge suggesting the use of social networks in the hiring process may have its
drawbacks. For one, employees may look past the quality aspects of their social contacts when
making referrals, leading firms to hire the wrong individuals. For instance in a study of low-wage
earners, Pinkston (2012) found that it took over a year for the quality characteristics of those hired
through family and friends to be accurately revealed, and that those with friends and family were
over compensated by firms due to the positive endorsements of their social contacts. In a similar
vein, research suggests it may be necessary to couple the use of hiring through social networks with
incentives that are contingent on the performance of newly hired employees, which may reduce the
likelihood that employees endorse friends or other social contacts out of a sense of obligation
(Beaman and Magruder, 2012; Rees, 1970). In short, while studies point to benefits inherent in
networks during hiring, there is also an associated set of difficulties that social networks produce.
2
Hiring the Right Employees
Additionally, on the supply-side, the use of social networks to hire has a disparate impact on
social groups. Hiring through networks creates homophily in the employers’ consideration sets of
applicants (Fernandez and Fernandez-Mateo 2006; Reskin and Padavic, 1994; Korenman and
Turner, 1996; Rubineau and Fernandez 2013). Because networks coincide with demographic
characteristics such as race and gender, some demographic groups lack network-based access to
jobs. While some studies suggest there may be ways to circumvent these effects (Rubineau et. al,
2013) firms may continue with this established hiring practice, unaware of the disparate effects it
creates.
The above-mentioned difficulties associated with network-based hiring prompts important
questions. Namely, might it be possible for a practice to yield similar benefits as network-based
hiring without the use of preexisting relationships between employees and job-seekers? If the
answer to this question is yes it would be important for researchers to investigate such a practice.
Specifically, it would be useful to understand the positive and negative aspects of this practice
versus formal hiring methods, and how this hiring practice affects employees post-entry versus
those hired through social networks.
The purpose of this paper is to engage in this line of inquiry through an investigation of trial
employment. Trial employment refers to the period of time individuals are hired in an organization
before more permanent hiring decisions are made. At the end of the period organizations choose
whether or not to offer temporary workers more permanent positions. For example, organizations
may hire seasonal workers for a busy season and then provide a portion of these workers
permanent jobs.
Social-networks are argued to help overcome information asymmetry that results in
individuals being better matched to firms (Rees, 1970; Simon and Warner, 1992). In a similar vein,
trial employment may allow characteristics of job-seekers to be revealed prior to entry to aid in
employer-employee matching. When employers are able to observe individuals on a first-hand
3
Hiring the Right Employees
basis, this may provide firms with greater assurance about their hiring choices. As a result, trial
employment may positively influence post-entry outcomes such as employee turnover and
performance.
Although researchers have long suggested the ways in which employees join firms affects
post-entry outcomes, actual studies documenting the link between pre-entry hiring practices and
post-entry employee outcomes are rare (for an exception, see Castilla, 2005). This paper uses a
unique, novel data set from a large sales organization to investigate how pre-entry hiring practices
and post-entry hiring practices are related. The data includes information on thousands of
employees that worked from 2003-2013. A particularly appealing aspect of this data set is that
employees all started in the same entry-level position in which they were expected to perform the
same set of tasks. They were also expected to advance through the same set of roles within the
organization, and had the same pay within a level, incentive structure, and training during at the
firm.
The data employed here are unusually rich and well-suited to investigate the influence of
trial employment on employees’ outcomes after they are hired for full-time positions. Specifically,
the firm used interns as a source of labor at various points during the year. After the internship was
complete, the individuals had to re-apply to be selected for a full-time position within the firm. That
is, prior interns were placed in the same applicant pool as everyone else, and entered the same
entry-level position as those hired through on-campus recruiting, internet websites, job fairs, and
other formal and informal methods. This aspect of the firm’s hiring policy allows for an assessment
of individuals performance and post-entry outcomes in the same initial and subsequent jobs, even
though they were hired through different practices at the point-of-entry.
The rest of this paper proceeds as follows. Below literature on networks and hiring is
briefly reviewed to motivate the argument that an alternative type of hiring could afford firms the
same sorts of benefits as networks. Next, hypotheses are generated about how the performance and
4
Hiring the Right Employees
turnover of employees is influenced by trial employment. After laying out these arguments, a
description of the data and sample is provided, followed by an analysis of the influence of hiring
practices on post-entry performance and turnover outcomes. The paper concludes with a
discussion of the contributions of this study for an understanding of how employees are matched to
firms.
Social Networks and Employer-Employee Matching
The information problems facing employers and job-seekers in labor markets have long
been recognized by social scientists (Jovanovic, 1979; Granovetter, 1981). Bilateral information
asymmetry describes the dual-sided information problem facing firms and job-seekers. On the
supply-side of the market, applicants know much more about their skills and abilities than hiring
managers. On the demand-side of the labor market, managers within firms know much more about
the skills and behaviors needed for a job than applicants.
Social networks have long been considered useful in dealing with bilateral information
asymmetry. There are a few ways the benefits of networks may arise. First, social networks may
lessen information asymmetry by helping job-seekers gain a realistic job preview (Wanous, 1980).
That is, networks may channel finer-grained information to prospective employees that what is
available through formal job search methods that, in turn, allows individuals to opt into or out of
the application process (Granovetter, 1981). For example, an informant in Granovetter’s classic
study on job-finding in Newton, Massachusetts stated that a social contact whom works within a
firm offers a prospective employee “more than a simple job-description—he may also indicate if
prospective workmates are congenial, if the boss is neurotic, and if the company is moving forward
or stagnant” (1981:23). ,
Second, networks may be useful to firms on the demand-side of the market. When
employees know an applicant on a personal level this provides an additional form of assurance to
5
Hiring the Right Employees
an employer about the quality of a candidate. It is common practice for firms to encourage and
reward employees for referring their informal contacts to jobs (Fernandez and Weinberg, 1997;
Fernandez, Castilla, & Moore, 2000). The firm may benefit from their employees’ careful
assessment of their personal contacts; the employees do not want to damage their reputations by
referring poor performers (Rees, 1966, 1970). Also, the employee can vouch for a potential
recruit’s trustworthiness and provide his contact first-hand information on working for the
employer (Granovetter, 1974).
In sum, much theory and empirical evidence on the use of networks turns on the use of
networks to alleviate information asymmetry on the supply and demand-side of the market. Lastly,
an additional and related explanation for the use of networks centers on economizing on search
(Stigler, 1961). Formal methods of job-search including searching online for jobs can produce
hundreds or even thousands of applications within hours of a job being posted (Cappelli, 1999). As
a result, social networks are used as a way to economize on searching for the best applicants (Rees
and Shultz, 1970).
6
Hiring the Right Employees
Trial Employment and Employee-Matching
Trial employment refers to the period of time in which individuals are hired on a temporary
basis within the firm. Trial employment has increased markedly in the last few decades, and is
related to the growth of non-standard employment arrangements that have also increased (Davis-
Blake & Uzzi, 1993; Kalleberg, 2000). During post World War II industrialization almost all
employment structures were “standard work arrangements in which it was generally expected that
work was done full-time, would continue indefinitely, and was performed at the employer’s place of
business under the employer’s direction” (Kalleberg, 2000: 341). In the 1970s employment
structures changed in response to greater global competitive pressures and increased
environmental uncertainty (Cappelli et al., 1997; Cappelli, 1999). Organizations became much more
likely to use external employment structures such as temporary workers, contract workers, and
other market-mediated arrangements to lower costs and control labor.
Organizations may start workers in a market-mediated employment structure and then
internalize some of the workers (Abraham, 1990; Houseman, 2001; Kalleberg et al., 2003).
Research suggests this may occur for a few reasons. Organizations may select to internalize a
portion of external workers to increase administrative control (Williamson, 1991). Internalizing
workers may also improve an organization’s ability to incent workers to make firm-specific
investments in skills and training (Becker, 1962; Davis-Blake et al., 1993).
The period of time when workers are hired in market-mediated employment arrangements
serves as a type of trial employment in the organization. Employers are given the opportunity to
observe individuals performing tasks in the firm. Evidence indicates trial employment is a key
aspect of organizational selection (Christensen, 1995; Houseman, 2001). Surveys of employers have
found managers use temporary work assignments to screen potential long-term employees (Davis-
Blake & Broschak, 2000). In one study of large corporations, over half of the respondents to a
survey indicated that they used temporary assignments to screen prospective permanent workers
7
Hiring the Right Employees
(Christensen, 1995). In a similar vein, Houseman (2001) found that over one-fifth of the firms that
she surveyed used trial employment to select long-term employees.
Trial employment lowers information asymmetries between prospective workers and
employers in ways that are not possible in traditional hiring. In traditional hiring, even when
employers go through interviews, skill-based assessments and other intensive search techniques,
workers know more about their skills, abilities, and preferences than what they may reveal to
employers. The benefit of trial employment is the opportunity for individuals to be assessed in
ways not possible during the interview process. For example, a manager put it the following way.
“[During trial employment] I have the opportunity to observe this person over a period of time. I don't have just a half-hour snapshot to go by as in an interview. I can get to know the person, get to know their background a little bit, get to know what their behaviors are, what motivates them, what possible problem areas I might have with the individual.” (Houseman, Kalleberg, and Erickeck, 2003: 122)
The Effect of Trial Employment on Turnover
If trial employment lowers information asymmetries between prospective workers and
employers, then we may expect to see the effects of this practice on post-entry outcomes compared
to other types of hiring practices. First, trial employment may influence turnover. In prior studies,
turnover has been the most readily utilized indicator of the quality of an employer-employee match.
Research suggests that turnover is highest for individuals in the early stages of their organizational
tenure because jobs are experience goods (Jovanovich, 1979). That is, uncertainty about the fit of
an employee with an employer is highest when they first join an organization and as a result,
turnover is highest during this period. Over time as individuals learn about the norms, values, and
expectations in the organization, as well as the complementarity between a job and their own skills
and abilities, turnover decreases: those poorly matched leave the firm.
8

Hiring the Right Employees
If individuals have an opportunity to work in a firm prior to being hired for more
permanent positions, prospective employees are able to evaluate their match with the organization
prior to a more permanent hiring decision being made. Observing the behavior of current
employees including their norms, traditions, and task-related activities allows individuals to
determine whether or not they are well-matched. That is, gaining a first-hand perspective on the
organization’s employees, culture, and tasks provides trial employees the chance to select into or
out of more permanent jobs in an informed manner. The selection into and out of the more
permanent hiring process in an informed manner should influence individuals’ likelihood of staying
with the firm. Those with a trial employment experience in the organization that choose to pursue a
more permanent job are better suited for the job and organization and are less likely to depart.
This suggests the following:
Hypothesis 1a. Employees with a trial employment experience are less likely to exit firms than those without a trial employment experience.
Hypothesis 1b. Employees with a trial employment experience, when they exit firms, do so after working for a longer period of time than employees without a trial employment experience.
Departures from firms may come about for voluntary and involuntary reasons. That is,
individuals may decide after working for firms that they are better off somewhere else, and thus
search for a new job accordingly. They may also have other factors, such as family or medical
reasons, that lead them to voluntarily exit. Obviously, however, not all departures are voluntary.
When employees perform poorly or disobey established rules they may be more likely to be fired.
During trial employment information should also be gleaned which permits employers better select
and screen individuals for jobs. With this more stringent screen in place there may be more
involuntary turnover.
Hypothesis 2. Employees with a trial employment experience are less likely to involuntarily exit (be fired) than those without a trial employment experience.
9
Hiring the Right Employees
The Effect of Trial Employment on Performance
It is also likely that trial employment influences the post-entry performance of employees. A
common indicator of performance is the rate at which individuals are promoted in organizations. A
promotion suggests that individuals have attained the necessary requirements for moving up the
organizational hierarchy. Those that move faster tend to do so because they perform better than
their peers competing for jobs (Rosenbaum, 1981).
Using the same logic as stated above about the benefits of trial employment, it is likely that
employees hired through this channel perform better than those hired through more formal
methods. This leads to the following.
Hypothesis 3a. Employees hired after trial employment are more likely to be promoted than employees without a trial employment experience.
Hypothesis 3b. Employees hired through trial employment are promoted faster than employees without a trial employment experience.
The above hypotheses outline the main predictions of the study. In addition to investigating
trial employment this study also investigates prior theoretical predications about the impact of
networks on post-entry hiring outcomes. As stated, prior research suggests individuals hired
through networks may have an advantage for selection and treatment-related reasons. Networks
provide fine-grained information about the nature and characteristics of the job and organization,
so job-seekers should be able to select in and out of the hiring process in a more informed manner
(Granovetter, 1981). Additionally, job-seekers hired through networks may be less likely to
turnover because they feel social obligations to the individuals that hired them (Sterling, 2014), or
because they receive additional help and encouragement from their social contacts (Castilla, 2005).
That is, prior theorizing suggests networks may also have positive effects on reducing turnover and
improving performance. As a result, I also examine these hypotheses.
Hypothesis 4a. Employees hired through referrals are less likely to exit firms than employees not hired through referrals.
10
Hiring the Right Employees
Hypothesis 4b. Employees hired through referrals, when they exit firms, do so after working for a longer period of time than employees not hired through referrals.
Hypothesis 4c. Employees hired through referrals are less likely to involuntarily exit (be fired) than employees not hired through referrals.
Hypothesis 4d. Employees hired through referrals are more likely to be promoted than employees not hired through referrals.
Hypothesis 4e. Employees hired through referrals are promoted faster than employees not hired through referrals.
METHODS
Sample
This study compares the influence of trial employment on post-entry outcomes in the
context of internships. Internships are temporary work arrangements that employers use to
preview future employees (Baron & Kreps, 1999). That is, they serve as an extended “job interview”
whereby individuals are screened for their longer-term prospects in the organization (Beenen &
Rousseau, 2010). For example, Wertheim (1988: 24) notes, “The internship experience provides
the employer a significant value in recruiting. Interns who perform at the highest levels, fit into the
corporate culture and develop expertise in an area of the firms’ practice are ideal candidates for
permanent employment. The hiring procedures based upon actual performance are best as they use a
known quantity and eliminate the need for a recruiter’s guesswork based upon a resume and
interview.”
Internships are common in the U.S. and Japan, though they are present in labor markets in a
number of countries. Somewhat surprisingly, although many organizations, including more than
half of the Fortune 1000 have internship programs, the effects of internship on employees’ turnover
and performance have rarely been previously investigated.1
To conduct this study data was collected from personnel records of 15,348 employees that
worked for one of three sales regions in the firm. The personnel records contained an entry for
1 This is based on internship postings on Fortune 1000 company career websites in the spring of 2013.
11

Hiring the Right Employees
each time a recorded event –a promotion, termination, job-role change – occurred within the firm,
and contained over 41,000 entries for employees over a ten year period. The data was obtained
after providing and receiving a signed copy of a Non-Disclosure Agreement (NDA) from the
organization. For the purposes of confidentiality, no identifying information about the organization
is provided.
Dependent Variables
To assess these hypotheses several dependent variables were created. To assess turnover a
dichotomous variable was created, equal to 1 if individuals were terminated, else 0. A tenure
variable was created indicating the number of days individuals worked in the firm after they were
hired. Variables were also created to indicate promotions, and rates of promotion. The first
promotion (to rank=2), was indicated with a dichotomous variable, promotion, set equal to one if
there was a promotion while the individual was within the firm, else 0. A days to promotion
variable was also constructed to indicate the number of days from entry to an employee’s first
promotion.
Independent Variables
The two main independent variables, interns and referrals, equals 1 if the HR manager
responsible for tracking entry-level employees indicated that this was the means of hiring the
individuals into the firm, else 0. In this sample, 834 full-time employees had been interns
previously. In this time period 5,087 individuals were hired through employee referrals, and 9,430
individuals were hired through formal methods (i.e. the baseline), such as on-campus interviews,
job or career fairs, and online-applications. A few employees were listed as both interns and
referrals (i.e. three), and were removed from the analysis depending on the models being run.
12
Hiring the Right Employees
Control Variables
To isolate the hypothesized relationship between hiring practices and post-entry outcomes
several other factors that could lead to turnover or performance outcomes were controlled. The
human capital of the individuals, including their level of education, is included as a set of categorical
variables (high school grad, some college, technical school, two year degree, bachelors degree,
masters degree, doctorate, with not finished high school as the omitted category), according to the
information provided on an employee’s application which was verified by the employer.
Demographic variables are included that control for the gender and race of respondents, as well as
the year in which individuals entered the organization (i.e. with a cohort year variable). As
mentioned, the individuals were placed in offices performing the same types of tasks with the same
set of incentives throughout the firm, so no additional controls for incentive structure, pay, or other
variables are included in the models.
ANALYSES AND RESULTS
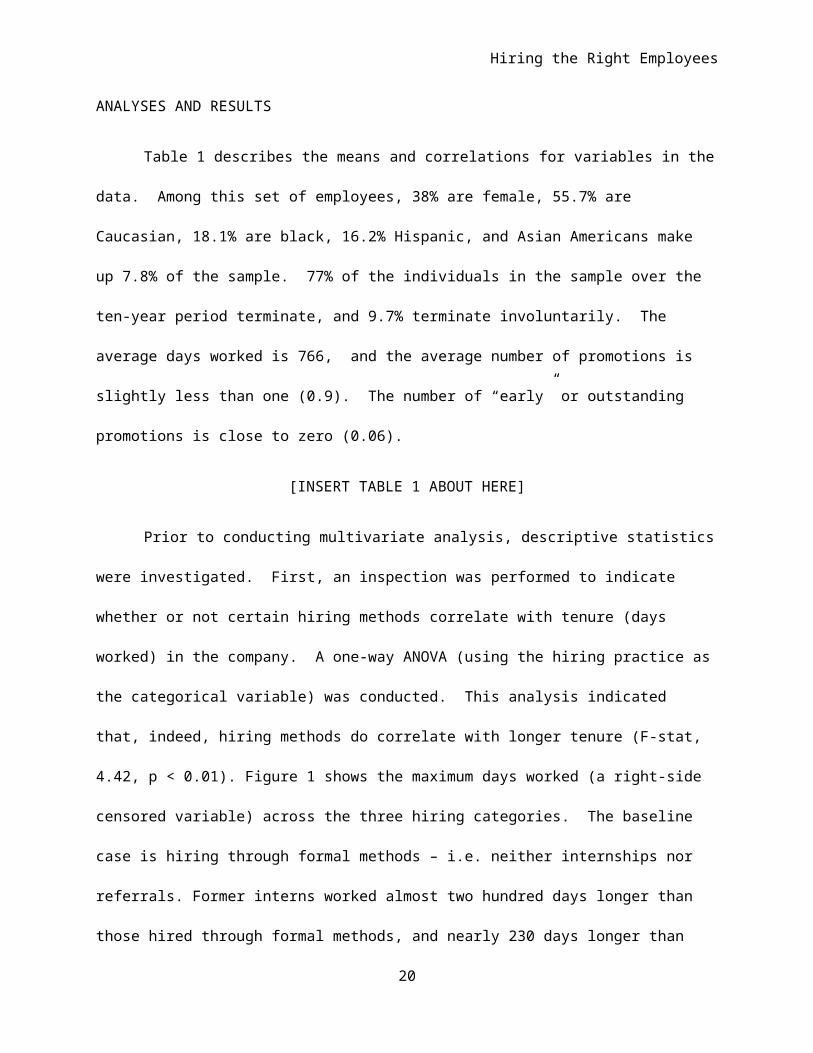
Table 1 describes the means and correlations for variables in the data. Among this set of
employees, 38% are female, 55.7% are Caucasian, 18.1% are black, 16.2% Hispanic, and Asian
Americans make up 7.8% of the sample. 77% of the individuals in the sample over the ten-year
period terminate, and 9.7% terminate involuntarily. The average days worked is 766, and the
average number of promotions is slightly less than one (0.9). The number of “early” or outstanding
promotions is close to zero (0.06).
[INSERT TABLE 1 ABOUT HERE]
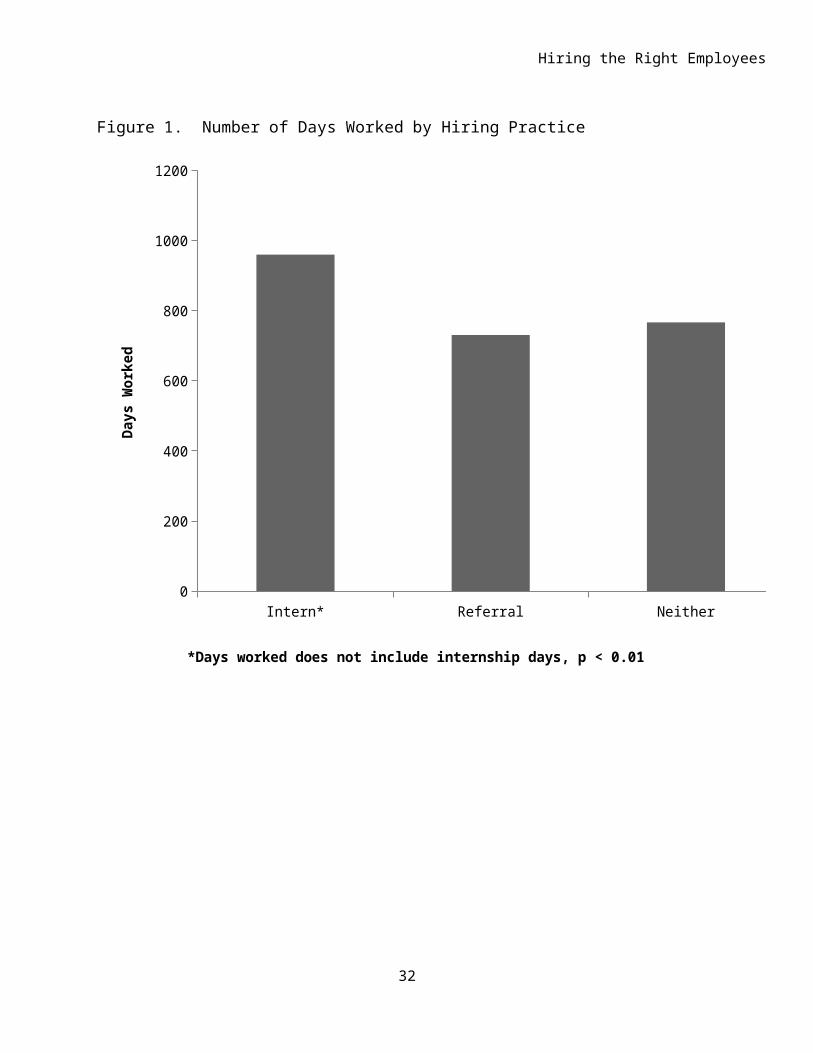
Prior to conducting multivariate analysis, descriptive statistics were investigated. First, an
inspection was performed to indicate whether or not certain hiring methods correlate with tenure
(days worked) in the company. A one-way ANOVA (using the hiring practice as the categorical
13

Hiring the Right Employees
variable) was conducted. This analysis indicated that, indeed, hiring methods do correlate with
longer tenure (F-stat, 4.42, p < 0.01). Figure 1 shows the maximum days worked (a right-side
censored variable) across the three hiring categories. The baseline case is hiring through formal
methods – i.e. neither internships nor referrals. Former interns worked almost two hundred days
longer than those hired through formal methods, and nearly 230 days longer than those hired
through referrals. Each difference is statistically significant (p < 0.01).
[INSERT FIGURE 1 ABOUT HERE]
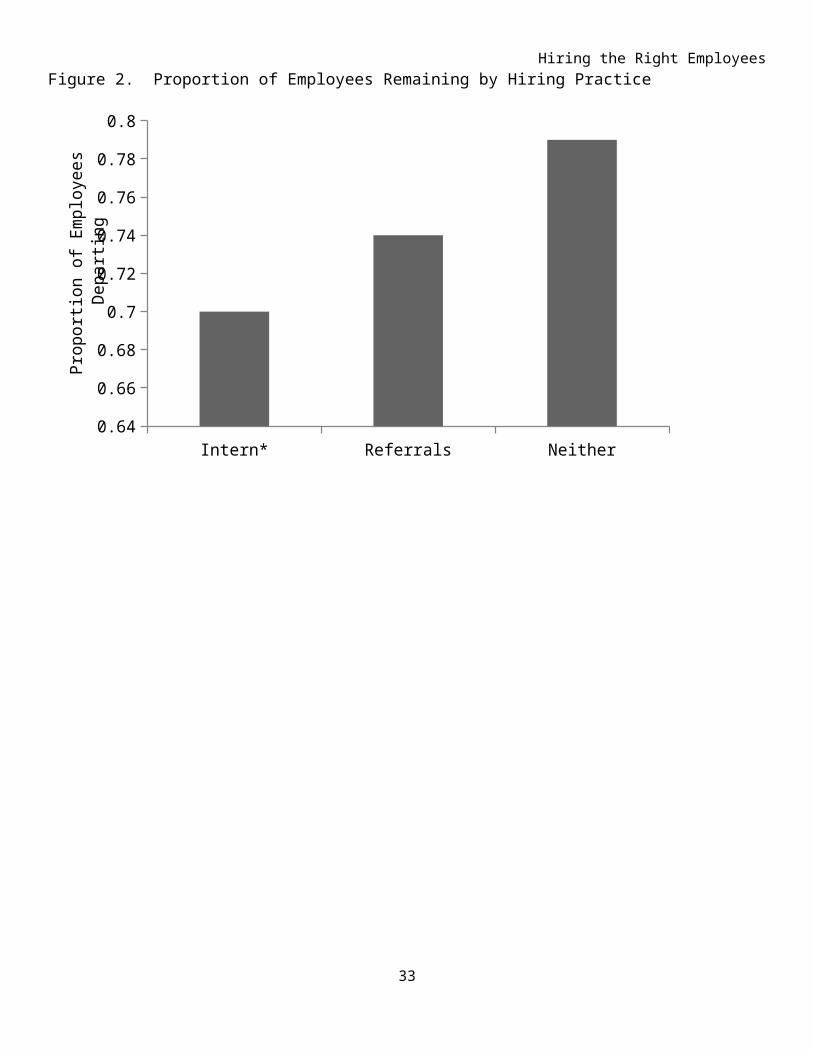
Analysis was also undertaken on employee departures. There were significant differences
in the proportions of total employee departures across groups (Chi-square 54.9, p < 0.01) as shown
in Figure 2 below. Further, there were statistically significant differences in the proportion of
involuntary terminations (Chi-square = 14.6, p < 0.01). There was not a statistically significant
difference in the involuntary terminations for interns versus employees hired through formal
methods. However, there was a higher level of involuntary turnover for those hired through
referrals (p < 0.01).
[INSERT FIGURE 2 ABOUT HERE]
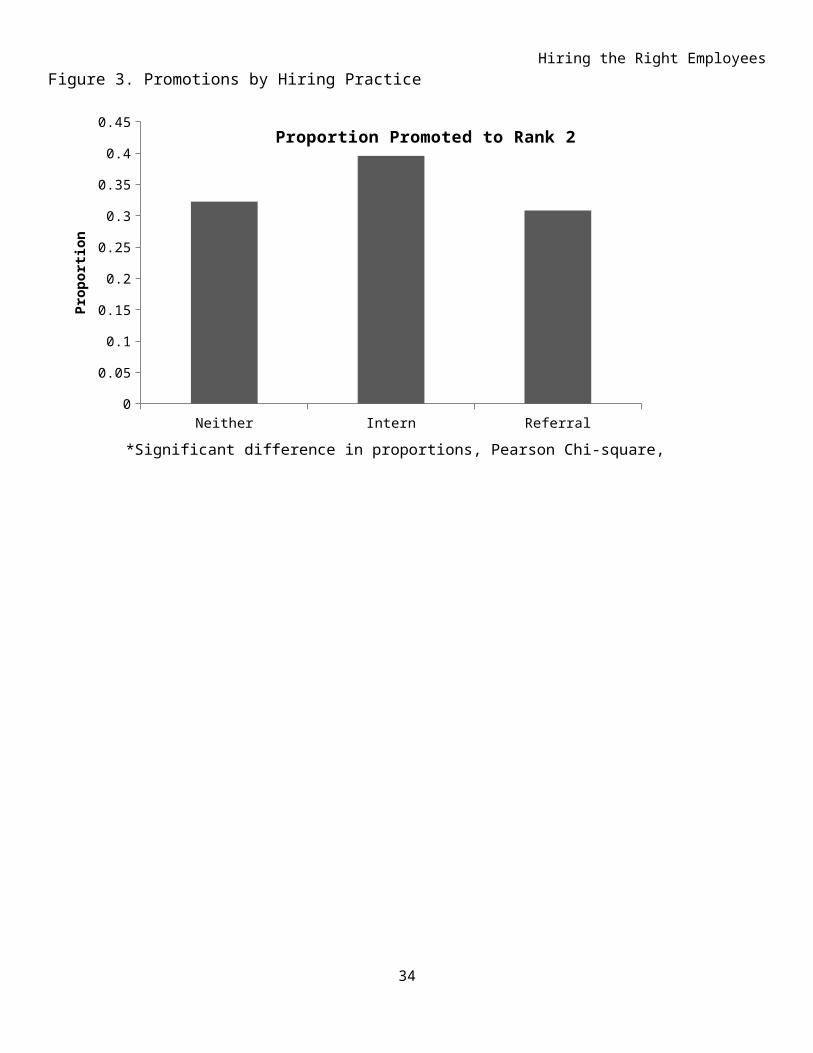
Analysis of promotions indicates that there were statistically significant differences in the
number of promotions across hiring practices (Chi-square 146.9, p < 0.01). Employees with
internships were significantly more likely to be promoted than the baseline or formal hiring
method case (t=8.2, p < 0.01). There was also a significant difference between the likelihood of
being promoted for the referral and baseline case, though the analysis indicates it works in the
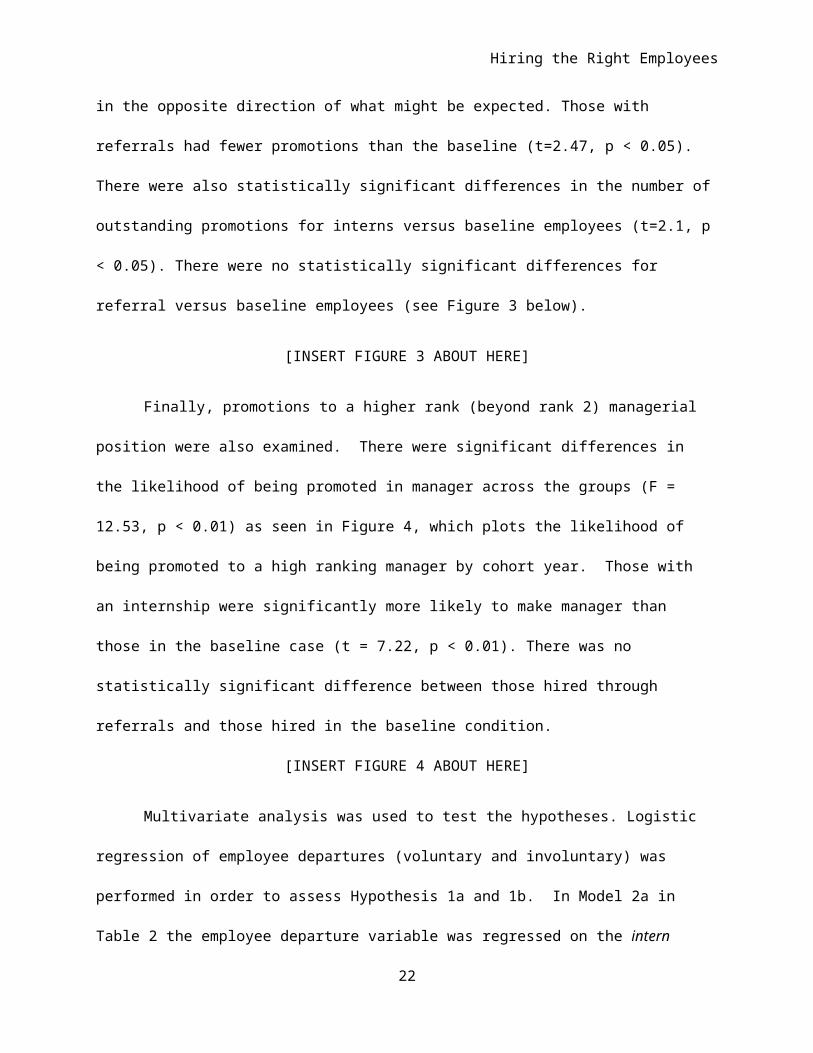
opposite direction of what might be expected. Those with referrals had fewer promotions than the
baseline (t=2.47, p < 0.05). There were also statistically significant differences in the number of
outstanding promotions for interns versus baseline employees (t=2.1, p < 0.05). There were no
statistically significant differences for referral versus baseline employees (see Figure 3 below).
14

Hiring the Right Employees
[INSERT FIGURE 3 ABOUT HERE]
Finally, promotions to a higher rank (beyond rank 2) managerial position were also
examined. There were significant differences in the likelihood of being promoted in manager
across the groups (F = 12.53, p < 0.01) as seen in Figure 4, which plots the likelihood of being
promoted to a high ranking manager by cohort year. Those with an internship were significantly
more likely to make manager than those in the baseline case (t = 7.22, p < 0.01). There was no
statistically significant difference between those hired through referrals and those hired in the
baseline condition.
[INSERT FIGURE 4 ABOUT HERE]
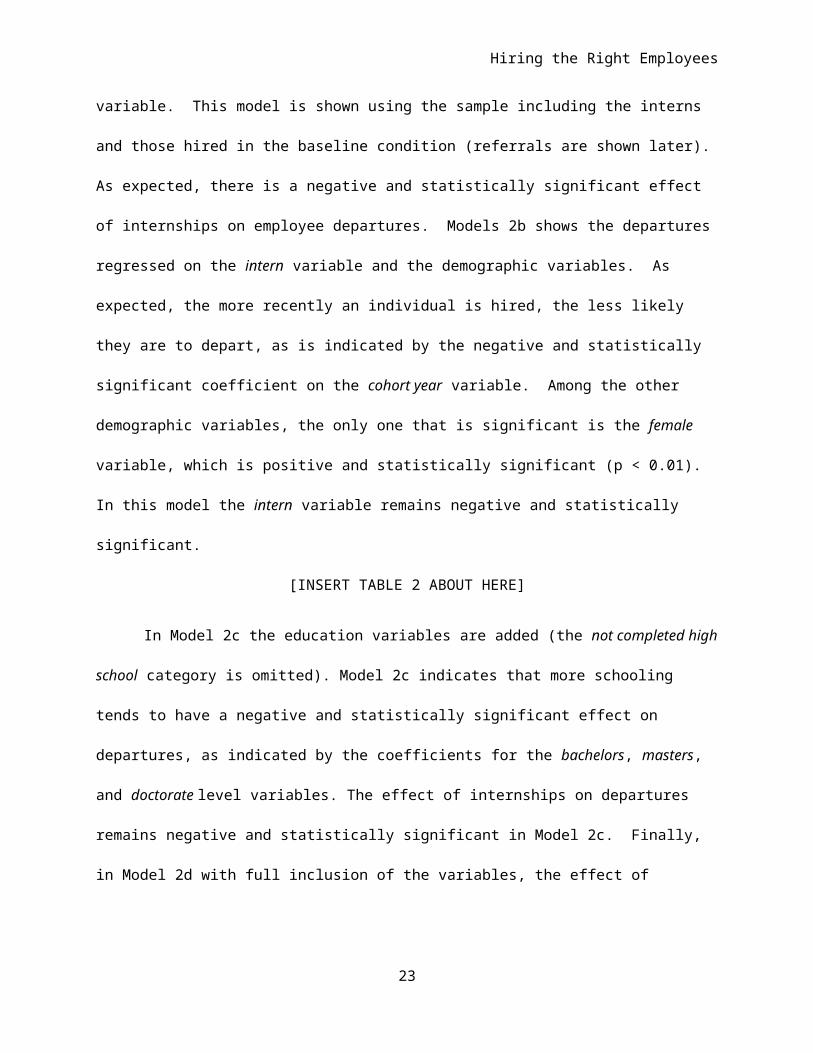
Multivariate analysis was used to test the hypotheses. Logistic regression of employee
departures (voluntary and involuntary) was performed in order to assess Hypothesis 1a and 1b. In
Model 2a in Table 2 the employee departure variable was regressed on the intern variable. This
model is shown using the sample including the interns and those hired in the baseline condition
(referrals are shown later). As expected, there is a negative and statistically significant effect of
internships on employee departures. Models 2b shows the departures regressed on the intern
variable and the demographic variables. As expected, the more recently an individual is hired, the
less likely they are to depart, as is indicated by the negative and statistically significant coefficient
on the cohort year variable. Among the other demographic variables, the only one that is significant
is the female variable, which is positive and statistically significant (p < 0.01). In this model the
intern variable remains negative and statistically significant.
[INSERT TABLE 2 ABOUT HERE]
In Model 2c the education variables are added (the not completed high school category is
omitted). Model 2c indicates that more schooling tends to have a negative and statistically
significant effect on departures, as indicated by the coefficients for the bachelors, masters, and
15
Hiring the Right Employees
doctorate level variables. The effect of internships on departures remains negative and statistically
significant in Model 2c. Finally, in Model 2d with full inclusion of the variables, the effect of
internships on departures is negative and statistically significant (p < 0.01), suggesting hypothesis
1a is supported.
Next, the tenure of employees in the firm (measured as days worked) was regressed on the
same set of variables. As Model 3a in Table 3 indicates, there is a positive and statistically
significant effect of having had an internship on tenure. Model 3b indicates that the female variable
and cohort year have a negative effect on tenure, while Model 3c indicates that most of the
educational categories have positive and significant effects (again, the omitted category is not
finishing high school). Model 3d indicates that internships have a positive and statistically
significant effect on days worked at the firm (p < 0.01). Hypothesis 1b is supported.
[INSERT TABLE 3 ABOUT HERE]
In Table 4, the influence of being hired after an internship and being fired (involuntary
terminated) is examined. Logistic regression shown in Models 4a-4d suggests that there is not a
statistically significant effect of being hired after an internship on being involuntarily fired from the
firm. Hypothesis 2 is not supported.
[INSERT TABLE 4 ABOUT HERE]
Table 5 examines two types of promotions: normal and outstanding, or early promotions.
Using negative binomial regression, the influence of internships on promotions, without inclusion
of the other variables in the model, is shown in Model 5a and 5f for normal and outstanding
promotions, respectively. These models suggest that being hired after an internship has a positive
and statistically significant effect on getting promoted. Including the full set of variables in Models
5d and 5h do not influence this effect. There is a positive and statistically significant effect of being
an intern and getting promoted (p < 0.01), indicating that hypothesis 3a is supported.
16
Hiring the Right Employees
[INSERT TABLE 5 ABOUT HERE]
Similar results are found in Table 6, which models, with ordinary least squares regression,
the effect of being hired through an internship on days to the first promotion. There is a negative
and statistically significant effect of being hired after an internship on the number of days to
promotion for Models 6a-6d, indicating support for hypothesis 3b.
[INSERT TABLE 6 ABOUT HERE]
The effects above suggest there are benefits to hiring through trial employment versus
formal hiring methods. Next, attention is turned to the influence of referrals. Models of the
influence of referrals versus the baseline condition are shown in Tables 7-10. Models 7a and 7c in
Table 7 suggest that referrals have a negative and statistically significant effect on departures, but
the effects do not hold in Model 7d with inclusion of the full set of variables. As a result, hypothesis
4a is not supported.
[INSERT TABLE 7 ABOUT HERE]
In Table 8, tenure (in days) is regressed on the referral variable. In Model 8a it appears
there is a negative and statistically significant effect of being hired through referrals on tenure.
However, this effect does not hold in Models 8b and 8d. Hypothesis 4b predicted being hired
through referrals would have a positive and statistically significant effect on tenure, and therefore
is not supported.
[INSERT TABLE 8 ABOUT HERE]
Table 9 shows logistic regression models of involuntary terminations on referrals.
Somewhat surprisingly, referrals have a positive and statistically significant effect of being
involuntarily terminated in all models (p < 0.01), indicating that hypothesis 4c is not supported.
[INSERT TABLE 9 ABOUT HERE]
17
Hiring the Right Employees
Table 10 shows models of promotions, both normal and outstanding. Referrals do not seem
to have a positive effect for promotions of either type. Therefore, hypotheses 4d and 4e are not
supported.
[INSERT TABLE 10 ABOUT HERE]
Concluding Remarks
Several decades of research on employer-employee matching has revealed the difficulties
firms face in finding and hiring the right workers. Much of the research on overcoming difficulties
due to information asymmetry in labor markets has focused on the use of networks. This study is
the first \ to compare a broader slate of hiring practices – networks, trial employment, and formal
methods of hiring – on the post-entry retention and performance of employees.
This paper examines one core hypothesis – i.e. that trial employment positively affects
employees’ post-entry outcomes. The results suggest that this, indeed, is the case. Individuals hired
after internships were found to be less likely to depart firms and had longer tenure than those hired
through formal methods. Individuals hired after internships were also more likely to be promoted,
and were promoted earlier, than those hired through formal methods. Somewhat surprisingly,
however, the positive effects of referrals did not surface. Rather, consistent with some other
studies, there was some evidence that referrals had some negative effects on post-entry outcomes.
This study makes an important contribution to literature on employer-employee matching
by suggesting that there may be ways to garner the benefits of networks outside the purview of
social relationships. Future work (planned for this study) involves inspecting the mechanisms
leading to the positive effects uncovered here. Also, work will explore how selection varies for
those with internships versus those hired through other methods.
18
Hiring the Right Employees
REFERENCES
Abraham, K. G. 1990. Restructuring the Employment Relationship: The Growth of Market-Mediated Work Arrangements. In K. G. Abraham & R. B. McKersie (Eds.), New Developments in the Labor Market: Toward a New Institutional Paradigm. Cambridge, Mass.: MIT Press.
Baron, J. N. & Kreps, D. M. 1999. Strategic human resources: Frameworks for general managers. New York: John Wiley & Sons.
Beaman, L., and J. Magruder. 2012. Who gets the job referral? Evidence from a social networks experiment. The American Economic Review, 102(7): 3574-3593.
Beenen, G. & Rousseau, D. M. 2010. Getting the most from MBA internships: Promoting intern learning and job acceptance. Human Resource Management, 1: 3-22.
Cappelli, P. 1999. The new deal at work: managing the market-driven workforce. Boston: Harvard Business School Press.
Christensen, K. 1995. Contingent work arrangements in family-sensitive corporations. Center on Work and Family Policy Paper Series.
Broschak, J. P., & Davis-Blake, A. 2006. Mixing standard work and nonstandard deals: The consequences of heterogeneity in employment arrangements. Academy of Management Journal, 49(2): 371-393.
Cappelli, P. 1999. The new deal at work: managing the market-driven workforce. Boston: Harvard Business School Press.
Cappelli, P., Bassi, L., Katz, H., Knoke, D., Osterman, P., & Useem, M. 1997. Change at Work. New York: Oxford University Press.
Castilla, E. J. 2005. Social Networks and Employee Performance in a Call Center. American Journal of Sociology, 110(5): 1243-1283.
Davis-Blake, A. & Uzzi, B. 1993. Determinants of Employment Externalization: A Study of Temporary Workers and Independent Contractors. Administrative Science Quarterly, 38(2): 195-223.
Fernandez, R. M., Castilla, E. J., & Moore, P. 2000. Social Capital at Work: Networks and Employment at a Phone Center. American Journal of Sociology, 105(5): 1288-1356.
Fernandez, R. M., & Greenberg, J. 2013. Race, Network Hiring, and Statistical Discrimination.Research in the Sociology of Work, 24: 81-102.
Fernandez, R. M., & Fernandez-Mateo, I. 2006. Networks, Race, and Hiring. AmericanSociological Review, 71: 42-71.
Granovetter, M. S. 1974. Getting a Job (2nd ed.). Chicago: University of Chicago Press.
Granovetter, M. S. 1981. Toward a sociological theory of income difference. In I. Berg (Ed.),Sociological Perspectives on Labor Markets: 11-47. New York: Academic Press.
19
Hiring the Right Employees
Houseman, S. N. 2001. Why employers use flexible staffing arrangements: Evidence from an establishment survey. Industrial and Labor Relations Review, 55(1): 149-170.
Jovanovic, B. 1979. Firm-specific capital and turnover. The Journal of Political Economy: 1246-1260.
Kalleberg, A. L. 2000. Nonstandard employment relations: Part-time, temporary and contract work. Annual Review of Sociology, 26: 341-365.
Kalleberg, A. L., Reynolds, J., & Marsden, P. V. 2003. Externalizing employment: flexible staffing arrangements in US organizations. Social Science Research, 32: 525-552.
Korenman, S., & Turner, S. C. 1996. Employment contracts and minority-white wage differences. Industrial Relations, 35: 106-122.
Pinkston, Joshua C. 2012. How Much Do Employers Learn from Referrals? Industrial Relations, 51(2):317-41.
Rees, A. 1966. Information networks in labor markets. American Economic Review: 559-566.
Rees, A., & Shultz, G. 1970. Workers and Wages in an Urban Labor Market. Chicago: University of Chicago Press.
Reskin, B. F., & Padavic, I. 1994. Men and women at work: Thousand Oaks, CA: Pine ForgePress.
Rosenbaum, J. 1981. Careers in a corporate hierarchy. Research in social stratification and mobility.
Rubineau, B., & Fernandez, R. 2013. Missing Links: Referrer Behavior and Job Segregation.Management Science, 59(11): 2470-2489.
Sterling, A. 2014. Friendships and Search Behavior in Labor Markets. Management Science. In Press.
Wanous, J. P. 1980. Organizational Entry: Recruitment Selection and Socialization of Newcomers. Reading, Mass.: Addison-Wesley.
Williamson, O. E. 1991. Strategizing, economizing, and economic organization. Strategic Management Journal, 12: 75-94
20

Hiring the Right Employees
Figure 1. Number of Days Worked by Hiring Practice
Intern* Referral Neither0
200
400
600
800
1000
1200
*Days worked does not include internship days, p < 0.01
Day
s W
orke
d
21
Hiring the Right EmployeesFigure 2. Proportion of Employees Remaining by Hiring Practice
Intern* Referrals Neither0.64
0.66
0.68
0.7
0.72
0.74
0.76
0.78
0.8
Prop
orti
on o
f Em
ploy
ees
Dep
arti
ng
22
Hiring the Right EmployeesFigure 3. Promotions by Hiring Practice
Neither Intern Referral0
0.05
0.1
0.15
0.2
0.25
0.3
0.35
0.4
0.45Proportion Promoted to Rank 2
Pro
por
tion
*Significant difference in proportions, Pearson Chi-square, p < 0.001
23
Hiring the Right EmployeesFigure 4. Proportion Promoted to High Ranking Manager by Hiring Practice
2003 2004 2005 2006 2007 2008 20090.00
0.05
0.10
0.15
0.20
0.25
0.30
0.35
ReferralInternNeither
Cohort Year
Prop
orti
on
24
Hiring the Right EmployeesTable 1. Means and Bivariate Correlations
Mean 1 2 3 4 5 6 7 8 9 10 11 12 13 14 15 16 17 18 19 20 211. No. Promotions 0.9040 12. No. Promotions (Outstanding) 0.0683 0.2686* 13. Terminated 0.7671 -0.2116* -0.0920* 14. Days Worked 766 0.7114* 0.1871* -0.2705* 15. Former Intern 0.0813 0.0809* 0.0207* -0.0549* 0.0695* 16. Employee Referral 0.3504 -0.0205* -0.0127 -0.0490* -0.0237* 0.5773* 17. Not Highschool Grad 0.0006 -0.0045 -0.005 -0.0121 -0.0165* 0.0045 -0.0111 18. High School Grad 0.0062 -0.0175* -0.0112 0.014 0.003 0.0876* 0.0093 -0.0019 19. Some College 0.0491 0.0178* -0.014 0.0304* 0.0211* 0.6612* 0.0548* -0.0055 -0.0179* 110. Technical School 0.0006 -0.0087 -0.005 -0.0058 0.0108 -0.0066 0.0049 -0.0006 -0.0019 -0.0055 111. Two Year Degree 0.0194 -0.0002 -0.0146 0.0360* 0.0002 0.0651* 0.0534* -0.0034 -0.0111 -0.0319* -0.0034 112. Bachelors Degree 0.8892 -0.0067 0.0144 -0.0118 -0.0184* -0.5166* -0.0531* -0.0686* -0.2235* -0.6438* -0.0686* -0.3979* 113. Some Grad School 0.0104 0.0209* 0.0177* -0.0730* 0.0193* -0.0049 0.0039 -0.0025 -0.0081 -0.0233* -0.0025 -0.0144 -0.2898* 114. Masters Degree 0.0189 0.0056 -0.0012 -0.0277* 0.0178* -0.0257* -0.0047 -0.0034 -0.011 -0.0315* -0.0034 -0.0195* -0.3931* -0.0142 115. Doctorate 0.0005 -0.0028 -0.0047 -0.0077 0.0128 -0.0051 0.0135 -0.0006 -0.0018 -0.0052 -0.0006 -0.0032 -0.0647* -0.0023 -0.0032 116. Female 0.3835 -0.0395* 0.0065 0.0278* -0.0277* -0.0181 -0.0377* 0.003 -0.0195* -0.0311* -0.008 -0.0164* 0.0262* 0.004 0.0175* -0.0063 117. White 0.5569 0.0434* -0.0180* 0.0163* 0.0223* -0.0339* -0.0209* -0.0001 0.0018 -0.0400* -0.0001 -0.0366* 0.0708* -0.0253* -0.0467* -0.0141 -0.0443* 118. Black 0.1809 -0.0663* -0.0343* -0.0021 -0.0199* 0.0295* 0.0408* -0.0114 0.0104 0.0200* 0.0026 0.0200* -0.0670* 0.0438* 0.0628* 0.0189* 0.0581* -0.5270* 119. Hispanic 0.1628 0.0151 0.0145 -0.0084 0.01 0.0226* 0.0085 -0.0034 0.0057 0.0394* -0.0034 0.0508* -0.0501* 0.0002 0.001 0.0054 -0.0168* -0.4945* -0.2073* 120. Asian 0.0779 0.0101 0.0557* 0.0319* -0.0025 -0.0024 -0.0453* 0.0231* -0.0198* 0.0003 0.003 -0.0197* 0.0190* -0.0153 -0.0046 -0.0066 0.0102 -0.3259* -0.1366* -0.1282* 121. Cohort Year 2007 -0.2237* -0.0326* -0.5019* -0.2912* 0.0211* 0.0853* 0.0222* -0.0081 -0.0415* -0.0056 -0.0391* 0.0268* 0.0724* 0.0280* -0.0049 0.0033 -0.0312* 0.0229* -0.0013 -0.0536* 1
*p < 0.05
25
Hiring the Right EmployeesTable 2. Logistic Regression Models of Employee Departure (Interns)
Model 2a Model 2b Model 2c Model 2dIntern -0.44 ** -0.49 ** -1.09 ** -1.1 **
(0.08) (0.10) (0.12) (0.15)Female 0.2 ** 0.21 **
(0.06) (0.06)White 0.04 0.04
(0.16) (0.16)Black 0.01 0.01
(0.17) (0.17)Hispanic -0.02 -0.03
(0.17) (0.17)Asian American 0.13 0.13
(0.19) (0.19)Cohort Year -0.47 ** -0.46 **
(0.01) (0.01)High School -1.008 -0.309
(0.68) (0.55)Some College -0.693 -0.137
(0.60) (0.46)Technical School -1.738 -1.311
(1.26) (0.87)Two Year Degree -1.200 -0.691
(0.63) (0.51)Bachelors Degree -1.82 ** -1.22 **
(0.58) (0.44)Some Grad School -3.12 ** -1.96 **
(0.62) (0.51)Masters -2.23 ** -1.36 **
(0.60) (0.48)Doctorate -3.82 ** -3.44 **
(1.36) (1.21)Constant 1.3 ** 941.3 ** 3.12 ** 933.8 **
(0.03) (23.19) (0.58) (23.29)N 10262 10262 10262 10262Robust standard errors in parentheses* p<0.05, **p < 0.01
26
Hiring the Right EmployeesTable 3. OLS Regression of Days Worked in Firm (Interns)
Model 3a Model 3b Model 3c Model 3dIntern 192.30 ** 208.10 ** 338.60 ** 387.3
(29.45) (27.71) (42.99) (39.61)Female -38.15 ** -42.19
(14.54) (14.45)White -34.32 -31.92
(39.92) (39.88)Black -65.24 -64.18
(42.02) (42.09)Hispanic -10.03 -6.68
(42.65) (42.62)Asian American -66.35 -66.76
(46.98) (46.83)Cohort Year -73.95 ** -76.88
(2.32) (2.35)High School 331.30 ** 459.50
(94.14) (92.91)Some College 298.70 ** 389.40
(53.93) (51.77)Technical School 693.10 758.90
(501.58) (491.91)Two Year Degree 372.40 ** 487.30
(63.93) (61.98)Bachelors Degree 536.70 ** 680.80
(30.99) (31.46)Some Grad School 725.10 ** 1021.00
(86.06) (77.68)Masters 620.40 ** 818.60
(72.58) (68.26)Doctorate 1257.10 ** 1428.40
(415.46) (395.89)Constant 767.80 ** 149232 ** 236.90 ** 154444
(7.70) (4664.77) (30.00) (4725.58)N 10257 10257 10257 10257Robust standard errors in parentheses
27

Hiring the Right EmployeesTable 4. Logistic Regression Models of Involuntary Termination (Interns)
Model 4a Model 4b Model 4c Model 4dIntern 0.15 0.12 -0.14 -0.04
(0.12) (0.12) (0.18) (0.17)Female -0.54 ** -0.53 **
(0.08) (0.08)White -0.12 -0.13
(0.33) (0.33)Black 0.59 0.56
(0.34) (0.33)Hispanic 0.35 0.32
(0.34) (0.34)Asian American -0.37 -0.38
(0.36) (0.36)Cohort Year -0.16 ** -0.16 **
(0.01) (0.01)High School 0.82 0.93
(0.58) (0.59)Some College 0.56 0.62
(0.50) (0.50)Technical School -- --
Two Year Degree 1.01 * 1.10 *(0.51) (0.51)
Bachelors Degree 0.16 0.41(0.47) (0.47)
Some Grad School 0.16 0.59(0.58) (0.59)
Masters 0.15 0.33(0.53) (0.54)
Doctorate -- --
Constant -2.31 322.30 -2.50 323.80(0.04) (23.92) (0.47) -24.26
N 10262 10262 10254 10254
Robust standard errors in parentheses* p<0.05, **p < 0.01
28

Hiring the Right EmployeesTable 5. Negative Binomial Regressions of Promotions (Interns)
Model 5a Model 5b Model 5c Model 5d Model 5e Model 5f Model 5g Model 5hPromotions Promotions Promotions Promotions Outstanding Outstanding Outstanding Outstanding
Intern 0.35 ** 0.42 ** 0.57 ** 0.67 ** 0.32 * 0.38 ** 0.89 0.99 **(0.04) (0.04) (0.05) (0.05) (0.14) (0.15) (0.17) (0.18)
Female -0.09 ** -0.10 ** 0.12 0.113(0.03) (0.03) (0.10) (0.10)
White -0.06 -0.07 -1.01 ** -1.02 **(0.11) (0.11) (0.28) (0.28)
Black -0.36 ** -0.36 ** -1.51 ** -1.50 **(0.11) (0.11) (0.30) (0.30)
Hispanic -0.06 -0.05 -0.63 * -0.60 *(0.11) (0.11) (0.29) (0.29)
Asian American -0.13 -0.13 -0.26 -0.29(0.11) (0.12) (0.30) (0.30)
Cohort Year -0.12 ** -0.13 ** -0.08 ** -0.09 **(0.00) (0.00) (0.02) (0.02)
High School 0.49 0.69 -1.20 -0.80(0.40) (0.40) (1.21) (1.20)
Some College 0.88 * 1.00 ** -0.95 -0.84(0.35) (0.34) (0.83) (0.75)
Technical School 0.431 0.453 -13.55 -14.24 **(0.96) (0.92) (0.91) (0.87)
Two Year Degree 1.07 ** 1.25 ** -1.08 -0.76(0.36) (0.36) (0.95) (0.89)
Bachelors Degree 1.26 ** 1.46 ** 0.19 0.38(0.34) (0.34) (0.80) (0.71)
Some Grad School 1.49 ** 1.97 ** 0.70 1.13(0.36) (0.35) (0.87) (0.80)
Masters 1.25 ** 1.53 ** 0.02 0.33(0.36) (0.35) (0.87) (0.79)
Doctorate 1.35 * 1.73 ** -13.55 -14.16 **(0.58) (0.59) (0.98) (0.94)
Constant -0.10 ** 241.3 ** -1.35 ** 249 ** -2.66 ** 157 ** -2.83 173.2 **(0.01) (9.94) (0.34) (9.99) (0.05) (35.08) (0.79) (34.90)
N 10262 10262 10262 10262 10262 10262 10262 10262
Robust standard errors in parentheses* p<0.05, **p< 0.01
29

Hiring the Right EmployeesTable 6. OLS Regression of Days to Promotion (Intern)
Model 6a Model 6b Model 6c Model 6dIntern -53.82 ** -56.36 ** -32.12 -35.96 *
(14.76) (14.73) (16.94) (16.97)Female -8.34 -9.54
(6.35) (6.30)White -35.32 -34.60
(25.10) (24.92)Black -7.31 -5.64
(26.58) (26.44)Hispanic -13.22 -11.71
(25.97) (25.81)Asian American -37.12 -36.43
(25.91) (25.73)Cohort Year 4.93 ** 4.73 **
(1.07) (1.05)High School 164.10 * 152.30 *
(68.25) (69.77)Some College 83.56 * 80.50
(40.47) (43.51)Technical School -- --
Two Year Degree 101.50 * 94.23 *(42.50) (44.76)
Bachelors Degree 128.70 * 123.20 *(34.81) (38.18)
Some Grad School 108.20 * 86.92 *(39.22) (42.87)
Masters 142.60 ** 133.40 **(48.11) (49.93)
Doctorate -- --
Constant 381.90 ** -9472.70 ** 254.30 ** -9193.90 **(3.11) (2142.78) (34.66) (2111.28)
N 3114 3114 3114 3114Robust standard errors in parentheses* p<0.05, **p < 0.01
30
Hiring the Right EmployeesTable 7. Logistic Regression Models of Employee Departure (Referrals)
Model 7a Model 7b Model 7c Model 7dReferral -0.24 ** 0.00 -0.26 ** 0.00
(0.04) (0.05) (0.04) (0.05)Female 0.19 ** 0.20
(0.05) (0.05)White 0.12 0.12
(0.12) (0.13)Black 0.12 0.14
(0.13) (0.13)Hispanic 0.03 0.03
(0.13) (0.13)Asian American 0.14 0.14
(0.15) (0.15)Cohort Year -0.48 ** -0.48
(0.01) (0.01)High School -1.49 * -0.85
(0.68) (0.55)Some College -1.51 * -1.26
(0.61) (0.48)Technical School -2.59 ** -2.31
(0.91) (0.87)Two Year Degree -1.17 -0.97
(0.62) (0.49)Bachelors Degree -2.09 ** -1.20
(0.59) (0.44)Some Grad School -3.46 ** -1.96
(0.61) (0.49)Masters -2.51 ** -1.42
(0.60) (0.48)Doctorate -2.72 ** -2.56
(0.96) (1.19)Constant 1.30 ** 972.90 ** 3.40 ** 967.10
(0.03) (19.95) (0.59) (20.16)N 14517 14517 14517 14517Robust standard errors in parentheses* p<0.05, **p < 0.01
31
Hiring the Right EmployeesTable 8. OLS Regression of Days Worked in Firm (Referrals)
Model 8a Model 8b Model 8c Model 8dReferral -36.50 ** -0.60 -41.08 ** -1.48
(12.57) (12.05) (12.54) (12.01)Female -37.58 ** -37.59 **
(11.89) (11.86)White 8.15 7.48
(29.37) (29.22)Black -20.50 -29.51
(31.12) (31.04)Hispanic 9.90 6.32
(31.84) (31.73)Asian American -41.66 -41.94
(36.15) (35.99)Cohort Year -72.83 ** -74.73 **
(1.89) (1.93)High School 579.8 ** 708.2 **
(91.51) (88.04)Some College 634.2 ** 707.7 **
(53.41) (53.32)Technical School 842.4 * 949.8 **
(337.12) (336.80)Two Year Degree 551.1 ** 629 **
(51.54) (51.20)Bachelors Degree 493.7 ** 659.7 **
(24.03) (25.78)Some Grad School 625.6 ** 954 **
(65.91) (60.55)Masters 585.7 ** 802.1 **
(58.85) (56.03)Doctorate 936.0 * 1046.5 **
(410.33) (385.65)Constant 768 ** 146957 ** 271 ** 150102 **
(7.70) (3805.97) (23.42) (3870.02)N 14506 14506 14506 14506
Robust standard errors in parentheses* p<0.05, **p< 0.01
32
Hiring the Right EmployeesTable 9. Logistic Regression Models of Involuntary Termination (Referrals)
(1) (2) (3) (4)Model 9a Model 9b Model 9c Model 9d
Referral 0.22 ** 0.24 ** 0.18 ** 0.21 **(0.06) (0.06) (0.06) (0.06)
Female -0.58 ** -0.56 **(0.06) (0.06)
White 0.09 0.08(0.28) (0.28)
Black 0.85 ** 0.83 **(0.28) (0.28)
Hispanic 0.49 0.43(0.28) (0.28)
Asian American -0.06 -0.06(0.30) (0.30)
Cohort Year-0.18 ** -0.17 **
High School (0.01) (0.01)0.82 1.04 *
Some College (0.46) (0.47)0.81 * 0.84 *
Technical School (0.38) (0.39)-- --
Two Year Degree0.82 * 0.90 *
Bachelors Degree (0.38) (0.39)-0.15 0.17
Some Grad School (0.35) (0.36)-0.33 0.22
Masters (0.46) (0.47)-0.50 -0.23
Doctorate (0.42) (0.43)-- --
Constant-2.31 ** 351.00 ** -2.20 ** 345.60 **
(0.04) (19.60) (0.35) (20.09)N 14517 14517 14500 14500
Robust standard errors in parentheses* p<0.05, **p < 0.01
33
Hiring the Right EmployeesTable 10. Negative Binomial Regressions of Promotions (Referrals)
Model 10a Model 10b Model 10c Model 10d Model 10e Model 10f Model 10g Model 10hPromotions Promotions Promotions Promotions Outstanding Outstanding Outstanding Outstanding
Referral -0.06 * 0.00 -0.07 ** 0.00 -0.135 -0.03 -0.17 -0.01(0.03) (0.02) (0.03) (0.02) (0.09) (0.09) (0.09) (0.09)
Female -0.10 ** -0.11 ** 0.07 0.06(0.02) (0.02) (0.08) (0.08)
White 0.02 0.02 -0.63 * -0.63 *(0.09) (0.09) (0.25) (0.25)
Black -0.24 * -0.26 ** -1.01 ** -1.02 **(0.10) (0.10) (0.27) (0.27)
Hispanic 0.01 0.01 -0.35 -0.32(0.10) (0.10) (0.26) (0.26)
Asian American -0.04 -0.04 0.04 0.02(0.10) (0.10) (0.27) (0.27)
Cohort Year -0.13 ** -0.13 ** -0.05 ** -0.06 **(0.00) (0.00) (0.01) (0.01)
High School 1.03 ** 1.25 ** -18.95 ** -23.30 **(0.35) (0.34) (0.58) (0.54)
Some College 1.41 ** 1.55 ** -0.70 -0.59(0.32) (0.31) (0.65) (0.62)
Technical School 0.66 0.86 -18.95 ** -23.33 **(0.70) (0.71) (0.65) (0.64)
Two Year Degree 1.39 ** 1.56 ** -0.68 -0.63(0.32) (0.31) (0.69) (0.65)
Bachelors Degree 1.34 ** 1.62 ** -0.03 0.13(0.31) (0.30) (0.57) (0.53)
Some Grad School 1.61 ** 2.19 ** 0.59 0.90(0.32) (0.31) (0.63) (0.60)
Masters 1.39 ** 1.75 ** -0.04 0.19(0.32) (0.31) (0.62) (0.59)
Doctorate 1.19 1.45 ** -18.92 ** -23.23 **(0.60) (0.56) (0.67) (0.64)
Constant -0.10 ** 256.3 ** -1.44 ** 262 ** -2.66 ** 108 ** -2.63 ** 118.3 **(0.01) (8.51) (0.31) (8.57) (0.05) (28.67) (0.56) (28.57)
N 14517 14517 14517 14517 14517 14517 14517 14517
Robust standard errors in parentheses* p<0.05, **p< 0.01
34