Embed Size (px)
Citation preview

Supplementary Information: Non-thermal Plasma Exposure Rapidly Attenuates Bacterial AHL-Dependent Quorum Sensing and Virulence
Padrig B. Flynn1,2,†, Alessandro Busetti1,†, Ewa Wielogorska3, Olivier P. Chevallier3,
Christopher T. Elliott3, Garry Laverty1, Sean P. Gorman1, William G. Graham2 and
Brendan F. Gilmore1, *.
Table S1. Function, antibiotic resistance and cognitive HSL of strains used in study.
Strain Genotype or phenotype Cognitive HSL Source/
references
A. tumefaciens
ATCC BAA 2240
HSL sensor strain; contains
traR and traG-lacZ fusion, a β-
galactosidase reporter, β -
lactam and CnR
C4-C12 3-oxo-HSLs
3-hydroxy- and 3-
unsubstituted HSLs
32
C. violaceum
CV026
HSL sensor strain; miniTn-5
mutant of CV31532, violacein
reporter, KmR
C4-C8 HSLs. 29
Escherichia coli
JM109 (pSB401)
HSL sensor strain; contains
luxRI::luxCDABE,
bioluminescent reporter, TcR
C6-C8-HSL and
related medium side
chain HSL analogues
33
E. coli JM109
(pSB 536)
HSL Sensor strain; contains ahyR ahyI::luxCDABE; AmpR ColE1 origin
C4-HSLs and related
short side chain HSL
analogues
33
E. coli JM109
(pSB 1142)
HSL sensor strain; contains
lasR
and promoter of
lasI::luxCDABE,
bioluminescent reporter, TcR
C10-C14 long side
chain HSL analogues
33
PAO-MW1 lasI and rhlI mutant of P.
aeruginosa, HgClR & TcR
BHL and OdDHL 24
Table S2. UHPLC - MS/MS conditions for the analysis. Where: MW - Molecular weight, tr – Retention time.

Analyte MW [g/mol]
Moleculat Ion [M+H]+
Fragment Ions tr
BHL 171.09 172.1102.1
1.8371.1154.0
HHL 199.12 200.0
102.2
3.6774.199.271.2
OHL 227.15 228.0102.2
5.4674.1109.1
OdDHL 297.19 298.0102.2
6.9198.295.1


Figure S1. Normalized bioluminescence of E. coli AHL bioluminescence reporters
incubated with plasma exposed AHLs: BHL, HHL, OHL, OdDHL grown over 14
hours. AHL were exposed to a helium/oxygen 0.5% plasma plume for 0, 30 seconds,
60 seconds, 120 seconds, 240 seconds. (a) E. coli pSB 536 incubated with BHL at 30 oC, (b) E. coli pSB 401 incubated with HHL at 37 oC, (c) E. coli pSB 401 incubated
with OHL at 37 oC and (d) E. coli pSB 1142 incubated with OdDHL at 37 oC. Each
data point represents the mean of five replicates with error bars representing the
standard deviation.
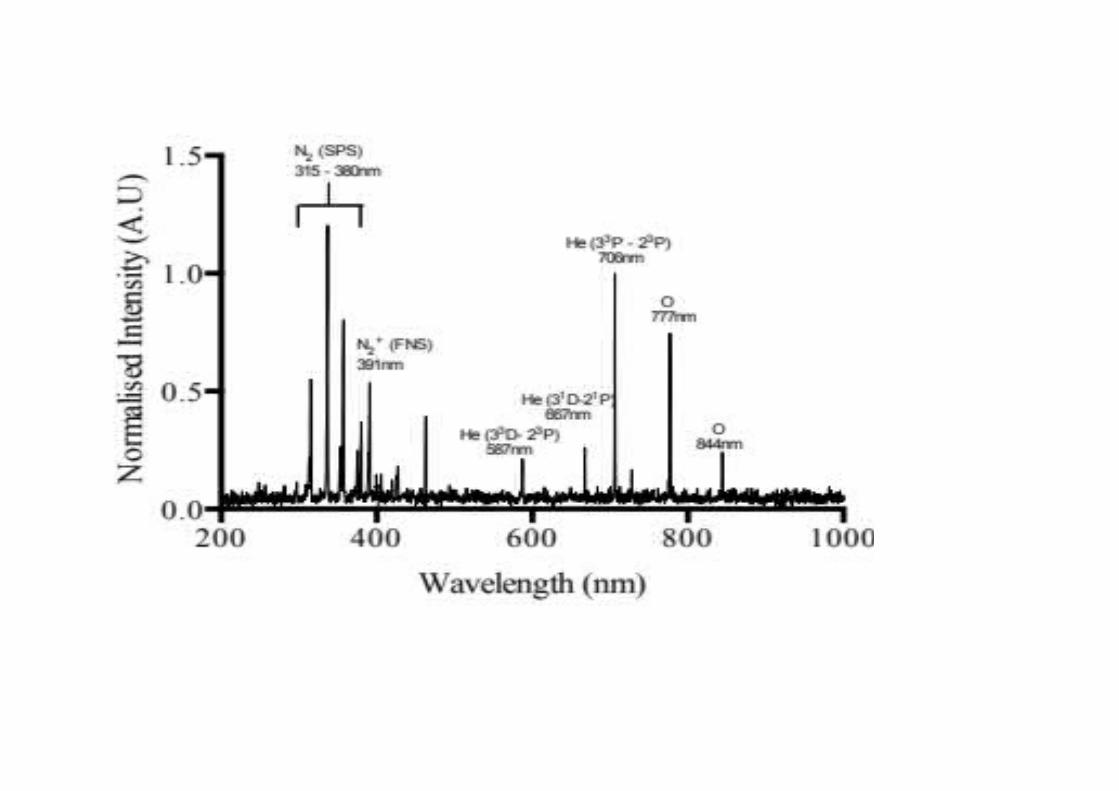
Figure S2. Optical Emission Spectra of the plume of a helium/oxygen (0.5%) plasma, operating at 6kV and 20 kHz.

Figure S3. Production of 2-hydroxyterephthalic acid (2-HTA) after plasma exposure
of terephthalic acid in water and PBS. Each data point represents the average of three
replicates with error bars depicting the standard deviation.
Figure S4. Production of hydrogen peroxide in PBS and water following plasma
exposure using the titanium sulphate assay. Each data point represents the average of
three replicates with error bars depicting the standard deviation.

Figure S5. Measurement of pH following plasma exposure of water (red squares) and
PBS (black circles). A Hamilton mini-electrode pH meter was used for pH
measurements. Each data point represents the average of three replicates with error
bars depicting the standard deviation.
Figure S6. Plasma dependent temperature increase of PBS exposed to plasma over a
series of time points. Each data point represents the average of three replicates with
error bars depicting the standard deviation.

Figure S7. A. tumefaciens ATCC BAA-2240 TLC-overlay showing the effect of
plasma exposure on AHL mobility and activity of OdDHL when exposed at a higher
concentration of 1mM and in either (a) PBS or (b) water

Figure S8. A. tumefaciens ATCC BAA-2240 TLC-overlay of AHLs (Grayscale) used
in study (a) Untreated and (b) following incubation with 4 mM hydrogen peroxide for
240 seconds, showing negligible alteration in migration, compared with control.
(b)(a)
BHL HHL OHLOdDHL OdDHLOHLHHLBHL

Figure S9 Overlay of LC - MS/MS chromatograms for 4 analytes at concentration
of 1mM.
A.
B.

C.
D.

Figure S10 – LC-MS traces of BHL (A), HHL (B), OHL (C) and OdDHL (D)
exposed to APNTP for (top to bottom) 0 seconds, 60 seconds and 240 seconds.
Supplementary Materials and Methods
Optical Emission Spectroscopy And Chemical Characterization Of Plasma Treated Liquids.
For optical emission spectroscopy the light of the plasma plume was focused onto a
fiber optic using a lens (UV/SR-VIS, 300 m in diameter). The fibre optic was
connected to a broadband (200-1100 nm) spectrometer (Ocean optics, HR 4000,
0.25nm resolution) to disperse the collected light. The dispersed light and subsequent
wavelengths were recorded using PC software (SpectraSuite, Ocean optics) and
reactive species produced within the plasma identified.
Titanium sulphate was used to colometrically determine the concentration of
hydrogen peroxide produced in plasma treated water and PBS. 50 μl of deionised
water or PBS was exposed to the plasma effluent for up to 240 seconds with
measurements taken at intervals in triplicate. After exposure 10 μl was added to 90 μl
of water in wells of a Nunc-96 well plate (Fisher Scientific UK Ltd. Loughborough,
UK) followed immediately by the addition of 10 μl of a 60 mM sodium azide solution
after which 50 μl of titanium sulphate was added. Absorbance of the yellow
perxotitanium complex was read at 400 nm using a biotek microplate reader. (BioTek
EL808; BioTek Instruments Ltd. Potton, UK) with H2O2 concentrations calculated
from a standard curve.
Terephthalic acid (Sigma Aldrich, Dorset, UK) was used to evaluate the production of
OH radicals in liquid. A 10 mM terephthalic acid, insoluble at acidic/neutral pH was
created using a 5mM NaOH/PBS solution (pH 8) or 5mM NaOH/DI water which was
then adjusted to pH 7.4 . 50 µl of this solution was exposed to the plasma effluent, 15
mm from the quartz tube tip to the surface of the sample for up to 240 second with
measurements taken at intervals in triplicate. Unexposed samples were used as
negative controls and correspond to time 0 seconds exposure. After exposure 20 µl of
the exposed solution was transferred to 180 µl of PBS in a black bottomed 96-well
plate (Fisher Scientific UK Ltd. Loughborough, UK). 2-Hydroxyterephthalic acid

fluorescence was measured at emission 310 nm, excitation 425 nm using a BMG
Fluostar Optima Fluorescence plate reader (BMG,Labtech Ltd. Aylesbury, UK).
Fluorescence of 2-Hydroxyterephthalic from exposed samples were converted to
concentrations using a standard curve of known concentrations of 2-
Hydroxyterephthalic acid (Sigma Aldrich, Dorset, UK).
pH measurements of plasma exposed water and PBS were carried out immediately
after transferring 20 µl of plasma exposed PBS or DI water to 180 µl of DI water. pH
was measured using a Hamilton minitrode combination electrode pH meter, calibrated
using pH 7 and pH 4 buffer solutions (Fisher Scientific UK Ltd., Loughborough, UK).
Measurements were repeated in triplicate for each time point.
Temperature measurements of plasma treated liquids was investigated through the
immersion of a Fluke CNX t3000 K-type temperature indicator (Fluke UK Ltd,
Norwich, UK) in 50 µl of PBS and exposed for up to 240 seconds in triplicate.
Temperature readings were taken at intervals for up to 240 seconds.
AHL exposure to Hydrogen peroxide
A concentration of 100 µM of each AHL was exposed to 4 mM of Hydrogen peroxide
for 240 seconds at room temperature (equivalent to the concentration of hydrogen
peroxide produced after four minutes plasma exposure). Briefly 1 mM AHL solutions
were created as previously mentioned and added to 10 µl added to 90 µl of a 4 mM
hydrogen peroxide solution in PBS. After 240 seconds hydrogen peroxide exposure 1
µl of each AHL was spotted onto RP-TLC paper and overlaid with A. tumefaciens
ATCC-BAA 2240 as mentioned previously.
LC-MS analysis
Analyses were carried out on a Waters Acquity UPLC I-Class system (Milford, MA,
USA) coupled to a Waters Xevo G2-S QTof mass spectrometer (Manchester, UK)
with an electrospray ionisation source operating in positive with lock-spray interface
for real time accurate mass correction. Instrument settings were as follow: source
temperature was set at 120ºC, cone gas flow at 50 L.h-1, desolvation temperature at
450ºC, and desolvation gas flow at 850 L.h-1. The capillary voltage was set at 1.0 kV
in positive mode. Source offset was 60 (arbitrary unit). Mass spectra data were

acquired in continuum mode using MSE function (low energy: 4 eV; high energy:
ramp from 15 to 30 eV) over the range m/z 50-1200 with a scan time of 0.08 s. A
lock-mass solution of Leucine Enkephalin (1 ng µL-1) in methanol/water containing
0.1% formic acid (1:1, v/v) was continuously infused into the MS via the lock-spray
at a flow rate of 10 µL min-1.
The chromatographic separation was conducted on an Acquity HSS T3 column (100
mm x 2.1 mm, 1.8 µm). The column oven temperature was set at 45oC, injection
volume at 5 µL and flow rate at 0.4 mL min-1. Mobile phase consisted of (A) water
with 0.1% formic acid and (B) methanol with 0.1% formic acid. The gradient was set
as follows: 1.50 min of 99% (A) followed by a linear increase from 1 to 99% (B) over
15 min, isocratic cleaning step at 99% (B) for 2 min, then returned to initial
conditions 99% (A) over 0.25 min and column equilibration step at 99% (A) for 1.25
min.
Samples were reconstituted in H2O:MeOH (9:1, v/v) and 10 μL injected onto the
system.