Embed Size (px)
Citation preview

Intrinsically Labeled Fluorescent Oligonucleotide Probes on Quantum Dots for Transduction of Nucleic Acid
Hybridization
Anna Shahmuradyan and Ulrich J. Krull*
Chemical Sensors Group, Department of Chemical and Physical Sciences, University of Toronto
Mississauga, 3359 Mississauga Road, Mississauga ON, L5L 1C6, Canada.
*Author to whom correspondence should be addressed: [email protected]
1

ABSTARCT
Quantum dots (QDs) have been widely used in chemical and biosensing due to their unique
photoelectrical properties, and are well suited as donors in fluorescence resonance energy
transfer (FRET). Selective hybridization interactions of oligonucleotides on QDs have been
determined by FRET. Typically, the QD-FRET constructs have made use of labeled targets or
have implemented labeled sandwich format assays to introduce dyes in proximity to the QDs for
the FRET process. The intention of this new work is to explore a method to incorporate the
acceptor dye into the probe molecule. Thiazole orange (TO) derivatives are fluorescent
intercalating dyes that have been used for detection of double-stranded nucleic acids. One such
dye system has been reported in which single-stranded oligonucleotide probes were doubly
labeled with adjacent thiazole orange derivatives. In the absence of the fully complementary
(FC) oligonucleotide target the dyes form an H-aggregate, which results in quenching of
fluorescence emission due to excitonic interactions between the dyes. The hybridization of the
FC target to the probe provides for dissociation of the aggregate as the dyes intercalate into the
double stranded duplex, resulting in increased fluorescence. This work reports investigation of
the dependence of the ratiometric signal on the type of linkage used to conjugate the dyes to the
probe, the location of the dye along the length of the probe, and the distance between adjacent
dye molecules. The limit of detection for 34mer and 90mer targets was found to be identical, and
was 10 nM (2 pmol), similar to analogous QD-FRET using labeled oligonucleotide target. The
detection system could discriminate a one base pair mismatch (1BPM) target, and was functional
without substantial compromise of the signal in 75% serum. The 1BPM was found to reduce
background signal, indicating that the structure of the mismatch affected the environment of the
intercalating dyes.
2

Keywords: fluorescence resonance energy transfer, quantum dot, oligonucleotide, hybridization, intercalation
INTRODUCTION
Cyanine dyes have been widely used for a variety of biological and biomedical applications
involving nucleic acids, such as staining of DNA in agarose gel and capillary electrophoresis
separations1,2, detection of nucleic acids after high-performance liquid chromatography
separations3, as labels in polymerase chain reaction4 , and as acceptors in FRET5,6. The
properties that make cyanine dyes useful in such applications include high affinity for double-
stranded nucleic acids, large extinction coefficients associated with strong π-π absorption, and
quantum yield that increases by orders of magnitude upon intercalation into double-stranded
DNA7.
Cyanine dyes can form aggregates in aqueous solutions due to π stacking interactions that are
associated with the polarizability and hydrophobicity of the dyes8. In such aggregates the
fluorescence is quenched due to excitonic interactions of the transition dipoles. This optical
property of the aggregates offers potential for development of DNA detection bioassays based on
an “on-off” switching system as reported by Okamoto et al.9,10. Single-stranded oligonucleotide
probes were labeled with two adjacent derivatives of thiazole orange dye that formed an H-
aggregate dimer in aqueous solutions, resulting in quenching of the fluorescence emission of the
dye molecules. Upon hybridization of the probe with complementary target, the dimer
dissociated interrupting the excitionic interactions and resulting in enhancement of fluorescence
emission due to intercalation of the dye molecules into the hybrid structure9,10. This approach to
transduction of hybridization makes use of intrinsically labeled oligonucleotide probes that allow
3

reversible determination of unlabeled target in a single step, and eliminates need for additional
reagents such as found in sandwich assays or in staining of hybrids using intercalators.
Figure 1. Schematic representation of the dye labeled probe on the surface of a QD. The dye is excited by FRET with the QD serving as donor. (a) In the absence of the target the dye molecules form an H-aggregate, which results in suppression of fluorescence emission due to excitonic interaction. (b) The hybridization of the target results in the disruption of the excitonic
interaction and strong emission from intercalated dye.
The work reported herein explores the analytical performance of the general configuration shown
in Figure 1, where the concept of use of intrinsically labeled probes is combined with optical
excitation by quantum dots (QDs). The DNA probes are immobilized on the surface of QDs and
the fluorescent dyes are excited via Fluorescent Resonance Energy Transfer (FRET) from the
QD donors. This configuration offers several advantages to the analytical performance. The QDs
have broad absorption and narrow emission bands, so that a range of absorption wavelengths can
be easily converted into a well-defined emission for the FRET process. FRET-based detection
provides inherent spatial selectivity as FRET efficiency is distance dependent. The FRET
4

excitation interrogates a distance on the scale of 10 nm (Equation 1), so that only the surface
interactions on the QDs are sampled.
E=a Ro
6
r 6+a Ro6 Equation 1
where E is the FRET efficiency, r is the distance between the donor and the acceptor, a is the
total number of the acceptors and Ro is the Förster distance, the distance at which the energy
transfer has 50% efficiency11. The interdependence of QD and dye emission allows for
ratiometric detection and opportunities for improved efficiency of hybridization based on the
high curvature of the nanoparticle surface, multiplexed analysis using concurrent spectroscopic
color channels and signal amplification by proximity of an acceptor to multiple donors in solid-
state assay formats.
Ratiometric detection is based on the calculation of the emission intensity ratio of the donor and
the acceptor, and offers improved precision while accounting for donor photoluminescence (PL)
quenching and sensitization of acceptor PL12. This investigation of the FRET-based transduction
system considers a variety of structural motifs associated with the location of the cyanine dyes to
extend the original work of Okamoto et al.9,10. Permutations include investigation of placement
of the dyes on nucleobases, on the phosphate backbone, and the effect of the distance of
separation of dyes.
EXPERIMENTAL SECTION
A detailed description of the experimental procedures, instrumentation and data analysis can be
found in the Supporting Information.
5

Reagents and oligonucleotides
Qdot® 525 ITK™ Streptavidin Conjugate Kits were from Life Technologies, a ThermoFisher
brand. Oligonucleotides were from Integrated DNA Technologies (Coralville, IA) and were
purified by either standard desalting or HPLC by the manufacturer. The oligonucleotide
sequences were dissolved in autoclaved MilliQ water (purified water from a Milli-Q cartridge
filtration system with a resistivity of 18.2 MΩ.cm) and stored at −20 °C. 2-methylbenzoxazole
(C8H7NO, 99%), 5-bromovaleric acid (Br(CH2)4COOH, 97%), 4-dimethylamino benzaldehyde
((CH3)2NC6H4CHO, ≥99.0%, HPLC), acetic anhydride ((CH3CO)2O, ReagentPlus®, ≥99%) N-
hydroxysuccinimide (NHS, C4H5NO3, 98%), 1,2- dichlorobenzene (C6H4Cl2, anhydrous, 99%) N-
(3-Dimethylaminopropyl)-N′-ethylcarbodiimide hydrochloride (EDC, C8H17N3 · HCl, purum ≥
98%), Goat Serum were from Sigma-Aldrich (Oakville, ON). All buffer solutions were prepared
using a deionized water purification system (MilliQ, 18 MΩ.cm) and were autoclaved prior to
use. The buffer solutions included 100 mM tris-borate buffer (TB, pH 7.4) and 100 mM
bicarbonate buffer (BIC, pH 8.3).
Synthesis of OD539 (3-(4-Carboxybutyl)-2-[4(N,N-dimethylamino)styryl]benzoxazolium).
The synthesis of this dye has been reported elsewhere10. Briefly, 2-methylbenzoxazole (3.00 ml,
25.0 mmol) and 5-bromovaleric acid (9.00 mg, 50 mmol) were suspended in 10 mL 1,2-
dichlorobenzene. The resulting mixture was stirred and heated at 120 oC overnight. The reaction
mixture was cooled to room temperature and 200 mL of dichloromethane was added. The
resulting suspension was stirred at room temperature for 2 hours. The precipitate was then
filtered, washed and dried resulting in white powder. The white powder (312 mg, 1.00 mmol)
was then mixed with 4-dimethylaminobenzaldehyde (150 mg, 1.00 mmol) and suspended in 10
mL acetic anhydride. The suspension was heated and stirred at 120 oC for 30 min. At the end of
6

the 30 min, 10 mL of purified water (MilliQ, 18.2 MΩ.cm) was added and the resulting solution
was heated for another 30 min. The solvent was then evaporated at reduced pressure and 100 mL
acetone was added to the residue. The resulting suspension was allowed to stand at room
temperature for 30 min. The precipitate was filtered, washed with acetone and dried under
reduced pressure giving a reddish brown powder. The mass of the synthesized dye was found to
be 365.06 ([M-Br]+) using ESI MS.
The resulting dye (8.9 mg, 20 μmol) was mixed with N-Hydroxysuccinimide (4.6 mg 40 μmol )
and 1-ethyl-3-(3-dimethylaminopropyl)carbodiimide hydrochloride (7.7 mg, 40 μmol) in 0.5 mL
dimethylformamide and stirred at room temperature overnight. The resulting clear solution was
stored in a freezer.
Attaching dye to the DNA probe
DNA probe was from Integrated DNA Technologies (IDT) and was provided with two internal
amine linkers, AmC6dT or UniLinkTM, and a biotin attached to the 5’end. AmC6dT is a modified
nucleotide with an amine attached to the nucleobase by a 6 carbon linker. UniLinkTM has an
amine that is attached to the phosphate backbone by a 6 carbon linker. The dye solution was
added to the diamino modified DNA probe at 50 mole equivalents in 100 mM bicarbonate
buffer at pH 8.3. The resulting solution was shaken using a vortex mixer and left overnight (at 4
oC). The solution was then centrifuged at 8000 rpm for 3 min. The supernatant was collected and
purified using a NAP5 column. The concentration of the DNA probe was determined using the
DNA absorption band at 260 nm (Molar Extinction Coefficients were provided by IDT).
Preparation of QD-probe conjugates
7

The doubly labeled DNA probes were mixed with streptavidin coated green QDs at 70
equivalents in 100 mM Tris Borate (TB) buffer with 20 mM NaCl at pH 7.4. These QDs
accommodate on average 46 probes per QD [13]. The solution was mixed on a shaker platform
for 45 min. 100 kD spin filters were used to remove excess DNA probes in solution. The
immobilization of the DNA probes was confirmed using Gel Electrophoresis (Supporting
Information).
Positioning of Dyes on Oligonucleotide Probes
Two types of probes were ordered from IDT; one contained two thymine bases each with amino
modified linkers (Amino Modifier C6 dT) and the other was modified with two Uni-LinkTM
Amino Modifiers. The modified thymine bases were adjacent, located either in the middle of the
probe sequence or one quarter of the distance from the terminus of the oligonucleotide sequence.
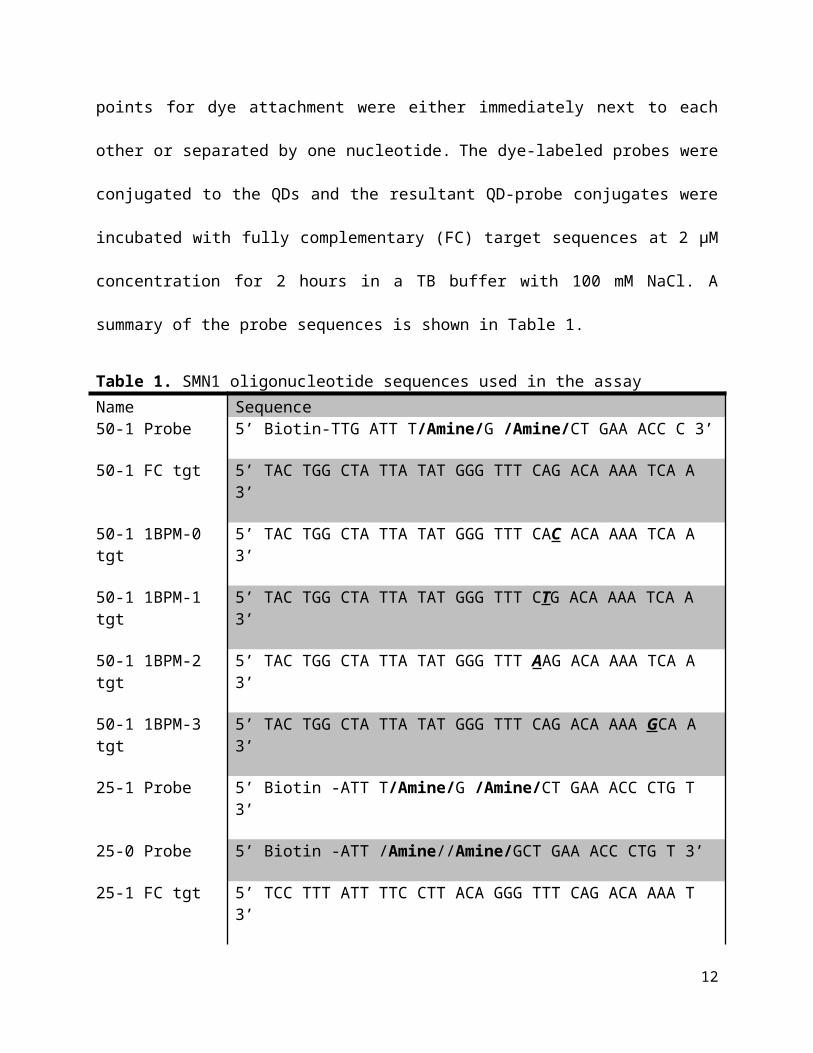
The points for dye attachment were either immediately next to each other or separated by one
nucleotide. The dye-labeled probes were conjugated to the QDs and the resultant QD-probe
conjugates were incubated with fully complementary (FC) target sequences at 2 μM
concentration for 2 hours in a TB buffer with 100 mM NaCl. A summary of the probe sequences
is shown in Table 1.
Table 1. SMN1 oligonucleotide sequences used in the assayName Sequence50-1 Probe 5’ Biotin-TTG ATT T/Amine/G /Amine/CT GAA ACC C 3’
50-1 FC tgt 5’ TAC TGG CTA TTA TAT GGG TTT CAG ACA AAA TCA A 3’
50-1 1BPM-0 tgt 5’ TAC TGG CTA TTA TAT GGG TTT CAC ACA AAA TCA A 3’
50-1 1BPM-1 tgt 5’ TAC TGG CTA TTA TAT GGG TTT CTG ACA AAA TCA A 3’
50-1 1BPM-2 tgt 5’ TAC TGG CTA TTA TAT GGG TTT AAG ACA AAA TCA A 3’
8

50-1 1BPM-3 tgt 5’ TAC TGG CTA TTA TAT GGG TTT CAG ACA AAA GCA A 3’
25-1 Probe 5’ Biotin -ATT T/Amine/G /Amine/CT GAA ACC CTG T 3’
25-0 Probe 5’ Biotin -ATT /Amine//Amine/GCT GAA ACC CTG T 3’
25-1 FC tgt 5’ TCC TTT ATT TTC CTT ACA GGG TTT CAG ACA AAA T 3’
tgt = target, FC = fully-complementary, 1 BPM = 1 Base Pair Mismatch, NC = noncomplementary, /Amine/ = modified thymine (AmC6dT) or UniLinkTM. The mismatched base in 1 BPM tgt is bolded, italicized and underlined.
Sensitivity and Selectivity assays
The 34 and 90 base length target oligonucleotides were from Integrated DNA Technologies
(Table 1). Calibration curves were constructed using solutions of 0.01 to 2 μM target
concentrations. The targets were incubated with the QD-probe conjugates in 100 mM TB buffer
with 100 mM NaCl at pH 7.4 for 1-2 hours. The quantum dots were excited at 405 nm using a
fluorescence spectrometer and photoluminescence (PL) was measured between 500 - 600 nm.
The selectivity of the assay was evaluated by comparing the PL for fully complementary (FC)
target with one containing a base pair mismatch (1BPM). The target with 1BPM was incubated
with the QD-probe conjugate in a 100 mM TB buffer at pH 7.4 with 100 mM NaCl for 2 hours.
The effect of the location of the 1BPM was investigated by placing the dye and mismatch at
various distances with up to 3 nucleotides of separation. This experiment was repeated in the
presence of 75% v/v goat serum.
9

Figure 2. a) Normalized absorption and PL of the dye labeled probe measured in the absence and the presence of the FC target. The absorption (dashed line) and PL (solid line) are indicated by red and blue for the nonhybridized probe and the hybrid, respectively. b) The excited state of the dimer splits into two energy levels due to the interaction of the transition dipoles. The out-of-phase alignment of the dipoles results in the lower energy level, whereas in-phase alignment of the dipoles results in the higher energy level. The transition from the ground state to the lower energy level is forbidden. After excitation to the allowed upper level, rapid internal conversion takes place to the lower level, which is followed by non-radiative relaxation to the ground state15.
RESULTS AND DISCUSSION
The absorption and emission spectra of the doubly labeled probes were measured in the presence
and the absence of the fully complementary target. Two absorption bands were present in both
cases in a range of 400-550 nm (Figure 2a). The band centered with the shorter wavelength (482
nm) was more prominent when the probes were in the single-stranded state. The longer
wavelength absorption band (520 nm) dominated when the fully complementary target
hybridized to the probe. This latter absorption band was also prominent in the spectrum of a
probe labeled with only a single dye molecule (Supporting Information). The difference in the
photophysical properties of the dyes in the presence and the absence of the target are due to the
formation of a dimeric structure between the dyes9. The self-association of the dye molecules in
10

aqueous solutions occurs due to π stacking interactions between the conjugated systems of the
dyes, which minimizes exposure to water14. The shift towards a shorter wavelength upon
formation of a dimeric structure is a characteristic of H-aggregates. The formation of the H-
aggregate allows for excitonic interaction between the dye molecules, which in turn suppresses
fluorescent emission10 (Figure 2b). Exciton coupling theory suggests that the dye molecules are
treated as point dipoles and the excited state splits into two energy levels due to the interaction of
transition dipoles15. The higher energy level results from the in-phase alignment of the two
dipoles, whereas the out-of-phase alignment gives rise to the lower energy level15. Absorption of
an incoming photon results in the transition to the upper excitonic state followed by rapid
deactivation to the non-emissive lower excitonic state15. Hybridization of the fully
complementary target results in the dissociation of the dimer, leading to the disruption of the
excitonic interaction and restoration of the fluorescence emission. Fluorescence intensity is
directly affected by the quantum yield, and the quantum yield is expressed by the ratio of the
sum of the radiative relaxation over the sum of the non-radiative relaxation rate constants11. The
disruption of the excitonic interaction leads to increase in the quantum yield and the subsequent
increase in fluorescence intensity. The quantum yield of the probe-target hybrid was 1.6 times
the quantum yield of the probe in the single-stranded state which is lower than expected for a
derivative of a thiazole orange dye in a similar environment9. The relatively small change in the
quantum yield may be a consequence of incomplete dissociation of the dimer upon hybridization
of the target. The presence of two emissive populations, dimer and monomer, was evident in
lifetime measurements (Supporting Information). The fluorescence decay profile of the probe in
the double stranded state was fit well with a double exponential function; whereas, the probe in
11
the single stranded state could be fit to a single exponential function. The presence of the dimeric
form is also supported by the absorption spectra. The shorter wavelength absorption band is
present as a shoulder in the spectrum of the double stranded state and absent in the spectrum of
the probe labeled with a single dye (Supporting Information).
The PL associated with the hybridization of the target to the probe was quantified using a
ratiometric approach based on a modified FRET ratio (MFR) (Supporting Information). The
12

Figure 3. Two types of linkages were used to attach the dye to the DNA probe, amine modifier UniLinkTM (a) and an amino modified thymine base (b) The UniLinkTM conjugates the dye to the phosphate backbone of the oligonucleotide; whereas, the modified thyme conjugates the dye to the nucleobase. The MFR for the probe containing the modified thymine bases was 5.2 times the MFR of the probe labeled with the UniLinkTM. (c-d) Absorption spectra of the doubly labeled probe in the presence and the absence of the target, as well as of a singly labeled probe for “50-uni” and “50-1”, respectively.
change in the magnitude of the MFR provided an indication of the effect of the type of linkage
used to attach the dye to the probe, the location of the dye within the probe sequence, as well as
the distance between the dyes in the presence and the absence of the target.
The type of linkage used to attach the dye to the probe had a significant effect on the PL of the
dye. There were two types of commercially available linkages used; both contained a six carbon
aliphatic spacer arm. A Uni-LinkTM amino-modifier provided for attachment of an amine to the
phosphate backbone of an oligonucleotide sequence (Figure 3). A modified thymine nucleobase,
AmC6dT, provided for conjugation to the nitrogenous base. The MFR of the probe containing
the AmC6dT (50-1 probe) was 4.6 times higher than the MFR of the probe containing the Uni-
LinkTM (50-uni probe) (Figure 3a). The lower PL of the UniLinkTM probes could result from steric
restrictions imposed on the dyes. Unlike the dyes directly attached to the nucleobases, the dyes
attached to the DNA via the UniLinkTM spacer might not have sufficient range of motion, hence
preventing the dyes from intercalating into the DNA duplex. This is evident in the absorption
spectrum of the “50-uni” probes as the characteristic long wavelength absorption peak of the
monomeric state emerged as only a shoulder after the hybridization of the fully complimentary
target, and the short wavelength absorption band that is characteristic of the dimeric state
remained prominent (Figure 3 c-d).
13

Figure 4. The signal from the dye in the presence of the FC target was not significantly impacted due to variation of the distance between the locus of the dyes and the QD. In one configuration the dye was attached to the center of the probe (50-AmC6dT, a), and in another configuration was attached a quarter of the distance along the probe length (25-AmC6dT, b). The dyes were attached using the amine modified thymine, C6dT. The ratio between the MFR of the 50-AmC6dT probe and the 25-AmC6dT probe was 1:1.
The location of the dye within the probe sequence was chosen relative to the 5’ end of the
sequence (Figure 4) so that FRET efficiency would be maintained. In the case of the probes
referred to as “25-1”, the dyes were attached to the 5th and the 7th nucleotides, and this represents
one quarter of the length of the sequence. The probes referred to as the “50-1” located the
conjugated dyes in the middle of the sequence. Based on Equation 1, the location of the dye with
respect to the QD was expected to have a significant effect on the signal intensity. However,
there were no significant differences between the MFR for the two dye configurations. In order
to rule out the possibility of the probes collapsing on the surface of the QDs, unlabeled probes of
the same sequence were hybridized with targets labeled with Cy3 dye at the 3’and the 5’ end.
The FRET ratio observed for the proximal target was 6 times the FRET ratio of the distal target,
which suggests that the probes do not fold onto the nanoparticle surface. The results shown in
14

Figure 4 suggest that any increase in the FRET efficiency due to a closer proximity of the dye to
the donor was largely offset by weakened intercalation of the dyes due to being close to the
terminus of the hybrid sequence16. The signal intensity of the dye is expected to increase upon
hybridization of the target as it causes disassociation of the non-emissive dimer; however, it was
previously noted that partial intercalation of the dye caused only a 50% increase in the signal
intensity16.
Figure 5. (a-b) The effect of the distance between two dyes was investigated by attaching the dyes to nucleotides that were immediately adjacent (25-0) or that were separated by one nucleotide (25-1). The dyes were attached to the probe one quarter of the way along the length of the sequence using the amine modified thymine AmC6dT. (c-d) Absorption spectra for the probe in the single stranded state, double stranded state and a single dye molecule for “25-1” and “25-0”.
15

The distance between the dyes had a significant effect on the signal intensity. The MFR of the
probes labeled with dyes that were separated by one nucleotide (25-1 probes) was a factor of 4.5
greater than the MFR of the probes labeled with dyes that were immediately adjacent (25-0
probes) (Figure 5 a-b). It was anticipated that increasing the distance between the dyes would
weaken the excitonic interaction between the dyes, and this was supported by the absorption
spectra. In case of the “25-0” probe, the short wavelength absorption band did not reduce in
intensity and the longer wavelength absorption band emerged only as a shoulder after the
addition of the fully complementary target, which indicates that the excitonic interaction was not
sufficiently disrupted (Figure 5 c-d).
Figure 6. a) Concentration-response showing MFR response to 34mer and 90mer FC target. b) Fluorescence emission spectrum corresponding to a - QD, b - QD-probe conjugate, c-k increasing concentrations of target.
The quantitative response of the assay was investigated using FC targets of 34mer and a 90mer
length. In case of the 34mer target, the response increased linearly with target concentration
ranging from 0.01 μM (2 pmol) to 0.75 μM (150 pmol), corresponding to a dynamic range of one
order of magnitude (Figure 6). The limit of detection (LOD) of the assay was determined
experimentally to be 2 pmol. In case of the 90mer target, the dynamic range, the detection limit
16

and magnitude of the signal was similar to that of the 34mer target (Figure 6). The similarity of
hybridization efficiency of the shorter and longer targets is attributed to the angle of deflection
between the strands provided by the radius of curvature of the nanoparticle interface17. The
increase in distance between the strands on a surface of high curvature reduces steric
interactions, thus facilitating hybridization efficiency17. The quantitative response of the assay
was also investigated in a complex matrix consisting of 75% v/v Goat Serum (Supporting
Information). Despite some reduction of signal intensity, the dynamic range and the limit of
detection were found to be similar to those obtained in buffer solution.
The primary intention of this work was to integrate intercalating dyes into single-stranded
oligonucleotide probes in a manner that could be used for transduction of hybridization by a QD-
FRET mechanism. A further opportunity involving improvement of detection level was
examined. Excitonic interaction between the dye molecules in the doubly labeled probes caused
quenching of the fluorescence, thus reducing background. The resultant increase in the difference
between the signals obtained from the hybridized and the non-hybridized states allowed for
improvement of the limit of detection. There was higher background in the case of the singly
labeled probes, and the LOD was improved by 5 with doubly labeled probes (Supporting
Information). In addition, the sensitivity (slope of response) using the doubly labeled probes was
higher than observed for the singly labeled probes (Supporting Information). The sensitivity of
the configuration containing QDs and doubly labeled probes was also compared to the sensitivity
of a system in the absence of the QDs where the doubly labeled probes were excited directly by
the excitation source (Supporting Information). Results showed a 34% increase in the sensitivity
of the system for probes that were excited using FRET from QD donors, with equivalent LOD,
indicating that the advantages of QD-FRET excitation were achieved without sacrificing
17

analytical performance. In addition, the precision in the measurements were improved in the case
of direct excitation of the doubly labeled probes.
Figure 7. Selectivity of the assay was evaluated by comparing the MFR of FC and a 1BPM target. (a) The mismatch was located next to the labeled nucleotide (Table 1). (b) The absorption spectrum of the 1BPM does not have the characteristic peak of a probe labeled with a single dye molecule at 520 nm. (c) With increasing distance between the mismatch and the dye the signal intensity and the MFR increased.
Single nucleotide polymorphism (SNP) discrimination was used as a proxy to evaluate the
selectivity of the assay. A sequence was chosen for SNP discrimination in which the 1BPM was
located next to the amine modified thymine that was linked to the dye (1BPM-0). The MFR for
this probe was -0.08±0.03, indicating that the analytical signal was lower than the background
18

signal that was observed in the absence of the target (Figure 7a). The magnitude of the MFR was
observed to behave as expected as the distance between the 1BPM was moved by 1 or 2
nucleotides (Figure 7c) away from the amine modified thymine conjugation sites. The formation
of the mismatched base pair in the 1BPM-0 probe results in the decrease in the fluorescence
intensity because the mismatched nucleotide located next to labeled nucleotide serves as a
binding site for the dye9. The mismatched base pair causes the dissociation of the dyes from the
DNA structure by lowering the binding affinity to the DNA. The dissociated dyes form a non-
emissive bichromophoric aggregate which in turn results in the decrease of fluorescence intensity
9, as is evident from the absorption spectrum of the dye in the presence of the 1BPM target where
the characteristic monomeric absorption peak at 520 nm is missing (Figure 7b). The experiment
was repeated in the presence of goat serum. The results showed reduction in signal due to
increase in the background; however, the same trend was observed (Supporting Information,
Figure S3).
CONCLUSIONS
An intrinsically-responsive FRET transduction method to detect hybridization was investigated
using dye labeled oligonucleotide probes that were immobilized on the surface of QDs. Two
commercially available linkers were assessed for concurrent conjugation of two identical
thiazole orange derivatives at various locations on single-stranded probe oligonucleotide. Amino
modified thymine provided for better signal-to-noise in comparison to attachment of dyes to the
phosphate backbone of oligonucleotide probes. It was shown that attachment of the dyes closer
to the QDs did not result in the improvement of the signal for the relatively short oligonucleotide
probes that were used. This was attributed to the possibility that the increase in the FRET
19
efficiency due to decrease in the distance between the donor and acceptor was counteracted by
the decrease in fluorescence intensity due to partial intercalation of the dyes as they were located
near the end of the sequence where the hybrid was labile. The impact of the distance between
the dyes on signal generation was explored. The dyes were attached either next to each other or
separated by one nucleotide. The latter provided for improved signal intensity, as increasing the
distance between the dyes further weakened the excitonic interaction so that they could more
effectively intercalate into the DNA duplex. The system was also assessed for quantitative
response to increasing concentrations of a fully complementary 34mer target and a 90mer target,
indicating pmol detection levels with similar response to both sequences even though they
differed in length. The selectivity of the assay was investigated using a 1BPM target, establishing
that the location of the mismatch was important because the mismatch could serve as an
interaction site for adjacent dyes.
ACKNOWLEDGEMENTS
The authors gratefully acknowledge the Natural Sciences and Engineering Research Council of
Canada (NSERC) for financial support of this research. The authors would also like to thank
Samantha Tabone for technical assistance with some of the research work and for helpful
discussion.
ASSOCIATED CONTENT
Supporting Information
Description of instrumentation used, characterization of the FRET pair and equations used in the
data analysis, gel electrophoresis results, additional absorption spectrum and SNP discrimination
in 75% v/v goat serum solution.
20

REFERENCES
1. Hilal, H.; Taylor, J. A. J. Biochem. Biophys. Methods. 2008, 70, 1104–1108
2. Sang, F.; Ren, J. J. Sep. Sci. 2006, 29, 1275 – 1280
3. Bahrami, A. R.; Dickman, M. J.; Matin, M.M.; John R. Ashby, J. R.; Brown, P. E.; Conroy, M.J.; Fowler,G.J.S.; Rose,J.P.; Sheikh, Q.I.; Yeung, A. T.; Hornby D.P. Anal. Biochem. 2002, 309, 248–252
4. Bengtsson, M.; Karlsson, H. J.; Westman, G.; Kubista, M. Nucl. Acids Res. 2003, 31, e45
5. Chi, C.; Yeh-Hsing Lao, Y.; Li, Y.; Chen, L. Biosens. Bioelectron. 2011, 26, 3346–3352
6. Zhang, H.; Zhou, D.; Chem. Comm. 2012, 48, 5097–5099
7. Kaloyanova, S.; Trusova,V. M.; Gorbenko, G.P.; Deligeorgiev, T. J. Photochem. Photobiol. A: Chem. 2011, 217,147–156
8. Armitage, B. A. Top Curr. Chem. 2005, 253, 55–76
9. Ikeda, S.; Kubota, T.; Kino, K.; Okamoto, A. Bioconjugate Chem. 2008, 19, 1719-1725
10. Ikeda, S.; Kubota, T.; Yuki, M.; Okamoto, A. Angew. Chem. Int. Ed. 2009, 48, 6480 –6484.
11. Skoog, D.A.; West D. M.; Holler F.J.; Crouch S.R. Fundamentals of Analytical Chemistry.
8th ed. Brooks/Cole: 2001, pg 707-875.
12. Noor, O. M.; Shahmuradyan, A.; Krull, U. J. Anal. Chem. 2013, 85, 1860−1867.
13. Noor, O.M.; Tavares, A. J.; Krull, U.J. Anal. Chim. Acta. 2013, 788, 148–157
14. Armitage, B. A. Top Curr. Chem. 2005, 253, 55-76.
15. Kasha, M.; Rawls, R.; El-Bayoumi, M. A. Pure and Appl. Chem. 1965, 11, 371-392.
16. Wanga, D. O.; Okamoto, A. J. Photochem. Photobio. C: Photochem. Rev. 2012, 13, 112– 123
21

17. Noor, O. M.; Hrovat, D.; Moazami-Goudarzi, M.; Espie, G., S.; Anal. Chim. Acta. 2015, 885, 156–165
22