Embed Size (px)
Citation preview
EN EN
EUROPEAN COMMISSION
Brussels, 26.2.2016 SWD(2016) 87 final
COMMISSION STAFF WORKING DOCUMENT
Country Report The Netherlands 2016
Including an In-Depth Review on the prevention and correction of macroeconomic imbalances
This document is a European Commission staff working document. It does not constitute the official position of the Commission, nor does it prejudge any such position.
Executive summary
1. Scene setter: Economic situation and outlook
2. Imbalances, risks, and adjustment issues
2.1. The large positive trade surplus2.2. The saving and investment perspective on the current account surplus2.3. Real and financial spillovers2.4. Private sector indebtedness2.5. The housing market2.6. MIP assessment
3. Additional structural issues
3.1. Taxation, sustainability of public finances and fiscal framework3.2. Labour market, social policies, skills and education3.3. Drivers of growth3.4. Energy, transport and climate policy
A. Overview table
B. MIP Scoreboard indicators
C. Standard tables
LIST OF TABLES1.1. Net lending/borrowing by sector1.2. Key economic, financial and social indicators2.2.1. Income statement of non-financial corporations (2014)2.6.1. MIP assessment matrix (*) - NetherlandsB.1. The MIP scoreboard for the NetherlandsC.1. Financial market indicatorsC.2. Labour market and social indicatorsC.3. Labour market and social indicators (continued)C.4. Structural policy and business environment indicatorsC.5. Green growth
CONTENTS
LIST OF GRAPHS1.1. Real GDP and contributions1.2. Labour market developments1.3. Natural gas production and revenues2.1.1. Breakdown of external position (current and capital accounts)2.1.2. Trade balance in goods per continent2.1.3. Imports and exports of services (2014)2.2.1. Net lending/borrowing per sector2.2.2. NFC saving, investment and net lending2.2.3. Saving per sector2.2.4. Use of net saving, NFCs2.2.5. Net distributed income ratios (2012-2014 average)2.2.6. Corporate income tax burden for NFCs (2014)2.2.7. Household saving and investment rates (% of disposable income)2.2.8. Household balance sheets2.2.9. Pension fund assets over time2.2.10. Investment per sector2.2.11. Gross capital formation by type2.2.12. Credit conditions2.2.13. Net international investment position by sector2.3.1. Exports in value added by destination (2011)2.3.2. Imports by country of origin (2013)2.3.3. Consolidated assets of domestic credit institutions: international claims on immediate
borrower basis2.3.4. EU bank claims on the Netherlands, by sector2.4.1. Private-sector debt in the Netherlands and the EU2.4.2. Household debt ratios2.4.3. Average housing equity (main residence) per age cohort2.4.4. Balance sheet of the non-financial sector2.4.5. Credit demand and supply, loans to NFCs2.4.6. Debt/GDP ratio change and contributions for NFCs (consolidated)2.4.7. Leverage of NFCs2.4.8. NFC loan interest and implicit yield2.4.9. Balance sheet repair, Non-financial corporations (non-consolidated)2.5.1. Evolution of house prices and number of transactions2.5.2. Overvaluation gap with respect to main supply and demand fundamentals2.5.3. Housing price index year-on-year growth in %, Q3 20152.5.4. User cost of owner-occupied housing and contribution of taxes2.5.5. Top marginal tax rate for MID2.5.6. Construction permits issued for rented apartments3.1.1. Compulsory payment wedge, single person earning the average wage (2014)
3.1.2. Debt profile 2011-20263.2.1. Main labour market developments3.2.2. Unemployment and long-term unemployment3.2.3. Long-term unemployment (LTU) of specific groups3.2.4. Inactivity trap for single earner at 50% of average wage3.2.5. Employment by type, year-on-year changes3.2.6. OECD indicators on employment protection legislation (2013)3.2.7. Change in self-employed and self-employment as a share of total employment3.2.8. Take-home pay and labour costs for employees and the self-employed3.2.9. Poverty and social inclusion3.2.10. Education indicators3.3.1. GDP per hour worked (2014)3.3.2. Labour hoarding in the early phase of the crisis3.3.3. Productivity per sector (2014)3.3.4. R&D expenditure by sector (2014)
LIST OF BOXES1.1. Investment challenges1.2. Contribution of the EU budget to structural change2.4.1. Consumer insolvency2.5.1. Mortgage interest deductibility reform in the Netherlands

This country report assesses the economy of the Netherlands in the light of the European Commission’s Annual Growth Survey published on 26 November 2015. The survey recommends three priorities for the EU’s economic and social policy in 2016: re-launching investment, pursuing structural reforms to modernise Member States’ economies, and responsible fiscal policies. At the same time, the Commission published the Alert Mechanism Report that launched the fifth annual round of the macroeconomic imbalance procedure. The Alert Mechanism Report identified the Netherlands as warranting a further in-depth review.
The economy of the Netherlands still bears the hallmarks of its post-crisis experience. While the initial fall in economic output in 2009 was sharp and driven by a collapse in foreign trade and fixed investment, a short-lived recovery set in from 2010 onwards that was punctuated by a renewed decline in GDP in 2012 and 2013. Private consumption declined alongside fixed investment, aggravated by the pronounced downturn in the housing market from 2010 onwards and by rising uncertainty regarding pension benefits and contribution levels in the country's large second pillar pension system. The scars of the recent crisis still remain visible in households spending and fixed investment levels, which in the fourth quarter of 2015 remained 3 % and 5.5 % below their respective pre-crisis peaks.
The economic recovery is firming thanks to stronger domestic demand growth. Following the contraction in real GDP in 2012 and 2013, positive growth of 1.0 % was recorded in 2014 and is projected to have accelerated to 2.0 % in 2015; this growth rate is expected to be maintained in 2016 and 2017. Rising economic confidence, faster wage growth and a housing market recovery are expected to boost domestic demand growth via private consumption and investment. While the labour market continued to improve in 2015, inflation remained very low, but is expected to pick up in the medium term.
The housing market has contributed to a range of macroeconomic imbalances. Owner-occupancy rates have tended to be high in the Netherlands, and this tenure type has long been encouraged by the full tax deductibility of mortgage interest payments. This resulted in a
proliferation of interest-only mortgages in the pre-crisis years, granted to borrowers at very high loan-to-value ratios, creating a strong debt bias that drove up household indebtedness to around 120 % in 2009; although receding gradually, the debt legacy persists. The protracted downturn in house prices also affected household spending and wealth and amplified macroeconomic volatility during the crisis. As households resorted to greater precautionary saving and scaled back residential investment activity, the household became a growing source of net saving between 2009 and 2014. In turn, this form of household deleveraging is the principal reason for the rise in the current account surplus in recent years.
The outlook for the housing market is positive, which may reduce macroeconomic vulnerabilities. A broad improving trend is visible in house prices, transaction volumes and housing investment. Rising house prices may cause positive wealth effects for household spending and investment, and will progressively lift affected households out of negative housing equity (‘underwater mortgages’), thereby reducing their financial loss in case of a forced home sale. Although a housing market recovery is also likely to be accompanied by rising mortgage lending, stricter mortgage lending rules are likely to curb the potential for renewed excesses.
Public finances weathered the crisis comparatively well, but face new challenges. Multi-annual budgetary planning permitted fiscal policy to take a medium-term view on fiscal consolidation needs, and ensured a correction of the previously excessive government deficit by 2013; in the following two years, the government deficit is estimated to have remained broadly stable at around -2.25 % of GDP. However, public investment levels fell by almost 1 pp. of GDP between 2009 and 2014, and have not arrested their decline yet. While plans for an ambitious reform of the Netherlands' tax system have not been put into action, the gradual economic recovery prompted the government in 2015 to adopt measures to boost disposable income from employment via a EUR 5 billion (0.7 % of GDP) package of unfinanced tax reductions. The Netherlands' position as the largest natural gas producer in the EU has kept foreign energy dependency low and boosted public finances, but
1
EXECUTIVE SUMMARY
Executive summary
safety concerns in extraction regions have caused production to be progressively scaled back in 2015. In combination with currently low energy prices, this is likely to reduce fiscal revenues from gas production in the medium term.
Overall, the Netherlands has made limited progress in addressing the 2015 country-specific recommendations. Limited progress has been made in raising public and private R&D expenditure, while some progress has been made in reforming housing market rules. In particular, some progress has been made in ensuring a more market-based pricing mechanism in the rental market, and substantial progress in relating income to social rent payments in the social housing sector. By contrast, the gradual phasing out of mortgage interest deductibility has not been speeded up. Limited progress has been made on the recommendation concerning the pension system, as the government has committed to reforms and initiated consultations, but has not presented concrete reform proposals or legislative plans. Regarding the progress in reaching the national targets under the Europe 2020 Strategy (see also Annex A), the Netherlands is performing well in employment rate, reducing greenhouse gas emissions, energy efficiency, reducing early school leaving and tertiary education attainment, while more effort is needed in R&D investment, renewable energy, and reducing poverty.
The main findings of the in-depth review in this country report, and the related policy challenges, are as follows:
The current account continues to show a marked surplus. The Netherlands has a prominent role as a transit point and re-exporter and the positive trade balance in goods, which rose to 12 % of GDP in 2014, accounts for the entirety of the current account surplus. The steady rise in the current account surplus since 2009 was mainly driven by the fall in domestic investment, particularly in construction, and rising household savings following the financial crisis. Furthermore, a falling fiscal deficit also contributed to pushing the current account surplus to well above its long-term average in recent years.
Surpluses in the non-financial corporate sector explain the high level of the current account surplus, but not its increase. Rising saving levels in the corporate sector played only a minor role in driving up the current account in recent years, while corporate investment has not had a significant influence on the external surplus. High corporate savings are rooted in low levels of profit distribution, and are typically channelled into share buybacks and the acquisition of equity assets. The low levels of corporate profit distribution appear linked to the location of many large multinational enterprises in the Netherlands; the quantitative impact of the ‘headquarters effect’ on the current account surplus is likely to be considerable. The attractiveness of the Netherlands for corporate head offices stems not only from favourable structural factors, such as proximity to large markets, the quality of the labour force and a supportive business environment, but also from favourable legal and taxation frameworks.
Investment declined strongly during the crisis and has recovered only partially since. The weakness in economy wide-investment appears to have a strong cyclical character, and was driven by a downturn in the housing market as well as fiscal consolidation choices. While barriers to investment seem to be minor, low investment in the construction sector and in renewable energy appears linked to market uncertainty and regulatory factors. In spite of improving credit conditions, risks to credit creation are heightened in the current financial environment.
The large second pillar of the pension system plays a central role in shaping household finances and the household saving rate. The rise in recent years in the household saving rate was partly due to higher saving in the second pillar of the pension system (mandatory supplementary private schemes), to which the regulatory environment contributed. Overall, the pension system performs well in terms of quality and adequacy, but has drawbacks in terms of intergenerational fairness, transparency and flexibility. As second pillar pension contributions are high but tend to fluctuate in line with financial market
2
Executive summary
performance, they may affect households’ spending decisions in a pro-cyclical manner.
Levels of private sector debt remain high. High household debt levels have been driven by the build-up of mortgage debt favoured by tax incentives, but household debt ratios are showing signs of decline. A large number of households, especially younger ones, are still in negative housing equity. High mortgage loan-to-value and loan-to-income ratios persist, but are likely to fall gradually due to regulatory action and the rising share of amortising mortgages. In addition to a high financial burden from taxation and mortgage debt, households face relatively high pension contributions. Although households’ financial distress has risen in recent years, it remains limited and has begun to stabilise. Corporate debt indicators suggest falling leverage ratios.
The tax treatment of owner-occupied housing remains generous and encourages mortgage borrowing. Although rules on mortgage interest deductibility have been revised to make them progressively less favourable, the reform reduces the effective subsidy to debt-financed home ownership only to a limited extent. In conjunction with more stringent mortgage lending guidelines, the reforms may nonetheless slow further mortgage debt build-up as the housing market recovers.
Inefficiencies remain in the social housing sector. The social housing sector is relatively large compared to other EU Member States. The joint problems of social tenants whose income exceeds the qualifying threshold (scheefhuurders) and scarcity of social housing are causing long waiting lists and are being tackled only slowly. Moreover, the financial attractiveness of owner-occupancy and social housing partly accounts for the underdeveloped private rental market.
Demand spillovers to other euro area Member States are likely to be moderate. This is primarily due to the small size of the economy relative to the euro area, which also limits its contribution to the aggregate euro area current account surplus to 0.6 pp. of euro area GDP. However, economic developments
in Germany affect the Netherlands, given their strong trade ties. External financial exposure remains relatively large, but has been decreasing substantially since the crisis.
Other key economic issues, which point to particular challenges facing the economy are the following:
The total tax burden on labour is high, but is being addressed by policy measures. A high tax burden on labour can create disincentives to work, especially for the low-skilled and second earners. The authorities have introduced a large package of tax cuts in 2016 (0.7 % of GDP) to lower the tax burden on labour; its impact on growth and employment is expected to be positive.
Rising long-term unemployment and potential segmentation of the labour market are of concern. Total employment rose steadily and the unemployment rate continued to decline in 2015. However, long-term unemployment was still rising in 2015, and employment gains were concentrated in temporary contracts and self-employment. Low transition rates from temporary to permanent contracts pose a risk of labour market segmentation. Self-employed workers are more often under-insured against disability, unemployment and old age, which could affect the sustainability of the social security system in the long run. Age, skill levels and migration background are found to be important determinants of labour market outcomes. In this context, the labour market integration of refugees and migrants poses a challenge.
3
Executive summary
In spite of the strong scientific base, research and development (R&D) spending is lower than that of top performers. The strong education system and scientific base of the Netherlands provides a sound basis for boosting innovation and growth capacity via education and R&D activities. Private investment in R&D remains fairly low, while public investment in R&D is set to decline. Shifting public expenditure towards growth-friendly areas such as R&D and improving conditions to unlock private R&D investment has the potential to improve the Netherlands’ long-term growth potential.
4
The macroeconomic situation and developments
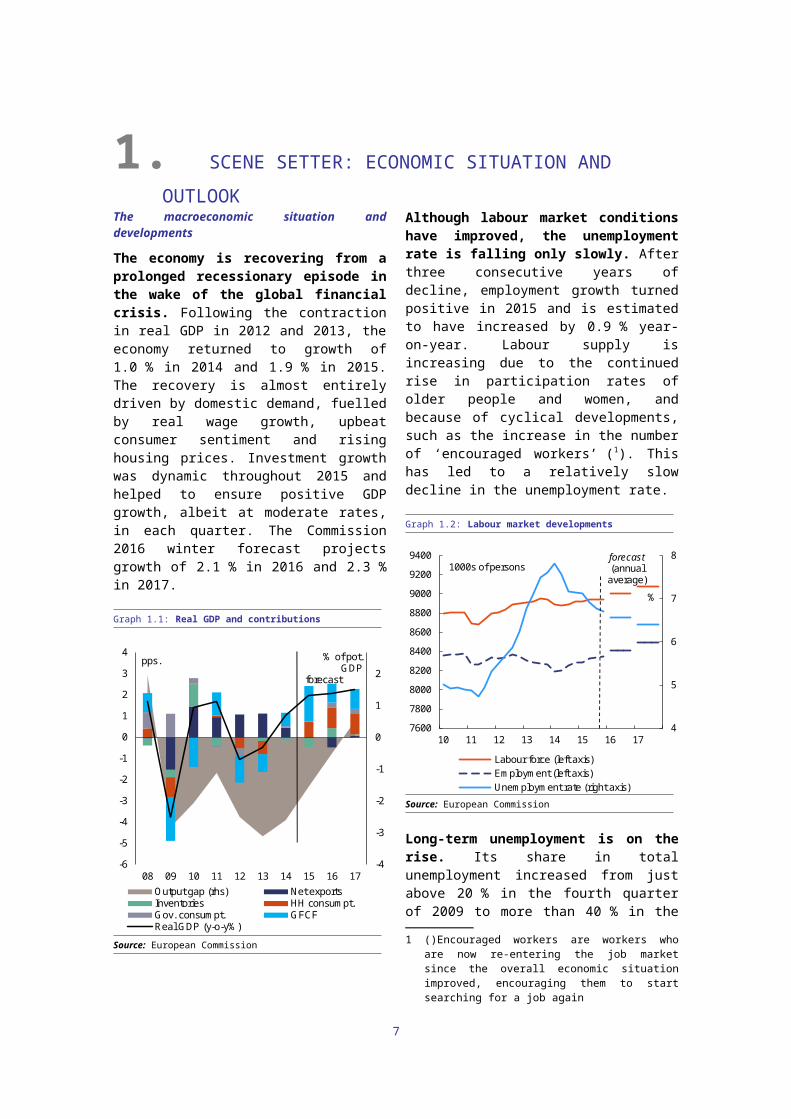
The economy is recovering from a prolonged recessionary episode in the wake of the global financial crisis. Following the contraction in real GDP in 2012 and 2013, the economy returned to growth of 1.0 % in 2014 and 1.9 % in 2015. The recovery is almost entirely driven by domestic demand, fuelled by real wage growth, upbeat consumer sentiment and rising housing prices. Investment growth was dynamic throughout 2015 and helped to ensure positive GDP growth, albeit at moderate rates, in each quarter. The Commission 2016 winter forecast projects growth of 2.1 % in 2016 and 2.3 % in 2017.
Graph 1.1: Real GDP and contributions
-4
-3
-2
-1
0
1
2
-6
-5
-4
-3
-2
-1
0
1
2
3
4
08 09 10 11 12 13 14 15 16 17
pps.
Output gap (rhs) Net exportsInventories HH consumpt.Gov. consumpt. GFCFReal GDP (y-o-y%)
forecast
% of pot. GDP
Source: European Commission
Although labour market conditions have improved, the unemployment rate is falling only slowly. After three consecutive years of decline, employment growth turned positive in 2015 and is estimated to have increased by 0.9 % year-on-year. Labour supply is increasing due to the continued rise in participation rates of older people and women, and because of cyclical developments, such as the increase in the number of ‘encouraged
workers’ (1). This has led to a relatively slow decline in the unemployment rate.
Graph 1.2: Labour market developments
4
5
6
7
8
7600
7800
8000
8200
8400
8600
8800
9000
9200
9400
10 11 12 13 14 15 16 17
Labour force (left axis)Employment (left axis)Unemployment rate (right axis)
forecast(annual
average)
%
1000s of persons
Source: European Commission
Long-term unemployment is on the rise. Its share in total unemployment increased from just above 20 % in the fourth quarter of 2009 to more than 40 % in the third quarter of 2015. Around 40 % of the long-term unemployed are above the age of 50, compared with 25 % in the EU on average. There has been a slow adjustment process after the protracted recession, but there are also signs that labour market prospects for older unemployed people are impaired by relatively high reservation wages, in combination with a lack of effective activation and reintegration programmes (2).
Like other Member States the Netherlands was confronted with a relatively large inflow of refugees and migrants. The Netherlands received 56 900 refugees in 2015, equivalent to 0.3 % of the total population. At a local level integration may pose challenges if not managed well, for example by creating strains on public services. But from a macroeconomic perspective, in the longer term
1 ()Encouraged workers are workers who are now re-entering the job market since the overall economic situation improved, encouraging them to start searching for a job again
2 ()De Graaf-Zijl, Van der Horst et al. (2015) ‘Long-term Unemployment in the Netherlands’ CPB Policy Brief 2015/11, http://www.cpb.nl/en/publication/long-term-unemployment-in-the-netherlands.
5
1. SCENE SETTER: ECONOMIC SITUATION AND OUTLOOK

1. Scene setter: Economic situation and outlook
migration flows could be positive on balance through their impact on labour supply if they integrate well in the labour market (3).
Consumer price inflation is expected to rise from its currently low rate, although further exchange rate and oil price volatility is possible. Inflation as measured by the harmonised index of consumer prices stood at 0.3 % in 2014 and 0.2 % in 2015. Upward pressure on inflation is likely to build during 2016 due to accelerating wage growth and the closing of the output gap. The tightening of spare capacity is expected to contribute to inflation rising to 0.9 % in 2016 and further to 1.5 % in 2017.
The current account surplus of the Netherlands has been slowly decreasing since 2013 and stood at 10.3 % of GDP in 2015, based on the Commission 2016 winter forecast. Of the euro area countries, the Netherlands has the largest current account surplus in terms of GDP. As a proportion of euro area GDP, the surplus has fallen, to 0.6 % in 2015, while Germany’s current account surplus has increased to 2.3 % of euro area GDP. Structural features of the economy, such as the port of Rotterdam’s role in transit and re-exporting and the high number of multinational enterprises in the country, exert an upward bias on the Netherlands’s current account. However, the anticipated firming of domestic demand growth is expected to dampen the external surplus slightly in the coming years. The cyclical element of the current account surplus is estimated to have declined from 1.6 % of GDP in 2013 to 0.3 % in 2015.
The high current account surplus is the result of high saving rates of households and the corporate sector. Driven by deleveraging pressures, collective saving in pension schemes and recovering gross disposable income, the household saving rate is expected to peak at 4 % of GDP in 2016. Real disposable household income is on the rise, thanks to better labour market conditions, real wage increases and a boost from fiscal stimulus measures in 2016 (a sizeable tax cut of around 0.7 % of GDP). With a delay, the increase in disposable income is likely to feed into
3 ()See Box 1.1 A first assessment of the macroeconomic impact of the refugee influx in European Economic Forecast Autumn 2015. November 2015.
private consumption. This is expected to put downward pressure on the saving rate of households. Nevertheless, as a legacy of long-standing fiscal incentives to debt-finances home ownership and the credit-driven housing boom that started in the 1990s, households remain highly indebted. Deleveraging pressures will therefore continue to work on the economy, making a rapid decline in the household saving rate unlikely.
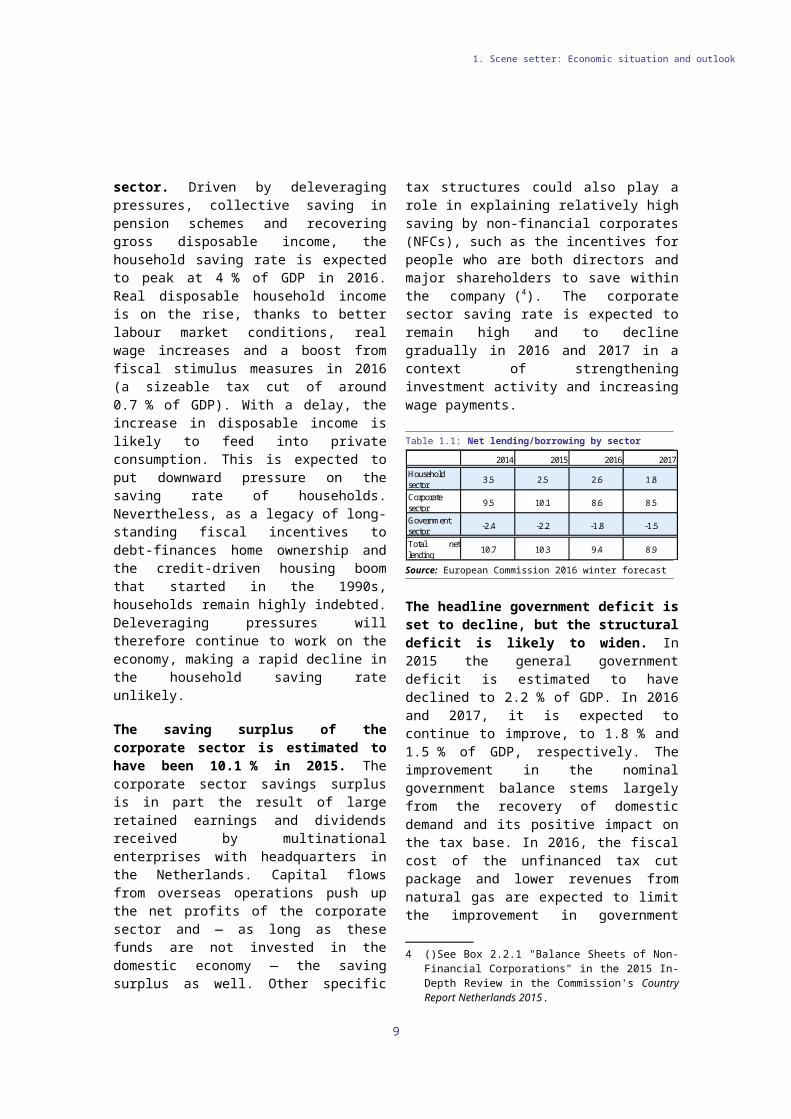
The saving surplus of the corporate sector is estimated to have been 10.1 % in 2015. The corporate sector savings surplus is in part the result of large retained earnings and dividends received by multinational enterprises with headquarters in the Netherlands. Capital flows from overseas operations push up the net profits of the corporate sector and — as long as these funds are not invested in the domestic economy — the saving surplus as well. Other specific tax structures could also play a role in explaining relatively high saving by non-financial corporates (NFCs), such as the incentives for people who are both directors and major shareholders to save within the company (4). The corporate sector saving rate is expected to remain high and to decline gradually in 2016 and 2017 in a context of strengthening investment activity and increasing wage payments.
Table 1.1: Net lending/borrowing by sector2014 2015 2016 2017
Household sector 3.5 2.5 2.6 1.8
Corporate sector 9.5 10.1 8.6 8.5
Government sector -2.4 -2.2 -1.8 -1.5
Total netlending 10.7 10.3 9.4 8.9
Source: European Commission 2016 winter forecast
The headline government deficit is set to decline, but the structural deficit is likely to widen. In 2015 the general government deficit is estimated to have declined to 2.2 % of GDP. In 2016 and 2017, it is expected to continue to improve, to 1.8 % and 1.5 % of GDP, respectively. The improvement in the nominal government balance stems largely from the recovery of domestic demand and its positive impact on the tax base. In 2016, the fiscal cost of the unfinanced tax
4 ()See Box 2.2.1 "Balance Sheets of Non-Financial Corporations" in the 2015 In-Depth Review in the Commission's Country Report Netherlands 2015.
6
1. Scene setter: Economic situation and outlook
cut package and lower revenues from natural gas are expected to limit the improvement in government finances. The structural deficit is estimated at 1.2 % of GDP in 2015, and is expected to deteriorate by 0.5 pp. to 1.7 % in 2016. The gross government debt ratio is forecast at 66.8 % in 2015, and expected to decrease due to favourable trends in nominal GDP growth and relatively low interest expenditure in 2016 and 2017.
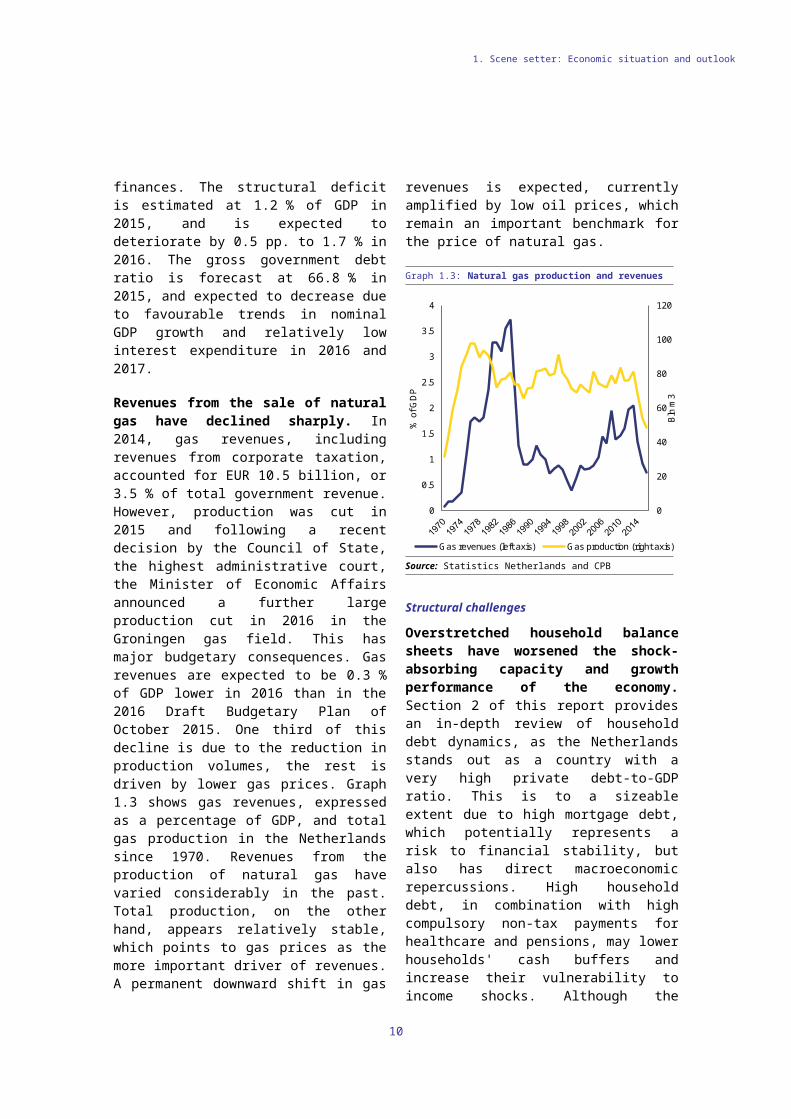
Revenues from the sale of natural gas have declined sharply. In 2014, gas revenues, including revenues from corporate taxation, accounted for EUR 10.5 billion, or 3.5 % of total government revenue. However, production was cut in 2015 and following a recent decision by the Council of State, the highest administrative court, the Minister of Economic Affairs announced a further large production cut in 2016 in the Groningen gas field. This has major budgetary consequences. Gas revenues are expected to be 0.3 % of GDP lower in 2016 than in the 2016 Draft Budgetary Plan of October 2015. One third of this decline is due to the reduction in production volumes, the rest is driven by lower gas prices. Graph 1.3 shows gas revenues, expressed as a percentage of GDP, and total gas production in the Netherlands since 1970. Revenues from the production of natural gas have varied considerably in the past. Total production, on the other hand, appears relatively stable, which points to gas prices as the more important driver of revenues. A permanent downward shift in gas revenues is expected, currently amplified by low oil prices, which remain an important benchmark for the price of natural gas.
Graph 1.3: Natural gas production and revenues
0
20
40
60
80
100
120
0
0.5
1
1.5
2
2.5
3
3.5
4
Bln
m3
% o
f GD
P
Gas revenues (left axis) Gas production (right axis)
Source: Statistics Netherlands and CPB
Structural challenges
Overstretched household balance sheets have worsened the shock-absorbing capacity and growth performance of the economy. Section 2 of this report provides an in-depth review of household debt dynamics, as the Netherlands stands out as a country with a very high private debt-to-GDP ratio. This is to a sizeable extent due to high mortgage debt, which potentially represents a risk to financial stability, but also has direct macroeconomic repercussions. High household debt, in combination with high compulsory non-tax payments for healthcare and pensions, may lower households' cash buffers and increase their vulnerability to income shocks. Although the economy weathered the initial impact of the crisis relatively well, the second dip in growth between 2011 and 2013 was more pronounced than in many other EU Member States, as declining house and stock prices gave rise to negative wealth effects that weighed on domestic consumption.
The government has implemented important housing market reforms aimed at reducing household imbalances, but policy-induced distortions remain. In 2013, a set of relevant housing market measures was introduced, including a partial and gradual reduction in mortgage interest deductibility (MID) and its restriction to fully amortising mortgage loans with
7
1. Scene setter: Economic situation and outlook
a maximum duration of 30 years. Maximum loan-to-value ratios are being gradually reduced to 100 in 2018 and maximum loan-to-income ratios have become stricter. Although new buyers are arguably less vulnerable to shocks, these reforms do not fully eliminate the substantial tax incentives that drove up mortgage indebtedness. Furthermore, mortgage interest deductibility distorts decisions on whether to buy or rent, potentially creating allocative inefficiencies. Moreover, given the low elasticity of housing supply, strong fiscal incentives to home ownership push up house prices, thereby fuelling mortgage debt growth and worsening affordability.
Excess saving in the corporate sector may weigh on future growth prospects. The Netherlands is a large exporter of financial capital to the rest of the world, as reflected in the large current account surplus, which is examined in the in-depth review in section 2 of this report. Compared with gross corporate savings, corporate investment is low. Although the activities of multinationals play an important role, the large savings surplus may also indicate a lack of investment opportunities in the domestic economy.
Increasing labour market segmentation may weigh on the quality of job matching and productivity growth. Subsection 3.2 shows that labour market divisions between permanent and non-permanent employees, as well as self-employment, are increasing. In the third quarter of 2015, four out of ten working people held a temporary contract or worked as self-employed, up from three out of ten in 2005. The Netherlands is among the EU Member States with the highest incidence of flexible work arrangements. Although flexible labour contracts could increase the efficiency of the labour market, this may come at the price of lower overall employment security and lower incentives to invest in firm-specific human capital. Transition rates from temporary to permanent employment have declined, the wage premium for permanent contracts is large and long-term unemployment has increased. These are signs that labour market mobility is stalling, which could hold back productivity growth.
The Netherlands scores below potential with regard to some drivers of productivity growth such as R&D investment. Subsection 3.3 assesses
structural economic policy settings and analyses productivity developments. The Netherlands combines a relatively high level of productivity with very low post-crisis productivity growth. GDP per hour worked increased by only 0.2 % on average between 2008 and 2014. Although trade integration is high and the business environment is generally supportive, investment in R&D is relatively low. Total R&D intensity currently stands at 2 % of GDP, below the Europe 2020 target and below top performers, which are countries with a similar level of development. The Netherlands has a high-quality scientific base and research infrastructure, and operates at the ‘productivity frontier’ in many sectors. As productivity improvements at the knowledge frontier are typically being made through innovation, boosting investment in R&D has the potential to pay off in terms of productivity growth.
8
1. Scene setter: Economic situation and outlook
Box 1.1: Investment challenges
Macroeconomic perspective
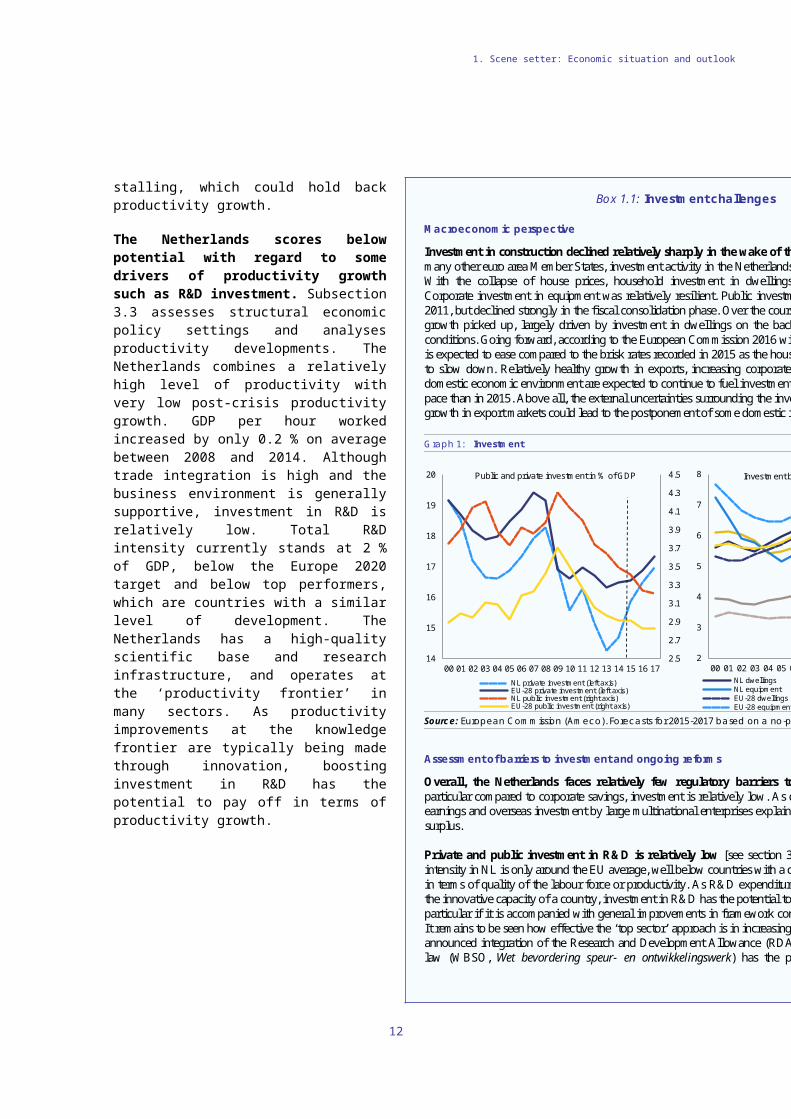
Investment in construction declined relatively sharply in the wake of the housing market crisis. As in many other euro area Member States, investment activity in the Netherlands declined in the recession years. With the collapse of house prices, household investment in dwellings declined particularly sharply. Corporate investment in equipment was relatively resilient. Public investment peaked in the period 2009-2011, but declined strongly in the fiscal consolidation phase. Over the course of 2014 and 2015, investment growth picked up, largely driven by investment in dwellings on the back of improving housing market conditions. Going forward, according to the European Commission 2016 winter forecast, investment growth is expected to ease compared to the brisk rates recorded in 2015 as the housing market recovery is expected to slow down. Relatively healthy growth in exports, increasing corporate value added and the improved domestic economic environment are expected to continue to fuel investment in equipment, albeit at a slower pace than in 2015. Above all, the external uncertainties surrounding the investment forecast are large; lower growth in export markets could lead to the postponement of some domestic investment.
Graph 1: Investment
Source: European Commission (Ameco). Forecasts for 2015-2017 based on a no-policy-change assumption.
Assessment of barriers to investment and ongoing reforms
Overall, the Netherlands faces relatively few regulatory barriers to investment. Nevertheless, in particular compared to corporate savings, investment is relatively low. As discussed in section 2.2 retained earnings and overseas investment by large multinational enterprises explain a substantial part of the savings surplus.
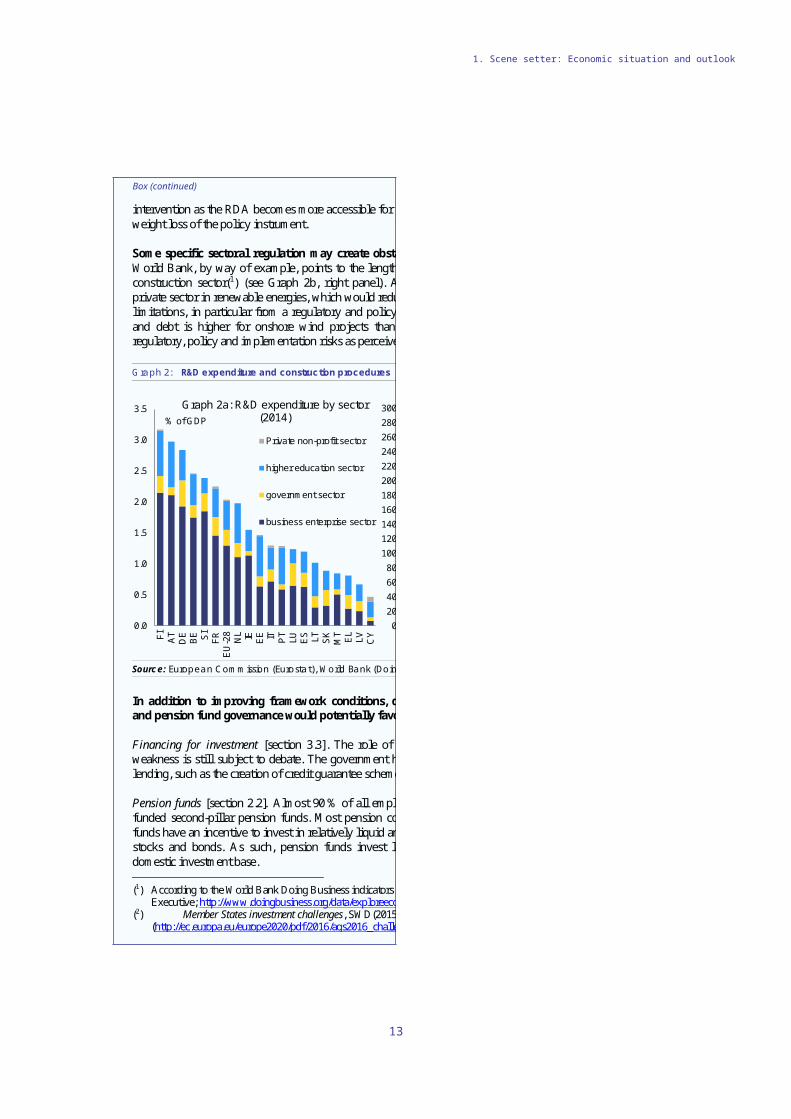
Private and public investment in R&D is relatively low [see section 3.3]. Graph 2a shows that R&D intensity in NL is only around the EU average, well below countries with a comparable level of development in terms of quality of the labour force or productivity. As R&D expenditure bears a close relationship with the innovative capacity of a country, investment in R&D has the potential to increase productivity growth, in particular if it is accompanied with general improvements in framework conditions for productivity growth. It remains to be seen how effective the ‘top sector’ approach is in increasing private sector R&D efforts. The announced integration of the Research and Development Allowance (RDA, R&D aftrek) into the relevant law (WBSO, Wet bevordering speur- en ontwikkelingswerk) has the potential to improve the policy
2.5
2.7
2.9
3.1
3.3
3.5
3.7
3.9
4.1
4.3
4.5
14
15
16
17
18
19
20
00 01 02 03 04 05 06 07 08 09 10 11 12 13 14 15 16 17
Public and private investment in % of GDP
NL private investment (left axis)EU-28 private investment (left axis)NL public investment (right axis)EU-28 public investment (right axis)
2
3
4
5
6
7
8
00 01 02 03 04 05 06 07 08 09 10 11 12 13 14 15 16 17
Investment by components as % of GDP
NL dwellings NL other constructionNL equipment NL otherEU-28 dwellings EU-28 other constructionEU-28 equipment EU-28 other
9
1. Scene setter: Economic situation and outlook
Box (continued)
intervention as the RDA becomes more accessible for young innovative companies, and it reduces the dead-weight loss of the policy instrument.
Some specific sectoral regulation may create obstacles to investment [see sections 3.3 and 3.4]. The World Bank, by way of example, points to the lengthy procedure for dealing with building permits in the construction sector(1) (see Graph 2b, right panel). Also, conditions for mobilising investment from the private sector in renewable energies, which would reduce the Netherland’s energy dependency, have several limitations, in particular from a regulatory and policy clarity and planning perspective. The cost of equity and debt is higher for onshore wind projects than for offshore projects, which might reflect mostly regulatory, policy and implementation risks as perceived by market participants(2).
Graph 2: R&D expenditure and construction procedures
Source: European Commission (Eurostat), World Bank (Doing Business Indicators)
In addition to improving framework conditions, direct policy interventions on corporate financing and pension fund governance would potentially favour investment activity.
Financing for investment [section 3.3]. The role of weak credit demand and supply in explaining loan weakness is still subject to debate. The government has taken a number of specific measures to stimulate lending, such as the creation of credit guarantee schemes. Box 3.3.1 describes these in detail.
Pension funds [section 2.2]. Almost 90 % of all employees in the Netherlands save for retirement through funded second-pillar pension funds. Most pension contracts are ‘defined benefit’. Consequently, pension funds have an incentive to invest in relatively liquid and low-risk instruments, such as internationally traded stocks and bonds. As such, pension funds invest largely overseas potentially negatively affecting the domestic investment base. (1) According to the World Bank Doing Business indicators it takes 98 days to submit a building permit to the Municipal
Executive; http://www.doingbusiness.org/data/exploreeconomies/netherlands/#dealing-with-construction-permits. (2) Member States investment challenges, SWD(2015) 400 final/2
(http://ec.europa.eu/europe2020/pdf/2016/ags2016_challenges_ms_investment_environments_en.pdf) .
020406080
100120140160180200220240260280300
FI DK
US
DE
EE LT PT
SE EL IE CH LU NL
LV HU FR ES AT SI IT C
ZR
O SK
Graph 2b: Days to comply with formalities to build a warehouse (2015)
0.0
0.5
1.0
1.5
2.0
2.5
3.0
3.5
FI AT
DE
BE SI
FRE
U-2
8N
L IE EE IT PT
LU ES LT SK
MT EL
LV CY
% of GDP
Graph 2a: R&D expenditure by sector (2014)
Private non-profit sector
higher education sector
government sector
business enterprise sector
10
1. Scene setter: Economic situation and outlook
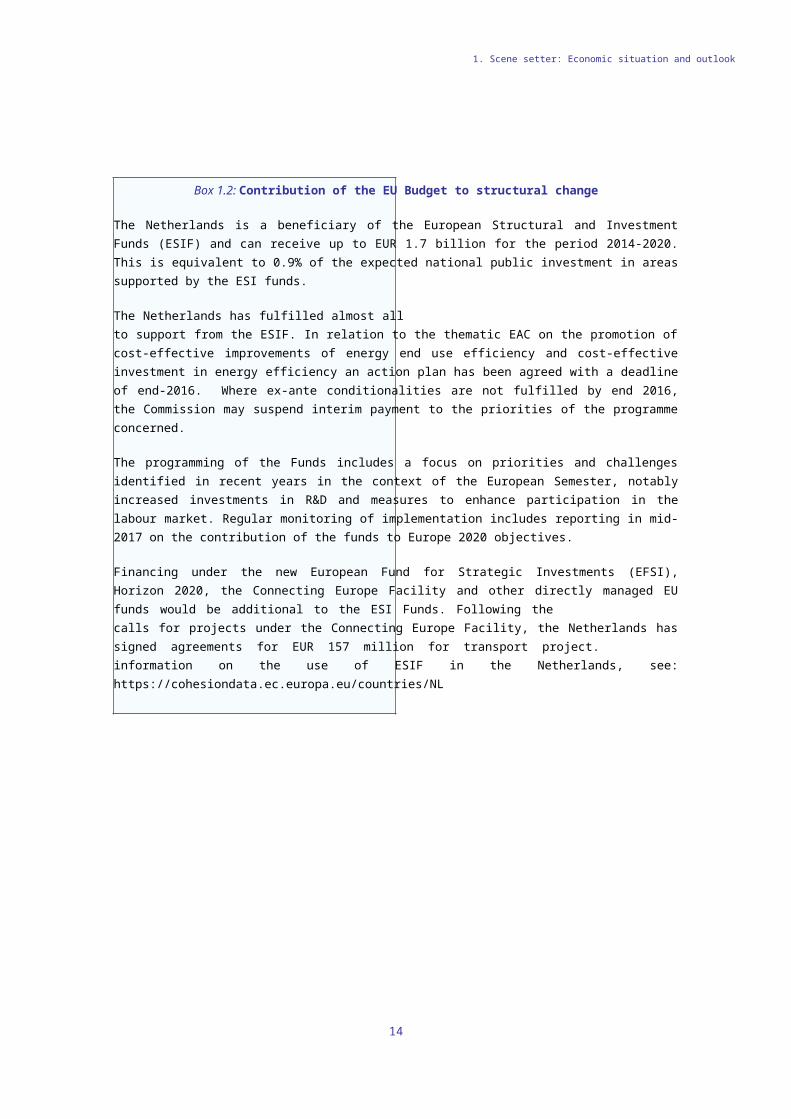
Box 1.2: Contribution of the EU Budget to structural change
The Netherlands is a beneficiary of the European Structural and Investment Funds (ESIF) and can receive up to EUR 1.7 billion for the period 2014-2020. This is equivalent to 0.9% of the expected national public investment in areas supported by the ESI funds.
The Netherlands has fulfilled almost all ex ante conditionalities (EACs) related to support from the ESIF. In relation to the thematic EAC on the promotion of cost-effective improvements of energy end use efficiency and cost-effective investment in energy efficiency an action plan has been agreed with a deadline of end-2016. conditionalities are not fulfilled by end 2016, the Commission may suspend interim payment to the priorities of the programme concerned.
The programming of the Funds includes a focus on priorities and challenges identified in recent years in the context of the European Semester, notably increased investments in R&D and measures to enhance participation in the labour market. Regular monitoring of implementation includes reporting in mid-2017 on the contribution of the funds to Europe 2020 objectives.
Financing under the new European Fund for Strategic Investments (EFSI), Horizon 2020, the Connecting Europe Facility and other directly managed EU funds would be additional to the ESI Funds. Following the calls for projects under the Connecting Europe Facility, the Netherlands has signed agreements for EUR 157 million for transport project. For more information on the use of ESIF in the Netherlands, see: https://cohesiondata.ec.europa.eu/countries/NL.
11
1. Scene setter: Economic situation and outlook
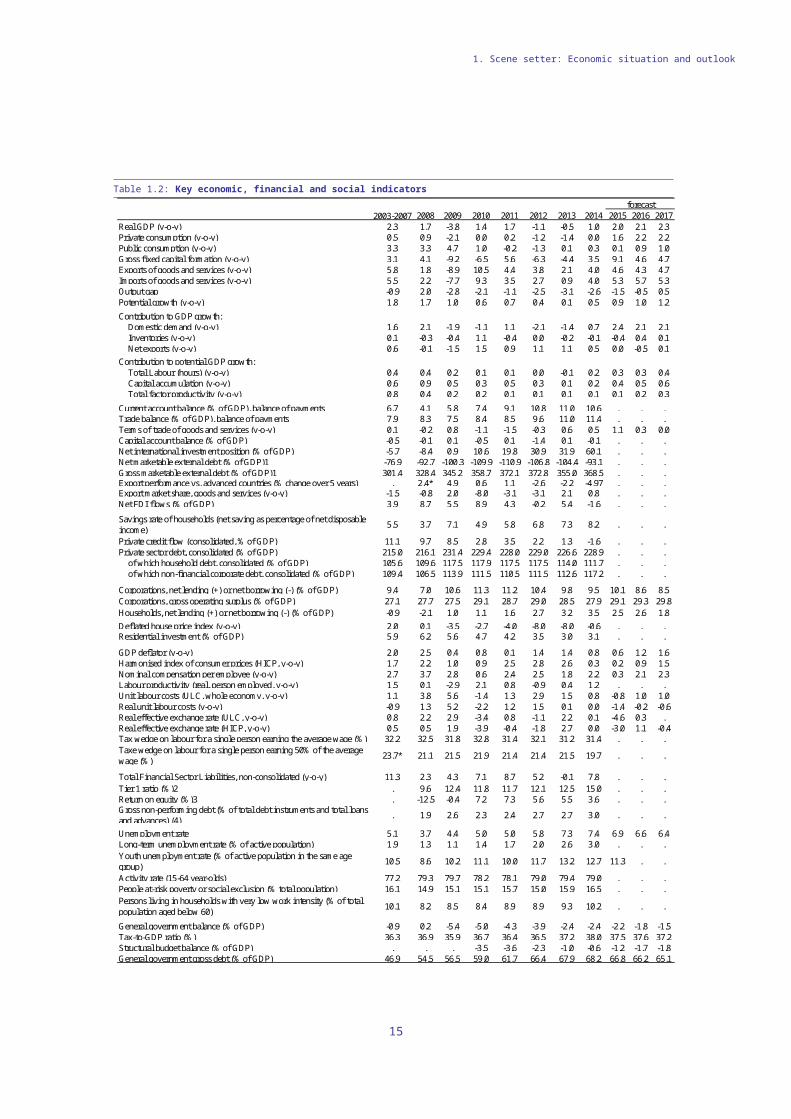
Table 1.2: Key economic, financial and social indicators
2003-2007 2008 2009 2010 2011 2012 2013 2014 2015 2016 2017Real GDP (y-o-y) 2.3 1.7 -3.8 1.4 1.7 -1.1 -0.5 1.0 2.0 2.1 2.3Private consumption (y-o-y) 0.5 0.9 -2.1 0.0 0.2 -1.2 -1.4 0.0 1.6 2.2 2.2Public consumption (y-o-y) 3.3 3.3 4.7 1.0 -0.2 -1.3 0.1 0.3 0.1 0.9 1.0Gross fixed capital formation (y-o-y) 3.1 4.1 -9.2 -6.5 5.6 -6.3 -4.4 3.5 9.1 4.6 4.7Exports of goods and services (y-o-y) 5.8 1.8 -8.9 10.5 4.4 3.8 2.1 4.0 4.6 4.3 4.7Imports of goods and services (y-o-y) 5.5 2.2 -7.7 9.3 3.5 2.7 0.9 4.0 5.3 5.7 5.3Output gap -0.9 2.0 -2.8 -2.1 -1.1 -2.5 -3.1 -2.6 -1.5 -0.5 0.5Potential growth (y-o-y) 1.8 1.7 1.0 0.6 0.7 0.4 0.1 0.5 0.9 1.0 1.2Contribution to GDP growth:
Domestic demand (y-o-y) 1.6 2.1 -1.9 -1.1 1.1 -2.1 -1.4 0.7 2.4 2.1 2.1Inventories (y-o-y) 0.1 -0.3 -0.4 1.1 -0.4 0.0 -0.2 -0.1 -0.4 0.4 0.1Net exports (y-o-y) 0.6 -0.1 -1.5 1.5 0.9 1.1 1.1 0.5 0.0 -0.5 0.1
Contribution to potential GDP growth:Total Labour (hours) (y-o-y) 0.4 0.4 0.2 0.1 0.1 0.0 -0.1 0.2 0.3 0.3 0.4Capital accumulation (y-o-y) 0.6 0.9 0.5 0.3 0.5 0.3 0.1 0.2 0.4 0.5 0.6Total factor productivity (y-o-y) 0.8 0.4 0.2 0.2 0.1 0.1 0.1 0.1 0.1 0.2 0.3
Current account balance (% of GDP), balance of payments 6.7 4.1 5.8 7.4 9.1 10.8 11.0 10.6 . . .Trade balance (% of GDP), balance of payments 7.9 8.3 7.5 8.4 8.5 9.6 11.0 11.4 . . .Terms of trade of goods and services (y-o-y) 0.1 -0.2 0.8 -1.1 -1.5 -0.3 0.6 0.5 1.1 0.3 0.0Capital account balance (% of GDP) -0.5 -0.1 0.1 -0.5 0.1 -1.4 0.1 -0.1 . . .Net international investment position (% of GDP) -5.7 -8.4 0.9 10.6 19.8 30.9 31.9 60.1 . . .Net marketable external debt (% of GDP)1 -76.9 -92.7 -100.3 -109.9 -110.9 -106.8 -104.4 -93.1 . . .Gross marketable external debt (% of GDP)1 301.4 328.4 345.2 358.7 372.1 372.8 355.0 368.5 . . .Export performance vs. advanced countries (% change over 5 years) . 2.4* 4.9 0.6 1.1 -2.6 -2.2 -4.97 . . .Export market share, goods and services (y-o-y) -1.5 -0.8 2.0 -8.0 -3.1 -3.1 2.1 0.8 . . .Net FDI flows (% of GDP) 3.9 8.7 5.5 8.9 4.3 -0.2 5.4 -1.6 . . .
Savings rate of households (net saving as percentage of net disposable income) 5.5 3.7 7.1 4.9 5.8 6.8 7.3 8.2 . . .
Private credit flow (consolidated, % of GDP) 11.1 9.7 8.5 2.8 3.5 2.2 1.3 -1.6 . . .Private sector debt, consolidated (% of GDP) 215.0 216.1 231.4 229.4 228.0 229.0 226.6 228.9 . . .
of which household debt, consolidated (% of GDP) 105.6 109.6 117.5 117.9 117.5 117.5 114.0 111.7 . . .of which non-financial corporate debt, consolidated (% of GDP) 109.4 106.5 113.9 111.5 110.5 111.5 112.6 117.2 . . .
Corporations, net lending (+) or net borrowing (-) (% of GDP) 9.4 7.0 10.6 11.3 11.2 10.4 9.8 9.5 10.1 8.6 8.5Corporations, gross operating surplus (% of GDP) 27.1 27.7 27.5 29.1 28.7 29.0 28.5 27.9 29.1 29.3 29.8Households, net lending (+) or net borrowing (-) (% of GDP) -0.9 -2.1 1.0 1.1 1.6 2.7 3.2 3.5 2.5 2.6 1.8Deflated house price index (y-o-y) 2.0 0.1 -3.5 -2.7 -4.0 -8.0 -8.0 -0.6 . . .Residential investment (% of GDP) 5.9 6.2 5.6 4.7 4.2 3.5 3.0 3.1 . . .
GDP deflator (y-o-y) 2.0 2.5 0.4 0.8 0.1 1.4 1.4 0.8 0.6 1.2 1.6Harmonised index of consumer prices (HICP, y-o-y) 1.7 2.2 1.0 0.9 2.5 2.8 2.6 0.3 0.2 0.9 1.5Nominal compensation per employee (y-o-y) 2.7 3.7 2.8 0.6 2.4 2.5 1.8 2.2 0.3 2.1 2.3Labour productivity (real, person employed, y-o-y) 1.5 0.1 -2.9 2.1 0.8 -0.9 0.4 1.2 . . .Unit labour costs (ULC, whole economy, y-o-y) 1.1 3.8 5.6 -1.4 1.3 2.9 1.5 0.8 -0.8 1.0 1.0Real unit labour costs (y-o-y) -0.9 1.3 5.2 -2.2 1.2 1.5 0.1 0.0 -1.4 -0.2 -0.6Real effective exchange rate (ULC, y-o-y) 0.8 2.2 2.9 -3.4 0.8 -1.1 2.2 0.1 -4.6 0.3 .Real effective exchange rate (HICP, y-o-y) 0.5 0.5 1.9 -3.9 -0.4 -1.8 2.7 0.0 -3.0 1.1 -0.4Tax wedge on labour for a single person earning the average wage (%) 32.2 32.5 31.8 32.8 31.4 32.1 31.2 31.4 . . .Taxe wedge on labour for a single person earning 50% of the average wage (%) 23.7* 21.1 21.5 21.9 21.4 21.4 21.5 19.7 . . .
Total Financial Sector Liabilities, non-consolidated (y-o-y) 11.3 2.3 4.3 7.1 8.7 5.2 -0.1 7.8 . . .Tier 1 ratio (%)2 . 9.6 12.4 11.8 11.7 12.1 12.5 15.0 . . .Return on equity (%)3 . -12.5 -0.4 7.2 7.3 5.6 5.5 3.6 . . .Gross non-performing debt (% of total debt instruments and total loans and advances) (4) . 1.9 2.6 2.3 2.4 2.7 2.7 3.0 . . .
Unemployment rate 5.1 3.7 4.4 5.0 5.0 5.8 7.3 7.4 6.9 6.6 6.4Long-term unemployment rate (% of active population) 1.9 1.3 1.1 1.4 1.7 2.0 2.6 3.0 . . .Youth unemployment rate (% of active population in the same age group) 10.5 8.6 10.2 11.1 10.0 11.7 13.2 12.7 11.3 . .
Activity rate (15-64 year-olds) 77.2 79.3 79.7 78.2 78.1 79.0 79.4 79.0 . . .People at-risk poverty or social exclusion (% total population) 16.1 14.9 15.1 15.1 15.7 15.0 15.9 16.5 . . .Persons living in households with very low work intensity (% of total population aged below 60) 10.1 8.2 8.5 8.4 8.9 8.9 9.3 10.2 . . .
General government balance (% of GDP) -0.9 0.2 -5.4 -5.0 -4.3 -3.9 -2.4 -2.4 -2.2 -1.8 -1.5Tax-to-GDP ratio (%) 36.3 36.9 35.9 36.7 36.4 36.5 37.2 38.0 37.5 37.6 37.2Structural budget balance (% of GDP) . . . -3.5 -3.6 -2.3 -1.0 -0.6 -1.2 -1.7 -1.8General government gross debt (% of GDP) 46.9 54.5 56.5 59.0 61.7 66.4 67.9 68.2 66.8 66.2 65.1
forecast
12
1. Scene setter: Economic situation and outlook
(1) Sum of portfolio debt instruments, other investment and reserve assets; (2, 3) Domestic banking groups and stand-alone banks; (4) Domestic banking groups and stand-alone banks, foreign (EU and non-EU) controlled subsidiaries and foreign (EU and non-EU) controlled branches; (*) Indicates BPM5 and/or ESA95Source: European Commission winter forecast 2016; ECB
13
This section provides the in-depth review required under the macroeconomic imbalance procedure (MIP) (5). It focuses on the risks and vulnerabilities flagged in the Alert Mechanism Report 2016. The section analyses the reasons behind the relatively high current account surplus, both from a trade perspective as well as a saving and investment view. Potential spillovers between the economy of the Netherlands and the rest of the world via trade linkages and financial market exposures are investigated. Moreover, the high private-sector indebtedness is examined, which is linked to taxation incentives. In the context of high household indebtedness, recent developments and structural aspects of the housing market are reviewed. The section concludes with the MIP assessment matrix, which summarises the main findings.
2.1. THE LARGE POSITIVE TRADE SURPLUS
The current account surplus is still hovering around 10 % of GDP. According to the macroeconomic imbalance procedure (MIP) scoreboard, the current account surplus fell marginally to 10.6 % of GDP in 2014 from 11 % in 2013. The three-year average of the current account balance for 2012-2014 was 10.9 % of GDP. The contribution to the euro area current account surplus decreased slightly to 0.6 pp. of euro area GDP in the third quarter of 2015 (by way of comparison, the German contribution increased to 2.3 % of euro area GDP). The long-term average of the current account surplus has been around 6 % of GDP for the past three decades. Based on Commission calculations, the surplus has been substantially above the estimated benchmark for the Netherlands for the past six years (6). This gap increased between 2009 and 2013, but narrowed slightly in 2014. According to Commission calculations, one third of the increase in the current account balance between 2008 and 2014 can be explained by deleveraging in the
5 ()According to Article 5 of Regulation (EU) No 1176/2011.6 ()The benchmark is derived from reduced-form regressions
capturing the main determinants of the saving/investment balance, including fundamental determinants (e.g. demography, resources), policy factors and global financial conditions. The methodology is akin to the External Balance Assessment (EBA) approach developed by the IMF: https://www.imf.org/external/np/res/eba.
private sector, the increasing net international investment position and the cyclical position of the economy. The results are broadly in line with the IMF External Balance Assessment, which expects the current account surplus to decline in the medium term, supported by a recovery in domestic demand (7).
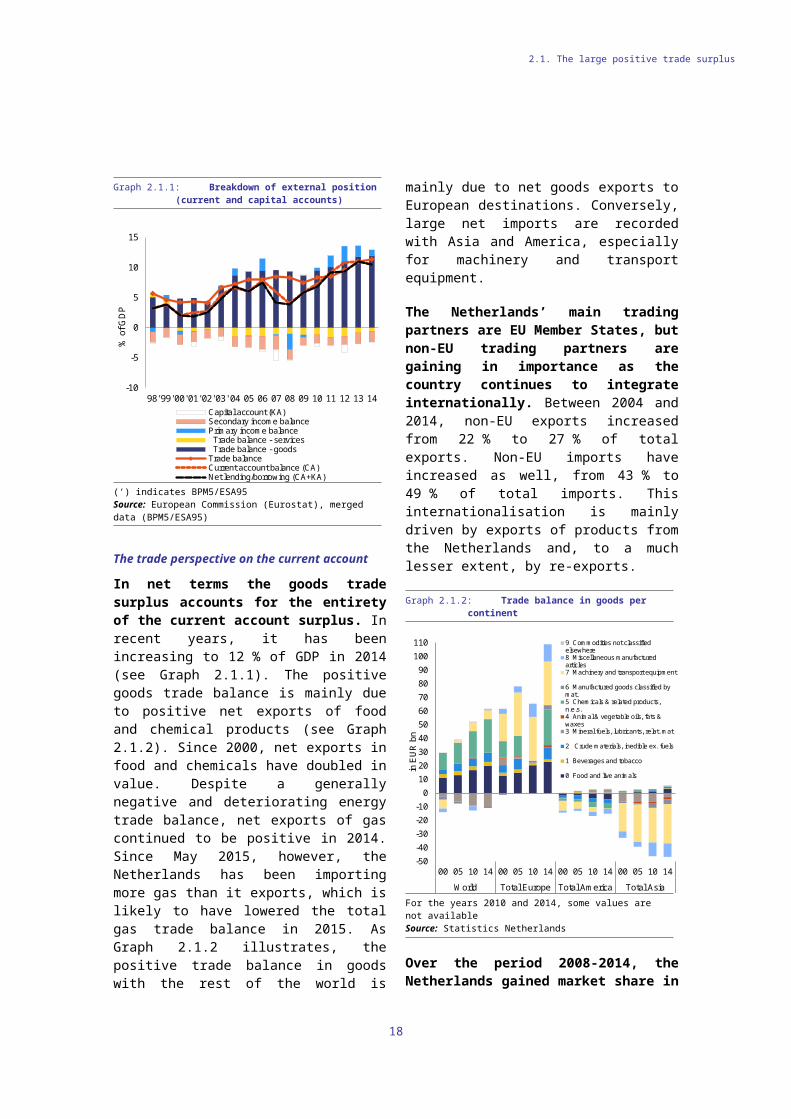
Graph 2.1.1: Breakdown of external position (current and capital accounts)
-10
-5
0
5
10
15
98' 99' 00' 01' 02' 03' 04 05 06 07 08 09 10 11 12 13 14
% o
f GD
P
Capital account (KA)Secondary income balancePrimary income balance Trade balance - services Trade balance - goodsTrade balanceCurrent account balance (CA)Net lending/borrowing (CA+KA)
(‘) indicates BPM5/ESA95Source: European Commission (Eurostat), merged data (BPM5/ESA95)
The trade perspective on the current account
In net terms the goods trade surplus accounts for the entirety of the current account surplus. In recent years, it has been increasing to 12 % of GDP in 2014 (see Graph 2.1.1). The positive goods trade balance is mainly due to positive net exports of food and chemical products (see Graph 2.1.2). Since 2000, net exports in food and chemicals have doubled in value. Despite a generally negative and deteriorating energy trade balance, net exports of gas continued to be positive in 2014. Since May 2015, however, the Netherlands has been importing more gas than it exports, which is likely to have lowered the total gas trade balance in 2015. As Graph 2.1.2 illustrates, the positive trade balance in goods with the rest of the world is mainly due to net goods
7 ()2015 IMF External Sector Assessments: https://www.imf.org/external/np/pp/eng/2015/062615a.pdf.
14
2. IMBALANCES, RISKS, AND ADJUSTMENT ISSUES
2.1. The large positive trade surplus
exports to European destinations. Conversely, large net imports are recorded with Asia and America, especially for machinery and transport equipment.
The Netherlands’ main trading partners are EU Member States, but non-EU trading partners are gaining in importance as the country continues to integrate internationally. Between 2004 and 2014, non-EU exports increased from 22 % to 27 % of total exports. Non-EU imports have increased as well, from 43 % to 49 % of total imports. This internationalisation is mainly driven by exports of products from the Netherlands and, to a much lesser extent, by re-exports.
Graph 2.1.2: Trade balance in goods per continent
-50-40-30-20-10
0102030405060708090
100110
00 05 10 14 00 05 10 14 00 05 10 14 00 05 10 14
World Total Europe Total America Total Asia
in E
UR
bn
9 Commodities not classifiedelsewhere8 Miscellaneous manufacturedarticles7 Machinery and transport equipment
6 Manufactured goods classified bymat.5 Chemicals & related products,n.e.s.4 Animal & vegetable oils, fats &waxes3 Mineral fuels, lubricants, relat. mat
2 Crude materials, inedible ex. fuels
1 Beverages and tobacco
0 Food and live animals
For the years 2010 and 2014, some values are not availableSource: Statistics Netherlands
Over the period 2008-2014, the Netherlands gained market share in intra-EU trade but lost export market share overall. The loss in overall export market share is mainly due to the fact that the weight of the EU economy in world markets declined. The export performance of the Netherlands was also held back by a further fall in the share of exports in the fastest-growing export markets, notably China. When product groups are assessed, a relatively large loss in market share of ‘other sectors’ stands out, which is mainly driven by agricultural products — animal products, vegetable products and foodstuffs. On the other hand, mineral products, chemicals and allied
industries gained market share. This grouping includes products in the high-tech spectrum, highlighting the importance of R&D for the competitiveness of exports.
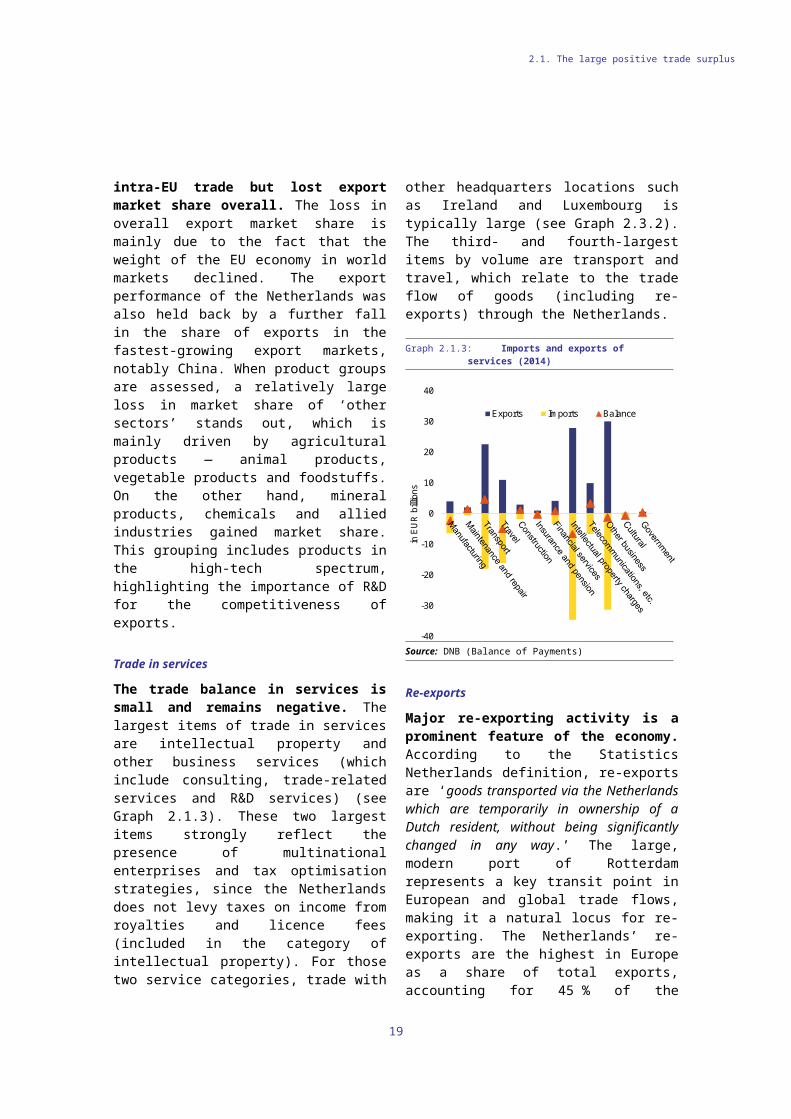
Trade in services
The trade balance in services is small and remains negative. The largest items of trade in services are intellectual property and other business services (which include consulting, trade-related services and R&D services) (see Graph 2.1.3). These two largest items strongly reflect the presence of multinational enterprises and tax optimisation strategies, since the Netherlands does not levy taxes on income from royalties and licence fees (included in the category of intellectual property). For those two service categories, trade with other headquarters locations such as Ireland and Luxembourg is typically large (see Graph 2.3.2). The third- and fourth-largest items by volume are transport and travel, which relate to the trade flow of goods (including re-exports) through the Netherlands.
Graph 2.1.3: Imports and exports of services (2014)
-40
-30
-20
-10
0
10
20
30
40
in E
UR
bill
ions
Exports Imports Balance
Source: DNB (Balance of Payments)
Re-exports
Major re-exporting activity is a prominent feature of the economy. According to the Statistics Netherlands definition, re-exports are ‘goods transported via the Netherlands which are temporarily in ownership of a Dutch resident,
15

2.1. The large positive trade surplus
without being significantly changed in any way.’ The large, modern port of Rotterdam represents a key transit point in European and global trade flows, making it a natural locus for re-exporting. The Netherlands’ re-exports are the highest in Europe as a share of total exports, accounting for 45 % of the Netherlands’ total exports of goods. This ratio that has remained broadly stable over the past ten years in spite of export activity having risen by around 70 % over the same period. In 2014, 81 % of re-exports went to the rest of the EU, considerably above the 67 % of domestically produced exports that go to other EU countries. For some trading partners, e.g. the Czech Republic and Slovakia, trade relations with the Netherlands are strongly biased towards re-exports, rather than domestically produced goods.
Re-exports are estimated to make a sizeable contribution to the current account surplus. Although re-exported goods are not significantly processed or changed while in the Netherlands, a recent study from the statistical offie (8) estimated that the domestic value added of re-exports is about 10 cents per exported euro; the remainder of the export value is accounted for by previous imports. The net impact of re-exports on the goods trade balance is therefore approximately 10 % of the total value of re-exports, which in 2014 equated to 2.9 % of GDP. Although some of the domestic value added generated by re-exports may leak out via second-round imports, these estimates suggest that the direct impact of re-exporting may account for up to one quarter of the current account surplus.
8 ()Lemmers, Exel and Ouwehand (2015). ‘Naar welke EU-landen exporteren kleine exporteurs hun goederen?’ Centraal Bureau voor de Statistiek, Den Haag/Heerlen.
16
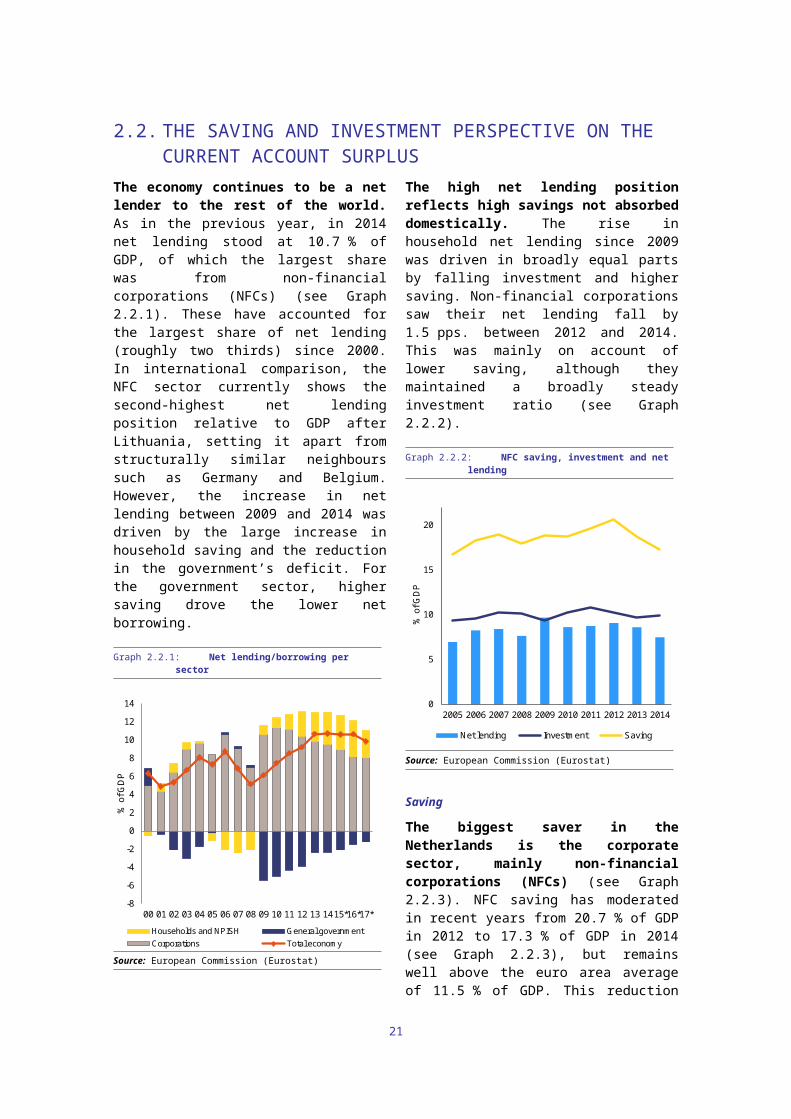
The economy continues to be a net lender to the rest of the world. As in the previous year, in 2014 net lending stood at 10.7 % of GDP, of which the largest share was from non-financial corporations (NFCs) (see Graph 2.2.1). These have accounted for the largest share of net lending (roughly two thirds) since 2000. In international comparison, the NFC sector currently shows the second-highest net lending position relative to GDP after Lithuania, setting it apart from structurally similar neighbours such as Germany and Belgium. However, the increase in net lending between 2009 and 2014 was driven by the large increase in household saving and the reduction in the government’s deficit. For the government sector, higher saving drove the lower net borrowing.
Graph 2.2.1: Net lending/borrowing per sector
-8
-6
-4
-2
0
2
4
6
8
10
12
14
00 01 02 03 04 05 06 07 08 09 10 11 12 13 1415*16*17*
% o
f GD
P
Households and NPISH General governmentCorporations Total economy
Source: European Commission (Eurostat)
The high net lending position reflects high savings not absorbed domestically. The rise in household net lending since 2009 was driven in broadly equal parts by falling investment and higher saving. Non-financial corporations saw their net lending fall by 1.5 pps. between 2012 and 2014. This was mainly on account of lower saving, although they maintained a broadly steady investment ratio (see Graph 2.2.2).
Graph 2.2.2: NFC saving, investment and net lending
0
5
10
15
20
2005 2006 2007 2008 2009 2010 2011 2012 2013 2014
% o
f GD
P
Net lending Investment Saving
Source: European Commission (Eurostat)
Saving
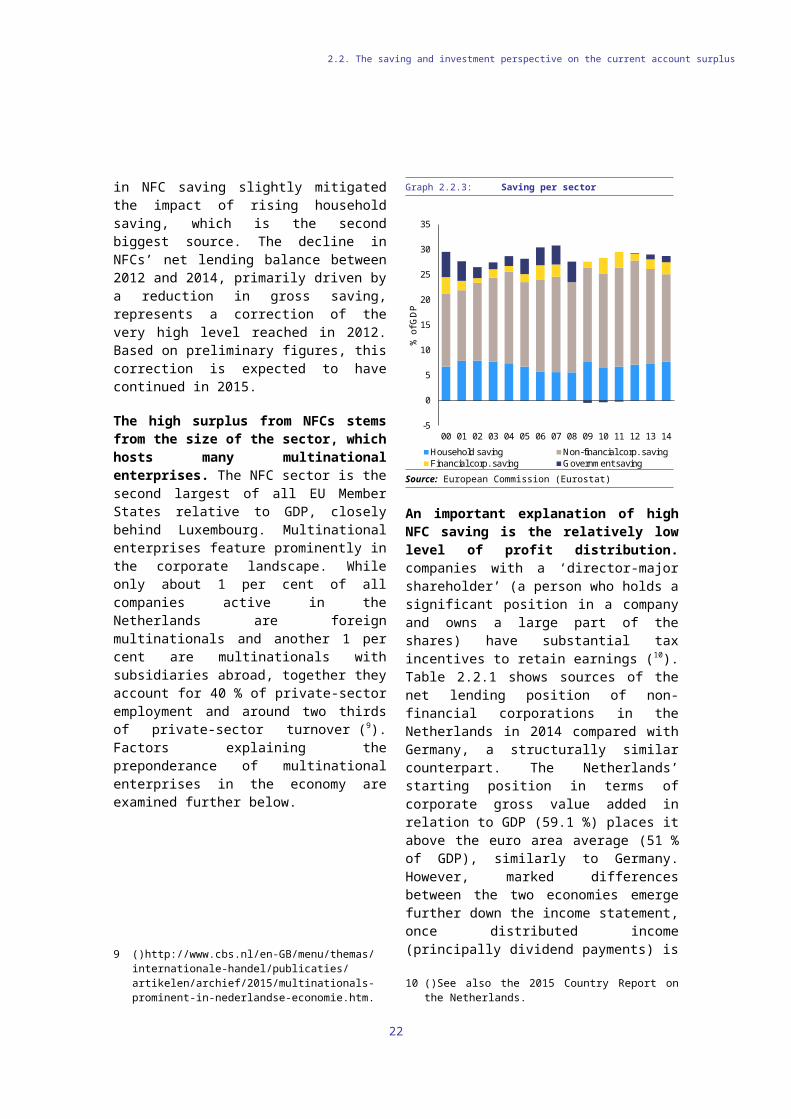
The biggest saver in the Netherlands is the corporate sector, mainly non-financial corporations (NFCs) (see Graph 2.2.3). NFC saving has moderated in recent years from 20.7 % of GDP in 2012 to 17.3 % of GDP in 2014 (see Graph 2.2.3), but remains well above the euro area average of 11.5 % of GDP. This reduction in NFC saving slightly mitigated the impact of rising household saving, which is the second biggest source. The decline in NFCs’ net lending balance between 2012 and 2014, primarily driven by a reduction in gross saving, represents a correction of the very high level reached in 2012. Based on preliminary figures, this correction is expected to have continued in 2015.
The high surplus from NFCs stems from the size of the sector, which hosts many multinational enterprises. The NFC sector is the second largest of all EU Member States relative to GDP, closely behind Luxembourg. Multinational enterprises feature prominently in the corporate landscape. While only about 1 per cent of all companies active in the Netherlands are foreign multinationals and another 1 per cent are multinationals with subsidiaries abroad, together they account for 40 % of private-sector employment and around two thirds of private-
17
2.2. THE SAVING AND INVESTMENT PERSPECTIVE ON THE CURRENT ACCOUNT SURPLUS
2.2. The saving and investment perspective on the current account surplus
sector turnover (9). Factors explaining the preponderance of multinational enterprises in the economy are examined further below.
Graph 2.2.3: Saving per sector
-5
0
5
10
15
20
25
30
35
00 01 02 03 04 05 06 07 08 09 10 11 12 13 14
% o
f GD
P
Household saving Non-financial corp. savingFinancial corp. saving Government saving
Source: European Commission (Eurostat)
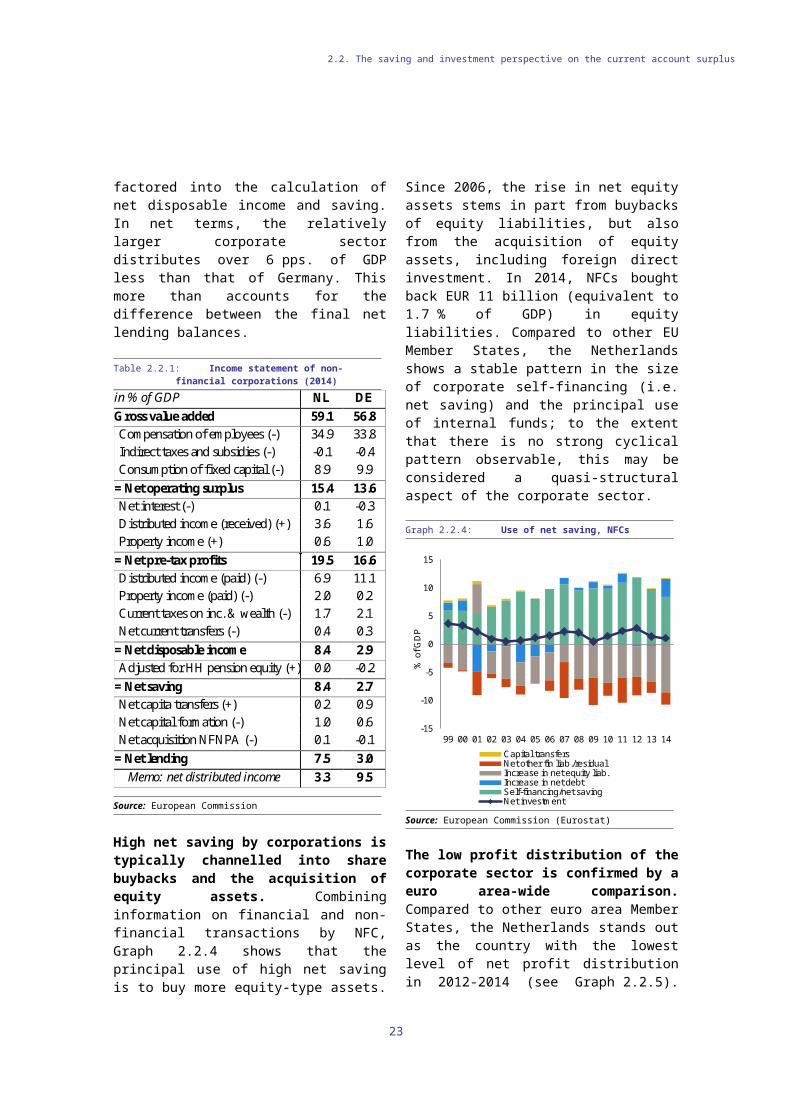
An important explanation of high NFC saving is the relatively low level of profit distribution. companies with a ‘director-major shareholder’ (a person who holds a significant position in a company and owns a large part of the shares) have substantial tax incentives to retain earnings (10). Table 2.2.1 shows sources of the net lending position of non-financial corporations in the Netherlands in 2014 compared with Germany, a structurally similar counterpart. The Netherlands’ starting position in terms of corporate gross value added in relation to GDP (59.1 %) places it above the euro area average (51 % of GDP), similarly to Germany. However, marked differences between the two economies emerge further down the income statement, once distributed income (principally dividend payments) is factored into the calculation of net disposable income and saving. In net terms, the relatively larger corporate sector distributes over 6 pps. of GDP less than that of Germany. This more than accounts for the difference between the final net lending balances.
9 ()http://www.cbs.nl/en-GB/menu/themas/internationale-handel/publicaties/artikelen/archief/2015/multinationals-prominent-in-nederlandse-economie.htm.
10 ()See also the 2015 Country Report on the Netherlands.
Table 2.2.1: Income statement of non-financial corporations (2014)
in % of GDP NL DE Gross value added 59.1 56.8 Compensation of employees (-) 34.9 33.8 Indirect taxes and subsidies (-) -0.1 -0.4 Consumption of fixed capital (-) 8.9 9.9
= Net operating surplus 15.4 13.6 Net interest (-) 0.1 -0.3 Distributed income (received) (+) 3.6 1.6 Property income (+) 0.6 1.0
= Net pre-tax profits 19.5 16.6 Distributed income (paid) (-) 6.9 11.1 Property income (paid) (-) 2.0 0.2 Current taxes on inc. & wealth (-) 1.7 2.1 Net current transfers (-) 0.4 0.3
= Net disposable income 8.4 2.9 Adjusted for HH pension equity (+) 0.0 -0.2
= Net saving 8.4 2.7 Net capita transfers (+) 0.2 0.9 Net capital formation (-) 1.0 0.6 Net acquisition NFNPA (-) 0.1 -0.1
= Net lending 7.5 3.0 Memo: net distributed income 3.3 9.5
Source: European Commission
High net saving by corporations is typically channelled into share buybacks and the acquisition of equity assets. Combining information on financial and non-financial transactions by NFC, Graph 2.2.4 shows that the principal use of high net saving is to buy more equity-type assets. Since 2006, the rise in net equity assets stems in part from buybacks of equity liabilities, but also from the acquisition of equity assets, including foreign direct investment. In 2014, NFCs bought back EUR 11 billion (equivalent to 1.7 % of GDP) in equity liabilities. Compared to other EU Member States, the Netherlands shows a stable pattern in the size of corporate self-financing (i.e. net saving) and the principal use of internal funds; to the extent that there is no strong cyclical pattern observable, this may be considered a quasi-structural aspect of the corporate sector.
18
2.2. The saving and investment perspective on the current account surplus
Graph 2.2.4: Use of net saving, NFCs
-15
-10
-5
0
5
10
15
99 00 01 02 03 04 05 06 07 08 09 10 11 12 13 14
% o
f GD
P
Capital transfersNet other fin liab./residualIncrease in net equity liab.Increase in net debtSelf-financing/net savingNet investment
Source: European Commission (Eurostat)
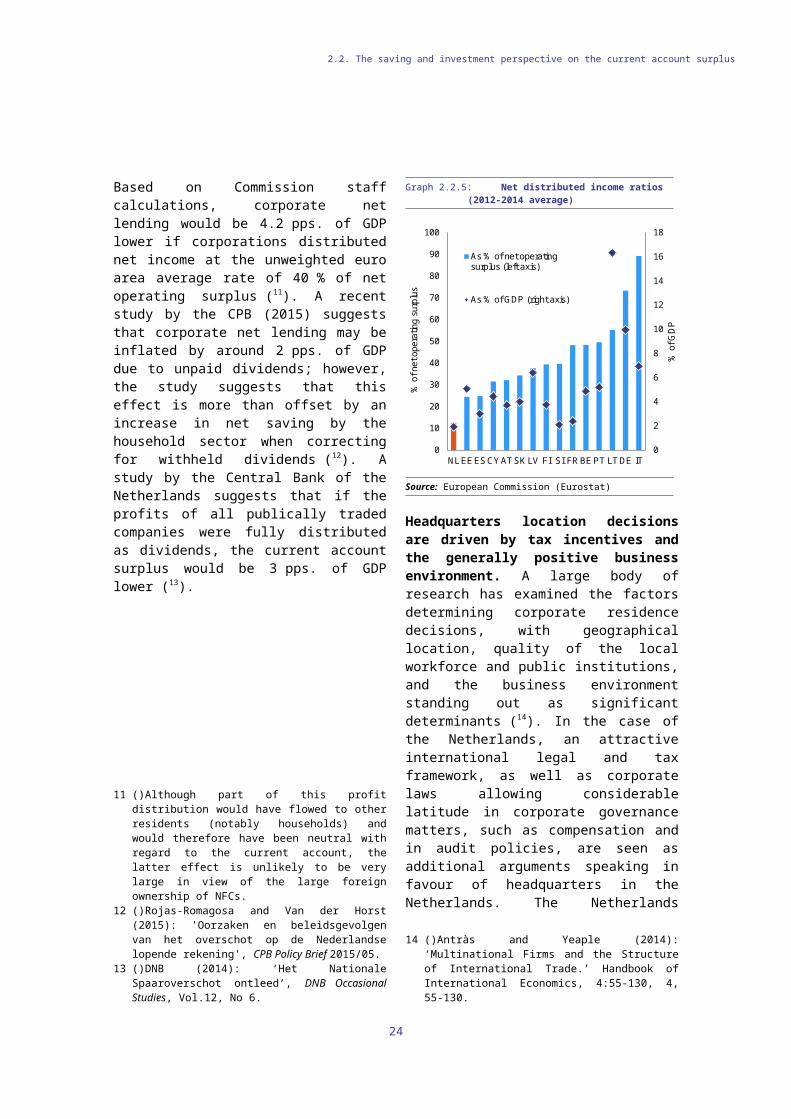
The low profit distribution of the corporate sector is confirmed by a euro area-wide comparison. Compared to other euro area Member States, the Netherlands stands out as the country with the lowest level of net profit distribution in 2012-2014 (see Graph 2.2.5). Based on Commission staff calculations, corporate net lending would be 4.2 pps. of GDP lower if corporations distributed net income at the unweighted euro area average rate of 40 % of net operating surplus (11). A recent study by the CPB (2015) suggests that corporate net lending may be inflated by around 2 pps. of GDP due to unpaid dividends; however, the study suggests that this effect is more than offset by an increase in net saving by the household sector when correcting for withheld dividends (12). A study by the Central Bank of the Netherlands suggests that if the profits of all publically traded companies were fully distributed as dividends, the current account surplus would be 3 pps. of GDP lower (13).
11 ()Although part of this profit distribution would have flowed to other residents (notably households) and would therefore have been neutral with regard to the current account, the latter effect is unlikely to be very large in view of the large foreign ownership of NFCs.
12 ()Rojas-Romagosa and Van der Horst (2015): 'Oorzaken en beleidsgevolgen van het overschot op de Nederlandse lopende rekening', CPB Policy Brief 2015/05.
13 ()DNB (2014): ‘Het Nationale Spaaroverschot ontleed’, DNB Occasional Studies, Vol.12, No 6.
Graph 2.2.5: Net distributed income ratios (2012-2014 average)
0
2
4
6
8
10
12
14
16
18
0
10
20
30
40
50
60
70
80
90
100
NL EEESCYAT SK LV FI SI FRBE PT LT DE IT
% o
f GD
P
% o
f net
ope
ratin
g su
rplu
s
As % of net operatingsurplus (left axis)
As % of GDP (right axis)
Source: European Commission (Eurostat)
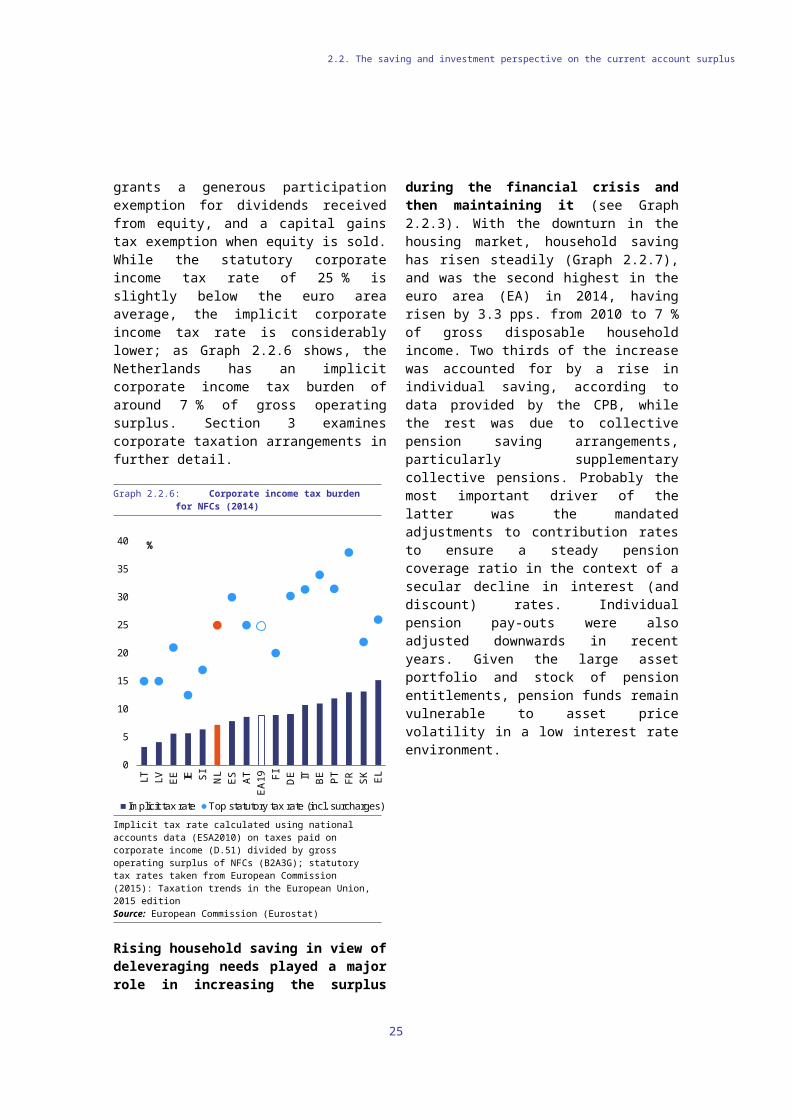
Headquarters location decisions are driven by tax incentives and the generally positive business environment. A large body of research has examined the factors determining corporate residence decisions, with geographical location, quality of the local workforce and public institutions, and the business environment standing out as significant determinants (14). In the case of the Netherlands, an attractive international legal and tax framework, as well as corporate laws allowing considerable latitude in corporate governance matters, such as compensation and in audit policies, are seen as additional arguments speaking in favour of headquarters in the Netherlands. The Netherlands grants a generous participation exemption for dividends received from equity, and a capital gains tax exemption when equity is sold. While the statutory corporate income tax rate of 25 % is slightly below the euro area average, the implicit corporate income tax rate is considerably lower; as Graph 2.2.6 shows, the Netherlands has an implicit corporate income tax burden of around 7 % of gross operating surplus. Section 3 examines corporate taxation arrangements in further detail.
14 ()Antràs and Yeaple (2014): ‘Multinational Firms and the Structure of International Trade.’ Handbook of International Economics, 4:55-130, 4, 55-130.
19
2.2. The saving and investment perspective on the current account surplus
Graph 2.2.6: Corporate income tax burden for NFCs (2014)
0
5
10
15
20
25
30
35
40
LT LV EE IE SI
NL
ES AT
EA
19 FI DE IT BE PT
FR SK EL
%
Implicit tax rate Top statutory tax rate (incl. surcharges)
Implicit tax rate calculated using national accounts data (ESA2010) on taxes paid on corporate income (D.51) divided by gross operating surplus of NFCs (B2A3G); statutory tax rates taken from European Commission (2015): Taxation trends in the European Union, 2015 editionSource: European Commission (Eurostat)
Rising household saving in view of deleveraging needs played a major role in increasing the surplus during the financial crisis and then maintaining it (see Graph 2.2.3). With the downturn in the housing market, household saving has risen steadily (Graph 2.2.7), and was the second highest in the euro area (EA) in 2014, having risen by 3.3 pps. from 2010 to 7 % of gross disposable household income. Two thirds of the increase was accounted for by a rise in individual saving, according to data provided by the CPB, while the rest was due to collective pension saving arrangements, particularly supplementary collective pensions. Probably the most important driver of the latter was the mandated adjustments to contribution rates to ensure a steady pension coverage ratio in the context of a secular decline in interest (and discount) rates. Individual pension pay-outs were also adjusted downwards in recent years. Given the large asset portfolio and stock of pension entitlements, pension funds remain vulnerable to asset price volatility in a low interest rate environment.
Graph 2.2.7: Household saving and investment rates (% of disposable income)
6
7
8
9
10
11
12
13
14
15
16
2005 2006 2007 2008 2009 2010 2011 2012 2013 2014
Saving EA (19) Saving NLInvestment EA (19) Investment NL
Source: European Commission (Eurostat)
Pension funds hold the largest share of household savings, but invest mainly in securities and mostly abroad. Within a period of 10 years, total household pension assets increased by more than 50 % to 212 % of GDP in 2014 (see Graph 2.2.8). From the perspective of the wealth portfolio of households, pension assets have increased massively over the last decade, while housing equity and other wealth holdings decreased. The allocation of pension fund assets may be suboptimal both from the perspective of households and, more generally, from a macroeconomic perspective. The main investments (83 %) of total pension fund assets in recent years have been shares, other equity and securities other than shares; real estate assets represented less than 2 % of total assets in 2014 (see Graph 2.2.9). By far the largest share of assets is invested abroad. In 2014, only 17 % of total pension fund assets were invested in the Netherlands, 27 % in other euro area countries and 46 % outside the euro area.
20
2.2. The saving and investment perspective on the current account surplus
Graph 2.2.8: Household balance sheets
379
358
295
96
84
40
17
24
25
0 200 400 600
2014
2005
1995
Net wealthMortgagesOther debts
% of GDP
212
137
112
179
223
137
58
49
40
0200400600
PensionsReal-estateOther wealth
% of GDP
Source: DNB in the government’s Miljoenennota 2016
The very large fully funded pension system has difficulties coping with stock market volatility and the low long-term interest rates; policy initiatives are addressing the transparency and actuarial fairness of the system. The pension system is based on strong institutions, providing wide coverage and delivering good results in terms of pension adequacy and fiscal sustainability. Nevertheless, stock market volatility and the current low long-term interest environment have led to expensive and increasingly uncertain defined-benefit pension entitlements. Low solvability has generally led to large reductions in indexation and increases in contributions, and sometimes even to nominal reductions in pension income for retirees. In combination with relatively low transparency and a disconnect between contributions and future earnings, this has reduced the popularity of the current system, in particular among younger generations who feel that they bear an undue financial burden on account of the doorsneesystematiek (15). Acknowledging these dilemmas, the government has set out a plan to reform the pension system starting in 2020.
15 ()Freely translated as ‘average premium system’, which states that every participant receives an equal share in the total entitlements for every euro of contribution. This financing system is not actuarially fair, as a young person’s contribution has a longer investment horizon and higher future value.
Graph 2.2.9: Pension fund assets over time
0
250
500
750
1000
1250
1500
08 09 10 11 12 13 14 15Q3
in E
UR
bill
ion
Other non-financial assetsReinsured technical provisionsDeposits and other liquid assetsLoansFinancial derivativesSecurities other than sharesShares and other equityReal estate
The data are based on pension funds’ balance sheets including DNB ‘look through’ data on pension funds’ investments.Source: DNB
Investment
Investment activity by non-financial corporations and households is recovering slowly from a construction-led drop (see Graph 2.2.10). In the wake of the economic crisis and the housing market slump, construction investment fell by 30 % between 2008 to and 2013 (see Graph 2.2.11). Reinvigorated by the recovery in the housing market, construction investment increased slightly in 2014 and more strongly in 2015, and is expected to rise further. Other major items of investment including equipment are unchanged relative to GDP.
Household investment is strongly influenced by taxation incentives. Households invest mainly in housing, because of strong long-standing fiscal incentives (mortgage income deductibility) —which are being slowly and partially phased out — and as a result of financial innovation (see section 2.5 on the housing market). At the height of the housing boom, household investment reached close to 8 % of GDP (see Graph 2.2.10). Since then it has almost halved, which widened the gap of excess household saving over investment. With the recovery in the housing market, households’ investment increased slightly in 2014 and rose further in 2015.
21
2.2. The saving and investment perspective on the current account surplus
Graph 2.2.10: Investment per sector
0
5
10
15
20
25
00 01 02 03 04 05 06 07 08 09 10 11 12 13 14
% o
f GD
P
Government investment Financial corp. investmentNon-financial corp. investment Household investment
Source: European Commission
Graph 2.2.11: Gross capital formation by type
-5
0
5
10
15
20
25
02 03 04 05 06 07 08 09 10 11 12 13 14*15*16*17*
% G
DP
Construction EquipmentOther investment Inventories and Valuables
Source: AMECO
By contrast, corporate investment has been relatively unchanged, hovering around 10 % of GDP for more than a decade. Given that the Netherlands experienced a protracted double-dip recession between 2009 and 2013, the stability of corporate investment in relation to GDP underlines that much of the decline in economy-wide investment activity during the recession was accounted for by the large drop in residential investment by the household sector. The resilience of corporate investment in recent years may be
partly explained by somewhat more favourable credit conditions for corporate borrowers compared to households, particularly for larger corporations and multinational enterprises, which in the Netherlands make up a large part of the NFC sector (Graph 2.2.12). Furthermore, and in contrast to households, there is evidence to suggest that large corporations in particular have commanded ample sources of internal financing since the crisis, thereby enabling corporate investment to be partly funded without recourse to bank loans.
In spite of improving credit conditions, risks to credit creation are heightened in the current financial environment. Recent signals from the Central Bank's quarterly credit standards survey suggest that lending standards are easing only for large corporate borrowers (see Graph 2.2.12). Overall, credit provision to the non-financial corporate sector continued to remain negative during 2015. By squeezing lending margins and bank profitability, the interest rate environment and financial market uncertainty may reduce the room for raising bank equity, with potential implications for the growth outlook. Moreover, the relatively pronounced reliance of the banking sector on wholesale funding may increase its sensitivity to interest and asset price movements.
In line with the European Economic Recovery Plan, public investment peaked in 2009, but has remained in decline since. With the outbreak of the financial crisis, European governments responded with a large fiscal stimulus. In the Netherlands, the stimulus was provided via enforced automatic stabilization and a targeted discretionary investment package of around EUR 3 billion in both 2009 and 2010, leading to a discretionary impulse of 1 % of GDP over both years. Around EUR 2 billion (0.35 % of GDP) from the budget of a public investment fund (the so-called Fonds Economische Structuurversterking) was frontloaded to the years 2009 to 2010. In the subsequent fiscal consolidation period public investment has declined from 4.3% of GDP in 2009 to 3.5 % of GDP in 2014. In 2014, public investment relative to GDP was relatively high in the Netherlands compared to the euro area average of 2.7 % of GDP and to neighbouring countries such as Belgium (2.4 %) and Germany (2.2 %), but lower than France (3.7 %). However, public investment
22
2.2. The saving and investment perspective on the current account surplus
in the Netherlands was still below its long-term average of 3.9 % and is set to continue its decline until 2017 judging by current plans.
Graph 2.2.12: Credit conditions
-60
-40
-20
0
20
40
60
80
100
06 07 08 09 10 11 12 13 14 15 16
Net
% o
f ban
ks re
porti
ng ti
ghte
ning
(4 q
uarte
r av.
)
Large corporationsSMEsHouseholds (mortgage loans)
Source: DNB
Net international investment position
The high net international investment position (NIIP) is mainly driven by the private sector. Graph 2.2.13 shows the NIIP with a breakdown by institutional sector, which reveals a number of important trends. Most striking is the steady rise in the NIIP from approximately zero in the second quarter of 2010 to 65.2 % of GDP in the second quarter of 2015; roughly half of this increase is due to valuation effects in 2014-2015. This rise was principally accounted for by an improvement in the net foreign asset position of the private sector, and — to a lesser extent — by a reduction in the net foreign debt of monetary financial institutions (MFIs). In contrast, the increasing net asset position of the private sector reflects the net saving of non-financial corporations but also the increasing asset base of pension funds (which are classed in this sector in external statistics).
Valuation effects from the euro depreciation increased the NIIP in 2014. Net financial transactions linked to trade activity typically explain much of the annual change in the NIIP up to 2014. However, with the steady depreciation of the euro in the course of 2014, which accelerated
in the first half of 2015, valuation gains made an important positive contribution to the NIIP: while the value of foreign currency-denominated assets rose in euro terms, external liabilities, mainly denominated in euros, were less affected by currency movements. In a long-term perspective, valuation gains have not produced a significant shift in the NIIP. To the extent that the euro’s nominal effective exchange rate is likely to eventually appreciate from its current, still relatively low level, recent positive valuation gains in the NIIP should not be considered permanent.
23
2.2. The saving and investment perspective on the current account surplus
Graph 2.2.13: Net international investment position by sector
-150
-100
-50
0
50
100
150
200
07Q
3'
08Q
3
09Q
3
10Q
3
11Q
3
12Q
3
13Q
3
14Q
3
% o
f GD
P
General GovernmentPrivate sectorMFI (excl central bank)Central Bank (incl reserves)Net int'l investment position (NIIP)
Source: European Commission
24
Trade spillovers
Risks of spillovers through trade from exposure to EU trading partners are no more than moderate. Within the EU, the main trading partners in 2014 were Germany, Belgium, the UK and France, accounting for roughly the same share (70 %) of both imports to the EU and exports from the EU. The Netherlands’ trade with the rest of the euro area has fallen slightly in the past 10 years from 80 % in 2004 to 75 % (imports) and 77 % (exports) in 2014. As can be seen in Graph 2.3.1, by far the highest exported value added goes to Germany. Total goods exports to Germany are expected to have decreased by 5 % in 2015; however, half of this drop is due to lower re-exports. The pronounced trade exposure to the German market may pose a risk if German absorption of imports from the Netherlands is in any way affected, for example if German exports (and the German economy) were affected by weaker demand from emerging market economies.
Graph 2.3.1: Exports in value added by destination (2011)
0%
1%
2%
3%
4%
5%
6%
7%
ROW
*
DE UK USA FR
CHN IT BE ES
RUS SE DK PL JPN
AUS
% o
f NL
GD
P
* Rest of the WorldSource: WIOD database, IMF European Commission calculations based on the methodology of Koopman, Wang and Wei (AER, 2014)
The Netherlands’ trade ties with countries outside the EU are relatively diverse. Trade figures for 2015 indicate that the slowdown of the Chinese economy and the recession in Russia have had limited spillovers to trade figures. While trade with Russia suffered strongly from the downturn,
importers and exporters seem to have found alternative markets for their products, as total trade figures did not fall to the same extent. Imports from China have fallen slightly more than world imports, mainly due to lower imports of machinery and transport equipment. Yet exports to China increased far more strongly than world exports. This was driven by higher exports of food and live animals, crude materials and chemicals and related products. Given that the trade figures for world export and imports have been fairly stable for the Netherlands, the spillover risks from China or Russia to the Netherlands seem to be limited.
The impact of potential spillovers from the Netherlands to its trading partners through trade channels is not pronounced, except in the case of neighbouring Belgium. The value added of imports from Belgium to the Netherlands represents 2.4 % of Belgian GDP, while the other listed countries’ imports represent a value added of below 1 % of their GDP (see Graph 2.3.2). The close trade relations with Belgium imply that an economic shock to the economy could potentially spill over to Belgium, but would leave other Member States largely unscathed.
Graph 2.3.2: Imports by country of origin (2013)
0
2
4
6
8
10
12
Bel
gium
Irela
nd
Luxe
mbo
urg
Cze
ch_R
ep
Ger
man
y
Latv
ia
Mal
ta
Hun
gary
Slo
vaki
a
UK
Lith
uani
a
Den
mar
k
Cyp
rus
Finl
and
Sw
eden
% o
f tra
ding
par
tner
GD
P
Goods Services
The data includes all imports, including goods and services that are imported for re-export.Source: UN
25
2.3. REAL AND FINANCIAL SPILLOVERS
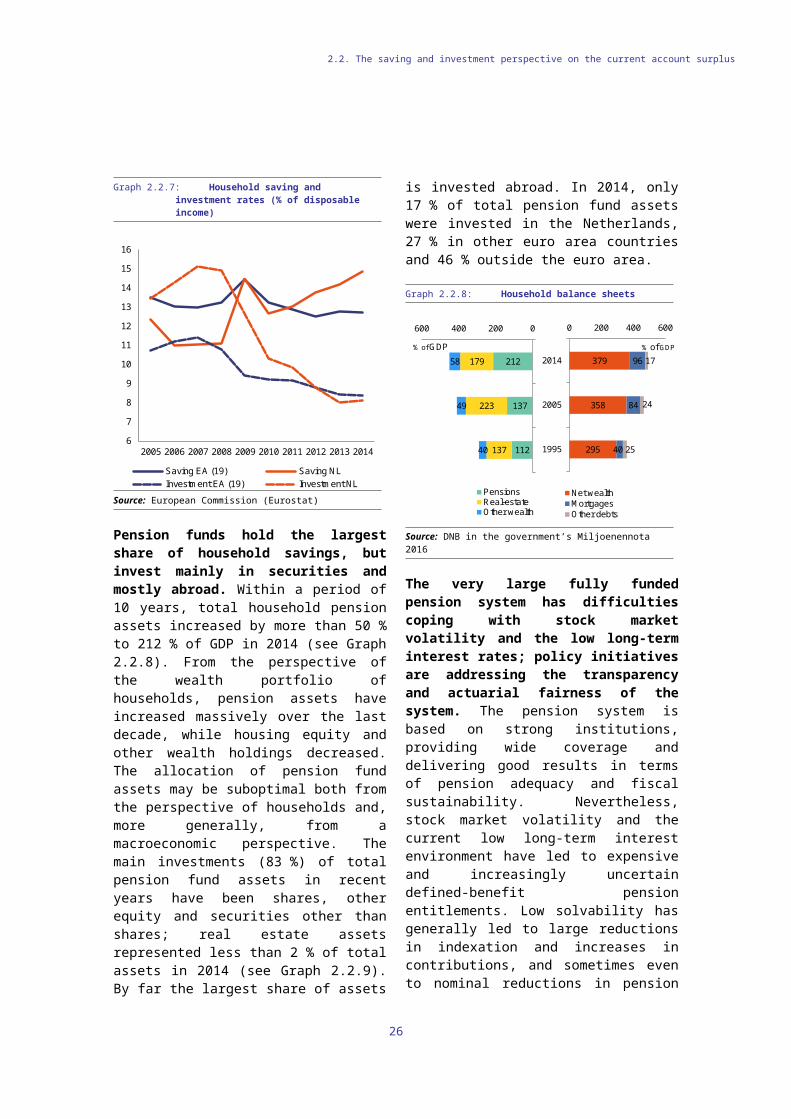
2.3. Real and financial spillovers
Financial market spillovers
The international exposure of the financial market was reduced in the immediate aftermath of the financial crisis. The financial market is relatively large in relation to domestic GDP, with total bank assets worth 386.3 % of GDP in 2014 (the average size of the financial sector of other euro area Member States is 308 % of GDP). The international exposure of banks has roughly stayed constant over the past five years at around EUR 500 billion (75 % of GDP in 2014) and is mainly exposure to other European countries (see Graph 2.3.3). In the run-up to the financial crisis (2004-2007), a strong build-up of European and US exposure was observed, which peaked at over EUR 900 billion. In the following three years, with the decline of the interbank market, exposure was sharply reduced to previous levels, also reducing potential spillover effects from other European countries and the US.
Graph 2.3.3: Consolidated assets of domestic credit institutions: international claims on immediate borrower basis
0
100
200
300
400
500
600
700
800
900
1,000
04Q
405
Q2
05Q
406
Q2
06Q
407
Q2
07Q
408
Q2
08Q
409
Q2
09Q
410
Q2
10Q
411
Q2
11Q
412
Q2
12Q
413
Q2
13Q
414
Q2
14Q
415
Q2
in E
UR
bill
ion
America Asia BelgiumGermany France United KingdomSwitzerland Rest of Europe Rest of World
Source: DNB
Financial market exposure is relatively diverse. Exposure to UK and French banks was sharply reduced during the course of the crisis, further diversifying total exposure. Exposure to Greece, Italy, Ireland, Portugal and Spain has been brought down from 17 % of total exposure at the end of 2008 to 6 % (Q2-2015). For the rest of the world, domestic credit institutions' largest claims are in
the US (6 % of total exposure in Q2-2015) and China & Hong Kong (6 %). Exposure to China & Hong Kong is non-negligible, but given the greater diversification than in the past, potential turbulences in the Chinese market would be expected to have only limited spillovers to credit institutions.
Foreign bank claims on the Netherlands are mostly held by its main trading partners: Belgium, France, the UK and Germany. This is reflected in high non-bank private-sector claims, especially those of Belgium (see Graph 2.3.4). Portugal has a surprisingly high share of claims on the Netherlands, mainly on the non-bank private sector too, owing to the activity of non-financial corporations. The largest share of claims on banks is held by French, British and German banks on which banks registered in the Netherlands also hold claims, suggesting strong interlinkages between their banking sectors
Graph 2.3.4: EU bank claims on the Netherlands, by sector
0
0.5
1
1.5
2
2.5
3
3.5
4
4.5
5
BE PT
FR UK
DE
SE AT
ES IE FI IT EL
% o
f cou
nter
part
GD
P
Banks Official sector Non-bank private sector All sectors
Based on an EU sample of 12 countries; sum of sectors may not add up to total due to unallocated claimsSource: BIS consolidated banking statistics (ultimate risk basis 2015 Q2), IMF, European Commission
The government bond portfolio of the four largest banks focuses on countries with strong ratings. The four largest internationally active banks (ING, RABO Bank, ABN AMRO and SNS) account for 80 % of the total banking sector. According to data from the European Banking Authority, their total sovereign exposure accounted
26
2.3. Real and financial spillovers
for 8 % of total assets at the end of 2013 and was mainly to the European Economic Area (85 % of total sovereign exposure, including the Netherlands). Those four banks held government bonds mainly issued by the Netherlands (33 % of total sovereign exposure), followed by German (17 %), Belgian (11 %) and French (10 %). After the crisis broke out, the four banks increased their exposure to their home sovereign and to Germany, reaching 45 % and 21 % of total exposure respectively in 2012. Holdings of Greek, Irish, Italian, Portuguese and Spanish bonds have been strongly reduced, from 17 % in 2009 to 3 % in 2013. Considering the four banks’ strategy of diversifying into government bonds of countries with higher credit ratings, the potential spillovers of sovereign risk are limited.
Potential demand spillovers
Weak domestic investment levels warrant a detailed analysis of the impact of raising investment spending — both on the domestic economy and fellow euro area Member States. Following Commission calculations, a positive boost to public investment of 1 % of GDP has a sizable effect on the economy of the Netherlands (16). A shock of this size would ensure a partial reversal of the downward trend in public investment and would bring it back in line with the 2000-2011 average. The investment boost would have an immediate positive impact on the level of GDP, increasing it by 0.5 % in the first year to 1.1 % after 10 years. The shock’s positive impact on GDP and the fact that investment goods are partly imported would reduce the current account surplus by -0.1 % of GDP in the first year to -0.45 % of GDP after 10 years.
Given the relatively small size of the economy, demand spillovers to other euro area member states are modest. Model simulations by the Commission suggest that a potential increase in public investment by 1 % of GDP would only cause GDP in the rest of the euro area to increase by 0.05 % after one year, with the impact hardly rising over time. The impact of the simulated
16 ()The simulation is based on a version of the Commission’s QUEST model calibrated to the economy of the Netherlands. The modelled spillovers include a trade impact of domestic demand and, to a lesser extent, an exchange rate effect.
investment shock on the euro area current account balance is smaller still, with the current account balance of the rest of the euro area increasing by between 0.02 and 0.03 percentage point of GDP. Overall, and including the negative impact on the current account surplus, the current account of the entire euro area would be reduced by 0.01-0.02 percentage point of GDP.
27
Private debt continues to remain high in the Netherlands. Standing at 228.9 % of GDP in 2014, roughly half of private debt can be attributed to households and the other half to non-financial corporations (NFC). Both have been similarly high for the past 10 years and well above the EU average (see Graph 2.4.1).
Graph 2.4.1: Private-sector debt in the Netherlands and the EU
0
50
100
150
200
250
04 05 06 07 08 09 10 11 12 13 14
% o
f GD
P
NL NFC NL HH and NPISH EU NFC EU HH and NPISH
Source: European Commission (Eurostat)
Household debt
The high household debt is largely mortgage debt that has built up in the past, fuelled by tax incentives (see section 2.5 on the housing market). As can be seen in Graph 2.4.2, total household debt was 112 % of GDP in 2014 and mortgage debt on the primary residence accounted for roughly 90 % of total household debt. The remaining debt mainly consisted of consumer loans, financing of shares, mortgages on other real estate and student loans.
Household deleveraging seems to be mostly the result of GDP growth. The deleveraging indicated in Graph 2.4.2 — in the ratios of both total debt and mortgage debt to GDP — is partly passive, i.e. driven by rising GDP. In nominal terms, household debt increased throughout the crisis, reaching a peak of EUR 758 billion at the end of 2012. After that, it initially decreased by 3 pps. to mid-2014, but has recently been increasing slightly again. An indication of the
financial vulnerability of households can be garnered from a comparison of household debt to financial assets held in the form of bank savings and securities, as those financial assets tend to be relatively liquid. In contrast to wealth held in illiquid pension savings or dwellings, bank savings and securities can easily be tapped in case of financial distress. While the ratio of debt to financial assets rose strongly until 2009, mostly due to increasing debt, households actually increased their buffers in savings accounts from 2006 to 2014 by on average 3 % per year, lessening the financial risk of high household debt.
Graph 2.4.2: Household debt ratios
80
100
120
140
160
180
200
220
240
260
2006 2007 2008 2009 2010 2011 2012 2013 2014
in %
Debt/GDPMortgage debt (residence)/GDPDebt/financial assetsDebt /disposable income
Source: Statistics Netherlands, European Commission (Eurostat)
The number of households with negative equity (‘underwater mortgages’) has started to decrease. Homeowners have ‘negative equity’ when the mortgage value of their home exceeds its value. Negative equity rose sharply in 2009, when house prices started plummeting, and was estimated to affect 1.5 million households (30 %) in 2014, but has since fallen slightly (17). Those most affected are people up to 35 years old. This group consists mainly of first-time buyers who bought their homes in the years immediately preceding the housing market crisis. It is also the
17 ()Based on Statistics Netherlands data. Taking savings accounts linked to the outstanding mortgages into consideration, the number was much lower (around 1.1 million) according to DNB data, and was falling further in 2015.
28
2.4. PRIVATE SECTOR INDEBTEDNESS
2.4. Private sector indebtedness
group most exposed to changes in market prices. The 30-35 age cohort had negative housing equity of EUR 34 000 on average in 2014 (see Graph 2.4.3). According to a recent DNB study (18), the proportion of households with negative equity could fall to 5 % in 2023 with regular amortisation and house price increases of 3 % per year. If house prices were to remain at their 2015 level, the figure would only fall to 20 % in 2023 with regular amortisation.
Only a fraction of households with negative housing equity are covered by the mortgage loan insurance scheme. The public mortgage loan insurance scheme (Nationale Hypotheek Garantie, NHG) is aimed at protecting borrowers from any residual debt after foreclosure or sale of the house. However, the scheme is not compulsory and not all borrowers can sign up to it voluntarily, as only lower-valued houses are eligible. Without NHG coverage, borrowers are more financially vulnerable, as they are not insured against losses if they have to sell their house. A subsample of the DNB loan level data (19) indicates that roughly half of the borrowers with negative housing equity are not covered by the NHG.
Average loan-to-value (LTV) ratios are falling gradually, but slowly. The average LTV ratio for the 30-35 age cohort increased from 89 % in 2008 to 121 % in 2013, but is expected to have fallen to 112 % in 2015. The lower LTV ratios result partly from the ongoing housing market recovery and partly from a cap on the maximum LTV ratio introduced in 2012. With the recovery of the housing market, the value of homes is expected to continue rising, and therefore to reduce outstanding LTV ratios (see section 2.5 on the housing market). The gradual lowering of the maximum LTV at the time of house purchase to 100 % by 2018 (from 103 % in 2015) is one of the housing market measures introduced in 2012. While this is still higher than other EU Member States, it is expected to slowly bring down average LTV ratios, gradually reducing the risk of negative equity as well.
18 ()Mastrogiacomo and van der Molen (2015). ‘Dutch mortgages in the DNB loan level data’. Occasional Studies Vol. 13 – 4, DNB.
19 ()Idem.
Graph 2.4.3: Average housing equity (main residence) per age cohort
-100
-50
0
50
100
150
200
250
up to
25
y
25 -
30 y
30 -
35 y
35 -
40 y
40 -
45 y
45 -
50 y
50 -
55 y
55 -
60 y
60 -
65 y
65 -
70 y
70 -
75 y
75 y
and
abo
ve
in E
UR
100
0
2006 2009 2012 2013 2014
Source: Statistics Netherlands
The loan-to-income ratio has remained high throughout the past decade, especially for younger generations. The mortgage debt of the 30-35 age group was on average 5.7 times higher than their disposable income in 2014, having improved slightly from a ratio of 6.1 in 2012, according to Statistics Netherlands.
Households’ financial distress has risen in the past decade. The increasingly high level of debt has led to more households finding it difficult to repay their loans. The number of households with mortgage payment arrears of more than four months has increased, from around 35 000 in October 2008 to 112 000 households in October 2015, according to the credit bureau BKR (20). The number of applications for consumer insolvency remains low. This is most likely due to features of the consumer insolvency procedure that make it unattractive to households with negative housing equity, as they are not guaranteed a debt discharge at the end of the insolvency procedure (see Box 2.4.1).
20 ()BKR Hypotheekbarometer: http://perskamer.bkr.nl.
29
2.4. Private sector indebtedness
Box 2.4.1: Consumer insolvency
Given the high stock of household debt in the Netherlands, one would expect more households to apply for consumer bankruptcy. However, debt rescheduling applications and debt discharge remain low. In 2014, 17 619 people applied for debt restructuring under the law covering natural persons (Wet schuldsanering natuurlijke personen (Wsnp), introduced in 1998). Of these, 70 % were admitted to the procedure (see Table below). This compares to 777 000 persons that had difficulties meeting their payment obligations on non-housing loans (not including payments to tax authorities, housing corporations, health insurance companies or study loans), according to the credit bureau BKR, and 112 000 households with mortgage payment arrears of more than four months in mid-2015. According to Statistics Netherlands, 1.5 million households held negative housing equity in 2014. Despite this still high number, the consumer insolvency procedure is not so attractive for holders of negative housing equity, because debt discharge may not be granted.
Table 1: Debt restructuring and bankruptcy
Source: Statistics Netherlands and Bureau WSNP
Consumer bankruptcy procedures are generally more creditor-oriented in the Netherlands, meaning that secured creditors are often not affected by debt rescheduling or bankruptcy procedures, as their claims remain valid. Full recourse loans (including mortgages) make it difficult for debtors to dispose of their debt and get a fresh start. An important feature of the consumer insolvency procedure is that the outcome of a debt restructuring or bankruptcy does not necessarily entail a debt discharge.
The Wsnp establishes an elaborate settlement procedure. Applications are only admissible if previous out-of-court negotiations have failed. When Wsnp debt restructuring is launched, a period of good conduct is imposed, generally three years, but possibly up to five years. During this period the debtor has to work and is granted an income comparable to the minimum wage by the rescheduling administrator. Other earnings and any income from foreclosed property flow into debt repayment. The administrator directly receives and checks all of the debtor’s mail during the first 13 months of the period of good conduct. At the end of this period, it is decided whether the debtor has fulfilled all the criteria and may be considered for debt discharge. If discharge is refused, the debtor may be declared bankrupt, which would lead to the appointment of a curator who evaluates whether more property can be sold. If the bankruptcy procedure does not yield sufficient income, the outstanding claims are not written off, but creditors may pursue the recovery of their claims again. In 2014, only 80 % of all debtors undergoing debt restructuring obtained a fresh start (debt discharge). 18 % were declared bankrupt or the restructuring was terminated as no other property could be used for redistribution to creditors. For those 18 %, the residual debt claims remain valid, meaning that creditors can continue to enforce their claims.
The procedure has no clear-cut rules on the treatment of housing property. In 2012, the national advisory body Recofa recommended that any property above value should be sold, while undervalued housing should be treated on a case-by-case basis. Hence, debtors with negative housing equity may have their house excluded from foreclosure. This means that even after three years of good conduct, the remaining debt may not be eligible for discharge, so creditors’ outstanding claims remain valid and can be enforced. Hence, the debtor’s situation may potentially be worse after debt rescheduling, as the residual housing debt remains, despite the period of good conduct. This feature of the Wsnp makes the consumer bankruptcy procedure very unattractive to those with negative housing equity.
30
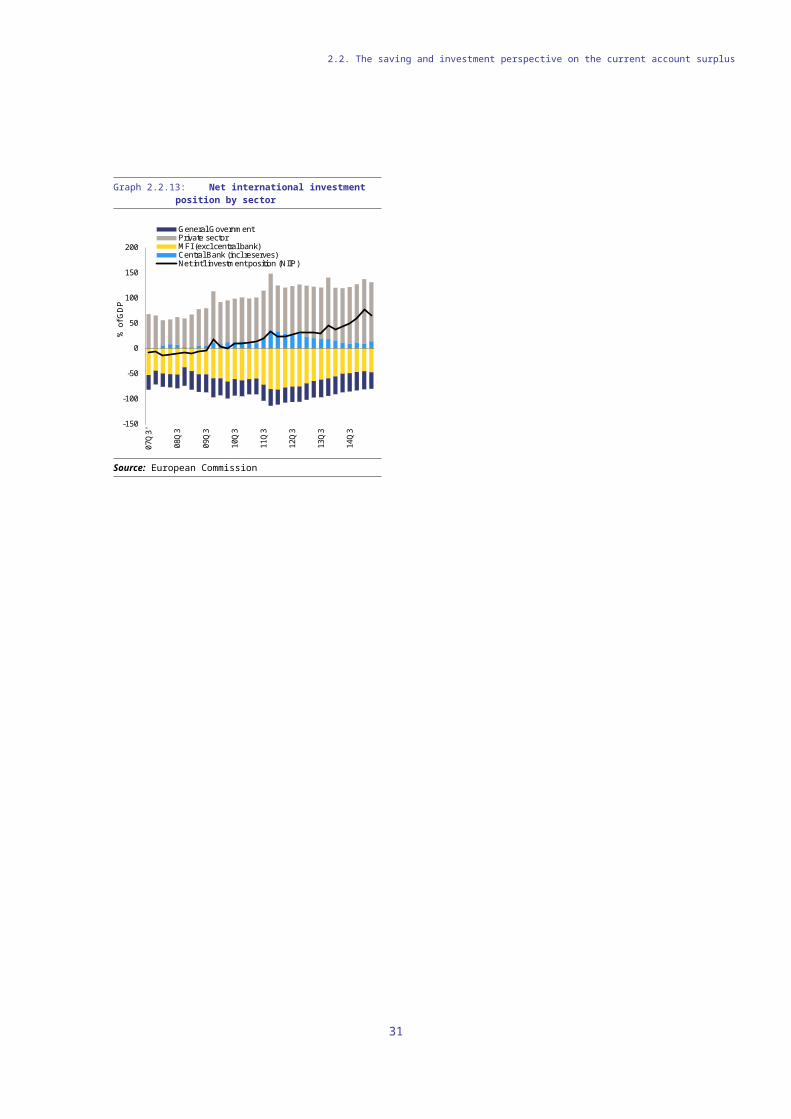
2.4. Private sector indebtedness
Non-financial corporate sector debt
Supported by high savings flows, non-financial corporations have continued to strengthen their balance sheets. In relation to GDP, the sector’s total financial liabilities have remained broadly stable since the global financial crisis (Graph 2.4.4). Debt-type instruments (debt securities and loans) rose from 112 % of GDP in 2010 to 117 % in 2014 on a consolidated basis, while equity liabilities rose from 112 % of GDP to 116 % in 2014. However, given the large financial surplus of NFCs, this has allowed corporations to increase their gross asset position commensurately, leading to a rapid — and virtually unbroken — rate of improvement in the sector’s net financial asset position. Since the crisis, financial interlinkages between parent companies and their subsidiaries have risen, as measured by the gap between consolidated and non-consolidated liabilities; this gap is accounted for by both (intra-company) loan and equity instruments.
Graph 2.4.4: Balance sheet of the non-financial sector
-250
-150
-50
50
150
250
350
00 01 02 03 04 05 06 07 08 09 10 11 12 13 14
% o
f GD
P
Debt securitiesOther liabilitiesEquityLoansTotal liabilities (non-consolidated)Total liabilities (consolidated)Net financial assets (consolidated)
Source: European Commission (Eurostat)
Graph 2.4.5: Credit demand and supply, loans to NFCs
-100
-80
-60
-40
-20
0
20
40
60
80
100
120
06 07 08 09 10 11 12 13 14 15 16
net w
eigh
ted
perc
enta
ges
(4q
av.)
Credit termsCredit standardsLoan demand
Bank lending survey results; positive readings indicate tightening credit standards, more expensive loan terms or rising loan demandSource: DNB, European Commission
Debt flows turned negative in 2014, but are consistent with an incipient turn in the credit cycle towards corporate re-leveraging. Following three consecutive years of positive debt liability flows in the non-financial corporate sector, 2014 saw debt flows turn moderately negative. This credit contraction was underpinned by slightly negative flows for both corporate loans liabilities and debt securities. While this may seem at odds with the expected credit cycle in an economic upswing, the extent of credit contraction is comparatively small and may partly reflect the substitution of external for internal funding. Furthermore, quarterly (non-consolidated) transaction data for the first two quarters of 2015 show positive liability flows for both loans and debt securities, suggesting that the active deleveraging seen in 2014 did not persist in 2015. Finally, the DNB bank lending survey results show an increase in loan demand in 2015, particularly in the second half of 2015, while also suggesting that credit conditions eased slightly in 2015 due to competitive pressure and falling risk perceptions (see Graph 2.4.5).
Corporate debt sustainability is being supported by the return to real economic growth. The Netherlands’ positive GDP growth of
31
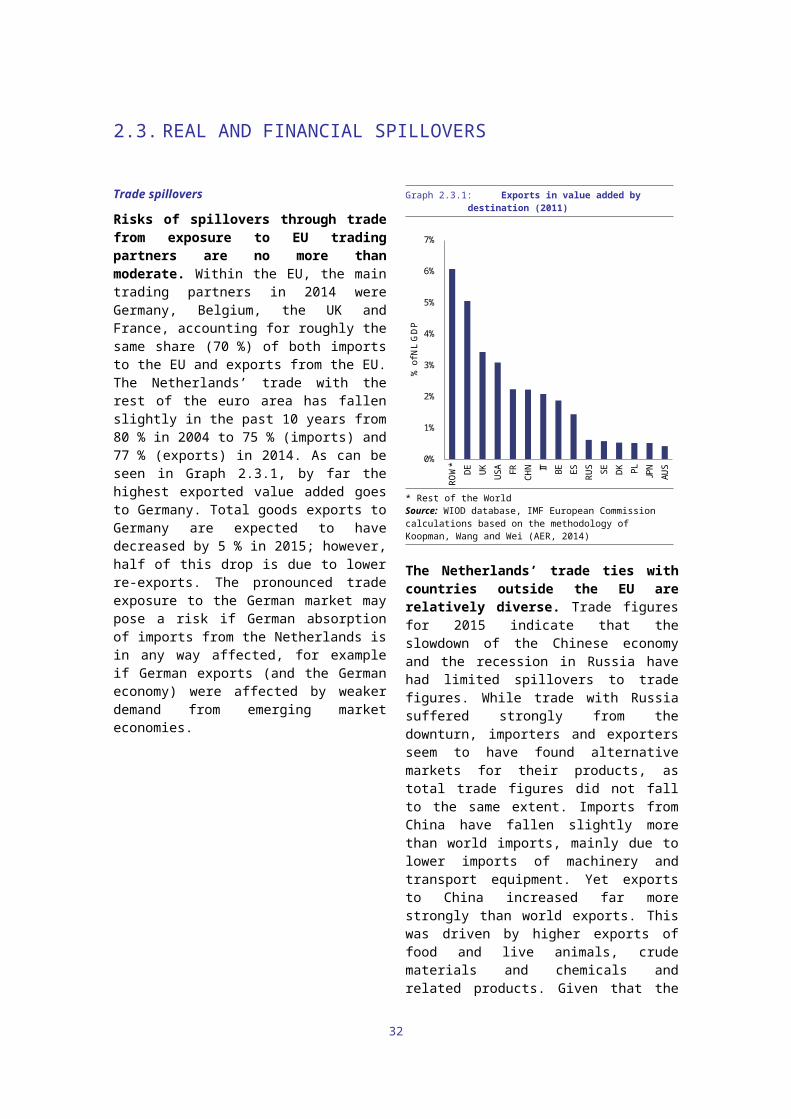
2.4. Private sector indebtedness
1.0 % in 2014 helped to stabilise the corporate debt/GDP ratio (Graphs 2.4.6 and 2.4.7). Although weaker than in previous years, inflation remained positive in 2014, with the GDP deflator rising by 0.9 % in 2014 so reducing any fall in the debt/GDP ratio. A large stock-flow adjustment contributed around 7 pps. to the rise in the corporate debt/GDP ratio (Graph 2.4.6). This is mainly explained by changes in methodology that caused a structural break in the underlying data series. Taking these developments into account, overall corporate indebtedness remains broadly stable and balance sheet risks are declining. Graph 2.4.7 plots the debt/GDP ratio with alternative measures of financial leverage, most of which show a slightly declining and unbroken trend in 2014.
Graph 2.4.6: Debt/GDP ratio change and contributions for NFCs (consolidated)
-10
-8
-6
-4
-2
0
2
4
6
8
10
02 03 04 05 06 07 08 09 10 11 12 13 14
y-o-
y ch
ange
Credit flow Real growth InflationOther changes D/GDP, change
Source: European Commission (Eurostat)
Graph 2.4.7: Leverage of NFCs
0
20
40
60
80
100
120
140
01 03 05 07 09 11 13 15*Rat
ios
of d
ebt t
o eq
uity
, GD
P a
nd to
tal f
inan
cial
as
sets
(%)
Debt / GDPDebt / equityDebt / financial assetsDebt / financial assets, consolidated
Source: European Commission
Declining interest rates are not yet visible in the corporate interest payment burden, while the risk profile of corporate debt is largely unchanged. Given the environment of historically low interest rates, implicit yields on the liabilities of non-financial corporations remained at low levels, but did not decrease much further in recent years, in contrast to the average yields of euro area NFCs (see Graph 2.4.8). This might be partly explained by the relatively long-term structure of corporate debt (Graph 2.4.9), which has seen little change in recent years. While risk factors in the NFC debt stock suggest no major change, low interest rates — also supported by the ECB’s fully-fledged asset purchase programme in March 2015 — should be expected to slowly improve debt sustainability as maturing corporate debt is refinanced at (significantly) lower interest rates.
32
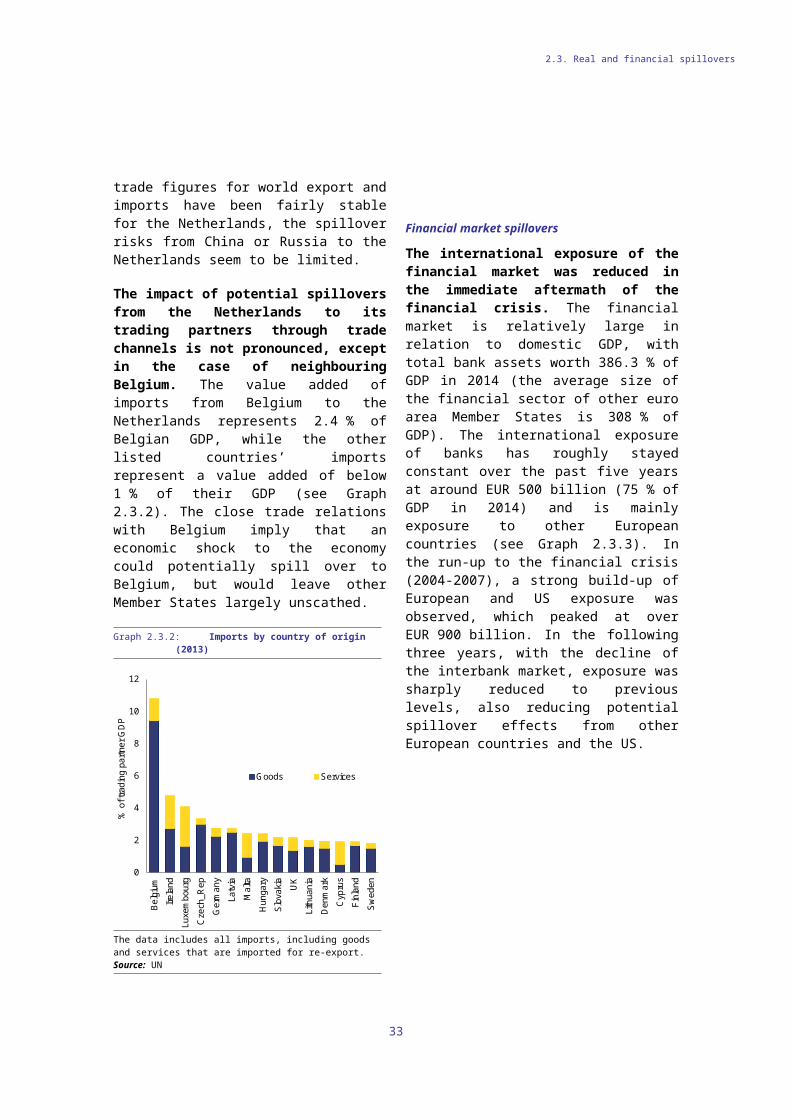
2.4. Private sector indebtedness
Graph 2.4.8: NFC loan interest and implicit yield
0
1
2
3
4
5
6
7
05 06 07 08 09 10 11 12 13 14 15
%
NL impl. yield (nat acc)EA19 impl. yield (nat acc)NL loan int. (outstanding)EA19 loan int. (outstanding)
Source: European Commission (Eurostat), ECB
Graph 2.4.9: Balance sheet repair, Non-financial corporations (non-consolidated)
0
10
20
30
40
50
60
70
80
98 99 00 01 02 03 04 05 06 07 08 09 10 11 12 13 1415*
% o
f tot
al fi
nanc
ial a
sset
s an
d de
bt
Volatile assets / total assets, Non-financial corporationsLong-term debt / total debt, Non-financial corporations
Source: European Commission (Eurostat)
33
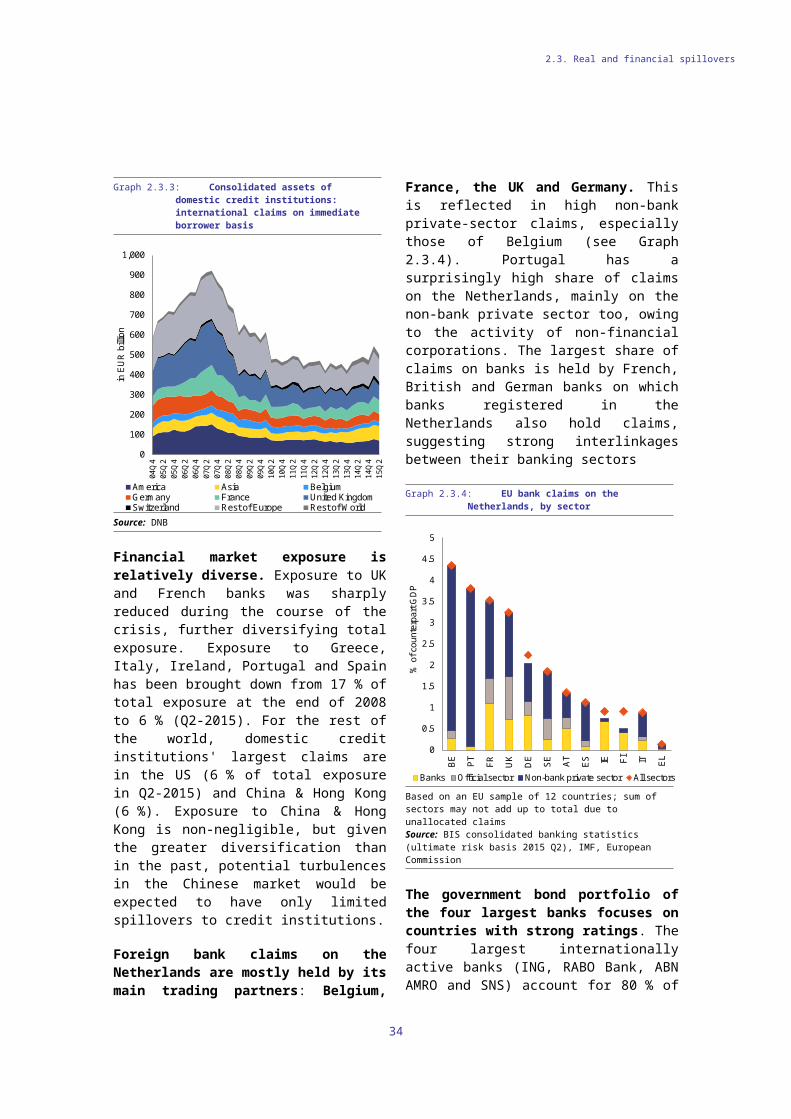
Market developments
The recovery of the housing market has gained further momentum in the past two years. The purchase price index for existing homes has been increasing steadily to reach 90 % of the 2010 prices, after having hit an historic low in June 2013 (see Graph 2.5.1). Housing market transactions have also recovered from the slump, to more than 21 000 in December 2015 — almost twice as many as in December 2013. Over the last 10 years, the housing market has adjusted sharply in response to its previous overvaluation. Based on Commission calculations, house prices are currently valued at their equilibrium level (see Graph 2.5.2), as the difference between actual prices and their filtered trend is close to zero.
Graph 2.5.1: Evolution of house prices and number of transactions
5,000
8,000
11,000
14,000
17,000
20,000
23,000
80
85
90
95
100
105
110
Jan-
09Ju
n-09
Nov
-09
Apr
-10
Sep
-10
Feb-
11Ju
l-11
Dec
-11
May
-12
Oct
-12
Mar
-13
Aug
-13
Jan-
14Ju
n-14
Nov
-14
Apr
-15
Sep
-15
TransactionsIndex price, 2010 = 100
Index purchase price (left axis)Number of dwellings sold (right axis)
Source: Statistics Netherlands
The pace of the housing market recovery varies across the different regions of the Netherlands (see Graph 2.5.3). Since the end of 2013, the four largest cities (Amsterdam, The Hague, Rotterdam and Utrecht) have been experiencing substantially higher growth rates in housing prices than the rest of the Netherlands. Amsterdam is even close to reaching the pre-crisis levels of 2008 again, while provinces like Overijssel in the north-east and Zeeland in the south-west are still almost at 2013 levels (which marked the trough of the fall in housing price). The highest growth rates between January and September 2015 were recorded in the
provinces of North Holland and Utrecht, where the large cities of Amsterdam and Utrecht are located. These high growth rates also suggest that there is a mismatch between supply and demand in housing in these cities. Lower supply than demand, together with a distorted rental market will necessarily lead to high price growth.
Graph 2.5.2: Overvaluation gap with respect to main supply and demand fundamentals
-4
-2
0
2
4
6
8
10
12
14
00 01 02 03 04 05 06 07 08 09 10 11 12 13 14
The methodology is described in: European Commission (2012): ‘Focus: Assessing the dynamics of house prices in the euro area’, Quarterly report on the euro area, Volume 11, Issue 4. December 2012.Source: European Commission
The recovery of the housing market is expected to continue. Consumer sentiment is positive; the housing market sentiment indicator Eigen Huis Marktindicator reached an all-time high in October 2015 (21). The number of construction permits issued rose sharply in 2014, after a steep downturn in residential construction in 2007-2013. The year-on-year growth rate of building permits issued peaked at 45 % in the first quarter of 2015 and remains positive for the other quarters in 2015. The provinces with the largest share of newly issued building permits — North Brabant, Gelderland, South Holland and North Holland — also have the strongest urban population growth. In the long run, this could reduce the supply and demand mismatch. The trend in growth rates of
21 ()The Eigen Huis Marktindicator is available at www.eigenhuis.nl/woningmarkt/marktindicator. The indicator was launched in 2004.
34
2.5. THE HOUSING MARKET
2.5. The housing market
building permits issued is positive, but volatile, for all provinces, indicating a country-wide recovery of the building sector.
Graph 2.5.3: Housing price index year-on-year growth in %, Q3 2015
Source: Statistics Netherlands
Looking at the value of construction permits, the recovery in the residential construction sector is strongly driven by institutional investors. For January-September 2015, the value of their investments is above 2014 levels. In the same period, private buyers obtained residential construction permits worth EUR 1 453 million, twice as much as those obtained by government and social housing corporations. This data underscores the positive trend in the recovery of the residential sector, especially for private and institutional investors.
Structural aspects and policy
The housing market in the Netherlands is divided into a large owner-occupied segment, a small private rental market and one of the largest social housing sectors in the EU. Roughly 60 % of households live in a home that they own (they are owner-occupiers). This is in line with the EU average, but the percentage of owners with outstanding mortgages is much larger (NL: around
53 %; EU: 27 %). The private segment represents roughly 10 % and social housing 30 %.
Graph 2.5.4: User cost of owner-occupied housing and contribution of taxes
-2
-1
0
1
2
3
4
5
6
7
8
-1.5
-1.0
-0.5
0.0
0.5
1.0
1.5
2.0
2.5
NL IE FI AT DK SE DE PT LU UK IT ES BE FR EL(Current) tax on imputed rent Capital gains taxMortgage tax relief Recurrent taxTransfer tax Tax-adjusted cost (right axis)
perc
enta
ge p
oint
s
%
Tax-adjusted user cost expressed in percentage of an additional euro of house value (right scale). The bars (left scale) depict the contribution of taxes. No data available for Cyprus. The tax rules used were applicable in May 2015 to the purchase of an existing dwelling. For the underlying assumptions and methodology, see Tax Reforms in EU Member States 2014.Source: European Commission
High home ownership rates are due to strong tax incentives. The taxation system allows full deduction of mortgage interest payments on an individual’s main residence from taxable income. These arrangements contrast with those of other EU Member States, where mortgage interest payments are typically not (or only partly) tax-deductible, with Sweden and Denmark being prominent exceptions as Member States where deductions are relatively generous. From a taxpayer’s perspective, mortgage interest deductibility (MID) lowers the user cost of owner-occupied housing, which recent research by the Commission shows is the lowest in the Netherlands among all EU Member States, not least due to the very large (negative) contribution from mortgage interest tax relief (see Graph 2.5.4) (22). MID represents a significant fiscal cost to the government through lost revenue, while
22 ()European Commission (2015): ‘Tax reforms in EU Member States’, Institutional Papers, No 008.
35
2.5. The housing market
various studies stress the regressive nature of the incentive (23).
Although still generous, both the tax treatment of mortgage interest and general mortgage lending rules have been progressively tightened in the Netherlands since 2013. The measures adopted in 2012 — with effect from 1 January 2013 — limited mortgage interest to fully amortising loans, at a gradually diminishing top marginal tax rate. Whereas the previous system allowed mortgage interest to be deducted at the highest applicable marginal tax rate (typically 52 %), the new rules are intended to cut this by 0.5 pp. per year to a maximum rate of 38 % by 2041 (Graph 2.5.5). The benchmark yield for imputed rental income for owner-occupied housing, which is added to total taxable income before MID, was also raised in steps, to 0.75 % of a property’s cadastral value (WOZ waarde) in 2015, and remains unchanged in 2016. Box 2.5.1 discusses the financial impact of the reduction in MID.
While the measures introduced in 2012/2013 limit the risks of household over-indebtedness stemming from adverse housing market developments, their effectiveness cannot be fully assessed yet, as the reforms stretch over a long period. So far, limited change has been seen in the strong bias towards housing debt and general household indebtedness. Regarding the reduction in MID, most recent DNB data suggest that newly-issued interest-only loans remain high: from 2013 to 2015, they accounted for roughly one third of newly issued loans. However, most of these loans were re-negotiated and therefore relate to longer-standing mortgages, which still qualify for the MID.
23 ()For an overview see European Commission (2015): ‘Housing Taxation: From micro design to macro impact’, Quarterly Report on the Euro Area, Vol. 14, No1.
Graph 2.5.5: Top marginal tax rate for MID
0%
10%
20%
30%
40%
50%
60%
2012 2016 2020 2024 2028 2032 2036 2040 2044
Top
mar
gina
l rat
e of
inte
rest
ded
uctib
ility
Pre-reform
Post-reform
Source: European Commission
Some steps have been taken to reform the social housing sector. The social housing sector in the Netherlands is the largest in the EU, representing roughly 30 % of the country’s housing market. Some 80 % of the 2.9 million rental homes are owned by housing corporations (24). Waiting lists are long and many flats are rented out to tenants above the income threshold. In July 2015, a new housing act (Woningwet) entered into force. Its aim is to ensure that housing corporations focus on their core task: to provide affordable housing to low-income earners. One important feature of this act is that at least 90 % of all social housing should be provided to low-income earners, i.e. only 10 % can be allocated freely. This criterion, however, applies only to newly rented flats; it does not have implications for current tenants. Furthermore, the House of Representatives adopted the Rental Market Mobility Act (Wet Doorstroming Huurmarkt 2015) in February 2016 and sent it to the Senate for approval. This act includes the introduction of the 'rental sum approach' (huursombenadering) in January 2017, which aims at improving mobility in the housing market by allowing for an extended system of income-related rent increases. Until its introduction, the current system of income-related rent increases, introduced in 2013 stays in place.
24 ()Housing Europe (2015). ‘The State of Housing in the EU 2015’, Housing Europe Review.
36
2.5. The housing market
37
Box 2.5.1: Mortgage interest deductibility reform in the Netherlands
This box assesses the financial impact of the reduction in the MID tax rate on debt servicing costs and house prices, as well as providing indicative simulations of further housing taxation reform.
While the homeownership rate in the Netherlands is in line with the euro area average, the uncapped deductibility of interest payments explains the high gross revenue costs of over 2 % of GDP per year due to MID, which are only partly compensated for by taxation of imputed rent. This implies that further MID reform can have a potentially sizeable financial impact on households’ and the state’s finances.
The following simulations of the impact of tapering down the applicable MID tax rate to 38 % over a 28-year horizon, which corresponds to the current MID reform, are based on a simplified loan scenario (4 % interest fixed for a 30-year annuity mortgage, starting in 2016). The representative taxpayer in this exercise is assumed to be in the highest tax bracket (52 % income tax). Within these simulation parameters, the following results (in percentage terms) are valid across all loan sizes. Graph 1a shows debt service costs under the above assumptions, both under the post-reform rules (tapered MID rate) and the previous regime (52 % standard deduction rate). Using the debt service costs of an unsubsidised annuity mortgage as a benchmark, the new rules ensure a faster decline in the implicit discount on debt service costs (before imputed rent taxation) than the old rules. This difference increases in the first years of the mortgage due to the rising differential in the applicable MID tax rate (see Graph 2.5.5), peaking in the middle years of the loan period. Thereafter, the convexity of the interest payment schedule reduces the impact of a declining tax rate on debt service costs. In cash terms, the MID rate reduction would reduce the subsidy to a homeowner with a newly and fully debt-financed property at the national average value by around EUR 520 in the middle years of the mortgage. Expressed in net present value terms (assuming a uniform discount rate of 1 %) the reform has reduced the implicit debt service cost discount from 33 % to 29 % of the debt service costs of a non-deductible mortgage, i.e. by slightly more than one tenth (independent of loan size).
Graph 1: Impact of MID rate taper and further reform options
Source: European Commission
Notwithstanding the less generous MID rules applicable from 2013 onwards, the implicit subsidy to owner-occupied housing remains substantial. Estimates by the Commission suggest that even under the new rules, house prices are likely to be inflated by around 20 % compared to a ‘no-MID’ scenario. This estimate is based on the assumption that households seek to keep debt service payments at the same level as in an MID
-25%
-20%
-15%
-10%
-5%
0%
2016 2020 2024 2028 2032 2036 2040 2044
Deb
t ser
vice
dis
coun
t due
to M
ID (i
n pp
s)
Graph 1b: Further reform options (after imputed rent)
Baseline
Faster MID taper
higher imputed rentalyieldCombination ofreforms
-40%
-35%
-30%
-25%
-20%
-15%
-10%
-5%
0%
5%
2016 2020 2024 2028 2032 2036 2040 2044
Deb
t ser
vice
dis
coun
t due
to M
ID (i
n pp
s)
Graph 1a : Impact of MID rate taper (before imputed rent)
Impact on debt service costsdue to reformGross discount (after reform)
Gross discount (beforereform)
(Continued on the next page)
2.5. The housing market
Box (continued)
scenario by reducing their willingness to pay for a given property. This estimate broadly corresponds to earlier estimates found in the literature (1).
The above simulations have so far ignored the role of imputed rent taxation. When accounting for this, the debt service discount relative to an unsubsidised mortgage is smaller and the effective subsidy falls to zero sooner in the lifetime of a mortgage (2). Graph 1b depicts as a baseline scenario the net discount — after imputed rent taxation — corresponding to the gross discount (after reform, before imputed rent taxation) shown in Graph 1a. Three further reform options are simulated relative to the baseline: A faster reduction in the top deductibility rate on mortgage interest from the current 0.5 pp. per year to 1.0 pp. per year from 2017 onwards until 2041 (‘faster MID taper’); an annual increase of 0.05 pp. in the imputed rental yield from 0.75 % in 2016 to 1.25 % in 2026 (‘higher imputed rental yield’); and the joint implementation of both. While the simulated impact depends on the calibration of the reform variables, the illustrated reform scenarios should not be considered overly ambitious (3). Faster tapering of the MID rate has a comparatively smaller impact on reducing the implicit subsidy to debt service than raising imputed rental yield, with the net present value of the subsidy falling by 29 % relative to the baseline scenario in the former and 15 % in the latter; the combination scenario results in a 43 % reduction in the discount. Given the aforementioned fiscal costs and macroeconomic distortions created by MID, these results could provide grounds for a faster phasing-out of the implicit subsidy to owner-occupied housing. (1) Ewijk, C. et al. (2010): ‘Welfare effects of fiscal subsidies on home ownership in the Netherlands’, manuscript; ter
Rele, H. and G. van Steen (2001): ‘Housing subsidisation in the Netherlands’, CPB Discussion Paper, No 002. (2) Cadastral property value (WOZ waarde) assumed to be 95 % of the purchase value; mortgage loan at 100 % LTV
(loan to value ratio). . (3) The increase in the MID taper is of the same size as in the initial reform, and the increase of the imputed rental yield
merely continues the stepwise rise that took place between 2013 and 2015. .
Despite the measures taken, substantial inefficiencies in the social housing sector remain, particularly in relation to dealing with those in need and long waiting lists. The problems of scheefhuurders and long waiting lists have not been solved. Scheefhuurders (literally translated ‘skew tenants’) are those tenants who earn above the income threshold for social housing, but occupy social housing because they were once eligible for it. According to an update of the WoON 2012 survey (25), 418 000 households are estimated to be scheefhuurders in 2015, as they earn above EUR 38 000 but live in regulated social housing, which corresponds to 15 % of all social housing tenants. Of those 418 000 households, only 36-38 % indicated that they were interested in moving to a different place. Scheefhuurders tend to stay in social housing longer than the average tenants (15-17 years for scheefhuurders; 13 years on average). While the total percentage of scheefhuurders in social housing has decreased, from 18 % in 2002 to an estimated 15 % in 2015, the number is still high. In 2013, a measure was introduced to address the problem of scheefhuurders by allowing housing corporations
25 ()ABF Research (2015): ‘Passend wonen’.
to apply higher rent increases to scheefhuurders. So far, the effect appears to be very small, as the problems of scheefhuurders and consequently long waiting lists remain.
Some efforts have been made to consolidate the social housing sector. The number of housing corporations fell from 389 in 2011 to 275 in 2013 due to various mergers (26). The total housing stock has increased slightly (by 0.4 %). The number of corporation dwellings has grown less than the housing market as a whole, as the social housing market share decreased from 31.3 % in 2011 to 30.1 % in 2013. In 2013, 0.6 % of the existing social housing market stock was sold to households, a similar ratio to the two previous years.
The private rental market is recovering for the second year in a row. The number of construction permits issued for rented apartments is expected to rise above 17 000 (extrapolated, based on data for January-November 2015), well above the 10 700 issued in 2013 (see Graph 2.5.6). The increase was greatest for institutional investors and private builders, who are expected to have received twice as many constructions permits in 2015 as in 2013. The average rent increases of above 4 % in 2013 and 2014 also indicate a recovery of the rental market.
The private rental market is the only non-subsidised housing sector. Since subsidies for the other sectors are so large, there is much less of an incentive for institutional or private investors to enter the market and provide rental housing. At the same time, the generous tax incentives for home ownership make it less advantageous for households to pay relatively high market rents. The price-finding mechanism between supply and demand for the private rental market is distorted by subsidies in the other housing subsectors. As long as those tax advantages remain at elevated levels, they will continue to severely affect the functioning of the private rental market.
26 ()For more information, see Centraal Fonds Volkshuisvesting (www.cfv.nl).
38
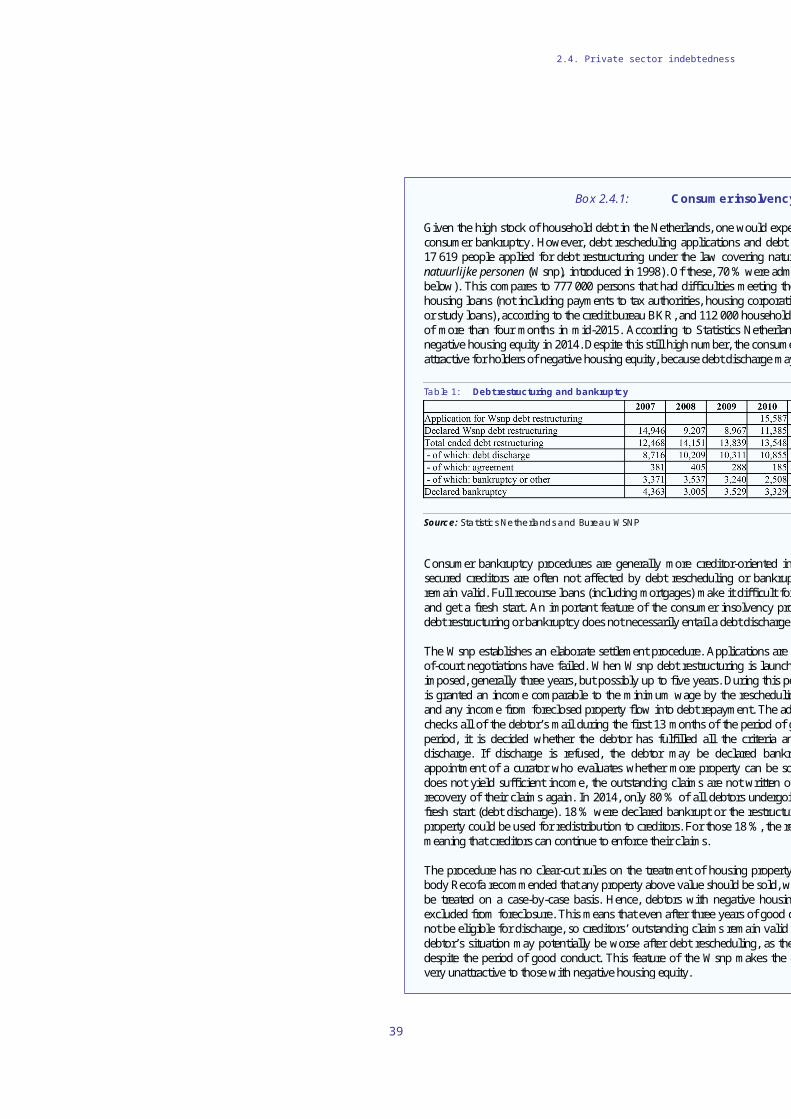
2.5. The housing market
Graph 2.5.6: Construction permits issued for rented apartments
0
5
10
15
20
25
30ths
Private buildersInstitutional investorsGovernment and housing corporations
Source: Statistics Netherlands
39
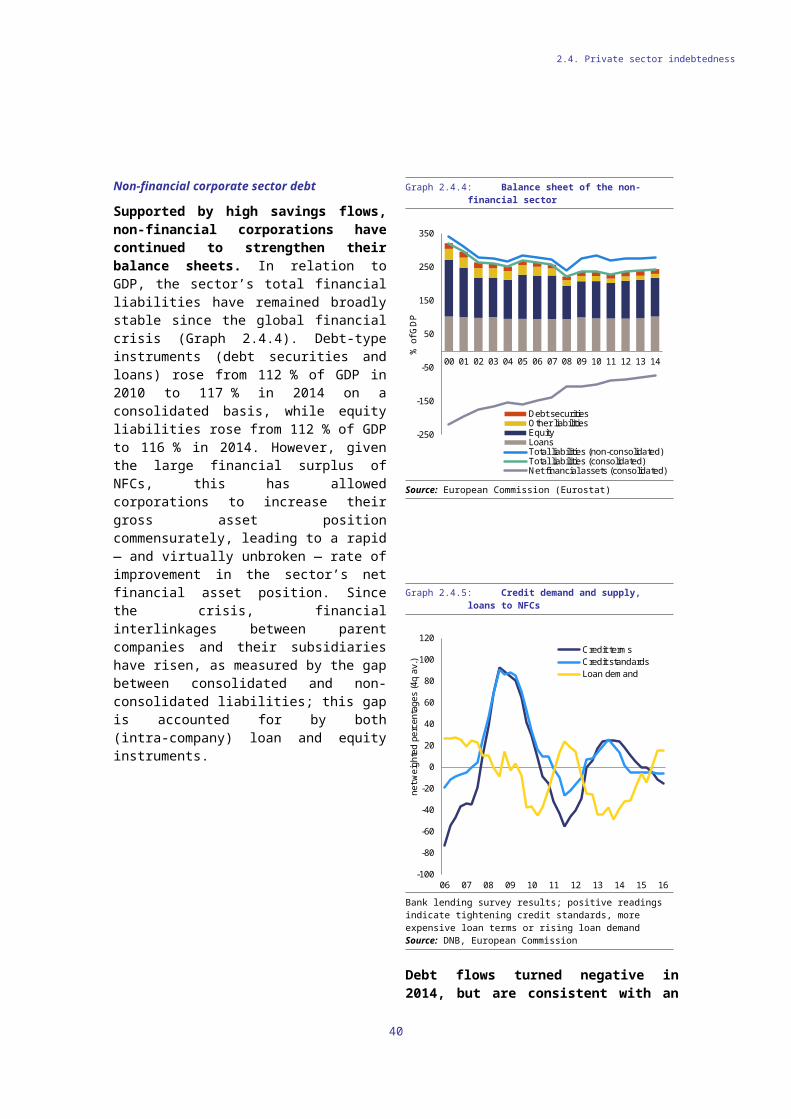
This MIP assessment matrix summarises the main findings of the in-depth review in the country report. It focuses on imbalances and adjustment issues relevant for the MIP.
Table 2.6.1: MIP assessment matrix (*) - Netherlands
Gravity of the challenge Evolution and prospects Policy response Imbalances (unsustainable trends, vulnerabilities and associated risks)
Current account The Netherlands has been recording persistent current account surpluses for three decades, averaging 6 % of GDP. Currently, the surplus stands at over 10% of GDP. As such it still contributes 0.6 pp. to the euro area surplus (by comparison, the German contribution increased to 2.3 % of euro area GDP).
The surplus is mostly structural. The economy has traditionally been a net lender to the rest of the world, which is mainly explained by the strong net lending position of non-financial corporations (7.5 % of GDP in 2014). The excess savings of non-financial corporations have increased since 2000, and are due to both a sharp increase in saving by foreign-owned multinationals, which distribute only a low share of their profits, and declining investment. The household sector also contributes to the surplus in response to relevant deleveraging needs, while the government is running a deficit.
Re-exports and to a lesser extent natural gas production underscore the positive trade balance, while the incentives in the regulatory framework and the tax system drive savings and investment decisions by households, multinational companies and the funded pension system that influence the income accounts.
Rising household savings in view of deleveraging needs played a major role in the surplus increase during the financial crisis, and its stabilisation afterwards.
Improved cyclical conditions and a relatively strong recovery of domestic demand in 2014/2015 are expected to lead to a slight decline in the surplus over the forecast horizon.
In addition, lower gas production is expected to lead to higher energy imports.
The government has announced a tax cut (0.7 % of GDP) mainly targeting low-income workers. The demand stimulus package is thus expected to slightly decrease the surplus through improving domestic demand.
(Continued on the next page)
40
2.6. MIP ASSESSMENT
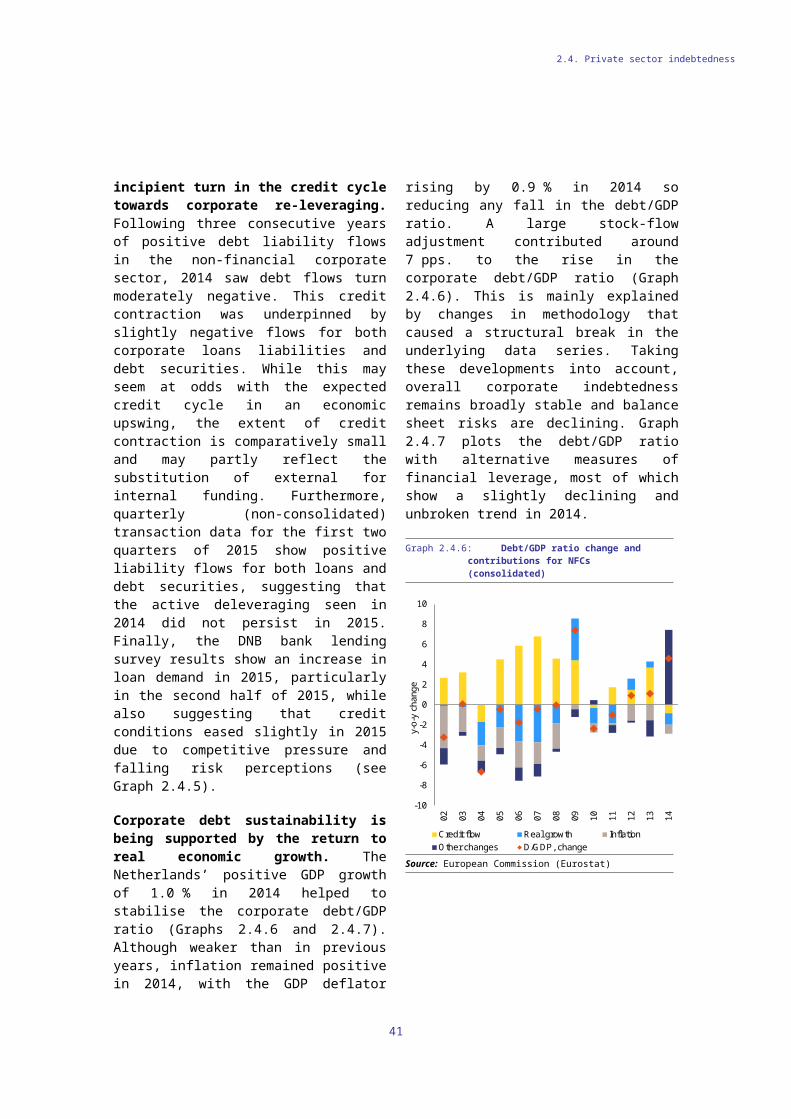
2.6. MIP assessment
Table (continued)
Private debt Private-sector debt as a percentage of GDP peaked in 2009 at 231 % of GDP and has since been decreasing very gradually, to 229 % in 2014.
In the past two decades, household debt has been growing rapidly reaching 112 % of GDP in 2014. The build-up of household debt was driven by regulatory settings, taxation incentives and large increases in both house prices and associated mortgage lending.
While household liabilities are large, in particular mortgage debt, they coexist with persistently large illiquid assets in the form of housing wealth and pension wealth.
The savings of households have been increasing compared to their disposable income since the mid-2000s and are now comparatively high (14.8 % of disposable income in 2014). Given the high level of debt, pressures on households to continue deleveraging remain.
Since 2012, the government has taken a series of policy initiatives targeted at the housing market. The most significant legislative changes relate to the eligibility for mortgage tax interest deductibility and the gradual reduction in the maximum deductible rate. The regulatory ceiling for the loan-to-value (LTV) ratio is gradually being lowered to 100 % by 2018. The measures are still insufficient and are being phased in only very slowly; faster implementation would be required to improve the financial resilience of households and reduce distortions in the housing market
Conclusions from IDR analysis
Among the euro area countries, the Netherlands has the largest current account surplus in terms of GDP, mainly due to structural features of the economy and policy settings. The household sector is characterised by a very large debt stock. The need for household sector deleveraging has contributed to the increase in the surplus since 2007.
The current account surplus has decreased slightly over 2014/2015 due to improved cyclical conditions and a relatively strong recovery of domestic demand. Nevertheless, household deleveraging has contributed to maintaining the current account surplus at its high level, but needs to proceed further as the outstanding household debt is still large.
The government has taken measures to support the household deleveraging process, but phasing-in is slow. A tax package is expected to strengthen consumption and thus contribute to a declining surplus in 2016.
(*) The first column summarises ‘gravity’ issues which aim at providing an order of magnitude of the level of imbalances. The second column reports findings concerning the ‘evolution and prospects’ of imbalances. The third column reports recent and planned relevant measures. Findings are reported for each source of imbalance and adjustment issue. The final three paragraphs of the matrix summarise the overall challenges, in terms of their gravity, developments and prospects, policy response.Source: European Commission
41
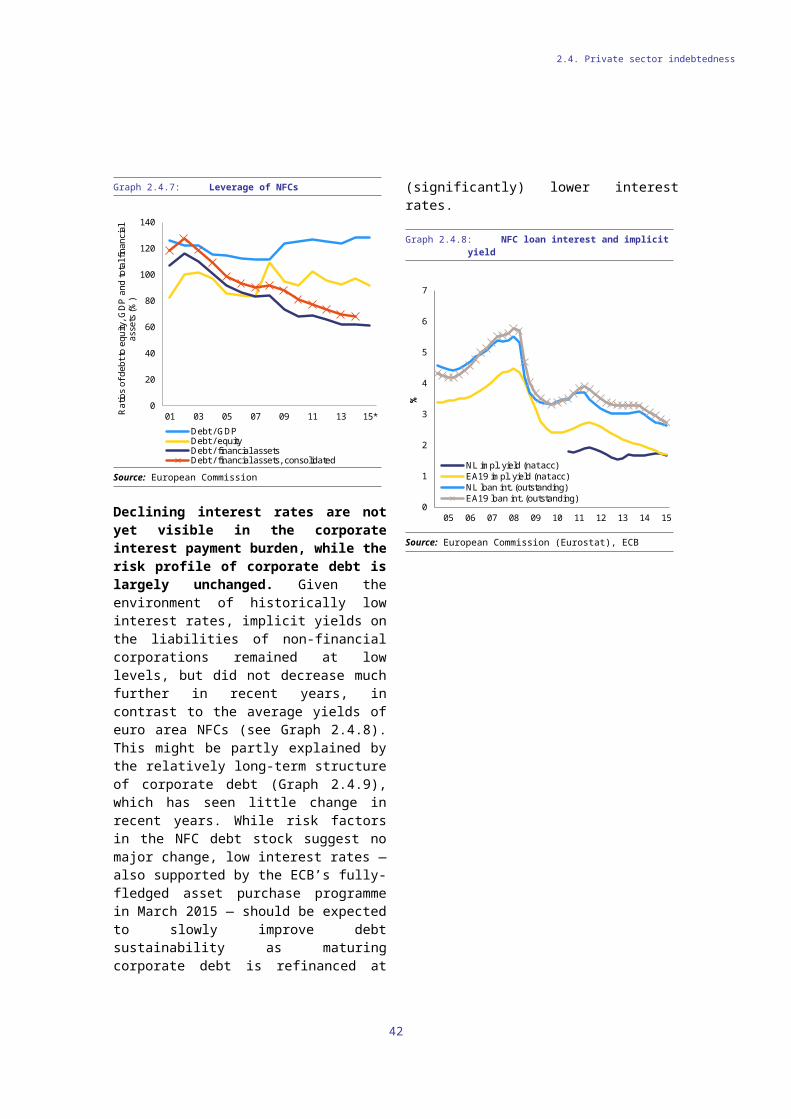
Taxation
The total tax and non-tax burden on labour is high in the Netherlands. Labour taxes make up a relatively large share of total tax revenues. Whereas revenues from personal income taxes, expressed as a percentage of GDP, are below the EU average, revenues from social contributions are the second highest in the EU due to high revenues from employee contributions. In addition, non-tax compulsory payments on labour activity are substantial in the Netherlands, increasing employers’ labour costs and reducing employees’ net earnings in a similar way to taxes (27). Graph 3.1.1 shows the ‘tax wedge’ on labour for a single person who earns the average wage (28). Non-tax compulsory payments are included, showing the high burden on labour in the Netherlands.
The high tax and non-tax burden on labour combined with relatively high reservation wages creates disincentives to work. The inactivity trap is among the highest in the EU, with labour taxes making a substantial contribution to the disincentive effect. The unemployment trap is among the highest as well, although taxation’s contribution to the disincentive is relatively small (29).
27 ()Non-tax compulsory payments are compulsory payments in relation to employment that do not qualify as taxes or social security contributions because they are ‘requited’ (offset by benefits) or they are made to an organisation outside the general government. In the Netherlands, these payments include employer and employee pension and healthcare insurance contributions to privately managed funds. See http://www.oecd.org/tax/tax-policy/Non-tax-compuslory-payments_2014.pdf .
28 ()The tax wedge on labour represents the difference between the total labour cost of employing a worker and the worker’s net earnings. It is defined as personal income tax and employer and employee social security contributions (net of family benefits) as a percentage of total labour costs (the wage and employer social security contributions).
29 ()The unemployment trap measures the short-term financial incentive for an unemployed person receiving unemployment benefits to move to paid employment. The
Graph 3.1.1: Compulsory payment wedge, single person earning the average wage (2014)
0
10
20
30
40
50
60
BE NL IT AT
DE
HU FR EA
RO FI LV EU SK
CZ
SE SI
EE PT LT ES PL
EL
HR
DK LU BG UK IE MT
Income tax Employer contributionsEmployee contributions Non-tax payments
Source: OECD. The OECD does not provide data on non-tax payments for non-members.
A sizeable unfinanced tax cut has been introduced to increase financial incentives to work. While incremental, but relatively minor, measures were introduced in recent years, the Netherlands published a sizeable package of tax measures in September 2015. The in-work tax credit was increased, while the rate applicable in the second and third income tax brackets was reduced from 42 % to 40.15 %, both from 1 January 2016. To boost employment among low-skilled workers, a wage cost subsidy for low-income earners will be introduced in 2017. To stimulate labour participation further, the childcare allowance is being increased by EUR 0.3 billion in 2016 and an additional EUR 0.2 billion in 2017. The total budgetary impact of the policy package
inactivity trap measures the short-term financial incentive for an inactive person not entitled to unemployment benefits (but potentially receiving other benefits such as social assistance) to move from inactivity to paid employment.
42
3. ADDITIONAL STRUCTURAL ISSUESIn addition to the imbalances and adjustment issues addressed in section 2, this section provides an analysis of other structural economic and social challenges for the Netherlands. Focusing on the policy areas covered in the 2015 country-specific recommendations, this section analyses issues related to taxation and the fiscal framework, labour market developments and challenges, recent productivity-related developments, as well as energy, transport and climate challenges.
3.1. TAXATION, SUSTAINABILITY OF PUBLIC FINANCES AND FISCAL FRAMEWORK
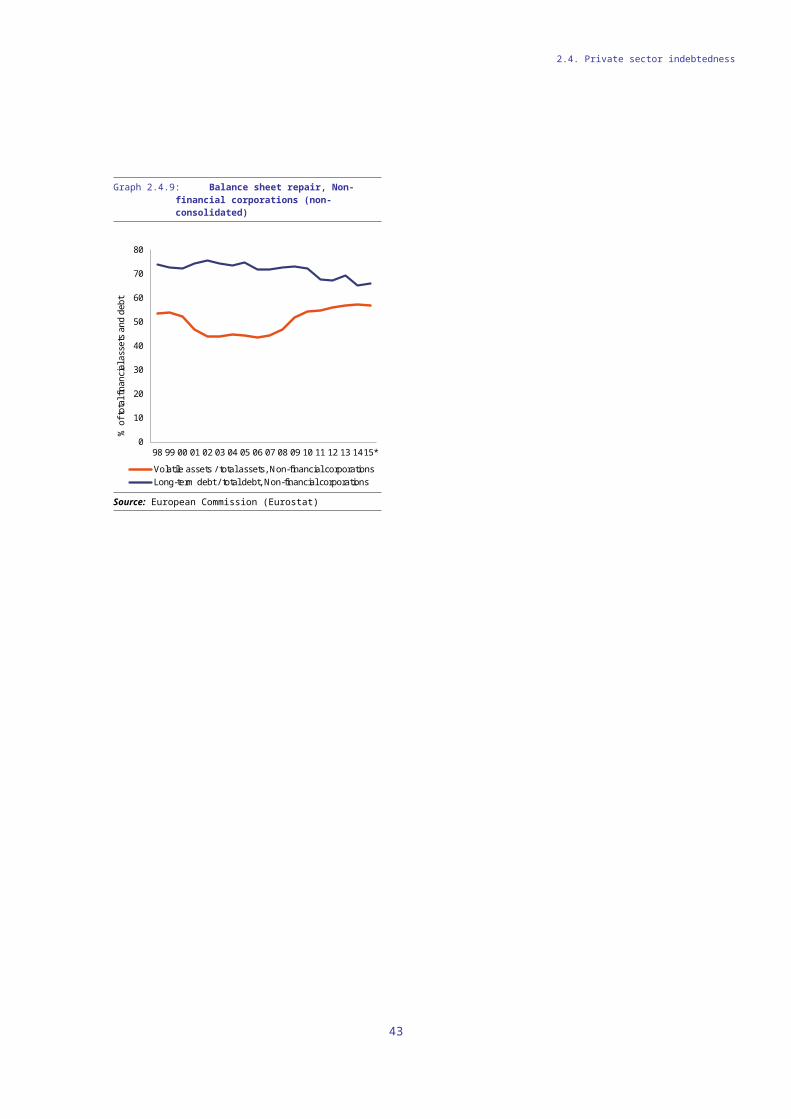
3.1. Taxation, sustainability of public finances and fiscal framework
amounts to EUR 5 billion (0.7 % of GDP), of which EUR 4.4 billion is for tax measures and EUR 0.6 billion expenditure measures. The CPB has estimated that, once fully implemented, the policy package could create 35 000 jobs in the long run (30).
Several features of the Netherlands’ tax system can be used in structures for aggressive tax planning (31). The absence of anti-abuse rules (32) and the absence of withholding tax on outbound interest and royalties vis-à-vis non-EU countries are particularly relevant. Furthermore, some tax deductions for deemed interest cost (33), excess-profit rulings (34) and the patent box regime can prompt or facilitate aggressive tax planning without sufficient safeguards. In addition, the inward and outward foreign direct investment stock expressed as a percentage of GDP amounted to approximately 500 % and 600 % of GDP in 2014. Around 80 % of these positions were held by ‘special purpose entities’ (35), suggesting that the Netherlands is used by multinational companies to
30 ()The CPB uses its recently developed microsimulation model for the analysis of tax and benefit reforms (MICSIM) for this purpose. One key empirical finding embedded in this model is that labour supply elasticities are lower for women than was previously understood.
31 ()For an overview of the most common structures for aggressive tax planning and the provisions (or lack thereof) necessary for these structures to work, see Ramboll Management Consulting and Corit Advisory (2016), Study on Structures of Aggressive Tax Planning and Indicators, European Commission Taxation Paper No 61. Note that country-specific information in this study refers to the state of play by May/June 2015.
32 ()For example, there is no beneficial-owner test for reducing dividend withholding tax; the tax deduction for interest is not linked to the tax treatment in the creditor Member State; there are no rules to counter mismatches in the tax status of domestic companies or partnerships and those of a foreign state.
33 ()The Ramboll study on aggressive tax planning explains that ‘if a Member State offers a tax deduction for interest costs which have actually not accrued as a result of non-arm’s-length conditions being applied to an inter-company debt, there is a risk of aggressive tax planning if such a tax deduction is not contingent on a corresponding adjustment in the state of the creditor company’.
34 ()By ‘excess-profit rulings’, the Ramboll study is referring to regimes that ‘offer a tax exemption of a portion of local company profits to the extent that they are deemed to exceed a normal arm’s-length profit. This practice can be agreed with the tax authorities in the form of a ruling, and targets profits earned on transactions with related parties (i.e. member companies of the group).’ In the Netherlands, profit deemed to have been left to a company by its shareholders is treated as an informal capital contribution and remains untaxed following case law established by the Supreme Court of the Netherlands.
channel tax-driven financial flows to other jurisdictions.
Long-term sustainability of public finances
The Netherlands is at medium risk in terms of fiscal sustainability. Government debt, currently above Treaty threshold of the 60 % of GDP (at 68.2 % of GDP in 2014) is expected to decrease to 65.1 % in 2017, partly thanks to increasing nominal GDP growth and partly thanks to the sale of financial assets and other debt-reducing measures. The Commission’s debt sustainability analysis for the Netherlands shows that government debt is likely to continue falling, to 62.5 % of GDP in 2024 to stabilise until 2026 (final projection year) (36). The projected excess over the 60 % of GDP threshold at the end of projection period places the country at medium risk under the baseline medium-term debt projections. The overall assessment of the debt sustainability analysis confirms the medium-risk category for the debt projection results under alternative risk scenarios, for example a negative shock (-0.5 pp.) on nominal GDP growth (Graph 3.1.2).
35 ()Source: European Commission (Eurostat). A special purpose entity is a legal entity that has little or no employment, operations or physical presence in the jurisdiction where it is located. It is related to another corporation, often as its subsidiary, and is typically located in another jurisdiction.
36 ()European Commission, 2014, "Assessing Public Debt Sustainability in EU Member States: A Guide", European Economy Occasional Paper, n. 200.
43
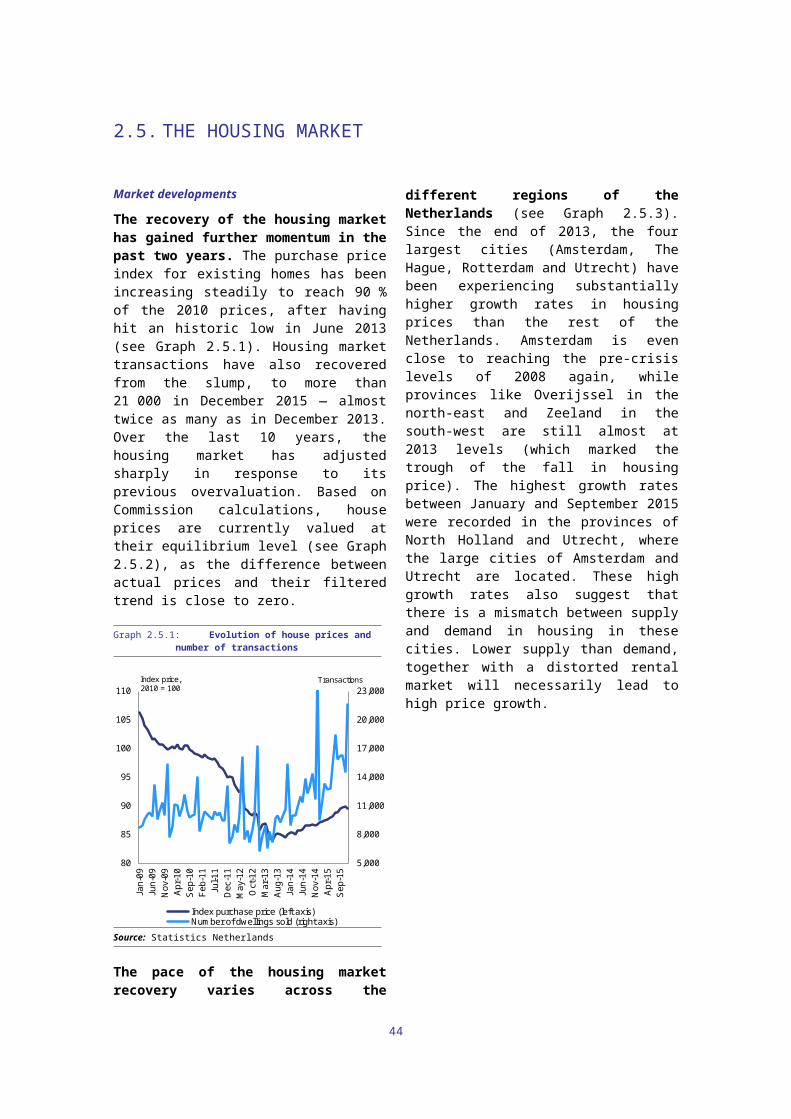
3.1. Taxation, sustainability of public finances and fiscal framework
Graph 3.1.2: Debt profile 2011-2026
50
55
60
65
70
75
80
2011 2016 2021 2026
Gro
ss p
ublic
deb
t as
% o
f GD
P
Baseline no-policy change scenario
Standardised (permanent) negative shock (- 0.5 pp.) on GDPgrowthStandardised (permanent) positive shock (+ 0.5 pp.) on GDPgrowth
Source: European Commission
The Netherlands has adopted substantial pension and long-term care reforms, with the aim of addressing its medium- and long-term fiscal sustainability risks. In the last three years the authorities have undertaken substantial structural reforms to address fiscal sustainability, in particular in the areas of pensions and healthcare. The official statutory retirement age is gradually being increased to 67 in 2021 and will be linked to life expectancy thereafter. Policy reforms and cost-cutting in healthcare have improved the long-term sustainability of government finances. Nevertheless, despite these recent efforts, compared to other European countries the projected increase in long-term care expenditure is still high, particularly in comparison with other euro area Member States. In the Netherlands, following the so called Ageing Working Group reference scenario (37), public expenditure on long-term care is set to increase from 4.1 % of GDP in 2013 to 7.1 % in 2060. For the euro area as a whole, both the baseline and the increase are much lower, from 1.7 % in 2013 to 3.0 % in 2016.
Fiscal framework
The Netherlands has a well-established fiscal framework. The main characteristics of the multiannual trend-based fiscal framework
37 ()See European Commission, The 2015 Ageing Report. Economic and budgetary projections for 28 EU Member States. European Economy 3 – 2015. http://europa.eu/epc/pdf/ageing_report_2015_en.pdf
currently in place are: (i) the use of independently derived macroeconomic assumptions; (ii) the use of real (i.e. inflation-adjusted (38)) expenditure ceilings, which are predetermined and cover the government’s entire term of office; (iii) the use of automatic stabilisers on the revenue side, and (iv) a well-defined budgetary process in terms of decision making and clear distribution of responsibilities, including the tasks of CPB and the Council of State (Advisory Division), which has been mandated to monitor compliance with numerical fiscal rules. Finally, the commitment to comply with European fiscal rules is embedded in the legal framework of the Netherlands.
The coverage of expenditure ceilings is wide, but does not include a number of expenditure categories. Four main categories do not fall under the current expenditure ceilings in the Netherlands: spending by local government, some tax expenditures, interest expenditures and revenues from natural gas. Local government spending is subject to a requirement to balance the budget (in the medium run). Tax expenditures add up to relatively large sums, especially mortgage interest deductibility (around EUR 11 billion in 2014, or 1.8 % of GDP), and deductibility of pension contributions (EUR 13 billion, 2.2 % of GDP). A number of smaller tax facilities, which together represent a significant amount, do not fall under any ceiling (for example, specific tax support for the self-employed, which is about 0.3 % of GDP). These categories are therefore not subject to the same high level of oversight.
The fiscal framework of the Netherlands operates reasonably well, but there is limited flexibility in the event of a serious downturn. The current multiannual planning creates stability in ‘normal times’, but provides limited flexibility to deal with unforeseen circumstances, in particular if expenditure ceilings have, with the benefit of hindsight, been based on overly optimistic growth forecasts. The application of ‘rolling mechanisms’ with multiannual expenditure ceilings updated on an annual basis according to pre-defined drivers (e.g. an update in macro conditions), the removal of cyclical expenditure from the ceilings (or a more frequent update), the
38 ()The expenditure ceilings are indexed by the deflator of domestic demand (prijs nationale bestedingen).
44
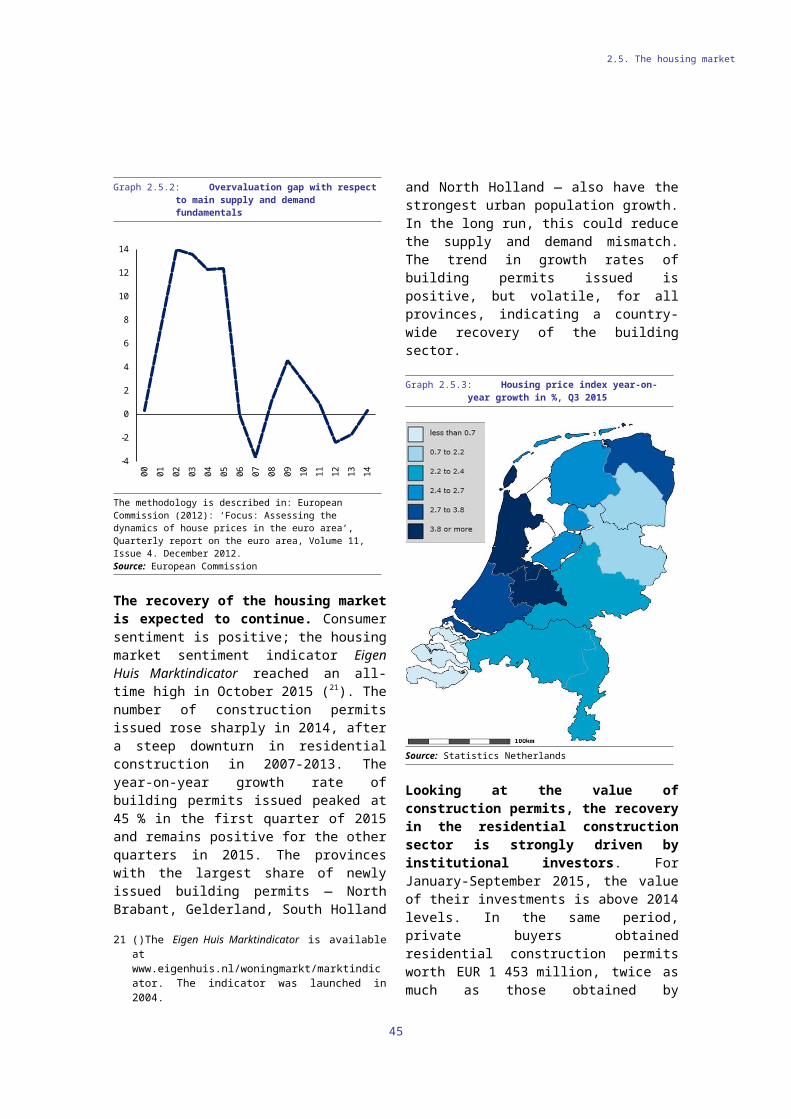
3.1. Taxation, sustainability of public finances and fiscal framework
use of ‘rainy day funds’ (39) and the introduction of formal escape clauses limited to a few pre-defined circumstances are also among the options to improve flexibility within the framework while not hampering responsible budgeting.
A dedicated study group put in place in 2015 is expected to review the national fiscal framework well ahead of next elections, and report its findings in the summer of 2016. Membership of this non-partisan advisory group on budgetary principles includes high level civil servants, the director of the CPB and the relevant director of the Central Bank of the Netherlands. This study group is expected to analyse fiscal performance, and to provide policy advice on the fiscal framework and fiscal stance.
39 ()Rainy day funds are financial assets accumulated in order to be used in times of liquidity constraints. Note that the use of rainy day funds in crisis years does not affect the budget deficit, as this measures the difference between revenues and expenditures in a certain year. However, it will positively affect the development of the general government debt in a crisis year, as expenditure is financed via accumulated savings and not via additional borrowing.
45
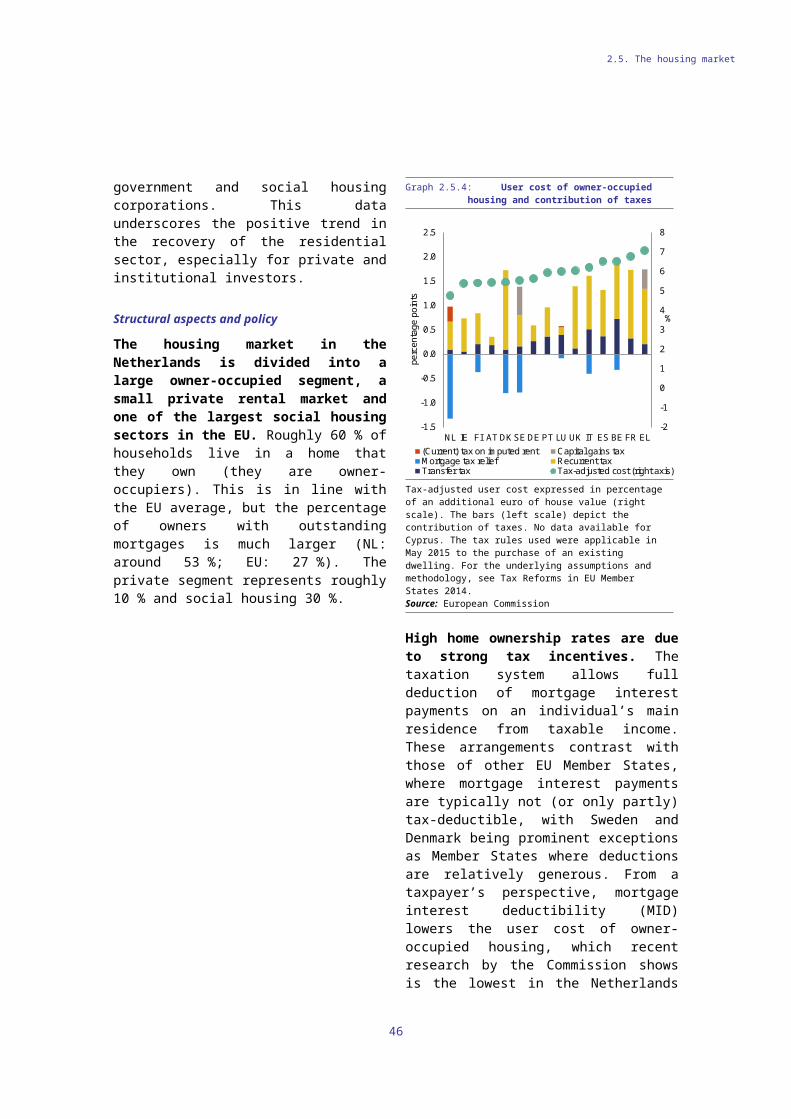
In 2015, the labour market situation improved in conjunction with robust economic growth. The rate of job losses decreased, which is reflected in a fall in unemployment from 7.2 % in the third quarter of 2014 to 6.8 % in the third quarter of 2015. At the same time the labour force grew by 0.6 %, reflecting structural trends such as rising participation in the labour market by women and older workers but also pointing to a cyclical labour market recovery. However, the labour market is still underperforming compared with the situation before 2008. In the third quarter of 2008, 219 600 people were unemployed (and unemployment stood at 3.6 %), while in the third quarter of 2015, there were 586 200 unemployed. In terms of employment, too, the Netherlands is not yet back at pre-crisis levels.
Youth unemployment has declined, however the number of young people not in employment, education or training has increased. The youth unemployment rate for those under 25 stood at 11.4 % in the third quarter of 2015, below the peak reached in the fourth quarter of 2013 (13.8 %). In 2014, the unemployment rate among young people born in a non-EU country stood at 22.7 %, more than 10 pps. higher than for young people born in the Netherlands. Furthermore, the rate of people aged 15-24 not in employment, education or training stood at 5.5 % in 2014. This is lower than the EU average (12.5 %), but the rate has been steadily increasing in recent years.
Although the employment rate is relatively high, a further increase, in particular for under-represented groups, is needed to cope with the demographic challenge of an ageing population. The employment rate (20-64 age group) increased from 75.7 % in the third quarter 2014 to 76.5 % in the third quarter of 2015, but remains substantially below its pre-crisis level of 78.9 % (2008). Employment rates were higher for men than women, and although the gender employment gap has narrowed in the last five years, it was still 11 pps. in the third quarter of 2015 (EU: 12 pps.). Ensuring the financial sustainability of the social security system requires raising labour market participation rates among under-represented groups. These include non-EU-born immigrants (employment rate: 58.9 % in
2014), people with a disability (50.8 % in 2013), low-skilled workers (60.5 % in the third quarter of 2015), older workers (55-64, 61.9 % in the third quarter of 2015) and female part-time workers. 75.2 % of women worked part-time in 2014, by far the highest percentage in the EU even though only 10 % of women would like to work more hours (40).The high level of part-time work goes hand in hand with a high financial dependency of women indicated by high gender gaps in pensions and overall earnings (41).
Graph 3.2.1: Main labour market developments
0
2
4
6
8
10
12
14
16
72
73
74
75
76
77
78
79
8020
05Q
120
05Q
320
06Q
120
06Q
320
07Q
120
07Q
320
08Q
120
08Q
320
09Q
120
09Q
320
10Q
120
10Q
320
11Q
120
11Q
320
12Q
120
12Q
320
13Q
120
13Q
320
14Q
120
14Q
320
15Q
120
15Q
3
% of labour force
% of population
Employment rate (%) (20-64) (lhs)Unemployment (%) (15-74) (rhs)Youth unemployment (%) (15-24) (rhs)Long-term unemployment (%) (15-74)(rhs)
Source: European Commission (Eurostat)
The Netherlands has introduced important labour market reforms, aimed at increasing labour market participation and improving the long-term financial sustainability of the social security system. However, despite these recent reforms and a moderated recovery of the labour market, long-term unemployment continues to increase, especially for certain groups. In addition, labour market segmentation between permanent contracts, temporary contracts and self-
40 ()This is far below the EU average of 26.8 %.41 ()The Netherlands has one of the highest gender gaps in
pensions in the EU (46 %) and the second highest overall earnings gap in the EU (49.1 %). This last indicator shows that the average number of hours paid per month to women in the Netherlands is by far the lowest in the EU. As a result, 47 % of all women aged 20-65 are not economically independent.
46
3.2. LABOUR MARKET, SOCIAL POLICIES, SKILLS AND EDUCATION
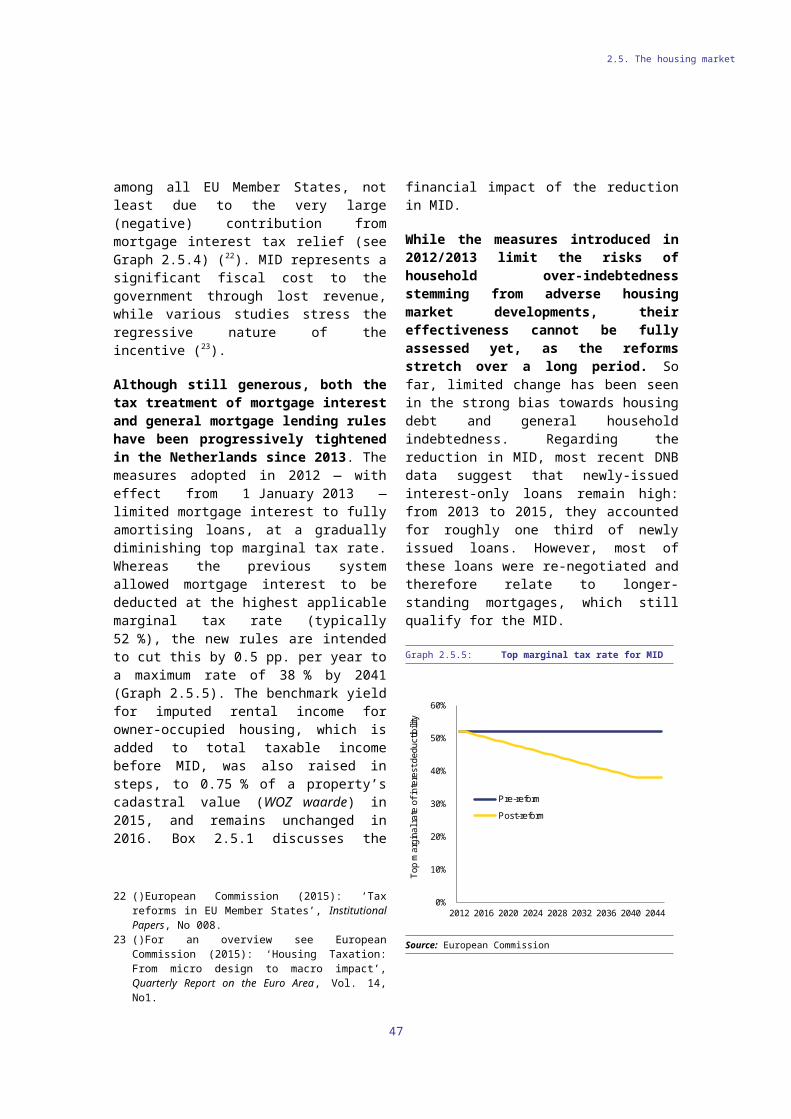
3.2. Labour market, social policies, skills and education
employment is increasing. These challenges are described in detail in the sections below.
Long-term unemployment
While unemployment has started to fall, long-term unemployment continues to rise. The long-term unemployment rate in the Netherlands increased from 1.0 % in third quarter of 2009 to 2.9 % in the third quarter of 2015 (EU28: 4.3 %). Long-term unemployment increased by almost 8 pps. to 42.8 % of total unemployment in the third quarter of 2015, compared to the third quarter of 2013 (Graph 3.2.2), but it is below the EU average (48.2 %).
Graph 3.2.2: Unemployment and long-term unemployment
0.0
100.0
200.0
300.0
400.0
500.0
600.0
700.0
800.0
2005
Q1
2005
Q3
2006
Q1
2006
Q3
2007
Q1
2007
Q3
2008
Q1
2008
Q3
2009
Q1
2009
Q3
2010
Q1
2010
Q3
2011
Q1
2011
Q3
2012
Q1
2012
Q3
2013
Q1
2013
Q3
2014
Q1
2014
Q3
2015
Q1
2015
Q3
ths
Total > 6 months > 12 months
>24 months > 48 months
Source: European Commission (Eurostat)
The recent increase in long-term unemployment gives cause for concern, even though the Netherlands has proportionally more long-term unemployed returning to work than other Member States. Of those that were in long-term unemployment in 2013, around 30 % moved back to work within one year, which is among the highest ranking out of 22 EU countries (42). This means that institutional factors that typically explain weak labour market dynamics and persistently high long-term unemployment are possibly less relevant for the Netherlands. Long-term unemployment could gradually decrease
42 ()Employment and Social Developments in Europe (ESDE) 2015, European Commission.
again over the coming years, assuming sound economic growth and a continued increase in employment.
Among the long-term unemployed, low-skilled workers, older workers and non-EU-born immigrants are over-represented. In 2013, 37 % of the long-term unemployed were low-skilled workers (compared with 23 % of the total workforce), while 39 % were older workers (over 50) (29 % of the total workforce) and 8 % were non-EU-born immigrants (2 % of the total workforce).
Graph 3.2.3: Long-term unemployment (LTU) of specific groups
Total
Men
Women
Young (20 to 24)
Young adults (25 to 29)
Prime age (25 to 49)
Older workers (50-64)
Low skilled
Medium skilled
High skilled
Nationals
EU mobile
Third-country
0.0
0.5
1.0
1.5
2.0
2.5
3.0
3.5
4.0
0.0 1.0 2.0 3.0 4.0
Cha
nge
in L
TU ra
te 2
007-
14 (
ppts
)
LTU rate 2007 (% of labour force)
Netherlands
Source: European Commission (Eurostat)
About 40 % of the long-term unemployed in the Netherlands are above 50 years old. A CPB study concluded that higher long-term unemployment among older workers was a structural issue caused by existing features of the labour market such as employment protection increasing with seniority, the obligation to keep paying wages to employees on sick leave (for up to two years), and favourable wage conditions for older workers (43). These established practices put upward pressure on older workers’ wage costs, making it financially less attractive for employers to recruit them. The study concludes that improving the situation would inevitably mean
43 ()De Graaf-Zijl, Van der Horst and Van Vuuren (2015). 'Langdurige werkloosheid, Afwachten én hervormen' CPB Policy Brief, 2015/11,.
47
3.2. Labour market, social policies, skills and education
addressing these features of the labour market. Moreover, job search requirements are less often enforced for older workers and those perceived to be socially disadvantaged (44).
The integration of immigrants into the labour market is a major challenge. The Netherlands has a relatively high percentage of non-EU-born immigrants (8.6 % in 2014). This group is characterised by a low employment rate (58.9 % in 2014), a high unemployment rate (14.4 % in 2014) and a high inactivity rate (32.2 % in 2014) (45). The employment rate is lower than for the native population at all qualification levels. Attachment to the labour market is particularly weak among women and young people. The Netherlands refrains from taking a target-group approach to labour market policy. The government offers broad generic measures to remove barriers to entering the labour market, such as language courses, childcare facilities and adequate housing conditions.
There are several explanations for the poor performance of non-EU-born immigrants in the labour market. These include a lower education level and poorer language skills (46). The reasons for leaving the country of origin and the reason for entering the host country also have an impact on labour market outcomes; economic migrants have better labour market outcomes than refugees (47).
While the Netherlands experienced an inflow of 56 900 refugees in 2015, almost twice as many as in 2014, the implications for the labour market and the social security system are not yet visible. Due to the length of the asylum procedure, including cases going to higher courts, the legal status of most refugees will only become clear in 2016 or even 2017. To strengthen the labour market position of refugees, early access to the labour market, the recognition of diplomas, immediate language training and measures to fight possible discrimination deserve particular
44 ()Inspectie SZW (2013a), Voor wat hoort wat, Den Haag.45 ()Compared with an employment rate of 77.6 %, an
unemployment rate of 6.7 % and an inactivity rate of 19.6 % for the population born in the Netherlands.
46 ()In 2014, 21 % of non-EU immigrants had tertiary education (compared with 31 % of the native-born), while 37 % had only primary education (28 % of the native-born).
47 ()OECD (2015), Settling in: OECD Indicators of Immigrant Integration 2015.
attention. On average, the participation rate of those who entered the Netherlands as refugees increases with the duration of stay. This means the newly arrived migrants could enlarge the labour force potential in the medium and long run (48), on the condition of active support to integration and labour market participation in an early stage (49). Refugees may enter the labour market six months after the start of the asylum procedure (under specific conditions: only 24 weeks per year) or once they have obtained a legal status (statushouder), although there are some exceptions for internships and voluntary work.
Labour taxation
The structure of the tax and benefits system leads to relatively high inactivity and unemployment traps. The average tax wedge is below the EU average at all wage levels, but the overall average burden on labour is among the highest in the EU when taking into account compulsory non-tax payments (see Graph 3.1.1 in section 3.1) (50). The high average burden on labour reduces take-home pay for employees and increases wage costs for employers. The inactivity trap for low wage earners and the unemployment trap are relatively high. However, incremental tax measures aimed at making work pay have contributed to a slow but steady decline of these traps. For single households earning 50 % of the average wage in 2014, the inactivity trap is 87.2 %, down from 95.1 % in 2006, while the unemployment trap is 93.7 %, down from 98 % in 2006.
48 ()Labour Force Survey and ad hoc module 2008.49 ()Engbersen et al. (2015) ‘Geen tijd verliezen: van opvang
naar integratie van asielmigranten’, WRR-Policy Brief 4, Den Haag: WRR.
50 ()Non-tax compulsory contributions in the Netherlands are paid under collective labour agreements by employees and employers to privately managed pension funds and for basic health insurance to a privately managed health insurance company.
48
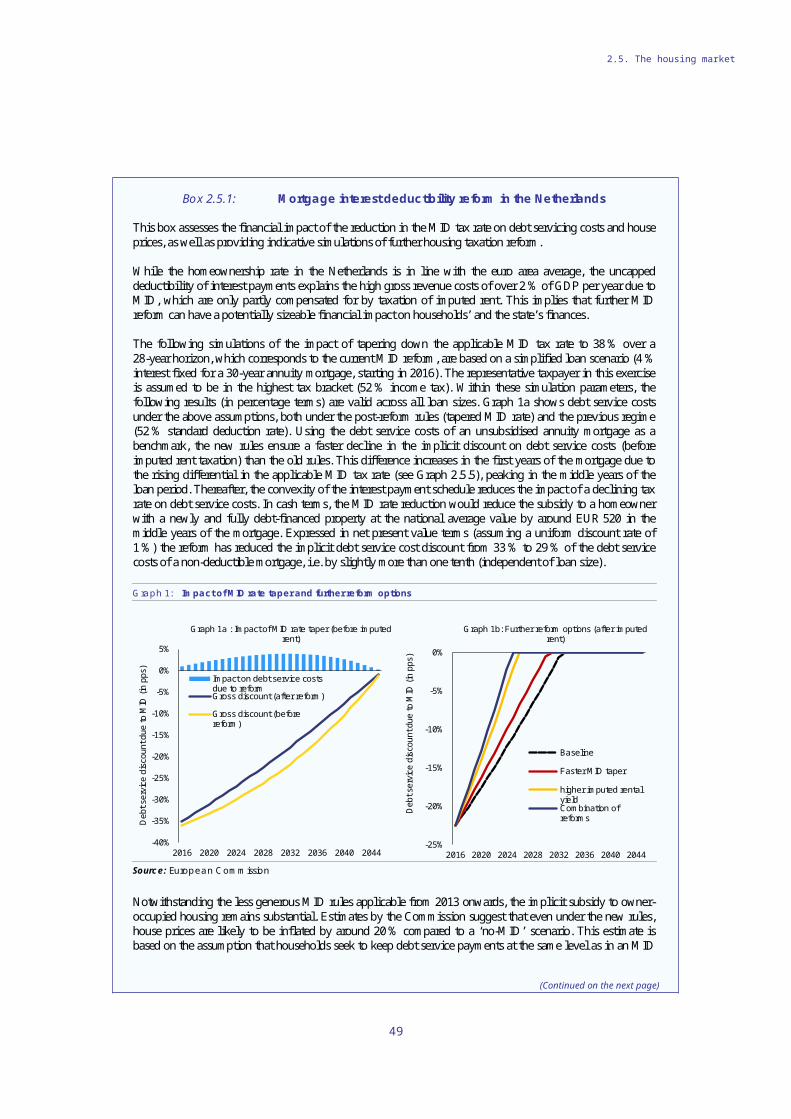
3.2. Labour market, social policies, skills and education
Graph 3.2.4: Inactivity trap for single earner at 50% of average wage
0
20
40
60
80
100
120
04 05 06 07 08 09 10 11 12 13 14
Inactivity trap (%)
NL Min EU-28Max EU-28 Average EU-28
Source: European Commission
For 2016 and 2017 a relatively large tax package has been introduced, leading to a fall in the average burden on labour (see section 3.1). In particular, the ‘low-income advantage’ (lage inkomensvoordeel), which is a wage cost subsidy for employers who employ low wage earners, is likely to positively affect labour demand for low-skilled workers. This measure is based on the hourly wage, leading to a relatively low deadweight loss (51).
Labour market segmentation
The relatively modest labour market impact of the crisis and the recent growth in employment can be fully attributed to an increase in the number of people employed on temporary contracts and of the self-employed. Since 2012, their numbers have increased in each quarter, while the number of people on permanent contracts has decreased (Graph 3.2.5).
51 ()Previous wage cost measures have typically been applied to annual wage income, providing a disincentive to work more hours. Moreover, given the high incidence of part-time work arrangements, wage cost subsidies based on annual income could lead to large deadweight losses.
Graph 3.2.5: Employment by type, year-on-year changes
-500
-400
-300
-200
-100
0
100
200
300
05Q
105
Q3
06Q
106
Q3
07Q
107
Q3
08Q
108
Q3
09Q
109
Q3
10Q
110
Q3
11Q
111
Q3
12Q
112
Q3
13Q
113
Q3
14Q
114
Q3
15Q
115
Q3
ths
Permanent employees Temporary employeesSelf-employment Overall
Source: European Commission (Eurostat)
While the percentage of temporary contracts is high and increasing, transition rates from temporary to permanent contracts are comparatively low. In times of labour market recovery, there is typically an increase in the number of temporary contracts, at least initially. These contracts can be seen as potential stepping stones to a permanent contract. However, transition rates from temporary to permanent contracts in the Netherlands are among the lowest in the EU. In 2013, the transition rate between temporary and permanent contracts stood at 12.3 %, well below the EU average of 22.7 %. Moreover, the percentage of temporary contracts is among the highest in the EU and the Netherlands has a relatively high pay gap between permanent contracts and temporary contracts (52).
52 ()Eurofound (2015), Recent developments in temporary employment: Employment growth, wages and transitions. Publications Office of the European Union, Luxembourg; IZA Policy Paper No 105 (August 2015), Precarious and less well paid? Wage differences between permanent and fixed-term contracts across the EU.
49
3.2. Labour market, social policies, skills and education
Graph 3.2.6: OECD indicators on employment protection legislation (2013)
0.00
0.50
1.00
1.50
2.00
2.50
3.00
Protection of permanentworkers against (individual)
dismissal
Regulation on temporaryforms of employment
Netherlands Germany Belgium OECD countries
Scale from 0 (least restrictions) to 6 (most restrictions)Source: OECD
The high and increasing percentage of temporary contracts is observed in the context of great differences in employment protection legislation between temporary and permanent contracts. The low transition rates from temporary to permanent contracts may be a result of relatively stringent legal protection for employees on permanent contracts, and the high cost of employer-paid sick leave. Based on the OECD’s Employment Protection Legislation indicators, there is a big difference in regulation between permanent contracts and temporary contracts. In particular, protection against individual dismissal is much greater than that of neighbouring countries and the OECD average (rated 2.84 versus 2.03 for the OECD average). By contrast, protection of employees on temporary contracts is weaker than that of neighbouring countries and the OECD average (Graph 3.2.6). These figures do not yet reflect the changes in the legislation introduced in 2015.
In July 2015, several measures reducing the differences between permanent and temporary contracts were introduced (53). The number of consecutive temporary contracts was limited to three, with a maximum of two years, and the
53 ()Work Security Act (Wet Werk en Zekerheid) adopted in the upper house of the Parliament of the Netherlands on 10 June 2014.
waiting time for renewal of a temporary contract after three contracts or two years had expired was raised from three to six months. Although there are signs that the measures have had some adverse effects, such as less job security, it is too early to assess their impact pending evaluations in the coming years.
The increase in employment has been particularly marked for self-employed people with no employees. Between 2005 and 2014, the total number of self-employed increased by 35 %, the largest increase in the EU (Graph 3.2.7). The self-employed accounted for 15.9 % of total employment in 2014, somewhat above the EU average of 14.6 %. The increase in self-employment was mainly driven by a rise in the number of self-employed people with no employees, which increased by 51 % between 2005 and 2014 while the number of self-employed people with employees increased by only 5 %.
Graph 3.2.7: Change in self-employed and self-employment as a share of total employment
-40
-30
-20
-10
0
10
20
30
40
-40
-30
-20
-10
0
10
20
30
40
LT HR PT
CY
HU EL IT RO ES
BG IE DE
EU
-28
PL
SE
DK AT LV FI BE
MT
EE
CZ
FR UK SI
LU SK NL
Share (%)Change (%)
Change in self-emloyment (2005-2014)
Self-employed share of total employment in 2014 (%)
Source: European Commission (Eurostat)
As regards the rapid increase in the number of self-employed with no employees, several macroeconomic and institutional factors may play a role. In the past decade, changes in technology and in the production structure have helped to expand the service sector, in which self-employment is more common. In addition, self-employed workers received favourable tax
50
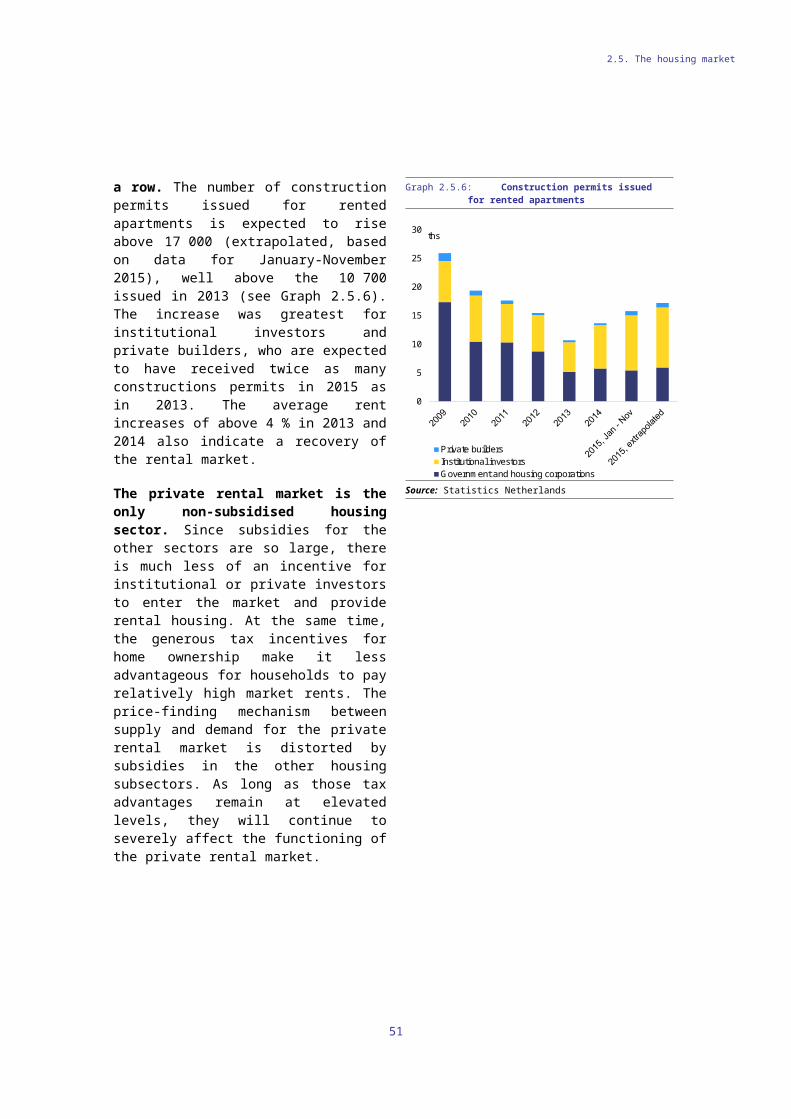
3.2. Labour market, social policies, skills and education
treatment, in particular high tax relief (the self-employment deduction, Zelfstandigenaftrek) and a 14 % discount in taxable profits for small businesses (the MKB winstvrijstelling). A CPB study indicates a positive relation between developments in tax treatment and the number of self-employed (54). Furthermore, the self-employed are allowed to pay lower social and non-tax contributions — thereby enabling them to offer their services at lower cost — as they can decide on the extent to which they insure themselves against the risks of sickness, labour disability, unemployment and old age. For employers, using self-employed workers is financially attractive as they are not covered by minimum wage and employment protection legislation or entitled to employer-paid sick leave.
There is a clear financial incentive for employees to start working as self-employed. For the same gross labour cost, a self-employed person without employees earning a typical wage receives a take-home pay that is 12 % higher than an employee if he or she is privately insured against sickness, labour disability, unemployment and old age and 23 % higher if not insured (Graph 3.2.8, panel a). In addition, there are financial incentives for employers to make use of self-employed people. At the same net income, the gross labour cost of an employee earning an average wage is 84 % of net income, but 41 % for a self-employed person without employees who is privately insured against sickness, disability, unemployment and old age, and 6 % for a self-employed person without employees who is not insured (Graph 3.2.8, panel b).
A recent government study suggests that tax incentives for the self-employed do not lead to additional job creation (55). The study points out that tax and legal incentives for the self-employed and employers lead to labour market distortions and that the rise in self-employment is leading to a decline in public revenue and probably an increase in public expenditure. The study also shows that there is no correlation between self-employment and innovation.
54 ()CPB Notitie, 21-2-2014, De Winstbox en de Wig.55 ()Ministerie van Financiën, 2015, IBO Zelfstandigen
zonder personeel.
Graph 3.2.8: Take-home pay and labour costs for employees and the self-employed
54%66%
11%46%
23%
0%
20%
40%
60%
80%
100%
Employee Self-employed withoutemployees
Panel a. Take-home pay at the same gross labour costs for employees and self-employed without employees
TaxesReservations for sickness, disability, unemployment and old ageNet income
100% 100% 100%
84%
41%6%
0%
20%
40%
60%
80%
100%
120%
140%
160%
180%
200%
Employee Self employedwithout employees
making noreservations
Self employedwithout employees
making reservations
Panel b. Labour costs at the same net income for employees and self-employed without employees
Net-income Gross labour costs
Source: Ministerie van Financiën (2015) IBO Zelfstandigen zonder personeel.
The increase in the number of self-employed could put pressure on the social security system, as most self-employed are not insured, or only partly, against the risks of sickness, labour disability, unemployment and old age (56). The rapid rise in self-employment has led to a presumption that many of these contracts could be bogus self-employment (57). A new law against fraudulent schemes (Wet aanpak schijnconstructies) adopted in June 2015 aims at tackling this. It combines new provisions and amendments to existing laws to prevent fraud,
56 ()For example, in 2013 only 33.2 % of the self-employed without employees were insured against disability (IBO ZZP, 2015).
57 ()This term refers not only to economically dependent self-employed workers, but to workers who are pushed into self-employment by external factors and would prefer to work as an employee.
51
3.2. Labour market, social policies, skills and education
including bogus self-employment, and seeks to strengthen workers’ protection. These measures should help to enforce the statutory minimum wage (by clarifying whether specific allocations or reimbursements can be included or deducted and making salary slips more transparent). In addition, they extend the contractor’s or client’s liability for the salary paid by the employer to wages laid down in collective agreements, of which at least the statutory minimum wage part should be paid electronically. They expand the powers of social protection inspectorates and improve control and monitoring of collective agreements, while providing for fines for social fraud.
Social dialogue in the Netherlands is gradually adapting to the increase in the number of self-employed without employees. For example, for the first time, the 2013 social agreement between the government and social partners covers the self-employed with no employees.
Social inclusion
Poverty levels in the Netherlands are low but increasing and have reached the highest level over the past decade. The at-risk-of-poverty-or-social-exclusion rate (58) has increased by 0.6 pp. from 2013 to 2014, from 15.9 % to 16.5 % (Graph 3.2.9). In particular, poverty increased for groups that already faced high at-risk-of-poverty rates, namely non-EU-born immigrants and households with (very) low work intensity (59). Since 2008, the number of people that lived in households with very low work intensity rose by 67 000 persons until 2014. In addition, in-work poverty (at 5.3 %) has increased, although it is still significantly lower than the EU average. This issue is most prevalent among the self-employed, for whom in-work poverty stands at 13.2 %. The self-employed are more susceptible to the risk of poverty or social exclusion due to the combined effect of income
58 ()This rate is the percentage of people who are: at risk of poverty, i.e. whose equalised household disposable income (after social transfers and after pensions) is below 60 % of
the median national household disposable income; or severely materially deprived; or living in households with very low work intensity.
59 ()For individuals living in households with very low-work intensity, the at-risk-of-poverty rate has increased by 8.9 pps., from 39.8 % in 2013 to 48.7 % in 2014. For non-EU-born immigrants, the at-risk-of-poverty rate increased from 20.8 % in 2013 to 24.5 % in 2014.
volatility and limited coverage by social security provisions. The negative trends in the social situation may be related to a transitional effect. From 1 January 2015 responsibility for groups more distant from the labour market shifted to the municipalities; it remains to be seen what social effects this reform will have.
Graph 3.2.9: Poverty and social inclusion
0
2
4
6
8
10
12
14
16
18
2005
2006
2007
2008
2009
2010
2011
2012
2013
2014
% of population
At-risk-of-poverty-or-social-exclusion rateAt-risk-of-poverty rateSevere material deprivationPeople living in low work intensity householdsIn-work poverty rate
Source: European Commission (Eurostat)
Education and skills
The Netherlands has a high tertiary education attainment rate and the results of international surveys show that educational performance is good (Graph 3.2.10). These are major assets given the strong connection between educational outcomes, skills levels, labour productivity and participation (and achievement) in the labour market. The tertiary education attainment rate, for which the Europe 2020 national target is 40 %, already exceeds that level and stood at 44.6 % in 2014. The increase in tertiary education attainment has partly been achieved by providing guidance to improve students’ choice of courses and by encouraging students to complete their studies. Competence levels in mathematics have decreased somewhat since 2009, but the proportion of low-achieving students is relatively low in all three areas tested (reading, mathematics and science). Measures to improve the quality and range of courses offered in higher education have been taken. This includes more differentiation between courses and guidance for and selection of
52
3.2. Labour market, social policies, skills and education
prospective students (60). Plans to foster talent in primary and secondary education were also adopted in 2014 (61). These measures cover support for more challenging education, support for education in which outstanding achievements are positively recognised and support for better equipped teachers. The measures seem promising, but it is too early to assess their long-term impact.
Graph 3.2.10: Education indicators
0
5
10
15
20
25
30
35
40
45
50
0
2
4
6
8
10
12
14
16
18
00 01 02 03 04 05 06 07 08 09 10 11 12 13 14
%%
Tertiary education 30-34 (right axis)NEET 15-24 (left axis)Early school leavers 18-24 (left axis)
Source: European Commission (Eurostat)
The Survey of Adult Skills (PIAAC) shows the literacy, numeracy and problem-solving in technology-rich environments skills of adults to be significantly above the EU average. While the proportion of low-skilled adults is comparatively low, the gap between the educational level and numeracy and literacy skills of native- and foreign-born adults is larger than the EU average. This suggests a need for further action to reduce this gap and thereby improve the chances of successfully integrating the foreign-born population in the labour market and society at large (62).
A lack of engineers and information and communication technology (ICT) professionals may hamper job matching and innovation performance. In 2015, more than half (53 %) of the companies in the Netherlands trying to recruit
60 ()Wet Kwaliteit in verscheidenheid hoger onderwijs. 61 ()Ruim baan voor toptalent 33 400 Nr. 166 Brief van de
Staatssecretaris van onderwijs, cultuur en wetenschap.62 ()OECD (2013), ‘OECD Skills Outlook 2013: First
Results from the Survey of Adult Skills’, OECD Publishing.
ICT specialists found it hard to fill their vacancies (63). This challenge is in part because science and technology graduate numbers have failed to rise, as not enough young people, including women, are being attracted to careers in ICT. This is part of a broader issue touching many science and engineering studies, as reflected by the position of the Netherlands (25th among the EU Member States) on the indicator 'new graduates in science and engineering per thousand population 24-34'. The Netherlands has been seeking to address actual and potential technological and digital skills shortages with a range of programmes, and recently launched the Human Capital Agenda ICT-Innovation to link demand and supply of ICT professionals in the ‘top sectors’ and to stimulate lifelong learning. It is too early yet to assess this measure.
The new social lending system (sociaal leenstelsel) is replacing the previous grant system for new students starting their studies as of the academic year 2015/16. In this new system, students will be able to take out low-interest loans to finance their studies. Repayment of these loans will depend on the students’ income after graduation. The system includes special provisions for students from low-income families. Although the high private rents from higher education provide a theoretical and empirical justification for increasing private contributions to tertiary education, there are worries about the accessibility of the higher educational system.
The implementation of the reform promoting inclusive education for children with special needs seems to be challenging. Since August 2014, schools must provide appropriate education (passend onderwijs) for pupils who need extra support. Some reports from stakeholders (64) indicate that there is a lack of adequate coordination between schools, unfamiliarity with certain disabilities or disorders, or pupils not finding an appropriate school, which is leading to an increase in truancy. Around 70 % of headmasters report that the quality of education provided is being compromised by shortages of qualified or high-quality teachers and of teachers able to teach students with special needs. The
63 ()Digital Agenda Scoreboard, based on Eurostat.64 ()Balans, Steunpunt passend onderwijs,
Kinderombudsman.
53
3.2. Labour market, social policies, skills and education
Ministry is aware of these problems and has taken measures such as providing support (via education consultants) and setting up a national conciliation committee. The aim is to provide every pupil with the necessary support within three months of identifying the special need by 2020.
In 2014, several initiatives were launched to increase the amount of work-based training in vocational education and training programmes. Particular attention has also been given to improving the general quality of education, offering incentives for employers to provide more and better quality internships and more opportunities for students’ personal development, including doing more to avoid students dropping out. Further changes are expected to be made to increase the amount of work-based learning in vocational education and training programmes. EUR 400 million will become available as of 2015 from investment and performance budgets created as part of the quality agreements in secondary vocational education.
54
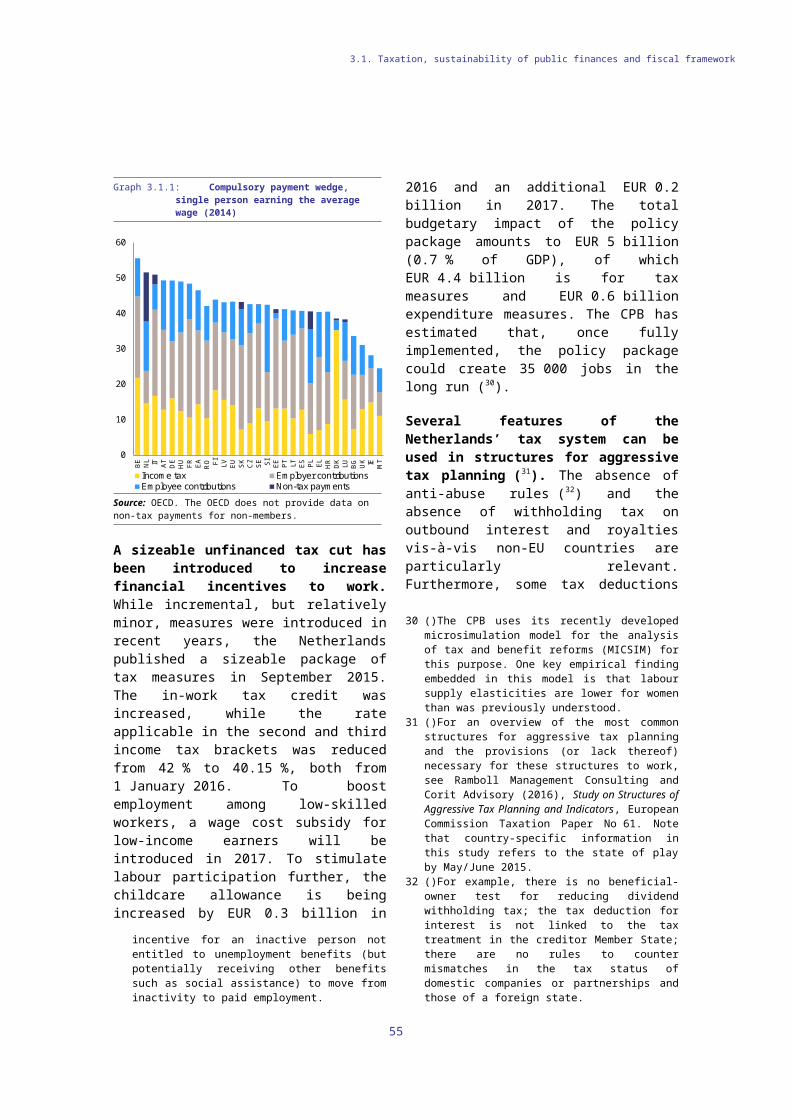
Productivity developments
The Netherlands combines a very high level of productivity with very low post-crisis productivity growth (65). Productivity is one of the three drivers of economic growth, alongside labour and capital inputs. Graph 3.3.1 shows that the Netherlands ranks third after Belgium and Ireland in terms of productivity, measured as GDP per hour worked, which is around 30 % higher than the EU average. The average annual growth rate of GDP per hour worked, however, since 2008 is only 0.2 %. Total factor productivity, which is a measure of the economy’s long-term technological dynamism, decreased between 2008 and 2014, in contrast to many other euro area Member States, and especially the US (66).
Graph 3.3.1: GDP per hour worked (2014)
-1.5
-1
-0.5
0
0.5
1
1.5
2
2.5
3
3.5
-75
-50
-25
0
25
50
75
100
125
150
BE IE NL
FR DK
DE
SE AT
EA
-19 FI ES
UK
EU
-28 IT CY
SK
MT SI
EL
CZ
PT
HU LT EE PL
LV RO
BG
%
gdp per hour worked (index EU-27 = 100, right axis)post-crisis average growth rate (left axis)
International comparison based on PPS; growth (right axis) is represented in compound average growth rates.Source: European Commission (AMECO)
Labour hoarding only explains low productivity growth in the first years of the economic crisis. Between 2009 and 2011, productivity growth was heavily influenced by labour hoarding. Since 2011, GDP and employment (both in hours and in persons) moved in tandem, indicating low growth
65 ()See European Commission (2015), ‘Single Market Integration and Competitiveness in the EU and its Member States’, SWD (2015) 203, notably charts 2.11, 2.13, 2.16, 2.17, 2.18, 2.20, 3.18-3.23.
66 ()Total factor productivity could be seen as the residual economic growth component, not accounted for by labour and capital inputs.
of labour productivity (Graph 3.3.2). Only in 2014 did GDP per hour increase again, after a long period of stagnation.
Graph 3.3.2: Labour hoarding in the early phase of the crisis
94
95
96
97
98
99
100
101
2007 2008 2009 2010 2011 2012 2013 2014
inde
x 20
08 =
100
Total employment GDP volumeTotal hours worked
Source: European Commission (AMECO)
Businesses rank among the most productive in the euro area in many sectors, but in there is scope for catching up in the financial services sector. A sectoral perspective shows high productivity in resource-rich and capital-intensive industries, which contrasts with lower levels of productivity in (non-financial) services and agriculture. Graph 3.3.4 shows the 2014 level of productivity for different branches of activity. The graph also shows the comparable sectoral productivity level of the top euro area performers (here defined as the average of the top three euro-area Member States in each area of activity). It shows that many sectors in the Netherlands operate close to or above the European frontier; only in finance and business services is there scope for catching up with the top European performers.
55
3.3. DRIVERS OF GROWTH
3.3. Drivers of growth
Graph 3.3.3: Productivity per sector (2014)
-160
-120
-80
-40
0
40
80
120
160
agric
ultu
re
Indu
stry
(exc
l.con
stru
ctio
n)
cons
truct
ion
Trad
e,tra
nspo
rt an
dco
mm
unic
atio
n
Fina
nce
and
Bus
ines
s se
rvic
es
Oth
er s
ervi
ceac
tiviti
es
NL top 3
Productivity is measured as gross value added per employed worker in constant prices. Leader represents the average of the three best performing euro area Member States. The sample is restricted to euro area countries to eliminate exchange rate effects.Source: European Commission (AMECO).
Innovation policy challenges
The Netherlands is developing less favourably than the Nordic countries and the US in a number of key drivers of competitiveness, including productivity growth, innovation and R&D, development of ICT skills and integration of digital technologies, notably by SMEs (67) This raises a number of longer-term challenges to the productivity and competitiveness of the economy and shows the need to further enhance framework conditions, encourage technology adoption and boost innovation. Framework conditions, such as a high-quality educational system and well-functioning product and labour markets, are key for productivity growth. Although the Netherlands scores well on bankruptcy procedures and product market regulation, there are signs that the relatively stringent employment protection legislation for permanent contracts having reached a certain seniority may hinder productivity growth via its impact on labour turnover rates (68). The
67 ()For example, only 17 % of SMEs sell online and only 15 % of enterprises send e-invoices, even though 76 % of consumers use the internet for shopping and 91 % for banking. http://ec.europa.eu/digital-agenda/en/desi .
68 ()Andrews, Criscuolo and Gal (2015). ‘Frontier firms, technology diffusion and public policy: micro-evidence
Netherlands is one of the few Member States where labour reallocation contributes negatively to productivity growth (69).
The Netherlands' public research base is of global-level quality but its research and innovation (R&I) system is still endeavouring to leverage additional business investment. The Netherlands is a global player in terms of the quality of its public research base, with 16.4 % of its scientific publications among the 10 % most cited worldwide. The efficiency and high quality of the R&I system has the potential to leverage additional business R&I investment (70). The ‘top sectors’ approach, implemented in 2011, addresses this challenge by enhancing science-business cooperation. This approach is complemented by support for R&D activities via tax incentives (71), an innovation fund (72) and the ‘national science agenda’, via which the government aims to improve cooperation between universities and the corporate sector. In 2016 two existing tax facilities, the WBSO and the RDA, are being merged, which is expected to lead to improved access for SMEs and new entrants to support for R&D activities.
R&D intensity is below the EU average and below Europe 2020 targets. Despite the effort put
from OECD countries’ OECD future of productivity main background papers. The authors use a harmonised firm-level productivity database covering the top performing enterprises in 23 OECD Member States, and isolate the productivity growth at the frontier from the productivity growth in non-frontier firms and all firms, based on the OECD Stan database. They show that potential labour productivity in the Netherlands could be increased by ten percent by reducing the stringency of employment protection.
69 ()This follows from a shift-share analysis on Ameco-data over the period 2000-2014 and has also been documented by the OECD, see Molnar and Chalaux (2015) ‘Recent trends in productivity in China: shift-share analysis of labour productivity growth and the evolution of the productivity gap’ OECD Economics Department Working Papers No 122. Figure 1, p.8 at http://www.oecd-ilibrary.org/docserver/download/5js1j15rj5zt.pdf?expires=1454064978&id=id&accname=guest&checksum=31F5211ED3F8C215B6C91F57C685361B .
70 ()Public-private cooperation in R&D is relatively well positioned in an EU comparison (3rd position) with 0.083 % of public expenditure financed by the private sector, compared to the EU average of 0.051 %.
71 ()The tax credit for R&D labour costs (‘WBSO’), the Research & Development Allowance (‘RDA’) and the tax relief for innovation (‘Innovation box’).
72 ()The MBK+ innovation fund will continue as a part of the new ‘Future Fund’.
56
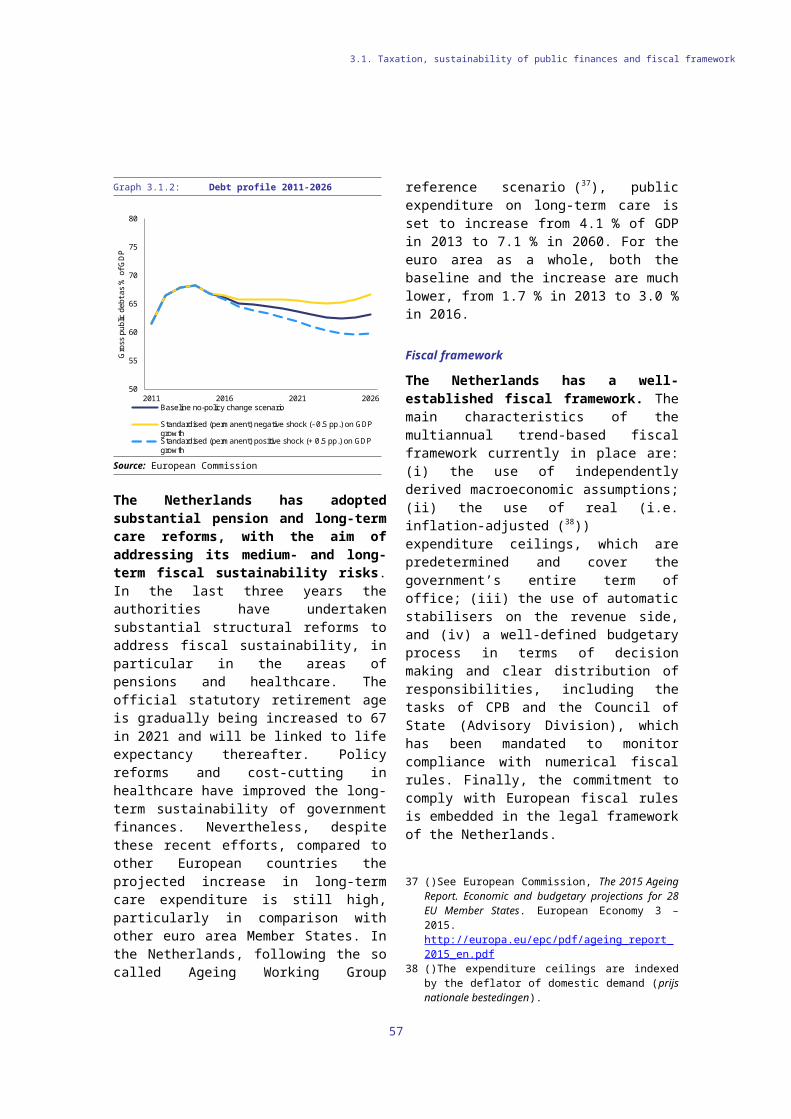
3.3. Drivers of growth
into introducing the integrated innovation policy, total R&D intensity has stabilised at around 2 % of GDP, markedly below the Europe 2020 target of 2.5 % of GDP and below the EU average (73). At 0.86 % of GDP in 2014, public R&D spending is lower than in other Member States with similar levels of educational attainment and economic development (Denmark, Sweden, Germany). Moreover, the overall level of public support to R&D and innovation is expected to decline from 0.94 % of GDP in 2014 to 0.77 % by 2019, both in terms of direct support and fiscal incentives (74). In 2014 business enterprise expenditure on R&D stabilised at a level of 1.11 % of GDP compared to the EU average of 1.30 %. This is a reason for concern as at the ‘knowledge frontier’ productivity improvements are typically made through R&D and innovation.
Graph 3.3.4: R&D expenditure by sector (2014)
0.00
0.50
1.00
1.50
2.00
2.50
3.00
3.50
FI AT
DE
BE SI
FRE
U-2
8N
L IE EE IT PT
LU ES LT SK
MT EL
LV CY
% of GDP
Business enterprise sector Government sectorHigher education sector Private non-profit sector
Source: European Commission (Eurostat)
Patent applications have declined significantly from their average level before the crisis, in contrast to trends in some other countries. Although patent applications per million inhabitants are relatively high, the number of
73 ()The country-specific Europe 2020 R&D target of 2.5 % of GDP takes the services-oriented economic structure of the Netherlands into account.
74 ()Rathenau Instituut (2015), 'Total Investment in Research and Innovation (TWIN) 2013-2019'https://www.rathenau.nl/en/node/98.
patent applications has slightly declined. The share of patents relating to key enabling technologies (KETs) for the Netherlands has been slowly declining, from close to 3 % of all patents in the early 2000s to below 2 % in 2011 (75).
Access to finance
Financing conditions are showing signs of improvement. Financial sector deleveraging and lower demand for credit have led to a decline in credit growth (see also chapter 2.2). Although Small and Medium-Sized Enterprises (SMEs) in particular are still reporting difficulties in obtaining credit from banks, credit conditions seem to be improving according to the most recent SAFE survey by the ECB and Commission (76). This showed that for the first time more than 50 % of surveyed SMEs reported access to finance being of low importance to the company. Moreover, the survey shows a high number of SMEs reporting increased profits and decreased interest expenditures. Although lower than in previous years, the calculated loan rejection rate at 25 % is still elevated and the highest in the EU.
Various measures to support access to finance have been introduced. These include microcredit loans through Qredits (77) and guarantee schemes (78). The government takes part in venture capital for young innovative companies (SEED). The government set up an investment facility linked to business angels (Investeringsfaciliteit Business Angels), whereas the Netherlands Investment Agency (NIA) aims to link entrepreneurs to the European Fund for Strategic Investments (EFSI). Finally, in 2015 a one-stop shop for business finance (Nationale Financieringswijzer) was set up to provide
75 ()For further detail, see European Commission (2015), ‘Key Enabling Technologies (KETs) Observatory, First annual report’ May 2015. The six KETs analysed include: adfvanced materials, nano-technology, micro- and nano-electronics, industrial biotechnology, photonics and advanced manufacturing technology.
76 ()http://ec.europa.eu/growth/access-to-finance/data-surveys/.
77 ()Qredits Microfinanciering Nederland is a non-profit organisation supported by the government http://qredits.com/.
78 ()Garantie Ondernemingsfinanciering (GO), Borgstellings MKB-kredieten (BMKB), Groeifaciliteit and Toekomstfonds (structural funding for R&D and innovative companies).
57
3.3. Drivers of growth
entrepreneurs with knowledge, skills and networks to obtain finance.
Quality of public administration
The perceived quality and effectiveness of public administration is relatively high, both by EU and international comparison. According to the World Bank Worldwide Governance Indicators, the Netherlands ranks among the best performing countries in terms of government effectiveness (79). The burden of government regulation is light. There is a framework to systematically assess the impact of new policy and legislation: the Advisory Board on Administrative Burden Reduction (ACTAL), the mandate of which has been extended until 2017. After evaluating its impact, the government will decide on ACTAL’s continuation or termination in 2017. All enterprises will have the right to communicate and to do business with the authorities online by 2017. By 2017, a reduction of EUR 2.5 billion in the regulatory burden on business, professionals and the public is planned to be achieved by introducing new regulations revising or abolishing existing rules (80).
The Netherlands does well in most key areas of interaction between businesses and public administration, except for fees for specific administrative procedures. The Netherlands performs better than most of its EU peers in terms of start-up conditions, including the time it takes to start a business and the paid-in minimum capital needed, which has contributed to a rise in start-ups in recent years. Export and import procedures also take up much less time than in the rest of the EU. Yet several fees for specific administrative procedures are higher compared to the EU average. The cost to start a business at EUR 375 is still more expensive than the EU average (EUR 312.86), and well below the Single Business Act target of EUR 100. The same holds true for the costs required to transfer property (6.1 % of property value compared to an EU average of
79 ()For the government effectiveness indicator, which captures perceptions of the quality of public services, the capacity of the civil service and its independence from political pressure, and the quality of policy formulation, the Netherlands scores well above the EU average and is among the top performers worldwide.
80 ()Goed geregeld, een verantwoorde vermindering van regeldruk 2012-2017(2013) Letter to parliament.
4.45 %) and to enforce contracts (23.9 % of the claim compared to an EU average of 21.54 %) (81). Finally, the World Bank Doing Business 2016 report indicates that dealing with construction permits remains burdensome, given the Netherlands ranks 85th out of 189 economies (82).
Public procurement
The number of tenders published under EU –rules is far below EU average, but the competition among bidders is high and e-procurement is used frequently. The tenders published under EU rules by the Netherlands in 2014 represent 2 % of GDP, compared to 4.4 % for an average EU Member State. An increase in the value of contracts published EU-wide would generate additional opportunities for European businesses in other Member States (83). The reporting quality is poor, as 75 % of contracts awards published EU-wide in 2015 have no information about the value. On the other hand, the Netherlands is one of the best performers in enabling e-procurement and in ensuring high levels of competition among bidders. In 2015, the proportion of awards with just a single bid at 12 % in the Netherlands was below the EU average of 21 %, together with Ireland, the UK and Denmark.
81 ()2015 Single Business Act Fact Sheet The Netherlands, available at: http://ec.europa.eu/growth/smes/business-friendly-environment/performance-review/files/countries-sheets/2015/netherlands_en.pdf.
82 ()World Bank Doing Business 2016.83 ()It should be emphasised that a low value in relation to
GDP does not imply that rules are not respected, simply that other Member States publish tenders representing a higher proportion of their economy.
58
While greenhouse gas emission targets are expected to be met, targets for renewable energy and energy efficiency remain key challenges for the Netherlands in the area of energy and climate policy. Under the Effort Sharing Decision, the Netherlands needs to reduce its greenhouse gas emissions not covered by the EU emission trading scheme by 16 % by 2020, compared to 2005. Emissions from sectors not covered by the emissions trading scheme fell by 23 % between 2005 and 2014. Taking into account existing policies, the latest projections suggest that it will beat this target by 5 %. On the other hand, there is insufficient progress on meeting renewable energy and energy efficiency targets (see the Europe 2020 table in the annex) which are especially important given the decline in gas production.
The Netherlands is not on track to meet its 2020 renewable energy sources target. This target (i.e. energy from renewable sources as a share of gross final energy consumption) is set at 14 % by 2020. The fall in gas production makes renewable energy resources more important, as they can limit dependency on energy imports. The Netherlands did not meet the first interim target (4.4 % in 2011/2012 when the target was 4.7 %) and the latest 2014 data shows that it also did not meet the second interim target (5.0 % in 2013/2014 versus a target of 5.9 %). In the National Energy Outlook 2015, current measures are projected to not fully meet the Europe 2020 target.
Furthermore, the Netherlands is at risk of not meeting its primary energy efficiency target. For the Netherlands, the Europe 2020 energy efficiency target is 60.7 Mtoe expressed in primary energy consumption and 52.2 Mtoe expressed in final energy consumption. While the Netherlands will most likely meet its final energy consumption target, its primary energy efficiency target is more challenging (84). Under the Energy Agreement for sustainable growth, the Netherlands has taken additional measures to improve energy efficiency (85). While some of the agreed measures have been translated into legislation, others are
84 ()https://ec.europa.eu/energy/sites/ener/files/documents/1_EEprogress_report.pdf
85 ()For an overview of these measures, please see http://afsprakengestart.energieakkoordser.nl/.
non-binding, meaning that their contribution to meeting the targets is not guaranteed.
The findings of a 2016 progress report (86) on the national Energy Agreement for sustainable growth (87) indicate that reaching the 2020 renewable energy sources and energy efficiency targets is still feasible, given that full agreement has been reached among all parties involved on additional measures, including an action plan for the production of wind energy and subsidies for small-scale projects on renewable energy.
Energy dependency is expected to increase. Petroleum products accounted for 41.9 % of energy consumption in the Netherlands in 2013 (EU28: 33 %) while nuclear energy accounted for 0.9 % (EU28: 14 %) and renewables 4.8 % (EU28 15 %). Gas accounts for a higher proportion of energy consumption than in other European Member States, (NL 41.8 %, EU 23 % in 2013) (88). 66.2 % of the Netherlands energy needs were covered domestically in 2014; the rest was imported. Although the Netherlands’ overall import dependency in total fossil fuels is low (due to national gas production), its dependency on imports of petroleum products is very high. Gas import dependency is expected to increase in the next 20 years, as a steady decline in domestic gas production is expected due to concerns about earthquake activity in Groningen (see section 1). Besides the fiscal implications, the decrease in domestic gas production strongly affects the country’s energy supply and dependency on energy imports. The gas production policy and broader energy strategy from 2016 onwards has not been determined yet.
A more circular economy and improved resource efficiency would stimulate investment. This would have both short-term and long-term benefits for the economy, environment and employment (89). Although the Netherlands is the best performer in the EU in terms of resource productivity (how efficiently the economy uses material resources to produce wealth), at
86 ()SER Energieakkoord voor duurzame groei.87 ()http://www.energieakkoordser.nl/energieakkoord.aspx88 ()See SWD (2015) 241 http://eur-lex.europa.eu/legal-
content/EN/TXT/?uri=CELEX%3A52015SC0241.89 ()Annual Growth Survey 2016, p.13.
59
3.4. ENERGY, TRANSPORT AND CLIMATE POLICY
3.4. Energy, transport and climate policy
3.82 EUR/kg (EU average 1.95) in 2014 (90), its high level of dependency on imported raw materials is a concern. The Netherlands is among the leading countries in making use of environmental taxes (3.31% of GDP in revenue compared to 2.45% in the EU; 2013 data) (91).
Transport policy has been successful in supporting the adoption of cleaner cars. The average efficiency of all new cars sold in 2013 was the highest among all Member States. But this success came at a significant fiscal cost (92), which contributed to the decision to focus fiscal support even more on the most innovative, lowest-emission vehicles. These political objectives include having all new cars capable of driving at zero emissions (including plug-in hybrids) or chargeable by 2035 (93).
Traffic congestion is still significant, though it is being reduced (94). Congestion remains high both inside the urban agglomerations and on the main interurban links, which causes economic, health and environmental costs. While recent infrastructure developments have significantly improved traffic flows, no further measures have been taken.
90 ()http://ec.europa.eu/eurostat/web/europe-2020-indicators/resource-efficient-europe
91 ()European Commission (2015): ‘Tax reforms in EU Member States’, Institutional Papers, No 008.
92 ()Balans van de leefomgeving 2014, PBL. As an indication, receipts from vehicle registration taxes declined by between EUR 1 billion and EUR 1.5 billion between 2006 and 2012.
93 ()https://www.rijksoverheid.nl/onderwerpen/ milieuvriendelijke-brandstoffen-voor-vervoer/documenten/kamerstukken/2015/07/10/ duurzame-brandstofvisie-en-uitvoeringsagenda.
94 ()http://www.inrix.com/scorecard/key-findings-us/
60
ANNEX AOverview table Commitments Summary assessment (95)
2015 country-specific recommendations (CSRs)
CSR 1:
Shift public expenditure towards supporting investment in R&D and work on framework conditions for improving private R&D expenditure in order to counter the declining trend in public R&D expenditure and increase the potential for economic growth.
The Netherlands has made limited progress in addressing CSR 1:
Limited progress in shifting public expenditure towards supporting investment in R&D and improving framework conditions for private R&D. In 2016, the WBSO tax credit (for R&D wage costs) and the R&D allowance (RDA, for other R&D costs) will be merged and increased. The government has decided to drop a planned cut in the WBSO tax credit of EUR 110 million. However, despite these measures, total public support for R&D and innovation will continue its decline in the longer run.
CSR 2:
With the strengthening of the recovery, accelerate the decrease in mortgage interest tax deductibility so that tax incentives to invest in unproductive assets are reduced. Provide for a more market-oriented pricing mechanism in the rental market and further relate rents to household income in the social housing sector.
The Netherlands has made some progress in addressing CSR 2:
No progress on mortgage interest deductibility, as its partial phasing out has not been stepped up despite a recovery of the housing market and the economic environment.
Some progress on a more market-based pricing mechanism. The measure to support mobility in the housing market (the rental sum approach ‘huursombenadering’) will be implemented in 2017.
95 ()The following categories are used to assess progress in implementing the 2015 CSRs:No progress: The Member State (MS) has neither announced nor adopted measures to address the CSR. This category also applies if
the MS has commissioned a study group to evaluate possible measures.Limited progress: The MS has announced some measures to address the CSR, but these appear insufficient and/or their
adoption/implementation is at risk.Some progress: The MS has announced or adopted measures to address the CSR. These are promising, but not all of them have been
implemented and it is not certain that all will be.Substantial progress: The MS has adopted measures, most of which have been implemented. They go a long way towards
addressing the CSR.Fully implemented: The MS has adopted and implemented measures that address the CSR appropriately.
61
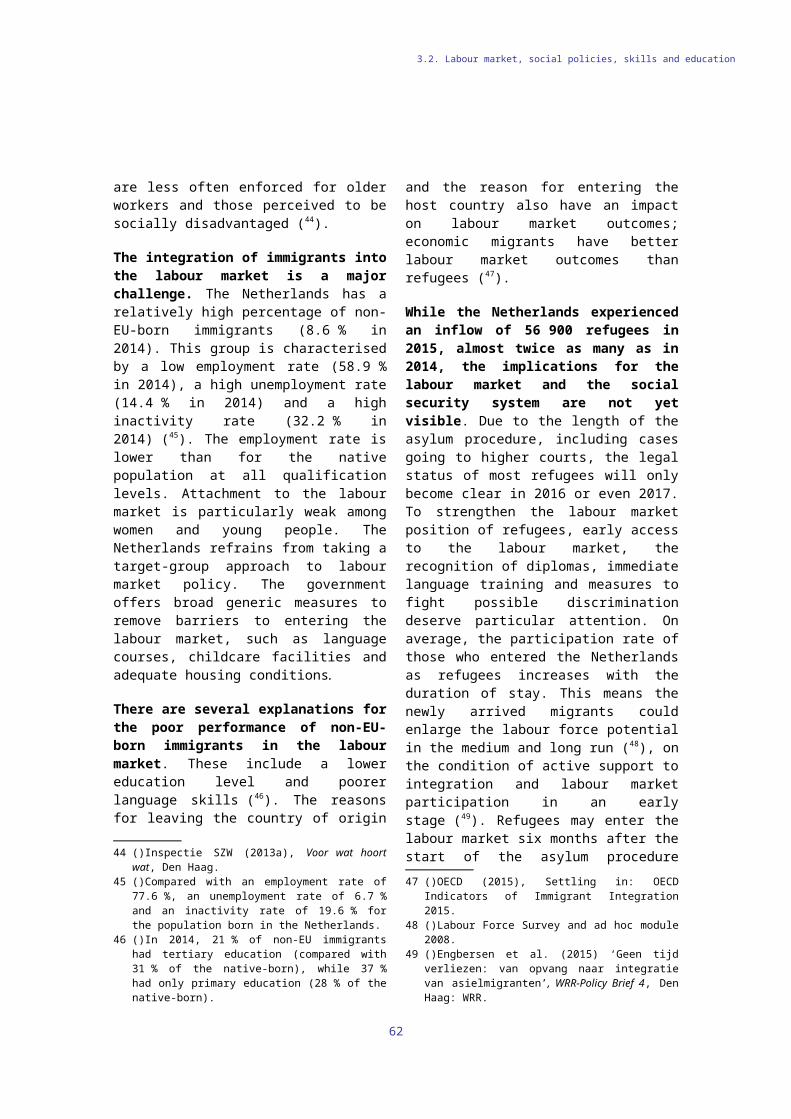
A. Overview table
Substantial progress on relating rents to household income, as the Housing Act (Woningwet) entered into force in July 2015 and the rental sum approach will be implemented in 2017. Nevertheless, progress on tackling the number of tenants above the income threshold for social housing is very small and waiting lists have not been reduced.
CSR 3:
Reduce the level of contributions to the second pillar of the pension system for those in the early years of working life.
The Netherlands has made limited progress in addressing CSR 3:
Limited progress has been made in reducing pension contributions for young workers. On 6 July 2015, the government announced its intention to substantially reform the second pension pillar in order to create a more transparent and actuarially fairer system. There is agreement in the country that reform is necessary, but the specifics need to be decided.
Europe 2020 (national targets and progress)
Employment rate target set out in the Netherlands:
80 %.
The employment rate was at 75.4 % in 2014, having decreased slightly from 76.6 % in 2012 and 75.9 % in 2013. The negative trend reversed in 2015, with the Q3 figure standing at 76.5%. Based on the recovery of the labour market, the Europe 2020 employment rate target of 80 % still seems feasible.
R&D target set out in the Netherlands:
2.5 % of GDP.
Total R&D intensity has stabilised around 2 % of GDP, markedly below its target of 2.5 % of GDP and below EU average. At 0.86 % of GDP in 2014, public R&D spending is lower than in other Member States with similar level of economic development.
National Greenhouse Gas emissions target:
-16 % in 2020 compared to 2005 (in sectors not covered by the EU emission trading scheme)
Non-ETS 2014 target: -5 %.
According to the latest national projections and taking into account existing measures, the target is expected to be met: -21 % in 2020 compared to 2005 (with a margin of 5 pps.).
According to approximated data, greenhouse gas emissions from sectors not covered by the emissions trading scheme fell by 23 % between 2005 and 2014.
2020 renewable energy target: With renewable energy accounting for 5 % of
62
A. Overview table
14 %.
Proportion of renewable energy in all modes of transport:
10 %.
energy consumption in 2014, the Netherlands seriously risks missing its renewable energy target for 2020. Current policy measures are projected to be insufficient to meet the 2020 target.
With renewable energy sources accounting for 5 % of energy used in transport, the Netherlands is about half-way towards the binding 10 % renewable energy sources target in transport.
Energy efficiency target:
20 %.
The Netherlands has set itself an indicative national energy efficiency target of a reduction of 1.5 % a year. This means it must reach a 2020 level of 60.7 Mtoe (megatonne of oil equivalent) in primary energy consumption and 52.2 Mtoe in final energy consumption.
The Netherlands has taken additional measures to improve energy efficiency, and final energy consumption in 2020 is estimated at 49.4 Mtoe. The Netherlands is also on track to meet the energy efficiency target of 1.5 % a year.
Early school leaving target set out in the Netherlands:
<8.0 %.
Early leavers from education and training (share of the population aged 18-24 with at most lower secondary education and not in further education or training) in 2014: 8.7 % (2013: 9.3 %, 2012: 8.9 %).
The Netherlands has made some progress towards achieving the target of below 8%.
Tertiary education attainment target set out in the Netherlands:
>40 %.
Tertiary educational attainment (share of population aged 30-34 having successfully completed tertiary education) in 2014: 44.6 % (2013: 43.2 %, 2012: 42.2 %)
The target of 40 % has been achieved.
Target for reducing the number of people living in households with very low work intensity in number of people:
- 100 000 (aged 0-64).
The number of people (aged 0-64) living in households with very low work intensity was 1 680 000 in 2014 (2013: 1 624 000, 2012: 1 635 000).
The target was set in 2008, when 1 613 000 people aged 0-64 lived in households with very low work intensity. This number rose by 67 000 persons until 2014.
63
A. Overview table
64
ANNEX BMIP Scoreboard indicatorsTable B.1: The MIP scoreboard for the Netherlands
Thresholds 2009 2010 2011 2012 2013 2014Current account balance, (% of GDP) 3 year average -4%/6% 5.3 5.7 7.4 9.1 10.4 10.9
-35% 0.9 10.6 19.8 31.1 32.3 60.8
Real effective exchange rate - 42 trading partners, HICP deflator
3 years % change ±5% & ±11% 2.6 -1.5 -2.4 -6.0 0.4 0.8
Export market share - % of world exports 5 years % change -6% -3.4 -7.1 -7.0 -12.6 -10.0 -11.0
Nominal unit labour cost index (2010=100) 3 years % change 9% & 12% 12.1 7.6 4.8 2.3 5.6p 5.4p
6% -3.5 -2.7 -4.0 -8.0 -8.1 -0.5
14% 8.6 2.8 3.6 2.1 1.3p -1.6p
133% 231.4 229.4 228.0 229.0 226.6p 228.9p
60% 56.5 59.0 61.7 66.4 67.9 68.2
Unemployment rate 3 year average 10% 4.1 4.4 4.8 5.3 6.0 6.8
16.5% 7.8 5.8 9.3 5.2 -1.9p 8.2p
-0.2% 2.3 -0.3b -1.2b -0.7 1.2 0.9
0.5% -1.1 -0.2b 0.4 0.9 1.2 1.3
2% 0.2 1.7 1.4 1.5 2.1 2.7
External imbalances and competitiveness
New employment indicators
Net international investment position (% of GDP)
Deflated house prices (% y-o-y change)
Total financial sector liabilities (% y-o-y change)
Private sector credit flow as % of GDP, consolidated
Private sector debt as % of GDP, consolidated
General government sector debt as % of GDP
Activity rate - % of total population aged 15-64 (3 years change in p.p)
Long-term unemployment rate - % of active population aged 15-74 (3 years change in p.p)
Youth unemployment rate - % of active population aged 15-24 (3 years change in p.p)
Internal imbalances
Flags: b: break in time series. p: provisional. Note: Figures highlighted are those falling outside the threshold established in the European Commission's Alert Mechanism Report. For REER and ULC, the first threshold applies to euro area Member States.Source: European Commission
ANNEX CStandard tablesTable C.1: Financial market indicators
2010 2011 2012 2013 2014 2015Total assets of the banking sector (% of GDP) 358.0 372.1 379.9 337.6 370.0 365.9Share of assets of the five largest banks (% of total assets) 84.2 83.6 82.1 83.8 85.0 -Foreign ownership of banking system (% of total assets) 15.4 13.3 11.2 8.3 6.9 -Financial soundness indicators: - non-performing loans (% of total loans)1) 2.8 2.7 3.1 3.2 3.0 2.7 - capital adequacy ratio (%)1) 13.9 13.5 14.2 14.9 17.9 20.0 - return on equity (%)1) 8.9 9.6 7.4 6.2 6.6 12.0Bank loans to the private sector (year-on-year % change) 4.0 4.1 4.0 -1.1 1.0 -0.6Lending for house purchase (year-on-year % change) 5.5 3.3 4.3 -0.1 1.3 5.4Loan to deposit ratio 120.3 119.5 119.2 117.8 113.2 112.4Central Bank liquidity as % of liabilities 0.8 0.8 1.5 0.7 0.6 0.6Private debt (% of GDP) 229.4 228.0 229.0 226.6 228.9 -Gross external debt (% of GDP)2) - public 36.0 35.7 36.3 38.6 41.2 37.1
- private 288.7 295.3 304.5 318.2 328.8 337.5Long-term interest rate spread versus Bund (basis points)* 24.8 38.1 43.8 39.2 29.0 19.5Credit default swap spreads for sovereign securities (5-year)* 44.6 66.0 86.4 49.0 28.2 16.1Notes (1) Latest data Q3 2015. (2) Latest data September 2015. Monetary authorities, monetary and financial institutions are not included. * Measured in basis points.Sources: IMF (financial soundness indicators); European Commission (long-term interest rates); World Bank (gross external debt); Eurostat (private debt); ECB (all other indicators).
65
C. Standard tables
Table C.2: Labour market and social indicators2010 2011 2012 2013 2014 2015 (4)
Employment rate(% of population aged 20-64) 76.8 76.4 76.6 75.9 75.4 76.3
Employment growth (% change from previous year) -0.7 0.9 -0.2 -0.9 -0.2 0.8
Employment rate of women(% of female population aged 20-64) 70.8 70.4 71.0 70.6 69.7 70.8
Employment rate of men (% of male population aged 20-64) 82.8 82.4 82.3 81.1 81.1 81.8
Employment rate of older workers (% of population aged 55-64) 53.7 55.2 57.6 59.2 59.9 61.6
Part-time employment (% of total employment, aged 15 years and over) 48.9 48.9 49.6 50.6 50.4 50.8
Fixed term employment (% of employees with a fixed term contract, aged 15 years and over) 18.5 18.3 19.4 20.5 21.5 22.1
Transitions from temporary to permanent employment 20.0 20.8 16.5 12.3 - -Unemployment rate(1) (% active population, age group 15-74)
5.0 5.0 5.8 7.3 7.4 6.9
Long-term unemployment rate(2) (% of labour force) 1.4 1.7 2.0 2.6 3.0 3.1Youth unemployment rate (% active population aged 15-24) 11.1 10.0 11.7 13.2 12.7 11.3
Youth NEET(3) rate (% of population aged 15-24) 4.3 4.3 4.9 5.6 5.5 -Early leavers from education and training (% of pop. aged 18-24 with at most lower sec. educ. and not in further education or training)
10.0 9.2 8.9 9.3 8.7 -
Tertiary educational attainment (% of population aged 30-34 having successfully completed tertiary education) 41.4 41.2 42.2 43.2 44.8 -
Formal childcare (30 hours or over; % of population aged less than 3 years) 6.0 6.0 7.0 6.0 - -
Notes(1) Unemployed persons are all those who were not employed but had actively sought work and were ready to begin working immediately or within two weeks.(2) Long-term unemployed are peoples who have been unemployed for at least 12 months.(3) Not in education employment or training.(4) Average of first three quarters of 2015. Data for total unemployment and youth unemployment rates are seasonally adjusted.Source: European Commission (EU Labour Force Survey)
66
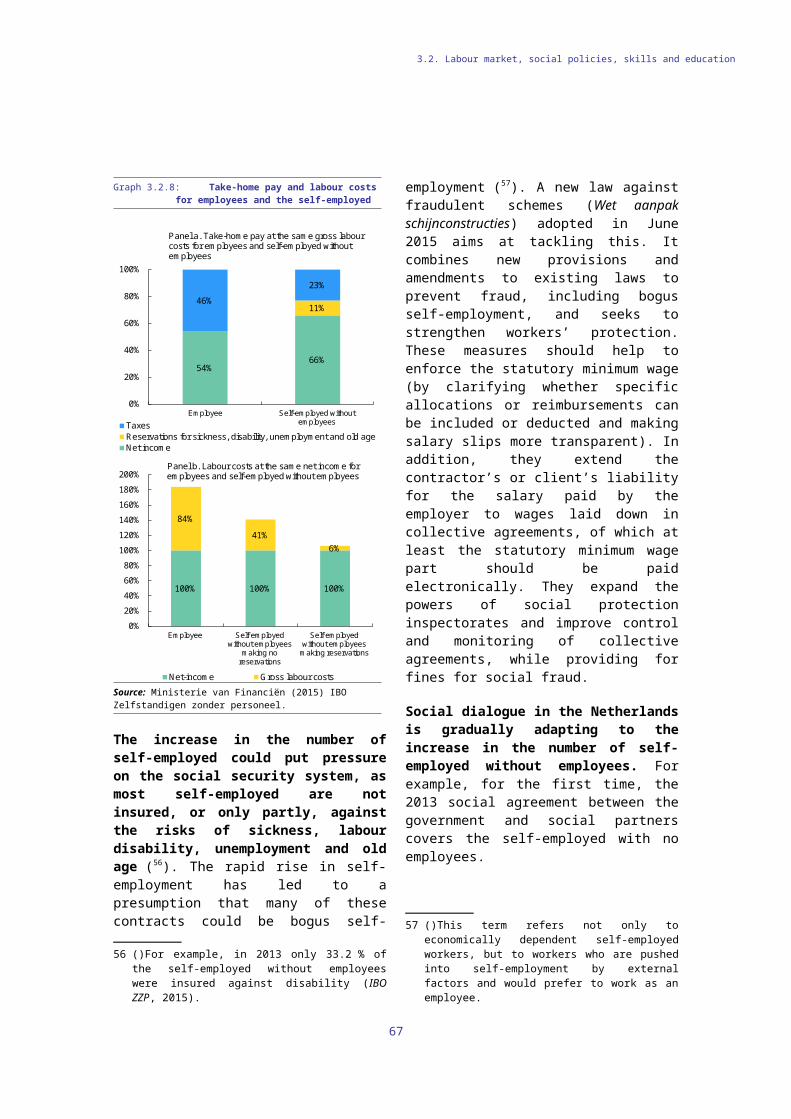
C. Standard tables
Table C.3: Labour market and social indicators (continued)Expenditure on social protection benefits (% of GDP) 2009 2010 2011 2012 2013 2014
Sickness/healthcare 9.7 9.9 10.1 10.5 10.2 -Invalidity 2.3 2.3 2.2 2.2 2.3 -Old age and survivors 10.8 11.1 11.2 11.6 12.2 -Family/children 1.2 1.2 1.1 1.0 1.0 -Unemployment 1.3 1.5 1.4 1.6 1.6 -Housing and social exclusion n.e.c. 0.3 0.4 0.4 0.4 0.4 -Total 27.6 28.1 28.4 29.2 29.3 -of which: means-tested benefits 4.2 4.3 4.4 4.5 3.9 -
Social inclusion indicators 2009 2010 2011 2012 2013 2014
People at risk of poverty or social exclusion(1)
(% of total population)15.1 15.1 15.7 15.0 15.9 16.5
Children at risk of poverty or social exclusion (% of people aged 0-17) 17.5 16.9 18.0 16.9 17.0 17.1
At-risk-of-poverty rate(2) (% of total population) 11.1 10.3 11.0 10.1 10.4 11.6
Severe material deprivation rate(3) (% of total population) 1.4 2.2 2.5 2.3 2.5 3.2Proportion of people living in low work intensity households(4)
(% of people aged 0-59)8.5 8.4 8.9 8.9 9.3 10.2
In-work at-risk-of-poverty rate (% of persons employed) 5.0 5.1 5.4 4.6 4.5 5.3
Impact of social transfers (excluding pensions) on reducing poverty 45.9 51.2 47.4 51.0 50.0 45.5
Poverty thresholds, expressed in national currency at constant prices(5) 11648 11613 11516 11377 11214 10962
Gross disposable income (households; growth %) 0.0 0.5 2.3 0.1 1.2 2.4Inequality of income distribution (S80/S20 income quintile share ratio) 4.0 3.7 3.8 3.6 3.6 3.8
Notes(1) People at risk of poverty or social exclusion (AROPE): individuals who are at risk of poverty (AROP) and/or suffering from severe material deprivation (SMD) and/or living in households with zero or very low work intensity (LWI). (2) At-risk-of-poverty rate (AROP): proportion of people with an equivalised disposable income below 60 % of the national equivalised median income. (3) Proportion of people who experience at least four of the following forms of deprivation: not being able to afford to i) pay their rent or utility bills, ii) keep their home adequately warm, iii) face unexpected expenses, iv) eat meat, fish or a protein equivalent every second day, v) enjoy a week of holiday away from home once a year, vi) have a car, vii) have a washing machine, viii) have a colour TV, or ix) have a telephone. (4) People living in households with very low work intensity: proportion of people aged 0-59 living in households where the adults (excluding dependent children) worked less than 20 % of their total work-time potential in the previous 12 months. (5) For EE, CY, MT, SI and SK, thresholds in nominal values in euros; harmonised index of consumer prices (HICP) = 100 in 2006 (2007 survey refers to 2006 incomes)Sources: For expenditure for social protection benefits ESSPROS; for social inclusion EU-SILC.
67
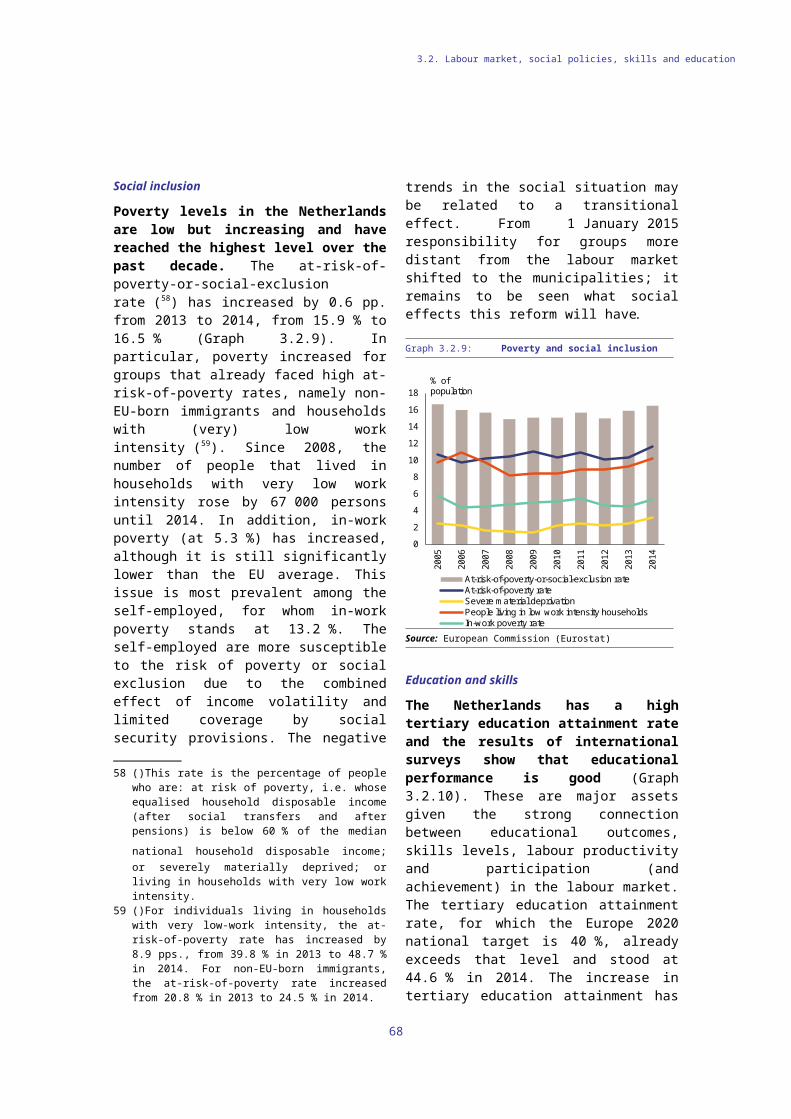
C. Standard tables
Table C.4: Structural policy and business environment indicatorsPerformance indicators 2009 2010 2011 2012 2013 2014Labour productivity (real, per person employed, y-o-y)
Labour productivity in industry -5.08 6.95 1.23 0.43 1.12 -2.02Labour productivity in construction -3.24 -5.77 -0.04 -4.78 -0.07 5.79Labour productivity in market services -1.87 2.27 1.33 0.55 -0.40 1.15
Unit labour costs (ULC) (whole economy, y-o-y)ULC in industry 11.07 -10.89 1.61 2.63 0.24 4.67ULC in construction 3.83 9.67 -0.82 7.82 -3.01 -6.96ULC in market services 4.10 -2.69 0.27 1.78 1.52 0.00
Business environment 2009 2010 2011 2012 2013 2014
Time needed to enforce contracts(1) (days) 514 514 514 514 514 514
Time needed to start a business(1) (days) 8.0 8.0 8.0 8.0 5.0 4.0
Outcome of applications by SMEs for bank loans(2) 1.07 1.43 1.25 1.80 1.58 1.64
Research and innovation 2009 2010 2011 2012 2013 2014
R&D intensity 1.69 1.72 1.90 1.94 1.96 1.97
Total public expenditure on education as % of GDP, for all levels of education combined 5.95 5.98 5.93 5.89 na na
Number of science & technology people employed as % of total employment 45 46 45 46 46 47
Population having completed tertiary education(3) 28 28 28 29 29 30
Young people with upper secondary level education(4) 77 78 78 79 78 79Trade balance of high technology products as % of GDP 1.12 1.71 1.98 2.86 2.26 2.22Product and service markets and competition 2003 2008 2013
OECD product market regulation (PMR)(5), overall 1.49 0.96 0.92
OECD PMR(5), retail 1.47 0.91 0.91
OECD PMR(5), professional services 1.57 1.28 1.23
OECD PMR(5), network industries(6) 2.06 1.71 1.57
Notes(1) The methodologies, including the assumptions, for this indicator are shown in detail here: http://www.doingbusiness.org/methodology. (2) Average of the answer to question Q7B_a. ‘[Bank loan]: If you applied and tried to negotiate for this type of financing over the past six months, what was the outcome?’. Answers were codified as follows: zero if received everything, one if received most of it, two if only received a limited part of it, three if refused or rejected and treated as missing values if the application is still pending or ‘don’t know’.(3) Percentage population aged 15-64 having completed tertiary education.(4) Percentage population aged 20-24 having attained at least upper secondary education.(5) Index: 0 = not regulated; 6 = most regulated. The methodologies of the OECD product market regulation indicators are shown in detail here: http://www.oecd.org/competition/reform/indicatorsofproductmarketregulationhomepage.htm(6) Aggregate OECD indicators of regulation in energy, transport and communications (ETCR).Source: European Commission; World Bank — Doing Business (for enforcing contracts and time to start a business); OECD (for the product market regulation indicators); SAFE (for outcome of SMEs’ applications for bank loans).
68
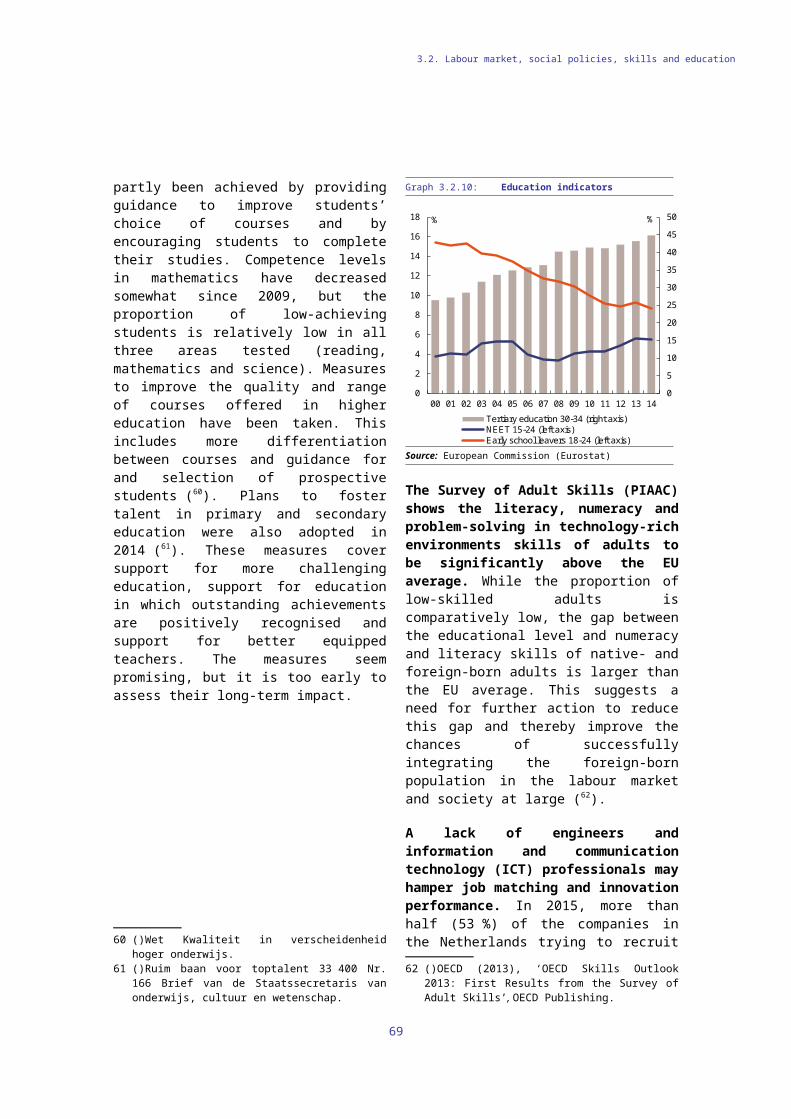
C. Standard tables
Table C.5: Green growthGreen growth performance 2009 2010 2011 2012 2013 2014
MacroeconomicEnergy intensity kgoe / € 0.15 0.16 0.14 0.15 0.15 -Carbon intensity kg / € 0.35 0.37 0.34 0.34 0.34 -Resource intensity (reciprocal of resource productivity) kg / € 0.33 0.32 0.32 0.30 0.27 0.28Waste intensity kg / € - 0.21 - 0.21 - -Energy balance of trade % GDP -1.7 -2.7 -3.5 -5.0 -4.0 -3.4Weighting of energy in HICP % 10.24 10.30 11.32 11.28 11.66 11.69Difference between energy price change and inflation % -0.1 -8.8 3.4 3.6 0.0 -1.5
Real unit of energy cost % of value added 15.8 17.4 19.5 - - -
Ratio of labour taxes to environmental taxes ratio 5.6 5.6 5.9 6.4 6.4 6.1 Environmental taxes % GDP 3.5 3.5 3.5 3.3 3.3 3.4
Sectoral Industry energy intensity kgoe / € 0.15 0.16 0.16 0.15 0.15 -
Real unit energy cost for manufacturing industry % of value added 58.8 69.9 79.0 - - -
Share of energy-intensive industries in the economy % GDP 9.23 9.71 9.52 9.50 9.58 9.16Electricity prices for medium-sized industrial users € / kWh 0.11 0.10 0.10 0.10 0.10 0.10Gas prices for medium-sized industrial users € / kWh 0.04 0.03 0.03 0.04 0.04 0.04Public R&D for energy % GDP 0.02 0.02 0.01 0.02 0.02 0.02Public R&D for environment % GDP 0.00 0.00 0.01 0.01 0.01 0.00Municipal waste recycling rate % 57.8 79.1 90.8 97.3 97.3 -Share of GHG emissions covered by ETS* % 40.8 40.3 40.8 39.7 44.3 47.6Transport energy intensity kgoe / € 0.58 0.56 0.55 0.53 0.52 -Transport carbon intensity kg / € 1.45 1.40 1.37 1.30 1.27 -
Security of energy supplyEnergy import dependency % 35.8 30.4 29.7 30.7 26.0 -Aggregated supplier concentration index HHI 18.0 19.3 36.8 27.9 75.5 -Diversification of energy mix HHI 0.36 0.38 0.36 0.35 0.35 -
NotesGeneral explanation of the table items:All macro intensity indicators are expressed as a ratio of a physical quantity to GDP (in 2005 prices) Energy intensity: gross inland energy consumption (in kgoe) divided by GDP (in EUR) Carbon intensity: greenhouse gas emissions (in kg CO2 equivalents) divided by GDP (in EUR) Resource intensity: domestic material consumption (in kg) divided by GDP (in EUR) Waste intensity: waste (in kg) divided by GDP (in EUR)Energy balance of trade: the balance of energy exports and imports, expressed as % of GDP. Weighting of energy in HICP: the proportion of ‘energy’ items in the consumption basket used for the construction of the HICP. Difference between energy price change and inflation: energy component of HICP, and total HICP inflation (annual % change). Real unit energy cost: real energy costs as a percentage of total value added for the economy. Environmental taxes over labour taxes and GDP: from European Commission’s database, ‘Taxation trends in the European Union’. Industry energy intensity: final energy consumption of industry (in kgoe) divided by gross value added of industry (in 2005 EUR). Real unit energy costs for manufacturing industry: real costs as a percentage of value added for manufacturing sectors. Share of energy-intensive industries in the economy: share of gross value added of the energy-intensive industries in GDP. Electricity and gas prices for medium-sized industrial users: consumption band 500-20 00MWh and 10 000-100 000 GJ; figures excl. VAT. Municipal waste recycling rate: ratio of recycled municipal waste to total municipal waste. Public R&D for energy or for the environment: government spending on R&D (GBAORD) for these categories as % of GDP. Proportion of greenhouse gas (GHG) emissions covered by EU Emission Trading System (ETS): based on greenhouse gas emissions (excl. land use, land use change and forestry) as reported by Member States to the European Environment Agency). Transport energy intensity: final energy consumption of transport activity (kgoe) divided by transport industry gross value added (in 2005 EUR). Transport carbon intensity: greenhouse gas emissions in transport activity divided by gross value added of the transport sector. Energy import dependency: net energy imports divided by gross inland energy consumption incl. consumption of international bunker fuels. Aggregated supplier concentration index: covers oil, gas and coal. Smaller values indicate larger diversification and hence lower risk. Diversification of the energy mix: Herfindahl index over natural gas, total petrol products, nuclear heat, renewable energies and solid fuels.* European Commission and European Environment AgencySource: European Commission (Eurostat) unless indicated otherwise
69