Embed Size (px)
Citation preview

Department of TransportAnnual Report
2015-16
Department of Transport Annual Report 2015-16 1
Our PurposeWe provide and enable safe, accessible and efficient movement for the economic and social prosperity of Western Australia.
Our VisionTo have the best integrated and intelligent transport services and solutions for the State.
Our ValuesClear DirectionWe set clear direction and have the courage to follow through.
Fresh ThinkingWe welcome fresh thinking and better ways of working.
Excellent ServiceWe work together to deliver excellent service.
Great peopleWe make things happen through our great people.
Statement of compliance with the Financial Management Act 2006
For the year ended 30 June 2016To the MinisterHon. Dean Nalder MLAMinister for Transport
In accordance with Section 63 of the Financial Management Act 2006, I hereby submit for your information and presentation to Parliament the Annual Report of the Department of Transport for the financial year ended 30 June 2016.
The Annual Report has been prepared in accordance with the provisions of the Financial Management Act 2006 and fulfils the Department of Transport’s reporting obligations under the Public Sector Management Act 1994, the Disability Services Act 1993 and the Electoral Act 1907.
Reece WaldockDirector General – Transport
Department of Transport Annual Report 2015-16 2

OverviewDirector General’s ForewordIt gives me great pleasure to present to you the Department of Transport’s (DoT) Annual Report for 2015-2016. It highlights achievements that demonstrate the great work of the Department’s dedicated staff following months of detailed planning and collaboration.
As Western Australia goes through an economic transition, we are experiencing increasing pressure on all modes of transport in both metropolitan and regional areas. It is clear that strategic planning is critical and I’m pleased to say that this year we have been working even harder with our portfolio partners; the Public Transport Authority (PTA) and Main Roads Western Australia, to deliver a smart, safe and customer focused transport network.
In June, leadership colleagues from across the portfolio met for the inaugural Portfolio Planning Day to consider the changing transport needs of our State and how the political and rapidly changing economic, social and environmental factors will influence the way we connect people and places. The result is the first Transport Portfolio Strategic Framework. This framework sets our agenda for working together to develop strategic transport policies, priorities and integrated transport plans to keep people and freight moving through WA – now and into the future.
As portfolio partners we can apply our expertise to provide world class outcomes and I am proud to say we are well underway in developing unified plans and policies.
An excellent example of this is the Transport @ 3.5 million – Perth Transport Plan for 3.5 million people and beyond. The Plan was developed during 2015-16 in close collaboration with our partners, and I believe it is a visionary proposal to expand and integrate transport options and to create a connected and accessible city with strong regional, interstate and international links. Transport @ 3.5 Million considers all modes of transport and is based on extensive research, knowledge, experience and predictive modelling. It takes into account many influencing factors, including future land use and employment distribution, changing demographics, social trends and expected advances in technology.
I am pleased to say that this year we stayed focused on improving our customer’s experience through providing more choice, flexibility and security.
Customer choice and service delivery were certainly key factors in the State Government’s May announcement to reform WA’s on-demand transport services. In the past few years, the on-demand transport industry has faced unprecedented changes with new market entrants and customer service expectations. It was evident from the feedback received following last year’s public release of the Green Paper proposing the reforms, that the industry and our community were ready for these changes.
The first stage of the On-demand Industry reforms will reduce red tape and remove many current licence restrictions, with the aim of supporting an industry that is flexible, responsive to its customers and importantly, will give the industry the freedom to compete and innovate. As DoT works with industry during the transition into the new environment, the safety and security of all passengers, drivers and operators will remain a priority.
Department of Transport Annual Report 2015-16 3

This year the Department has taken further steps to providing customers with choice and ease of access to Driver and Vehicle Services (DVS). Since January 2016, DoT customers have been able to use a range of DVS services through an expanded 32 metropolitan Australia Post outlets. DVS has also entered into a new partnership with Kmart Tyre and Auto Centres and Coles Express stations to provide Authorised Inspection Stations (AIS) for vehicle examinations, expanding the service to 30 DoT vehicle examination centres (VEC), which will significantly reduce the wait time for customer bookings. Similarly, for drivers who require regular medical assessments to continue driving for work purposes, they can now simply complete a Fitness to Drive declaration rather than undertake a time-consuming full assessment.
In other developments, we continue to improve safety and connectivity for our State’s growing cycling community. This year, Perth’s first bike boulevards were approved for Belmont, Bayswater and Mt Hawthorn. Through clearly marked local streets, cyclists will travel through safe and comfortable bike routes close to schools, train stations or shops, while more than $3.5 million has been allocated for cycling infrastructure projects as part of the Regional Bicycle Network and Perth Bicycle Networks.
Our work on State-wide infrastructure projects is ongoing with major construction works commencing on the $18.3 million Exmouth Boat Harbour upgrade and extensions. As the largest harbour south of the Pilbara, Exmouth is an important maritime hub in the State’s north and DoT is working closely with the Gascoyne Development Commission, Shire of Exmouth and boat harbour users as the project moves through its stages. In Kununurra, the East Kimberley Regional Airport has had a $5.1 million runway upgrade to improve safety and functionality for its vital air services in our north.
During 2015-16, the WA branch of the Office of the National Rail Safety Regulator was opened following the introduction of the Rail Safety National Law (WA) 2015. This national rail safety system allows rail operators and safety investigators to move between states without the need to hold multiple accreditations. Not only does this streamline interstate trade it will provide a national pool of expertise to improve consistency and ultimately safety standards.
Finally on a personal note, this is the last Annual Report I will present on behalf of DoT as I will be stepping down as Director General as of July 2016. Since the day I started in 2010, it has been a privilege to work for such a dynamic organisation. Over the years I have seen it evolve into a strong portfolio firmly committed to our customers and the community. Now more than ever, transport is an integral part of the everyday lives of all Western Australians and there are many extraordinary developments ahead that will deliver the best integrated transport services for the State. I know I will be watching with much interest and great pride.
Reece WaldockDirector General – Transport
Department of Transport Annual Report 2015-16 4

HighlightsThe visionary Transport @ 3.5 Million – Perth Transport Plan was completed.
$59.7 million was invested back into CBD projects from the Perth Parking Licensing Account.
Work commenced on Perth’s first Bike Boulevards in Belmont, Bayswater and Mt Hawthorn.
The number of Authorised Inspection Stations nearly doubled in 2015-16 with 30 new stations in the metropolitan area.
11 projects were completed to improve WA’s regional airports.
The announcement of reforms to the On-demand industry will launch a new era for passengers and operators.
Stage 2 works commence on the $18.2 million Exmouth Boat Harbour upgrade.
$1 million Coastal Adaptation and Protection grants were made available for projects to preserve our coastline.
Department of Transport Annual Report 2015-16 5

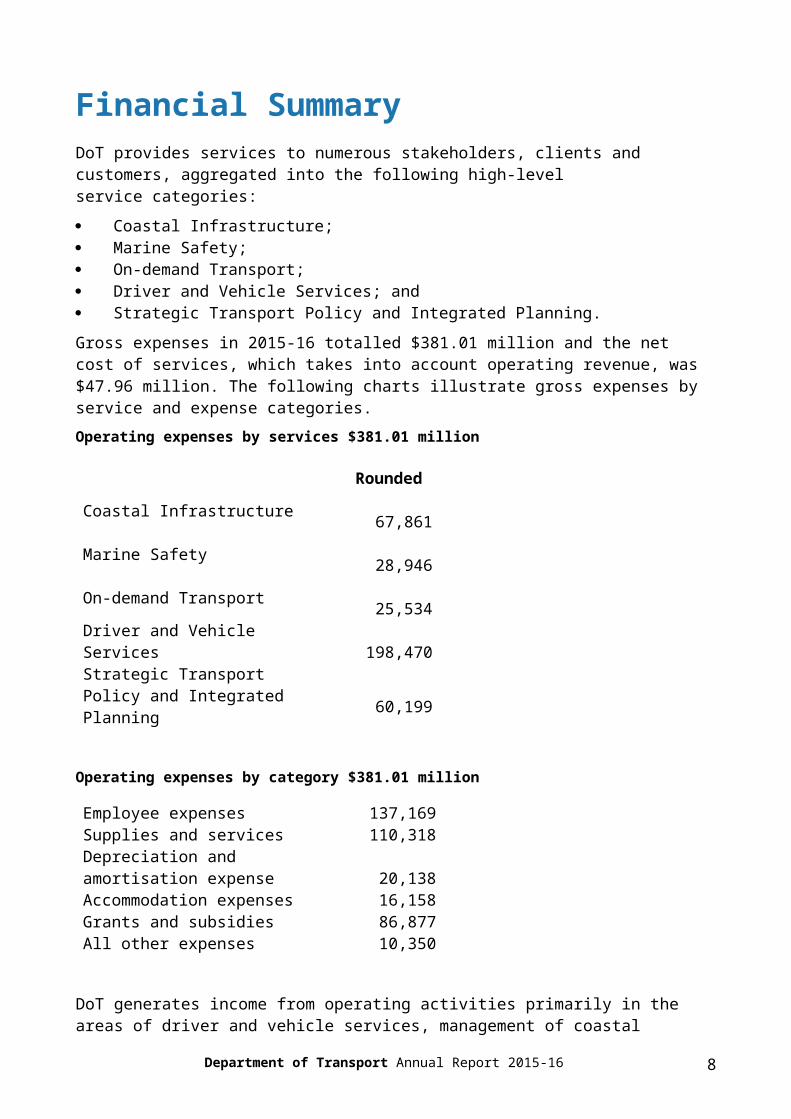
Financial SummaryDoT provides services to numerous stakeholders, clients and customers, aggregated into the following high-level service categories:
Coastal Infrastructure; Marine Safety; On-demand Transport; Driver and Vehicle Services; and Strategic Transport Policy and Integrated Planning.
Gross expenses in 2015-16 totalled $381.01 million and the net cost of services, which takes into account operating revenue, was $47.96 million. The following charts illustrate gross expenses by service and expense categories.
Operating expenses by services $381.01 million
RoundedCoastal Infrastructure
67,861
Marine Safety 28,946
On-demand Transport 25,534
Driver and Vehicle Services 198,470
Strategic Transport Policy and Integrated Planning
60,199
Operating expenses by category $381.01 million
Employee expenses 137,169Supplies and services 110,318Depreciation and amortisation expense 20,138Accommodation expenses 16,158Grants and subsidies 86,877All other expenses 10,350
DoT generates income from operating activities primarily in the areas of driver and vehicle services, management of coastal facilities, marine safety, parking levies in the Perth Central Business District (CBD) and regulation of the taxi industry.
Income by Category $333.06 million
User charges and fees 269,870Sales 137Grants and subsidies 9,885Interest Revenues 1,566
Department of Transport Annual Report 2015-16 6

Assets assumed 1,541Other revenues 50,059
This year DoT managed a diverse physical asset base totalling $469.97 million to deliver its services. The chart below shows the distribution by asset class.
DoT’s equity at 30 June 2016 was $709.58 million.
Assets under management $469.97 million
Property, plant and equipment 169,163Infrastructure 245,803Intangible Assets 27,079Construction in Progress 27,920
DoT also administers functions where the revenue is taken directly to the Consolidated Account or to other Government agencies. Total administered revenue from these functions totalled $2 billion in 2015-16, as illustrated below.
Administered revenues $2 billion
Motor vehicle registrations 831,153Plate and transfer infringements 8,954Speed and red light infringement fines 112,156Stamp duty 348,744Third party motor vehicle insurance premiums 680,066Other 16,566
Department of Transport Annual Report 2015-16 7
Operational StructureThe Transport PortfolioDoT is a key agency in the State Government’s Transport Portfolio, integrating and enhancing coordination of the State’s transport operations, regulatory functions and planning and policy development processes.
Throughout 2015-16, Reece Waldock concurrently held the positions of Director General – Transport, Chief Executive Officer of the PTA and Commissioner of Main Roads.
The structure of the Transport Portfolio is outlined in the Organisational Chart.
The Department of TransportDoT delivers its services through two divisions – Policy, Planning and Investment (PPI) and Transport Services.
PPI provides strategic transport policy, integrated transport planning solutions and coordinated investment decisions in collaboration with key stakeholders, to assist in the development of a safe and sustainable transport system for the movement of people and freight.
Transport Services leads and manages the State-wide delivery of a number of specialist transport services, including driver and vehicle services, coastal infrastructure and marine and rail safety, while also regulating WA’s on-demand transport industry.
The core functions of each directorate that make up these divisions are outlined in the Organisational Chart.
Changes to the Department in 2015-16DoT has established new business areas within DVS.
The new areas are:
Business Reform; Strategy, Policy and Governance; Commercial and Partnerships – formally known as Revenue Management and
Business Support; and Customer Service Delivery.
These will provide a realigned structure that will strengthen our accountability and customer focussed approach, align activities around our strategic plan and assist with the delivery of our reform plans to enhance DVS’ core purpose of Safe Drivers, Safe Vehicles, Secure Identities and Excellence in Service.
DoT also renamed its former Passenger Services Business Unit to On-demand Transport (OdT). This name change recognises the unit’s role will be delivered in a significantly changed environment.
Enabling legislationDoT was established on 1 July 2009, under the Public Sector Management Act 1994.
Responsible Minister
Department of Transport Annual Report 2015-16 8

Hon. Dean Nalder MLA, Minister for Transport.
Organisational Structure
Transport Portfolio
Department of Transport Annual Report 2015-16 9

Department of Transport
Department of Transport Annual Report 2015-16 10

Corporate ExecutiveReece WaldockDirector General – Transport As the head of the Transport Portfolio, Reece is responsible for setting the strategic direction of transport in the State, shaping the development of a number of major integrated transport plans and leading the implementation of some of WA’s most transformational capital projects.
With more than 35 years experience in strategic management, with particular expertise in organisational reform, his appointment as Director General – Transport in 2010 was the culmination of a 20-year journey within various State Government transport agencies including 14 years as a Chief Executive Officer. Prior to his public sector career, Reece held a number of senior management roles with BHP Billiton Pty Ltd.
Reece is also a Commissioner of the Western Australian Planning Commission (WAPC), Lifeline WA board member and a Director of the Australian Urban Design Research Centre.
Graeme DoyleManaging Director – Policy, Planning and Investment Graeme was appointed as Managing Director – Policy, Planning and Investment in April 2015. He brings a wealth of knowledge to the role with 36 years experience in the public sector and has been a valuable member of DoT’s Corporate Executive for five years, including in his previous capacity as Executive Director – Investment and Finance Coordination.
Graeme and his expert team provide policy advice, strategic transport solutions and coordinated investment decisions to State Government to assist in effective movement of people and goods. In doing so, Graeme ensures strong collaboration across the Transport Portfolio for a unified approach to planning and delivering WA’s transport services, infrastructure and systems.
Nina LyhneManaging Director – Transport ServicesNina joined DoT in January 2011 as the Managing Director – Transport Services. Nina holds a Bachelor of Arts degree in Psychology and has previously held the positions of WorkSafe Western Australia Commissioner and the Executive Director of the Office of Road Safety. Nina has worked in diverse roles across government agencies in sectors ranging from trade and commerce to community development and occupational safety and health.
In her key role with DoT, Nina is responsible for the delivery of a wide range of transport services including driver and vehicle services, coastal infrastructure, marine and rail safety and on-demand transport. She also oversees the provision of information technology, people and corporate services for DoT.
Department of Transport Annual Report 2015-16 11

Kate WangDirector – Office of the Director General Kate joined DoT as Director – Office of the Director General in October 2014. In this strategically focussed role, Kate leads the communications, ministerial liaison and governance activities of the Department while ensuring strong coordination of these functions across the Transport Portfolio.
Kate has more than 20 years State Government experience, having worked in policy and project roles for a range of agencies and Ministerial offices across the portfolios of Commerce, Education and most recently Transport.
As Principal Policy Advisor to the Minister for Transport for five years, she has a thorough understanding of the challenges and opportunities facing DoT and its portfolio partners. This background, together with a Masters of Business Administration in International Business, enables Kate to effectively lead the business and strategic planning for the DoT and the Transport Portfolio and to facilitate the progression of key priorities on behalf of the Director General.
Kate is an Alumna of Leadership Western Australia.
Fiona KnobelExecutive Director – People and Organisational DevelopmentFiona joined DoT as the Executive Director – People and Organisational Development in July 2011.
With her highly professional background, which includes a Master of Business in Human Resource Management and more than 25 years experience working across both the public and private sectors, Fiona is a strategically focused executive, leader and practitioner of managing people, performance and organisational culture to achieve the desired financial and non-financial business results.
At DoT, Fiona’s expertise and commitment has led the strategic alignment and delivery of people strategies to enable DoT as a sustainable values-driven organisation to focus on delivering excellent customer service.
Fiona is also a Fellow with Australian Human Resources Institute.
Dennis O’ReillyExecutive Director – Corporate ServicesA public servant for over 20 years, Dennis returned to DoT as the Executive Director – Corporate Services in February 2012, following more than six years leading Main Road’s customer service transformation. Prior to his time at Main Roads, Dennis headed up DoT’s Regional Services Business Unit.
In his current role, Dennis builds internal partnerships to provide quality services in the areas of accommodation and buildings, procurement and fleet, information and records management, as well as legal and legislative services.
During his time with Corporate Services, Dennis has provided his team with a clear focus in respect to customer service, relationship-building, business improvement and innovation and governance and accountability.
Department of Transport Annual Report 2015-16 12

Peter ParoloExecutive Director – Investment and Finance CoordinationPeter was appointed as Executive Director – Investment and Finance Coordination in 2015. He joined DoT in 2011 as Executive Director of Ports and Maritime. Previously, Peter was Chief Financial Officer for the Department of Water and has some 31 years experience in financial management within the private sector and the WA public sector.
With a Master in Accounting and as a Fellow of Certified Practising Accountants Australia, Peter’s experience and qualifications provides his teams with strong leadership and guidance to manage DoT’s broad financial accounting services and reporting requirements and the budgeting and planning linked to good financial management. He is also responsible for the portfolio coordination unit that manages portfolio project assessment and coordination.
Peter values and encourages his teams to seek opportunities to improve processes and stakeholder relationships.
Ann KingGeneral Manager – Driver and Vehicle ServicesAnn joined DoT as General Manager – Driver and Vehicle Services in January 2015. In her dynamic customer-focussed role, she is responsible for overseeing all aspects of driver and vehicle licensing in WA to ensure DoT achieves its outcomes of safe drivers, safe vehicles, secure identities and excellence in service.
Ann has experience in both the public and private sectors including expertise in registration and licensing services from her time at NSW Roads and Maritime Services. This experience, together with her extensive strategic policy and planning background and commitment to excellent service and new technologies, means she is well-placed to lead the delivery of driver and vehicle services State-wide.
In doing this, Ann balances the needs of DoT’s customers and a strong focus on education and compliance, providing service outcomes that deliver value for money for the WA community.
Ann values her team and is committed to creating a positive culture through collaborative relationships.
Christian ThompsonExecutive Director – Business Information SystemsChristian commenced as Executive Director – Business Information Systems in April 2015. In this newly created role, Christian provides strategic direction for the development and support of information technology across DoT.
His expertise in leading high-performing, innovative technology teams ensures the smooth delivery of IT services both internally and externally, as DoT continues to improve its online service delivery to meet the growing needs of its customers.
Christian is qualified in geology and IT and has more than 30 years experience in the latter. He has worked in various IT roles within the mining industry including General Manager of Shared Business Services for Rio Tinto and Chief Information Officer for iron ore junior Citic Pacific Mining.
Department of Transport Annual Report 2015-16 13

Administered LegislationOn behalf of the Minister for Transport, DoT administers the following Acts: Air Navigation Act 1937 Civil Aviation (Carriers’ Liability) Act 1961 Damage by Aircraft Act 1964 Harbours and Jetties Act 1928 Jetties Act 1926 Lights (Navigation Protection) Act 1938 Marine and Harbours Act 1981 Marine Navigational Aids Act 1973 Maritime Fees and Charges (Taxing) Act 1999 Motor Vehicle Drivers Instructors Act 1963 Owner-Drivers (Contracts and Disputes) Act 2007 Perth Parking Management Act 1999 Perth Parking Management (Consequential Provisions) Act 1999 Perth Parking Management (Taxing) Act 1999 Pilots’ Limitation of Liability Act 1962 Pollution of Waters By Oil and Noxious Substances Act 1987 Port Authorities Act 1999 Rail Safety National Law (WA) Act 2015 Road Traffic (Administration) Act 2008 Road Traffic (Authorisation to Drive) Act 2008 Road Traffic (Vehicles) Act 2012 Road Traffic (Vehicles) (Taxing) Act 2008 Sea-Carriage of Goods Act 1909 Shipping and Pilotage Act 1967 Taxi Act 1994 Taxi Drivers Licensing Act 2014 Trans-Continental Railway Act 1911 Transport Co-ordination Act 1966 Western Australian Marine Act 1982 Western Australian Marine (Sea Dumping) Act 1981 Wire and Wire Netting Act 1926 Western Australian Photo Card Act 2014
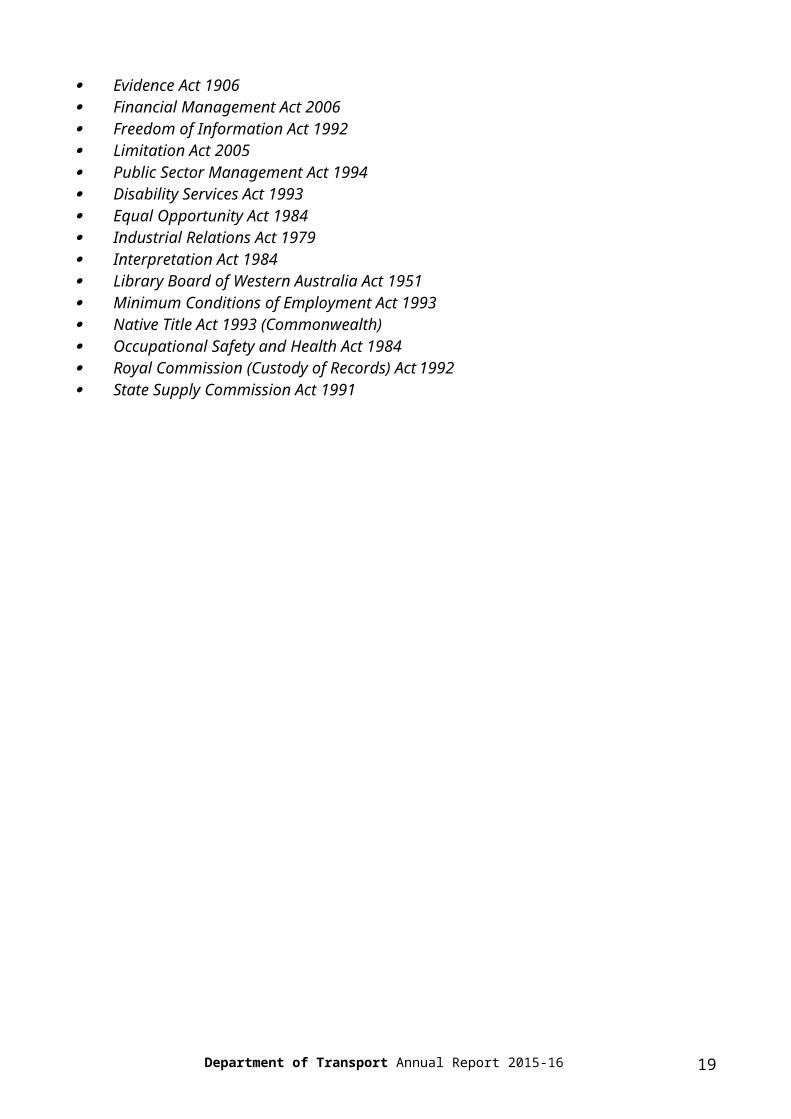
Other legislation affecting the functions and operation of DoT include: State Records Act 2000 State Trading Concerns Act 1916 Criminal Code 1913 Electronic Transactions Act 2011 Evidence Act 1906 Financial Management Act 2006 Freedom of Information Act 1992 Limitation Act 2005 Public Sector Management Act 1994 Disability Services Act 1993 Equal Opportunity Act 1984 Industrial Relations Act 1979 Interpretation Act 1984 Library Board of Western Australia Act 1951
Department of Transport Annual Report 2015-16 14

Minimum Conditions of Employment Act 1993 Native Title Act 1993 (Commonwealth) Occupational Safety and Health Act 1984 Royal Commission (Custody of Records) Act 1992 State Supply Commission Act 1991
Department of Transport Annual Report 2015-16 15

Performance Management FrameworkOutcome-based management frameworkUnder an outcome-based management framework, DoT contributes to two of the State Government’s strategic goals:
State Government Strategic Goals
DoT Outcomes DoT Services
Results Based Service DeliveryGreater focus on achieving results in key service delivery areas for the benefit of all Western Australians.
1. An accessible and safe transport system
1. Coastal Infrastructure
2. Marine Safety
3. On-demand Transport
Results Based Service DeliveryGreater focus on achieving results in key service delivery areas for the benefit of all Western Australians.
2. Vehicles and road users that meet established vehicle standards and driver competencies to deliver safe vehicles and safe drivers
4. Driver and Vehicle Services
State Building – Major ProjectsBuilding strategic infrastructure that will create jobs and underpin Western Australia’s long-term economic development.
3. Integrated transport systems that facilitate economic development
5. Strategic Transport Policy and Integrated Planning.
Changes to outcome-based management frameworkDoT received approval from the Economic Expenditure Reform Committee for significant changes to the 2015-16 outcome-based management structure. Further minor changes were approved by Treasury in December 2015.** In Dec 2015, Treasury approved the name change for Service 2 and 3. Service 2 was changed from Marine and Rail Safety to Marine Safety Service with the responsibility for Rail Safety being transferred to Office of the National Rail Safety Regulator. The name of Service 3 changed from Passenger Services to On-demand Transport.
These changes included increasing the number of Services from three to five and also included changes to key effectiveness and efficiency performance indicators.
These changes provide a more detailed view of services, and align and enhance performance number information to further increase stakeholders’ understanding of DoT operations.
Department of Transport Annual Report 2015-16 16

Changes to ServicesTransport system and services development, planning, operation and regulation service was replaced by the following:
Coastal Infrastructure Service (Service 1) Marine Safety Service* (Service 2) On-demand Transport* (Service 3)
The changes to Services more clearly represent functions that are recognised by the public.
Changes to Key Efficiency Performance IndicatorsDoT discontinued the Average cost per vehicle inspection Key Performance Indicator (KPI) as it no longer reflected the service provision model used to inspect vehicles. It has been replaced with the following two KPIs:
Average cost per vehicle inspection performed by Vehicle Examination Centres. Average cost per vehicle inspection delivered through Authorised Inspection Stations. DoT discontinued the average cost per household contacted under the TravelSmart
Scheme efficiency indicator as the KPI failed to adequately measure the efficiency of the TravelSmart program.
The following KPI was amended:
Average cost per day per maritime infrastructure asset managed. Inclusion of costs previously charged to the previous Service 3 Strategic Transport Policy and Integrated Planning which are more aligned to the new Coastal Infrastructure Service.
For the following KPIs, the Coastal Infrastructure costs were removed and included in the new Coastal Infrastructure Service:
Average cost per policy hour for strategic transport policy development. Average cost per planning hour for integrated transport planning development.
The following KPI changed from an efficiency KPI to an effectiveness KPI as it did not contain any costs to measure efficiency and is more aligned to a measure of effectiveness:
Percentage of driver’s licence cards issued within 21 days of completed application.
Key Effectiveness Performance IndicatorsDoT discontinued the following KPIs:
Percentage of standard metropolitan (non-multi-purpose) taxi jobs which were not covered – peak
Percentage of standard metropolitan (non-multi-purpose) taxi jobs which were not covered – off peak
They were replaced with a new KPI:
Compliance with mandatory taxi operating hours which is aligned to DoT’s responsibilities and within the control of the agency.
With the Office of Rail Safety ceasing operations with DoT, Treasury approved the removal of the following KPI in December 2015:
Number of serious rail accidents per million kilometres.
The wording “Assessed by audit” was removed from the title of the following two KPIs as
Department of Transport Annual Report 2015-16 17

this was part of the methodology of how it is measured:
Percentage of vehicle examinations completed in accordance with the Australian Design Rules assessed by audit (Safe Vehicles)
Percentage of driver licences issued that comply with the Graduated Driver Training and Licensing System assessed by audit (Safe Drivers).
The KPI percentage of regional airports receiving scheduled regular public transport (RPT) air services changed from Outcome one “An accessible and safe transport system” to Outcome three “Integrated transport systems that facilitate economic development” to better align function to outcome. Regular public transport air services to regional areas promotes local and state economic development by connecting regional business with opportunities outside their local area. By connecting regional towns by air, it makes Western Australia a more desirable destination for international, interstate and intrastate tourism.
Shared responsibilities with other agenciesIntegrated Transport PlanningDoT shares responsibility with portfolio partners Main Roads and the PTA to deliver high quality, intelligent and integrated transport policy, through planning, regulation, investment coordination and the delivery of safe and sustainable transport services.
In 2015-16, DoT and its portfolio partners developed Transport @ 3.5 Million – the Perth Transport Plan for 3.5 million people and beyond. The Plan identifies the major transport networks needed to keep people and freight moving as the city grows. It considers all modes of transport and proposes major structural changes to the network based on extensive research, knowledge, experience and predictive modelling.
DoT also works closely with the five Western Australian port authorities, providing leadership in developing investment programs and strategies, supporting reforms and initiatives, and assisting ports to facilitate trade through the development of ports strategies.
New scheme will support catastrophically injured peopleDoT has worked closely with the Insurance Commission of Western Australia (ICWA) to introduce the Catastrophic Injury Support Scheme through changes in the motor injury insurance legislation.
The Compulsory Third Party (CTP) Insurance did not provide cover for people who are catastrophically injured in a vehicle crash and are either at fault or who are unable to identify another driver at fault.
Each year in WA, approximately 44 catastrophically injured people do not receive any support through CTP insurance. From 1 July 2016, the CTP Catastrophic Injury Support Scheme will assist these people with treatment, care and support, including medical treatment and rehabilitation. Vehicle registration costs will increase to cover the costs of this care.
ICWA is responsible for operating the new insurance scheme, while DoT is responsible for collecting premiums, maintaining vehicle insurance details and issuing the new Motor
Department of Transport Annual Report 2015-16 18
Injury Insurance policies on behalf of the Insurance Commission.
Providing access to services in our communities
Community Open DaysSince November 2015, DoT has held Community Open Days at local community centres to assist people who are facing difficulties in obtaining a driver’s licence. These difficulties can include having inadequate identification, a lack of awareness of the licensing processes, or for some, physically attending a DVS business centre can be a challenge.
The Community Open Days, which are run in conjunction with the Department of the Attorney General, Department of Human Services (Centrelink) and the Registry of Births, Deaths and Marriages, offer a one-stop-shop in a more relaxed and interactive environment.
Protecting our coast
Marine hazard managementDoT is the appointed Hazard Management Agency (HMA), under the State Emergency Management Regulations 2005, for maritime transport emergencies and marine oil pollution incidents.
In 2015-16, the Marine Safety Business Unit commenced a project to enhance DoT’s readiness and capabilities to fulfil its HMA obligations relating to marine environmental emergencies. The details on the progress and outcomes of these projects are on page 29 of this report.
DoT continues work to ensure adequate prevention, preparation, response and recovery strategies are in place for maritime hazards in collaboration with the Australian Maritime Safety Authority, Port Authorities, Department of Fire and Emergency Services, Department of Environment, Department of Parks and Wildlife, Rottnest Island Authority and Western Australia Police.
Coastal Management Advisory GroupThe Coastal Management Advisory Group (CMAG) is an interagency working group chaired by the Department of Planning with DoT representative, General Manager, Coastal Infrastructure as the Deputy Chair.
The CMAG provides advice and oversees a whole of government approach to the management of coastal erosion and inundation consistent with the State Planning Policy SPP2.6 State Coastal Planning Policy. Its key outcomes are to provide an assessment and planning advice on existing erosion hotspots and high risk areas and develop a strategy for community education and awareness-raising around coastal hazard risk management and adaptation planning.
The group has membership from a number of State Governments with roles in environmental management and planning.
Providing a shared IT serviceIn 2015-16, DoT’s Business Information Systems (BIS) directorate has continued to maintain a shared ICT infrastructure service with the Department of Planning.
This shared arrangement is managed through a Service Level Agreement and continues to realise economies of scale and cost neutrality for the State Government.
Department of Transport Annual Report 2015-16 19

BIS provide operational support plus project delivery for both agencies through maintenance of software, hardware, disaster recovery systems and plans plus system security.
Video conferencing has now become common practice in DoT as business units find benefits in saving time, costs and resources while still providing valuable face-to-face interactions and participation between business areas.
Both agencies have many offices in metropolitan and regional locations and to improve communication and increased collaboration between these offices video conferencing facilities have been implemented across metropolitan and regional sites throughout WA.
Work continues to increase the use of technology for all desktops and mobile devices to further increase collaboration and productivity.
Enhancing maritime infrastructure
Denham Foreshore and Marine developmentsIn conjunction with the Shire of Shark Bay, DoT is working to redevelop Denham’s foreshore as part of the $6.116 million Royalties for Regions funded Gascoyne Revitalisation Plan.
The works include revitalising the Town Centre and Town Square area and the redevelopment of the town marine facilities. Together they will provide vibrant public spaces that cater for a wide range of community, tourism and commercial needs while maintaining Shark Bay's world heritage values.
The redevelopments are planned to be completed in time for the 400th anniversary of Dutch explorer Dirk Hartog’s landing off Shark Bay on the WA coast in October 2016.
Bunbury Marine FacilitiesDoT’s Coastal Infrastructure Business Unit is working with a number of agencies to progress improvements to Bunbury’s maritime facilities and future developments that will provide long term benefits for Bunbury and its surrounding communities.
As part of the South West Development Commission’s (SWDC) Transforming Bunbury Waterfront (TBW) initiative, the Coastal Infrastructure Business Unit, which operates Bunbury’s Casuarina Boat Harbour, has progressed concepts for an extensive development proposal for the boat harbour that will deliver more boat pens and marine facilities and services.
DoT is also part of a Steering Committee, which is overseeing the development of staged works for the overarching TBW initiative and developing funding business cases. The Committee includes representatives from the SWDC, Department of Planning, Department of Lands, City of Bunbury, the Southern Ports Authority and LandCorp.
Royalties for Regions funding has already allocated $24.9 million in the State Budget to revitalise Koombana Bay and redevelop the Dolphin Discovery Centre.
This funding will support the first stage of the waterfront redevelopment at Koombana Bay that will include new and improved footpaths, landscaping, car parking, an amphitheatre, access to the foreshore, a boardwalk and revegetation works to help protect the coastal dunes from future erosion.
Department of Transport Annual Report 2015-16 20

Department of Infrastructure and Regional Development (Commonwealth Government)Following successful negotiations between DoT and the Department of Infrastructure and Regional Development, a new Service Delivery Agreement was signed in July 2015 by the Minister for Transport and the Commonwealth Government to provide transport services to the Indian Ocean Territories (IOT) until 30 June 2019.
Through this Agreement, DoT supports the delivery of a safe, efficient, effective and equitable transport system in the IOT territories of Christmas Island and the Cocos (Keeling) Islands with the Commonwealth meeting all the costs of the services provided by DoT.
DoT meets regularly with Commonwealth Government officers to discuss operational matters and each year a work plan is developed for services within business units such as DVS, OdT, Marine Safety and BIS.
State Aviation StrategyDoT continues to work with other agencies on major projects arising from the State Aviation Strategy. DoT initiated each of the projects below and facilitated the agreement of the identified agencies to lead the nominated project:
A Second Perth Airport Study, which is being led by the Department of Planning, with DoT on the Steering Committee.
The State Aviation Training Strategy, which is being led by the Department of Training and Workforce Development, with DoT on the Steering Committee.
Strategic development of Western Australia’s Regional Airports Study, which is being jointly undertaken by Department of Regional Development and DoT.
The Department of Mines and Petroleum has included a step in its Mining Licence Application process requiring applicants to notify the Commonwealth whenever the construction of a new airstrip is proposed at a mine site.
Department of Transport Annual Report 2015-16 21

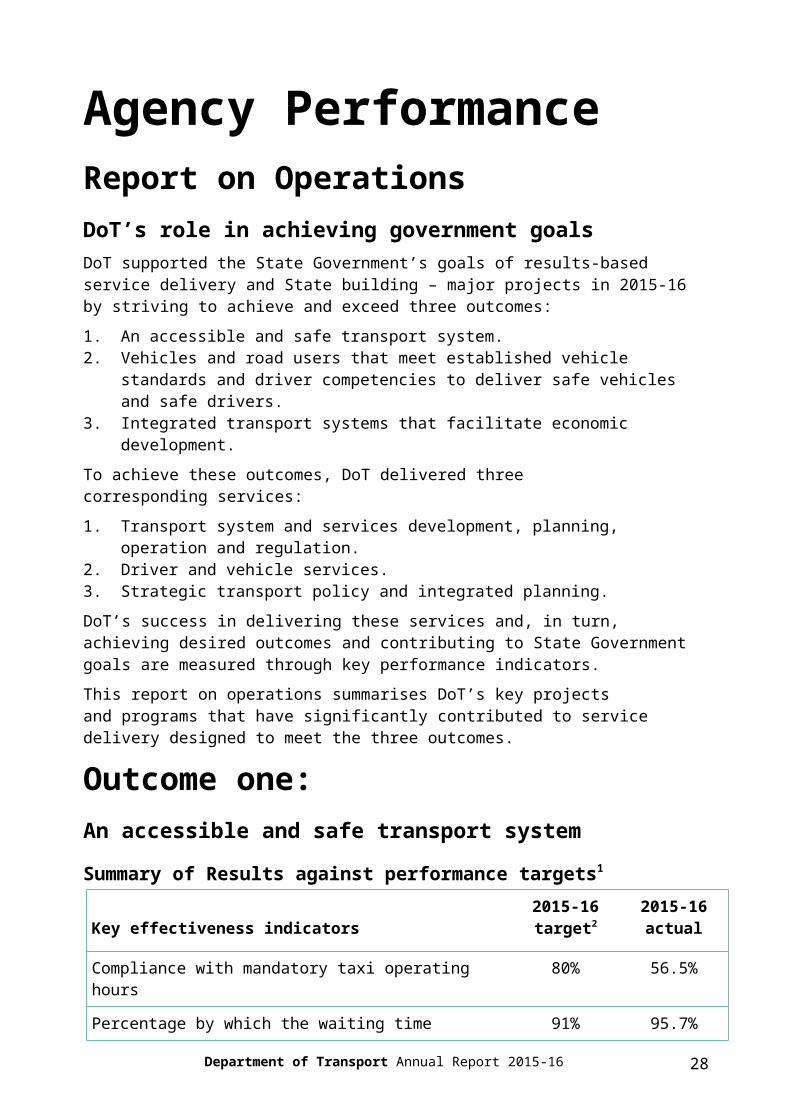
Agency PerformanceReport on OperationsDoT’s role in achieving government goalsDoT supported the State Government’s goals of results-based service delivery and State building – major projects in 2015-16 by striving to achieve and exceed three outcomes:
1. An accessible and safe transport system.2. Vehicles and road users that meet established vehicle standards and driver
competencies to deliver safe vehicles and safe drivers.3. Integrated transport systems that facilitate economic development.
To achieve these outcomes, DoT delivered three corresponding services:
1. Transport system and services development, planning, operation and regulation.2. Driver and vehicle services.3. Strategic transport policy and integrated planning.
DoT’s success in delivering these services and, in turn, achieving desired outcomes and contributing to State Government goals are measured through key performance indicators.
This report on operations summarises DoT’s key projects and programs that have significantly contributed to service delivery designed to meet the three outcomes.
Outcome one:An accessible and safe transport system
Summary of Results against performance targets1
Key effectiveness indicators2015-16 target2
2015-16actual
Compliance with mandatory taxi operating hours 80% 56.5%
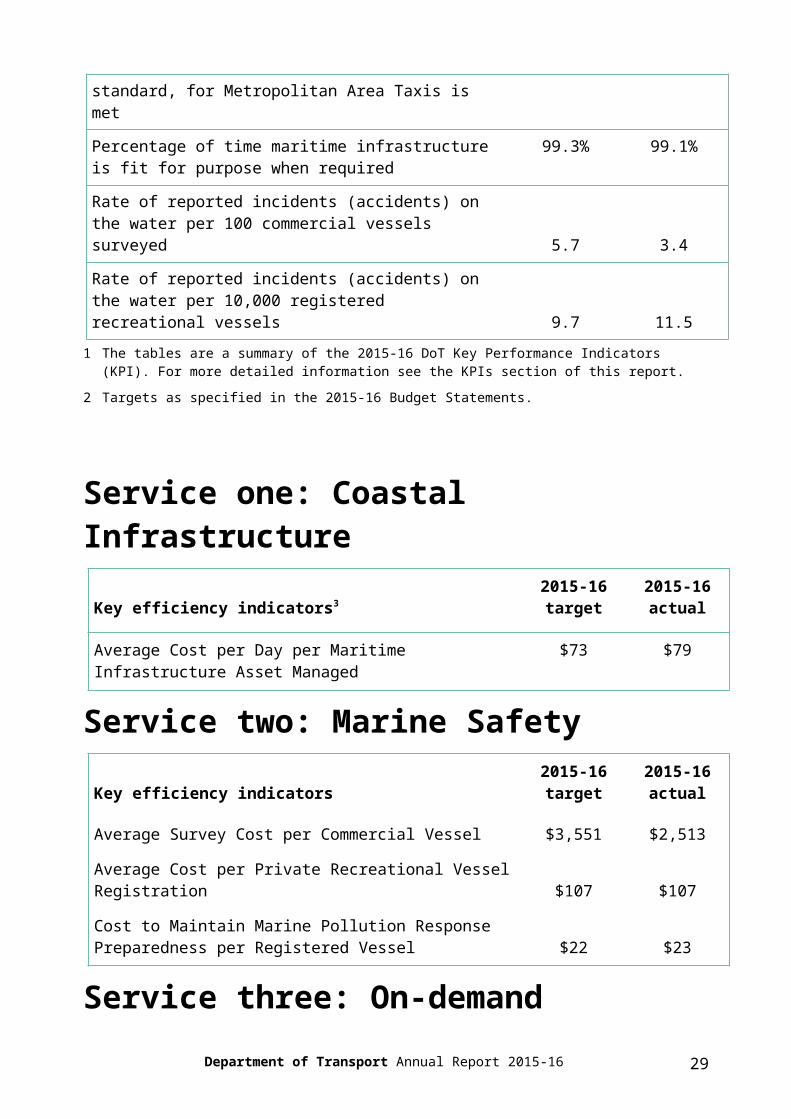
Percentage by which the waiting time standard, for Metropolitan Area Taxis is met 91% 95.7%
Percentage of time maritime infrastructure is fit for purpose when required
99.3% 99.1%
Rate of reported incidents (accidents) on the water per 100 commercial vessels surveyed 5.7 3.4
Rate of reported incidents (accidents) on the water per 10,000 registered recreational vessels 9.7 11.5
1 The tables are a summary of the 2015-16 DoT Key Performance Indicators (KPI). For more detailed information see the KPIs section of this report.
2 Targets as specified in the 2015-16 Budget Statements.
Department of Transport Annual Report 2015-16 22

Service one: Coastal Infrastructure
Key efficiency indicators32015-16 target
2015-16 actual
Average Cost per Day per Maritime Infrastructure Asset Managed
$73 $79
Service two: Marine Safety
Key efficiency indicators2015-16 target
2015-16 actual
Average Survey Cost per Commercial Vessel $3,551 $2,513
Average Cost per Private Recreational Vessel Registration $107 $107
Cost to Maintain Marine Pollution Response Preparedness per Registered Vessel $22 $23
Service three: On-demand Transport
Key efficiency indicators2015-16 target
2015-16 actual
Cost of Regulation per Taxi Plate Administered $3,756 $4,046
3 Efficiency KPI values are rounded to the nearest dollar.
On-demand Transport Industry ReformIn recent years, WA’s on-demand transport industry has faced a number of game-changers led by app-based technology, with the emergence of new market entrants and increased consumer demand for more transport options. These changes made it necessary to propose new reforms.
On 18 December 2015, the Minister for Transport announced plans to reform the on-demand transport industry in two stages, consistent with the proposals outlined in the On-demand Transport – Discussion Paper for Future Innovation (Green Paper) released in July. DoT received 5,831 responses to the Green Paper and although there were divergent views from industry stakeholders and users of the on-demand transport industry, the vast majority supported the proposals to simplify the regulations and policies.
The guiding principles for the reforms provide for:
an industry that is free to innovate; a regulatory environment that ensures that drivers and vehicles are safe and the
industry is accountable; and
Department of Transport Annual Report 2015-16 23

regulation that enables a level playing field for industry operators that continues to provide a safe and reliable service for consumers and drivers.
Since the announcement, DoT has been working to deliver Stage 1 of the reforms effective from July 2016, which will introduce:
changes to charter vehicle licensing requirements and conditions; the removal of the requirements for charter vehicles to impose a minimum fare; a significant reduction in the cost of licensing to below cost recovery in the first
year; amendments to regulations and plate operating conditions to allow the charging of
pre-agreed (contract fares) outside of rank and hail work; the freedom for drivers to choose to affiliate with more than one taxi dispatch
service or choose not to affiliate at all; and substantially reduced fees for metropolitan leased taxi plates and legislation to
remove the cap on taxi plate ownership. An important provision of Stage 1 is the substantial transition assistance package,
which will be available to assist taxi plate owners make the adjustment to the more competitive market. As part of this package, legislation has been introduced into Parliament to enable payment from the Taxi Industry Development Account of a one-off adjustment assistance payment to eligible plate owners.
Work progressed on the development of a Hardship Fund for additional assistance to plate owners who are suffering financial hardship as a result of the reforms. Support was also made available through the Small Business Development Corporation to assist owners to adjust and transition their business and to be aware of the business opportunities in the digital economy.
Stage 2 of the reforms will involve the creation of a new unifying On-Demand Transport Act governing the industry. DoT will continue to work with stakeholders and industry representatives to deliver a safe, flexible and efficient on-demand industry that meets community expectations.
Dedicated Multi-Purpose Taxi Dispatch ServiceFor some people living with disability, taxis may be the only available transport option and DoT is committed to ensuring they have the same access to a responsive and reliable taxi service as the rest of the travelling community.
To improve and simplify accessibility for taxi patrons travelling in wheelchairs, DoT has appointed Black and White Cabs as the new dedicated Multi-Purpose Taxi (MPT) dispatch service for the delivery of wheelchair accessible taxi services in the Perth metropolitan area. The decision to appoint a dedicated MPT service follows a review of MPT services and ongoing work with stakeholders in the disability sector.
Under the new arrangements, passenger wait times should be reduced through the management of a centralised fleet and vehicle roster system that will match demand, while MPT requests will be monitored in real time ensuring all jobs are completed.
In 2015-16, there were 109 MPTs operating in the metropolitan taxi fleet, which represented about five per cent of the total metropolitan fleet. All existing MPTs have the opportunity to affiliate with the new MPT Dispatch Service at any time but are not obliged to do so.
Drivers who have a regular MPT passenger, can continue to provide this service under the new dispatch service arrangements, as long as the driver logs the service request with Black and White Cabs MPT dispatch service.
This dedicated service is part of DoT’s commitment to continuously improve accessibility
Department of Transport Annual Report 2015-16 24

and safety for all MPT passengers.
Improved readiness for marine emergencyWA’s long pristine coastline provides those who live here with many opportunities and an enviable lifestyle but it also places great responsibility on government to protect it as one of the State’s significant assets.
DoT is the Hazard Management Agency for Marine Transport Emergencies and Marine Oil Pollution incidents. In 2015-16 DoT undertook work to enhance its readiness and capability to adequately respond to these to ensure the best possible outcome for the State.
Achievements in this period included the endorsement of a new and improved WestPlan – Marine Oil Pollution (MOP) by the State Emergency Management Committee and significant progress towards endorsement for WestPlan – Maritime Transport Emergency. Supporting plans and documents to the WestPlan MOP, extending to the offshore petroleum industry, were also introduced.
A formal comprehensive risk assessment of the WA coastline to determine risk levels and protection priorities also commenced in 2015-16 while a formal Oil Spill Contingency Plan template was developed for DoT boat harbours and finalised for the Two Rocks facility.
Other initiatives to enhance readiness and capability included the establishment and expansion of specialist teams to support DoT’s response to an incident or emergency; improvements to the Incident Control Centre capabilities and completion of the first phase of the 2016 State response exercise.
In 2016-17 efforts to boost readiness and capability will continue and build on the strong foundations of 2015-16.
Exmouth Boat Harbour upgrade commencedThe Exmouth Boat Harbour upgrade continues to progress with Stage 2 works commencing on the $18.275 million project.
The construction work includes the extension of the existing wharf and provision of a heavy lift facility that will provide better access for loading and unloading vessels.
To make way for the extension, existing trawler pens will be relocated near the existing wharf and the adjacent southern breakwater will be raised to provide the increased protection to the boat harbour. In addition, the wharf hardstand will beextended and other supporting landside infrastructure will be upgraded.
On-site works commenced in late 2015 to relocate the existing fuel farm and upgrade other services within the harbour. Following this, the main construction will commence in July 2016 with the project anticipated to be completed in March 2017.
This expanded infrastructure will support local businesses and industries supporting the fishing, charter and resource sectors.
Once completed, Exmouth Boat Harbour will be equipped to meet growing demand from recreational and commercial users in the region and the new facilities will allow Exmouth and the Gascoyne region increased capacity and efficiency as a service and support centre for the oil and gas sector.
Fremantle Fishing Boat Harbour Jetty 2 replacement completedWork was completed on the $3.8 million redevelopment project to replace Jetty 2,
Department of Transport Annual Report 2015-16 25

originally built in the 1960s, at the Fremantle Fishing Boat Harbour with a modern floating pontoon system.
The new jetty with 66 boat pens ranging in size from 15 to 20 meters has improved safety and access for boat harbour users.
Mariner notices go mobileDoT provides mariners and seafarers with important and up-to-date safety and navigational information through its website.
In late 2015 further upgrades allowed DoT customers to easily access and view the information on mobile devices such as tablets and mobile phones.
Grants for the Recreational Boating Facilities Scheme administeredOn behalf of the State Government, DoT administers the Recreational Boating Facilities Scheme (RBFS), which aims to improve recreational boating infrastructure by providing grants to eligible authorities around the State.
The key projects completed in 2015-16 include:
construction of four new universal access jetties at the Ocean Reef boat launching facility;
extension of the Ridley Place boat ramp and installation of two new universal access jetties;
extension of the finger jetty at the Old Dunsborough boat launching facility; the upgrade of the boat ramp and construction of a new universal access jetty at
the Walpole Town boat launching facility; construction of a finger jetty with lighting and upgraded trailer parking at Peaceful
Bay, Denmark; and the upgrade of the boat ramp at the Town Beach boat launching facility in Broome.
The RBFS is funded directly from recreational boat registration fees and is supplemented by Royalties for Regions funding. In May 2016, RBFS grants worth nearly $1.5 million for 20 projects throughout WA were made available for projects over the next two years.
Coastal Adaptation and Protection grantsThis year a further $1 million was made available for the Coastal Adaptation and Protection (CAP) grants program to help local coastal managers preserve and sustainably manage their coastline.
Coastal managers are invited to apply for grants up to 50 per cent of the total cost of a coastal adaptation project. Activities include monitoring, adaptation and planning, asset management, and maintenance.
The following are key projects completed in 2015-16:
The collection of seabed level survey from Two Rocks to Oakajee Sand replacement at Grace Darling Park, Lancelin Repairing two timber beach groynes at West Busselton Sand replacement at Esperance Bay Maintenance works to City Beach groyne.
Since 2005, approximately $11 million has been allocated to 158 projects from Port Hedland in the north to Esperance in the south.
Department of Transport Annual Report 2015-16 26

Two Rocks Marina expansionInadequate boat launching facilities at Two Rocks Marina, north of Perth, has been a long standing issue for recreational boaters in this region. DoT worked with the customers, stakeholders and contractors to identify a number of priority actions and implement improvements, including the expansion of the existing boat launching facilities.
The Stage 1 works, completed in July 2015, has more than doubled the number of marked bays in the parking area and introduced traffic management measures to facilitate queuing and ease congestion.
The Stage 2 $681,042 project, partly funded by the RBFS has:
widened the boat ramp to two distinct lanes; installed a central 50 metre floating jetty; realigned the revetment wall; removed the old fixed jetty; and created new access paths, solar lighting and signage upgrades.
In addition, with the project being delivered under budget, a new 18 metre boat landing pontoon was able to be constructed 75 metres north of the expanded boat ramp allowing better and safer access to and from vessels at peak times.
Marine Education Boatshed JettyLocated in East Fremantle, DoT’s Marine Education Boat Shed provides hands-on learning facilities and specially trained educators who help schools to incorporate marine safety education into the regular curriculum.
During 2015-16, approximately 12,000 students visited the Boatshed, with 11,447 students successfully completing their Recreational Skippers Ticket to date.
Originally built in 1942 as a boathouse for the Leeuwin Barracks, the Boatshed Jetty was in urgent need for repair or replacement. Following a comprehensive assessment of the options, a decision was made to replace the jetty with an improved jetty structure that would serve the facility well into the future.
The $1.3 million project was officially opened on 1 December 2015.
Department of Transport Annual Report 2015-16 27
Outcome two:Vehicles and road users that meet established vehicle standards and driver competencies to deliver safe vehicles and safe drivers
Summary of Results against performance targets4
Key effectiveness indicators2015-16 target5
2015-16actual
Percentage of vehicle examinations completed in accordance with the Australian Design Rules (Safe Vehicles) 100% 92.3%
Percentage of driver licences issued that comply with the Graduated Driver Training and Licensing System (Safe Drivers) 100% 98.5%
Percentage of driver’s licence cards issued within 21 days of completed application 99.9% 100%
Service four: Driver and vehicle services
Key efficiency indicators62015-16
target2015-16actual
Average Cost per Vehicle and Driver Transaction $18 $18
Average Cost per Vehicle Inspection Performed by Vehicle Examination Centres $247 $288
Average cost per Vehicle Inspection Delivered through Authorised Inspection Stations $86 $121
Average Cost per Driver Assessment $86 $97
4 The tables are a summary of the 2015-16 DoT Key Performance Indicators (KPI). For more detailed information see the KPIs section of this report.
5 Targets as specified in the 2015-16 Budget Statements.
6 Efficiency KPI values are rounded to the nearest dollar.
Enhanced customer servicesThis year, DoT continued to improve customer service delivery and access for vehicle owners through a new partnership with Kmart Tyre and Auto Service outlets to provide vehicle examinations on behalf of the Department.
This partnership along with other new partners has seen the number of Authorised Inspection Stations (AIS) nearly double in 2015-16 with 30 new stations in the metropolitan area. For customers, the benefits include a reduction in wait times for an inspection, more local options and greater convenience.
The new stations have also allowed DoT to focus on its vehicle operations base at Welshpool and strengthen the essential business areas of vehicle standards and safety, and the AIS training and quality assurance sections.
Department of Transport Annual Report 2015-16 28
Second Contact Centre in CanningtonIn a move to develop a more responsive service, DoT established a second DVS telephone contact centre within one of its newest and largest business centres at Cannington in April 2016.
With more than 6,000 customer calls each day received at the main contact centre base in Innaloo, the satellite new contact centre with 30 staff will enable DoT to meet the growing demands of the telephone contact channel.
The second location has also boosted DVS’ disaster recovery capability in the event of any form of business disruption occurring at its main site in Innaloo. DoT can now quickly minimise customer delays by redirecting calls to the new Cannington location.
This new capability has also given DoT the flexibility to easily and effectively move staff between contact centre and business centre roles in response to customer demand.
Improving services and reducing red tapeDoT has taken further steps to reduce red tape and improve customer services through simplifying its procedures and processes for Western Australian drivers.
Fitness to driveDoT requires some drivers to regularly undertake medical assessments to confirm their fitness to drive including taxi, bus and small charter vehicle drivers, as well as driving instructors and drivers over a certain age. Drivers diagnosed with a reportable medical condition are also required to be assessed periodically.
With some 99.5 per cent of all medical assessments affirming the driver as being fit to drive, it was apparent that undertaking a medical assessment was a burden in terms of time and costs for drivers who generally do maintain their health.
DoT introduced the Fitness to Drive Declaration for eligible drivers, providing them with a much simpler option of completing a declaration in lieu of undergoing a further medical assessment.
The Fitness to Drive Declaration process will not apply to new drivers to WA, occupational drivers (taxi/bus/small charter vehicles) or drivers aged 80 years and older.
In support of the Fitness to Drive Declaration, DoT plans to launch a new system that will enable doctors to submit medical assessments electronically. Presently, assessments are completed manually by medical practitioners and generally mailed to DoT.
These advancements will significantly improve the speed and quality of information exchanged between DoT, medical practitioners and drivers.
Applications for Driving Instructor Licences, Extension F and T EndorsementsApplicants for a driving instructor’s licence, an F extension or T endorsement, are now no longer required to provide a copy of their Traffic Infringement Certificate as part of the application process.
As client’s traffic history is already checked through DoT’s Driver Suitability Services processes, there is no further need for the client to submit a copy at the time of application. However, applicants will still need to provide a current National Police Certificate.
Department of Transport Annual Report 2015-16 29

DoTDirectDuring 2015-16 the Department continued to improve DoTDirect’s range of online driver and vehicle services and functions such as making a simple payment, transferring vehicles, change of addresses and driver and vehicle licence checks.
From January 2016, recreational boat owners are able to complete boat transactions using their DoTDirect online account. Additionally, business owners can renew their vehicles online removing the need to visit DVS business centres.
There are now more than 800,000 DVS transactions and enquiries completed online every month demonstrating the strong levels of customer support for DoTDirect.
iAssessThis year, DoT is trialling a new mobile device application – iAssess, which is designed to reduce red tape and improve the way Practical Driving Assessments (PDA) for Class C (car) driver licences are recorded.
DoT assessors can quickly record details and interactions with driving candidates on a mobile device and for the first time through the iAssess internet based administration console, authorised DoT staff will be able to easily access and view details of a PDA online. Following a PDA, candidates can also be presented with a detailed feedback printout, which will clearly explain the outcome of their driving assessment.
Data centre movesWork began to relocate two major data centre facilities that support all information communication technology systems and associated disaster recovery services for DoT and the Department of Planning.
Systems impacted include:
corporate systems such as internet, email, document and records management, financial and HR systems; and
Transport Services systems including but not limited to:– Transport Executive Licensing Information System (TRELIS) for regulation and
delivery of essential services such as driver licensing and vehicle registration; – Marine Information Systems for regulation of recreational boat registration,
marine safety compliance, operations of boat harbours around the state; – On-demand transport systems for taxi industry regulation; plus – On-line self service systems for the population of WA.
The relocation of the data centres has commenced with contracts awarded for the new sites. With such critical systems, the relocation will be progressed in carefully managed stages to minimise any potential disruption to customer services.
The relocation of the disaster recovery data centre was completed in March 2016. This new data centre has consolidated DoT’s ability to respond to a disaster, which was at risk of being compromised in its previous data centre due to rapidly running out of space, and the data centre’s ageing power and cooling systems.
The data centre relocation and arrangements are in line with the whole of government ICT strategy to move towards a consumption based service model for compute, storage and a unified government communications network for whole of WA government.
Department of Transport Annual Report 2015-16 30

Outcome three:Integrated transport systems that facilitate economic development
Summary of Results against performance targets7
Key effectiveness indicators2015-16 target8
2015-16actual
Percentage of containerised freight transported via rail in relation to total metropolitan container movements to and from Fremantle Port 15% 14.6%
Percentage of regional airports receiving scheduled regular public transport (RPT) air services 96% 83.3%
Service five: Strategic transport policy and integrated planning
Key efficiency indicators92015-16
target2015-16actual
Average Cost per Policy Hour for Strategic Transport Policy Development $93 $96
Average Cost per Planning Hour for Integrated Transport Planning Development $95 $116
7 The tables are a summary of the 2015-16 DoT Key Performance Indicators (KPI). For more detailed information see the KPIs section of this report.
8 Targets as specified in the 2015-16 Budget Statements.
9 Efficiency KPI values are rounded to the nearest dollar.
Transport @ 3.5 Million – the Perth Transport Plan for 3.5 million people and beyondIn collaboration with portfolio partners Main Roads and the PTA, DoT has developed Transport @ 3.5 Million – the Perth Transport Plan for 3.5 million people and beyond.
Transport @ 3.5 Million sets the vision for a generational change to Perth’s transport network. It proposes long-term structural changes that will serve a larger population and workforce by providing better access and more transport choices for the community across Perth and Peel.
The plan aligns with the Western Australian Planning Commission’s (WAPC) Perth and Peel @ 3.5 Million planning frameworks and the Perth and Peel Green Growth Plan for 3.5 Million coordinated through the Department of Premier and Cabinet.
Transport @ 3.5 Million identifies the major transport networks needed to keep people and freight moving as the city grows. These networks include passenger heavy rail, light rail, bus rapid transit, high frequency buses, cycling as well as road and rail freight.
Department of Transport Annual Report 2015-16 31

The Plan also identifies additional river crossings to spread the transport load more effectively and enable more flexibility in cross city travel. It includes measures that can influence travel choices, so that maximum use is made of available infrastructure.
To inform the rapid mass transit component of the Plan, the State Government received independent advice from the Planning and Transport Research Centre of WA which consists of specialist academics from the University of Western Australia, Curtin University and Edith Cowan University.
Transport @ 3.5 Million will be released in July 2016 for a three month consultation period.
Transport Portfolio Congestion Management PolicyThe Transport Portfolio developed the first Congestion Management Policy, which combines congestion management initiatives from across the portfolio into a single integrated policy. The policy sets a strategic direction and highlights key measures to manage Perth’s traffic congestion.
Under the policy, DoT and other key agencies have agreed to work together to achieve a shared vision to improve the liveability and productivity of the Perth and Peel region by minimising the impact of congestion. It also sets the groundwork to measure and improve performance against the following five specific outcomes:
1. Better informed travel choices by individuals.2. More efficient and reliable journeys on main roads. 3. Greater use of public transport. 4. More people cycling and walking. 5. The efficient and reliable movement of freight.
This year, work also commenced on the creation of a Congestion Management Scorecard, which requires the development of performance indicators, measurement methodologies, baselines and targets to regularly report on travel times, congestion cost and performance against the policy outcomes. The Congestion Management Scorecard will provide its first report on policy performance measures in late 2016.
Working with the community to encourage active transportDoT has a number of Travel Change programs known as TravelSmart.
DoT’s TravelSmart Workplaces program continued to assist workplaces in reducing car trips and enabling staff to use active, sustainable transport options. The program supported 36 organisations through advice, facilitation and tools for travel planning.
Five new workplaces were recruited into the program during 2015, which was partially funded by the Department of Health’s Healthy Workers Initiative promoting active travel by employees and workforce health and wellbeing.
The TravelSmart Local Government program continued to support the 16 existing local government participants through training, networking and provision of advice. DoT has provided seed funding to assist eligible local governments to employ TravelSmart Officers and is currently funding a position with the City of Albany.
DoT has also supported school communities through its TravelSmart School program to encourage students to walk, cycle or catch public transport. The program offers tools and resources to school administrators, teachers, parents and students. It includes an online peer network, a reward and recognition scheme and materials for school events and classroom activities. Some 36 schools with more than 18,000 students actively participated
Department of Transport Annual Report 2015-16 32

in the TravelSmart School program during the 2015 school year. A further six new schools, joined the program in the first half of 2016.
Your Move Wanneroo ProgramDoT and the Department of Sport and Recreation worked together to deliver the $2.4 million Your Move Wanneroo program within the City of Wanneroo to over 10,500 households, 10 schools and local businesses.
Launched in April 2015, the Your Move program aims to:
improve traffic flow by shifting car trips to walking, cycling and public transport; maximise use of the Butler and Clarkson train stations and connecting bus
services; and improve physical activity levels and public health outcomes.
Households received personalised information packs and ongoing support through regular phone coaching sessions in which they set active transport and physical activity goals. The program was very popular in the community, reaching the household recruitment target within five weeks.
Your Move Wanneroo continued its success in 2015-16, with direct householder engagement concluding in December 2015. The participant support was significant, with more than nine in 10 of Your Move participants recommending the program to others and 73 per cent saying Your Move had changed their life for the better.
Most importantly in terms of transport benefits, over half of all participants made active transport goals and commitments to change their transport behaviour.
In addition to State Government support, the broader community was highly supportive of the project. The City of Wanneroo contributed over $175,000 in funding towards local infrastructure upgrades, including bike parking, path upgrades and 150 wayfinding signs. Project sponsor RAC funded two new bike repair stations, over 500 wayfinding signs and delivery of bike maintenance and bike skills workshops for City of Wanneroo residents.
While the results of an evaluation on Your Move Wanneroo are expected in late 2016, the community continues to be engaged through social media.
A new Your Move Central travel change project is currently being considered following the conclusion of Your Move Wanneroo. This will focus on the Perth city centre and surrounding suburbs as part of the State Government’s efforts to address traffic congestion.
Perth ParkingDoT manages the Perth Parking Licensing Account (PPLA) and invests the revenue from the Perth Parking Levy into transport initiatives in the Perth Parking Management Area.
In 2015-16, a total of $58.9 million from the PPLA was invested in the following projects and services:
Provision of free public transport within the Free Transit Zone. Providing the free Central Area Transit (CAT) bus system. Purchasing 10 new CAT buses. Constructing the Roe Street and Railway Parade Principal Shared Path extension. Funding the Incident Response Service and Clearway Towing Service. Contributing towards the construction of the Perth Busport.
Department of Transport Annual Report 2015-16 33

The aim of these initiatives is to improve the transport system for those who travel to, from and within central Perth and to fund alternative transport services to reduce the need for cars and manage congestion in the CBD.
Perth Freight Transport Network PlanningWA’s freight transport network plays a major role in creating and maintaining the State’s international competitiveness and prosperity. In 2015-16, DoT continued to address the priorities for the metropolitan freight network outlined in the Perth Freight Transport Network Plan.
These priorities will allow the network to manage future demand and ensure the State’s businesses are able to trade freely and efficiently in the domestic and global marketplaces.
Kwinana Loop Railway The freight rail line serving the Kwinana Industrial Area will potentially have capacity problems within the next two decades, as freight trains only have a single point of access via the Kwinana railway triangle.
One option for improving rail capacity and providing an alternative rail access corridor is the Kwinana Loop Railway. This corridor was originally reserved in the Metropolitan Region Scheme (MRS) in 1963. Most of the land required is zoned as rail reserve and is fully owned by the government.
The connections at each end, however, are no longer reserved.
In November 2015, a MRS minor amendment was advertised by the WAPC to reinstate the full extent of the Kwinana Loop Railway back into the scheme. Local residents have raised concerns over the impact of future rail movement in this corridor in terms of noise, dust and vibration.
DoT has commenced a process to identify and assess a number of alternative railway corridors and compare these with the Kwinana Loop Railway. Modelling and design work will be undertaken on the preferred corridor to establish the land requirements and reservation plans.
DoT will continue to work with its portfolio partners, the freight and logistics industry, local government and the community to identify a preferred corridor.
The work will be completed in early 2017 and a report will be provided to WAPC to underpin a MRS amendment.
Intermodal Terminal PlanningWork undertaken by DoT in the Perth Freight Transport Network Plan identified the need for strategically located intermodal freight terminals (IMT) in Kewdale/Forrestfield, the Latitude 32 Industry Zone and Bullsbrook to cater for interstate and international container movements.
Several major IMTs are already in operation in Kewdale/Forrestfield; therefore work is focussed on the Latitude 32 Industry Zone in the south western metropolitan area and the Bullsbrook IMT in the north eastern metropolitan area.
The Master Plan for the Latitude 32 Industry Zone sets out six development areas, including Area 5 which has been set aside for an IMT and related land uses.
Department of Transport Annual Report 2015-16 34

DoT’s involvement in Latitude 32 is to identify land requirements and prepare a concept plan for a future IMT.
Work undertaken in 2015-16 included reviewing best practice freight village precincts in other jurisdictions such as the Moorebank IMT model in Sydney, and establishing key IMT performance requirements for the Latitude 32 IMT.
DoT aims to finalise land requirements for the Latitude 32 IMT by December 2016 and complete the concept planning early in 2017.
At Bullsbrook, DoT has undertaken investigations into the underlying freight demand and the identification of a site for an IMT.
The preparation of a concept plan to determine the IMT layout and land requirements is in progress and expected to be completed by the end of 2016. The concept plan will be used as the basis to initiate a Metropolitan Region Scheme Amendment in 2017 to reserve the land required for the proposed IMT.
An IMT (Intermodal Terminal) is a facility that allows for the transfer of freight from one transport mode to another, typically this is between road and rail. IMTs effectively facilitate the movement of freight on rail for a large part of the journey and ultimately can reduce the amount of heavy truck traffic on our roads.
Latitude 32 Industry Zone is an industrial area strategically located in the City of Cockburn. It comprises six areas for industrial development.
Transport Planning for Strategic CentresDoT leads transport planning for a number of metropolitan strategic centres to ensure the transport network can meet future access demands. In 2015-16 the focus has been on Stirling City Centre, Bentley/Curtin and Murdoch.
Transport assessments have covered a range of tasks, including testing of land use scenarios impacts, assessment of transport network characteristics, significant transport modelling and development of a public transport strategy. Guidelines have been developed and published to cover transport modelling, car parking, behaviour change and other related activity centre structure planning and development approval transport issues.
Substantial work has also been done with shopping centre owners in Booragoon, Karrinyup, Cannington, Morley and Innaloo to achieve agreement on network performance and investment to support expansion of the centres.
Stirling City Centre The Stirling City Council adopted the draft Stirling City Centre (SCC) Structure Plan in December 2014, which included a transport network to support future planning aspirations. The Transport Portfolio supported the draft SCC Structure Plan, subject to the resolution of a number of transport and traffic issues.
During 2015-16, major modelling was completed to assess eight network options. Each option included a combination of potential measures that could be implemented across the network – ranging from bus priority, reduced traffic signal cycle times and new road links and interchanges.
Department of Transport Annual Report 2015-16 35

The key elements of the preferred network include the construction of Stephenson Boulevard to Cedric Street and an interchange at Mitchell Freeway, changes to other key roads such as Hutton Street and McDonald Street, improvements to the train and bus interchange facilities and bus priority on key roads.
Work is being finalised and the strategic case for the new road links and transport modelling will be completed by the end of 2016.
Bentley/Curtin Activity Centre Curtin University and the Bentley Technology Park form the nucleus of a planned education, science, technology and research strategic centre. The draft structure plan for final development will accommodate over 28,000 employees, 40,000 students/visitors and 7,000 dwellings.
To understand the transport implications for the road and public transport network, DoT carried out a strategic level multi-modal Bentley/Curtin Activity Centre Transport Assessment. It represents the culmination of a 12 month process to support the development of the draft structure plan.
The findings indicate that a direct rail based public transport connection to the Bentley/Curtin Activity Centre, such as light rail, would provide the necessary capacity to support the proposed level of development, as well as promote modal shift. Bus priority on key strategic routes along with parking management will increase access. To improve the efficiency of the local road network, minor upgrades at key intersections are recommended.
Murdoch Activity CentreThe St John of God Hospital, the Fiona Stanley Hospital, Murdoch University and Challenger Institute of Technology are the main facilities for health, education and research in the Murdoch Activity Centre. The Murdoch Activity Centre Structure Plan provides for a build for 35,000 employees and 22,000 residents.
DoT has led a strategic level multi-modal transport assessment to test the adequacy of the existing and planned transport network for Murdoch based on future development targets within the precinct.
This strategic assessment will set the framework for more detailed local area transport assessments, including for the mixed use precinct and Murdoch University’s eastern precinct.
What are activity centres?Activity centres are community central points that include commercial, retail, higher-density housing, entertainment, tourism, higher education and medical services. Activity centres vary in size and diversity and are designed to be well-serviced by public transport.
Western Australian Bicycle Network Plan 2014-2031The Western Australian Bicycle Network Plan 2014-2031 has been the catalyst for significant new funding in cycling infrastructure across the State. In 2015-16, substantial progress was made on a range of Plan initiatives:
Principal Shared PathsCycling networks continued to expand to meet rising demand. The focus remained on building Principal Shared Paths (PSPs) along freeways and railway lines, giving priority to those within a 15 kilometres radius of the Perth CBD including the following projects:
Department of Transport Annual Report 2015-16 36

Fremantle Rail Line PSP – completion of Stage 2 of the Shenton Park Station to Loch Street Station section, which provides a continuous link from the CBD to Grant Street and commencement of planning and design work from Grant Street to North Fremantle Station.
Midland Rail Line PSP – completion of the Railway Road to Guildford Road upgrade and completion of the extension from Guildford Station to East Street; and commencement of the extension from East Street to Morrison Road.
Bike BoulevardsThe bike boulevard, which is a purpose designed low speed local street to provide for safe cycling, is a nation leading concept and will strongly influence the future provision for cycling in WA and other states.
The development of bike boulevard projects has been a key area of focus in 2015-16 with three demonstration projects developed in partnership with the Cities of Bayswater, Vincent and Belmont. These projects were approved for implementation in early 2016 followed by detailed design and construction commencing in late June through to August 2016.
Stage 1 of each project will be constructed within six months. This is a significant achievement delivered through partnerships with local government and input from the community and cycling representative groups.
In 2016-17 the demonstration projects will be completed and the planning and development of new Bike Boulevard projects will begin.
Local Government Grants ProgramDoT administers the Perth Bicycle Network and Regional Bicycle Network grants programs. These grants support local government authorities to build cycling infrastructure and develop bicycle plans.
In 2015-16, 48 projects across 34 local governments totalling 25.9 kilometres of shared path and 1.4 kilometres of on-road infrastructure were completed through $3.5 million in Perth Bicycle Network and Regional Bicycle Network grants.
In the 2016-17 grants programs, 30 local government authorities will share more than $3.5 million over two years.
Connecting Stations ProgramThe Connecting Stations Program aims to encourage cycling for short trips to assist in reducing congestion and parking pressures while benefiting community health. In 2015-16 the first Connecting Stations project began in the City of Joondalup. Stage 1 of a separated bike and pedestrian path was constructed in the Robertson Road reserve to link to the Greenwood Train Station. Stage 2 will take place in 2016-17 and will continue the path to link to Lake Goollelal.
Rail Safety National Law in placeOn 2 November 2015, the Rail Safety National Law (WA) 2015 was enacted in WA and the National Rail Safety Investigator (NRSI) WA commenced operation covering safety investigations of corporate rail operators and those engaged in interstate trade.
The WA branch of the Office of the National Rail Safety Regulator (ONRSR) was opened in Perth taking over the duties of the former Office of Rail Safety and is now responsible for accreditation of rail operators in WA.
Department of Transport Annual Report 2015-16 37

The national rail safety system allows for rail operators to receive national accreditation, removing the need for interstate operators to hold multiple accreditations to different standards.
It has also removed the duplication between states and territories in the monitoring and inspecting of interstate rail transport operators while providing a national pool of resources and specialist knowledge for ONRSR use when making technical decisions and investigating safety incidents.
State Aviation StrategyThe State Aviation Strategy, the first for WA, aims to support the economic and social development of the State through the provision of safe, affordable, efficient and effective aviation services and infrastructure.
The Minister for Transport released the Strategy on 21 February 2015 with 36 actions.
Implementation plans for many of these actions require input by both the DoT and external entities. These entities are continuing to contribute to the implementation of the Strategy and are sometimes in the lead role of making these actions a reality.
Implementation plans were prepared and executed for each of the actions identified as one-off tasks, and as a result, most of these actions were completed or near completion in 2015-16.
The following are this year’s key completed actions:
Improved forecasting for intrastate passenger numbers has been achieved through better cooperation and information sharing between the Bureau of Infrastructure, Transport and Regional Economics, Perth Airport, the Chamber of Minerals and Energy Western Australia (CMEWA) and the DoT.
Aviation infrastructure planning at regional publicly owner airports has continued to improve as local governments develop their airport master plans and airport asset management plans with assistance from the State’s Regional Airports Development Scheme (RADS) program. The plans are being developed to recommended national standards and in accordance with local government financial reporting requirements.
A study to identify possible sites for a second major airport in the Perth region is nearing completion for presentation to Government through the WAPC. While a second airport is not expected to be needed until well after 2050, the study, arising in part from the 2015 State Aviation Strategy, is considered a prudent measure in recognition of the expected increase in population in the Perth Region. The government has made no commitment other than to commission and to receive the report from the study.
The review of regulated air routes was completed in July 2015 and resulted in the need for continuing regulation on certain routes due to low passenger numbers with little likelihood of substantial increases in those numbers, and the need to have certainty of services provided on a commercial basis. A new airline, Regional Express entered the regular public transport (RPT) air services market in the State by servicing the Perth-Albany and Perth-Esperance routes.
Review and tender of regulated Regular Public Transport (RPT) air routesThe final report of the review of regulated RPT air routes was released on 16 July 2015 and outlined the following regulatory approach beyond 27 February 2016:
Department of Transport Annual Report 2015-16 38

Continued regulation for five years on the Perth-Albany, Perth-Esperance, Perth-Monkey Mia-Carnarvon and Perth-Derby routes.
Continued regulation for five years on the Northern Goldfields routes (between Perth and Laverton, Leonora, Meekatharra, Mt Magnet, and Wiluna) with the possibility of establishing new route configurations. Leinster will no longer operate as an RPT airport.
Reduced regulation for the Perth-Exmouth route allowing other airlines to enter the market.
A competitive tender process for the regulated RPT routes was then undertaken. Two requests for proposal were advertised on 29 July 2015, for air services between Perth and the regional towns of Albany, Esperance, Carnarvon and Monkey Mia (Shark Bay), Derby, and Northern Goldfields, including the towns of Laverton, Leonora, Meekatharra, Mount Magnet and Wiluna.
The outcomes of the tender process provided for:
Regional Express to sign a deed of agreement with the State Government to provide RPT air services on the Albany and Esperance routes for the next five years, commencing on 28 February 2016.
Skippers Aviation to sign a deed of agreement with the State Government to continue to service the Perth-Carnarvon-Monkey Mia and Perth-Northern Goldfields air routes, which include the towns of Laverton, Leonora, Meekatharra, Mount Magnet and Wiluna until 27 June 2017.
No compliant tenders were received on the Perth-Derby air route.
Currently, no airline is in a position to provide commercially viable RPT air services to and from Derby. DoT will continue to liaise with the aviation industry to explore the potential for an airline to provide commercially viable air services on the Perth-Derby route in the future.
Regional Airports Development Scheme (RADS)In 2015-16, DoT continued to administer the RADS. The scheme is designed to improve WA air services and safety by providing financial assistance for infrastructure to eligible owners or leaseholders of regional airports that can be accessed by the public.
A total of 11 RADS projects with a combined project value of $5.5 million were completed in 2015-16. A total of approximately $1.8 million RADS funding was spent (comprising of $1.6 million in Royalties for Regions funding and $0.2 million DoT funding). Projects funded included the development of runways, improving airport terminals, facilities and grounds and the completion of planning studies. A major project completed in the 2015-16 financial year was the reseal of the East Kimberley Regional Airport (Kununurra) runway at a total project cost of $5.1 million, which included $2.5 million in Royalties for Regions/RADS funding. The project took three years to complete.
Financial relief for Mid-West and Pilbara Port customersMarine ports are integral in fuelling our State’s economy as they are critical gateways for commodities and an essential link in the transport logistics chain.
In May 2016, the State Government announced that the Mid-West Port Authority’s (MWPA) remaining debt from the $67 million Geraldton Port Enhancement Project (PEP) will be repaid in full. In addition from 1 July 2016, MWPA port users will no longer pay the $2.56 per tonne PEP charge that services this debt.
Department of Transport Annual Report 2015-16 39

DoT worked closely with MWPA, the Department of State Development and the Department of Treasury in the development and ongoing implementation of the initiative to remove the PEP charge. Removing the charge is based on the principles of fairness and equity and reflects the direct and indirect financial benefits to the State Government and the economy.
The resulting restructure of the MWPA fees and charges ensures that no port user is worse off than they would have been if the PEP charge had continued into 2016-17. The restructure will ensure that the port adequately recovers its costs and provides a reasonable return on its assets.
In the Pilbara, the Government supported pricing relief at Port Hedland’s Utah Point Bulk Handling Facility, which is a single berth, multi-user, bulk handling facility at which junior miners export iron ore. The pricing relief has avoided substantial job losses at these junior iron ore mining companies and will continue in 2016-17.
Port DivestmentsPreparation for the proposed divestment of Fremantle Port and Port Hedland’s Utah Point Bulk Handling Facility continued with the introduction of two Bills in Parliament to enable the port divestments during 2015-16.
DoT has worked in close consultation with key stakeholders including the Department of Treasury, Fremantle Port Authority and Pilbara Ports Authority, and the State Government’s external advisors to ensure good policy outcomes are maintained as part of the divestments.
Preparing for Port Amalgamations legislationDoT is in the final stages of completing the draft Ports Legislation Amendment Bill, which will bring all WA trading ports under a consistent regulatory regime for the first time in more than 100 years.
Nine ports, comprising 11 port facilities, will be transferred from the Shipping and Pilotage Act 1967 to the Port Authorities Act 1999 into the Ports Legislation Amendment Bill. The ports are:
Wyndham Yampi Sound Derby Port Walcott Port of Cape Preston Varanus Island Barrow Island Onslow; and Carnarvon.
The Bill is a key part of the second phase of reforms arising from the Western Australian Ports Governance Review. The reforms will improve and deliver better governance of WA’s ports and ensure the risks associated with the operations of ports and shipping is managed more effectively.
Department of Transport Annual Report 2015-16 40

Actual Results Versus Budget TargetsThe following table provides a comparison of the financial targets and outcomes against criteria included in the Resource Agreement between the Chief Executive Officer, the Minister for Transport and the Treasurer.
2015-16 Actual results versus budget targets2015-16 Target$ 000
2015-16 Actual $ 000
Variation $ 000 Note
Total cost of services 377,194 381,010 3,816 1
Net cost of services 40,230 47,953 7,723 2
Total equity 707,350 709,581 2,232 3
Net increase/(decrease) in cash (4,671) (15,047) 10,376 4
Approved full time equivalent (FTE) 1,372 1,369 3 5
NotesThese notes should be read in conjunction with the Explanatory Statement to the Financial Statements.
Note 1: Total cost of servicesThe total cost of services exceeded estimates primarily due to higher than anticipated depreciation and amortisation expenses and higher than anticipated freight and mail expenses due to increased Australia Post charges.
Note 2: Net cost of servicesIn addition to the higher expenditure on depreciation, amortisation, freight and mail, lower than anticipated revenue primarily from Driver and Vehicle Services fees and charges contributed to the higher net cost of service.
Note 3: Total equityTotal equity exceeded estimates primarily due to the impact of the higher than anticipated favourable result for 2014 15 credited towards the 2015-16 accumulated surplus component of equity.
Note 4: Net increase/(decrease) in cash heldThe higher than estimated net decrease in cash held is due to the higher than anticipated actual cash held at the beginning of 2015-16.
Note 5: Approved FTEThe actual paid FTE closely reflects the budget, with the small variance primarily due to the recruitment freeze.
Department of Transport Annual Report 2015-16 41

Significant issues impacting the agencySocialShifting consumer expectations and increasing demand for choice and easy access to services driven largely by the emergence of new technology has led to a number of important DoT initiatives in 2015-16.
WA’s on-demand industry faced the full impact of these changes leading to the announcement of reforms in December 2015. Work began on Stage 1 to develop a package of interim initiatives that will reduce the regulatory burden, provide a degree of relief to existing players and greater incentive for new players to participate lawfully in the industry. These will be achieved through minor regulatory amendments, changes to licence conditions, and amendment to the Taxi Act 1994. To improve customer accessibility to information and services, DoT’s Driver and Vehicle Services (DVS) expanded the range of available online licensing transactions to include access for organisations and inclusion of recreational boat details. Plans have also commenced to introduce Practical Driving Assessments (PDA) on mobile tablets in July 2016, which will improve the PDA process and allow DVS to gain better insights into test results.
Work is continuing on developing more effective DVS contact centre solutions to support the growing number of customers seeking to use this channel of contact. With leases expiring in 2016-17 for both Willagee and Midland DVS sites, planning is under way to assess alternative sites that reflect changes in population growth in order to continue to improve the access to DVS services.
Traffic congestion continues to have an impact on travel times and with its wider influence on community health and the environment, DoT will maintain its focus on a transport system that supports active choices. There have been significant increases in cycling numbers well above the rate of population growth, with a 32 per cent increase in cyclists on the PSP network near the CBD from 2011 to 2015. Construction work is currently under way on the Midland Rail Line PSP from East Street to Morrison Road and designs are progressing for additional PSP projects in the freeway and railway reserves within a 15 kilometre radius of the CBD. The State Government continues to invest in cycling infrastructure with a further $8.6 million allocated to DoT in 2016-17.
A further $3 million from the Safe Active Streets program was made available in 2015 16 to fund Bike Boulevard projects in the Cities of Vincent, Belmont and Bayswater. This program will continue over 2016-17 and 2017-18.
EconomicAn assessment by the Bureau of Infrastructure, Transport and Regional Economics has calculated that the cost of congestion could be $5 billion for Greater Perth by 2031 as the population grows.
In collaboration with the PTA and Main Roads, DoT developed the Transport @ 3.5
Department of Transport Annual Report 2015-16 42

Million – Perth Transport Plan for 3.5 million people and beyond. The plan proposes long-term structural changes in Perth’s transport network, with options for demand management, cycling, mass transit, roads and river crossings. It will establish a blueprint for the development, investment and operation of the transport network across all modes to support the development of the metropolitan area.
Demand for coastal infrastructure continues to grow with the ongoing need for new or improved facilities in both metropolitan and regional locations. Construction of the $18.3 million Royalties for Regions funded harbour upgrade at Exmouth is on track with design complete and works currently under way.
The replacement of Jetty 2 at Fremantle Fishing Boat Harbour, which was completed in early 2016 and the replacement of the electrical distribution network in Carnarvon Boat Harbour to be carried out from November 2016 will enhance business opportunities associated with the fishing and resources sectors and support the development of marine tourism and recreational activities in these communities.
The planned divestment of two port assets, Fremantle Port and the Utah Point Bulk Handling Facility at Port Hedland is being managed through long term leases as part of the Government’s structured program of asset sales. The Fremantle Port divestment will consider the future development of container and general cargo facilities in the Outer Harbour, Cockburn Sound, and the efficiency of transport linkages to the port.
Department of Transport Annual Report 2015-16 43
Disclosures and legal complianceCertification of key performance indicatorsFor the year ended 30 June 2016I hereby certify that the key performance indicators are based on proper records, are relevant and appropriate for assisting users to assess Department of Transport’s performance, and fairly represent the performance of the Department of Transport for the financial year ended 30 June 2016.
Nina LyhneAccountable Authority7 September 2016
Key performance indicatorsFor the year ended 30 June 2016The transport function is integral to business and commerce and is important for social interaction and connecting communities. DoT’s focus is on strategic transport policy and planning, regulation, and the delivery of safe and sustainable transport services and programs. This includes the licensing of drivers, vehicles and vessels, developing and planning infrastructure, and setting and ensuring service and safety standards across the range of public and commercial transport systems in WA.
Together with its portfolio partners, DoT connects people with goods and services through an intricate system of roads, railways, airports, ports and waterways, and keeps people safe within those networks through an integrated approach to planning, licensing, education and compliance strategies.
DoT made changes to its Outcome Based Management (OBM) framework for 2015-16 that included increasing the number of services from three to five and changes to key effectiveness and efficiency performance indicators. These changes provide a more detailed view of services, and align and enhance performance information to further increase stakeholders’ understanding of DoT operations.
Department of Transport Annual Report 2015-16 44

DoT’s functions and services contribute to two of the State Government’s strategic goals outlined below.
Government Strategic Goals DoT Outcomes DoT Services
Results Based Service DeliveryGreater focus on achieving results in key service delivery areas for the benefit of all Western Australians.
1. An accessible and safe transport system
1. Coastal Infrastructure1
2. Marine Safety2
3. On-demand Transport3
Results Based Service DeliveryGreater focus on achieving results in key service delivery areas for the benefit of all Western Australians.
2. Vehicles and road users that meet established vehicle standards and driver competencies to deliver safe vehicles and safe drivers
4. Driver and Vehicle Services
State Building – Major ProjectsBuilding strategic infrastructure that will create jobs and underpin Western Australia’s long-term economic development.
3. Integrated transport systems that facilitate economic development
5. Strategic Transport Policy and Integrated Planning.
1 New Service for 2015-16.
2 New Service for 2015-16.
3 New Service for 2015-16.
Effectiveness key performance indicatorsOutcome one: An accessible and safe transport systemUnder the Transport Co-ordination Act 1966 (the Act), DoT is responsible for coordinating and planning the accessibility and safety considerations for the transport system.
There are varying degrees of accessibility and safety across the agency for the different modes of transport. For example, the Marine Safety Business Unit provides regulation, education, training and compliance monitoring in regards to safety of marine vessels, whereas accessibility to marine related infrastructure and waterways is the responsibility of the Coastal Infrastructure Business Unit.
Accessibility to taxis is the responsibility of On-demand Transport whereby it is responsible for ensuring an adequate taxi service is being provided to the public of Western Australia.
Safety in taxis in regards to vehicles and drivers is the responsibility of Driver and Vehicle Services in its role administering road laws as defined in the Road Traffic (Administration) Act 2008 and is covered under Outcome 2 of DoT’s Outcome structure: “Vehicles and road users that meet established vehicle standards and driver competencies to deliver safe vehicles and safe drivers”. Safety for taxi operators and
Department of Transport Annual Report 2015-16 45

passengers not related to use on the road is the responsibility of the Western Australia Police in its community safety role.
The effectiveness indicators below measure transport system accessibility and safety:
Accessibility Compliance with mandatory taxi operating hours Percentage by which the waiting time standard, for Metropolitan Area taxis is met Percentage of time maritime infrastructure is fit for purpose when required.
Safety Rate of Reported Incidents (Accidents) on the Water per 100 Commercial
Vessels Surveyed Rate of Reported Incidents (Accidents) on the Water per 10,000 Registered
Recreational Vessels.
Effectiveness key performance indicatorsCompliance with mandatory taxi operating hours4
DoT is responsible for regulating the Perth Metropolitan Taxi Industry through the administration of the Taxi Act 1994.Following the 1999 National Competition Policy Review of the Perth Metropolitan Taxi Industry, the then Department for Planning and Infrastructure (DPI) introduced performance standards for the industry on 1 July 2000. The taxi industry is required to meet these performance standards.
As of the 2013-14 financial year, taxi industry data provided by Taxi Dispatch Services (TDS) is analysed internally within the Department. DoT reports on taxi demand and industry viability trends as well as the performance of the taxi industry against the industry standards on a monthly and quarterly basis.
This assessment gives DoT the ability to provide the Minister with evidence-based policy recommendations and therefore directly assists the regulatory function of the Department.
Compliance with mandatory operating hours is a new Key Performance Indicator (KPI), effective as of the 2015-16 financial year. Taxi compliance is measured by determining whether a vehicle has been ‘logged on’ and completed one job per hour for each of its mandatory operating hours except one.
The industry performance is assessed by obtaining and analysing data from the two major TDS providers in the metropolitan area. Log-on data is used to determine whether a vehicle has been logged in, and job data is used to determine whether a vehicle has performed one job per hour for all hours except one.
4 This is a new Key Performance Indicator for 2015-16. Data has been re-cast to 2013-14.
Department of Transport Annual Report 2015-16 46

Compliance with mandatory taxi operating hours.
YearPercentag
e2013-13 actual 0%2013-14 actual 79.8%2014-15 actual 78.5%2015-16 target 80%2015-16 actual 56.5%
Reasons for significant varianceThe reduction in compliance with mandatory operating hours is thought to be due to a decline in taxi demand caused by: a softening of the economy; and a shift away from use of taxis and towards other forms of on-demand transport.
Percentage by which the waiting time standard, for Metropolitan Area Taxis is metUnder the Taxi Act 1994, DoT is responsible for regulation of the Perth Metropolitan Taxi Industry.
As stated previously in Compliance with mandatory taxi operating hours, industry performance standards have been in place since 1 July 2000.
Taxi performance is measured by determining the average time a customer has to wait for a taxi following a booking during both peak and off-peak times, and comparing the result against the relevant performance standards. To calculate this measure the wait times for taxis requested as soon as possible (ASAP) have been measured during both peak and off-peak times and bookings that meet the performance standard are determined and presented as a percentage against all ASAP bookings.
Trends from this indicator assists with determining supply versus demand requirements for the industry and provides rationale for determining whether there is a requirement to release additional taxi plates.
Industry performance is assessed by obtaining and analysing data from the two major TDS providers in the metropolitan area. Waiting time information is available from the TDS systems and measured as the difference between when the customer first requested the taxi and when the driver arrived at the pick up location to start the job.
Percentage by which the waiting time standard, for Metropolitan Area Taxis is met
YearPercentag
e2013-13 actual 91.7%2013-14 actual 92.3%
Department of Transport Annual Report 2015-16 47

2014-15 actual 92%2015-16 target 91%2015-16 actual 95.7%
Reasons for significant varianceNo significant variance noted this year between target and actual.
Percentage of time maritime infrastructure is fit for purpose when requiredDoT is responsible for the planning, creation, enhancement and management of new and existing land and water-based maritime facilities for small craft in Western Australia.
DoT manages and maintains a variety of maritime infrastructure assets at approximately 50 discrete locations throughout the State, including jetties, wharves, boat launching facilities, pens and moorings, to service the fishing and commercial maritime industries and recreational boating needs.
In addition, DoT maintains associated navigational aids, which are strategically placed in water and onshore to ensure the boating community can safely transit through waterways. The department also maintains the navigable waters at its managed maritime facilities as well as at a small number of other locations, including two commercial ports by providing access via dredged channels.
The facilities and their purpose vary for each location and the associated management and maintenance plans vary accordingly.
A consistently high percentage of availability will confirm that the maritime infrastructure is appropriately maintained and accessible to the boating industries and the public of Western Australia.
Percentage of time maritime infrastructure is fit for purpose when required
YearPercentag
e2013-13 actual 99.5%2013-14 actual 99.1%2014-15 actual 99.4%2015-16 target 99.3%2015-16 actual 99.1%
Reasons for significant varianceNo significant variance noted this year between target and actual.
Rate of reported incidents (accidents) on the water per 100 commercial vessels surveyed
Department of Transport Annual Report 2015-16 48

The Commercial Vessel Safety Branch (CVS) is a delegate to the National System for Domestic Commercial Vessel Safety under the auspice of the Marine Safety (Domestic Commercial Vessel) National Law 2012. The National Regulator and CVS ensures all commercial vessels in WA are subject to survey to certify they meet minimum standards for construction and equipment safety before they are allowed to operate.
A commercial vessel must hold a current certificate to show that it meets national and international construction standards to continue to operate.
All accidents or incidents that result in serious injury or death, or cause damage to the vessel rendering it unseaworthy or unsafe must be reported. An incident (accident) is defined as any commercial vessel, which is involved in a collision that sustains:
a) casualty;b) damage affecting her seaworthiness or efficiency, either in hull or in any part of the
boilers and machinery; andc) causes the loss or damage to any other vessel, or where by reason of a casualty
happening to, or on board a commercial vessel, loss of life or serious injury to any person ensues.
It is a requirement under the National Law for people to report any accident or incident involving a domestic commercial vessel.
Rate of reported incidents (accidents) on the water per 100 commercial vessels surveyed.
Year Rate2013-13 actual 4.82013-14 actual 6.52014-15 actual 5.42015-16 target 5.72015-16 actual 3.4
Reasons for significant varianceDecrease in incidents is partly due to the broadening definition of what constitutes an incident under National Law. Furthermore incidents can now be reported directly to the Australian Maritime Safety Authority (AMSA) or any local Marine Safety Authority.
Rate of reported incidents (accidents) on the water per 10,000 registered recreational vessels.
DoT takes a lead role in Western Australia to ensure the safety of the State’s mariners through:
setting standards for recreational vessels and registering only those that meet legislative requirements;
requiring recreational mariners to meet basic safety competencies through the recreational skipper’s tickets (compulsory from 1 April, 2008);
Department of Transport Annual Report 2015-16 49

maintaining marine charts and signs to promote safe navigation and warn of hazards;
responding to oil spills and other pollutants; maintaining navigational aids (navaids); and educating and informing mariners on marine safety matters.
Under the Navigable Waters Regulations 1958, all vessels that have a motor or have the capacity to have a motor fitted, must be registered to operate on navigable waters in WA. In addition, it is a requirement under the WA Marine Act 1982 for people to report any accident or incident that results in serious injury or death, or the vessel being damaged enough to make it unseaworthy or unsafe.
The data for this indicator is taken from the Department’s recreational vessel registration database and the marine incidents database. It is calculated by dividing the number of incidents by the number of registered recreational vessels (expressed as a rate per ten thousand vessels).
A reduction in the rate of incidents per registered recreational vessel indicates that the safety outcome is being met in relation to recreational boating.
Rate of reported incidents (accidents) on the water per 10,000 registered recreational vessels.
Year Rate2013-13 actual 9.52013-14 actual 10.62014-15 actual 112015-16 target 9.72015-16 actual 11.5
Reasons for significant varianceThe slowdown in the economy has had minimal impact on the number of recreational vessels being registered. The increase in the number of incidents reported is largely due to mandatory reporting requirements of the marine insurance industry to only accept claims made by clients under the proviso that the incident has been reported to DoT.
Outcome 2: Vehicles and road users that meet established vehicle standards and driver competencies to deliver safe vehicles and safe drivers
DoT’s Driver and Vehicle Services (DVS) is responsible for licensing the State’s drivers and registering vehicles under the Road Traffic Act 1974 (until 26 April 2015) and thereafter the Road Traffic (Authorisation to Drive) Act 2008, Road Traffic (Vehicles) Act 2012 and Road Traffic (Administration) Act 2008. Drivers must demonstrate that they are competent to drive a vehicle through complying with the requirements of Section 16 of the Road Traffic (Authorisation To Drive) Regulations 2014. Vehicles must be registered before they may lawfully be used on the road. The Road Traffic (Vehicles Regulations 2014) details the specific requirements for examination against the
Department of Transport Annual Report 2015-16 50

Australian Design Rules, which allow a vehicle to be deemed roadworthy.
DoT measures its effectiveness in meeting this outcome through measuring the percentage of:
vehicle examinations completed in accordance with the Australian Design Rules (Safe Vehicles);
driver licences issued that comply with the Graduated Driver Training and Licensing System (Safe Drivers); and
driver licence cards issued within 21 days of completed application.
Percentage of vehicle examinations completed in accordance with the Australian Design Rules (Safe Vehicles).Under the Road Traffic Act 1974 DoT is responsible for licensing the State’s vehicles, which must be licensed before they may lawfully be used on the road. A vehicle is registered only when it is deemed roadworthy (passed examination).
This indicator measures the extent to which vehicle examinations are conducted according to processes designed to establish levels of roadworthiness pursuant to the provisions of the Road Traffic Act 1974 and related regulations.
The Road Traffic (Vehicle Standards) Rules 2002 detail specific requirements for vehicles, including dimensions, braking, lighting and emissions – all of which must conform to the Australian Design Rules, as at the date of manufacture of the vehicle. DoT’s Vehicle Examiners and Authorised Inspection Station personnel are registered motor vehicle mechanics and trained to examine vehicles in accordance with the Australian Design Rules.
The Motor Vehicle “Certificate of Inspection” form is used to record details of the vehicle examination.
Percentage of vehicle examinations completed in accordance with the Australian Design Rules (Safe Vehicles).
YearPercentag
e2013-13 actual 87.8%2013-14 actual 85%2014-15 actual 90%2015-16 target 100%2015-16 actual 92.3%
Reasons for significant varianceAssessing compliance for this indicator is dependent upon verification of original source documents for completed vehicle examinations. The delays in returning the certificate of inspection forms from AIS providers to DoT are the cause of the variance in this KPI. DVS is working closely with AIS partners to minimise delays.
Percentage of driver licences issued that comply with the Graduated Driver Training and Licensing System (Safe Drivers).The Road Traffic Act 1974 places on Transport the responsibility for licensing the State’s
Department of Transport Annual Report 2015-16 51

drivers. Section 16 of the Road Traffic (Authorisation to Drive) Regulations 2008 details the requirements prescribed under section 42 of the Act. Drivers must demonstrate that they are competent to drive a vehicle through passing theoretical and practical tests, completing the prescribed hours of supervised driving and passing a computerised hazard perception test.
This indicator measures the extent to which licensing of drivers is conducted according to processes designed to establish levels of competence pursuant to the provisions of the Road Traffic Act 1974 and related regulations.
Percentage of driver licences issued that comply with the Graduated Driver Training and Licensing System (Safe Drivers).
YearPercentag
e2013-13 actual 87.5%2013-14 actual 87%2014-15 actual 96%2015-16 target 100%2015-16 actual 98.5%
Reasons for significant varianceNo significant variance noted this year between target and actual.
Percentage of driver’s licence cards issued within 21 days of completed applicationDoT is responsible for issuing driver licence cards to applicants who complete all aspects of the due process.
This measure of timeliness divides the total number of licence cards issued within the timeframe (21 days) by the total number of licence cards issued and multiply it by 100 to determine the percentage.
The specified timeframe is based on a historical benchmark and reduced timeframes are built into the contractor’s service level agreement to ensure the above timeframes are met.
Percentage of driver’s licence cards issued within 21 days of completed application.
YearPercentag
e2013-13 actual 99.9%2013-14 actual 100%2014-15 actual 100%2015-16 target 99.9%2015-16 actual 100%
Department of Transport Annual Report 2015-16 52
Reasons for significant varianceNo significant variance noted this year between target and actual.
Outcome 3: Integrated transport systems that facilitate economic developmentThrough its Policy, Planning and Investment Division, DoT develops, integrates and regulates transport systems and infrastructure which is integral to servicing the State’s business and social communities.
DoT determines the location of major transport routes and infrastructure, their suitability for a range of transport services and how each integrates into the broader transport system for boats, trains, planes and vehicles.
Providing regular public transport air services is the responsibility of the Transport Strategy and Reform Directorate, which ensures an adequate air service is provided to support economic activity in key regional communities throughout the State. DoT ensures all aircraft that carry passengers for regular public transport or charter purposes within Western Australia are licensed annually.
DoT measures its effectiveness in meeting this outcome through measuring the percentage of:
containerised freight transported via rail in relation to total metropolitan container movements to and from Fremantle port; and
regional airports receiving scheduled regular public transport (RPT) air services.
Percentage of containerised freight transported via rail in relation to total metropolitan container movements to and from Fremantle PortTransporting containers by rail to and from the Fremantle Inner Harbour minimises truck movements on port roads, thereby reducing road congestion, noise, accidents and emissions.
To encourage short haul rail transport to the Fremantle Inner Harbour, the State Government has subsidised containers transported by rail since 2007. The subsidy is currently in place until 30 June 2017.
DoT pays the subsidy to Intermodal Link Services (ILS), the operator of the North Quay Rail Terminal (NQRT) service. ILS then passes it on to the client through reduced rail transport price, which contributes to making the rail freight service more cost competitive with road freight services.
The total annual subsidy amount and the rate per Twenty Foot Equivalent Unit (TEU) container gradually reduce over time. The intention is for funding assistance to reduce over time as rail volumes grow and rail establishes itself in the market.
The effectiveness and performance of the subsidy is measured by giving consideration to containers transported specifically by rail and the total container throughput for Fremantle Inner Harbour. It is calculated by sourcing data on rail container numbers (measured in TEU), processed at the NQRT, which is compared to Fremantle Port Authority’s total container trade figures. This comparison enables calculation of rail’s market share.
Although rail volumes experienced strong growth following the introduction of the subsidy in 2007, the global financial downturn resulted in a contraction of the number of containers moved by rail to 10.9 per cent in 2009-10. Growth in the number of rail
Department of Transport Annual Report 2015-16 53

containers has since recovered, averaging 14.2 per cent in 2013-14.
There are short to medium term fluctuations with respect to the number of rail containers due to general economic conditions and commercial decisions. However, total container trade through the port, including rail volumes, are expected to continue to grow over the long term. The State Government has a long term aspirational target of transporting 30 per cent of the total number of containers through Fremantle Inner Harbour by rail.
Percentage of containerised freight transported via rail in relation to total metropolitan container movements to and from Fremantle Port.
YearPercentag
e2013-13 actual 13.8%2013-14 actual 13.6%2014-15 actual 13.2%2015-16 target 15%2015-16 actual 14.6%
Reasons for significant varianceNo significant variance noted this year between target and actual.
Percentage of regional airports receiving scheduled regular public transport (RPT) air servicesDoT provides advice on a range of aviation issues: it provides grants to support the development of airport infrastructure through the Regional Airports Development Scheme and regulates intrastate air services to ensure that key WA regional communities receive sustainable, regular public transport (RPT) air services.
Under the Transport Co-ordination Act 1966, all aircraft that carry passengers for RPT or charter purposes within WA are required to be licensed annually. In addition, the Minister for Transport has powers to apply conditions to aircraft licences to determine where they may fly in WA.
The State Government is committed to providing sustainable regular public transport (RPT) air services to regional communities in Western Australia. Regional air routes with insufficient passenger volumes to sustain competition need to be protected to ensure that regional and remote communities have reasonable access to air services. The Review of the Regulated RPT Air Routes identified several air routes in WA with insufficient passenger volumes to sustain competition, as a result these air routes are regulated by the State Government.
The objective is that communities in WA with populations of more than 500 are within 250 kilometres of an airport accessible by a safe road which provides two or more weekly RPT air services or have access to other forms of public transport.
To ensure that charter operations do not undermine the RPT service, charter operators are limited by a condition on their aircraft licence to providing one return flight per client per week to an RPT airport in WA.
The Minister’s or DoT’s approval is required to provide additional charter services over
Department of Transport Annual Report 2015-16 54

RPT air routes.
The licensing arrangements and deeds for the protected and subsidised services are monitored through monthly statistics and regular meetings with the airlines to ensure regional centres have a sustainable RPT service.
A reduction in the percentage of key regional centres being serviced by RPT air services or other forms of public transport would indicate that services to remote communities are not being maintained.
Percentage of regional airports receiving scheduled regular public transport (RPT) air services.
YearPercentag
e2013-13 actual 96%2013-14 actual 96%2014-15 actual 96%2015-16 target 96%2015-16 actual 83.3%
Reasons for significant varianceA total of four airports (Busselton, Derby, Kambalda and Ravensthorpe) received less than two weekly RPT air services during 2015-16. Hence, the actual percentage of regional airports receiving scheduled regular public transport (RPT) air services in 2015-16 was 83.3 per cent (20/24). It should be noted that the Perth-Ravensthorpe, Perth-Busselton, Perth-Kambalda air routes are not regulated and any airline may make a commercial decision to enter or exit the market at any time. Perth-Derby was a regulated route but following the tender of RPT Air Routes in 2015, no airline was able to provide commercially viable services between Perth-Derby.RPT air services between:
Perth-Busselton ceased on 22 April 2015;Perth-Kambalda ceased on 27 August 2015; Perth-Ravensthorpe ceased on 27 February 2016; andPerth-Derby ceased on 27 February 2016.
It should be noted that these four airports are within 250 kilometres by sealed road of other RPT airports, specifically:
Perth to Busselton – 222 kilometresDerby to Broome – 222 kilometresKambalda to Kalgoorlie – 59 kilometresRavensthorpe to Esperance – 187 kilometres
DoT is continuing to liaise with the aviation industry to explore the potential for an airline to provide commercially sustainable air services on the Perth-Derby route. In the meantime, travellers to and from Derby can access RPT air services via Broome.
Efficiency key performance indicatorsDepartment of Transport Annual Report 2015-16 55

Service 1: Coastal InfrastructureThis service contributes towards the Department’s outcome of an accessible and safe transport system through the provision of a range of coastal infrastructure services, including:
plans, builds and manages new and existing land and water-based maritime facilities;
coastal engineering advice and solutions for new and existing land and water-based maritime facilities; and
oceanographic, hydrographic, cartographic and geographic information.
The key efficiency performance indicator used to measure this performance is detailed below:
Average Cost per Day per Maritime Infrastructure Asset Managed
Year Cost2013-13 actual $792013-14 actual $762014-15 actual $752015-16 target $732015-16 actual $79
Reasons for significant varianceThe total cost to manage maritime infrastructure assets exceeded the budget by $4 million. Amended mapping between the 2015-16 budget estimate calculations and 2015-16 actuals has resulted in the reallocation of approximately $2.5 million in costs from Policy and Planning to this KPI.Additionally, there was an overspend on repairs and maintenance across facilities – $1million; and an unbudgeted cost for fuel – $638,783, offset by revenue from fuel sales, from DoT assuming managerial control of the Two Rocks maritime facility.
Service 2: Marine SafetyThis service contributes towards the safe and sustainable use of navigable waters through the provision of a range of marine safety regulatory and education services, including:
regulation and administration of marine industry service and safety standards, including on water compliance patrols;
licensing of recreational vessels, marine safety education, navigational services and aids in accordance with relevant legislation; and
marine protection through provision of a pollution response team.
The key efficiency performance indicators used to measure this performance are detailed below:
Average Survey Cost per Commercial Vessel
Year Cost2013-13 actual $2,691
Department of Transport Annual Report 2015-16 56

2013-14 actual $3,5142014-15 actual $3,3842015-16 target $3,5512015-16 actual $2,513
Reasons for significant varianceThe increase in actual volumes is due to a considerable surge of 15.23 per cent in the domestic tourism industry resulting from the decline of the Australian dollar. Statistics show an increase in the registration of new vessels, which could also have resulted from the National Regulators’ effective communications aimed at increasing awareness of vessel owners to ensure they comply with survey requirements.There is a corresponding decrease in total costs due to the transition of surveys to the National System Australian Maritime Safety Authority.
Average Cost per Private Recreational Vessel Registration
Year Cost2013-13 actual $1062013-14 actual $982014-15 actual $1032015-16 target $1072015-16 actual $107
Reasons for significant varianceNo significant variance noted this year between target and actual.
Cost
Cost to Maintain Marine Pollution Response Preparedness per Registered Vessel
Year Cost2013-13 actual $202013-14 actual $192014-15 actual $182015-16 target $222015-16 actual $23
Reasons for significant varianceThe minor variance is due to an increase in costs associated with an enhancement of DoT’s ability to fulfil our Hazard Management Agency obligations in respect to Maritime Environment Emergency Response, with a corresponding decrease in recreational vessel numbers.
Service 3: On-demand TransportThis service contributes towards the provision of safe, accessible and sustainable personal on-demand transport services and systems through the provision of services for:
setting and monitoring standards for on-demand transport vehicles;
Department of Transport Annual Report 2015-16 57

testing and registration of new taxi drivers entering the industry; administering subsidies for taxi users, student and pensioner travel schemes; and investigating complaints from on-demand transport patrons, operators and drivers.
The key efficiency performance indicator used to measure this performance is detailed below:
Cost of Regulation per Taxi Plate Administered
Year Cost2013-13 actual $3,0982013-14 actual $3,3032014-15 actual $3,4792015-16 target $3,7562015-16 actual $4,046
Regulation per Taxi Plate Administered
Reasons for significant varianceTaxi plate release continued its slowed response to softening in demand for taxi services.The number of plates regulated has not increased at the rate initially anticipated, resulting in an increased cost of regulation per taxi plate administered.
Service 4: Driver and Vehicle ServicesThis service contributes towards the provision of safe, accessible, sustainable and efficient transport services and systems through the provision of driver licensing and vehicle registration services for:
setting motor vehicle standards in accordance with national and State Government requirements, examining motor vehicles for compliance with those standards and registering and transferring compliant motor vehicles;
setting standards and requirements for the issue of a driver’s licence, in accordance with State Government legislation and national identity and security and privacy policies;
assessing driver competency, issuing and renewing driver licences in accordance with national and State Government requirements and driver competency standards;
securing and maintaining a database of registered vehicles and drivers, and managing vehicle identification numbers, to support the enforcement of road traffic and other relevant laws;
collecting revenue on behalf of government; and informing and educating road users about driver licensing, vehicle registration and
related requirements.
The key efficiency performance indicators used to measure this performance are detailed below:
Average Cost per Vehicle and Driver Transaction
Average Cost per Vehicle and Driver Transaction
Year Cost2013-13 actual $182013-14 actual $17
Department of Transport Annual Report 2015-16 58

2014-15 actual $172015-16 target $182015-16 actual $18
Reasons for significant varianceNo significant variance noted this year between target and actual.
Average Cost per Vehicle Inspection Performed by Vehicle Examination Centres1
Year Cost2013-13 actual $02013-14 actual $1222014-15 actual $1472015-16 target $2472015-16 actual $288
Reasons for significant varianceDVS is currently transitioning to the new model of expanding the number of vehicle inspection partners. As part of this strategy, several metropolitan Vehicle Examination Centres were closed and resources were realigned to Authorised Inspection Stations to provide future efficiencies. This resulted in redundancy and related staff costs exceeding budget in 2016-17.
Average Cost per Vehicle Inspection Delivered through Authorised Inspection Stations2
Year Cost2013-13 actual $02013-14 actual $1062014-15 actual $992015-16 target $862015-16 actual $121
Reasons for significant varianceDVS is currently transitioning to the new model of expanding the number of vehicle inspection partners. As part of this strategy, several metropolitan Vehicle Examination Centres were closed and resources were realigned to Authorised Inspection Stations to provide future efficiencies.
Average Cost per Driver Assessment
Year Cost2013-13 actual $1002013-14 actual $108
1 This is a new Key Performance Indicator for 2015-16. Data has been re-cast to 2013-142 This is a new Key Performance Indicator for 2015-16. Data has been re-cast to 2013-14
Department of Transport Annual Report 2015-16 59

2014-15 actual $1082015-16 target $862015-16 actual $97
Reasons for significant varianceThe variance is caused by a reduction in demand for driver licences and practical driver assessments due to the slowdown in the WA economy and negative net overseas and interstate migration.Additionally costs increased as a result of the allocation of regional services costs to this KPI.
Service 5: Strategic transport policy and integrated planningThis service contributes towards the provision of leadership for strategic transport management, development and protection of economic nodes and networks through the provision of a range of services, including:
analysis, planning and implementation of urban infrastructure projects and models to manage future travel demands;
strategic policy development, which supports the achievement of sustainable, effective and practical solutions for Western Australian transport networks and addresses capacity issues;
policy advice and strategic transport solutions to the State Government; representation and negotiation, on behalf of the State Government, at national
level transport-related forums to produce positive outcomes that promote and protect Western Australian interests;
program management and delivery of major intermodal infrastructure planning and development activities that assists in economic development;
quality assurance and assessment of the return on investment for State Government funds in transport projects; and
monitoring industry and public demand-growth to provide best practice transport channels and access, which alleviates environmental impacts.
The key efficiency performance indicators used to measure this performance are detailed below:
A
Average Cost per Policy Hour for Strategic Transport Policy Development
Year Cost2013-13 actual $1042013-14 actual $812014-15 actual $962015-16 target $932015-16 actual $96
Reasons for significant varianceNo significant variance noted this year between target and actual.
Department of Transport Annual Report 2015-16 60
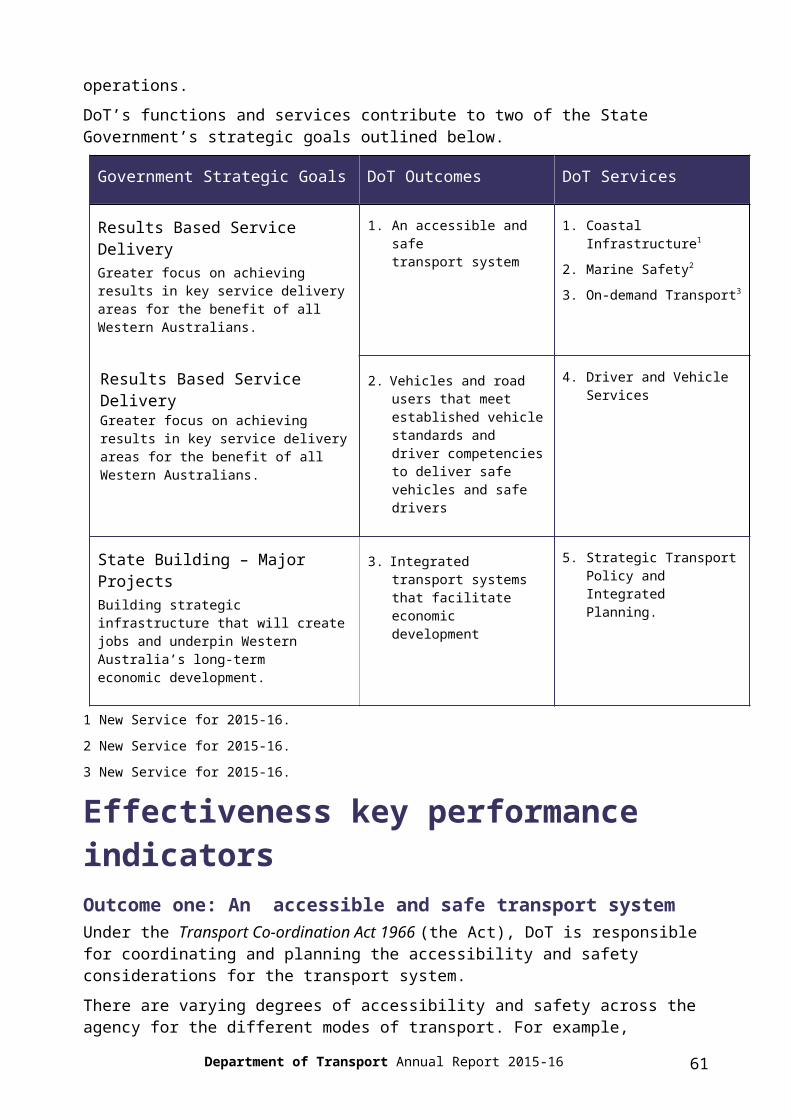
Average Cost per Planning Hour for Integrated Transport Planning Development
Year Cost2013-13 actual $962013-14 actual $722014-15 actual $1292015-16 target $952015-16 actual $116
Reasons for significant variancePlanning costs for 2015-16 increased within the Policy, Planning and Investment Division following reprioritisation of resources within the Department’s overall budget.
Other financial disclosuresPricing policies of services providedDoT reviews its fees and charges annually to reflect, where legally permissible, full cost recovery in the provision of its services pursuant to the departmental policy for costing and pricing.
The following gazettes contain variations to DoT’s fees and charges for the 2015-16 financial year:
Western Australia Government Gazette No. 72 dated 15 May 2015; Western Australia Government Gazette No. 79 dated 27 May 2015; Western Australia Government Gazette No. 80 dated 29 May 2015; and Western Australia Government Gazette No. 86 dated 12 June 2015.
Major capital projectsDepartment of Transport 2015-16 Financial Year Details of Major Capital Projects (TI 903 Section (13) (ii) (a) (b))
(Major capital projects are those over $5 million)
Capital projects incompleteExmouth Boat Harbour
Expected year of completion: 2016-17$ 000
Project life spent up to 30 June 2016 5,009
Estimated cost to complete 13,266
Estimated total cost of project 18,275
Department of Transport Annual Report 2015-16 61

Ministerial directivesNo Ministerial directives were received during the 2015-16 financial year.
Employment and industrial relationsFull-time equivalents (FTE) and headcount, as at 30 June 2016.
Status Headcount FTE*
Permanent full-time 1,123 1,123.00
Permanent part-time 204 126.99
Temporary full-time 111 111.00
Temporary part-time 21 14.64
Senior Executive Service 21 21.00Total 1,480 1,396.62
*Headcount and FTE numbers include paid employees and employees on unpaid leave.
During 2015-16, DoT continued to work in partnership with the Joint Consultative Committee and union delegates to discuss initiatives and address any issues.
Freedom of informationDoT’s Freedom of Information (FOI) Coordinator is the initial contact point for all FOI related matters.
In accordance with the Freedom of Information Act 1992 (the Act), DoT is required to respond to FOI access applications within 45 days of receipt, unless an extension of time is negotiated. The average time to process applications in 2015-16 was 15 days.
FOI fees and chargesFees and charges are set under the Act. Apart from the application fee for non-personal information, all charges are discretionary. Details of fees and charges are listed below.
Application Amount
Personal information about applicant No fee
Application fee (for non-personal $30.00
Charge for time taken dealing with the application
$30.00 per hour
Charge for access time supervised by $30.00 per hour
Charges for photocopying $30.00 per hour for staff time and 20
Department of Transport Annual Report 2015-16 62

Rights of reviewThe Act allows dissatisfied applicants to request an internal review of the initial decision made by DoT. In accordance with Section 40 of the Act, a request for an internal review must be forwarded to the FOI Coordinator, in writing within 30 days of the date of the initial decision.
Following an internal review, matters remaining in dispute can be submitted to the Office of the Information Commissioner for external review. Such applications must be submitted within 60 days from the date of internal review decision.
No fees or charges apply to internal or external reviews.
FOI statistics for 2015-16 against the previous three years are listed below:
Application Amount 2012-13
Amount 2013-14
Amount 2014-15
Amount 2015-16
Total received (not including those transferred to another agency)
178 204 257 351
Internal reviews 2 10 19 15External reviews 1 2 7 7Transferred to another agency 5 15 7 10
Customer feedbackDoT’s Complaints Handling Policy provides a flexible approach, where complaints can be made in person, by phone, fax, online or in writing.
The Department has in place Complaints Handling Procedures that provide guidelines for implementing the policy in line with the Australian Standard on Complaints Handling (AS ISO 10002-2006).
Complaints may be handled directly by individual Business Units or by the Customer Feedback System that is administered within Objective – the Department’s electronic document and record management system.
Feedback received in 2015-16 (through the Customer Feedback System)
Business Units Complaints
Feedback, Information & Compliments
Total Customer Feedback
% of DOT total
Complaints
Driver and Vehicle Services 1412 812 2224 89.59%
Marine Safety 38 64 102 2.41%
Coastal Infrastructure 31 43 74 1.97%
Regional Services 46 14 60 2.92%
On-demand Transport 39 13 52 2.47%
Other 10 78 88 0.63%
Total 1576 1024 2600“Other” includes Policy Planning and Investment, People and Organisational Development, Office of the Director General and Corporate Services. These business units typically do not receive consistent
Department of Transport Annual Report 2015-16 63

complaints or other feedback through the year, so have been included as a single category.
As the largest directorate in the Department, Driver and Vehicle Services received close to 90 per cent of all complaints.
Types of feedback
Types of feedback received 2014-15General feedback and information (requests and suggestions) have been grouped together.
Type of feedback received 2011-16In 2015-16 the total number of all types of customer feedback captured by the Customer Feedback System shows an overall decrease of 30 per cent from 2014-15.
Breakdown of feedback received over timeOver the past year, DoT has undertaken work to analyse customer feedback with the objective to reduce the number of complaints received. Additionally, DoT has improved accessibility for customers wishing to submit a general enquiry online. These measures to improve the customer experience have contributed to the reduction in formal complaints in 2015-16.
Investing in our great peopleIn 2015-16 DoT continued its commitment and investment in helping our people.
Performance Partnership ProgramThe Performance Partnership Program (PPP) provides managers and employees with the framework for ongoing discussions about performance objectives, measures, learning and development needs to ensure our people are set up for success.
PPP complianceIn 2015-16, DoT continued developing the PPP by measuring the number of people with current individual performance plans and if they have had a performance review in the previous six months. In September 2015, DoT also started measuring if people had a current individual learning and development plan.
As of March 2016:
96 per cent of our people had a current individual performance plan compared with 80 per cent in September 2013;
92 per cent had a current individual learning and development plan against 80 per cent in September 2015; and
90 per cent had a performance review within the previous six months against 79 per cent in March 2013.
The report also indicated the percentage of people meeting performance expectations which was 98 per cent as of March 2016.
PPP quality reviewDoT completed a quality review of the PPP program to gain a better understanding of the effectiveness and value of the PPP experience, from the point of view of the customers, DoT managers and employees, and the organisation itself.
Department of Transport Annual Report 2015-16 64

Overall, the results were positive, with the majority of employees satisfied with the PPP and its various components and the majority of employees and managers reporting that they feel confident and capable to participate in the PPP.
However, it was also found that the PPP could be improved with simple modifications and targeted initiatives including further training and education for our managers and employees.
The result of this review will set in place DoT’s learning and development action planning, career coaching conversations, upward feedback, and better quality PPP discussions based on meaningful and simple work objectives, actions and measures.
Developing our peopleDoT continued to develop and support learning and career development programs for all our people including empowering managers to effectively lead and manage their team.
Certificate IV program for Compliance OfficersIn 2015-16, DoT introduced the Certificate IV program for Compliance Officers. This training program will deliver a consistent professional approach to education and compliance activities, which will build and enhance our officers’ skills and capabilities. The courses feature on-the-job, task-based learning and theoretical assessment as well as face-to-face sessions.
After just one year of specialised training, all our Compliance Officers will have gained two nationally accredited qualifications – Certificate IV in Investigation and Certificate IV in Compliance. These qualifications will not only extend and strengthen their skill level in compliance duties over a range of roles but also open up new career pathways.
All Compliance Officers will complete the Certificate IV program over the next three years. The four intakes for 2016 have started and feedback from participants has been very positive.
People Managers ProgramIn 2015-16, DoT continued to place a high priority on developing the people management competencies of its frontline leaders.
Through the ongoing success of our People Managers Program, we have trained 98 leaders since 2013. Participation has resulted in improvements in individual leadership and operational effectiveness and has contributed to the confidence and career progression of many of our DoT leaders.
In addition, it was encouraging to see that 73 per cent of program participants were female leaders, which has assisted them to reach their potential and develop their career within DoT.
Continuing our cultural development journey: Excellent ServiceThe cultural development journey commenced in 2012 when a group of 65 champions from across the business attended a workshop to create four core business values to define the culture for DoT. These are Fresh Thinking, Clear Direction, Excellent Service and Great People.
Phase 2 of the cultural development journey involved establishing cultural development teams with representatives from across DoT, to focus specifically on promoting and
Department of Transport Annual Report 2015-16 65

further embedding each individual value. For each value, the cultural development teams identified and designed tools and initiatives to support people managers and employees to promote and further embed the values in their workplace behaviours and the way they work.
In May 2015, the Excellent Service Cultural Development Team was established to focus on DoT’s third Value Excellent Service.
The cultural team initiatives, which were officially launched in April 2016, included:
a service promise to promote consistency and ownership across the workforce as well as DoT’s positive brand within the community;
production of corporate videos showcasing our employees and their views on excellent service; and
some practical tools for our employees to further develop their capability in delivering excellent service.
Recognising our great peopleDoT’s Radar Awards is an employee recognition program where staff and colleagues are able to nominate an employee or team who have made an exceptional contribution to the Department’s strategic goals.
In early 2016, DoT worked on strengthening the Radar Awards to promote higher recognition of staff talents, improve the program’s alignment to DoT’s values and ensure better administration and transparency in the decision-making process.
Promoting a more diverse and inclusive workforceWorkforce Diversity PlanAs a result of implementing key diversity strategies in DoT’s Workforce Diversity Plan 2012-2016, the Department has seen an increase in:
the number of Aboriginal employees; the employment of people from a culturally diverse background; the employment of people with a disability; and the number of females at senior levels eight to nine.
This year DoT has commenced work on developing the DoT Workforce Diversity Plan for 2016-2020 to continue building on the strategies for a more culturally diverse workforce. The Plan will focus on raising greater awareness on the benefits of diversity and challenging the organisation to achieve a more diverse and inclusive workforce that will better represent our community, make good business sense and help make DoT successful.
Aboriginal Traineeship ProgramThe Aboriginal Traineeship Program is a Public Sector Commission initiative aimed at employing Aboriginal people, 25 years of age and under, to undertake an employment-based Government Traineeship in the WA Public Sector.
The traineeship program provides young Aboriginal people with a unique and valuable opportunity to develop the skills, experience and knowledge required for a career in the WA Public Sector. On successful completion of the Traineeship, trainees will achieve a Certificate II or III in Government.
In 2015, DoT welcomed three Aboriginal trainees who are due to successfully complete their traineeships in July and August 2016. The trainees have made a positive contribution to DoT’s workplace culture and the Department has requested to receive
Department of Transport Annual Report 2015-16 66

five new trainees, three in the Perth metropolitan area and two in regional areas for 2016-17.
Governance disclosuresContracts with senior officersDuring 2015-16, other than normal contracts for employment of services, no senior officers or firms of which senior officers are members, or entities in which senior officers have substantial interests, had any interests in existing or proposed contracts with DoT.
Unauthorised use of credit cardsDoT officers hold corporate credit cards (purchasing cards) where their functions warrant usage of this facility. Each cardholder is informed and reminded of their obligations annually under the Department’s purchasing card policy, however 16 employees inadvertently utilised their purchasing cards in their personal capacity.
None of these matters were referred for disciplinary action as the Chief Finance Officer noted that the nature of the expenditure was immaterial and characteristic of an unintentional mistake.
2016
Number of instances the purchasing card has been used for personal use 20
Number of referrals for disciplinary action instigated during the reporting period
Nil
$Aggregate amount of personal use expenditure for the reporting period 396
Aggregate amount of personal use expenditure settled by the due date (within five working days)
61
Aggregate amount of personal use expenditure settled after the period (after five working days)
3351
1 Includes the aggregate amount of $9, which was outstanding at balance date.
Other legal requirementsAct of GraceDuring the current financial year, the Department made nine Act of Grace payments totalling $1.259 million to Barrack Square operators who were able to sufficiently demonstrate an adverse impact on their business as a result of the Elizabeth Quay development works.
Department of Transport Annual Report 2015-16 67

Advertising agencyAs required under section 175ZE of the Electoral Act 1907, the following statement relates to advertising expenditure, which includes creative development, media placement, market research, polling and direct mail.
Advertising agency 2015-16
Cooch Creative Pty Ltd $56,868
Rare $44,609
$101,477
Media advertising
Media advertising – non-campaign
Adcorp Australia Limited $91,068
Media advertising – campaign
Carat Australia Media Services Pty Ltd $26,092
$117,160
Market research Nil
Polling Nil
Direct mail Nil
Total $218,637
Disability Access and Inclusion PlanDoT is continually improving accessibility for all Western Australians, including people with disability and their families and carers.
This commitment is clearly demonstrated in our Disability Access and Inclusion Plan 2012-2017 and its key strategies. Accessibility was a key consideration in the development of DoT’s infrastructure projects in 2015-16. These include the following:
An assisted access boat landing pontoon and associated provision of nearby disabled parking bay at Two Rocks Boat Harbour. The new boat landing pontoon is located near the upgraded boat launching ramp and depending on tides, provides full universal access for boarding of vessels.
New harbour management office buildings with accessible grade ramps, tactile indicators, disabled bathroom facilities and disabled parking were constructed at Onslow (Beadon Creek) Maritime Facility and Point Samson (Johns Creek) Boat Harbour.
Wheelchair access ramps for the new school based education facility – Marine Safety Education Boatshed Jetty.
During the year, DoT also introduced the following improvements to its quality of service and accessibility for customers with different needs:
New Safe Driving Course for people in remote communities now contains a presentation with embedded videos and a voice over to assist customers with literacy and language issues.
Department of Transport Annual Report 2015-16 68

Introduction of a standardised Oral Theory Test for learner’s permits as an alternative to the Computer Theory Test for customers with different needs, including people with difficulties with literacy and numeracy and those that experience difficulties using a computer.
A simplified process is now available for some drivers to satisfy DoT of their ongoing fitness to drive with the option of completing a declaration instead of undergoing a further medical assessment. The Fitness to Drive Declaration process will only apply to eligible drivers who have previously undergone a full medical assessment and where their medical condition is well maintained and under the regular care of a medical practitioner.
Reconciliation Action PlanDoT is committed to strengthening our relationships with Aboriginal and Torres Strait Islander people. Our commitment is demonstrated in our Reconciliation Action Plan 2012-16, which outlines strategies aimed at promoting awareness and improving access to our products and services.
In 2015-16 DoT assisted in introducing the following initiatives:
Community Open Days to metropolitan areas to help Aboriginal customers obtain ID, drivers or vehicle licence’s.
The introduction of the new Safe Driving Course, an interactive education program delivered by Remote Area Licensing Officers as an alternative to log book hours which, for people living in remote WA, are cumbersome and unnecessary. The new interactive course includes:– a single presentation with embedded videos and a voiceover to assist customers
with literacy issues; and– more interactive assessment requiring engagement and involvement from
the applicant. Improvements to accessing our information through:
– Facebook to advertise the remote licensing work and advise customers where and when the services are provided; and
– a stand-alone section on DoT website for our Remote Areas Licensing Program increasing accessibility for remote customers.
DoT continued to visit remote communities in the Kimberley, Pilbara, Goldfields and now Gascoyne and Mid-West regions. In 2015-16 the Remote Licensing teams have:– issued, re-issued, transferred or renewed a total of 621 driver’s licences;– conducted 343 practical driving assessments, – delivered 359 theory tests (including verbal tests),– engaged with Aboriginal corporations and private industry to deliver licensing
services; and – participated with other stakeholders at regional community Open Days.
DoT has formed a Reconciliation Action Plan working group to develop a new plan for 2017-19 and will continue to work with Aboriginal people, government and other stakeholders to promote relationships and improve outcomes for Aboriginal and Torres Strait Islander people.
Compliance with Public Sector Standards and ethical codesAs public servants, DoT’s employees are working for the people of WA who expect them to act with integrity and to look after their interests. This places DoT in a position of trust, requiring standards of ethical behaviour that reflect community expectations.
Department of Transport Annual Report 2015-16 69

During 2015-16, DoT continued to review its human resource management policies and procedures to empower managers to effectively manage their people in line with DoT’s culture and values.
These reviews resulted in the following achievements:
The Code of Conduct was revised to provide a helpful guide on what is the appropriate behaviour or decision to make when faced with an ethical situation and where to find more detailed policy/procedures on ethical behaviour.
The Recruitment and Selection Policy and Procedures were updated to provide clarity and flexibility with continued focus on fair and transparent merit based selection.
DoT continued to make its Accountable and Ethical Decision Making online training program available to employees throughout 2015-16, with 99 per cent of employees at 30 June having completed the program.
Compliance issuesThree Breach of Standard claims relating to the Employment Standard were received in 2015-16. Two of the claims were considered and dismissed by the Public Sector Commissioner and one was declined by the Public Sector Commissioner.
Seven Breach of Standard claims relating to the Grievance Standard were received in 2015-16. Five of the claims were considered and dismissed by the Public Sector Commissioner while two claims remain.
In 2015-16, 17 cases of non-compliance with the Code of Ethics/Code of Conduct were reported; 11 of which resulted in disciplinary investigations.
Better recordkeepingDoT is committed to best practice recordkeeping to ensure compliance with the State Records Act 2000, as well as enable best business outcomes for the agency. The following information is provided in accordance with the State Records Commission Standard 2, Principle 6.
Efficiency and effectiveness of recordkeeping systemsSystems are in place to effectively manage DoT records, both digital and hard copy, allowing for efficient and compliant recordkeeping across the agency. This is demonstrated in the continued commitment and focus on electronic recordkeeping for born digital documents and digitisation of hard copy records where appropriate.
DoT’s corporate Electronic Document and Records Management System is Objective. All staff have access to Objective, enabling them to capture and manage records in line with agency policies and procedures.
Recordkeeping training and induction programsThe completion of the online Recordkeeping Awareness Training course is mandatory for all staff. The course covers the individual’s obligations to comply with both DoT’s recordkeeping policies, procedures and the State Records Act 2000. Some 1600 DoT staff, including contractors, are enrolled in the online module. Currently, 88 per cent of those enrolled have completed the course.
Assessment of the training course is integrated into the online module, and all feedback provided is monitored and reviewed. The content of the course is regularly assessed to ensure it continues to encompass prevailing operational and administrative practices and processes.
Department of Transport Annual Report 2015-16 70

DoT’s employee induction program includes a segment that provides new staff with information relating to recordkeeping and the use of Objective. This section of the induction addresses employees’ roles and responsibilities in creating, managing, maintaining and using of government records.
Objective online training is available for all new staff, and as a resource for existing staff. Face-to-face training is also provided, on either an individual or group basis. This comprehensive training is tailored to meet the specific needs of users and workgroups.
Training effectivenessThe effectiveness of DoT’s recordkeeping training is reflected in the widespread use of Objective across the agency, as evidenced by the increasing number of corporate documents stored and managed in Objective. This is further reinforced by the extremely positive feedback received from staff to recent internal customer engagement surveys on the use of Objective and awareness of record keeping generally.
Government policy requirementsSubstantive equalityDoT continues to provide services to the diverse WA community in a fair and non-discriminatory manner. Within DoT’s core business and business planning process this commitment is consistent with the principles of the State’s Substantive Equality Framework and demonstrated in the following key achievements for 2015-16:
In July 2015, DoT established an Access and Inclusion Committee (AIC) to lead the implementation of the Substantive Equality Framework across DoT and identify opportunities to overcome access and inclusion barriers and develop strategies to enhance access and inclusion for the community.The AIC fosters an environment of understanding and inclusion regarding access to DoT’s information, services and facilities to address:– all forms of discrimination in accordance with the Equal Opportunity Act 1984;
and– issues faced by people with disability, ethnic minority groups and Aboriginal and
Torres Strait Islander people, which impact on their social and economic inclusion.
DoT worked in partnership with the Equal Opportunity Commission in the development of our Substantive Equality Framework Implementation Plan 2015-2018, which aims to ensure the needs of our whole community are being met, and that no group is unfairly impacted by DoT services, policies and proposals.
The national standard classification systems for recording of gender in driver licensing applications was introduced in July 2015 to recognise people who identify as intersex or being of indeterminate unspecified gender or gender neutral.
The acceptance of Centrelink BasicsCard for driver and vehicle licensing payments by all DVS Business Centres, DoT Regional Offices and Remote Licensing teams with EFTPOS facilities was implemented in August 2015.
Ongoing engagement with the Culturally and Linguistically Diverse (CaLD) community through:– CaLD Driver Licensing Reference Group;– WA CaLD Across Government Network; and– the provision of information and advice regarding obtaining a WA driver’s licence
and a photo card at Mercy Care CaLD Career Options day and the Communicare Safe Driver Education Program Workshop for refugee and humanitarian entrants.
Department of Transport Annual Report 2015-16 71

Audit and Risk Management CommitteeThe Audit and Risk Management Committee plays a key role in fulfilling DoT’s corporate governance and monitoring responsibilities in relation to reporting, internal control structure, risk management systems, external audit and internal audit functions.
The Committee is made up of the following members:
Director General Transport as the Chair of the Committee; Managing Director – Policy Planning and Investment; Managing Director – Transport Services; Director – Office of the Director General; and Executive Director Main Roads – Finance and Commercial Services, as the cross
portfolio representative.
Ernst & Young representatives attend as the contracted internal auditor.
The Committee contains one ex-officio member, the Executive Director Investment and Finance Coordination (Chief Finance Officer). A representative from the Office of the Auditor General also attends meetings as an independent observer.
The Audit and Risk Management Committee met four times in 2015-16.
Internal auditDoT’s internal audits are conducted by provider Ernst & Young, in accordance with the Financial Management Act 2006 and Institute of Internal Auditors International Standards for the Professional Practice of Internal Auditing.
The following internal audits were conducted in 2015-16:
Fraud Risk Management Transport Services Management of Compliance Occupational Health and Safety Management Purchasing Cards DVS Contract Management Penetration Testing Information Security Management Ports Statement of Corporate Intent and Strategic Development Plans Freight Industry Grant Subsidy Recreational Skippers Ticket Extraordinary Drivers Licence Opposition and Appeal Process Assessment
Recommendations from the internal audits are managed and monitored through DoT’s Audit Recommendation Management System. The implementation status of these recommendations is reported on a quarterly basis to the Audit and Risk Management Committee.
Risk managementDoT has a comprehensive risk management process that meets the requirements of Treasurer’s Instruction 825, the Public Sector Commissioner’s Circular 2015-03 Risk Management and Business Continuity Planning and is aligned to the international standard AS/NZS ISO 31000:2009 Risk Management – Principles and Guidelines.
DoT’s structured risk management approach is integrated into planning, management and operational processes, and assists DoT to achieve its desired outcomes by providing a transparent process that identifies what is essential to success and demonstrates the decision making process regarding the acceptance of risks.
Department of Transport Annual Report 2015-16 72

The Audit and Risk Management Committee has a key responsibility for providing management oversight for risk management across DoT.
DoT’s fraud and corruption risk management process is incorporated within DoT’s risk management framework. DoT’s Fraud and Corruption Control Plan sets out the relevant policies and obligations for all employees with respect to preventing, detecting and responding to incidents of fraud and corruption.
Leave Liability Reduction Strategy‘Take your leave – you’ve earned it’ In 2015-16, DoT applied a new educational and disciplined approach to reducing its leave liability commitments through its new Leave Liability Reduction Strategy and key message ‘Take your leave – you’ve earned it’. Since the Department of Treasury set policy across the public sector advising that there would be no increase to an agency’s leave liability, DoT’s funding was effectively capped at $29.2 million.
The Department has been working to maintain this leave liability funding level through a number of policy updates and targeted campaigns. The dollar value however, has continued to increase resulting in a leave liability figure of $34.1 million in July 2015.
DoT recognised that approximately 38 per cent of Long Service Leave Liability was attributed to pro-rata long service leave, which cannot be cleared. Therefore the remaining 62 per cent was analysed for attention, the majority of which was attributed to normal recreational Annual Leave.
A DoT Leave Liability Reduction Strategy was developed to drive a cultural shift required by managers and employees with the aim of reducing the number of annual leave hours held from 300 to 150 hours.
The strategy’s focus is on shifting responsibility for planning and taking available leave to employees in consultation with their manager.
The first target was for all employees to have booked and committed to taking any annual leave hours above the approved 150 hours by 30 June 2016. The second target and the key objective of the strategy, is that by 30 June 2017, all employees are holding no more than 150 hours of annual leave at any point in time (including booked leave). Long Service Leave is currently well managed, and it continues to be a requirement to clear this leave within three years of it being accrued.
The following are the main actions from the Leave Liability Reduction Strategy:
The Director General issued an e-mail broadcast encouraging all employees to; ‘Take your leave – you’ve earned it’.
The Executive Director of People and Organisational Development (POD) has continued to enable executive leaders to lead the organisation and communicate key messages of the strategy to our people managers and employees.
Clear data and reports, including graphs have been provided to executive leaders each month showing Business Unit progress to targets.
Quarterly reporting to Corporate Executive showing DoT’s progress on leave liability target hours and dollars.
These actions were supported by the following activities to help manage the leave liability reduction:
Department of Transport Annual Report 2015-16 73
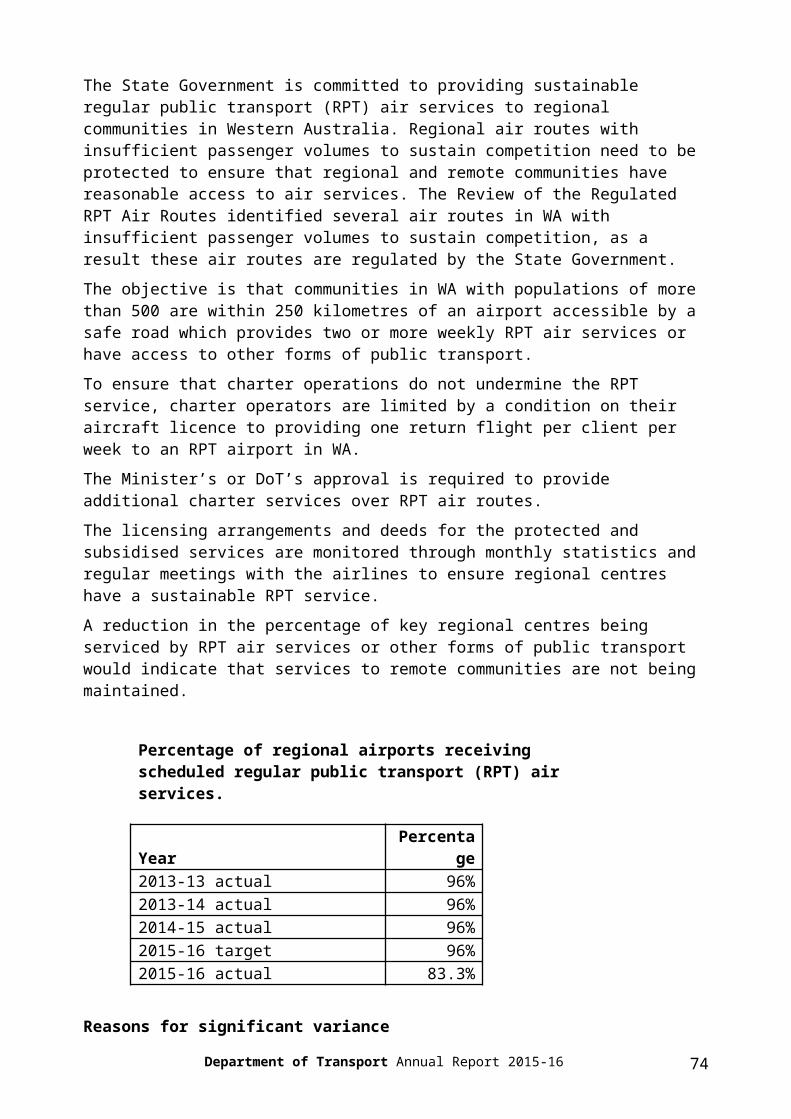
A workshop was held with Business Managers across DoT to explain the Leave Liability Reduction Strategy.
POD utilised its fortnightly DoT email communication, Pay Day News, to keep the focus of the strategy at the forefront of all employees minds.
DoT Policies and Procedures were updated for easy access to information. Publishing a Leave Management Self Service User Guide was published that
highlighted the tools available to managers to assist in monitoring employee leave balances.
A leave planning discussion in all Performance Partnership Program meetings. POD will continue to partner with executive leaders, as required, with tailored
strategies for people with longer term excess leave balance issues. The responsibility for planning and taking leave has been shifted to the employees
in consultation with their manager. Leaders/managers to ensure all employees take their booked leave.
In early June 2016 progress trends indicated that over 65 per cent of employees had achieved the desired result for the initial 30 June 2016 target and some 60 per cent were already within the thresholds of the 30 June 2017 target.
As of 30 June 2016, the leave liability had reduced to $32.5 million indicating the DoT strategy is working.
DoT continues to assist executive leaders and people managers to manage leave across their business areas and ensure their employees take the leave they have earned each year on an ongoing basis and to enable employees to lead themselves and be responsible for discussing, planning and clearing their leave.
The MyTime solutionTo improve DoT’s governance and associated records management of time and attendance information, the Department introduced the MyTime application – an electronic certification and approval of timesheets solution. The application is fully auditable and ensures DoT adheres to the legislative framework that defines these practices.
DoT has a variety of working arrangements across the Department, including nine-day fortnights, shift work, and counter staff rostering that presented some challenges to the consistent approach. MyTime was established to provide a consistent application of attendance practices across the Department, establish better recordkeeping facilities and to improve reconciliation between recorded employee time and attendance information with the leave and payroll records held in the HR system.
In November 2015, MyTime was released to a pilot group of DoT business areas to ensure the application was robust and to help define the transition process.
The implementation project has progressed well during 2016 with 78 per cent of DoT employees transitioned into MyTime by 30 June 2016. The feedback from users has been very positive, noting its ease of use and efficient approval process by managers. Managers are welcoming the ability to view their team’s timesheet at any time and find the interface of the work rosters, leave balances and bookings very helpful.
Even in these early stages of embedding this new application across DoT, it is clear that many of the shortcomings of the previous manual process are being eliminated. Many business areas are already considering ways to use the data collected to manage their workforce. The project is due for completion in October 2016.
Occupational safety, health and injury Department of Transport Annual Report 2015-16 74

managementDoT’s executives, safety and health representatives and employees are committed to achieving a workplace environment that is free of work related injuries and disease and to achieving a standard of excellence in occupational health and safety management.
In accordance with the Public Sector Commissioner’s Circular 2009-11: Code of practice: Occupational safety and health in the Western Australian public sector (the Circular), the Department complies with the requirements of the Occupational Safety and Health Act 1984, the Workers’ Compensation and Injury Management Act 1981 and the Code of practice: Occupational safety and health in the Western Australian public sector.
DoT’s Occupational Health and Safety Strategy Our commitment to our employeesDoT is committed to its corporate legislative responsibility to promote health and safety in the workplace.
In support of this commitment, DoT strives to promote and maintain a values driven workplace that encourages staff to bring their passion for life to work and to nurture an environment where all staff can thrive.
This year, DoT developed its Occupational Health and Safety (OHS) Strategy, which aims to create a work environment where the health and safety of its employees is highly valued. It provides the Department with a structured and relevant safety management system that addresses DoT‘s legislative obligations and enables Business Units to actively manage safety.
The Strategy is designed to provide a structured approach to OHS for both proactive and reactive safety and health activities undertaken by POD’s OHS Branch. It is based on a partnering model with other POD areas of expertise and with all the DoT Business Units.
If there is a workplace injury, the Department has an established injury management program, which details the steps taken to assist injured employees to return to work as soon as medically appropriate. The procedure ensures that injury management intervention occurs promptly and effectively, to allow the injured employee to remain at work or return to work at the earliest appropriate time. The Department’s injury management procedure is compliant with the requirements of the Workers’ Compensation and Injury Management Act 1981 and the Code of Practice (Injury Management) 2005.
All employees can access the Department’s OHS and Injury Management (IM) systems through the DoT intranet. OHS and IM information is widely communicated, as part of various training sessions designed for both employees – and for managers/supervisors – OHS and IM for Managers. OHS information is also provided through various OHS Sub-Committees. Due to the variation in roles and functions of the many DoT Business Units, the Department now has three OHS Subcommittees.
These are the:
Marine House and Regional Services OHS Subcommittee; DVS and On-demand Transport OHS Subcommittee; and
Department of Transport Annual Report 2015-16 75

140 William Street OHS Subcommittee.
Each committee is chaired by the Executive Director or General Manager/s of the various Business Units.
DoT’s Corporate Executive is strongly committed to OHS management in the workplace. This is demonstrated by its endorsement of the DoT OHS Policy and the establishment of the Corporate OHS Management Committee on behalf of the Director General – Department of Transport.
The Corporate OHS Management Committee is accountable for the management of OHS in DoT. More specifically, it is responsible for identifying and implementing OHS initiatives and making recommendations on policy and strategy to Corporate Executive. The Corporate OHS Management Committee includes all Executive Directors, General Managers and the OHS are chaired by the Managing Director of Transport Services.
Consultation mechanismsManagement and employees are committed to improved and effective consultation in the workplace. Consultation provides DoT employees with an opportunity to participate fully in decisions, which impact their work lives.
The three OHS Sub Committees comprising of safety and health representatives and management representatives, meet every three months to discuss matters relating to workplace issues that affect the health and welfare of employees and the continuous improvement of OHS performance. Both the agenda and meeting minutes for each of the OHS Subcommittee meetings and the Corporate OHS Management Committee meetings are displayed on dedicated OHS noticeboards across all the DoT sites.
The Safety and Health Representatives, in consultation with management, are responsible for updating the noticeboards and the effectiveness of the OHS Committee meetings is measured by their attendance rates, which subsequently form part of the key performance indicators reported back to Corporate Executive.
During the year, DoT discussed and resolved issues raised by employees, reviewed accident and incident forms to ensure that hazards were addressed to eliminate or reduce future issues, discussed injury trends and identified preventative measures that promote a safe working environment.
Workers’ Compensation and Injury Management DoT has a strong focus on early intervention and return to work. Managers and supervisors are trained in the importance of good injury management and return to work, all with the purpose of promoting a supportive, productive and positive workplace.
DoT has a dedicated Workers’ Compensation and Injury Management Consultant who manages the workers’ compensation claims and the non-work related injury management issues.
As of 30 June 2016, DoT had 34 open workers’ compensation claims, of which only three claims were certified unfit. The remaining injured workers were back at work on a return to work program.
OHS Management System audit and resultsThe DoT OHS Management System was audited in February 2016, by an external auditor from Ernst and Young, as part of the 2015-2016 DoT Internal Audit Plan.
The scope of this audit included DoT’s OHS management alignment with relevant health and safety management system specifications (including Australian Standard 4801), its core principles of relevant OHS legislation and DoT’s risk profile. The auditor utilised an
Department of Transport Annual Report 2015-16 76

AS 4801 Audit Tool.
The audit also included the following:
Interviews with key stakeholders including the Manager Occupational Health and Safety, OHS Representatives, Site Managers and the DoT Consultant for Occupational Health and Safety to understand how hazards and risks in the workplace are being identified, assessed, controlled and monitored.
A review of documentation, including standards, policies and procedures, of the OHS Management System and comparison to legislative requirements and those outlined by the Australian Standard for Occupational Health and Safety Management Systems, AS 4801.
A survey among OHS Representatives to further understand how workplace health and safety is managed across DoT and to gain a more detailed understanding of safety issues that work sites face in their day to day operations.
Visits to the following four work sites that represent the different DoT operational environments:
1. Cannington DVS Centre 2. Marine Operations Centre in Fremantle 3. Marine Education Centre in Fremantle4. Vehicle Examination Centre in Welshpool.
The audit provided positive findings as well as areas and recommendations for improvement, which have been detailed in an action plan with responsibilities and target dates set for completion.
In general, the audit found that DoT provides a safe working environment. The following are the main findings:
There was strong evidence to show management’s support of safety, health and wellbeing within DoT. The safety committee meetings are attended and chaired by Executive Directors or General Managers. The Director General has shown a strong commitment to improving health in the workplace by supporting, endorsing and promoting the various DoT Corporate Health initiatives.
The outer Framework of the OHS Management System is established and operational. Standards that govern the System are established and the Department’s IT Systems such as Transporta and Objective also enable the management of OHS operations across the Department.
Communication, involvement of workers and consultation processes are well established through the election of OHS representatives. Regular OHS
Committee meetings are held, a comprehensive reporting structure that includes executive management exists and workers are consulted when developing new procedures.
There were no exceptions noted when sample testing cases of Injury Management and Workers’ Compensation. The process is well managed through the position of the Workers’ Compensation and Injury Management Consultant.
There is a good and robust process in place for managing first aid within Business Unit. All first aid kits are regularly inspected and stocked accordingly and all first aiders are adequately trained.
Workplace inspections are conducted bi-monthly and all hazards identified are managed accordingly, in consultation with staff.
82 per cent of managers/supervisors have received the necessary OHS and Injury Management for Managers training sessions
There were however, the following key recommendations:
Department of Transport Annual Report 2015-16 77

While standards in the DoT OHS Management Framework provide for risk management mechanisms, the processes to identify, assess, control and monitor risks are currently reactive and performed ad hoc. Although risk assessments are performed for selected processes, they are triggered by incidents. A formal and pro-active process to identify risks across sites should be implemented to provide the foundation for a comprehensive risk management approach.
The reporting of incidents have improved over time, however there appears to be an under-reporting of hazards that workers identify in the workplace. It was recommended that management drive the correct use of existing mechanisms among employees and consider simplifying systems (current hazard report form) to increase participation in reporting hazards, where appropriate.
While the Department’s OHS Management System is well aligned with fundamental requirements of legislation and Australian Standards, the regulatory compliance requirements are not actively identified and monitored. The existing legal registers should be reviewed and procedural documents regarding monitoring processes and controls be published to improve and formalise this process.
It was recommended to develop and approve an OSH Risk Register including common public sector hazards as described in the Code of Practice – Occupational Safety and Health in the Western Australian Public Sector 2007 such as aggression, manual handling, working alone, organisational changes, inadequate physical working environment, inadequate workstations, and inadequate work organisation.
Currently DoT has a strong OHS Induction Training Program, as part of the Corporate Induction. It was recommended that an OHS training program for all other staff be developed and rolled out.
It was also recommended to insert OHS responsibilities into individual Job Description Forms.
DoT will commence work on these recommendations in the next financial year.
OHS trainingThis year, Occupational Health, Safety and Injury Management training programs were reviewed with the following results:
The POD OHS Branch continues to roll out employee mental health awareness training with topics on depression, anxiety and suicide with the introduction of the A.L.E.R.T. (Awareness Links Enables Resilient Teams) training course. Some 377 staff have attended these training sessions.
OSH and Injury Management for Managers training sessions were combined into one three-hour training session. DoT currently has 82 per cent of managers trained in their OHS and injury management responsibilities.
Ergonomic training sessions were conducted throughout the year for all staff in the three main DoT offices – 140 William Street, Tassels Place and Marine House in Fremantle. Vehicle ergonomics was also conducted in all regional offices and for the Remote Licensing employees to promote good ergonomics on long distance driving.
Manual Tasks, Ergonomics and OSH Induction one-hour training sessions are available to all staff. All new starters at DoT attend the Employee Induction Day, which includes the OHS Induction session.
Sessions were undertaken at the individual Business Units and in all the regional sites, which allowed for a greater number of managers and staff to attend the sessions. All the above training was conducted with the regional sites via video conferencing, which is now available at DoT Regional offices.
Other key achievements
Department of Transport Annual Report 2015-16 78

The following achievements and activities supported DoT’s management of OHS in the workplace:
Implementation of the POD OHS Corporate Health and Safety Strategy for 2016, including proactive DoT site visits, to conduct workplace inspections, risk assessments, site OHS audits and onsite training, as per the POD OHS site visits calendar for 2016.
A successful DoT Corporate Health strategy, incorporated as part of the Cultural Development Strategy. This included flu vaccinations, which were received by 665 staff members, an updated intranet page for wellbeing ideas, corporate gym membership discounts, corporate health insurance discounts and the promotion of a number of Safe Work Australia National Priorities which include Mental Disorders, Asthma and Musculoskeletal disorders in the workplace to encourage physical activities and minimise sedentary behaviours.
Partnering with DVS business unit to review all of the number plate rooms and safe storage requirements across all the DVS Centres.
The ongoing implementation of the Management of Customer Aggression Policy and Guidelines to provide management and staff with a consistent step by step approach to managing difficult and aggressive customers. All customer-facing staff can now attend a one-day Managing Difficult Customer Interactions training course. The number of customer aggression incidents across the Department continues to decrease gradually. This year, DoT adopted the Restriction of Service Letters process. In the event of a customer aggression incident on site, managers are now given the authority, if supported by the Metropolitan Business Centres Manager, to contact aggressors by letter and inform them that their behaviour is unsuitable and such unacceptable behaviour will not be tolerated by DoT. A review of all duress alarms across all DoT sites is currently underway.
The continued implementation of the Working in Remote Areas Policy and Procedures across worksites that ensures staff travelling to remote areas are provided with the right vehicles, equipment and systems to enable a safe working environment. Now all DoT vehicles travelling into remote locations are equipped with a GPS tracking system, which enables managers to track the travelling and ensure their safety during such long trips.
Partnering with DVS to review the safe working practices (ergonomic factors) for use of new tablet technology utilised by Driving Assessors as part of their conduct of Practical Driving Assessments; and review DVS’ current emergency intervention practices and controls utilised by Driving Assessors as part of their conduct of Practical Driving Assessments for C class motor vehicles.
DoT’s OHS and Injury Management performance is demonstrated in the table below.
Table 1: Occupational safety, health and injury management performance
Measure 2014-2015(1)
2015-2016
Target Result
Number of fatalities 0 0 0 (zero) Target achieved
Lost time injury and/or disease incidence rate
1.330 2.148(2) 0 or 10% reduction
Target not achieved. There was an increase (compared to 2014-2015) in the number of LTI claims. See point 2 below.
Department of Transport Annual Report 2015-16 79

Measure 2014-2015(1)
2015-2016
Target Result
Lost time injury and/or disease severity rate
5.263 13.333(3) 0 or 10% reduction
Target not achieved
Percentage of injured workers returned to work within 13 weeks
100% 90%(4)Actual percentage result
90% achieved
Percentage of injured workers returned to work within 26 weeks
100% 100%(5)Actual percentage result
Target achieved
Percentage of managers trained in occupational safety, health and injury management responsibilities
88% 82%(6)Greater than or equal to 80%
Target achieved
Notes:
(1) The results are sourced from DoT’s Annual Report 2014-15.
(2) There were 30 lost time injury (LTI) claims lodged in 2015-16, while the number of full time equivalents in 2015-2016 was 1,396. However, there were 19 lost time injury claims in 2014-15, while the full time equivalents in 2014-15 were 1428.
(3) There were 4 workers’ compensation (WC) claims lodged in 2015-16 with greater than 60 days or more lost from work. There were 30 lost time injury (LTI) claims lodged in 2015-16.
(4) 27 of the 30 WC claims with registered LTIs were returned back to work within 13 weeks.
(5) All 30 WC claims with registered LTIs were returned to work within 26 weeks.
(6) The training for managers and supervisors relates to their occupational safety and health and injury management responsibilities. In 2015-16, the Department successfully trained 82 per cent of the managers.
Department of Transport Annual Report 2015-16 80