Embed Size (px)
Citation preview
Why WAEMU Countries Have Persistent Difficulties to Meet the Convergence Criterion Related to Tax Revenue Performance? The Role of Institutions
Abstract
WAEMU countries have experienced persistent fiscal deficits and over-dependence on foreign sources of revenues in the period 1970 to 2011, showing the importance of the issue of domestic resources mobilization in this zone. In this period, tax revenue as a share of GDP is found to be not only volatile but also low in these countries which have thus persistent difficulties to meet the convergence criterion regarding a ratio of tax revenue to GDP higher than 17% annually for all member states. At the same time, the quality of institutions is declining in this zone. Using an econometric analysis, this paper finds that the weak institutions in WAEMU have contributed to reduce significantly tax revenue performance in this zone. Institutions have thus played an important role in explaining why WAEMU countries have persistent difficulties to meet the convergence criterion related to the tax revenue performance. The key implication of these results is that strong institutions are crucial for a greater performance of tax revenue in WAEMU. JEL Classification: E02, H10, H11, H20
Keywords: Tax revenue; institutions; domestic resource mobilization; WAEMU
1
1. Introduction
Issues of taxation and development in developing countries have attracted wider and renewed interest in the last few years (Stiglitz, 2010; Keen, 2012). The 2008 global financial and economic crisis has shown the need to pay more attention to domestic resources mobilization because the crisis demonstrated the volatility and uncertainty that surround external sources of development finance, including export revenues, foreign direct investment, aid and remittances (UNECA, 2010). The central concern is related to the need to increase sustainably domestic resources mobilization (Felix, 2008; IMF, 2011). Indeed, according to IMF (2011), several countries are still facing with the fundamental need of mobilizing more resources from their own tax bases. Mobilizing more revenue is a priority for developing countries as they have to finance their development agendas, and weak revenue mobilization is the root cause of fiscal imbalances in several countries (Drummond, Daal, Srivastava and Oliveira, 2012). Tanzi and Zee (1997) have demonstrated that raising domestic revenues is the most feasible way to achieve fiscal sustainability. Wilford and Wilford (1978a) asserted that one of the most important policy upon which most economists agree is that emerging nations must increasingly mobilize their own internal resources to provide economic growth. The United Nations (2005) find that the achievement of the Millennium Development Goals (MDG) by low income countries requires increasing tax revenue up to 4% of GDP.
However, while researchers agree that domestic tax revenues are an essential source of financing for development, it is important to note that the tax system should be effective in order to lead to a greater ownership of the development process (UNECA, 2010). Unfortunately, a distinction needs to be made between taxes collected by the tax administrators and taxes received by the treasury (Tanzi, 1999), showing the major problem of corruption in tax administration. Indeed, according to Ajaz and Ahmad (2010), developing countries are typically unable to generate sufficient amount of revenue from taxation because these countries face a number of institutional problems in the process of revenue generation. Countries with poor institutional quality are not able to establish effective tax systems and so these economies are characterized by a persistent weakness in tax collection (Bird et al, 2006; Davoodi and Grigorian, 2007; Madhavi, 2008; Minea and Villieu, 2009; Botlhole, 2011). Various studies have explained that collection of tax revenues is one of the important areas where corruption is most likely to arise (Galtung, 1995; Li, 1997; Toye and Moore, 1998; Tanzi, 2000; Fjeldstad and Tungodden, 2001). It is widely agreed that the presence of corruption is a social phenomenon that can significantly reduce tax revenue (Ghura, 1998; Imam and Jacobs, 2007; Bornhorst et al, 2009; Ajaz and Ahmad, 2010). Many studies regarding tax system in developing countries show that more than 50% of tax revenue goes uncollected because of fiscal corruption (Richupan, 1984; Alm et al, 1991; Bird, 1990 and 1992; Krugman et al, 1992). Bird et al (2008) indicate that tax structure is highly responsive to governance structure. There is a close relationship between low level of tax revenue and governance, and notably corruption (Attila, Chambas and Combes, 2008).
For the West African Economic and Monetary Union (WAEMU) countries, there are persistent fiscal deficits (as shown in figure A.1 in annex 1) and over-dependence on foreign sources of revenues (World Bank, Africa Development Indicators 2012), showing the importance of the issue of domestic resources mobilization. Tax revenue as a share of GDP is found to be low (BCEAO, Economic and Financial Database) in these countries which have also experienced a deterioration of the quality of their institutions (Polity IV Project Dataset, and World Bank, Worldwide Governance Indicators 2012). The decline in the quality of the institutions can then be an important cause of poor tax revenue performance in WAEMU, as explained above in various studies. By investigating empirically the
2
effect of institutions on tax revenue, this research contributes therefore to a better understanding of the role of institutions in explaining poor tax revenue performance in WAEMU.
The rest of the paper is organized as follows. Section 2 explains the importance of the study for the WAEMU countries with some key stylized facts. Section 3 provides the conceptual framework of institutions and tax revenue. Section 4 indicates the data. Section 5 provides the econometric analysis of the effect of institutions on tax revenue performance in WAEMU. Section 6 concludes the paper.
2. Importance of the study: some key stylized facts
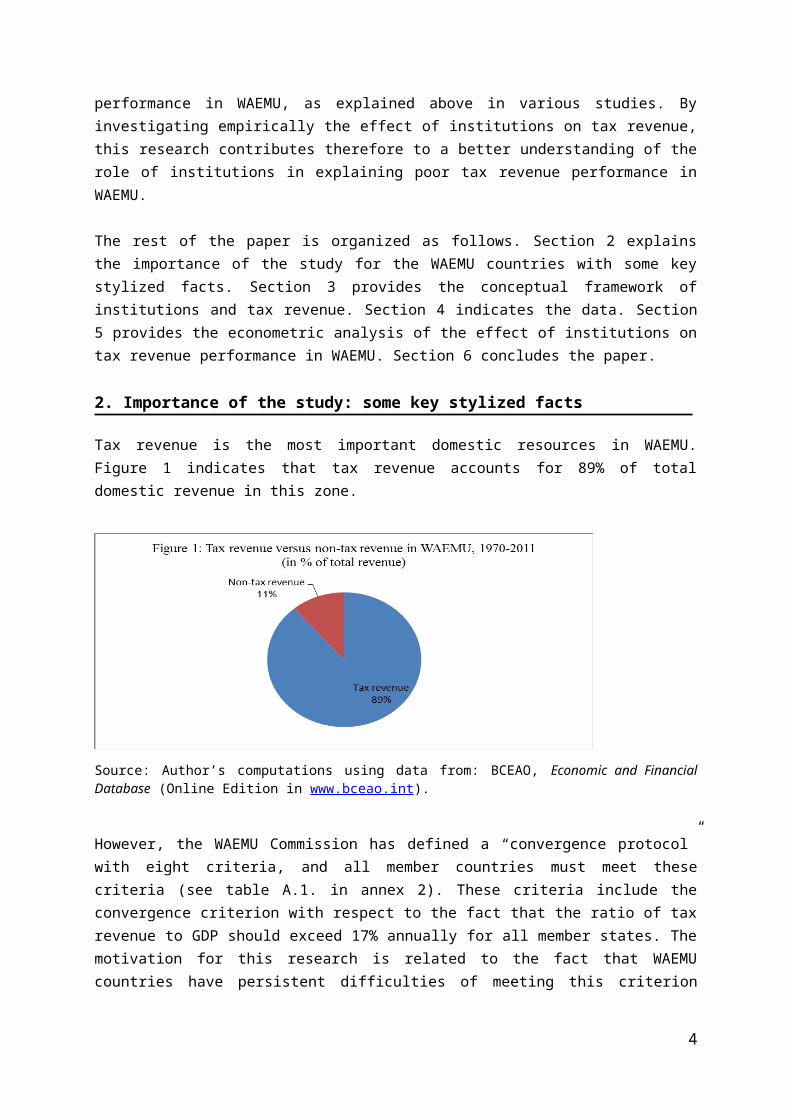
Tax revenue is the most important domestic resources in WAEMU. Figure 1 indicates that tax revenue accounts for 89% of total domestic revenue in this zone.
Source: Author’s computations using data from: BCEAO, Economic and Financial Database (Online Edition in www.bceao.int).
However, the WAEMU Commission has defined a “convergence protocol” with eight criteria, and all member countries must meet these criteria (see table A.1. in annex 2). These criteria include the convergence criterion with respect to the fact that the ratio of tax revenue to GDP should exceed 17% annually for all member states. The motivation for this research is related to the fact that WAEMU countries have persistent difficulties of meeting this criterion related to the tax revenue to GDP ratio. Indeed, there are several problems related to tax revenue in WAEMU.
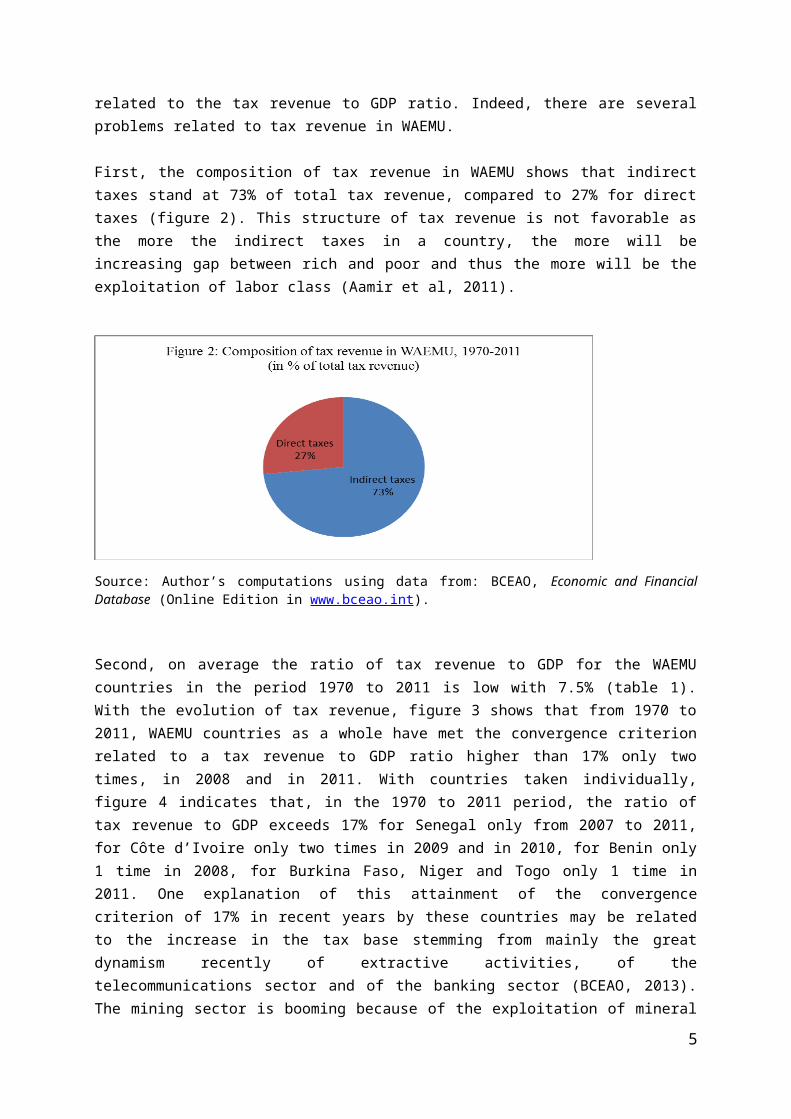
First, the composition of tax revenue in WAEMU shows that indirect taxes stand at 73% of total tax revenue, compared to 27% for direct taxes (figure 2). This structure of tax revenue is not favorable as the more the indirect taxes in a country, the more will be increasing gap between rich and poor and thus the more will be the exploitation of labor class (Aamir et al, 2011).
3
Source: Author’s computations using data from: BCEAO, Economic and Financial Database (Online Edition in www.bceao.int).
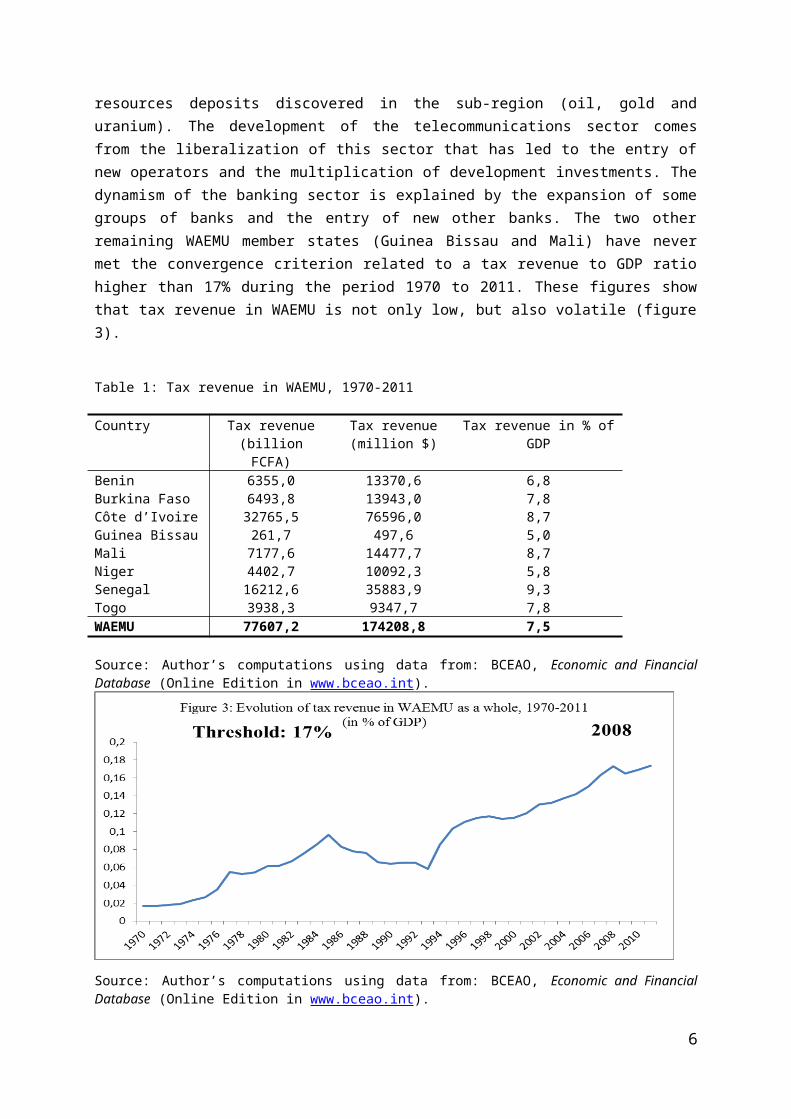
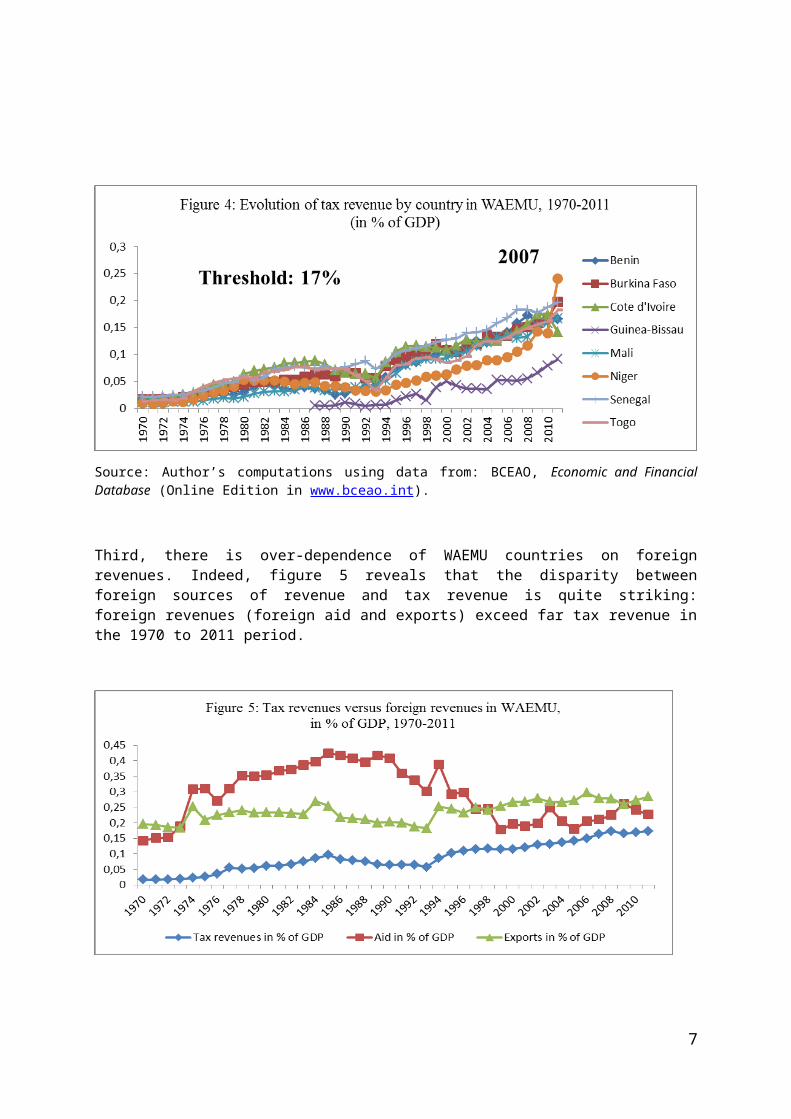
Second, on average the ratio of tax revenue to GDP for the WAEMU countries in the period 1970 to 2011 is low with 7.5% (table 1). With the evolution of tax revenue, figure 3 shows that from 1970 to 2011, WAEMU countries as a whole have met the convergence criterion related to a tax revenue to GDP ratio higher than 17% only two times, in 2008 and in 2011. With countries taken individually, figure 4 indicates that, in the 1970 to 2011 period, the ratio of tax revenue to GDP exceeds 17% for Senegal only from 2007 to 2011, for Côte d’Ivoire only two times in 2009 and in 2010, for Benin only 1 time in 2008, for Burkina Faso, Niger and Togo only 1 time in 2011. One explanation of this attainment of the convergence criterion of 17% in recent years by these countries may be related to the increase in the tax base stemming from mainly the great dynamism recently of extractive activities, of the telecommunications sector and of the banking sector (BCEAO, 2013). The mining sector is booming because of the exploitation of mineral resources deposits discovered in the sub-region (oil, gold and uranium). The development of the telecommunications sector comes from the liberalization of this sector that has led to the entry of new operators and the multiplication of development investments. The dynamism of the banking sector is explained by the expansion of some groups of banks and the entry of new other banks. The two other remaining WAEMU member states (Guinea Bissau and Mali) have never met the convergence criterion related to a tax revenue to GDP ratio higher than 17% during the period 1970 to 2011. These figures show that tax revenue in WAEMU is not only low, but also volatile (figure 3).
Table 1: Tax revenue in WAEMU, 1970-2011
Country Tax revenue (billion FCFA)
Tax revenue (million $)
Tax revenue in % of GDP
Benin 6355,0 13370,6 6,8Burkina Faso 6493,8 13943,0 7,8Côte d’Ivoire 32765,5 76596,0 8,7Guinea Bissau 261,7 497,6 5,0Mali 7177,6 14477,7 8,7Niger 4402,7 10092,3 5,8Senegal 16212,6 35883,9 9,3Togo 3938,3 9347,7 7,8WAEMU 77607,2 174208,8 7,5
Source: Author’s computations using data from: BCEAO, Economic and Financial Database (Online Edition in www.bceao.int).
4
Source: Author’s computations using data from: BCEAO, Economic and Financial Database (Online Edition in www.bceao.int).
Source: Author’s computations using data from: BCEAO, Economic and Financial Database (Online Edition in www.bceao.int).
Third, there is over-dependence of WAEMU countries on foreign revenues. Indeed, figure 5 reveals that the disparity between foreign sources of revenue and tax revenue is quite striking: foreign revenues (foreign aid and exports) exceed far tax revenue in the 1970 to 2011 period.
5
Source: Author’s computations using data from: BCEAO, Economic and Financial Database (Online Edition in www.bceao.int); World Bank, Africa Development Indicators 2012 (Online Edition).
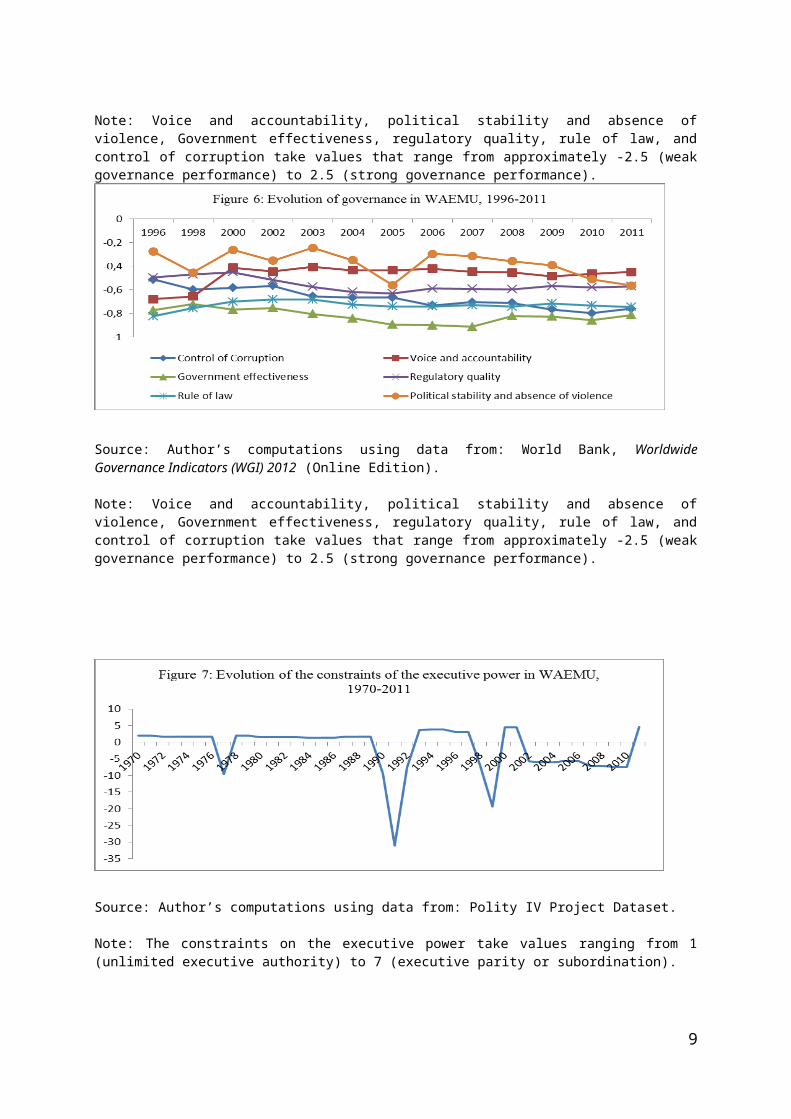
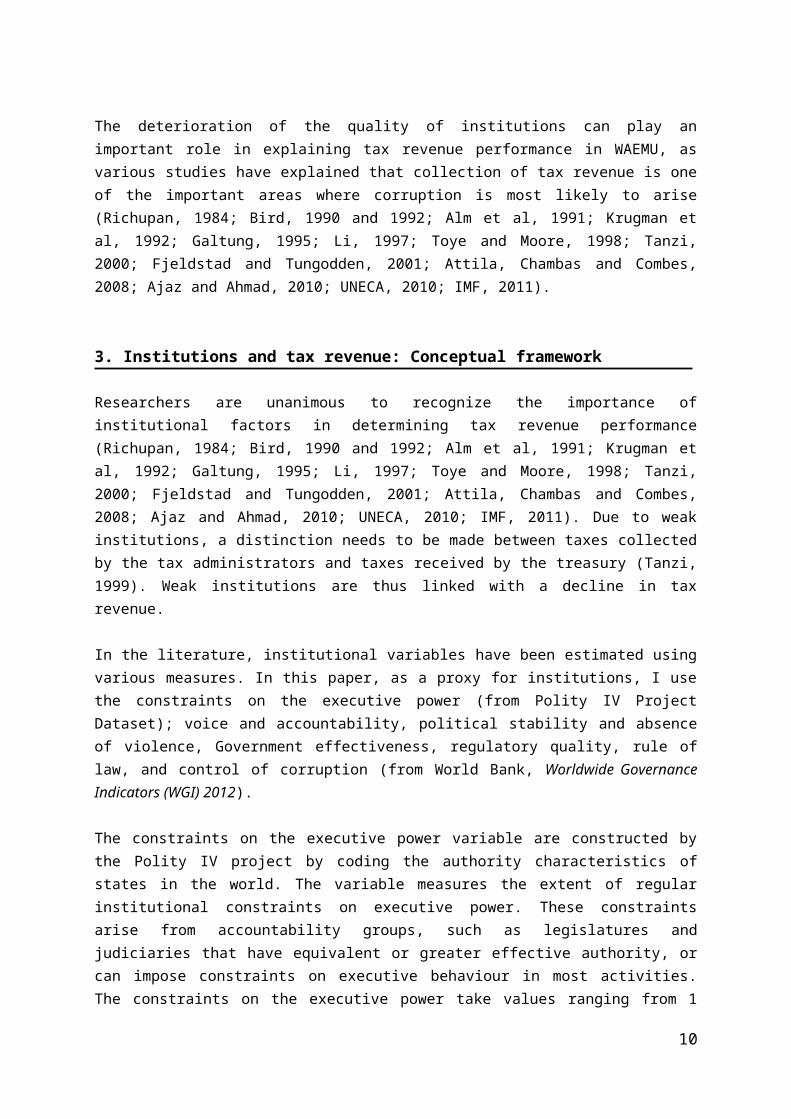
Therefore, a great challenge for WAEMU countries is the ability to mobilize sufficient domestic revenue. The issue of tax revenue mobilization is thus relevant for the WAEMU zone. What explains this poor performance in tax revenue mobilization? At the same time tax revenue is found to be low and WAEMU countries have serious difficulties to meet the convergence criterion regarding a ratio of tax revenue to GDP higher than 17%, there is a problem related to the deterioration of the quality of institutions in WAEMU. Indeed, table 2 shows that for the WAEMU countries as a whole, voice and accountability, political stability and absence of violence, Government effectiveness, regulatory quality, rule of law, and control of corruption are negative and take values of respectively -0.48, -0.38, -0.82, -0.56, -0.73, and -0.67. Figure 6 and figure 7 reveal that the quality of institutions is declining in WAEMU, respectively from 1996 to 2011, and in the period 1970 to 2011.
Table 2: Governance in WAEMU, 1996-2011
Country Voice and accountability
Political stability and absence of violence
Government effectivenes
s
Regulatory quality
Rule of law Control of corruption
Benin 0.23 0.51 -0.44 -0.38 -0.50 -0.66Burkina Faso -0.40 -0.10 -0.65 -0.24 -0.52 -0.20Côte d’Ivoire -1.15 -1.54 -1.01 -0.75 -1.30 -0.90Guinea Bissau -0.85 -0.78 -1.20 -1.09 -1.41 -1.06Mali 0.13 0.11 -0.81 -0.40 -0.34 -0.53Niger -0.57 -0.47 -0.87 -0.60 -0.72 -0.85Senegal -0.04 -0.37 -0.24 -0.24 -0.18 -0.29Togo -1.17 -0.42 -1.36 -0.77 -0.89 -0.88WAEMU -0.48 -0.38 -0.82 -0.56 -0.73 -0.67
Source: Author’s computations using data from: World Bank, Worldwide Governance Indicators (WGI) 2012 (Online Edition).
Note: Voice and accountability, political stability and absence of violence, Government effectiveness, regulatory quality, rule of law, and control of corruption take values that range from approximately -2.5 (weak governance performance) to 2.5 (strong governance performance).
6
Source: Author’s computations using data from: World Bank, Worldwide Governance Indicators (WGI) 2012 (Online Edition).
Note: Voice and accountability, political stability and absence of violence, Government effectiveness, regulatory quality, rule of law, and control of corruption take values that range from approximately -2.5 (weak governance performance) to 2.5 (strong governance performance).
Source: Author’s computations using data from: Polity IV Project Dataset.
Note: The constraints on the executive power take values ranging from 1 (unlimited executive authority) to 7 (executive parity or subordination).
The deterioration of the quality of institutions can play an important role in explaining tax revenue performance in WAEMU, as various studies have explained that collection of tax revenue is one of the important areas where corruption is most likely to arise (Richupan, 1984; Bird, 1990 and 1992; Alm et al, 1991; Krugman et al, 1992; Galtung, 1995; Li, 1997; Toye and Moore, 1998; Tanzi, 2000; Fjeldstad and Tungodden, 2001; Attila, Chambas and Combes, 2008; Ajaz and Ahmad, 2010; UNECA, 2010; IMF, 2011).
7

3. Institutions and tax revenue: Conceptual framework
Researchers are unanimous to recognize the importance of institutional factors in determining tax revenue performance (Richupan, 1984; Bird, 1990 and 1992; Alm et al, 1991; Krugman et al, 1992; Galtung, 1995; Li, 1997; Toye and Moore, 1998; Tanzi, 2000; Fjeldstad and Tungodden, 2001; Attila, Chambas and Combes, 2008; Ajaz and Ahmad, 2010; UNECA, 2010; IMF, 2011). Due to weak institutions, a distinction needs to be made between taxes collected by the tax administrators and taxes received by the treasury (Tanzi, 1999). Weak institutions are thus linked with a decline in tax revenue.
In the literature, institutional variables have been estimated using various measures. In this paper, as a proxy for institutions, I use the constraints on the executive power (from Polity IV Project Dataset); voice and accountability, political stability and absence of violence, Government effectiveness, regulatory quality, rule of law, and control of corruption (from World Bank, Worldwide Governance Indicators (WGI) 2012).
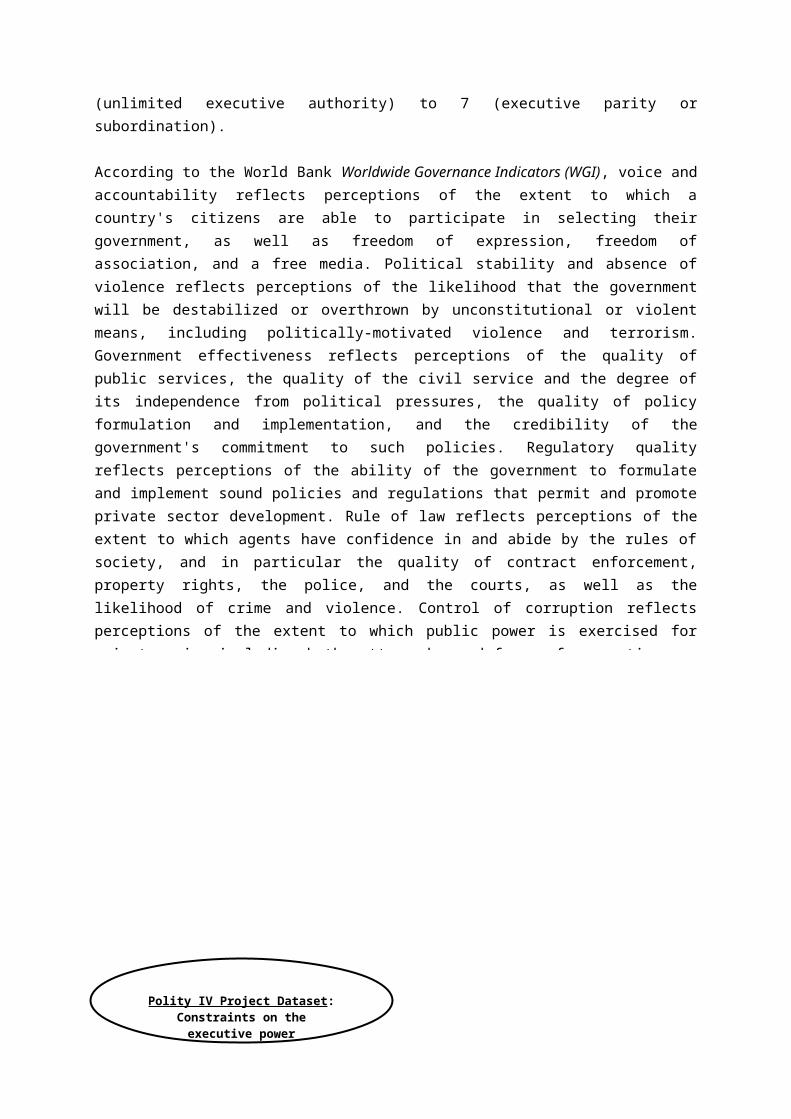
The constraints on the executive power variable are constructed by the Polity IV project by coding the authority characteristics of states in the world. The variable measures the extent of regular institutional constraints on executive power. These constraints arise from accountability groups, such as legislatures and judiciaries that have equivalent or greater effective authority, or can impose constraints on executive behaviour in most activities. The constraints on the executive power take values ranging from 1 (unlimited executive authority) to 7 (executive parity or subordination).
According to the World Bank Worldwide Governance Indicators (WGI), voice and accountability reflects perceptions of the extent to which a country's citizens are able to participate in selecting their government, as well as freedom of expression, freedom of association, and a free media. Political stability and absence of violence reflects perceptions of the likelihood that the government will be destabilized or overthrown by unconstitutional or violent means, including politically-motivated violence and terrorism. Government effectiveness reflects perceptions of the quality of public services, the quality of the civil service and the degree of its independence from political pressures, the quality of policy formulation and implementation, and the credibility of the government's commitment to such policies. Regulatory quality reflects perceptions of the ability of the government to formulate and implement sound policies and regulations that permit and promote private sector development. Rule of law reflects perceptions of the extent to which agents have confidence in and abide by the rules of society, and in particular the quality of contract enforcement, property rights, the police, and the courts, as well as the likelihood of crime and violence. Control of corruption reflects perceptions of the extent to which public power is exercised for private gain, including both petty and grand forms of corruption, as well as "capture" of the state by elites and private interests. These six World Bank governance indicators take values that range from -2.5 (weak governance performance) to 2.5 (strong governance performance).
8
4. The data
The sample includes all the 8 countries in WAEMU: Benin, Burkina Faso, Côte d’Ivoire, Guinea-Bissau, Mali, Niger, Senegal and Togo.
Data on tax revenue are sourced from BCEAO, Economic and Financial Database (Online Edition in www.bceao.int). Data on the quality of institutions are drawn from two sources: Polity IV Project Dataset for the constraints on the executive power; and World Bank, Worldwide Governance Indicators (WGI) 2012 (Online Edition) for voice and accountability, political stability and absence of violence, Government effectiveness, regulatory quality, rule of law, and control of corruption.
For the relationship between tax revenue and the constraints on the executive power, the time period is 1970 to 2011; while for the relationship between tax revenue and the World Bank governance indicators, the time period is 1996 to 2011.
Table A.2 in annex 3 provides more detailed definitions of all variables to be used in the research, and their data sources.
5. Econometric analysis of the effect of institutions on tax revenue in WAEMU
In this section, I investigate econometrically the effect of institutions on tax revenue in WAEMU, using several indicators of measuring institutions.
5.1. Specification of the models and estimation methods
9
Polity IV Project Dataset:Constraints on the executive power
World Bank Worldwide Governance Indicators:Voice and accountability Political stability and absence of violence Government effectiveness Regulatory quality Rule of law Control of corruption
Tax revenue
The specification of the econometric model of the effect of institutions on tax revenue takes the form of the following baseline equation:
Where TRG denotes the ratio of tax revenue to GDP; INS stands for institutions; X is the control variables; u is the country-specific fixed effect; v is the time-specific fixed effect; is the error term.
Institutions are measured firstly using the constraints on the executive power that take values ranging from 1 (unlimited executive authority) to 7 (executive parity or subordination) (sourced from Polity IV Project Dataset). Secondly, institutions are also measured using voice and accountability, political stability and absence of violence, Government effectiveness, regulatory quality, rule of law, and control of corruption (drawn from the World Bank, Worldwide Governance Indicators (WGI)). All these six World Bank governance indicators take value that range from approximately -2.5 (weak governance performance) to 2.5 (strong governance performance).
The control variables are those that have been identified as important determinants of tax revenue in the literature, including: the level of economic development (proxied by the growth rate of per capita GDP); tax base (via the share of agriculture sector in GDP used also as a proxy for the informal economy, the degree of openness of the economy measured as the ratio of exports plus imports to GDP); external environment (including the ratio of external debt to GDP, and the ratio of foreign aid to GDP); the macroeconomic instability (via the inflation rate measured as a change in the consumer price index); socio demographic indicators (proxied by the population growth) (Ghai, 1965; Ole, 1975; Wilford and Wilford, 1978a and 1978b; Wawire, 1991; Leuthold, 1991 ; Tanzi, 1992; Osoro, 1993 and 1995; Ariyo, 1997; Ghura, 1998; Edwards, 1998; Frankel, 1999; Wawire, 2000 and 2003; Eltony, 2002 ; Murüthi and Moyi, 2003; Agbeyegbe et al., 2004; Remmer, 2004; Brautigam and Knack, 2004 ; Gupta, 2007; Madhavi, 2008; Minea and Villieu, 2009; Lucotte, 2010; Ajaz and Ahmad, 2010; Ebeke, 2010; Wawire, 2011; IMF, 2011; Dioda, 2012; Drummond, Daal, Srivastava and Oliveira, 2012; Benedek, Crivelli, Gupta and Muthoora, 2012).
In equation 1 above, institutions could be endogenous to tax revenue. Indeed, while better institutions may lead to better tax revenue, in turn a poor tax revenue performance can reduce the possibilities of establishing or maintaining well-functioning institutions (Botlhole, 2010). To address endogeneity problems, the generalized method of moments (GMM) is be used by instrumenting the endogenous variable, institutions, by its lagged value (Ajaz and Ahmad, 2010; Benedek, Crivelli, Gupta and Muthoora, 2012).
5.2. Estimation results
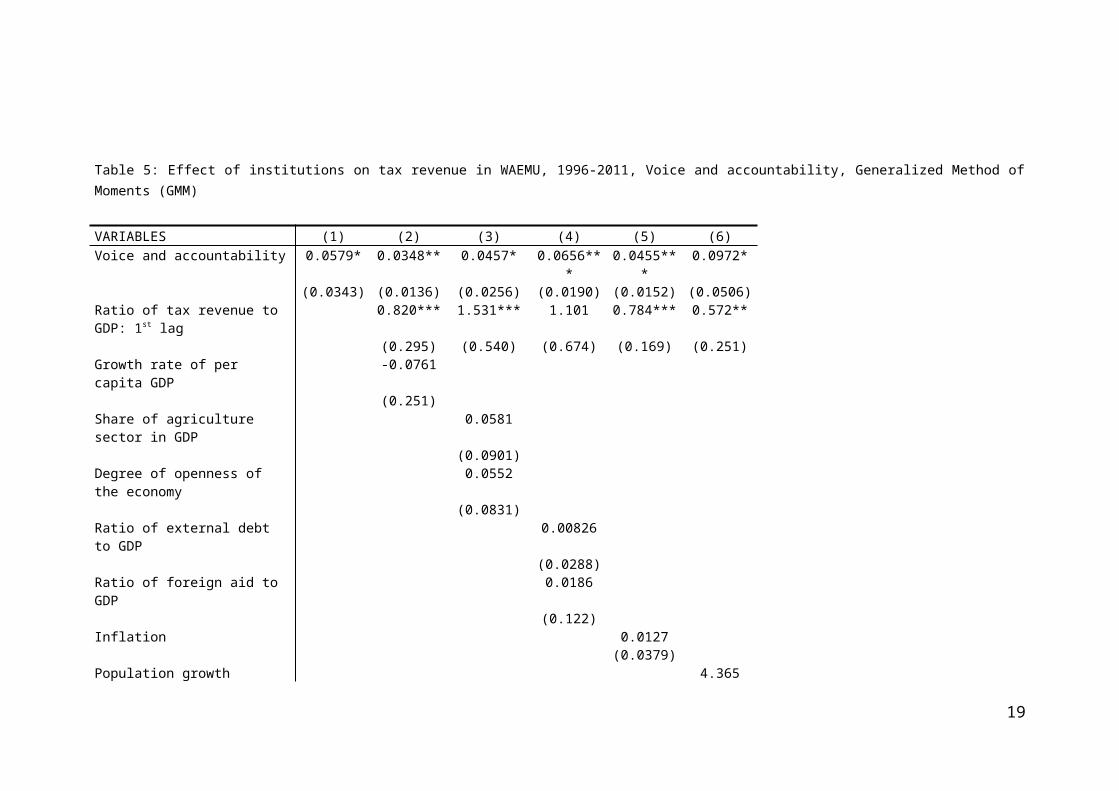
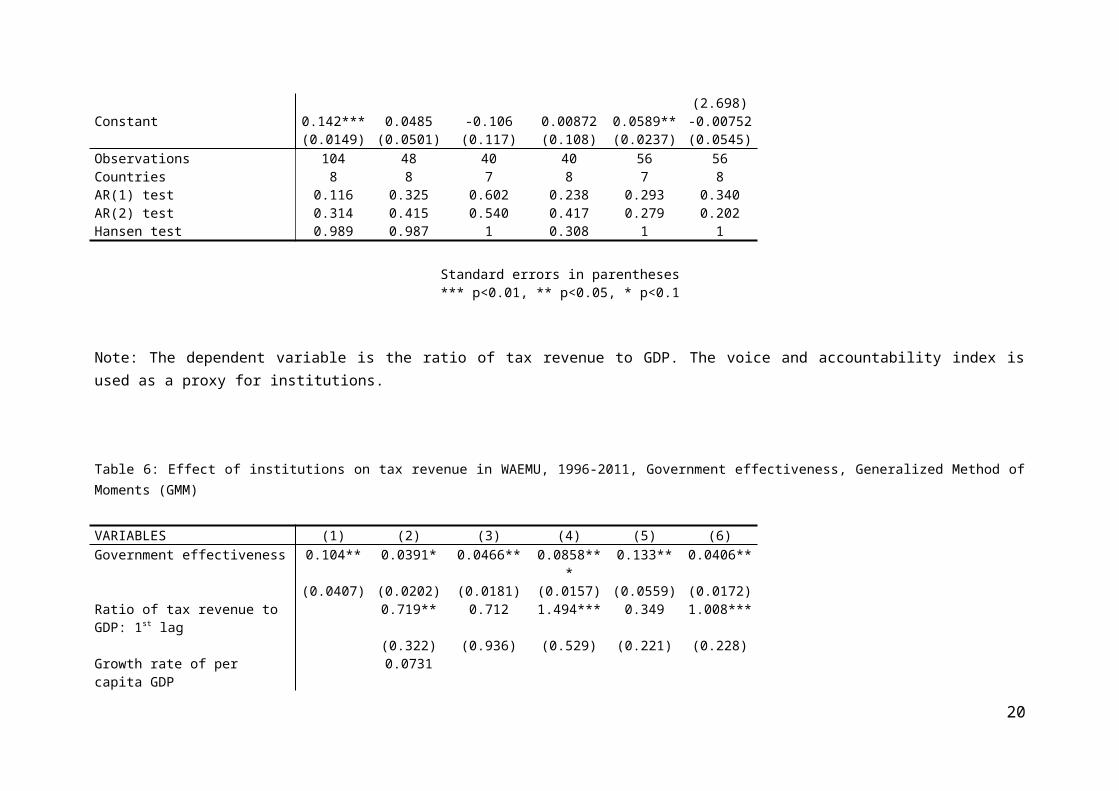
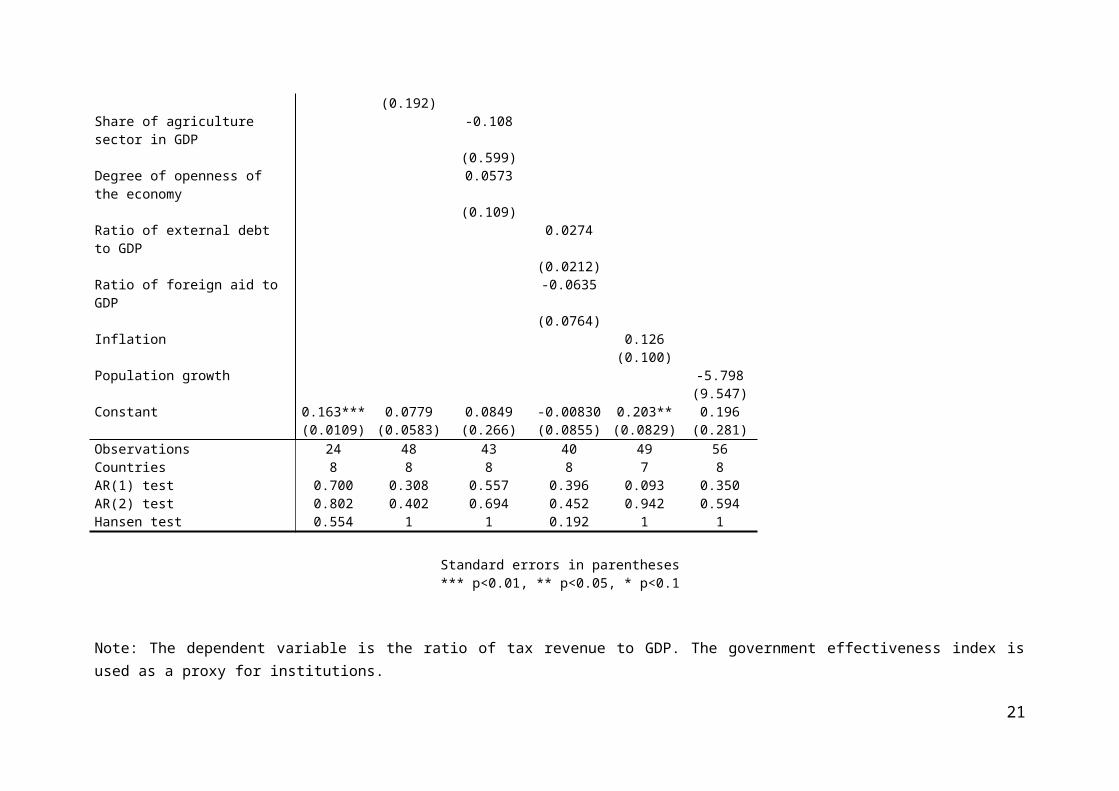
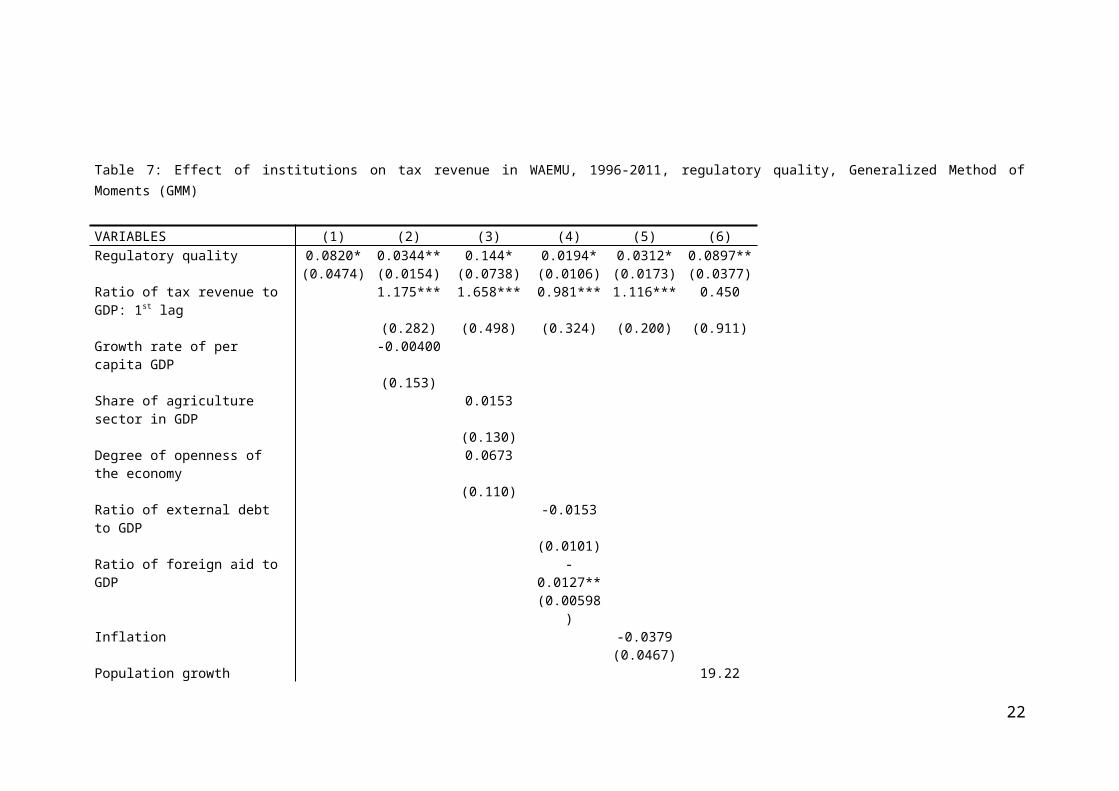
The results are presented in table 3 (for the constraints of the executive power, from Polity IV Project Dataset), in tables 4, 5, 6, 7, 8 and 9 (respectively for control of corruption, voice and accountability, government effectiveness, regulatory quality, rule of law, and political stability and absence of violence, from World Bank, Worldwide Governance Indicators (WGI)). The results show positive and statistically significant coefficients of the constraints of the executive power, control of corruption, voice and accountability, government effectiveness, regulatory quality, rule of law, and political stability and absence of violence. This result implies then that the weak institutions in WAEMU have contributed to reduce significantly tax revenue performance in this zone. Institutions have thus played an important role in explaining why WAEMU countries have persistent difficulties to meet the
10
convergence criterion with respect to the fact that the ratio of tax revenue to GDP should exceed 17% annually for all member states.
This result does not depend on the indicator of measuring institutions used. This result is robust across specifications as it holds true even after controlling for the level of economic development (proxied by the growth rate of per capita GDP), the tax base (via the share of agriculture sector in GDP used also as a proxy for the informal economy, and the degree of openness of the economy measured as the ratio of exports plus imports to GDP), the external environment (through the ratio of external debt to GDP, and the ratio of foreign aid to GDP), the macroeconomic instability (via the inflation rate measured as a change in the consumer price index), and the socio-demographic situation (proxied by the population growth).
11
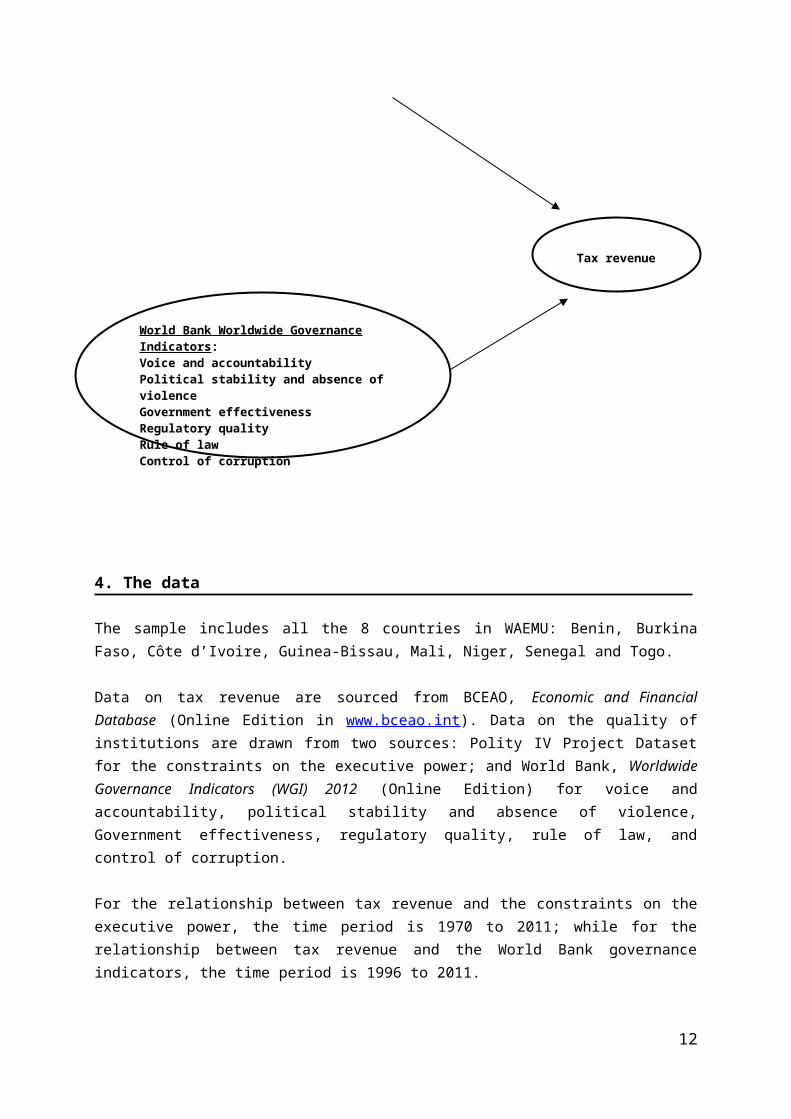
Table 3: Effect of institutions on tax revenue in WAEMU, 1970-2011, Constraints on the executive power, Generalized Method of Moments (GMM)
VARIABLES (1) (2) (3) (4) (5) (6) (7)Constraints of the executive power 0.000411* 0.000171* 0.000104*** 0.000256* 0.000287** 0.000226* 0.000180***
(0.000231) (9.17e-05) (1.67e-05) (0.000141) (0.000144) (0.000130) (5.54e-05)Ratio of tax revenue to GDP: 1st lag 0.840** 1.185*** 1.015* 1.034* 1.024* 0.936**
(0.417) (0.187) (0.546) (0.596) (0.588) (0.421)Growth rate of per capita GDP 0.0631
(0.0582)Share of agriculture sector in GDP -0.0772
(0.0730)Degree of openness of the economy 0.0821
(0.139)Ratio of external debt to GDP 0.00609
(0.0578)Ratio of foreign aid to GDP 0.0959
(0.0584)Inflation -0.0162
(0.0348)Population growth -4.554
(4.888)Constant 0.102*** 0.0274 -0.0120 -0.0712 -0.0317 0.00402 0.102
(0.00928) (0.0464) (0.0176) (0.188) (0.0443) (0.130) (0.0935)Observations 196 262 188 246 262 141 262Countries 8 8 8 8 8 7 8AR(1) test 0.265 0.151 0.058 0.174 0.200 0.141 0.558AR(2) test 0.209 0.767 0.050 0.133 0.551 0.719 0.527Hansen test 0.997 1 1 1 1 1 1
Standard errors in parentheses*** p<0.01, ** p<0.05, * p<0.1
Note: The dependent variable is the ratio of tax revenue to GDP. The constraints on the executive power are used as a proxy for institutions.
12
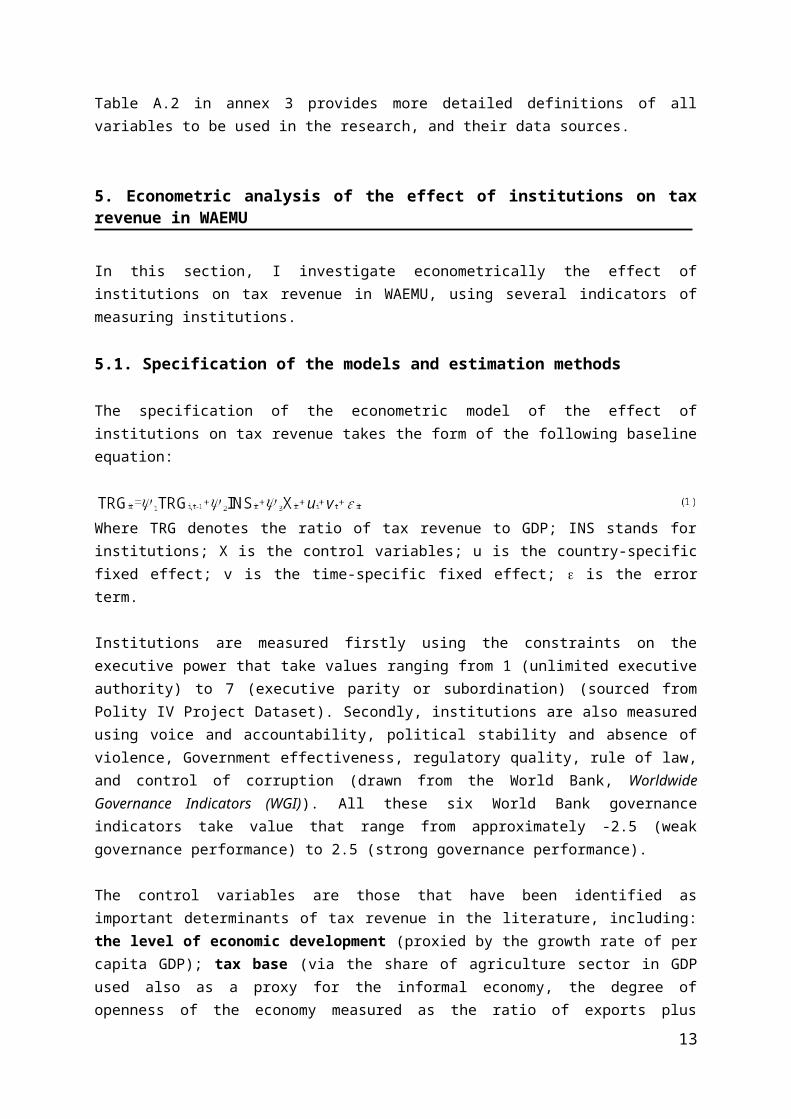
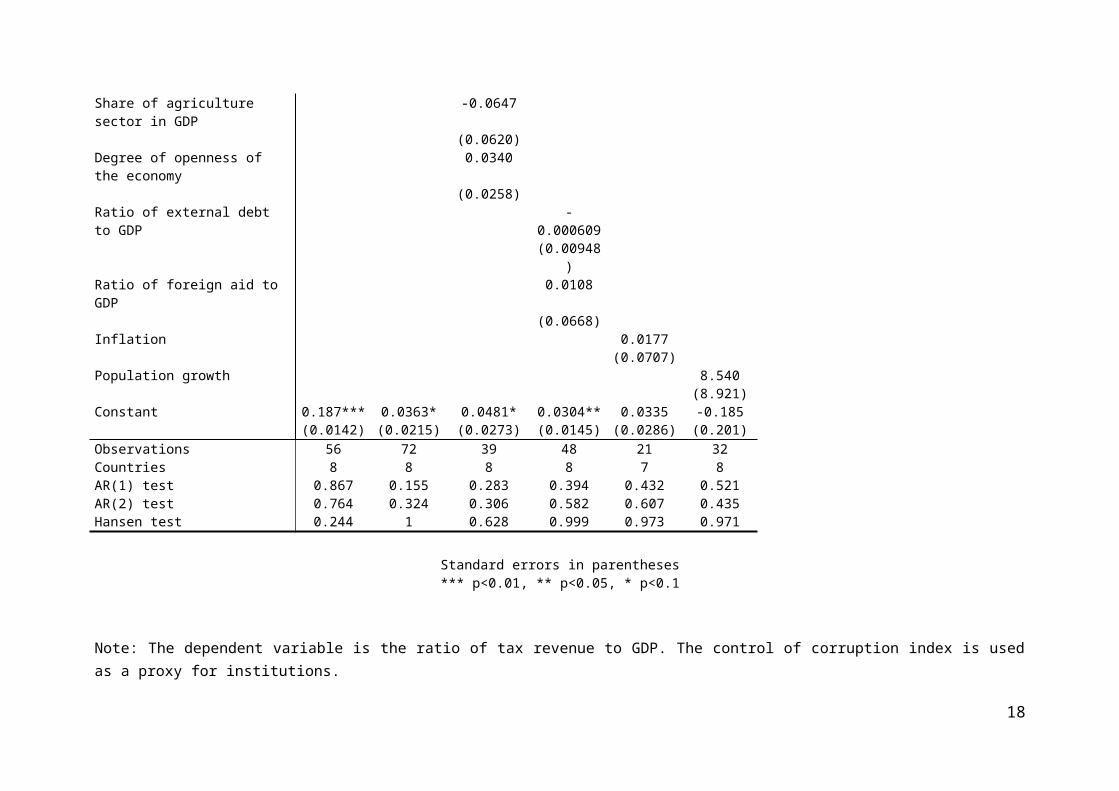
Table 4: Effect of institutions on tax revenue in WAEMU, 1996-2011, Control of corruption, Generalized Method of Moments (GMM)
VARIABLES (1) (2) (3) (4) (5) (6)Control of corruption 0.0905*** 0.0538* 0.0263** 0.0604* 0.0265** 0.0110**
(0.0262) (0.0300) (0.0114) (0.0330) (0.0131) (0.00489)Ratio of tax revenue to GDP: 1st lag 1.053*** 0.712*** 1.144*** 0.832*** 0.801**
(0.0935) (0.110) (0.187) (0.205) (0.325)Growth rate of per capita GDP 0.187
(0.181)Share of agriculture sector in GDP -0.0647
(0.0620)Degree of openness of the economy 0.0340
(0.0258)Ratio of external debt to GDP -0.000609
(0.00948)Ratio of foreign aid to GDP 0.0108
(0.0668)Inflation 0.0177
(0.0707)Population growth 8.540
(8.921)Constant 0.187*** 0.0363* 0.0481* 0.0304** 0.0335 -0.185
(0.0142) (0.0215) (0.0273) (0.0145) (0.0286) (0.201)Observations 56 72 39 48 21 32Countries 8 8 8 8 7 8AR(1) test 0.867 0.155 0.283 0.394 0.432 0.521AR(2) test 0.764 0.324 0.306 0.582 0.607 0.435Hansen test 0.244 1 0.628 0.999 0.973 0.971
Standard errors in parentheses*** p<0.01, ** p<0.05, * p<0.1
Note: The dependent variable is the ratio of tax revenue to GDP. The control of corruption index is used as a proxy for institutions.
13
Table 5: Effect of institutions on tax revenue in WAEMU, 1996-2011, Voice and accountability, Generalized Method of Moments (GMM)
VARIABLES (1) (2) (3) (4) (5) (6)Voice and accountability 0.0579* 0.0348** 0.0457* 0.0656*** 0.0455*** 0.0972*
(0.0343) (0.0136) (0.0256) (0.0190) (0.0152) (0.0506)Ratio of tax revenue to GDP: 1st lag 0.820*** 1.531*** 1.101 0.784*** 0.572**
(0.295) (0.540) (0.674) (0.169) (0.251)Growth rate of per capita GDP -0.0761
(0.251)Share of agriculture sector in GDP 0.0581
(0.0901)Degree of openness of the economy 0.0552
(0.0831)Ratio of external debt to GDP 0.00826
(0.0288)Ratio of foreign aid to GDP 0.0186
(0.122)Inflation 0.0127
(0.0379)Population growth 4.365
(2.698)Constant 0.142*** 0.0485 -0.106 0.00872 0.0589** -0.00752
(0.0149) (0.0501) (0.117) (0.108) (0.0237) (0.0545)Observations 104 48 40 40 56 56Countries 8 8 7 8 7 8AR(1) test 0.116 0.325 0.602 0.238 0.293 0.340AR(2) test 0.314 0.415 0.540 0.417 0.279 0.202Hansen test 0.989 0.987 1 0.308 1 1
Standard errors in parentheses*** p<0.01, ** p<0.05, * p<0.1
Note: The dependent variable is the ratio of tax revenue to GDP. The voice and accountability index is used as a proxy for institutions.
14
Table 6: Effect of institutions on tax revenue in WAEMU, 1996-2011, Government effectiveness, Generalized Method of Moments (GMM)
VARIABLES (1) (2) (3) (4) (5) (6)Government effectiveness 0.104** 0.0391* 0.0466** 0.0858*** 0.133** 0.0406**
(0.0407) (0.0202) (0.0181) (0.0157) (0.0559) (0.0172)Ratio of tax revenue to GDP: 1st lag 0.719** 0.712 1.494*** 0.349 1.008***
(0.322) (0.936) (0.529) (0.221) (0.228)Growth rate of per capita GDP 0.0731
(0.192)Share of agriculture sector in GDP -0.108
(0.599)Degree of openness of the economy 0.0573
(0.109)Ratio of external debt to GDP 0.0274
(0.0212)Ratio of foreign aid to GDP -0.0635
(0.0764)Inflation 0.126
(0.100)Population growth -5.798
(9.547)Constant 0.163*** 0.0779 0.0849 -0.00830 0.203** 0.196
(0.0109) (0.0583) (0.266) (0.0855) (0.0829) (0.281)Observations 24 48 43 40 49 56Countries 8 8 8 8 7 8AR(1) test 0.700 0.308 0.557 0.396 0.093 0.350AR(2) test 0.802 0.402 0.694 0.452 0.942 0.594Hansen test 0.554 1 1 0.192 1 1
Standard errors in parentheses*** p<0.01, ** p<0.05, * p<0.1
15

Note: The dependent variable is the ratio of tax revenue to GDP. The government effectiveness index is used as a proxy for institutions.
Table 7: Effect of institutions on tax revenue in WAEMU, 1996-2011, regulatory quality, Generalized Method of Moments (GMM)
VARIABLES (1) (2) (3) (4) (5) (6)Regulatory quality 0.0820* 0.0344** 0.144* 0.0194* 0.0312* 0.0897**
(0.0474) (0.0154) (0.0738) (0.0106) (0.0173) (0.0377)Ratio of tax revenue to GDP: 1st lag 1.175*** 1.658*** 0.981*** 1.116*** 0.450
(0.282) (0.498) (0.324) (0.200) (0.911)Growth rate of per capita GDP -0.00400
(0.153)Share of agriculture sector in GDP 0.0153
(0.130)Degree of openness of the economy 0.0673
(0.110)Ratio of external debt to GDP -0.0153
(0.0101)Ratio of foreign aid to GDP -0.0127**
(0.00598)Inflation -0.0379
(0.0467)Population growth 19.22
(56.56)Constant 0.166*** 0.00414 -0.0681 0.0454 0.0123 0.141
(0.0210) (0.0354) (0.0865) (0.0606) (0.0161) (0.145)Observations 104 56 40 40 49 32Countries 8 8 7 8 7 8AR(1) test 0.060 0.332 0.300 0.314 0.357 0.536AR(2) test 0.356 0.745 0.487 0.502 0.588 0.281Hansen test 0.973 1 1 1 1 1
Standard errors in parentheses*** p<0.01, ** p<0.05, * p<0.1
16

Note: The dependent variable is the ratio of tax revenue to GDP. The regulatory quality index is used as a proxy for institutions.
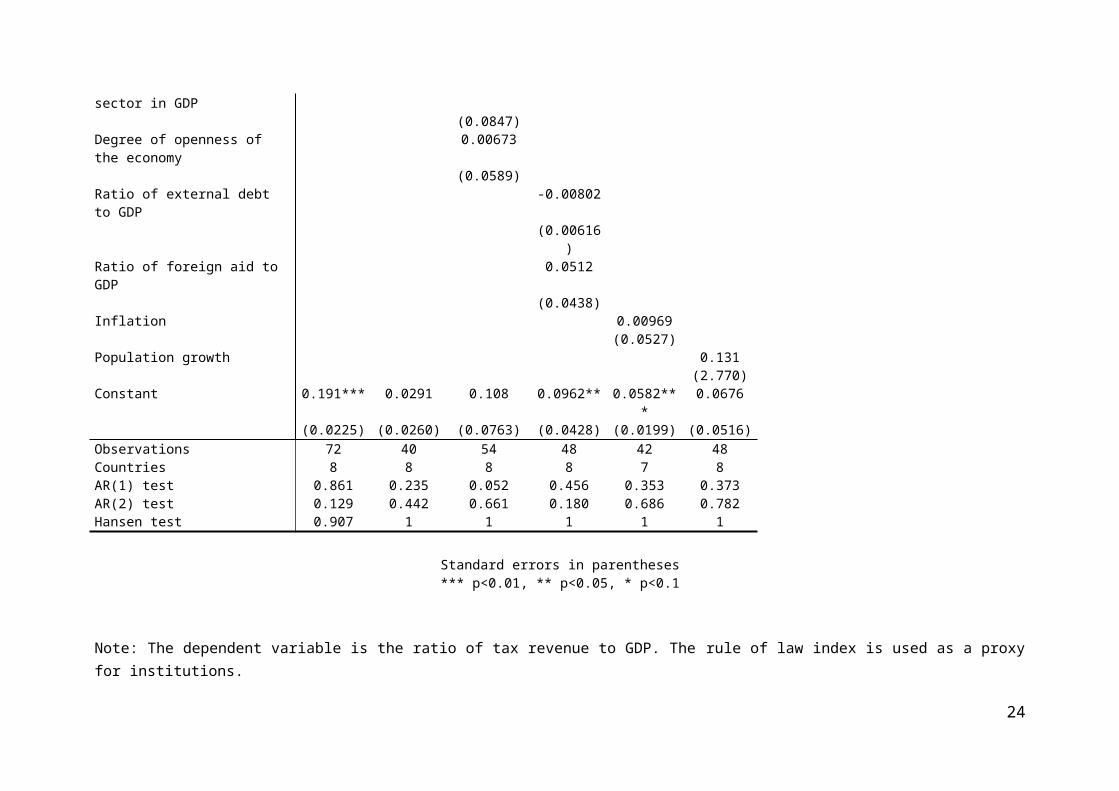
Table 8: Effect of institutions on tax revenue in WAEMU, 1996-2011, rule of law, Generalized Method of Moments (GMM)
VARIABLES (1) (2) (3) (4) (5) (6)Rule of law 0.0785** 0.0267* 0.0812* 0.193*** 0.0887** 0.106*
(0.0396) (0.0158) (0.0468) (0.0579) (0.0374) (0.0548)Ratio of tax revenue to GDP: 1st lag 0.983*** 0.954*** 1.342*** 1.128*** 1.097***
(0.157) (0.224) (0.394) (0.236) (0.163)Growth rate of per capita GDP 0.139
(0.111)Share of agriculture sector in GDP -0.154*
(0.0847)Degree of openness of the economy 0.00673
(0.0589)Ratio of external debt to GDP -0.00802
(0.00616)Ratio of foreign aid to GDP 0.0512
(0.0438)Inflation 0.00969
(0.0527)Population growth 0.131
(2.770)Constant 0.191*** 0.0291 0.108 0.0962** 0.0582*** 0.0676
(0.0225) (0.0260) (0.0763) (0.0428) (0.0199) (0.0516)Observations 72 40 54 48 42 48Countries 8 8 8 8 7 8AR(1) test 0.861 0.235 0.052 0.456 0.353 0.373AR(2) test 0.129 0.442 0.661 0.180 0.686 0.782Hansen test 0.907 1 1 1 1 1
Standard errors in parentheses*** p<0.01, ** p<0.05, * p<0.1
17
Note: The dependent variable is the ratio of tax revenue to GDP. The rule of law index is used as a proxy for institutions.
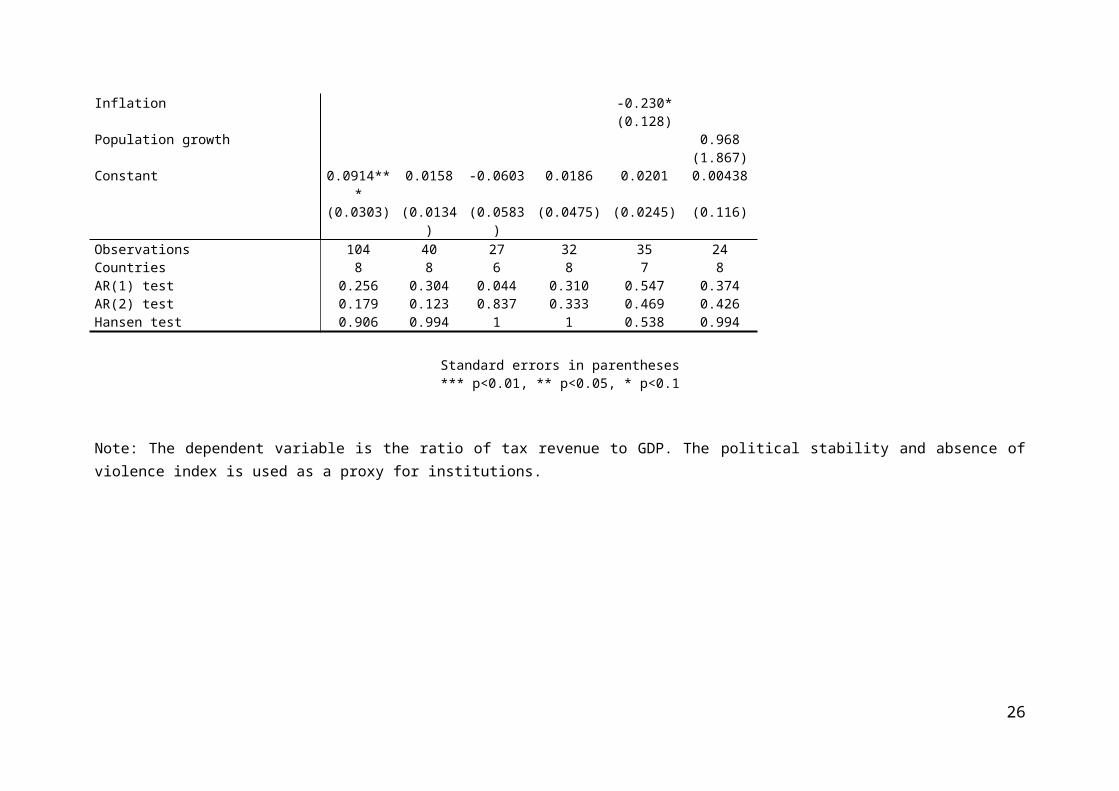
Table 9: Effect of institutions on tax revenue in WAEMU, 1996-2011, political stability and absence of violence, Generalized Method of Moments (GMM)
VARIABLES (1) (2) (3) (4) (5) (6)Political stability and absence of violence 0.0946*** 0.0147* 0.0150** 0.00803* 0.0114* 0.0160*
(0.0282) (0.00831) (0.00723) (0.00434) (0.00645) (0.00962)Ratio of tax revenue to GDP: 1st lag 0.951*** 0.948*** 0.885*** 1.029*** 0.858
(0.0913) (0.180) (0.253) (0.160) (0.538)Growth rate of per capita GDP 0.148***
(0.0531)Share of agriculture sector in GDP 0.162
(0.120)Degree of openness of the economy 0.0430
(0.0304)Ratio of external debt to GDP 0.00416
(0.0164)Ratio of foreign aid to GDP 0.0129
(0.104)Inflation -0.230*
(0.128)Population growth 0.968
(1.867)Constant 0.0914*** 0.0158 -0.0603 0.0186 0.0201 0.00438
(0.0303) (0.0134) (0.0583) (0.0475) (0.0245) (0.116)Observations 104 40 27 32 35 24Countries 8 8 6 8 7 8AR(1) test 0.256 0.304 0.044 0.310 0.547 0.374AR(2) test 0.179 0.123 0.837 0.333 0.469 0.426Hansen test 0.906 0.994 1 1 0.538 0.994
Standard errors in parentheses
18
*** p<0.01, ** p<0.05, * p<0.1
Note: The dependent variable is the ratio of tax revenue to GDP. The political stability and absence of violence index is used as a proxy for institutions.
19
6. Conclusion and policy implications
This research has explored the effect of institutions on tax revenue performance in WAEMU. WAEMU countries have experienced persistent fiscal deficits and over-dependence on foreign sources of revenues in the period 1970 to 2011, showing the importance of the issue of domestic resources mobilization in this zone. In this period, on average the ratio of tax revenue to GDP for the WAEMU countries is found to be low with 7.5%. With the evolution of tax revenue in the same period, WAEMU countries as a whole have met the convergence criterion related to a tax revenue to GDP ratio higher than 17% only two times, in 2008 and in 2011. The computations show that tax revenue in WAEMU is not only low, but also volatile. WAEMU countries have thus persistent difficulties to meet the convergence criterion regarding a ratio of tax revenue to GDP higher than 17% annually for all member states. At the same time, the quality of institutions is declining in this zone. The deterioration of the quality of institutions can then be an important cause of poor tax revenue performance in WAEMU, as various studies have explained that collection of tax revenue is one of the important areas where corruption is most likely to arise.
By investigating econometrically the effect of institutions on tax revenue, this paper finds that the weak institutions in WAEMU have contributed to reduce significantly tax revenue performance in this zone. Institutions have thus played an important role in explaining why WAEMU countries have persistent difficulties to meet the convergence criterion related to the tax revenue performance.
The key implication of these results is that strong institutions are crucial for a greater performance of tax revenue in WAEMU. This implies thus that strong institutions contribute significantly to help WAEMU countries to meet the convergence criterion related to the tax revenue performance.
References
Aamir, M., A. Qayyum, A. Nasir, S. Hussain, K. I. Khan, S. Butt (2011) “Determinants of Tax Revenue: A Comparative Study of Direct taxes and Indirect taxes of Pakistan and India”, International Journal of Business and Social Science, Vol. 2 No. 19 [Special Issue - October 2011].
Acemoglu, Daron, Simon Johnson, and James A. Robinson (2001) “The Colonial Origins of Comparative Development: An Empirical Investigation,” American Economic Review, Vol. 91, No. 5 (December), pp. 1369–401.
Agbeyegbe, T, Stortsky, J. G., and Woldermariam, A. (2004) “Trade liberalization, exchange rate changes, and tax revenue in Sub-Sahara Africa”, IMF Working Paper, no. WP/04/178. Washington D.C.
Ajaz, T. and E. Ahmad (2010) “The Effect of Corruption and Governance on Tax Revenues”, The Pakistan Development Review, 49:4, Part II, pp. 405–417.
Alesina, A., Devleeschauwer, A., Easterly, W., Kurlat, S., Wacziarg, R. (2003) “Fractionalization”, Journal of Economic Growth 8: 155-194.
Alm, J., R. W. Bahl, and M. N. Murrey (1991) “Tax Base Erosion in Developing Countries”, Journal of Economic Development and Cultural Change, 39:4, 849–72.
Ariyo, A. (1997) “Productivity of the Nigerian Tax System: 1970 – 1990”, African Economic Research Consortium, Research paper No. 67. Nairobi.
20
Attila, Joseph Gpewopo, Gérard Chambas and Jean Louis Combes (2008) “Corruption et Mobilisation des Recettes Publiques: Une Analyse Économétrique”, Recherche Economique de Louvain.
BCEAO, Economic and Financial Database (Online Edition)BCEAO (2013) « Evolution des investissements directs étrangers dans les pays de l'UEMOA au cours
de la période 2000-2011 », BCEAOBenedek, D. E. Crivelli, S. Gupta, and P. Muthoora (2012) “Foreign Aid and Revenue: Still a
Crowding Out Effect?”, IMF Working Paper WP/12/186.Bird, R. M. (1990) “Expenditures, Administration and Tax Reform in Developing Countries”, Bulletin
for International Tax Documentation, 44, 263–267.Bird, R. M. (1992) “Tax Policy and Economic Development”, Baltimore and London: The Johns
Hopkins University Press.Bird, R. M., J. Martinez-Vasquez, and B. Torgler (2006) “Societal Institutions and Tax Effort in
Developing Countries”, in: J. Alm and J. Martinez-Vazquez (eds.), The Challenge of Tax Reform in the Global Economy. Springer-Verlag.
Bird, R. M. and E. M. Zolt (2008) “Technology and Taxation in Developing Countries: From Hand to Mouse”, UCLA Law Review 52:6, 1627–95.
Bornhorst, F. S. Gupta, and J. Thornton (2008) “Natural Resource Endowments, Governance and the Domestic Revenue Effort: Evidence from a Panel of Countries”, Fiscal Affairs Department. (IMF Working Paper WP/08/170).
Bornhorst, F, Gupta, SA and Thornton, J. (2009) “Natural Resource Endowments and the Domestic Revenue Effort”, Economic Journal of Political Economy, vol. 25, pp. 439-46.
Botlhole, T. D. (2010) “Tax Effort and the Determinants of Tax Ratio in Sub-Sahara Africa”, International Conference on Applied Economics – ICOAE 2010.
Botlhole, T. D. (2011) “Natural Resources, Institutions and Tax Revenue Mobilization in Sub-Sahara Africa”, International Conference on Applied Economics – ICOAE 2011.
Brautigam, D., and S. Knack, 2004, “Foreign Aid, Institutions, and Governance in Sub-Saharan Africa,” Economic Development and Cultural Change, Vol. 52(2), pp. 255–85, January.
Davoodi, HR and Grigorian, DA (2007) “Tax Potential vs. Tax Effort: A Cross-Country Analysis of Armenia's Stubbornly Low Tax Collection”, IMF Working Paper, vol. WP/07/106.
Dioda, L. (2012) “Structural Determinants of Tax Revenue in Latin America and the Caribbean, 1990-2009”, Economic Development Unit, Economic Commission for Latin America and the Caribbean (ECLAC), Subregional Headquarters in Mexico, United Nations.
Drummond, P. W. Daal, N. Srivastava, L. E. Oliveira (2012) “Mobilizing Revenue in Sub-Saharan Africa: Empirical Norms and Key Determinants”, IMF Working Paper, WP/12/108.
Ebeke, C. H. (2010) “Remittances, Value Added Tax and Tax Revenue in Developing Countries”, Document de travail de la série Etudes et Documents E 2010.30, CERDI.
Edwards, S. (1998) “Openness, productivity and growth: what do we really know?”, Economic Journal, vol. 108, pp. 383-98.
Eltony, M. N. (2002) “The Determinants of Tax Effort in Arab Countries”, API Publications, Kuwait.Felix, R. A. (2008) “The Growth and Volatility of State Tax Revenue Sources in the Tenth District”,
Federal Reserve Bank of Kansas City.Fjeldstad, Odd-Helge and Bertil Tungodden (2001) “Fiscal Corruption: A Vice or a Virtue?”, CMI
Working Paper WP 2001:13.Frankel, J. (1999) “Does trade cause growth?”, American Economic Review, vol. 89, pp. 379-99.Galtung, F. (1995) “Current Strategies for Combating Corruption: A Study of Corruption in the Tax
Administration”, Berlin: Transparency International. (Occasional Working Paper 8:95).Ghai, D. (1965) “Income Elasticity of the Ugandan Tax Structure”, A Dissertation presented to the
faculty of the Graduate School of Yale University for a Ph.D. Degree.
21
Ghura, D. (1998) “Tax Revenue in Sub-Saharan Africa: Effects of Economic Policies and Corruption”, IMF Working Paper WP/98/135.
Gupta, A. S. (2007) “Determinants of Tax Revenue Efforts in Developing Countries”, IMF Working Paper WP/07/184.
Hall, R. E. and C. I. Jones (1999) “Why do some countries produce so much more output per worker than others?”, Quarterly Journal of Economics.
Imam, P. A. and D. F. Jacobs (2007) “Effect of Corruption on Tax Revenues in the Middle East”, IMF Institute and Fiscal Affairs Department. (IMF Working Paper No.07/270).
IMF (2011) « Mobilisation des recettes dans les pays en développement », Public Finance Department.IMF, Direction of Trade Statistics 2012 (Online Edition)Keen, M. (2012) “Taxation and Development—Again”, IMF Working Paper, WP/12/220.Krugman, P. R., J. Alm, S. M. Collins, and E. Remolina (1992) “Transforming the Philippine
Economy”, Quezon City: APO Production Unit, Inc.LaPorta, R., Lopez-de-Silanes, F., Shleifer, A., Vishny, R. (1999) “The quality of government”,
Journal of Law, Economics and Organization 15, 222-279.Leuthold, J. H. (1991), “Tax Shares in Developing Economies: A Panel Study”, Journal of
Development Economics, vol. 35, no. 1, pp. 173-85.Li, J. (1997) “Counteracting Corruption in the Tax Administration in Transitional Economies: A Case
Study of China”, Bulletin of the International Bureau of Tax Documentation 51, 474–492.Lucotte, Y. (2010) “Adoption of Inflation Targeting and Tax Revenue Performance in Emerging
Market Economies: An Empirical Investigation”, Laboratoire d’Economie d’Orléans, Université d’Orléans, CNRS.
Mahdavi, S. (2008) “The level and composition of tax revenue in developing countries: Evidence from unbalanced panel data”, International Review of Economics and Finance, no. 17, pp. 607-17.
McArthur, J. W. and Sachs, J .D. (2001) “Institutions and Geography: Comment on Acemoglu, Johnson and Robinson”, National Bureau of Economic Research (Cambridge, MA) Working Paper No. 8114, February.
Minea, A., Villieu, P. (2009) “Can inflation targeting promote institutional quality in developing countries?”, The 26th Symposium on Money, Banking and Finance, University of Orléans, 25-26 June 2009.
Muriithi M. K. and E. D. Moyi (2003) “Tax Reforms and Revenue Mobilization in Kenya”, African Economic Research Consortium, Research Paper 131, Nairobi.
Ole, A.M. (1975) “Income Elasticity of Tax Structure in Kenya: 1962/63-1972/73”, Unpublished. M.A Research Paper, University of Nairobi.
Osoro, N.E. (1993) “Revenue Productivity Implications of Tax Reform in Tanzania”, African Economic Research Consortium, Research Paper No. 20, Nairobi.
Osoro, N.E. (1995) “Tax Reforms in Tanzania: Motivations, Directions and Implications”, African Economic Research Consortium, Research paper No. 38. Nairobi.
Remmer, K., 2004, “Does Foreign Aid Promote the Expansion of Government?” American Journal of Political Science, 48(1), 77–92.
Richupan, S. (1984) “Income Tax Evasion: A Review of the Measurement of Techniques and Some Estimates for the Developing Countries”, Washington, DC: The International Monetary Fund. (Department Memorandum No. DM/84/46).
Stiglitz, Joseph E., 2010, “Development-Oriented Tax Policy,” in Taxation in Developing Countries: Six Case Studies and Policy Implications, ed. by Roger Gordon, pp. 11–36 (New York: Columbia University Press).
22

Tanzi, V. (1992), “Structural Factors and Tax Revenue in Developing Countries: A Decade of evidence in Open Economies”, Cambridge University Press, Cambridge, pp. 267-81.
Tanzi, and Zee (1997) “Fiscal Policy and Long-Run Growth”, IMF Staff Papers, Vol. 44, p.179-209.Tanzi, Vito (1999) “Uses and Abuses of Estimates of the Underground Economy”, The Economic
Journal 109, 388.Tanzi, Vito (2000) “Taxation in Latin America in the Last Decade”, Centre for Research on Economic
Development and Policy Reforms. Stanford University. (Working Paper No. 76).Toye, J. and M. Moore (1998) “Taxation, Corruption and Reform”, European Journal of Development
Research, 10, 60–84.UNECA (2010) “Mobilizing Domestic Tax Revenues for Development in Africa”, ECA Policy Brief,
N°. 001.United Nations (2005) Investing in Development (New York: United Nations).Wawire, N. H. W. (1991) “An Empirical Assessment of Tax Performance in Kenya: 1958 – 1989”,
M.A. Research Paper, Kenyatta University.Wawire, N. H. W. (2000) “Revenue Productivity Implications of Kenya’s Tax System”, in Kwaa Prah,
K. and A. G. M. Ahmed (Ed.). Africa in Transformation. Political and Economic Issues. Vol. 1 Chapter 6. Addis Ababa: OSSREA, Pp. 99 - 106.
Wawire, N. H. W. (2003). “Trends in Kenya’s Tax Ratios and Tax Effort Indices, and Their Implication for Future Tax Reforms” in Illieva E. V. (Ed.) Egerton Journal, 4, 256 – 279.
Wawire (2011) “Determinants of Value Added Tax Revenue in Kenya”, paper presented at the 2011 CSAE conference at St Catherine's College.
Wilford, S.D. and W.T. Wilford. (1978a). "Estimates of Revenue Elasticity and Buoyancy in Central America: 1955- 1974" in Toye, J.F.J (Ed.), Taxation and Economic Development. London: Frank Cass & Co. Ltd. Pp. 83 - 100.
Wilford, S.D and W.T. Wilford, (1978b). "On Revenue Performance and Revenue-Income Stability in the Third World", Economic Development and Cultural Change, 26, 505 - 523.
World Bank, Africa Development Indicators 2012 (Online Edition World Bank, Global Development Finance 2012 (Online Edition)World Bank, World Development Indicators 2012 (Online Edition)World Bank, Worldwide Governance Indicators (WGI) 2012 (Online Edition)
23
Annex
Annex 1: Figure A.1.: Evolution of fiscal balance in WAEMU
Source: Author’s computations using data from: BCEAO, Economic and Financial Database (Online Edition in www.bceao.int).
24

Annex 2: Table A.1.: Convergence criteria in WAEMU
Indicators CriteriaRatio of budget balance to nominal GDP Positive or equal 0Annual mean inflation rate Smaller than 3% or equal 3%Ratio of total public debt stock to nominal GDP Smaller than 70% or equal 70%Internal and external overdue Non-accumulationRatio of wage bill to tax revenue Smaller than 35% or equal 35%Ratio of investment financed via domestic resources to tax revenue
Higher than 20% or equal 20%
Ratio of external current balance to nominal GDP Higher than -5% or equal -5%Ratio of tax revenue to GDP Higher than 17% or equal 17%
Source: WAEMU Commission
25
Annex 3: Table A.2.: Definition and sources of variables
Variables Definition SourcesDEPENDENT VARIABLES
Tax revenue Ratio of tax revenue to GDP BCEAO, Economic and Financial Database (Online Edition in www.bceao.int) VARIABLE OF IMPACT
Institutions Constraints on the executive power that take values ranging from 1 (unlimited executive authority) to 7 (executive parity or subordination); Voice and accountability, political stability and absence of violence, Government effectiveness, regulatory quality, rule of law, and control of corruption. These six World Bank governance indicators take value that range from approximately -2.5 (weak governance performance) to 2.5 (strong governance performance)
Polity IV Project Dataset for the constraints on the executive power; World Bank, Worldwide Governance Indicators (WGI) for voice and accountability, political stability and absence of violence, Government effectiveness, regulatory quality, rule of law, and control of corruption
CONTROL VARIABLESThe level of economic development
Growth rate of per capita GDP World Bank, World Development Indicators 2012 (Online Edition); World Bank, Africa Development Indicators 2012 (Online Edition)
Tax base Share of agriculture sector in GDP, degree of openness of the economy (ratio of exports plus imports to GDP)
World Bank, World Development Indicators 2012 (Online Edition); World Bank, Africa Development Indicators 2012 (Online Edition); IMF, Direction of Trade Statistics 2012 (Online Edition)
External environment Ratio of external debt to GDP, ratio of foreign aid to GDP
World Bank, World Development Indicators 2012 (Online Edition); World Bank, Africa Development Indicators 2012 (Online Edition); World Bank, Global Development Finance 2012 (Online Edition)
Macroeconomic instability Inflation (change in the consumer price index)
World Bank, World Development Indicators 2012 (Online Edition); World Bank, Africa Development Indicators 2012 (Online Edition)
Socio demographic indicators Population growth World Bank, World Development Indicators 2012 (Online Edition); World Bank, Africa Development Indicators 2012 (Online Edition)
26