Embed Size (px)
Citation preview
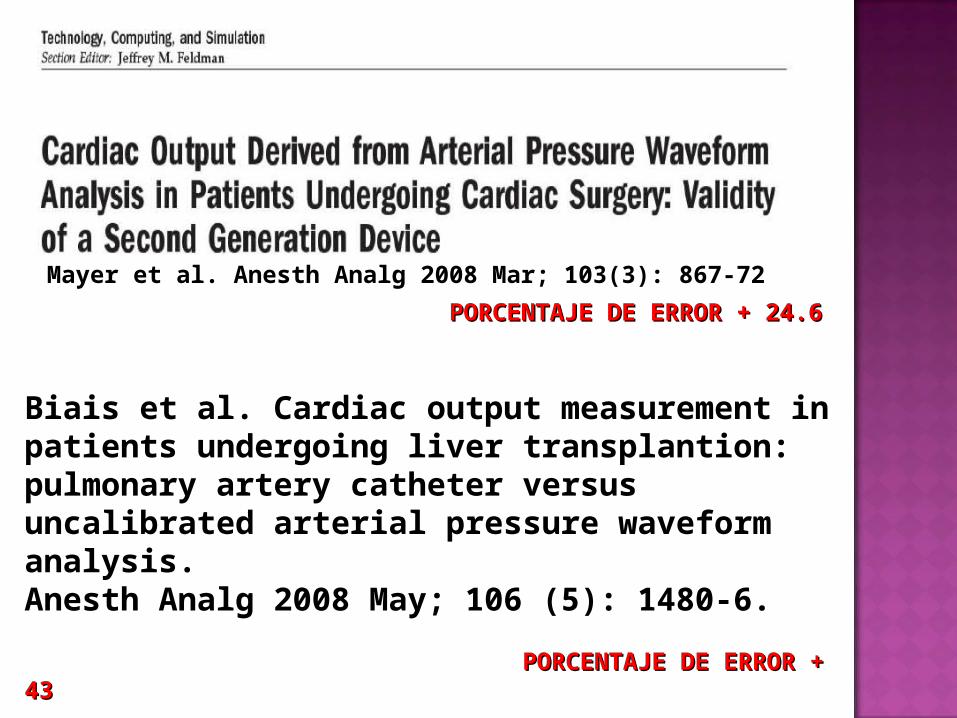
PORCENTAJE DE ERROR + 24.6PORCENTAJE DE ERROR + 24.6
Biais et al. Cardiac output measurement in patients undergoing liver transplantion:pulmonary artery catheter versus uncalibrated arterial pressure waveform analysis.Anesth Analg 2008 May; 106 (5): 1480-6.
PORCENTAJE DE ERROR + 43PORCENTAJE DE ERROR + 43
Mayer et al. Anesth Analg 2008 Mar; 103(3): 867-72
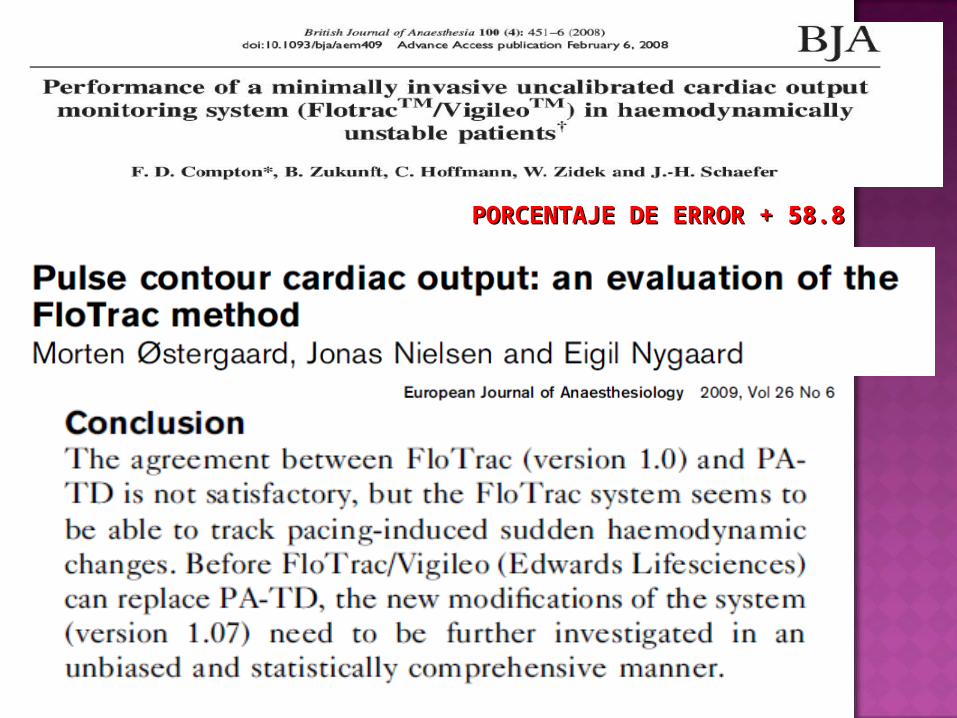
PORCENTAJE DE ERROR + 58.8PORCENTAJE DE ERROR + 58.8

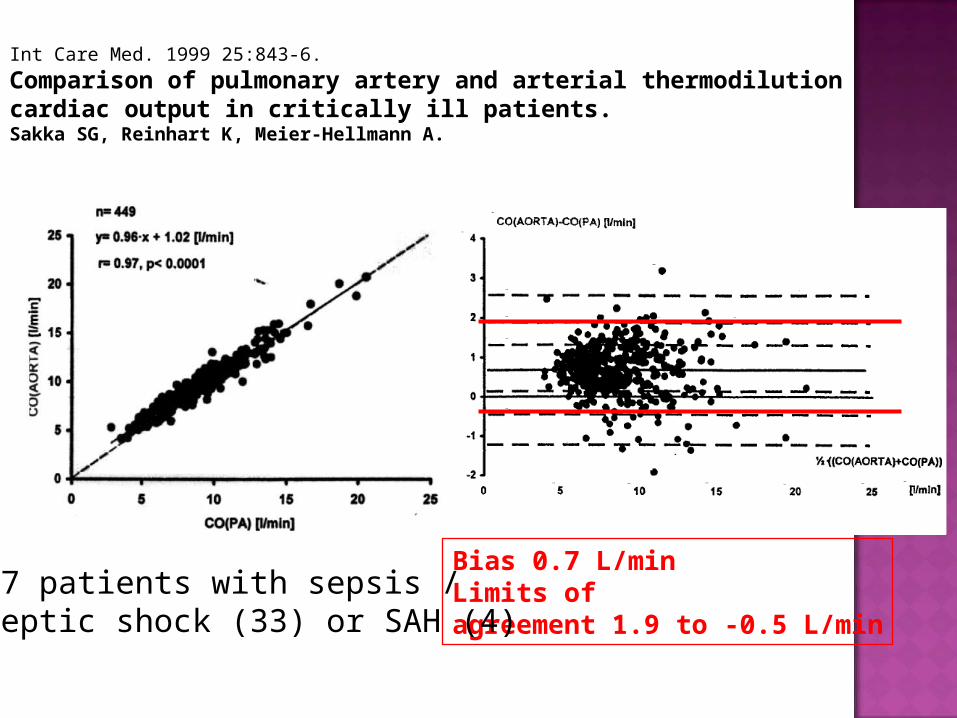
Int Care Med. 1999 25:843-6.
Comparison of pulmonary artery and arterial thermodilution cardiac output in critically ill patients. Sakka SG, Reinhart K, Meier-Hellmann A.
Bias 0.7 L/minLimits of agreement 1.9 to -0.5 L/min
37 patients with sepsis / septic shock (33) or SAH (4)
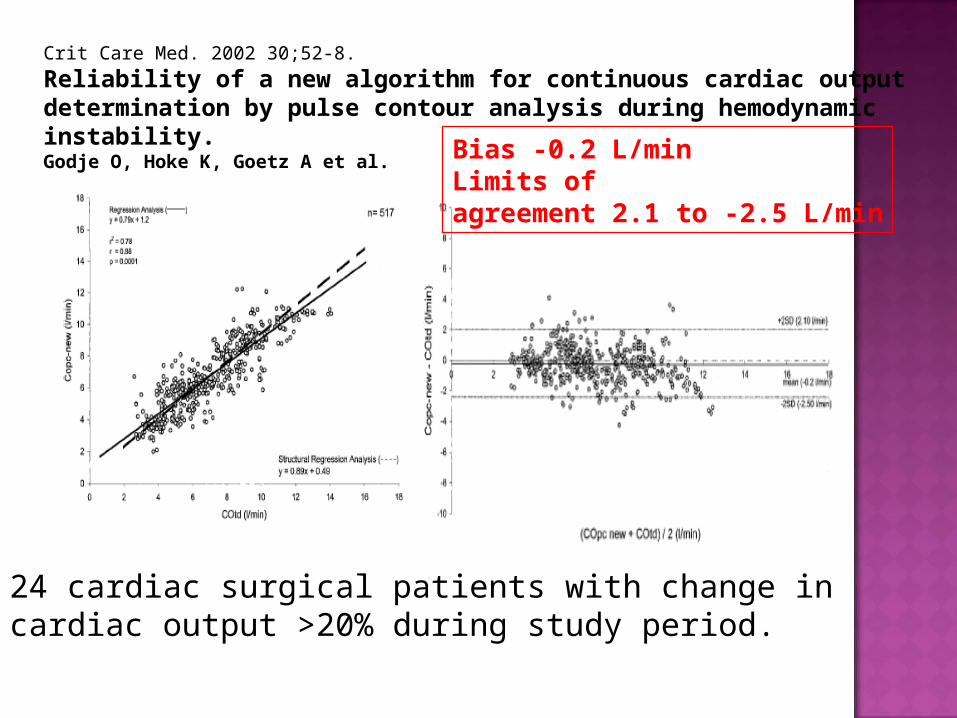
Crit Care Med. 2002 30;52-8.
Reliability of a new algorithm for continuous cardiac output determination by pulse contour analysis during hemodynamic instability. Godje O, Hoke K, Goetz A et al.
24 cardiac surgical patients with change in cardiac output >20% during study period.
Bias -0.2 L/minLimits of agreement 2.1 to -2.5 L/min
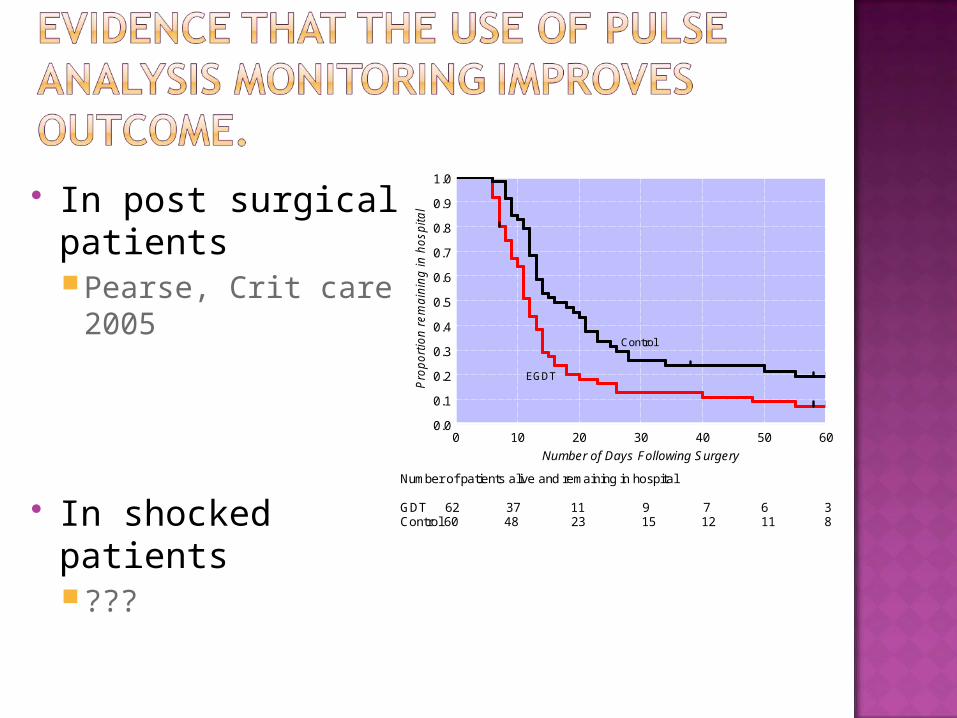
In post surgical patientsPearse, Crit care
2005
In shocked patients???
0 10 20 30 40 50 600.0
0.1
0.2
0.3
0.4
0.5
0.6
0.7
0.8
0.9
1.0
Control
EGDT
Number of patients alive and remaining in hospital
GDT 62 37 11 9 7 6 3Control 60 48 23 15 12 11 8
Number of Days Following Surgery
Pro
po
rtio
n r
em
ain
ing
in h
osp
ital
Yes, (level of evidence, C) but it depends….
Not all monitors are the same. In stable patients they perform to a clinically
acceptable level and have other advantages. Continuous data Less invasive Offer other variables.
In shocked patients the evidence is less clear.
Are the pulse analysis techniques as accurate as the PAC for monitoring CO?
Dr Andrew Rhodes . St George’s Hospital. London
No.But we should recommend more studies
evaluating the performance and efficacy of these monitors in shocked patients.
Can we recommend this new technology as an alternative to the PAC in shock?
DETERMINAR LA CAPACIDAD/HABILIDAD DE CIpc (PiCCO) Y CIpw (VIGILEO), EN REGISTRAR/ DETECTAR CAMBIOS EN CItd INDUCIDOS POR EXPANSION DE VOLUMEN O POR N.A EN SEPSIS GRAVE.
El análisis de la forma de la onda de presión no calibrada (vigileo), puede no reflejar los cambios en el gasto cardiaco, en condiciones de grandes variaciones en el tono arterial, especialmente en pacientes en estado hiperdinámico.
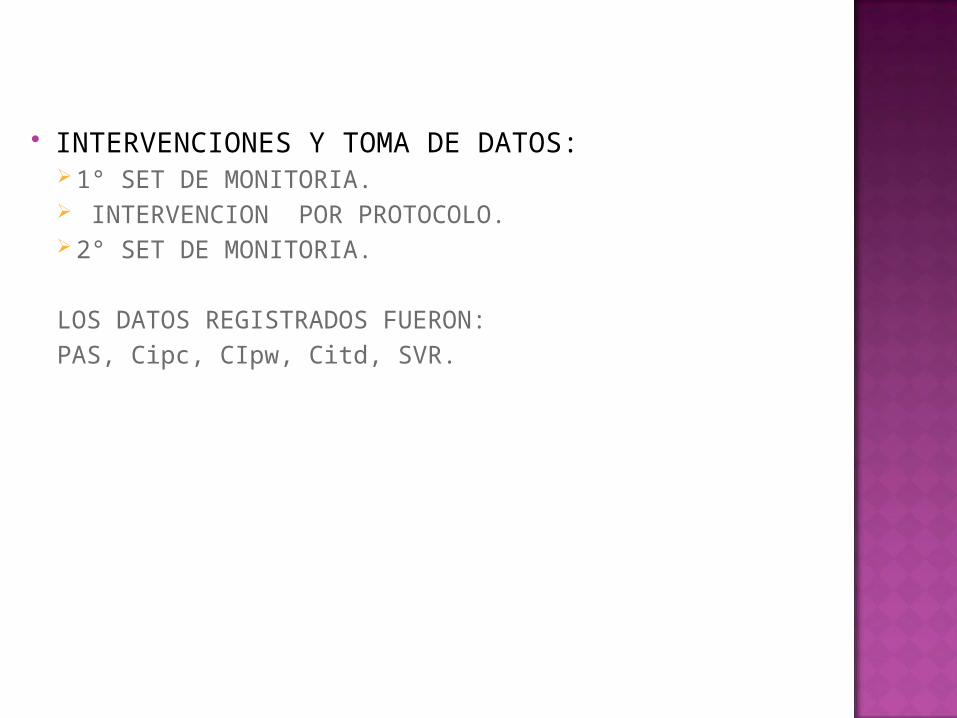
INTERVENCIONES Y TOMA DE DATOS: 1° SET DE MONITORIA. INTERVENCION POR PROTOCOLO. 2° SET DE MONITORIA.
LOS DATOS REGISTRADOS FUERON:PAS, Cipc, CIpw, Citd, SVR.
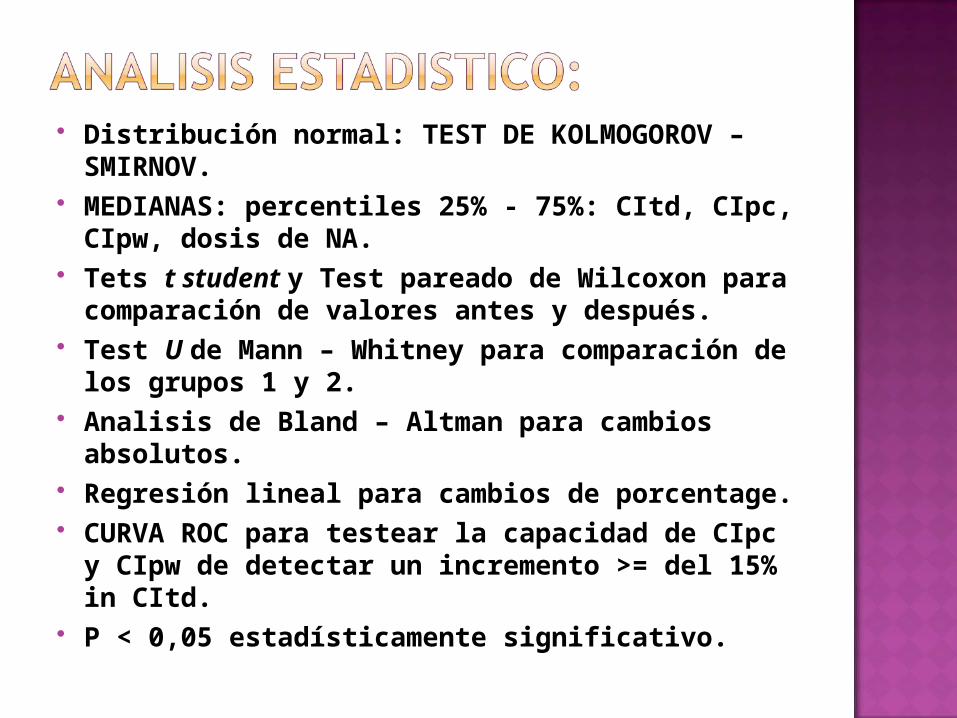
Distribución normal: TEST DE KOLMOGOROV – SMIRNOV.
MEDIANAS: percentiles 25% - 75%: CItd, CIpc, CIpw, dosis de NA.
Tets t student y Test pareado de Wilcoxon para comparación de valores antes y después.
Test U de Mann – Whitney para comparación de los grupos 1 y 2.
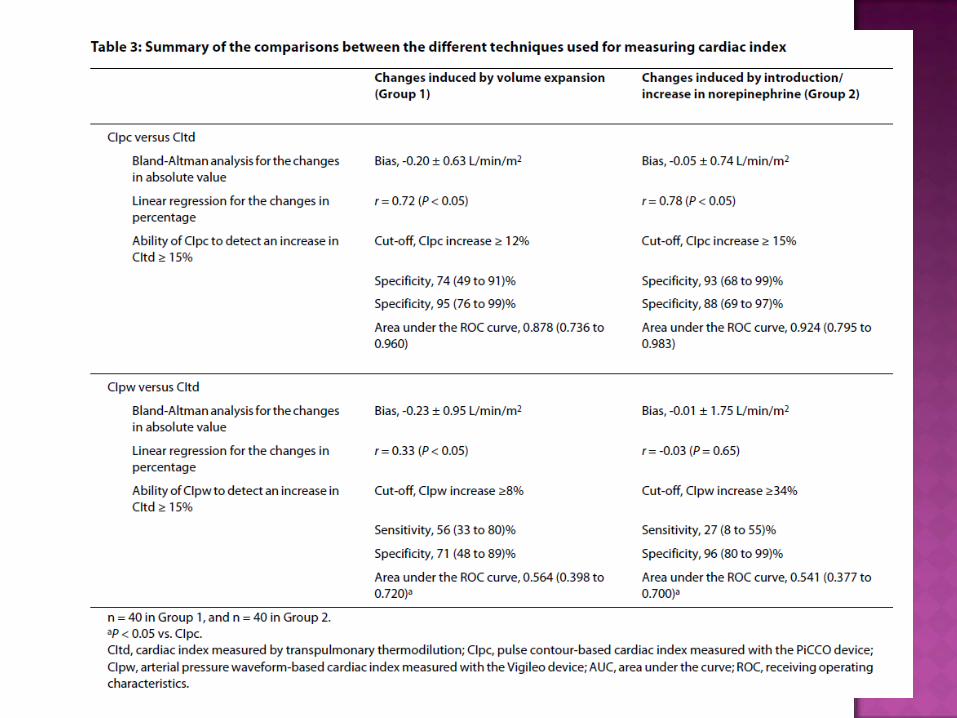
Analisis de Bland – Altman para cambios absolutos.
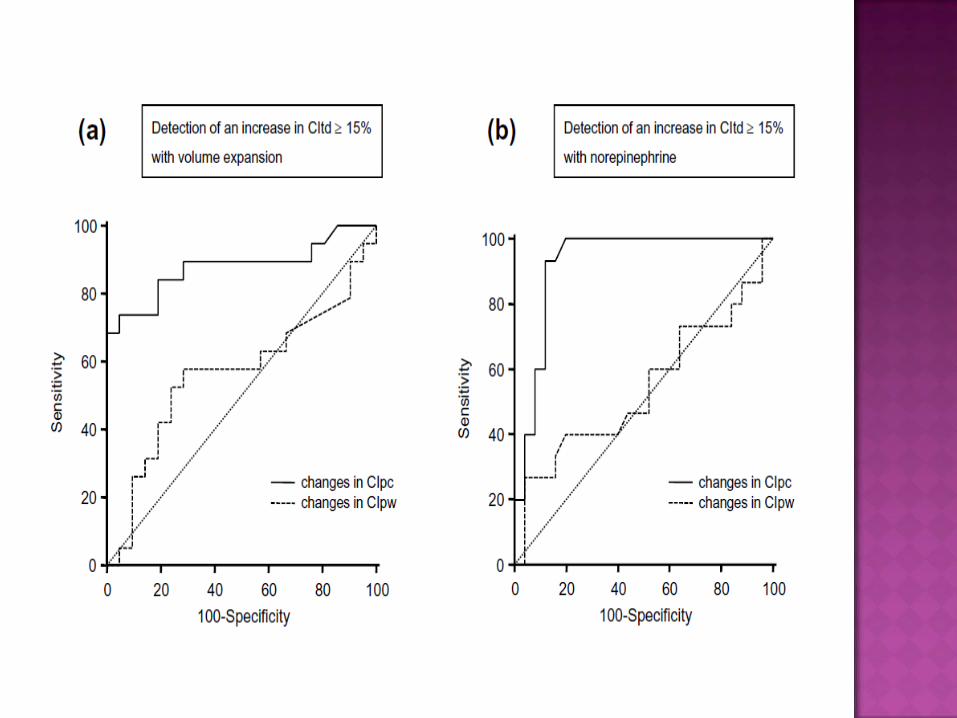
Regresión lineal para cambios de porcentage. CURVA ROC para testear la capacidad de CIpc
y CIpw de detectar un incremento >= del 15% in CItd.
P < 0,05 estadísticamente significativo.
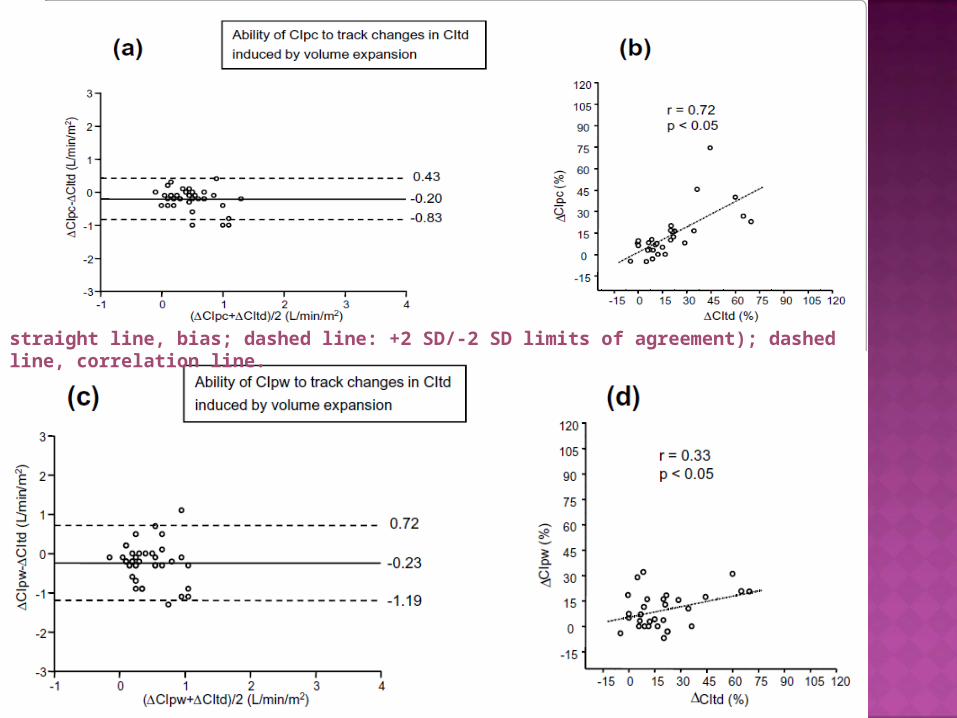
straight line, bias; dashed line: +2 SD/-2 SD limits of agreement); dashed line, correlation line.
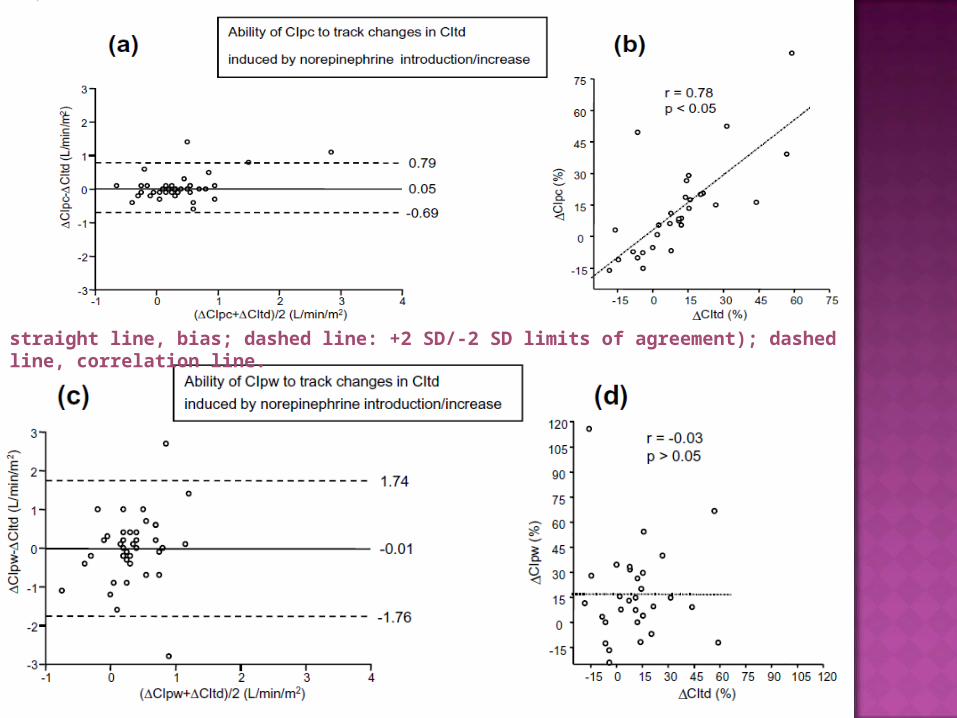
straight line, bias; dashed line: +2 SD/-2 SD limits of agreement); dashed line, correlation line.

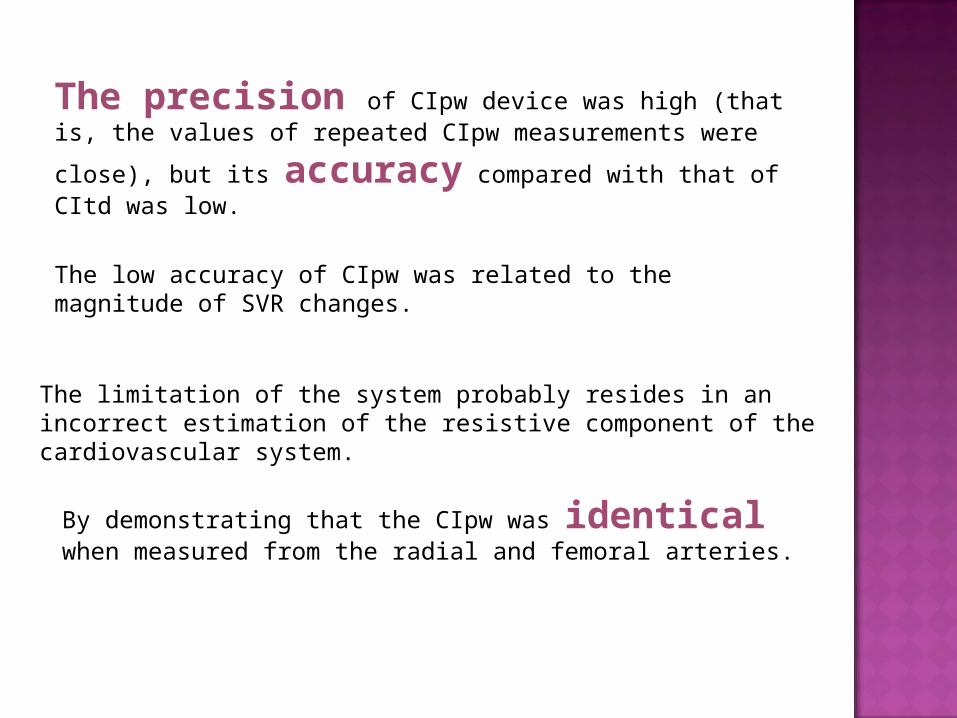
The precision of CIpw device was high (that is, the values of
repeated CIpw measurements were close), but its accuracy compared with that of CItd was low.
The low accuracy of CIpw was related to the magnitude of SVR changes.
The limitation of the system probably resides in an incorrect estimation of the resistive component of the cardiovascular system.
By demonstrating that the CIpw was identical when measured from the radial and femoral arteries.
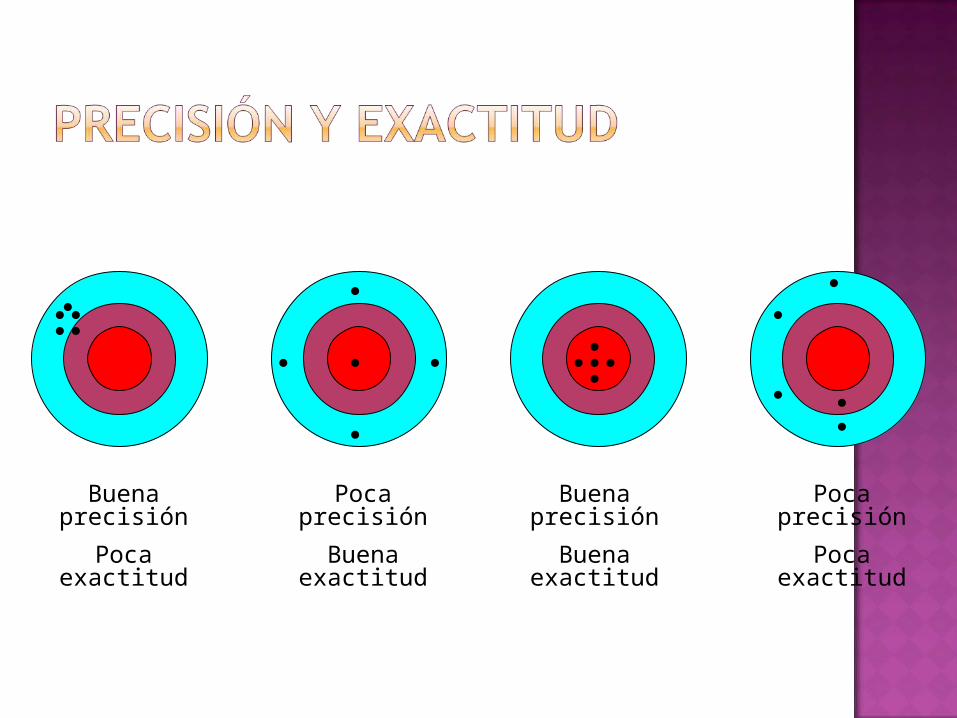
Buena precisión
Poca exactitud
Poca precisión
Buena exactitud
Buena precisión
Buena exactitud
Poca precisión
Poca exactitud


PELIGROSAMEPELIGROSAMENTE NTE
PRECISO!!!!PRECISO!!!!

INEXPERTO CON INEXPERTO CON EL ARCO Y LA EL ARCO Y LA
FLECHA.FLECHA.AZAR.AZAR.

PRECISOPRECISOYY
EXACTO.EXACTO.
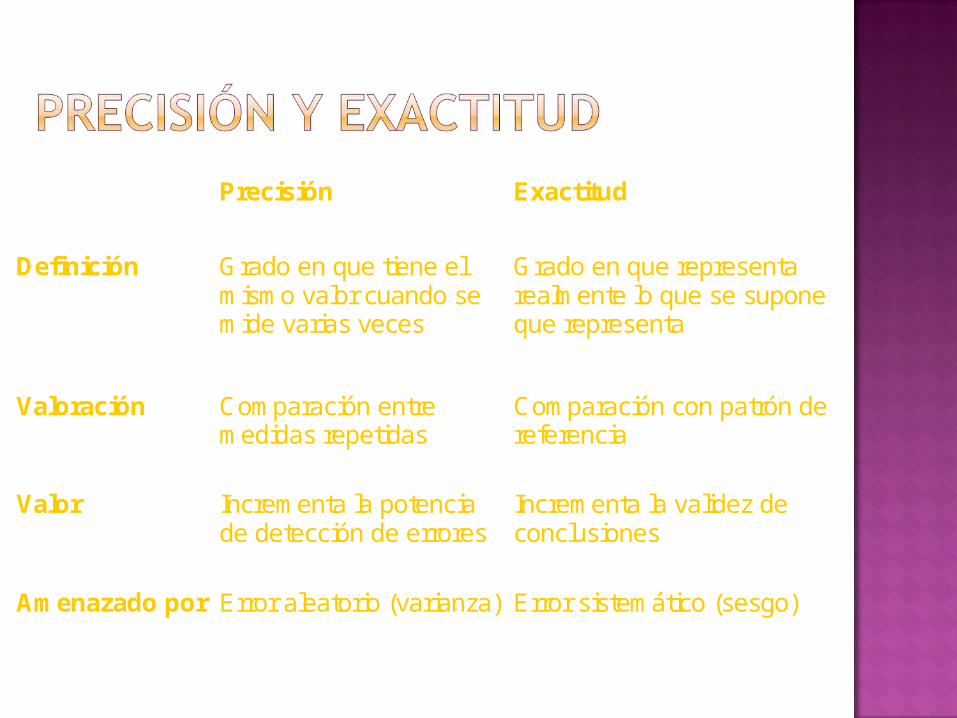
Precisión Exactitud
Definición Grado en que tiene el mismo valor cuando se mide varias veces
Grado en que representa realmente lo que se supone que representa
Valoración Comparación entre medidas repetidas
Comparación con patrón de referencia
Valor Incrementa la potencia de detección de errores
Incrementa la validez de conclusiones
Amenazado por Error aleatorio (varianza) Error sistemático (sesgo)