Embed Size (px)
Citation preview
VII. Green Waste ADC vs. Composting
Attachment 1: County Sanitation Districts’ Evaluation of Green
Waste (GW) Management Impacts on Greenhouse Gas Emission (GHG):
Alternative Daily Cover(ADC) Compared with Composting
VII. Green Waste ADC vs. Composting
Attachment 2: County Sanitation Districts Letter to CIWMB on
Comparison of the Use of Green Waste as Alternative Daily Cover (ADC) vs. Composting:
Greenhouse Gas Emission (GHG) Impacts
1
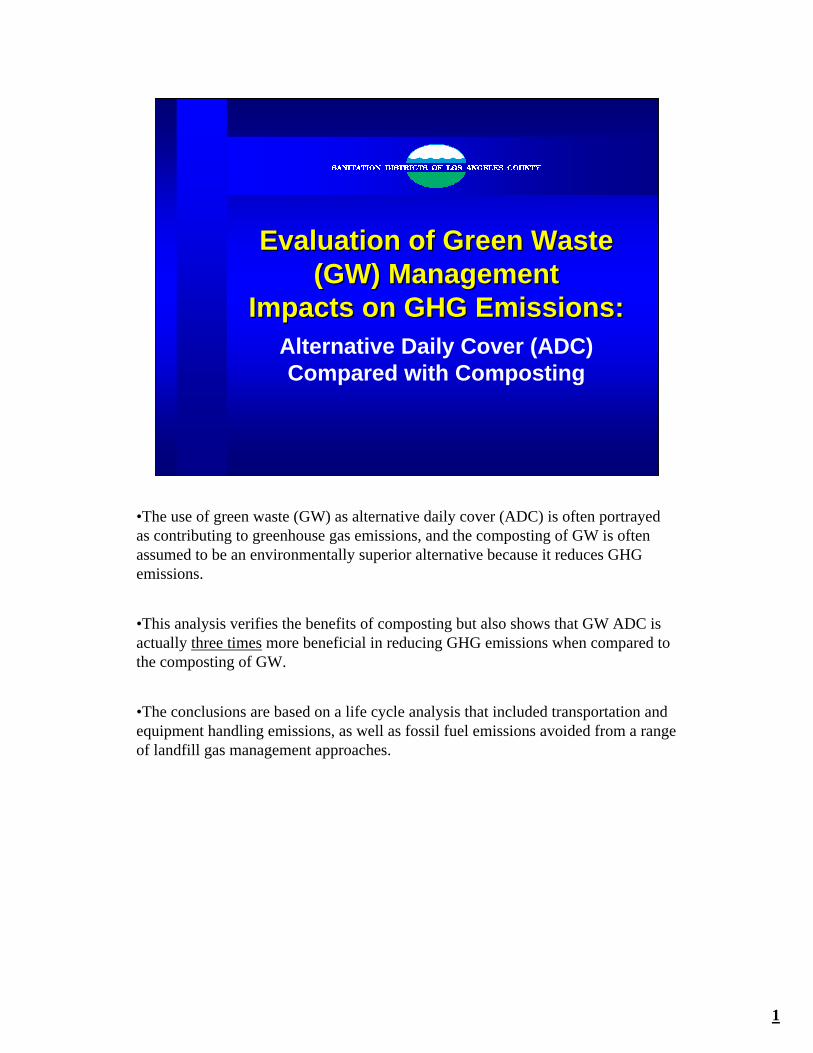
Evaluation of Green Waste Evaluation of Green Waste (GW) Management(GW) Management
Impacts on GHG Emissions:Impacts on GHG Emissions:Alternative Daily Cover (ADC)Compared with Composting
•The use of green waste (GW) as alternative daily cover (ADC) is often portrayed as contributing to greenhouse gas emissions, and the composting of GW is often assumed to be an environmentally superior alternative because it reduces GHG emissions.
•This analysis verifies the benefits of composting but also shows that GW ADC is actually three times more beneficial in reducing GHG emissions when compared to the composting of GW.
•The conclusions are based on a life cycle analysis that included transportation and equipment handling emissions, as well as fossil fuel emissions avoided from a range of landfill gas management approaches.
2
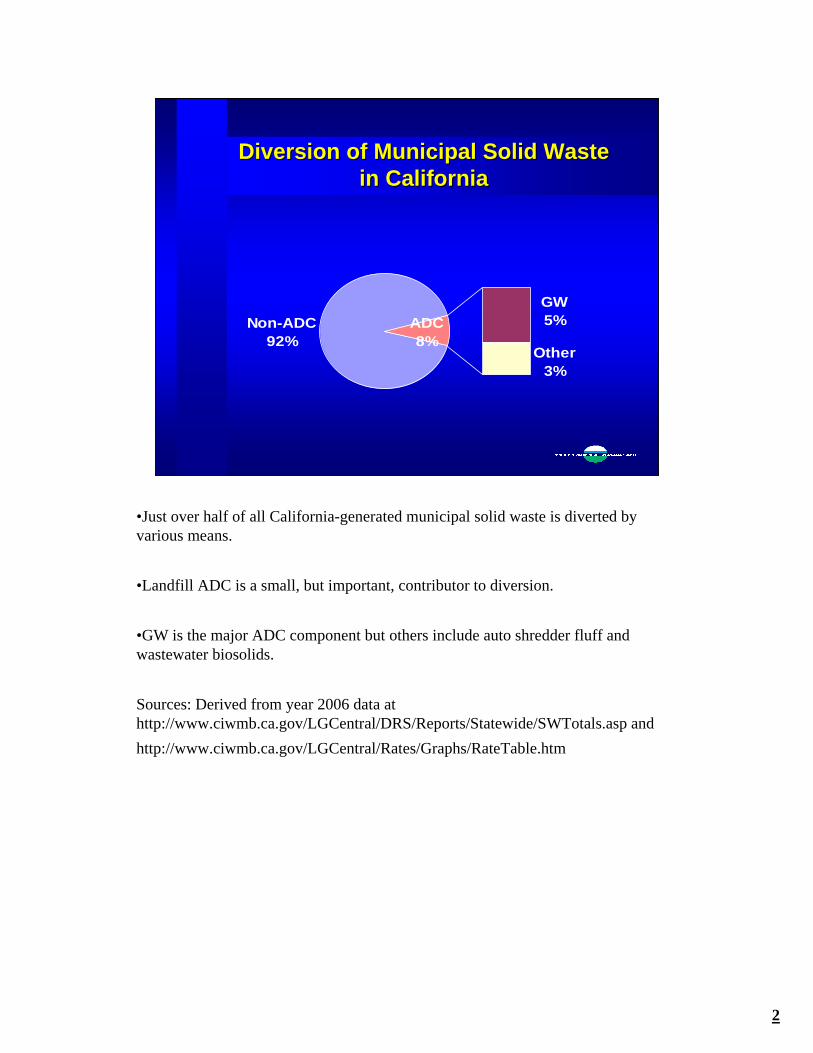
Diversion of Municipal Solid Waste Diversion of Municipal Solid Waste in Californiain California
Non-ADC92%
GW5%
Other3%
ADC8%
•Just over half of all California-generated municipal solid waste is diverted by various means.
•Landfill ADC is a small, but important, contributor to diversion.
•GW is the major ADC component but others include auto shredder fluff and wastewater biosolids.
Sources: Derived from year 2006 data at http://www.ciwmb.ca.gov/LGCentral/DRS/Reports/Statewide/SWTotals.asp andhttp://www.ciwmb.ca.gov/LGCentral/Rates/Graphs/RateTable.htm
3
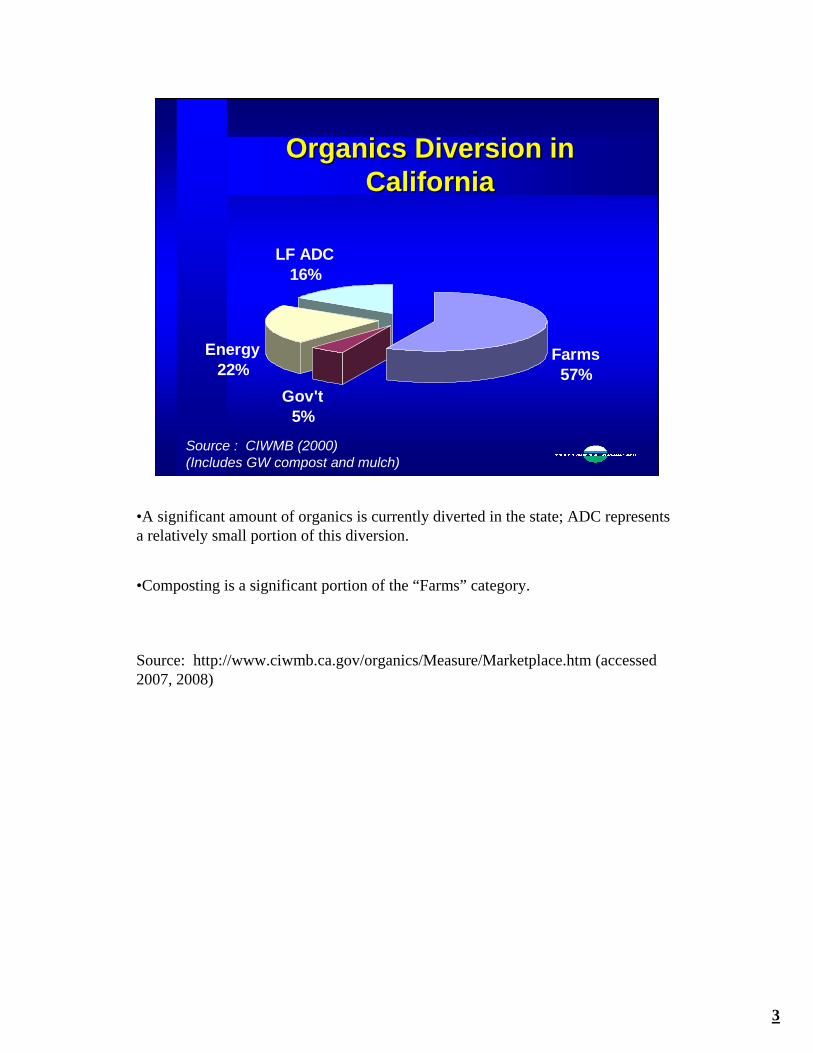
Organics Diversion in Organics Diversion in CaliforniaCalifornia
Farms57%
Gov't5%
Energy22%
LF ADC16%
Source : CIWMB (2000)(Includes GW compost and mulch)
•A significant amount of organics is currently diverted in the state; ADC represents a relatively small portion of this diversion.
•Composting is a significant portion of the “Farms” category.
Source: http://www.ciwmb.ca.gov/organics/Measure/Marketplace.htm (accessed 2007, 2008)
4
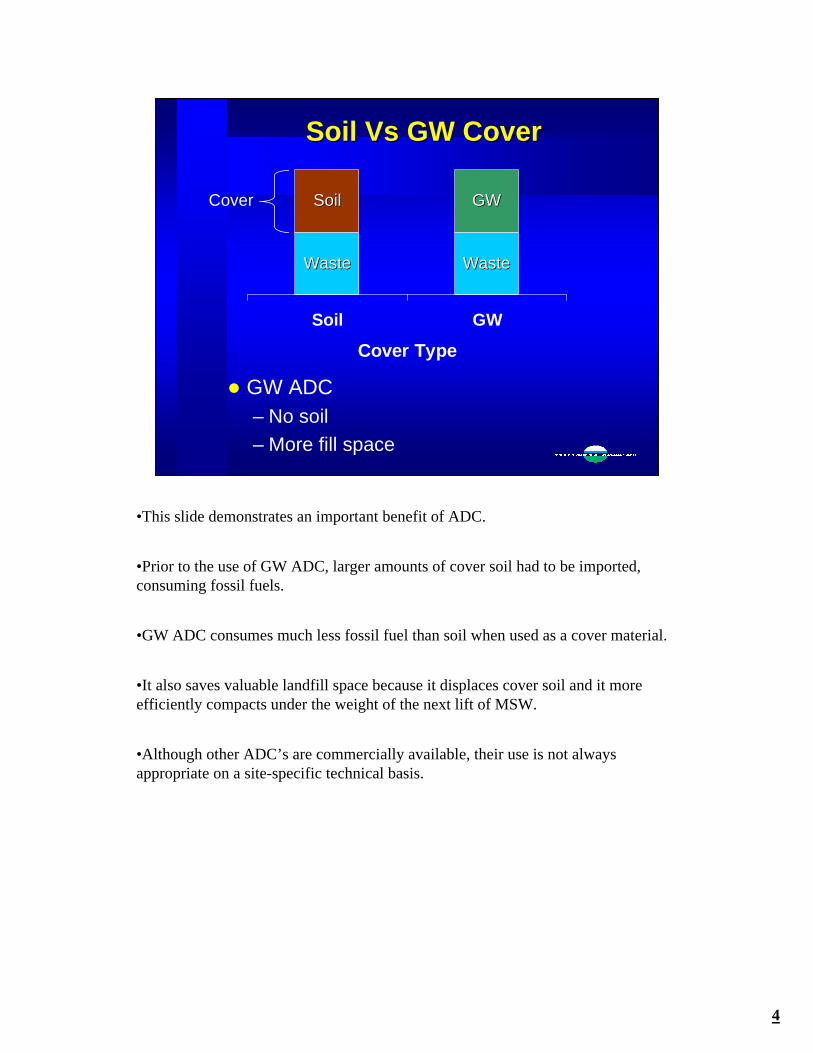
Soil Vs GW CoverSoil Vs GW Cover
GW ADC– No soil– More fill space
Soil GW
Cover Type
WasteWaste
SoilSoil GWGW
WasteWaste
Cover
•This slide demonstrates an important benefit of ADC.
•Prior to the use of GW ADC, larger amounts of cover soil had to be imported, consuming fossil fuels.
•GW ADC consumes much less fossil fuel than soil when used as a cover material.
•It also saves valuable landfill space because it displaces cover soil and it more efficiently compacts under the weight of the next lift of MSW.
•Although other ADC’s are commercially available, their use is not always appropriate on a site-specific technical basis.
5
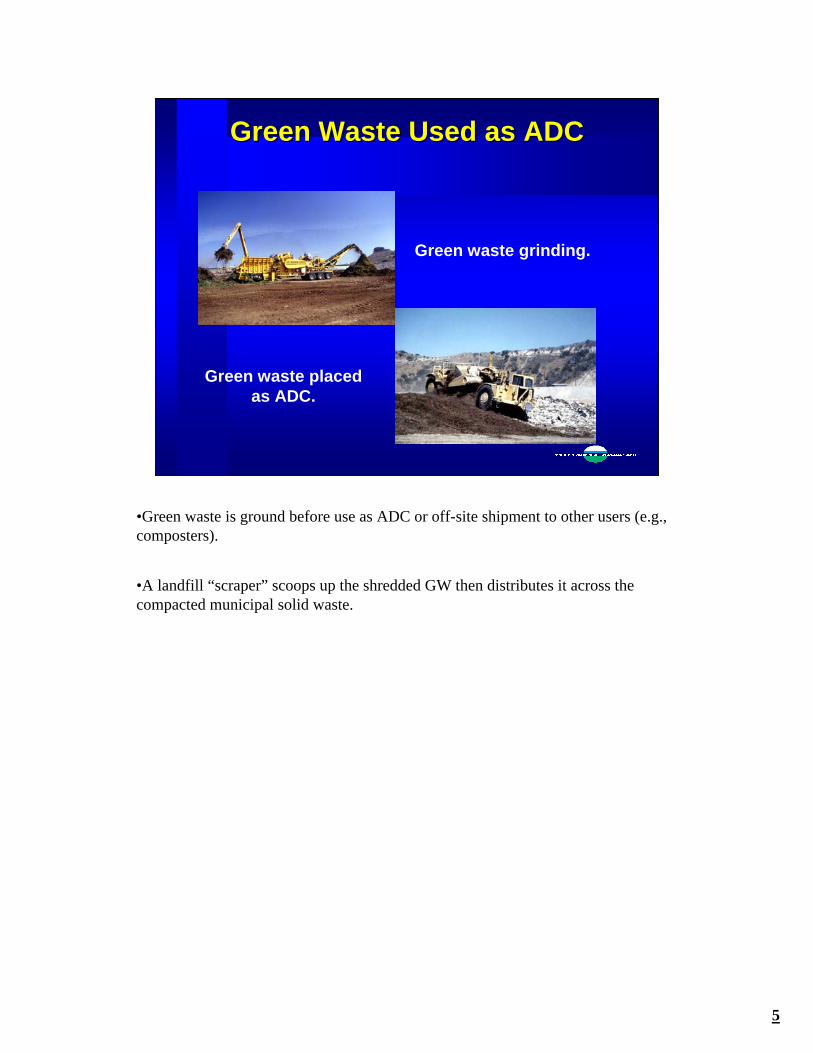
Green Waste Used as ADC Green Waste Used as ADC
Green waste grinding.
Green waste placed as ADC.
•Green waste is ground before use as ADC or off-site shipment to other users (e.g., composters).
•A landfill “scraper” scoops up the shredded GW then distributes it across the compacted municipal solid waste.
6
Comparison of GHG Comparison of GHG Reductions for ADC and Reductions for ADC and
CompostingComposting
•This presentation compares GHG Emissions for ADC and composting.
•This comparison was made using a comprehensive GHG lifecycle analysis.
7
Typical GHG Lifecycle Typical GHG Lifecycle AnalysisAnalysis
Categories– Virgin inputs & energy usage– Stages (e.g., transportation and materials handling)
– Emissions (anthropogenic only)
– Reductions• Carbon sequestration• Emission offsets
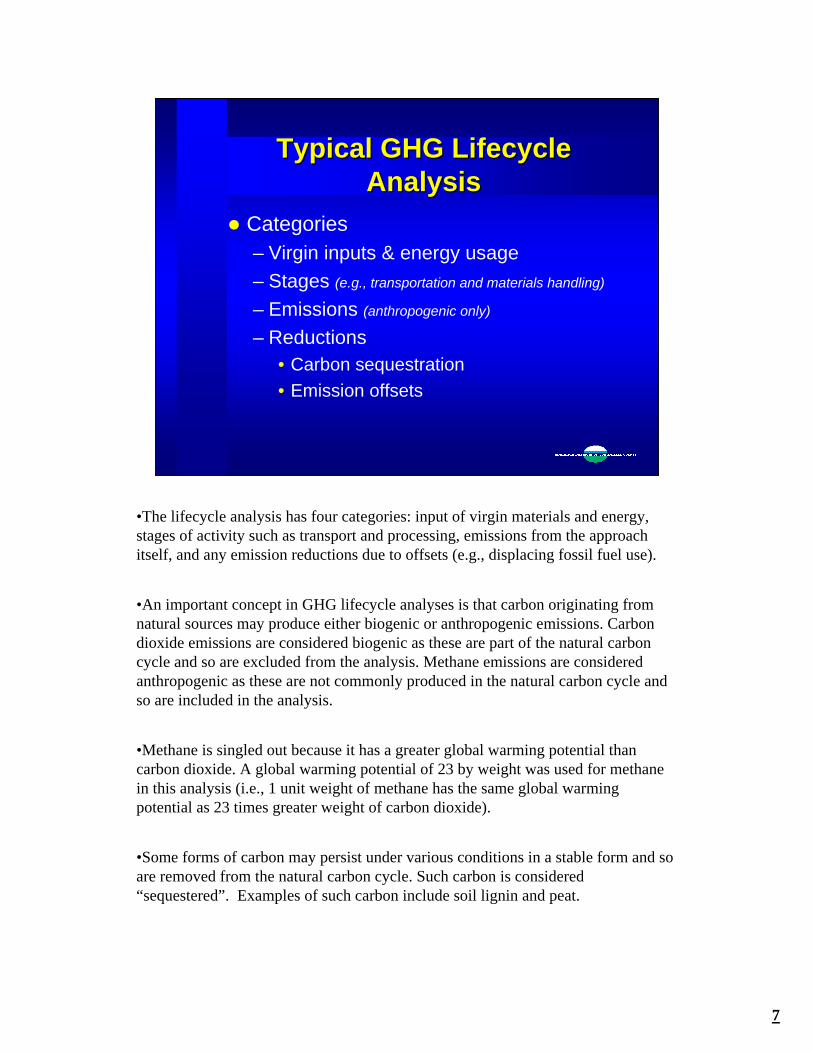
•The lifecycle analysis has four categories: input of virgin materials and energy, stages of activity such as transport and processing, emissions from the approach itself, and any emission reductions due to offsets (e.g., displacing fossil fuel use).
•An important concept in GHG lifecycle analyses is that carbon originating from natural sources may produce either biogenic or anthropogenic emissions. Carbon dioxide emissions are considered biogenic as these are part of the natural carbon cycle and so are excluded from the analysis. Methane emissions are considered anthropogenic as these are not commonly produced in the natural carbon cycle and so are included in the analysis.
•Methane is singled out because it has a greater global warming potential than carbon dioxide. A global warming potential of 23 by weight was used for methane in this analysis (i.e., 1 unit weight of methane has the same global warming potential as 23 times greater weight of carbon dioxide).
•Some forms of carbon may persist under various conditions in a stable form and so are removed from the natural carbon cycle. Such carbon is considered “sequestered”. Examples of such carbon include soil lignin and peat.
8
Lifecycle ToolsLifecycle Tools
EPA WARM– Flexible tool for variety of MSW scenarios
LACSD Model– Dedicated spreadsheet
• GW Compost & ADC– Similar to EPA WARM
• But uses latest factorsCanadian EPIC– Literature results reported here
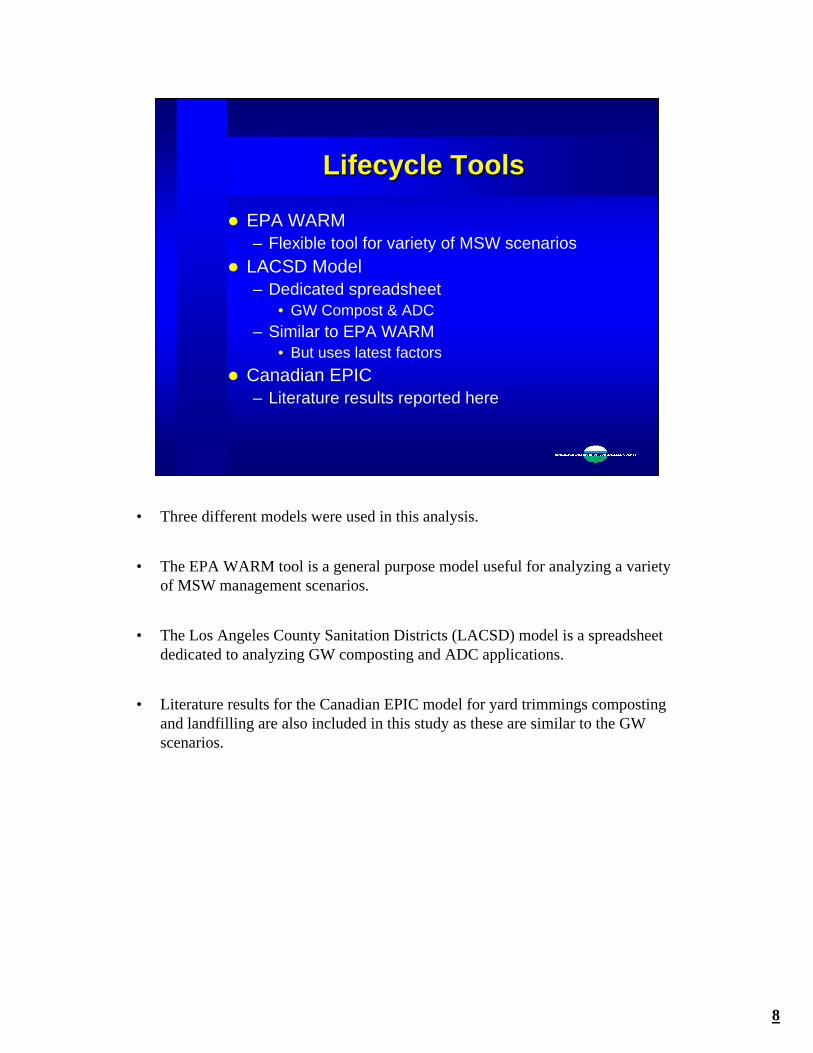
• Three different models were used in this analysis.
• The EPA WARM tool is a general purpose model useful for analyzing a variety of MSW management scenarios.
• The Los Angeles County Sanitation Districts (LACSD) model is a spreadsheet dedicated to analyzing GW composting and ADC applications.
• Literature results for the Canadian EPIC model for yard trimmings composting and landfilling are also included in this study as these are similar to the GW scenarios.
9
Composting ScenarioComposting Scenario
Composting of Shredded GW (windrowed);
Product used in agriculture
Windrow Farm
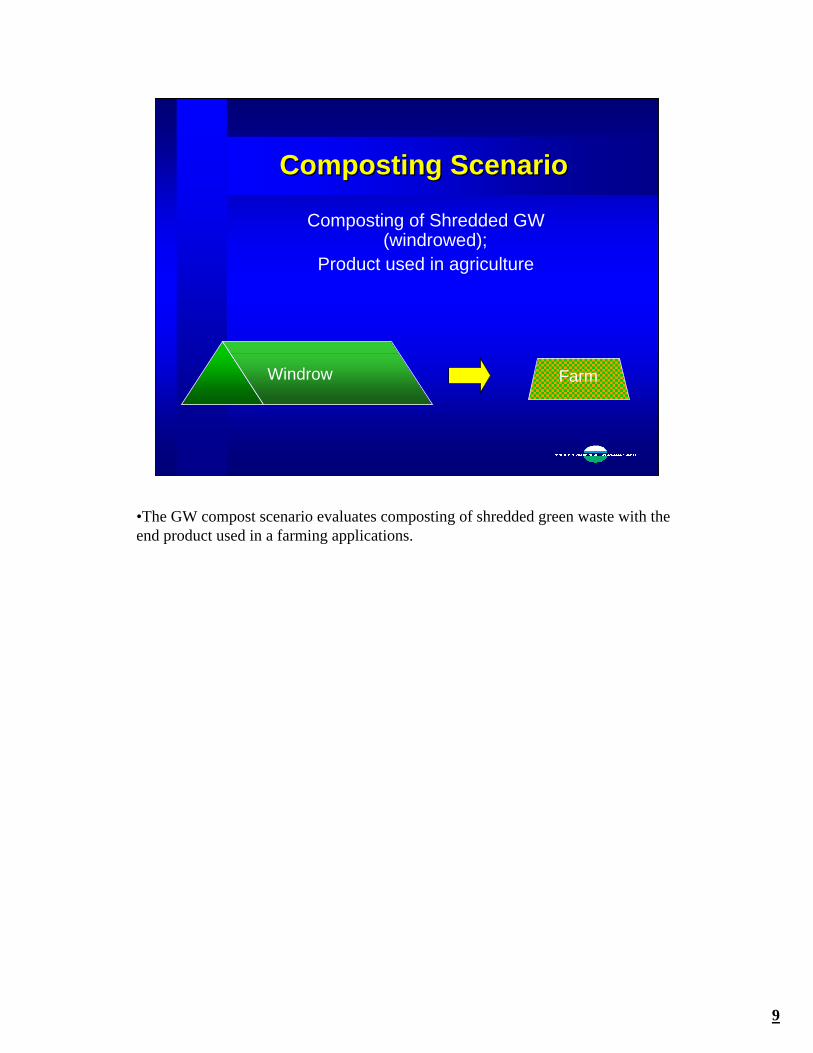
•The GW compost scenario evaluates composting of shredded green waste with the end product used in a farming applications.
10
Compost GHG Lifecycle AnalysisCompost GHG Lifecycle Analysis
Transport toCompost Site
Pile Turning
Decomposition
Stages
CO2(fossil fuel use)
CO2(fossil fuel use)
Emissions
CH4(fugitive; omitted)
Reductions
Farm Use Sequestration(direct and indirect)
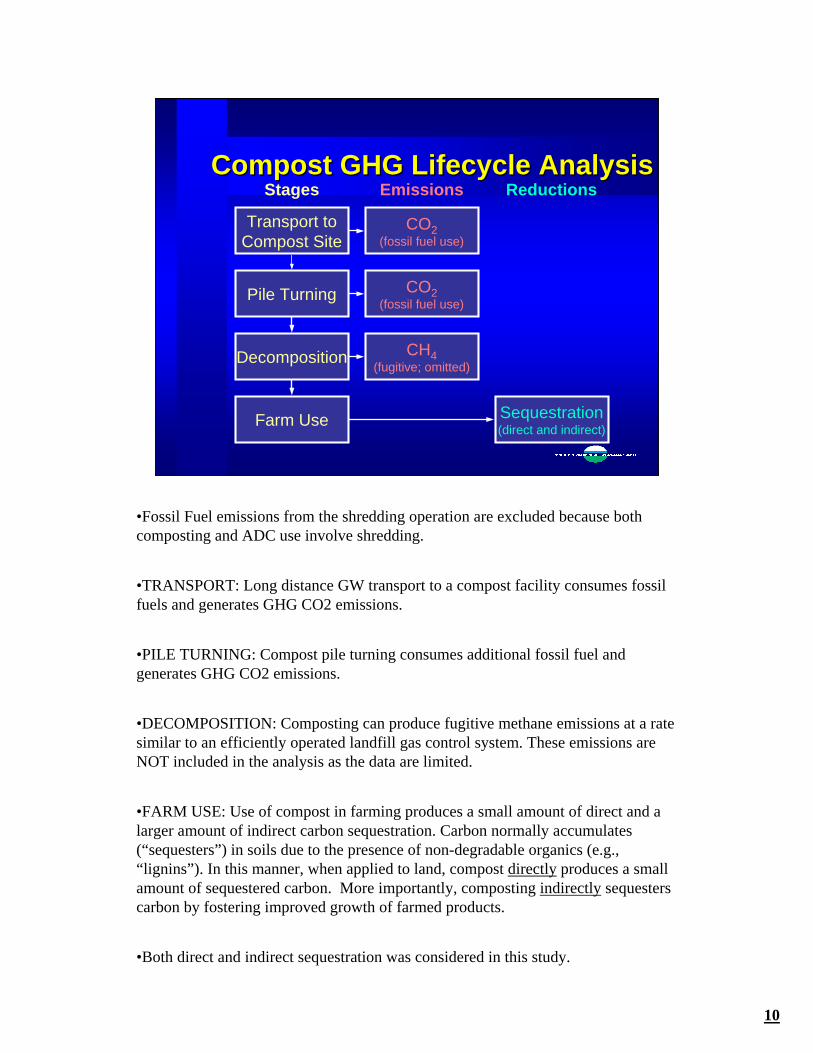
•Fossil Fuel emissions from the shredding operation are excluded because both composting and ADC use involve shredding.
•TRANSPORT: Long distance GW transport to a compost facility consumes fossil fuels and generates GHG CO2 emissions.
•PILE TURNING: Compost pile turning consumes additional fossil fuel and generates GHG CO2 emissions.
•DECOMPOSITION: Composting can produce fugitive methane emissions at a rate similar to an efficiently operated landfill gas control system. These emissions are NOT included in the analysis as the data are limited.
•FARM USE: Use of compost in farming produces a small amount of direct and a larger amount of indirect carbon sequestration. Carbon normally accumulates (“sequesters”) in soils due to the presence of non-degradable organics (e.g., “lignins”). In this manner, when applied to land, compost directly produces a small amount of sequestered carbon. More importantly, composting indirectly sequesters carbon by fostering improved growth of farmed products.
•Both direct and indirect sequestration was considered in this study.
11
ADC ScenarioADC Scenario
Shredded GW spread as ADC
GW LF Daily Cover
•The GW ADC lifecycle scenario addresses its placement as a daily cover and subsequent contribution to landfill gases.
12
ADC GHG Lifecycle AnalysisADC GHG Lifecycle Analysis
Placement
Decomposition
CO2(fossil fuel offset)
Stages
CO2(reduced soil haul)
CH4(fugitive; included)
Emissions
Sequestration(direct)
Reductions
CH4 to Energy
LFG Collection**
** landfill gas collection efficiency must be assumed here.
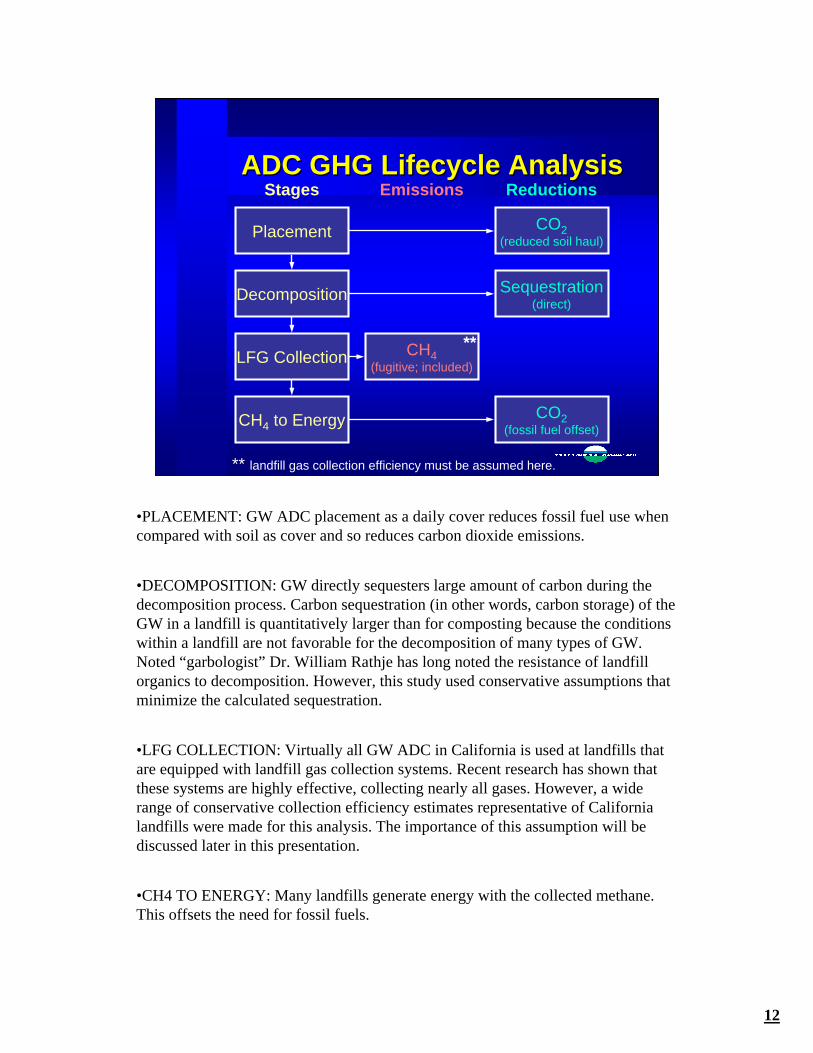
•PLACEMENT: GW ADC placement as a daily cover reduces fossil fuel use when compared with soil as cover and so reduces carbon dioxide emissions.
•DECOMPOSITION: GW directly sequesters large amount of carbon during the decomposition process. Carbon sequestration (in other words, carbon storage) of the GW in a landfill is quantitatively larger than for composting because the conditions within a landfill are not favorable for the decomposition of many types of GW. Noted “garbologist” Dr. William Rathje has long noted the resistance of landfill organics to decomposition. However, this study used conservative assumptions that minimize the calculated sequestration.
•LFG COLLECTION: Virtually all GW ADC in California is used at landfills that are equipped with landfill gas collection systems. Recent research has shown that these systems are highly effective, collecting nearly all gases. However, a wide range of conservative collection efficiency estimates representative of California landfills were made for this analysis. The importance of this assumption will be discussed later in this presentation.
•CH4 TO ENERGY: Many landfills generate energy with the collected methane. This offsets the need for fossil fuels.
13
Special GW ADC Special GW ADC ConsiderationsConsiderations
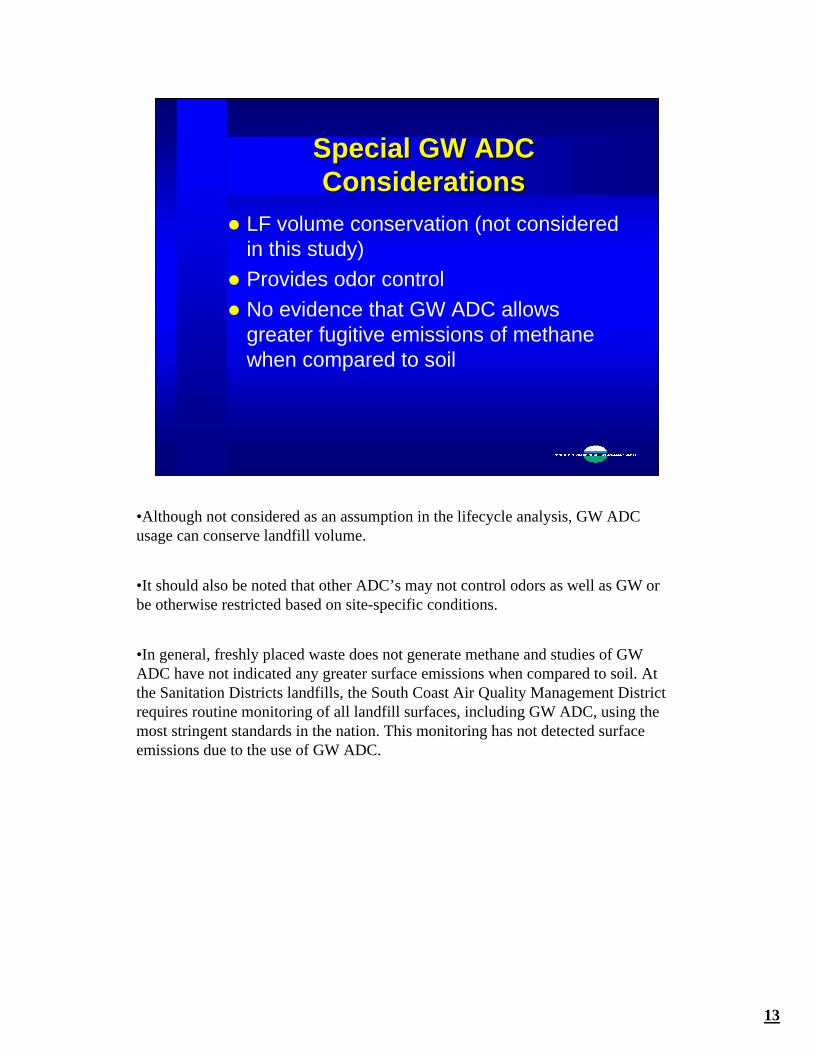
LF volume conservation (not considered in this study)Provides odor controlNo evidence that GW ADC allows greater fugitive emissions of methane when compared to soil
•Although not considered as an assumption in the lifecycle analysis, GW ADC usage can conserve landfill volume.
•It should also be noted that other ADC’s may not control odors as well as GW or be otherwise restricted based on site-specific conditions.
•In general, freshly placed waste does not generate methane and studies of GW ADC have not indicated any greater surface emissions when compared to soil. At the Sanitation Districts landfills, the South Coast Air Quality Management District requires routine monitoring of all landfill surfaces, including GW ADC, using the most stringent standards in the nation. This monitoring has not detected surface emissions due to the use of GW ADC.
14
LIFECYCLE ANALYSIS:LIFECYCLE ANALYSIS:GHG BudgetGHG Budget
Net Reductions reductionsemissions
•The results of a GHG lifecycle analysis can be expressed as a simple budget, the difference between reduction and emissions.
15
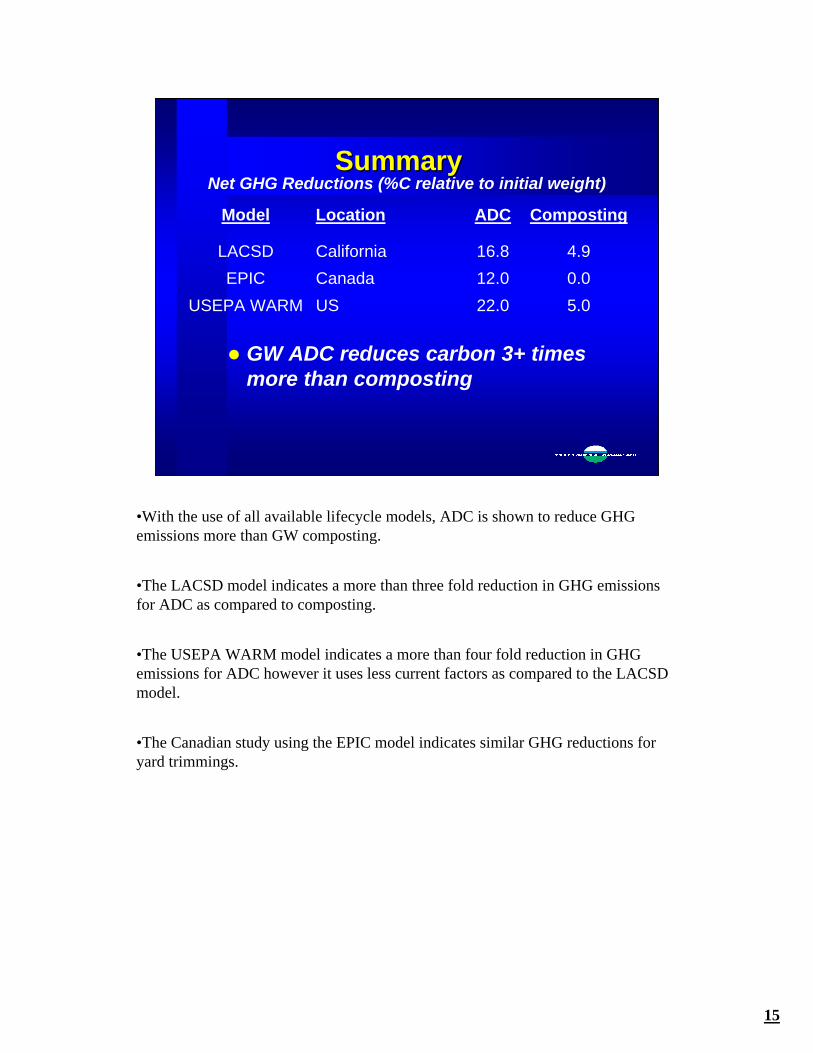
SummarySummaryNet GHG Reductions (%C relative to initial weight)
4.916.8CaliforniaLACSD
CompostingADCLocationModel
USCanada
USEPA WARMEPIC
5.022.00.012.0
GW ADC reduces carbon 3+ times more than composting
•With the use of all available lifecycle models, ADC is shown to reduce GHG emissions more than GW composting.
•The LACSD model indicates a more than three fold reduction in GHG emissions for ADC as compared to composting.
•The USEPA WARM model indicates a more than four fold reduction in GHG emissions for ADC however it uses less current factors as compared to the LACSD model.
•The Canadian study using the EPIC model indicates similar GHG reductions for yard trimmings.
16
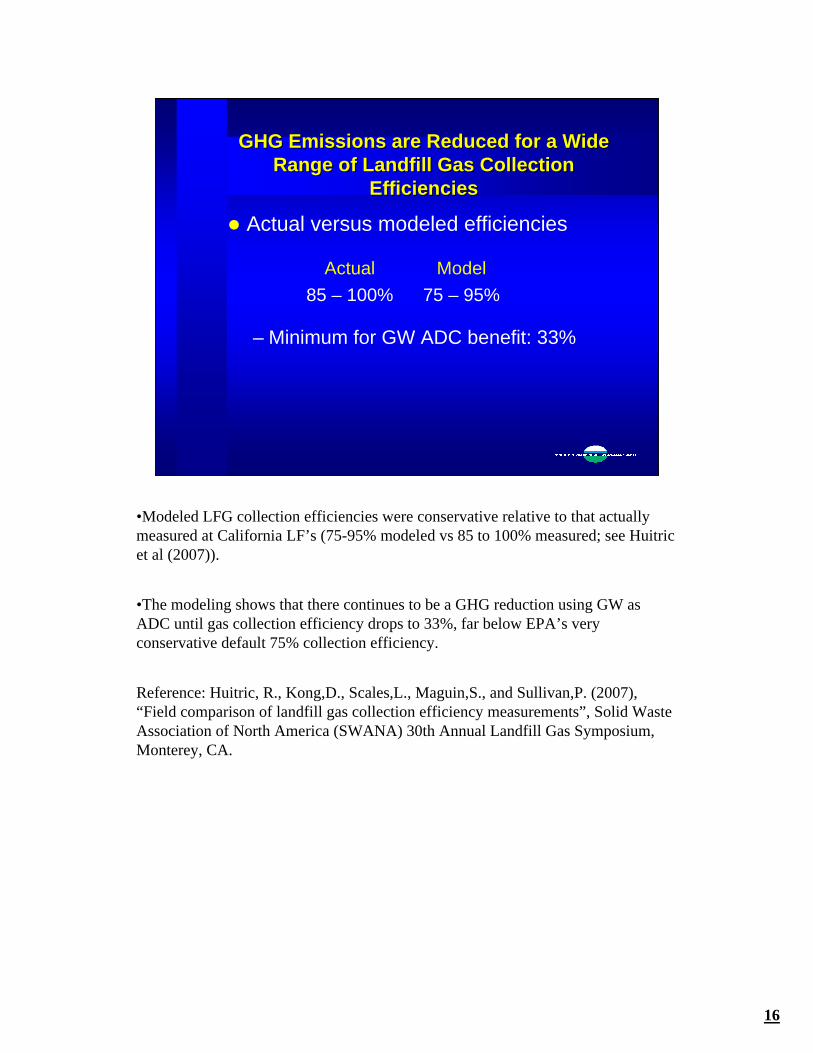
GHG Emissions are Reduced for a Wide GHG Emissions are Reduced for a Wide Range of Landfill Gas Collection Range of Landfill Gas Collection
EfficienciesEfficiencies
Actual versus modeled efficiencies
– Minimum for GW ADC benefit: 33%
75 – 95%85 – 100%ModelActual
•Modeled LFG collection efficiencies were conservative relative to that actually measured at California LF’s (75-95% modeled vs 85 to 100% measured; see Huitric et al (2007)).
•The modeling shows that there continues to be a GHG reduction using GW as ADC until gas collection efficiency drops to 33%, far below EPA’s very conservative default 75% collection efficiency.
Reference: Huitric, R., Kong,D., Scales,L., Maguin,S., and Sullivan,P. (2007), “Field comparison of landfill gas collection efficiency measurements”, Solid Waste Association of North America (SWANA) 30th Annual Landfill Gas Symposium, Monterey, CA.
17
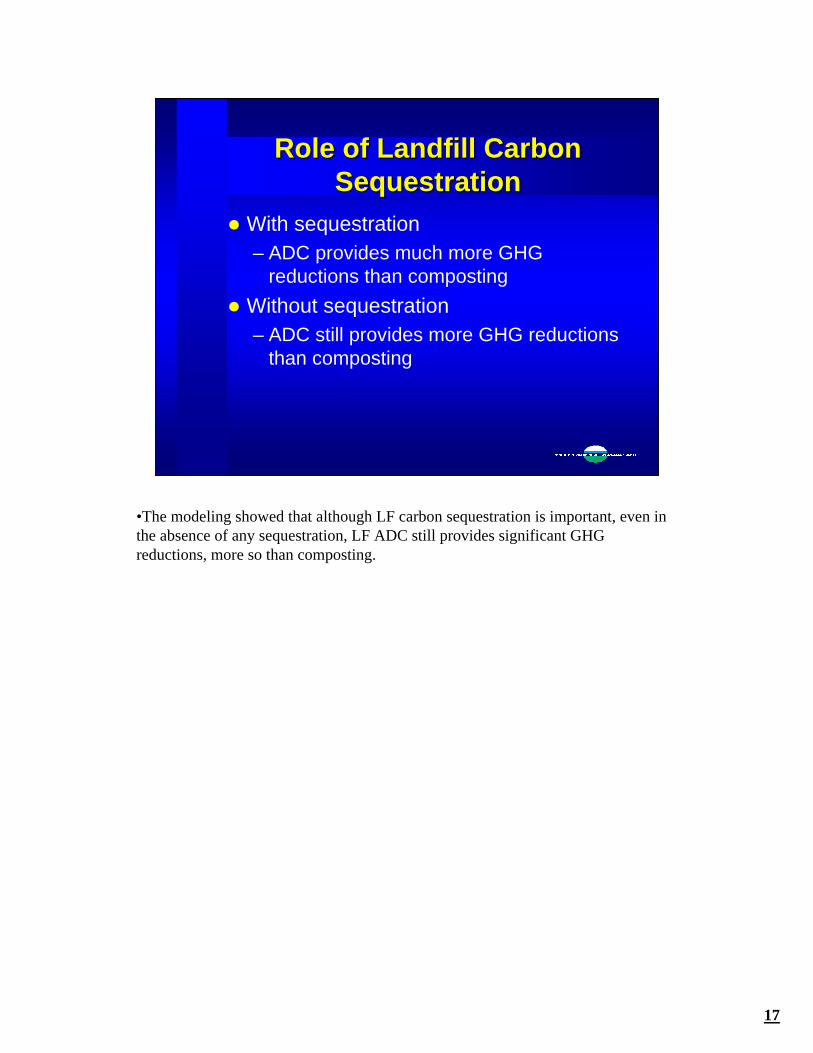
Role of Landfill Carbon Role of Landfill Carbon SequestrationSequestration
With sequestration– ADC provides much more GHG
reductions than compostingWithout sequestration– ADC still provides more GHG reductions
than composting
•The modeling showed that although LF carbon sequestration is important, even in the absence of any sequestration, LF ADC still provides significant GHG reductions, more so than composting.
18
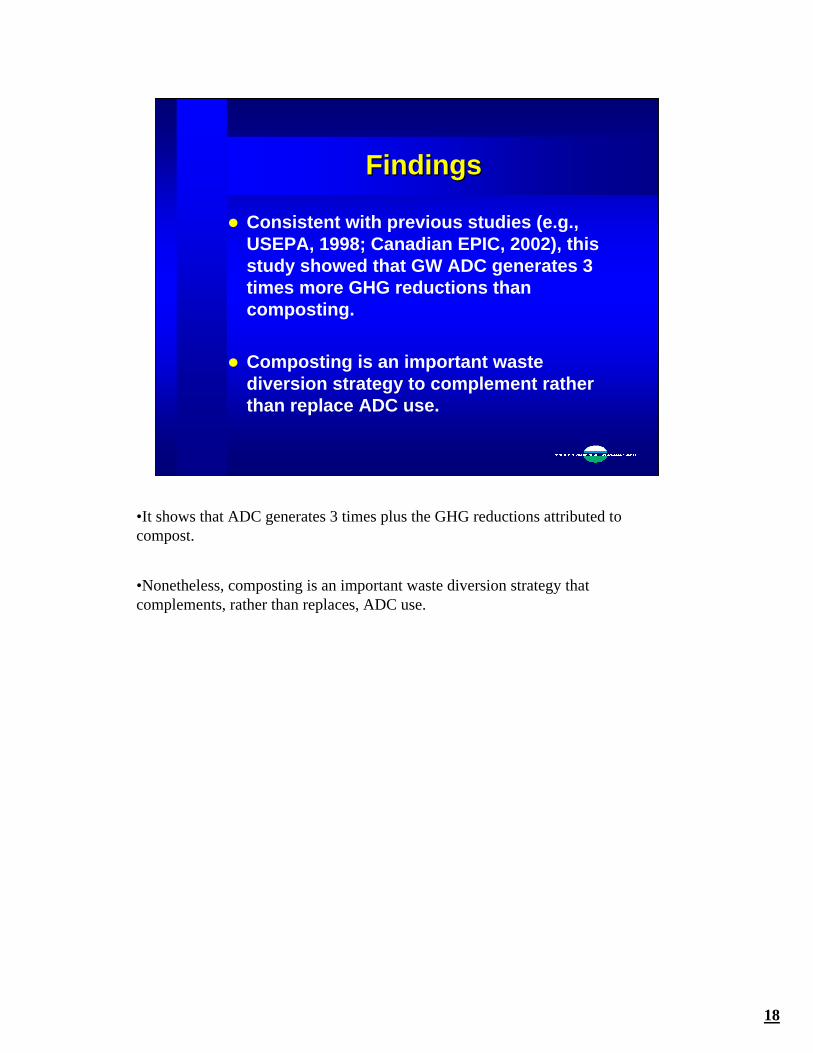
FindingsFindings
Consistent with previous studies (e.g., USEPA, 1998; Canadian EPIC, 2002), this study showed that GW ADC generates 3 times more GHG reductions than composting.
Composting is an important waste diversion strategy to complement rather than replace ADC use.
•It shows that ADC generates 3 times plus the GHG reductions attributed to compost.
•Nonetheless, composting is an important waste diversion strategy that complements, rather than replaces, ADC use.
Cui, Carrie
From: Mike Mohajer [[email protected]]
Sent: Sunday, March 09, 2008 3:34 PM
To: Margo Reid Brown; Wesley Chesbro; Rosalie Mule; Cheryl Peace; Gary Petersen
Cc: Mark Leary; Howard Levenson
Subject: 3/18/08 CIWMB Meeting, Item 7 - Discussion And Request For Direction On Green Material Alternative Daily Cover (ADC)
Attachments: CIWMB letter 3_5_08.pdf; GW GHG Final.pdf
03/10/2008
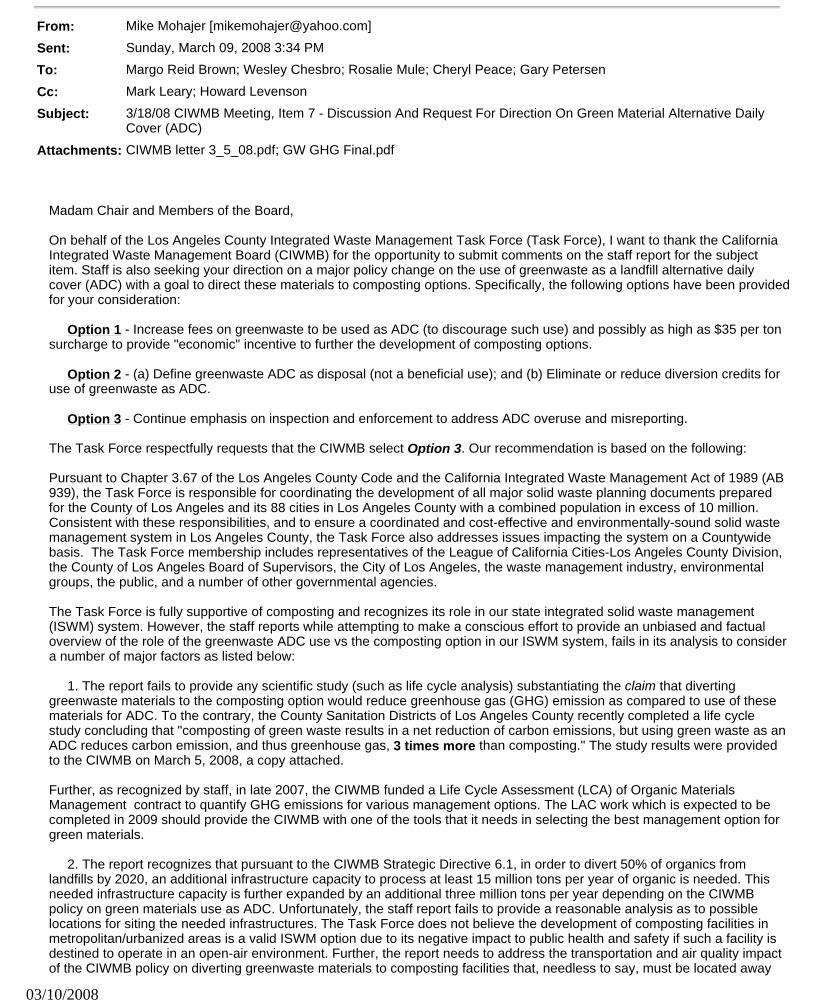
Madam Chair and Members of the Board, On behalf of the Los Angeles County Integrated Waste Management Task Force (Task Force), I want to thank the California Integrated Waste Management Board (CIWMB) for the opportunity to submit comments on the staff report for the subject item. Staff is also seeking your direction on a major policy change on the use of greenwaste as a landfill alternative daily cover (ADC) with a goal to direct these materials to composting options. Specifically, the following options have been provided for your consideration: Option 1 - Increase fees on greenwaste to be used as ADC (to discourage such use) and possibly as high as $35 per ton surcharge to provide "economic" incentive to further the development of composting options. Option 2 - (a) Define greenwaste ADC as disposal (not a beneficial use); and (b) Eliminate or reduce diversion credits for use of greenwaste as ADC. Option 3 - Continue emphasis on inspection and enforcement to address ADC overuse and misreporting. The Task Force respectfully requests that the CIWMB select Option 3. Our recommendation is based on the following: Pursuant to Chapter 3.67 of the Los Angeles County Code and the California Integrated Waste Management Act of 1989 (AB 939), the Task Force is responsible for coordinating the development of all major solid waste planning documents prepared for the County of Los Angeles and its 88 cities in Los Angeles County with a combined population in excess of 10 million. Consistent with these responsibilities, and to ensure a coordinated and cost-effective and environmentally-sound solid waste management system in Los Angeles County, the Task Force also addresses issues impacting the system on a Countywide basis. The Task Force membership includes representatives of the League of California Cities-Los Angeles County Division, the County of Los Angeles Board of Supervisors, the City of Los Angeles, the waste management industry, environmental groups, the public, and a number of other governmental agencies. The Task Force is fully supportive of composting and recognizes its role in our state integrated solid waste management (ISWM) system. However, the staff reports while attempting to make a conscious effort to provide an unbiased and factual overview of the role of the greenwaste ADC use vs the composting option in our ISWM system, fails in its analysis to consider a number of major factors as listed below: 1. The report fails to provide any scientific study (such as life cycle analysis) substantiating the claim that diverting greenwaste materials to the composting option would reduce greenhouse gas (GHG) emission as compared to use of these materials for ADC. To the contrary, the County Sanitation Districts of Los Angeles County recently completed a life cycle study concluding that "composting of green waste results in a net reduction of carbon emissions, but using green waste as an ADC reduces carbon emission, and thus greenhouse gas, 3 times more than composting." The study results were provided to the CIWMB on March 5, 2008, a copy attached. Further, as recognized by staff, in late 2007, the CIWMB funded a Life Cycle Assessment (LCA) of Organic Materials Management contract to quantify GHG emissions for various management options. The LAC work which is expected to be completed in 2009 should provide the CIWMB with one of the tools that it needs in selecting the best management option for green materials. 2. The report recognizes that pursuant to the CIWMB Strategic Directive 6.1, in order to divert 50% of organics from landfills by 2020, an additional infrastructure capacity to process at least 15 million tons per year of organic is needed. This needed infrastructure capacity is further expanded by an additional three million tons per year depending on the CIWMB policy on green materials use as ADC. Unfortunately, the staff report fails to provide a reasonable analysis as to possible locations for siting the needed infrastructures. The Task Force does not believe the development of composting facilities in metropolitan/urbanized areas is a valid ISWM option due to its negative impact to public health and safety if such a facility is destined to operate in an open-air environment. Further, the report needs to address the transportation and air quality impact of the CIWMB policy on diverting greenwaste materials to composting facilities that, needless to say, must be located away
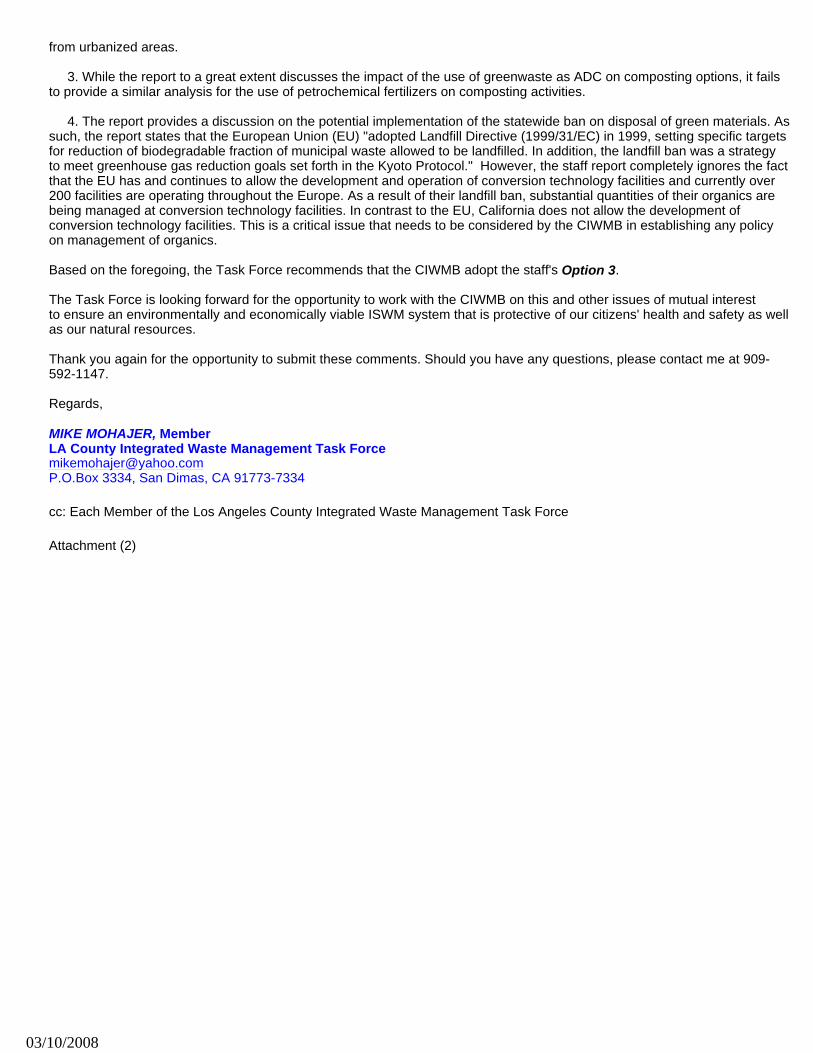
from urbanized areas. 3. While the report to a great extent discusses the impact of the use of greenwaste as ADC on composting options, it fails to provide a similar analysis for the use of petrochemical fertilizers on composting activities. 4. The report provides a discussion on the potential implementation of the statewide ban on disposal of green materials. As such, the report states that the European Union (EU) "adopted Landfill Directive (1999/31/EC) in 1999, setting specific targets for reduction of biodegradable fraction of municipal waste allowed to be landfilled. In addition, the landfill ban was a strategy to meet greenhouse gas reduction goals set forth in the Kyoto Protocol." However, the staff report completely ignores the fact that the EU has and continues to allow the development and operation of conversion technology facilities and currently over 200 facilities are operating throughout the Europe. As a result of their landfill ban, substantial quantities of their organics are being managed at conversion technology facilities. In contrast to the EU, California does not allow the development of conversion technology facilities. This is a critical issue that needs to be considered by the CIWMB in establishing any policy on management of organics. Based on the foregoing, the Task Force recommends that the CIWMB adopt the staff's Option 3. The Task Force is looking forward for the opportunity to work with the CIWMB on this and other issues of mutual interest to ensure an environmentally and economically viable ISWM system that is protective of our citizens' health and safety as well as our natural resources. Thank you again for the opportunity to submit these comments. Should you have any questions, please contact me at 909-592-1147. Regards, MIKE MOHAJER, Member LA County Integrated Waste Management Task Force [email protected] P.O.Box 3334, San Dimas, CA 91773-7334
cc: Each Member of the Los Angeles County Integrated Waste Management Task Force
Attachment (2)
03/10/2008


![ADC-20 und ADC-24 › download › datasheets › adc20...Datenlogger ADC-20 und ADC-24 ADC-20 ADC-24 Auflösung 20 Bit 24 Bit Anzahl Kanäle[1] 4 differenzial / 8 einpolig 8 differenzial](https://img.pdfslide.net/doc/110x75/5f23cbdc98bf2e58da663aad/adc-20-und-adc-24-a-download-a-datasheets-a-adc20-datenlogger-adc-20-und.jpg)


![ZLF Journey Info for Customer [Compatibility Mode]](https://img.pdfslide.net/doc/110x75/58a54c2e1a28abef2c8b4611/zlf-journey-info-for-customer-compatibility-mode.jpg)