Embed Size (px)
Citation preview
VILNIUS UNIVERSITY
CENTER FOR PHYSICAL SCIENCES AND TECHNOLOGY
INSTITUTE OF CHEMISTRY
Simas Šakirzanovas
NOVEL Sm2+/3+ PHOSPHORS AS LUMINESCENCE
CONVERTER FOR NEAR UV RADIATION
Doctoral Dissertation
Physical Sciences, Chemistry (03 P)
Vilnius, 2011
2
The dissertation was carried out in Vilnius University in the period of 2007-
2010.
Scientific supervisor:
Prof. Habil. Dr. Aivaras Kareiva
(Vilnius University, Physical Sciences, Chemistry 03P)
Scientific consultant:
Prof. Dr. Thomas Jüstel
(Muenster University of Applied Sciences, Physical Sciences, Chemistry
03P)
3
CONTENTS
Chapter 1. ............................................................................................................ 6
1.1. Introduction ............................................................................................. 6
Chapter 2. .......................................................................................................... 11
2.1. Fundamentals of Lanthanide Doped Inorganic Materials ..................... 11
2.2. Rare-Earth Elements .............................................................................. 12
2.3. Introduction to Luminescence ............................................................... 14
2.4. Principles of Lanthanide Luminescence ............................................... 16
2.5. Intraconfigurational f-f Transitions Selection Rules ............................. 21
2.6. Configurational Coordinate Diagram .................................................... 23
2.7. Quenching Processes ............................................................................. 25
2.7.1. Multi-phonon Relaxation ............................................................... 25
2.7.2. Cross-relaxation and Energy Migration ......................................... 27
Chapter 3. Characteristics of Samarium ........................................................ 29
3.1. The Ground State of Samarium Ion ...................................................... 29
3.2. Host Dependant Samarium Luminescence ........................................... 31
3.3. Samarium as Structural Probe ............................................................... 36
Chapter 4. Properties of the Host Materials ................................................... 40
4.1. Crystal Structure of SrB4O7 ................................................................... 40
4.2. Crystal Structure of La(Gd)MgB5O10 .................................................... 43
4.3. Crystal Structure of Sr4Al14O25 ............................................................. 46
4.4. Crystal Structure of SrAl12O19 and LaMgAl11O19 ................................. 50
Chapter 5. Experimental ................................................................................. 53
5.1. Methods of Preparation ......................................................................... 53
5.2. Chemicals .............................................................................................. 53
5.3. Materials Characterization .................................................................... 54
5.3.1. Powder X–ray Diffraction .............................................................. 54
5.3.2. Spectroscopic Investigations .......................................................... 54
4
5.3.3. Room Temperature Spectroscopy .................................................. 55
5.3.4. Specific Issues Concerning FSL900 .............................................. 57
5.3.5. Low Temperature Spectroscopy .................................................... 60
5.3.6. Lifetime Measurements ................................................................. 60
Chapter 6. Photoluminescence Properties of Sm2+ in SrB4O7 ....................... 63
6.1. Experimental Details ............................................................................. 63
6.2. Data analysis and Discussion ................................................................ 63
6.3. Influence of Samarium Concentration on Luminescence Properties .... 65
6.4. Luminescence and its Temperature Effects on Sm2+ ............................ 67
6.5. Time Resolved Spectroscopy of Sm2+ ................................................... 71
6.6. Review of the Main Results .................................................................. 71
Chapter 7. Photoluminescence Properties of Sm3+ in LaMgB5O10 ................ 73
7.1. Experimental Details ............................................................................. 73
7.2. Data Analysis and Discussion ............................................................... 73
7.3. Review of Main Results ........................................................................ 78
Chapter 8. Luminescence of Sm3+ in SrAl12O19 and LaMgAl11O19 ............... 79
8.1. Experimental Details ............................................................................. 79
8.2. Synthesis Route and Annealing Temperature Influence on Phase
Formation ..................................................................................................... 80
8.3. Luminescence Properties of Samarium Doped Magnetoplumbite ........ 84
8.4. Review of Main Results ........................................................................ 89
Chapter 9. Photoluminescence Properties of Sm2+/3+ in Sr4Al14O25 .............. 91
9.1. Experimental Details ............................................................................. 91
9.2. Influence of Flux on Sr4Al14O25 Phase Formation ................................ 92
9.3. Synthesis Conditions Influence on Samarium Oxidation State ............ 94
9.4. Temperature Dependent Luminescence ................................................ 97
9.5. Time Resolved Spectroscopy ................................................................ 99
9.6. Review of Main Results ...................................................................... 101

5
Chapter 10. Conclusions ............................................................................. 102
Chapter 11. List of Publications and Conference Participation.................. 104
11.1. List of Publications ............................................................................ 104
11.2. Patent ................................................................................................. 104
11.3. Published Contributions to Academic Conferences .......................... 104
11.4. Publications Not Included in the Thesis ............................................ 105
Chapter 12. REFERENCES ........................................................................ 108
6
Chapter 1.
1.1. Introduction
Rare earth (RE) ions play an important role in modern optical technologies
as the active constituents in many novel materials. There are an increasing
number of applications for these RE-activated materials and much of today’s
cutting-edge optical technology and future innovations are expected to rely on
their unique properties. The rare earth elements have had and still have a
unique and important impact on our lives. The unfilled 4f electronic structure
of the rare earth elements makes them to possess special properties in
luminescence, magnetism and electronics, which could be used to develop
many new materials for various applications such as phosphors, magnetic
materials, hydrogen storage materials and catalysts [1].
The luminescence of rare earth ions has a large technological importance
in a variety of materials like phosphor lamps, displays, lasers, and optical
amplifiers. Usually, the best hosts for these lanthanide ions are inorganic
materials like crystals and glasses, because those ions generally show high
quantum yields in these hosts. There is a considerable research activity in the
field of luminescent materials for lighting and displays to improve the
chemical stability and to adopt the materials to the production technology. On
the one hand ongoing miniaturization, lifetime improvement and spectral
stability of light sources and on the other hand brightness and contrast
improvement in imaging systems demand luminescent materials with very high
stability that is invariable to operating conditions.
The significant part of the today’s efficient lighting sources is based on
indirect light emission, which can be organized by the excitation source.
Luminescent materials in plasma display panels (PDPs) and field emission
displays (FEDs) use the high energy side of UV spectrum, i.e. vacuum
ultraviolet (VUV) and even low voltage electrons, respectively [2, 3].
Phosphors are excited by near UV or blue light, which are coated on light
emitting diodes (LEDs) and to some extent in fluorescent lamps for special
7
applications. The major application of rare-earth-doped luminescent materials
(i.e. phosphors) is for radiation conversion in order to get emission at distinct
and different wavelengths in the electromagnetic spectrum. This feature have
been widely used in color cathode ray tubes (CRT), tri-phosphor fluorescent
lamps, X-ray intensifying screens and newly developed vacuum mercury-free
lamps, as well as various types of displays such as plasma display panels, field
emission displays and projection TVs [4]. In particular, the invention of high-
efficiency blue-emitting InGaN-based LEDs makes realization of efficient,
full-spectrum white-light LEDs for general illumination possible by using
conversion phosphors [5]. Unfortunately, very few existing phosphor materials
can efficiently convert the UV-blue emission from the LED into green, and in
particular, red light. In addition, red-emitting phosphors that can be efficiently
pumped by UV-blue LEDs are very scare. Consequently, as an explorative
research, creating and designing novel luminescent materials by various ways
is a major motivation.
The most common oxidation state of RE ions is usually a trivalent one.
The 4f – 4f transitions of trivalent RE-doped materials brings out inherent
optical properties. On the other hand, some RE ions such as Sm, Eu and Yb
can be present in a divalent oxidation state as well. In contrast to the trivalent
RE ions, the divalent RE ions in solids manifest unique characteristics. Firstly,
the valence change can be induced by high-energy radiation, such as ultraviolet
(UV), X-ray or γ-ray. Secondly, the 4f – 5d transition appears in the visible
region for divalent RE ions, while for trivalent RE ions it lays in the ultraviolet
region. The 4f – 5d transition is parity-allowed, and therefore, the probability is
much higher than for parity-forbidden 4f – 4f transition. Furthermore, the
energy levels of 5d orbitals are largely influenced by the ligand field compared
with those of 4f orbitals. Such features of divalent RE ions give rise to the
possibility of inducing novel and striking optical effects. A typical example of
utilizing the change of the valence state of divalent RE ions is persistent
spectral hole burning due to photoionization. This phenomenon occurs when a
frequency-selected subset of optical absorption band is modified by the
8
photoionization removal of RE ions, as was first shown in CaF2:Sm2+ [6] and
subsequently in BaClF:Sm2+ [7]. In order to design materials with suitable
quality for room-temperature persistent spectral hole burning many studies
have been extensively performed for Sm2+-doped mixed crystals and glasses
[8-14].
The motivation to perform such investigation was limited available data in
scientific literature on Sm2+/3+ luminescence properties. The discussion is
divided into chapters describing the main information gained from separate
investigation of the different inorganic materials doped with samarium. Thus,
these aspects provide the novelty and originality for the doctoral dissertation.
The main aim of this work was to synthesize and investigate new Sm2+/3+
phosphors. The additional aim was better understand the nature and properties
of the inorganic crystalline materials doped with Sm2+/3+ ions searching of
suitable inorganic hosts for successful divalent samarium incorporation as well.
For this reason, there were formulated tasks as follows:
1. Synthesis and investigation of photoluminescence properties of Sm2+
substituted SrB4O7.
2. Synthesis and investigation of photoluminescence properties of Sm3+
substituted LnMgB5O10 (Ln = La, Gd).
3. Synthesis and investigation of photoluminescence properties of Sm3+
substituted SrAl12O19 and LaMgAl11O19.
4. Synthesis and investigation of photoluminescence properties of Sm2+/3+
substituted Sr4Al14O25.
Statements for defense:
1) Samarium substituted Sr1-xSmxB4O7 and different aluminate matrixes
(SrAl12O19, LaMgAl11O19 and Sr4Al14O25) could be synthesized using
advanced preparation routes. The results obtained indicate that the
synthesis route and synthesis temperature make significant influence on
the stability of crystalline phases and luminescent properties.
9
2) Samarium substituted Sr1-xSmxB4O7 samples could be prepared by
solid-state synthesis route. The preparation gives Sm3+ reduction to
divalent state even after annealing in air at high temperature. The d–f
transitions of Sm2+ in SrB4O7 appear at slightly higher than room
temperature due to the low enough energy position of the 4f55d1 level
and the small energy difference between 4f55d1 and 5D0 levels. The
study on the temperature dependence of samarium luminescence in
strontium tetraborate shows that the variation of Sm2+ fluorescence is
most probably governed by the lowest lying 4f55d1 states. Moreover,
the shape of emission spectra pointed out that Sm2+ occupies the C2v or
lower symmetry site in SrB4O7.
3) Orange-red emitting La1-xSmxMgB5O10 and Gd1-xSmxMgB5O10
photoluminescent materials could be synthesized by a solid state
reaction method at 1020 °C for 8 h. Four emission bands corresponding
to the 4G5/2→6H5/2, 6H7/2, 6H9/2 and 6H11/2 transitions peaking at 560,
600, 650 and 710 nm, respectively, upon excitation at 6H5/2→4L13/2+6P3/2+4F7/2 (402 nm) have been observed. The decay
lifetimes for Sm3+ emission upon direct excitation of Gd3+ is around 0.1
ms longer, confirming the energy transfer phenomena.
4) It was found that the best suitable synthesis technique to get phase pure
SrAl12O19 is combustion with EDTA as fuel. The same structure
LaMgAl11O19 pure phase can be synthesized via same method
regardless the fuel used. No obvious conclusion about Sm3+ occupied
site symmetry could be made due to insufficient clarity of the shape
and intensity of observed transitions. Annealing under highly reducing
conditions at high temperature revealed that examined
magnetoplumbite hosts are not suitable for samarium reduction to
divalent state. The measured emission decay values fall into the range
of 2.1 – 2.7 ms for LaMgAl11O19:Sm3+ and 2.5 – 3.0 ms for
SrAl12O19:Sm3+.
10
5) Complete and partial samarium reduction was achieved under strong
reducing atmosphere by solid-state and combustion synthesis of
Sr3.96Sm0.04Al14O25. Dependence of different fluxing agents on the
formation of various strontium aluminates was examined. Excitation
with UV radiation resulted in sharp and well resolved emission lines of
samarium ions. Distinct temperature behaviour for Sm2+ and Sm3+ were
detected in the range of 100-500 K. Estimated emission thermal
quenching values (TQ1/2) for divalent samarium were approximately
270 K while for trivalent state around 660 K. Measured luminescence
decay values of Sm2+ are substantially lower than for Sm3+, ≈ 1.7 and ≈
2.7 ms, respectively. The spectral feature of Sm2+ emission spectrum
indicates that dopant occupies low symmetry site in Sr4Al14O25
compound.
11
Chapter 2.
2.1. Fundamentals of Lanthanide Doped Inorganic Materials
It is well known that free atoms or ions generally exhibit discrete energy
level scheme. However, of primary technological interest are not the optical
properties of the free RE atoms but rather those of the RE ions embedded into
a solid. It has been found that when introduced into a solid the electronic
configuration of RE ion usually acquires the trivalent charge state [Xe]4fn−1
(i.e., the two 6s2 electrons and one 4f electron is removed). This is because it
takes relatively little energy to remove one electron from the 4f shell (the two
6s electrons are loosely bound anyway). For energies from IR up to the UV
range, the transitions in trivalent RE ions only involve the energy levels of the
4f shell, i.e. the ground configuration of the ion [15]. As the 4f shell of RE ion
is still shielded by the 5s25p6 electrons, the free-ion energy levels are only
weakly perturbed by the surrounding environment and the 4f
intraconfigurational transitions retain their atomic-like characteristics, e.g.
spectral sharpness (of the order of 10 cm−1 in good crystalline host) and long
lifetime (of the order of 1 ms). From the scientific as well as the technological
point of view one is mostly interested in the spectrally narrow highly efficient
emission of the RE ions. Such narrow lines provide sensitive probes of weak
perturbations. For example, the Stark splitting of the emission lines in a crystal
field and the relative intensity of different transitions are indicators of the site
symmetry of the emission center. Technologically the phosphors emitting
spectrally narrow lines are favorable in e.g. display devices, where they can
provide very pure primary colors (the red emission of Eu3+ at 620 nm being the
most well known) [3].
This chapter will introduce the basic theoretical background for the
experiments presented in this work. A generalized look on the field of rare-
earth spectroscopy can be found in the book of Blasse [4]. Following chapter
starts with an introduction to the energy level structure of lanthanide ions and
describes the changes introduced when the ion is placed in a crystalline
12
environment. Later the role of lattice vibrations in the lanthanide spectra and
the energy transfer processes occurring in the examined crystal systems is
discussed. The special properties of the samarium ion will be presented in the
Chapter 3.
2.2. Rare-Earth Elements
As defined by IUPAC, rare-earth elements or rare-earth metals are a
collection of seventeen chemical elements in the periodic table, namely
scandium, yttrium, and the lanthanoids. Fifteen elements La – Lu are
lanthanoids and fourteen elements Ce – Lu, without lanthanum, are lanthanides
(meaning the elements similar to lanthanum). The lanthanoid series comprise
the fifteen elements with atomic numbers 57 through 71, from lanthanum to
lutetium. Lanthanoids are strongly paramagnetic for all configurations from 4f1
to 4f13; hence, the compounds have been quite extensively applied in
superconductors, magnetic refrigeration, permanent magnets, etc. Scandium
and yttrium are considered rare-earths since they tend to occur in the same ore
deposits as the lanthanoids and exhibit similar chemical properties. Ln
abbreviation often is used as a general symbol for the lanthanide elements. The
partially filled 4f-shell also gives rise to unique optical properties that provide
the basis for the optical applications of lanthanides. Most importantly, the 4f
electrons remain highly localized to the atom and the optical transitions within
the 4f manifold maintain much of an atomic-like character even when the
lanthanide ion is embedded into a solid, therefore exhibit intense narrow-band
luminescence across much of the visible and near infra-red portions of the
spectrum.
Neutral lanthanides (Ln) possess the electron configuration 4fn5s25p66s2
where the number of 4f electrons n ranges from 2 for cerium to 14 for
ytterbium. Lanthanides are most stable in the +3-oxidation state, leading to
high coherent behavior and hence making them difficult to separate and purify.
The preference for the trivalent oxidation state is due in part to the energy of
the 4f electrons being below those of the 5d and 6s electrons (except in the
13
cases of La and Ce). When forming ions, electrons from the 6s and 5d orbitals
are lost first, so that all Ln3+ ions have [Xe]4fn electronic configurations. This,
coupled to the high enthalpies of hydration for trivalent lanthanides, results in
the stability of the +3-oxidation state. In reducing conditions, europium,
samarium and ytterbium can be stable in the divalent form; cerium has also
been known to adopt a +4-oxidation state. This is in contrast to the actinide
series where oxidation numbers up to +8 are known. The fact that the oxidation
state in some cases tends to +2 can be understood by looking at the reduction
potentials for the Ln3+ + e- → Ln2+ process (Figure 2.1). It makes clear why
Ln2+ ions are commonly seen only for a few lanthanides: the majority of the
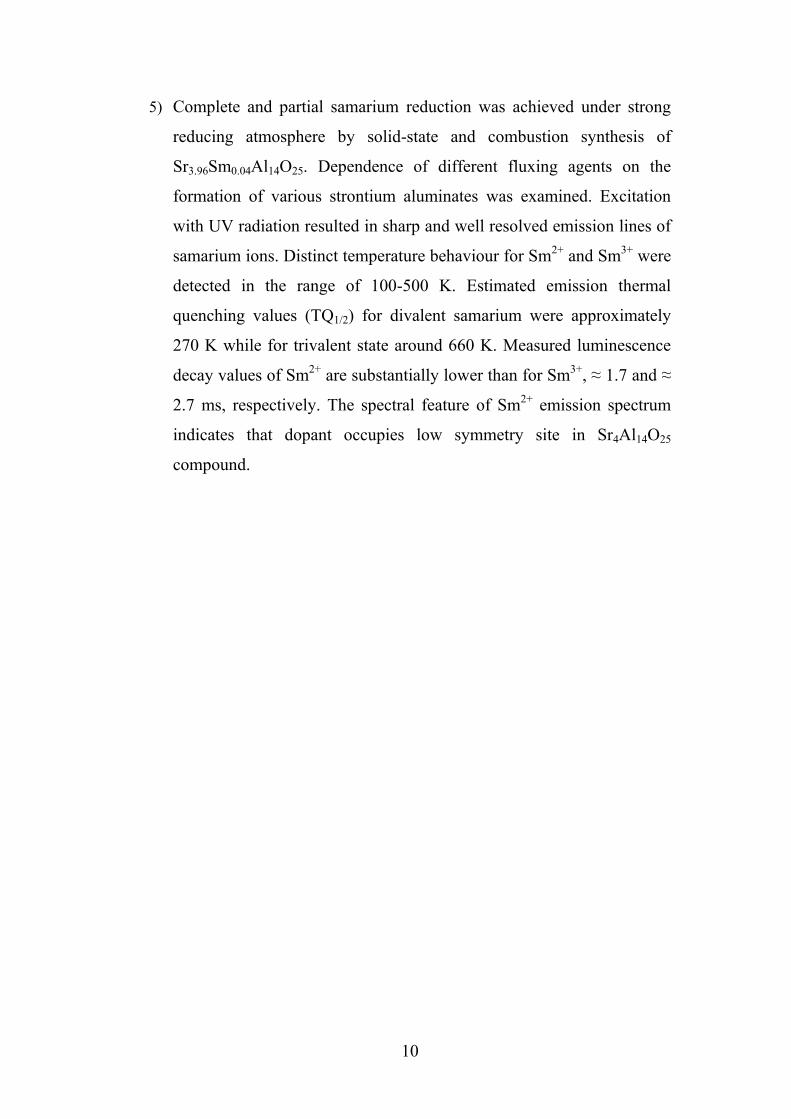
Ln3+ ions have reduction potentials of – 2.3 V or greater [16, 17]. It is clearly
visible why only few suitable compounds for Sm2+ incorporation exist.
Figure 2.1 Reduction potentials for Ln3+ + e- → Ln2+ process.
An interesting property of the lanthanide series is, with a few exceptions,
the decrease in both the ionic and the covalent radii and the increase in
Pauling’s electronegativity with increasing nuclear charge Z. This can be
attributed to the poor shielding abilities of the 4f electrons thus leading to a
diminution of the radial integrals of the outer 5s and 5p electrons with
increasing nuclear charge Z. This effect is the main reason for differences
found in compounds throughout the lanthanide series, e.g. a slightly different
chemistry, but it may also have an influence on the symmetry in ion-implanted
systems.
Another general property of the ionized lanthanides is the large number of
possible coordination numbers found in compounds, leading to a larger number
14
of possible symmetries [18, 19]. Coordination numbers up to 8 and 9 are
frequently found, but higher coordination numbers often exist as well [19, 20].
This is in contrast to the limited number of coordination numbers found for
transition metals. The reason for this can be seen in the more ionic character of
the bonding between lanthanides and surrounding ligands, contrary to an
emphatic covalent character of the bonding in the case of the transition metals.
Lanthanide ions possess relatively high charge densities and have a strong
electrostatic nature in their bonding, as the ions are polarizing and can be
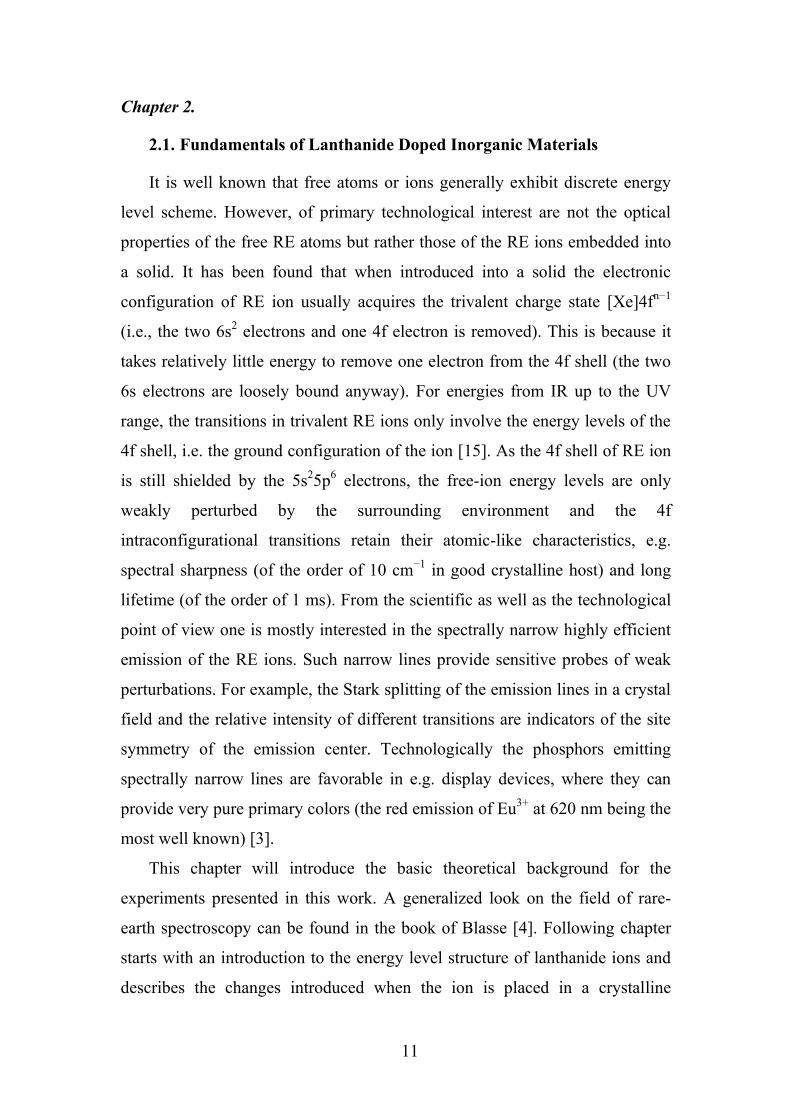
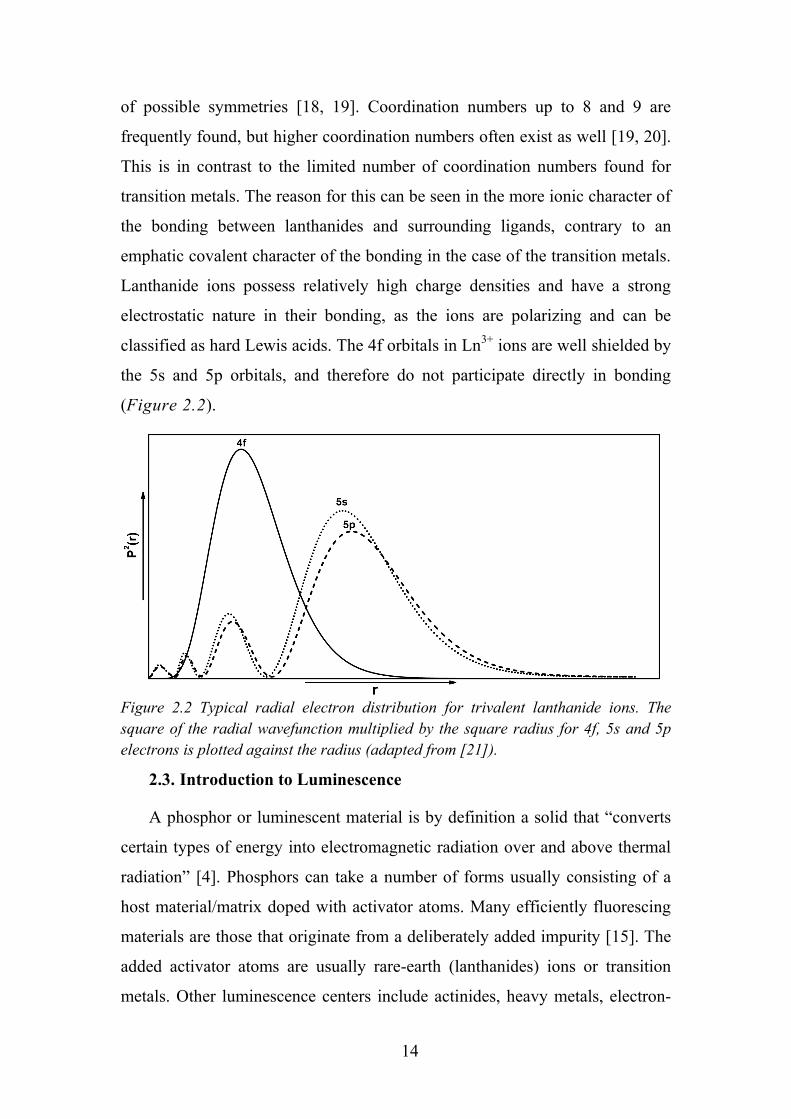
classified as hard Lewis acids. The 4f orbitals in Ln3+ ions are well shielded by
the 5s and 5p orbitals, and therefore do not participate directly in bonding
(Figure 2.2).
Figure 2.2 Typical radial electron distribution for trivalent lanthanide ions. The square of the radial wavefunction multiplied by the square radius for 4f, 5s and 5p electrons is plotted against the radius (adapted from [21]).
2.3. Introduction to Luminescence
A phosphor or luminescent material is by definition a solid that “converts
certain types of energy into electromagnetic radiation over and above thermal
radiation” [4]. Phosphors can take a number of forms usually consisting of a
host material/matrix doped with activator atoms. Many efficiently fluorescing
materials are those that originate from a deliberately added impurity [15]. The
added activator atoms are usually rare-earth (lanthanides) ions or transition
metals. Other luminescence centers include actinides, heavy metals, electron-
15
hole centers and ZnS-type semiconductors. Such solids can be found among
the transition metal compounds and the rare earth compounds of different
types. A large variety of phosphors for diverse technological applications is
known. The scientific models can explain the optical properties of the
phosphors.
The term luminescence comes from the Latin (lumen = light) and was first
introduced as luminescenz by the physicist and historian of science, Eilhardt
Wiedemann in 1888 for "all those phenomena of light which are not solely
conditioned by the rise in temperature", as opposed to incandescence [22].
Luminescence is cold light whereas incandescence is hot light. Luminescence
induced by light energy is termed photoluminescence and is formally divided
into two categories: fluorescence and phosphorescence. Fluorescence is
defined as the process of allowed radiative emission that occurs from a singlet-
excited state to a singlet-ground state. In excited singlet states, the electron in
the excited orbital is paired (of opposite spin) to the second electron in the
ground-state orbital. Consequently, return to the ground state is spin-allowed
and occurs rapidly by emission of a photon. The emission rates of fluorescence
are typically 10-8 s, so that a typical fluorescence lifetime is near 10 ns.
Phosphorescence is emission of light from triplet-excited states, in which the
electron in the excited orbital has the same spin orientation as the ground-state
electron. Transitions to the ground state are forbidden and the emission rates
are slow (10-3 – 100 s), so that phosphorescence lifetimes are typically
milliseconds to seconds. The two terms are still open for discussion. Earlier
literature refers to phosphorescence for emissions with lifetime > 10-3 s,
whereas recent literature suggests lifetime > 10-8 s. Luminescence is an all-
encompassing term that refers to emission of light from any substance and
occurs from electronically excited states. Therefore, luminescence will be used
to describe any radiative transition that cannot be defined as either
fluorescence or phosphorescence, such as samarium luminescence.
16
2.4. Principles of Lanthanide Luminescence
As the 4f electrons of the lanthanides are well shielded from the
environment, the spectroscopic and magnetic properties of these ions (e.g.,
electronic spectra and crystal-field splitting) are largely independent of
environment (solvent, coordinated ligands, etc.). The number (N) of
configurations for n electrons rapidly increases with the number of 4f
electrons:
𝑁 =14!
𝒏! (14 − 𝒏)!, 1 ≤ 𝒏 ≤ 13
The lowest energy term for each ion consistent with the predictions of
Hund’s first and second rules [23, 24]. Since all configurations have different
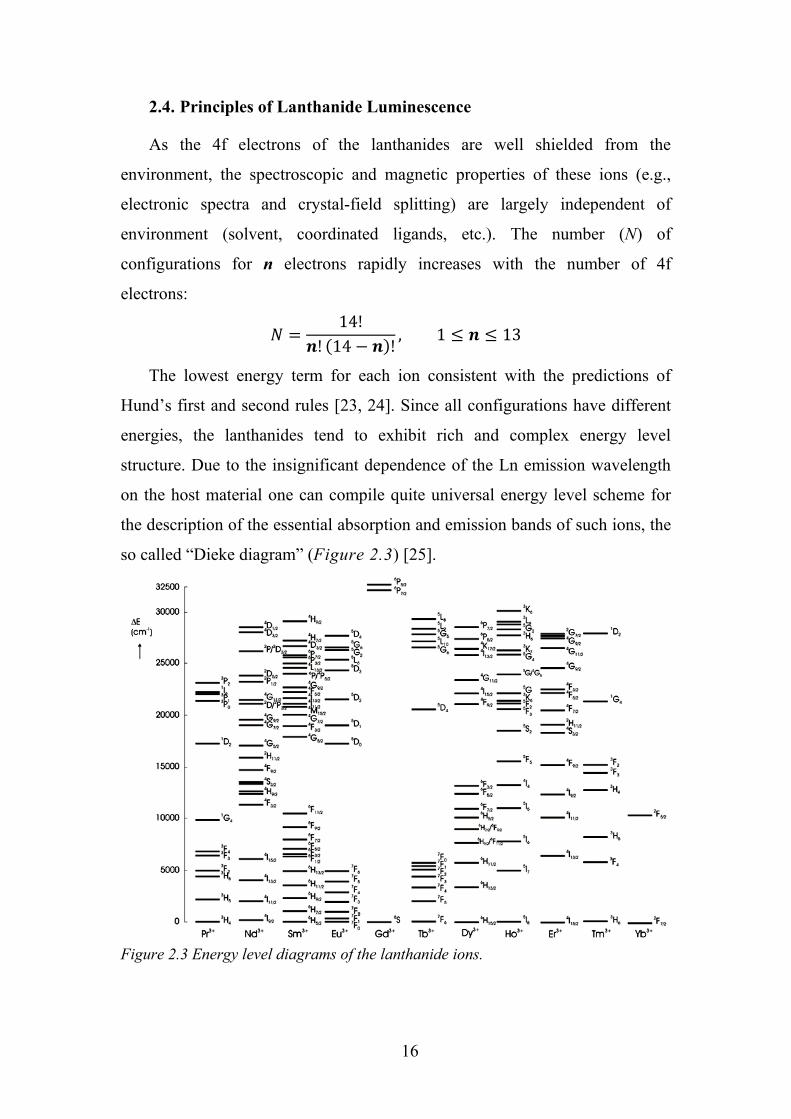
energies, the lanthanides tend to exhibit rich and complex energy level
structure. Due to the insignificant dependence of the Ln emission wavelength
on the host material one can compile quite universal energy level scheme for
the description of the essential absorption and emission bands of such ions, the
so called “Dieke diagram” (Figure 2.3) [25].
Figure 2.3 Energy level diagrams of the lanthanide ions.
17
The energies of the terms are determined by a combination of
interelectronic repulsion, spin-orbit coupling and, in a coordination
environment, the ligand field. The interactions that split up the levels
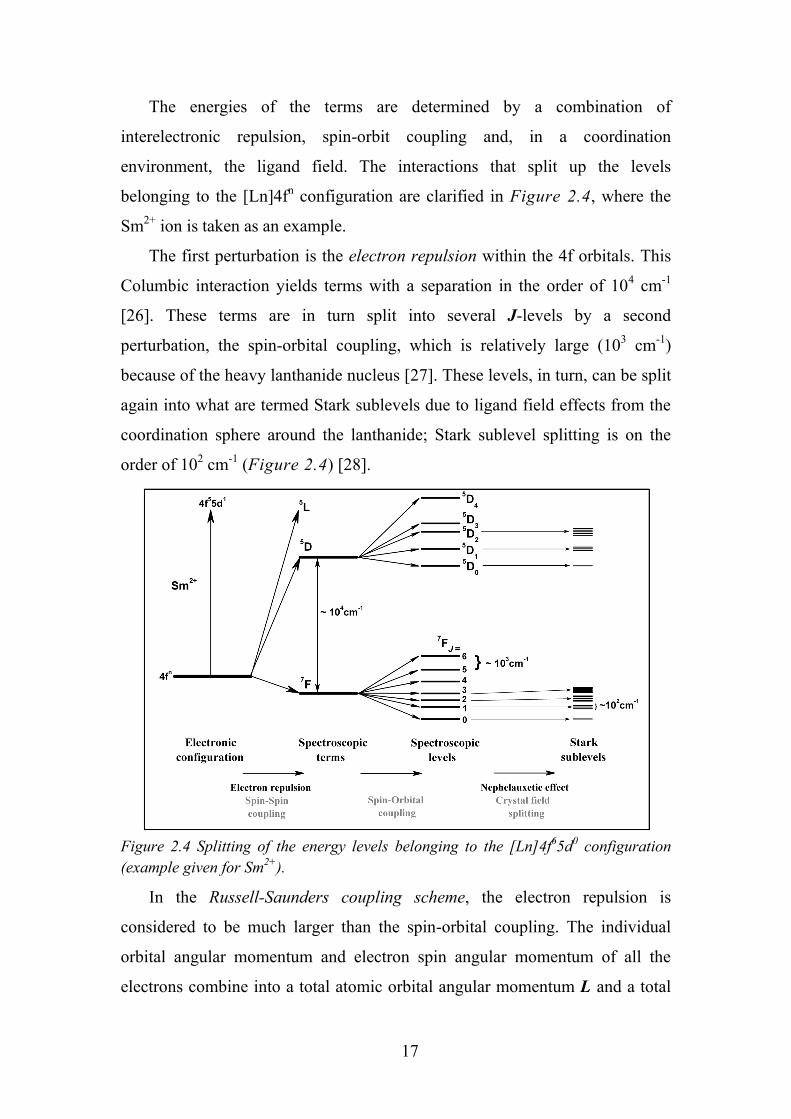
belonging to the [Ln]4fn configuration are clarified in Figure 2.4, where the
Sm2+ ion is taken as an example.
The first perturbation is the electron repulsion within the 4f orbitals. This
Columbic interaction yields terms with a separation in the order of 104 cm-1
[26]. These terms are in turn split into several J-levels by a second
perturbation, the spin-orbital coupling, which is relatively large (103 cm-1)
because of the heavy lanthanide nucleus [27]. These levels, in turn, can be split
again into what are termed Stark sublevels due to ligand field effects from the
coordination sphere around the lanthanide; Stark sublevel splitting is on the
order of 102 cm-1 (Figure 2.4) [28].
Figure 2.4 Splitting of the energy levels belonging to the [Ln]4f65d0 configuration (example given for Sm2+).
In the Russell-Saunders coupling scheme, the electron repulsion is
considered to be much larger than the spin-orbital coupling. The individual
orbital angular momentum and electron spin angular momentum of all the
electrons combine into a total atomic orbital angular momentum L and a total
18
spin angular momentum S. The total angular moment J is given by the
coupling of L and S. This scheme is not correct for the lanthanides but neither
is the j-j coupling scheme where the spin-orbital coupling is larger than the
electron repulsion. It has been found that the LS-coupling describes the lighter
elements, where the electrostatic interaction is relatively strong, whereas in the
heavier atoms the j-j coupling is more appropriate. The lanthanide atoms lie
somewhere between and neither coupling scheme is wholly appropriate. More
accurately, the quantum states of lanthanide atoms and ions can be described as
intermediate coupling states, which can be considered as mixed states (linear
combinations) of several LS states [29]. In the intermediate coupling scheme,
the Coulombic and spin-orbital interactions are simultaneously introduced.
Terms with the same J but different L and S can mix. L and S are no longer
valid quantum numbers, but J is. Consequently free ion levels are described by
the term symbols (2S+1)LJ. The LS notation is most appropriate for the states
near to the ground state. The effect of mixing is relatively small on the energy
of the levels but can be significant on the optical transition probabilities
between the states.
When a lanthanide is surrounded by a coordinating environment, with
inorganic or organic ligands, all the electrons of the system, other than those of
the lanthanide ion itself, destroy the spherical symmetry of the “free ion”.
Usually, this effect is called the crystal-field perturbation. It is a good
approximation to consider only the first coordination sphere, because of the
good shielding of the f electrons. When individual J-levels are split up further
by the crystal field, J mixing is allowed. Thus, L, S and J are no longer valid
quantum numbers but for convenience, the name of the mixed term is derived
from the largest contributing term. As mentioned earlier the average energy
gap introduced between the levels by this perturbation is 102 cm-1. When the
lanthanide is placed in a magnetic field, there is an additional perturbation: the
Zeeman perturbation. All remaining degeneracy is destroyed. This results in
the overall emission peak position remaining largely unchanged as the f-
electrons remain shielded, but the emission profile of a lanthanide (defined as
19
the relative intensity and degree of splitting of emission peaks) can vary greatly
depending on modulation of these influences [30, 31]. The number of Stark
sublevels depends on the site symmetry of the lanthanide ion, and these can be
thermally populated at room temperature, yielding emission spectra that are
more complex.
Ions with an odd number of 4f electrons, after forming Ln ions, have
electronic doublet levels, so-called Kramer’s doublets, with magnetic moments
of the order of a Bohr magneton. For non-Kramer’s ions, with an even number
of electrons, the levels are electronic singlets and the electronic angular
momentum is quenched by the crystal field, except if the ions are located in a
site with axial or higher symmetry, in which case so called non-Kramer’s
doublets occur [32, 33]. Ions with a non-quenched electronic angular
momentum experience large first-order Zeeman and hyperfine interactions.
According to Kramer’s theorem, the maximum number of states arising from a
J-manifold of an electronic configuration with odd number of electrons is (2J
+ 1)/2; each level remains at least doubly degenerated. Such two-fold
degeneracy can be removed, in principle, by applying external magnetic field.
For electronic configurations with even number of equivalent electrons, the J-
state degeneracy can be removed completely and the number of the states is 2J
+ 1. Based on this it is expected that the luminescence spectra of Ln ions can
be used as probes for local crystal field symmetry at the impurity centre.
Due to spin-orbit coupling, the excited states of the lanthanides are well
separated from the ground state manifold. Thus, the excited states are
thermally inaccessible and ideal for electronic transitions. With the exceptions
of the 4f0 and 4f14 species (La3+ and Lu3+), all lanthanide ions absorb
electromagnetic radiation, primarily in the visible region, which is manifested
in f-electrons from the partially filled 4f subshell being excited from the
ground state to an excited state.
4f-4f transitions are forbidden by the Laporte selection, which means
transition cannot occur between the same shells (ΔL ≠ 0). In other words, the
parity of final and initial state should be changed to obtain the allowed
20
transition. However observation of these transitions is explained through
simple configuration mixing caused by a non-centrosymmetric crystal field,
allowing opposite–parity excited configuration to become slightly mixed into
4fn by the Judd [34] and Ofelt [35] theory. Thus, when the ion is located at a
site without inversion symmetry, the electric dipole transition may become
allowed by the admixture of states from opposite-parity configuration (like 5d)
into 4f wave functions, due to the odd-parity crystal field [36]. The transitions
are derived, in most cases, due to forced electrical dipole transitions. In some
cases, considerable contribution can also be made by magnetic dipole
transitions. However, electric dipole transitions are much weaker in
lanthanides [21]. Electronic transitions must involve promotion of an electron
without a change in its spin (ΔS = 0) and with a variation of either the total
angular momentum and the total angular quantum number of one unit at most
(ΔL = 0, ±1; ΔJ = 0, ±1). Though absorption of radiation can in theory promote
the lanthanide ion to any energetically accessible state, emission normally
occurs only from the lowest lying spectroscopic level of the first excited term
due to rapid internal conversion [4]. In cases of low symmetry or vibronic
coupling, the f-f transitions can gain intensity through f- and d-state mixing
with higher electronic states of opposite parity [37]. Broad 4fn → 4fn-15d1
transitions can also be seen in the infrared region for some lanthanides. These
transitions can be attributed to another class of important spectroscopic
features emerging from lanthanide ions. The 5d states differ from 4f states by
their remarkably stronger coupling to crystal lattice vibrations and less
localized nature. Furthermore, inter-configurational transitions from 4fn–15d1
state are parity allowed resulting in 104 times higher absorption cross section
compared to f-f transitions. Due to the latter and relatively high energy needed
for the excitation, these transitions are becoming popular in UV lasers and
scintillator applications [38].
21
2.5. Intraconfigurational f-f Transitions Selection Rules
Electronic transitions occur through the interaction of atoms or molecules
with the electric or the magnetic component of electromagnetic radiation.
Since the start- and end-state of these transitions have the same parity, electric-
dipole transitions are forbidden by the Laporte selection rule and only
magnetic dipole transitions can occur [39]. Magnetic dipole transitions are
generally weaker than electric dipole transitions by a factor of 105. In non-
centrosymmetric systems, electric dipole transitions can be induced by mixing
of configurations of opposite parity (e.g. 4fn-15d1) in the 4fn configuration by
the crystal-field potential (this is the perturbation of the lanthanide energy
states caused by the interaction of the f-electrons with the crystal field) [34, 35]
or by vibronic interactions. These induced electric dipole transitions have a
small intensity. The molar absorption for 4f-4f transitions typically are around
10 %Lmol-1cm-1. In the case of crystallographic sites with inversion symmetry,
the Laporte selection rule can be weakened by non-centric distortions like
lattice defects. In general, the weakening for sites with inversion symmetry is
still considerably smaller than the weakening for non-inversion sites. Magnetic
dipole transitions have different selection rules than the electric dipole
transitions [40]. Finally, the atomic spectra have to obey the following
selection rules:
– ΔS = 0, the overall spin is not allowed to change, because light does not
affect the spin.
– ΔL = 0, ±1, with Δl = ±1, the orbital angular momentum of an
individual electron must change.
– ΔJ = 0, ±1, but J = 0 ↔ J = 0 is forbidden.
– Laporte selection rule, which forbids electric dipole transitions between
levels with the same parity, examples are electronic transitions within
the d-shell, within the f-shell, and between d and s shells.
22
In the case of lanthanide ions with an even number of electrons some
additional selection rules apply: (1) J = 0 ↔ J‘= 2, 4, 6 should be strong and
(2) J = 0 ↔ J‘= 1, 3, 5 should be weak.
Magnetic dipole transitions within the 4fn configuration, which obey the
selection rule ΔJ = 0, ±1 are allowed (except for J = 0 to J = 0), but have low
strengths. The electric dipole intra-4f transitions are in principle parity
forbidden, and those transitions that do not occur within the ground multiplet
may also be spin-forbidden (ΔS ≠ 0). However, in an asymmetric environment,
the electric dipole f-f transitions become weakly allowed by mixing of opposite
parity wave functions (primarily the 5d wave functions) into the 4f wave
functions. In other words the parity forbidden intra-4f-transitions gain some
intensity from the allowed 4f-5d transitions [37].
The spin selection rule is relaxed by the fact that heavy atoms have large
spin-orbit couplings. Because the strengths of these induced electric dipole
transitions are in the same order of magnitude as those of magnetic dipole
transitions, both transitions can be observed in lanthanide absorption and
emission spectra. The forbidden character of intra-4f transitions causes them to
have low intensities and relatively long luminescence lifetimes (in the range of
μs to ms).
As mentioned before, f-electrons are not much influenced by local changes
in the environment, because of the efficient shielding by filled 5s and 5p
orbitals. As a result, the intensities of the transitions are, in general, not much
affected by the environment. Some transitions are however very sensitive to
small changes of crystal field. These transitions are called hypersensitive
transitions and obey to the selection rules │ΔS│= 0, │ΔL│≤ 2 and │ΔJ│≤ 2
[41]. The intensities of these transitions may be up to 200 times larger than the
corresponding transition while the other transitions are generally
approximately the same. The hypersensitive transitions are useful tools in the
analysis of lanthanide spectroscopic data.
23
2.6. Configurational Coordinate Diagram
The energy level diagram of lanthanide metal ions forms a starting point
for the analyses of their luminescence properties. The configurational
coordinate model is often used to explain optical properties of a localized
center, particularly the effect of lattice vibrations. In this model, a luminescent
ion and the ions at its nearest neighbor sites are selected for simplicity. In most
cases, one can regard these ions as an isolated active center by neglecting the
effects of other distant ions. In this way, the huge number of actual vibrational
modes of the lattice can by approximated by a small number or a combination
of specific normal coordinates. These normal coordinates are called the
configurational coordinates. The configurational coordinate model explains
optical properties of a localized center on the basis of potential curves, each of
which represents the total energy (E) of the ion in its ground or excited state as
a function of the configurational coordinate (Figure 2.5). Here, the total
energy means the sum of the electron energy and ion energy. To understand
how the configurational coordinate model is built, one is first reminded of the
adiabatic potential of a metal-ligand dimer, in which the variable on the
abscissa is simply the inter-atomic distance. This simple model can explain a
number of facts qualitatively, such as:
– Stokes’ law; i.e., the fact that the energy of absorption is higher than
that of emission in most cases. The energy difference between the two is
called the Stokes’ shift;
– widths of absorption or emission bands and their temperature
dependence;
– thermal quenching of luminescence.
In Figure 2.5 R0 is the interatomic distance at the equilibrium of the
ground state, and E0 is the total energy at R = R0. The spatial distribution of an
electron orbital is different between the ground and excited states, giving rise
to a difference in the electron wavefunction overlap with neighboring ions.
This difference further induces a change in the equilibrium position and the
24
force constant of the ground and excited states, and is the origin of Stokes’
shift. In the excited state, the orbital is more spread out, so that the energy of
such an electron orbital depends less on the configuration coordinate; in other
words, the potential curve has less curvature. The nucleus of an emitting ion
stays approximately at the same position throughout the optical processes. This
is called the Franck-Condon principle. Consequently, electronic state transition
times are much shorter than vibrational relaxation of nucleus and therefore
assumed to occur in static conditions (vertical lines for transitions). This
approximation is quite reasonable since an atomic nucleus is heavier than an
electron by 103 to 105 times. The optical absorption proceeds from the
equilibrium position of the ground state. The probability for an excited electron
to lose energy by generating lattice vibration is from 1012 to 1013 s−1, while the
probability for light emission is at most 109 s−1. Consequently, state B relaxes
to the equilibrium position C, because relaxation from excited vibrational
states is much faster than emission [42]. This is followed by the emission
process C→D and the relaxation process D→A, completing the cycle. The
excitation (absorption) and emission spectra contains one sharp line at the
same position, corresponding to the transition from the lowest level of ground
and excited states. This transition is called the zero-vibrational or zero-phonon
transition, since no vibrations are involved.
At temperatures above 0 K, electrons are distributed over different
vibrational levels according to the Boltzmann’s law. The amplitude of this
oscillation causes the spectral width of the absorption transition. If the
temperature is high enough, electrons in the excited state can intersect the
ground state curve (point Q in Figure 2.5b) allowing vibrational relaxation
(via phonon release) to the ground state without any radiative emission [43]. It
can be described as the absorption of thermal energy (phonon) from point C,
which excites the electrons to the intersection point Q. Since non-radiative
processes now can take place, the observed luminescence intensity from a large
quantity of excited ions will diminish, explaining the thermal quenching
behavior that is observed for most phosphors. When the temperature is
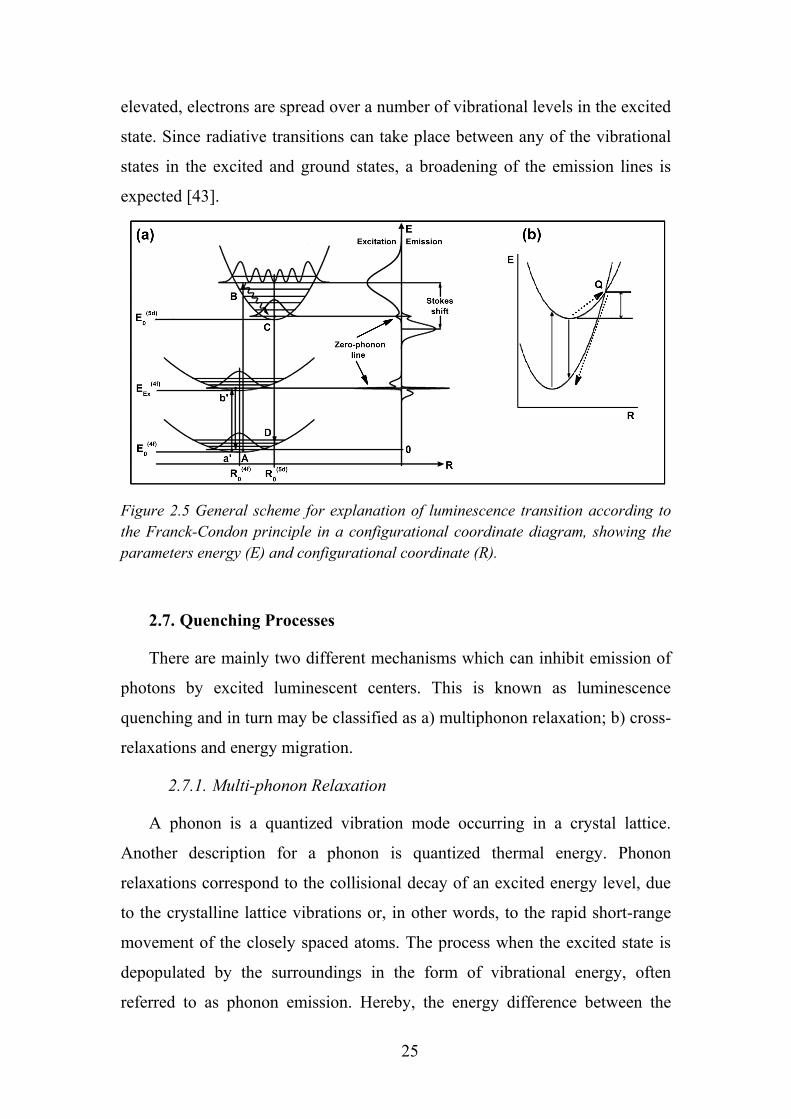
25
elevated, electrons are spread over a number of vibrational levels in the excited
state. Since radiative transitions can take place between any of the vibrational
states in the excited and ground states, a broadening of the emission lines is
expected [43].
Figure 2.5 General scheme for explanation of luminescence transition according to the Franck-Condon principle in a configurational coordinate diagram, showing the parameters energy (E) and configurational coordinate (R).
2.7. Quenching Processes
There are mainly two different mechanisms which can inhibit emission of
photons by excited luminescent centers. This is known as luminescence
quenching and in turn may be classified as a) multiphonon relaxation; b) cross-
relaxations and energy migration.
2.7.1. Multi-phonon Relaxation
A phonon is a quantized vibration mode occurring in a crystal lattice.
Another description for a phonon is quantized thermal energy. Phonon
relaxations correspond to the collisional decay of an excited energy level, due
to the crystalline lattice vibrations or, in other words, to the rapid short-range
movement of the closely spaced atoms. The process when the excited state is
depopulated by the surroundings in the form of vibrational energy, often
referred to as phonon emission. Hereby, the energy difference between the

26
excited states is transferred to one or more phonons. This relaxation is
normally described as a leakage process. The effectiveness of this process
depends on the availability of high-energy vibrations in the surroundings and
the energy difference between the energy levels of the lanthanide ion.
Multiphonon relaxations between two energy states occur by the simultaneous
emission of several phonons that are sufficient to conserve the energy of the
transition. Table 2.1 reports typical phonon energies of different matrices; the
probability of multiphonon relaxation may be assessed by using a simple
energy gap model [44]. To reach luminescence from an ion with high radiative
emission efficiencies the non-radiative relaxation caused by multiphonon
relaxation has to be minimized. For this case large energy-gaps, in the region
of 103 − 104 cm−1, between the excited states and the next lowest levels are
useful. Additionally minimizing the highest-phonon-energy of the hosts leads
to an increase of the number of required phonons for the multiphonon
relaxation to bridge this energy gab. The more phonons are needed to bridge
the gap, the higher the efficiency of the radiative depopulation. The intensity of
the vibronic transition is dependent on the square overlap integral (Franck-
Condon factor) of the initial and final vibrational states and this overlap
decreases rapidly as the number of vibrational quanta increases [45]. This is
summarized in the theory of the energy gap law [46]. It is common to assume
that non-radiative relaxation is inefficient if more than 5 − 7 phonons are
necessary to bridge the gap.
Table 2.1 The maximum of phonon energy of the various hosts.
27
2.7.2. Cross-relaxation and Energy Migration
Cross-relaxation and on the other hand cooperative up-conversion
processes leads to fluorescence quenching, i.e. to the decrease of fluorescence
intensity when the lanthanide concentration is increased. Cross-relaxation is
the full or partial transfer of excitation energy to an acceptor in a lower level.
This process can be very efficient, if the energy differences in the participating
donor and acceptor levels are resonant or the energy needed to excite the
acceptor is slightly smaller than the energy provided by the donor. With
increasing concentration of lanthanide ions, the ion spacing decreases and may
be small enough to allow them to interact and transfer energy. Cross-relaxation
may occur between lanthanide ions if they have two pairs of energy levels
characterized by the same energy gap ΔE. An excited ion D (donor) transfers
half of its energy to a ground-state ion A (acceptor), so that both ions move to
a same intermediate level, from which they decay non-radiatively to the ground
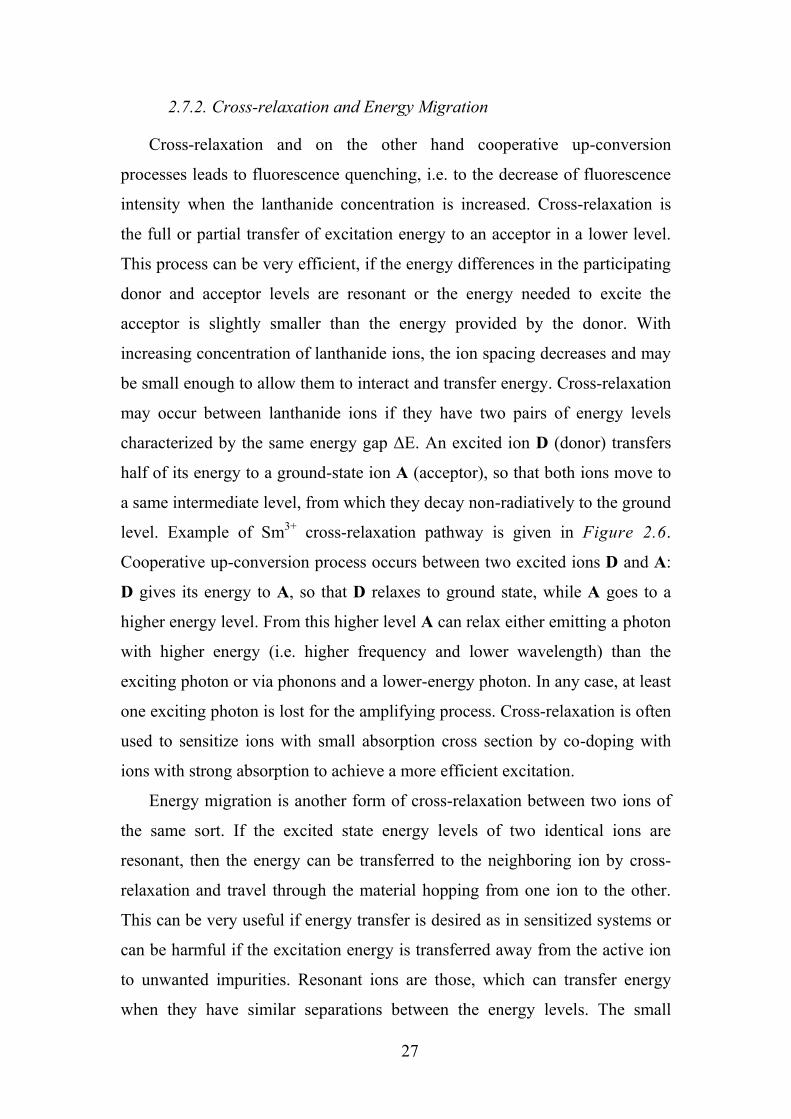
level. Example of Sm3+ cross-relaxation pathway is given in Figure 2.6.
Cooperative up-conversion process occurs between two excited ions D and A:
D gives its energy to A, so that D relaxes to ground state, while A goes to a
higher energy level. From this higher level A can relax either emitting a photon
with higher energy (i.e. higher frequency and lower wavelength) than the
exciting photon or via phonons and a lower-energy photon. In any case, at least
one exciting photon is lost for the amplifying process. Cross-relaxation is often
used to sensitize ions with small absorption cross section by co-doping with
ions with strong absorption to achieve a more efficient excitation.
Energy migration is another form of cross-relaxation between two ions of
the same sort. If the excited state energy levels of two identical ions are
resonant, then the energy can be transferred to the neighboring ion by cross-
relaxation and travel through the material hopping from one ion to the other.
This can be very useful if energy transfer is desired as in sensitized systems or
can be harmful if the excitation energy is transferred away from the active ion
to unwanted impurities. Resonant ions are those, which can transfer energy
when they have similar separations between the energy levels. The small
28
mismatch in energy can be compensated by the emission or uptake of a
phonon. An increase in the doping concentration leads to a faster energy
migration through the material, making the chance of meeting a quenching site
higher. For reasons of cross-relaxation and energy migration, high doping
concentrations often lead to a decrease in luminescence intensity and
luminescence lifetime [47].
Figure 2.6 Energy level diagram showing cross-relaxation channel for Sm3+-doped PKFBASm glasses [48].
29
Chapter 3. Characteristics of Samarium
3.1. The Ground State of Samarium Ion
Energy levels of free rare-earth ions are derived starting from classical
Russell-Sounders approximation. Electrons in a free atom reside inside a shell
and are characterized by a particular value of n, the principal quantum number.
Within each shell electron can reside on l = n − 1 sub shells. These sub shells
are sometimes referred to s, p, d, f etc. orbitals, depending on the value of the
orbital quantum number l (l = 0, 1, 2, 3 for the s, p, d, f orbitals). A quantum
mechanics approach to determine the energy of electrons in an atom or ion is
based on the results obtained by solving the Schrödinger wave equation for the
hydrogen atom. The various solutions for the different energy states are
characterized by the three quantum numbers: n, l and ml. A fourth quantum
number, which is denoted as ms and describes the electron spin states, is also
added to the final set of quantum numbers, uniquely describing a particular
state.
The electronic configuration of Sm atom is, for example:
Sm0 → 1s2 2s2 2p6 3s2 3p6 3d10 4s2 4p6 4d10 4f6 5s2 5p6 6s2
In short form – [Xe]4f55d16s2 for idealized and [Xe]4f66s2 for observed
configuration. The discrepancy arises because of comparable energy of the 5d
and 4f orbitals, so that is why the distinction between the two is not easy.
When samarium is incorporated into materials it become triply or doubly
ionized, e.g. to Sm3+ or Sm2+. Therefore, the electronic configuration must be
changed as below.
Sm3+ → 1s2 2s2 2p6 3s2 3p6 3d10 4s2 4p6 4d10 4f5 5s2 5p6
Sm2+ → 1s2 2s2 2p6 3s2 3p6 3d10 4s2 4p6 4d10 4f6 5s2 5p6
The electrons that lie inside of the 4f6 shell are shielded by the 5s25p6
closed subshells. The ground electronic configuration, with taking the angular
momentum and the total spin into account, amounts to 2002 for Sm3+ and 3003
30
for Sm2+ for the perfectly isolated samarium ions [30]. The degeneracy is
removed by applying the spin-spin, orbital-orbital and spin-orbital interaction.
Finally, it is possible to determine which electronic levels are going to be
allowed by the selection rules. Below, the fundamental electronic
spectroscopic notation of Sm2+/3+ is introduced.
The ground state can be assigned by Hund’s rules. These rules can be
summarized as follows. The notation S and L indicate the spin angular
momentum and orbital angular momentum, respectively.
1. For a given electron configuration, the term with maximum multiplicity
has the lowest energy. Since multiplicity is equal to (2S + 1), this is also
the term with maximum S.
→ Spin – Spin Interaction
2. For a given multiplicity, the term with the largest value of L, has the
lowest energy.
3. For a given term, in an atom with outermost subshell half-filled or less,
the level with the lowest value of J, lies lowest in energy. If the
outermost shell is more than half-filled, the level with highest value of
J, is lowest in energy. J is the total angular momentum, J = L + S.
→ Spin – Orbital Interaction
4. The wave function (product of angular and spin wave function) should
be anti-symmetric.
The spectroscopic notation of splitting energy levels under spin-spin
interaction is (2S+1)Γ, where Γ = S, P, D, F, G, H, J, K, L… if the angular
momentum L equals to 0, 1, 2, 3, 4, 5, 6, 7, 8… . Under the spin-orbital
interaction it is necessary to consider the total angular momentum J, where J =
L + S (|L - S| ≤ J ≤ L + S). This interaction will split (2S+1)Γ into (2S+1)ΓJ.
31
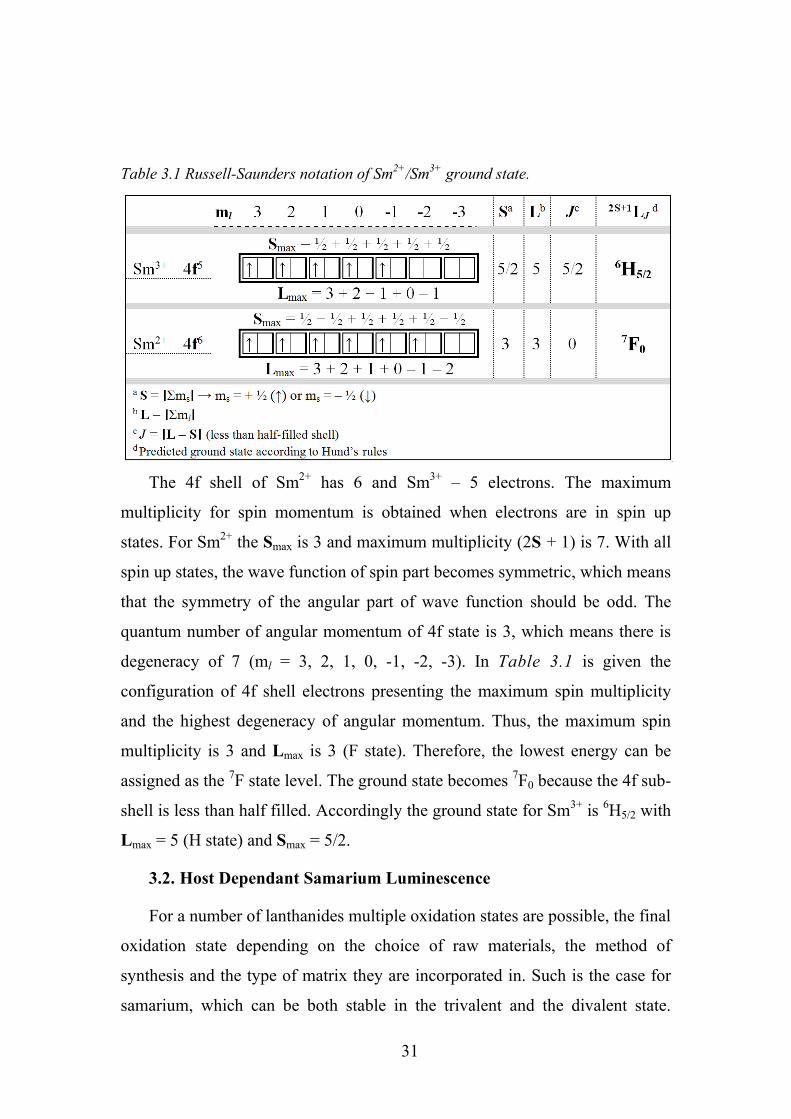
Table 3.1 Russell-Saunders notation of Sm2+/Sm3+ ground state.
The 4f shell of Sm2+ has 6 and Sm3+ – 5 electrons. The maximum
multiplicity for spin momentum is obtained when electrons are in spin up
states. For Sm2+ the Smax is 3 and maximum multiplicity (2S + 1) is 7. With all
spin up states, the wave function of spin part becomes symmetric, which means
that the symmetry of the angular part of wave function should be odd. The
quantum number of angular momentum of 4f state is 3, which means there is
degeneracy of 7 (ml = 3, 2, 1, 0, -1, -2, -3). In Table 3.1 is given the
configuration of 4f shell electrons presenting the maximum spin multiplicity
and the highest degeneracy of angular momentum. Thus, the maximum spin
multiplicity is 3 and Lmax is 3 (F state). Therefore, the lowest energy can be
assigned as the 7F state level. The ground state becomes 7F0 because the 4f sub-
shell is less than half filled. Accordingly the ground state for Sm3+ is 6H5/2 with
Lmax = 5 (H state) and Smax = 5/2.
3.2. Host Dependant Samarium Luminescence
For a number of lanthanides multiple oxidation states are possible, the final
oxidation state depending on the choice of raw materials, the method of
synthesis and the type of matrix they are incorporated in. Such is the case for
samarium, which can be both stable in the trivalent and the divalent state.
32
Although samarium is much more stable in the trivalent state than divalent,
consequently only several compounds with Sm2+ are known. In that respect,
the oxidation state of the samarium in the different lattices could well differ
depending on the synthesis temperature and atmosphere used. The
luminescence properties of samarium in divalent state are different from the
trivalent state. Characteristic Sm3+ (4f5) and Sm2+ (4f6) transitions can be found
in the red part of the visible spectrum (550 – 850 nm). Since the valence
change is interconnected to measured optical properties, samarium luminescent
and chemical properties are discussed together.
The spectroscopic properties of triply ionized samarium ion doped into a
variety of host matrices have been extensively studied [49-52]. It was observed
the strong fluorescence in the visible region and discovered that the radiative
property of the dopant depends on the chemical environment and the host
materials into which it is doped.
The Sm3+ ion has a 4f5 electron configuration, which is characterized by
198 2S+1LJ free-ion levels. In the presence of a low-symmetric crystal field,
these free-ion manifolds split into a total of 1001 crystal-field levels (non-
Kramer’s degeneracy). Usually the crystal-field fine structure is not resolved
due to inhomogeneous line broadening and only emission bands between 2S+1LJ manifolds are observed. Only a limited number of the 198 2S+1LJ
manifolds can be observed experimentally. Moreover, many of the manifolds
are lying so close to each other that is why it is not possible to determine their
exact maximum.
The initial level for all the transitions is the 6H5/2 ground state of Sm3+
(Figure 3.1). The first excited state 6H7/2 is only ≈ 1100 cm-1 above the ground
state, but no transitions starting from this level could be detected [53]. The
observed emission is due to transitions from the 4G5/2 level to the various
excited 6HJ and 6FJ levels. When Sm3+ is excited by blue, violet or ultraviolet
light, an intense orange luminescence is observed. When any of the energy
levels above 4G5/2 is excited, there is a fast non-radiative relaxation to this
emitting level. Consequently, the same luminescence spectrum is obtained
33
regardless the excitation wavelength (same relative intensities). However, the
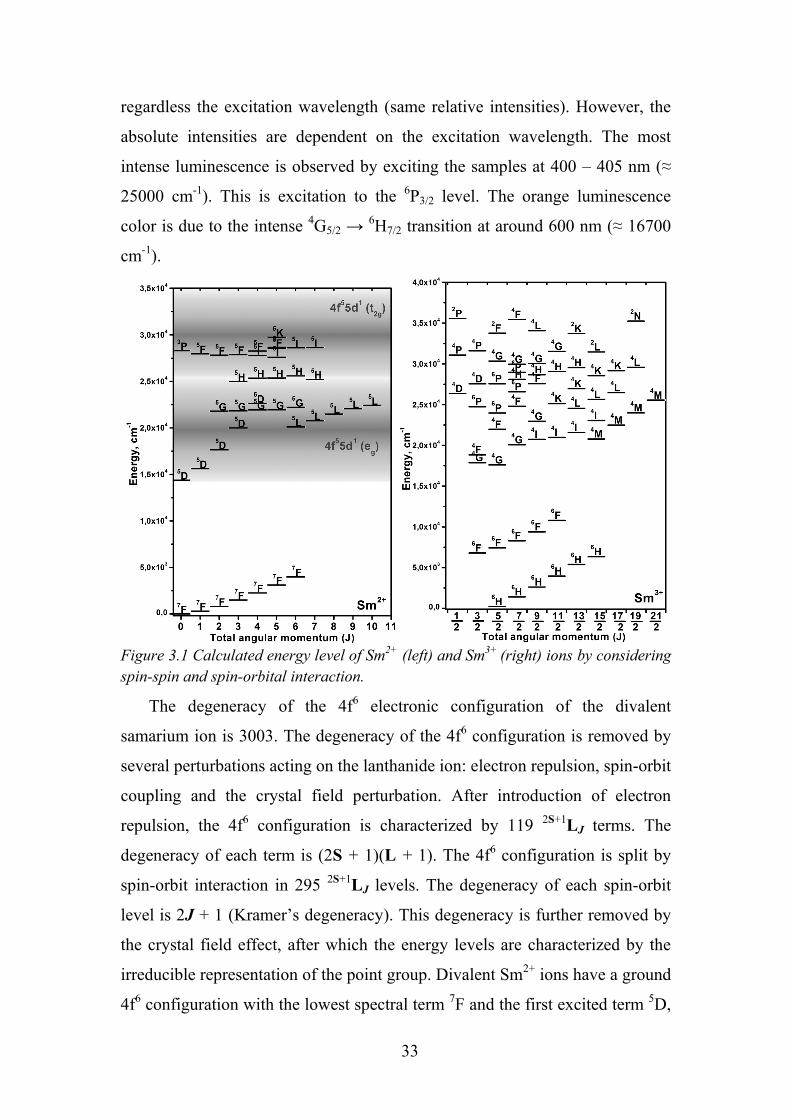
absolute intensities are dependent on the excitation wavelength. The most
intense luminescence is observed by exciting the samples at 400 – 405 nm (≈
25000 cm-1). This is excitation to the 6P3/2 level. The orange luminescence
color is due to the intense 4G5/2 → 6H7/2 transition at around 600 nm (≈ 16700
cm-1).
Figure 3.1 Calculated energy level of Sm2+ (left) and Sm3+ (right) ions by considering spin-spin and spin-orbital interaction.
The degeneracy of the 4f6 electronic configuration of the divalent
samarium ion is 3003. The degeneracy of the 4f6 configuration is removed by
several perturbations acting on the lanthanide ion: electron repulsion, spin-orbit
coupling and the crystal field perturbation. After introduction of electron
repulsion, the 4f6 configuration is characterized by 119 2S+1LJ terms. The
degeneracy of each term is (2S + 1)(L + 1). The 4f6 configuration is split by
spin-orbit interaction in 295 2S+1LJ levels. The degeneracy of each spin-orbit
level is 2J + 1 (Kramer’s degeneracy). This degeneracy is further removed by
the crystal field effect, after which the energy levels are characterized by the
irreducible representation of the point group. Divalent Sm2+ ions have a ground
4f6 configuration with the lowest spectral term 7F and the first excited term 5D,
34
which split into seven multiplets 7F0 to 7F6 and five – 5D0 to 5D4, respectively,
due to the spin-orbit interaction. With these splittings, the luminescence
spectrum of Sm2+ is expected to resemble closely the isoelectronic situation of
Eu3+. However, the first excited 4f55d1 configuration for Sm2+, located in the
visible and near UV region, is energetically much lower than for Eu3+. This in
turn affects various luminescence features of the Sm2+ doped crystals, which
are well known to depend on the relative position of the lowest 4f55d1 levels
with respect to the excited 5D0 multiplet of 4f6. Therefore, the excitation
mechanism of Sm2+ luminescence is quite different from for trivalent
lanthanide ions. The parity-allowed transition 4f6 → 4f55d1 can generate
notable luminescence and offers enough intensity for the presented optical
measurements.
Divalent samarium is a lanthanide ion capable of exhibiting both sharp line
and broadband emission spectra, depending on the choice of the host material
and the synthesis conditions. The prevailing type of emission is determined by
the location of the lowest (emitting) levels due to 4f5d1 and 4f5 electron
configurations relative to one another. Sm2+ (4f6) has its levels arising within
4f-configuration at low energies (5D0 at about 700 nm, 14300 cm-1) and
exhibits 4f–4f emissions in quite a number of compounds, even at room
temperature. The position of the 4f55d1 excited levels depends on several
factors, such as the crystal field strength and bond covalence between the
luminescence center and the ligands. The 4f55d1 excited levels are split into the
lower eg and higher t2g states (in Oh symmetry), where energy separation
depends on crystal field strength (Figure 3.1). Because of the large spatial
extent of the 5d wavefunction it is vibrationally broadened much more than the
forced electric-dipole transitions, which occur within the 4f shell. 5d → 4f
emission bands in materials are typically several tens of nanometers in width.
The luminescence properties of Sm2+ are sensitive to the temperature. At low
temperatures, the 4f6→4f6 sharp transitions were detected, while at high
temperatures usually additional allowed broadband transition 4f55d1→4f6
appears, owing to the thermal population of the 4f55d1 lower level.

35
Figure 3.2 Energy level diagram of trivalent (black) and divalent (grey) samarium. The Sm2+ energy levels are a combination of the 4f6 and the 4f55d1 states [36, 54]. The 4f55d1 states of Sm3+ are in the far VUV (with energies of about 70000 cm-1) [25]. All excited states are highlighted with a grey background. Closely spaced levels are depicted as bands.
Moreover, it can be seen that Sm2+ offers some advantages by comparing
the trivalent energy level of samarium with the divalent one (Figure 3.2). The
normal 4f6 energy levels are superimposed by the broad energy levels of the
4f55d1. For qualitative explanation of excitation data a superposition of the
multiplet structure of the 4f5 core and the 5d1 crystal-field levels is applied [37,
55]. 5d levels, in low symmetry site, can split into maximum five components
which can couple with 4f5(6HJ) and 4f5(6FJ) core electron substates. These
energy levels mainly increase the absorption in the green, blue and UV spectral
range.
Usually, there are two kinds of methods for the reduction of Sm3+ to Sm2+
ions. The first one is heating the Sm3+ ions-doped materials in a chemical
reducing atmosphere like H2/N2 mixture gas, which is effective to reduce Sm3+
to Sm2+. The second one is to irradiate the Sm3+-doped samples with high-
energy radiation, such as femtosecond laser [56], γ-ray irradiation [57], β-
irradiation [58], and X-ray [59]. During the irradiation, free electrons and holes
are created. Some electrons can be trapped by Sm3+ ions, leading to the
formation of Sm2+ ions and holes are trapped by other defects. Hence, the
luminescence of Sm2+ ions is highly dependent on the sample preparation
conditions, because of the different defects created by different methods.
36
The halide compounds are the best-known materials for divalent samarium
incorporation. These comprise the alkaline-earth halides MX2 and
halogenofluorides MXF (M = Ca, Sr, Ba; X = Cl, Br), the perovskites ABF3 (A
= Na, K, Rb; B = Ca, Mg) and the alkali halides MX (M = Na, K, Rb; X = Cl,
Br, I) [60-63]. In all cases strong reducing conditions were used for samarium
reduction. In addition, phosphates (KSrPO4) and borophosphates (BaBPO5)
showed suitable characteristics for Sm2+ incorporation [64, 65]. Doped BaSO4
also demonstrated samarium reduction [66]. However, there are reports on
unusual samarium reduction in high temperature under air. There are only three
compounds obtained showing such behavior, e.g. SrB4O7, SrB6O10 and
BaB8O13 [67, 68]. Following the above mentioned results, few conditions for
divalent lanthanide state stabilization in inorganic hosts can be summarized:
(1) it is necessary to avoid any oxidizing ions in the structure (NO3-, etc.); (2)
suitable crystallographic site for Sm2+ should be divalent; (3) the substituted
cation radius have to be similar; (4) the coordination number (CN) of
substituted cation is expected as high as possible [69, 70]. Besides, the
tetrahedral anion groups (BO4, SO4, PO4 and SiO4) in the structure are
favorable, due to the lower binding energies.
Sm2+/Sm3+-doped materials, however, are generally observed to be
efficient phosphors under ultraviolet or visible excitation and one can
reasonably expect that their luminescent properties may be of some interest for
industrial applications, in fluorescent lamps for example, where single crystals
are not needed. In the framework of an exploration on Sm2+-doped compounds,
it have been attempt to work out a simple and reliable method to prepare
powder samples containing samarium in the divalent state as impurity.
3.3. Samarium as Structural Probe
The idea of crystal symmetry sensing via lanthanide ion photo-luminescent
probes is not new. Lanthanide emission profiles have complex character due to
Stark sublevel splitting, which is largely dependent on the site symmetry of the
central lanthanide ion. Thus, if the emission (or the absorption) spectrum of a

37
pure lanthanide compound is known, it is in principle possible to determine the
point group of the lanthanide site. As described earlier the electric dipole
transition 5D0-7F2 and magnetic dipole transition 5D0-7F1 of Eu3+ have
successfully been used to probe the site symmetry changes in low symmetry
crystal sites [71, 72]. However, the group theory and resulting crystal-field
parameterization of lanthanides is complex and complications such as low site
symmetry or the additional degeneracy of odd-electron lanthanides make
spectral assignment of crystal-field transitions very difficult. Systems with an
odd number of f-electrons (i.e., Sm3+, Gd3+) are nearly impossible to use as
probes for the site symmetry around the lanthanide ion due to Kramer’s
degeneracy [18]. For a crystalline compound with symmetry lower than cubic,
every level will be split into maximum crystal-field levels in the absence of an
external magnetic field.
The divalent samarium ion has several characteristics useful for probing
the site symmetry [73]. First, Sm2+ has an even number of electrons ([Xe]4f6),
so total degeneracy is removed only in low symmetry cases. Second, the 7F0
ground state of Sm2+ is non-degenerate, meaning it will transform as the totally
symmetric representation of the point group, which simplifies spectral
interpretation significantly. Third, many of the 2S+1LJ levels where J is small
(and there is a straightforward relationship between crystal-field splitting and
crystal-field parameters) are present in the optical region for samarium,
meaning crystal field parameters can be measured directly from experimental
spectra. Finally, there is very little overlap between the crystal-field levels of
different J states, so levels in the ground 7FJ and excited 5DJ terms can be
easily distinguished in high resolution spectra.
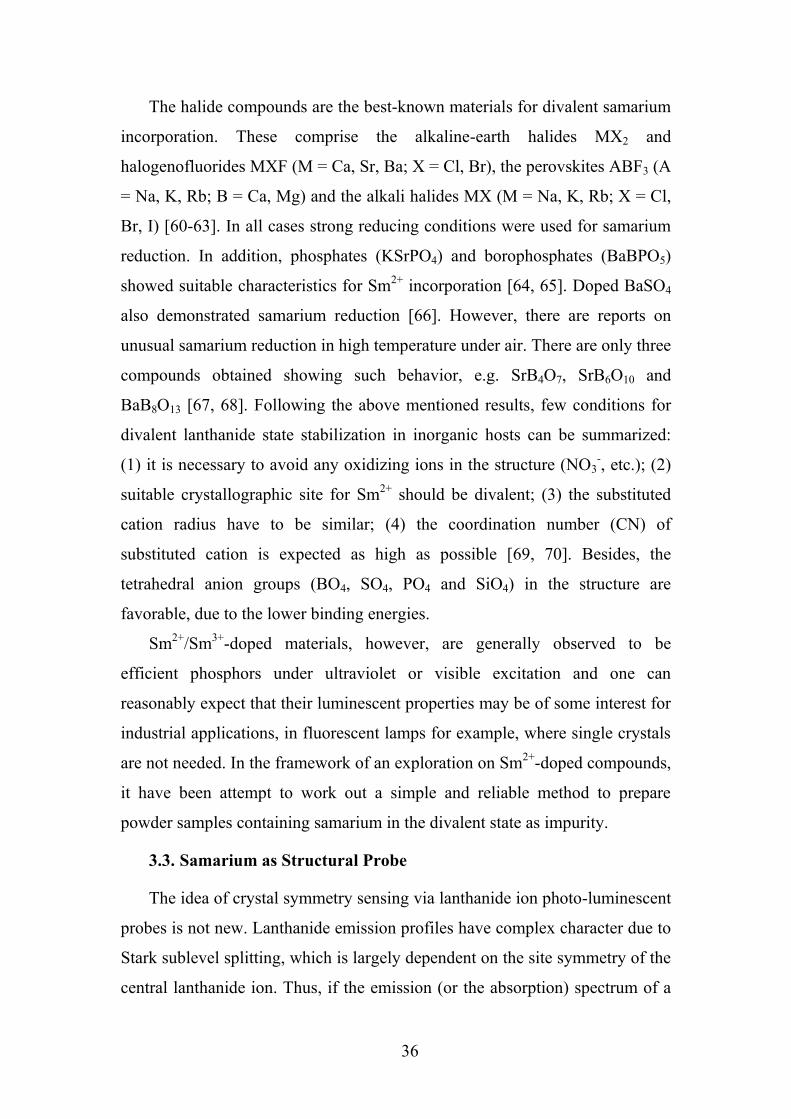
The most interesting and informative transitions in the divalent samarium
luminescence spectrum are: 5D0 → 7F0 (≈ 685 nm), 5D0 → 7F1 (≈ 690 – 705
nm), 5D0 → 7F2 (≈ 720 – 730 nm) and 5D0 → 7F4 (≈ 800 – 820 nm). All of
these are electric dipole transitions with the exception of 5D0 → 7F1, which is a
magnetic dipole transition [18]. The first peak in the emission spectrum allows
for determination of sample purity and significantly narrows down the list of
38
potential point groups. If the 5D0 → 7F0 transition shows any splitting,
consequently more than one non-equivalent site is present. This transition is
also reported to shift with coordination number, most likely due to an increase
in Sm2+-ligand covalency via the nephelauxetic effect [74, 75].
Set of peaks usually found around 690 – 705 nm, allows for further
isolation of the correct point group of the compound. If the 5D0 → 7F1
transition is split into three peaks, the symmetry must be either orthorhombic
(D2, C2v), monoclinic (C2, Cs) or triclinic (C1). If the transition has only two
peaks, it leaves the hexagonal, trigonal or tetragonal symmetries (Figure 3.3).
If the symmetry is high, more transitions are forbidden by symmetry
restrictions; therefore, lanthanides occupying sites of low symmetry will have
more peaks within a spin-orbit coupling band than those in site of higher
symmetry. This feature is well illustrated by the 5D0 → 7F2 (≈ 720 – 730 nm)
transition. If the symmetry is found to be orthorhombic, monoclinic or triclinic,
the exact point group can be assigned using this transition. If the band at ≈ 720
– 730 nm has only three peaks, the point group is D2, four peaks indicate a
point group of C2v, and five peaks leave the remaining point groups (C2, Cs and
C1) as possibilities. For the hexagonal, trigonal and tetragonal symmetries,
further information is required. If polarized spectra can be obtained,
distinctions can be made using this and the 5D0 → 7F4 transition to clearly
identify the point group of the Sm2+ coordination sphere (Figure 3.3).
The symmetry also has an influence on the radiative lifetime of the 5D0
level. The radiative lifetime is the time for the luminescence to drop to 1/e in
intensity in absence of quenching. In the case of a Sm2+ ion without inversion
symmetry the rate of the forced electric dipole transition is higher than in the
case of a Sm2+ ion with inversion symmetry. This automatically means that the
radiative lifetime of a Sm2+ ion in a site with inversion symmetry is longer.
Radiative lifetimes of lanthanide ions have been calculated with several
methods, of which the Judd-Ofelt theory is the most popular [34, 35]. In this
theory, the strength of the electric dipole transitions are calculated from the
39
absorption spectrum and these strengths can be related to the radiative lifetime.
Figure 3.3 Scheme for point group determination based on selected transitions in the Sm2+ ion. Modified for luminescence spectrum from references [31, 77].
Such approach is superior to conventional XRD and Raman measurements
because of its spatial selectivity and higher efficiency. Compared to Raman the
excitation cross-section of luminescence is ~ 104 times higher allowing much
smaller amounts of material to be characterized. As such, the luminescence
based detection method in theory could be used even at nano scale, when
single atom emitters and fluorescence resonant energy transfer (FRET)
microscopy is used [76].
40
Chapter 4. Properties of the Host Materials
4.1. Crystal Structure of SrB4O7
The orthorhombic phase of strontium tetraborate, α-SrB4O7 (I), is known
for a long time [78]. This compound has attracted attention owing to its
interesting physical properties, namely an unprecedented fundamental optical-
absorption edge among oxide compounds (~ 130 nm), good luminescent
characteristics and an ability to stabilize rare-earth elements in divalent state
[79-81]. The compound was reported to be the first example of an anhydrous
borate featuring only tedrahedrally coordinated boron in which all the boron
and oxygen atoms are involved in the borate network.
SrB4O7 (SrTB) falls in a glass-forming range within the SrO-B2O3 system
and can simply be obtained as a glass. Consequently synthesis of crystalline
borate compounds is rather tricky [82, 83]. Several borate compounds appear
in crystalline as well as glassy form. The solid-state synthesis using boric acid
as the boron source allows the preparation without melting the constituents,
which is essential for avoiding glass formation. This necessitates longer
reaction times and eventually evaporation of boric acid may cause non-
stoichiometry. The process of glass re-crystallization occurs through complex
mechanisms with potential formation of other crystalline phases, especially
through metastable phases. The phase diagram in Figure 4.2 reveals five main
phases in the SrO-B2O3 system: (I) strontium tetraborate (SrB4O7), (II)
strontium diborate (SrB2O4) [84] and its high-pressure form [85], (III)
distrontium diborate (Sr2B2O5), [86], (IV) tristrontium diborate (Sr3B2O6) [87]
and (V) strontium hexaborate (SrB6O10) [88]. However, the phase diagram is
not complete, because additional phases are reported: (VI) distrontium
hexadecaborate (Sr2B16O26) [89] and (VII) tetrastrontium tetradecaborate
(Sr4B14O25) [90]. Two of these phases crystallize in non-centrosymmetric space
groups, viz. I - Pmn21 and VII - Cmc21. The main feature of all these structures
are BOx units (x = 3, 4). Isolated (IV) or flat pairs (III) of BO3 triangles, a
framework of BO4 tetrahedra with shared vertices (I, II) and a framework of
41
triangles and tetrahedra with shared vertices (V, VII) are found in these
structures. According to the phase equilibrium diagram SrB4O7 congruently
melts at 994 ± 10 °C [91]. SrTB crystals were not found to be hygroscopic
[92].
SrB4O7 crystallizes in the orthorhombic crystal lattice with space group
Pmn21 (31). Its structure consists of an unusual type of borate framework
where all boron atoms are tetrahedrally coordinated. Three-dimensional borate
network constructs channels parallel to the a- and b-axis with Sr ions located in
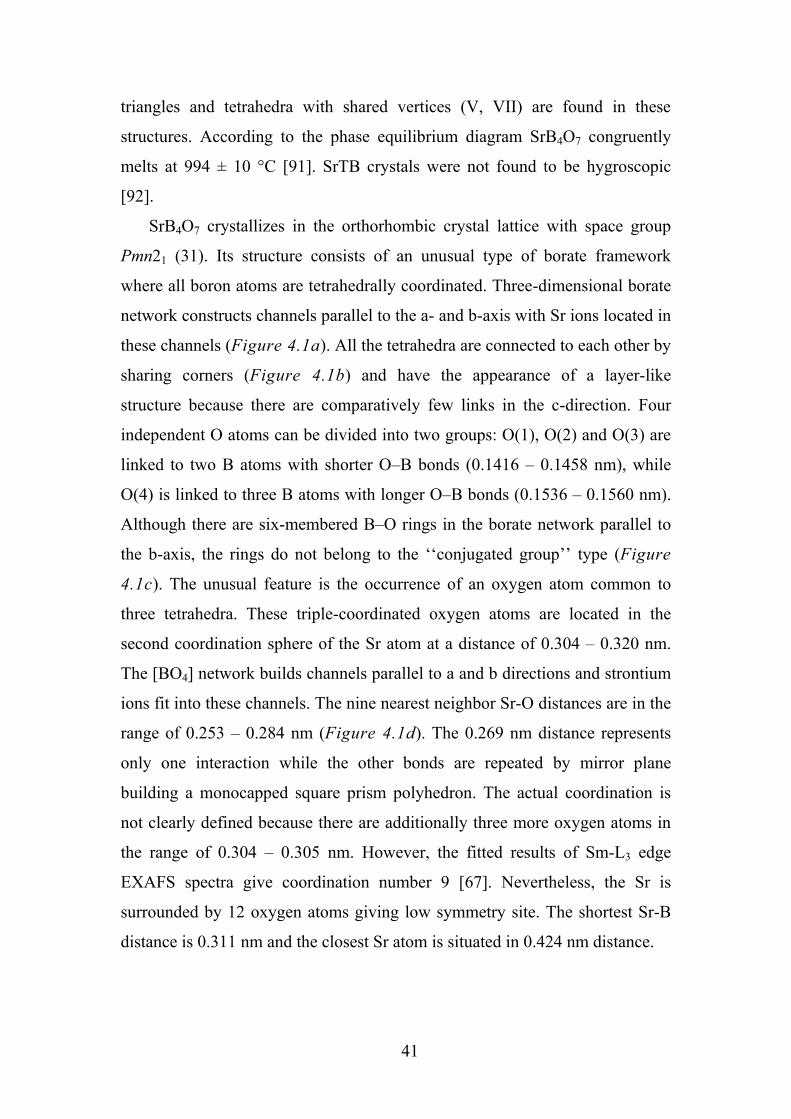
these channels (Figure 4.1a). All the tetrahedra are connected to each other by
sharing corners (Figure 4.1b) and have the appearance of a layer-like
structure because there are comparatively few links in the c-direction. Four
independent O atoms can be divided into two groups: O(1), O(2) and O(3) are
linked to two B atoms with shorter O–B bonds (0.1416 – 0.1458 nm), while
O(4) is linked to three B atoms with longer O–B bonds (0.1536 – 0.1560 nm).
Although there are six-membered B–O rings in the borate network parallel to
the b-axis, the rings do not belong to the ‘‘conjugated group’’ type (Figure
4.1c). The unusual feature is the occurrence of an oxygen atom common to
three tetrahedra. These triple-coordinated oxygen atoms are located in the
second coordination sphere of the Sr atom at a distance of 0.304 – 0.320 nm.
The [BO4] network builds channels parallel to a and b directions and strontium
ions fit into these channels. The nine nearest neighbor Sr-O distances are in the
range of 0.253 – 0.284 nm (Figure 4.1d). The 0.269 nm distance represents
only one interaction while the other bonds are repeated by mirror plane
building a monocapped square prism polyhedron. The actual coordination is
not clearly defined because there are additionally three more oxygen atoms in
the range of 0.304 – 0.305 nm. However, the fitted results of Sm-L3 edge
EXAFS spectra give coordination number 9 [67]. Nevertheless, the Sr is
surrounded by 12 oxygen atoms giving low symmetry site. The shortest Sr-B
distance is 0.311 nm and the closest Sr atom is situated in 0.424 nm distance.
42
Figure 4.1 (a) Unit cell of SrB4O7 along the c – axis; (b) Arrangement of boron tetrahedral around triply coordinated oxygen; (c) Boron circle coordination around Sr ion; (d) Local coordination geometry environment of Sr2+ sites.
The size of the divalent lanthanide dopants is much more suitable than the
size of these ions in the trivalent state for a substitution of Sr2+. From what is
known, it is thought that the lattice of SrB4O7 does not provide an evident
charge compensation mechanism, which is necessary for a substantial
substitution of Sr2+ by trivalent lanthanide ions [93].

43
Figure 4.2 SrO-B2O3 phase diagram [91]
4.2. Crystal Structure of La(Gd)MgB5O10
As proposed by Saubat et al. [94] lanthanide (Ln) magnesium meta borates
(LnMgB5O10) possess interesting features like one dimensional Ln-Ln chains,
where intrachain interaction dominate interchain one. The lanthanide
magnesium meta borates corresponding to the formula LnMgB5O10 can be
obtained as an isomorphic series from lanthanum to erbium [94]. According to
single crystal X-ray diffraction studies [94, 95] the LnMgB5O10 crystallize in
the monoclinic crystal system (Z = 4), space group P121/c1 (14). Figure 4.3
shows a structure fragment of LaMgB5O10. The structure of LnMgB5O10 can be
easily described as a set of parallel (B5O10)5-n layers composed of three BO4
tetrahedra and two BO3 triangles sharing corners. BO3 planar triangles play
bridging roles between BO4 tetrahedra. The three boron atoms are found in a
tetrahedral coordination, while only two have triangular surroundings. The
existence of BO3 and BO4 borate groups in the structure is also supported by
infrared spectroscopy [95]. The bonding between boron and oxygen is strongly
covalent in the anionic complex species and it has been concluded that the
bonding between lanthanide and oxygen should be predominantly of ionic
character [96]. Six-fold coordinated magnesium and 10-fold coordinated
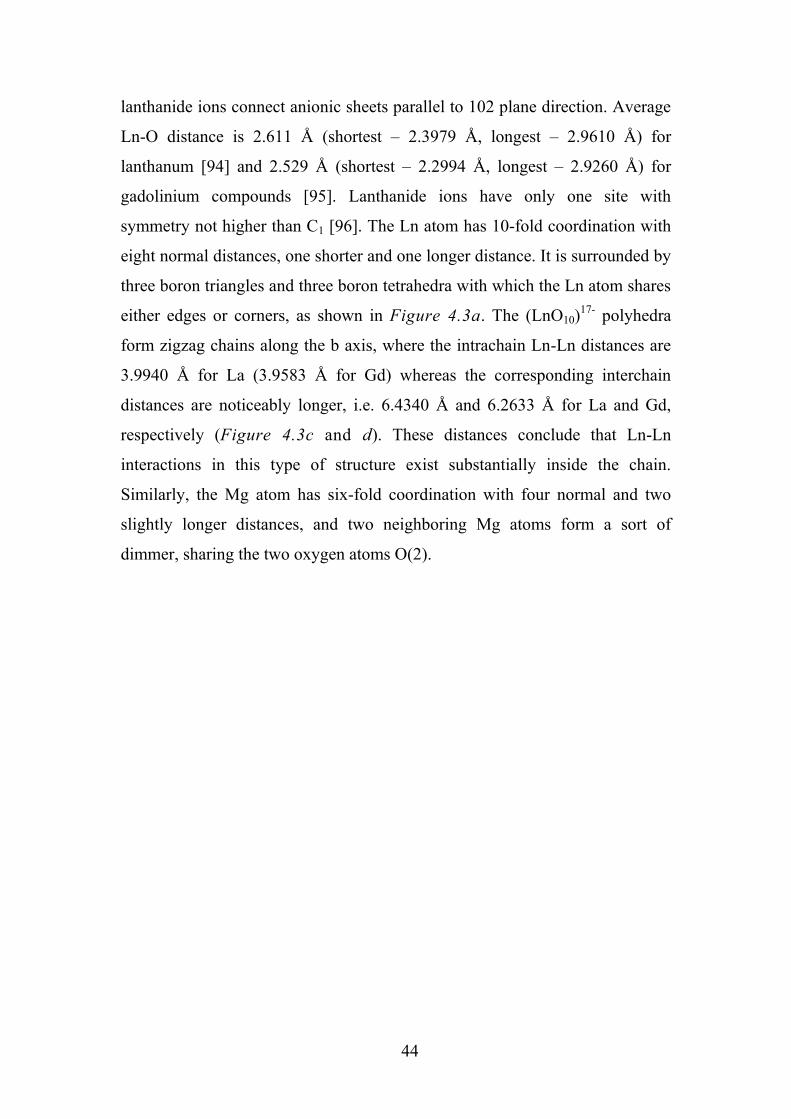
44
lanthanide ions connect anionic sheets parallel to 102 plane direction. Average
Ln-O distance is 2.611 Å (shortest – 2.3979 Å, longest – 2.9610 Å) for
lanthanum [94] and 2.529 Å (shortest – 2.2994 Å, longest – 2.9260 Å) for
gadolinium compounds [95]. Lanthanide ions have only one site with
symmetry not higher than C1 [96]. The Ln atom has 10-fold coordination with
eight normal distances, one shorter and one longer distance. It is surrounded by
three boron triangles and three boron tetrahedra with which the Ln atom shares
either edges or corners, as shown in Figure 4.3a. The (LnO10)17- polyhedra
form zigzag chains along the b axis, where the intrachain Ln-Ln distances are
3.9940 Å for La (3.9583 Å for Gd) whereas the corresponding interchain
distances are noticeably longer, i.e. 6.4340 Å and 6.2633 Å for La and Gd,
respectively (Figure 4.3c and d). These distances conclude that Ln-Ln
interactions in this type of structure exist substantially inside the chain.
Similarly, the Mg atom has six-fold coordination with four normal and two
slightly longer distances, and two neighboring Mg atoms form a sort of
dimmer, sharing the two oxygen atoms O(2).
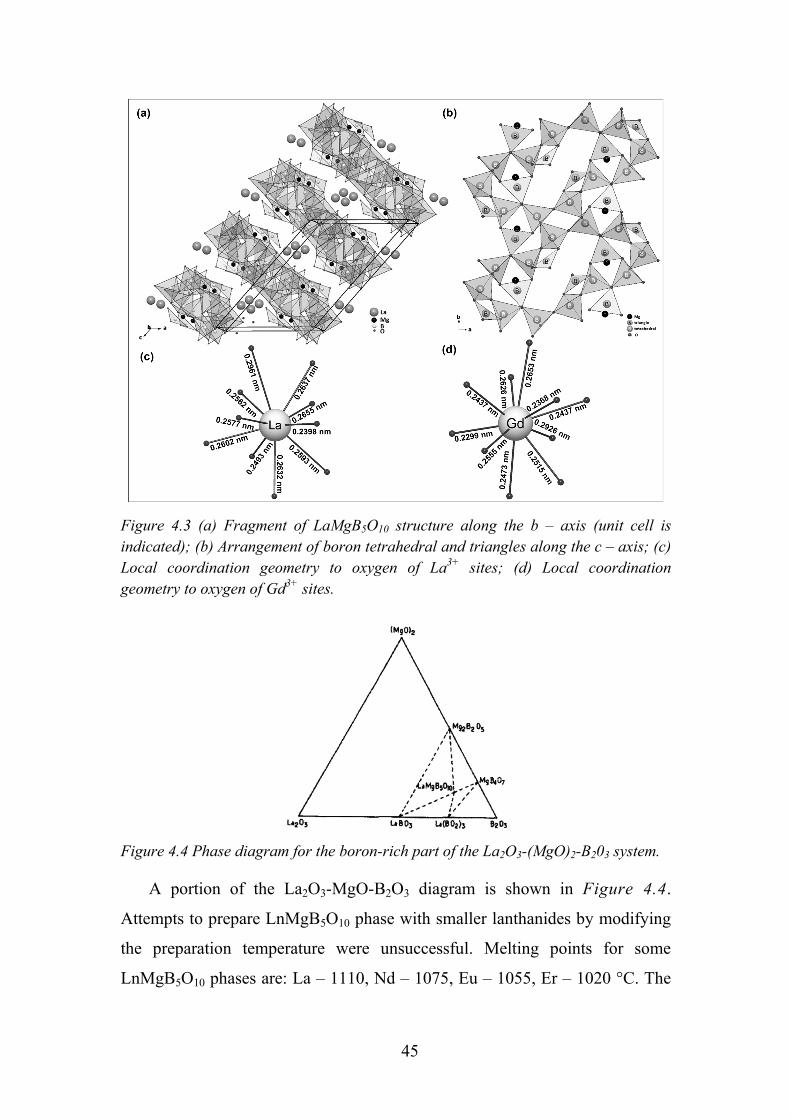
45
Figure 4.3 (a) Fragment of LaMgB5O10 structure along the b – axis (unit cell is indicated); (b) Arrangement of boron tetrahedral and triangles along the c – axis; (c) Local coordination geometry to oxygen of La3+ sites; (d) Local coordination geometry to oxygen of Gd3+ sites.
Figure 4.4 Phase diagram for the boron-rich part of the La2O3-(MgO)2-B203 system.
A portion of the La2O3-MgO-B2O3 diagram is shown in Figure 4.4.
Attempts to prepare LnMgB5O10 phase with smaller lanthanides by modifying
the preparation temperature were unsuccessful. Melting points for some
LnMgB5O10 phases are: La – 1110, Nd – 1075, Eu – 1055, Er – 1020 °C. The
46
variation of melting points indicates a decrease in the stability of the structure
when the lanthanide ion shrinks [94].
4.3. Crystal Structure of Sr4Al14O25
The crystal structure of Sr4Al14O25 (4SrO∙7Al2O3 or S4A7) is orthorhombic
with space group Pmma (51). Sr4Al14O25 consists of layers made up of AlO6-
octahedra separated by a double layer of AlO4-tetrahedra. The octahedra are
connected together by sharing one edge, whereas the tetrahedra are connected
by corner sharing, two by two or three by three, resulting in the presence of
tricoordinated oxygen atoms and tetrahedra triclusters (Figure 4.5a) such as in
CaAl4O7 [97], SrAl4O7 [98] and mullite [99]. There are six different
crystallographic sites for the aluminum atoms in the structure: three AlO6
octahedral sites and three AlO4 tetrahedral sites. According to the structural
data, two different strontium sites with coordination numbers 10 and 7 exist in
the Sr4Al14O25. The Sr1 site lies in the complicated oxygen-polyhedron with
average Sr-O distances ≈ 0.284 nm (Figure 4.5b), while for the Sr2 site
distances are shorter (≈ 0.258 nm) (Figure 4.5c) [100, 101]. Because the
radius of Sm2+ (CN = 7 → 0.122 nm; CN = 10 → 0.137 nm) is very similar to
that of Sr2+ (CN = 7 → 0.121 nm; CN = 10 → 0.136 nm), it is assumed that
Sm2+ replace Sr2+. Considering Sm2+ affinity to occupy high CN sites, it can be
predicted that Sm2+ remains mainly in Sr1 sites (CN = 10). Nevertheless, two
types of Sm2+ ions in the Sr4Al14O25 crystals could be expected. Moreover, the
interactions between oxygen and strontium ions at the 10-fold coordinated site
are weaker than at 7-fold coordinated site. One can assume that the covalence
and crystal field effects are stronger for 7-fold coordinated site than for the 10-
fold site.

47
Figure 4.5 (a) Unit cell of Sr4Al14O25 along the c – axis and local coordination geometry environment of nonequivalent Sr2+ sites: (b) CN = 7; (c) CN = 10.
Despite large similarities with their calcium counterparts, strontium
aluminates have received less attention and many uncertainties concerning the
phase diagram still remain [102, 103]. When identifying the crystalline phases
present during the synthesis of strontium aluminate, via solid-state method
using aluminum hydroxide and strontium carbonate, a secondary phase,
referred to as strontium aluminum oxide hydroxide (SrAl3O5(OH)), was always
present. In fact, this compound was Sr4Al14O25 (S4A7), not reported in the
phase diagram. It was identified by Wang et al. [104, 105], who synthesized it
by solid-state reaction at 1300°C. They found that this compound was identical
to the sample processed by hydrothermal synthesis [106]. The formation and
48
crystallization of S4A7 from amorphous precursor is confirmed and studied by
differential scanning calorimetry (DSC), X-ray diffraction (XRD) and 27Al
nuclear magnetic resonance (NMR) spectroscopy [107]. Sr4Al14O25 was
formed through two exothermic peaks. The first one, at 923 °C, corresponded
to the crystallization of two metastable solid solutions, γ-Al2O3 and hexagonal
strontium monoaluminate SrAl2O4 (SA). The second one, at 1134 °C, induced
the reaction between these two metastable phases to yield pure S4A7. This
compound was stable up to 1500 °C; after holding at this temperature for 15 h
no sign of decomposition was noted. At higher temperatures it decomposed
into mono-aluminate (SA) and di-aluminate SrAl4O7 (SA2), the latter
decomposes into SA and SrAl12O19 (SA6). Studies have shown that SrAl4O7
and Sr4Al14O25, having close compositions, should not coexist. Their respective
domains of stability exclude each other [108].
In Figure 4.6(left) is proposed a modification of a part of the SrO-Al2O3
phase diagram after Massazza [1] (Figure 4.6(right)). It introduces S4A7
with its domain of stability, closely related to that of SA2. Because of its low
kinetics of formation, SA2 may crystallize at 900 – 1000 °C, either directly or
via hexagonal SA and γ-Al2O3 metastable solid solutions. As the temperature is
raised (>1100 °C), SA2 becomes metastable, and only S4A7 will crystallize.
This compound is stable up to 1500 °C. At higher temperature, S4A7
decomposes into SA and SA2. The latter compound, being unstable at elevated
temperature, also decomposes into SA and SA6. At higher temperature, there is
again a narrow stability domain for SA2, close to its melting point. On cooling
from the liquid state, if the solidification occurs in that high-temperature
stability domain only SA2 will crystallize, while by too rapid quenching, at
least a part of the solidification will occur out of this stability domain and it
will result in a mixture of phases. The symmetrical behaviors for crystallization
from amorphous precursors at low temperature and from liquid at very high
temperature should be noted. Low heating or cooling rates produce pure SA2
while too rapid kinetics results in mixtures of phases.
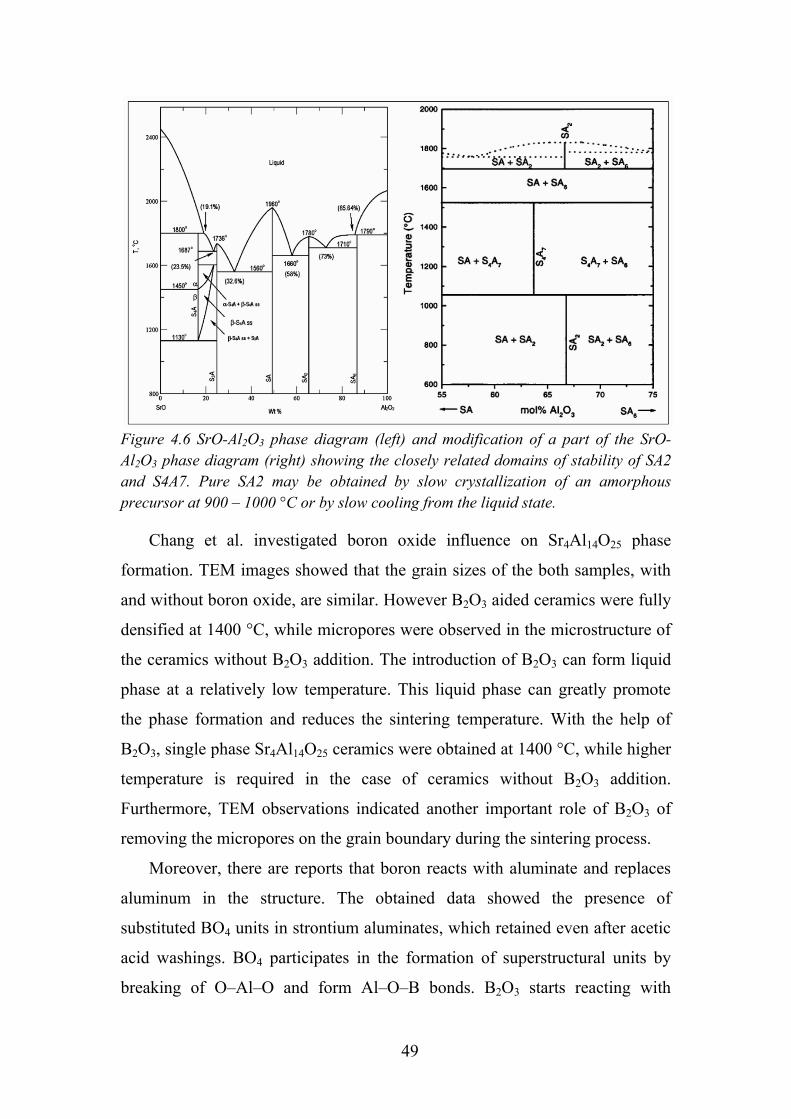
49
Figure 4.6 SrO-Al2O3 phase diagram (left) and modification of a part of the SrO-Al2O3 phase diagram (right) showing the closely related domains of stability of SA2 and S4A7. Pure SA2 may be obtained by slow crystallization of an amorphous precursor at 900 – 1000 °C or by slow cooling from the liquid state.
Chang et al. investigated boron oxide influence on Sr4Al14O25 phase
formation. TEM images showed that the grain sizes of the both samples, with
and without boron oxide, are similar. However B2O3 aided ceramics were fully
densified at 1400 °C, while micropores were observed in the microstructure of
the ceramics without B2O3 addition. The introduction of B2O3 can form liquid
phase at a relatively low temperature. This liquid phase can greatly promote
the phase formation and reduces the sintering temperature. With the help of
B2O3, single phase Sr4Al14O25 ceramics were obtained at 1400 °C, while higher
temperature is required in the case of ceramics without B2O3 addition.
Furthermore, TEM observations indicated another important role of B2O3 of
removing the micropores on the grain boundary during the sintering process.
Moreover, there are reports that boron reacts with aluminate and replaces
aluminum in the structure. The obtained data showed the presence of
substituted BO4 units in strontium aluminates, which retained even after acetic
acid washings. BO4 participates in the formation of superstructural units by
breaking of O–Al–O and form Al–O–B bonds. B2O3 starts reacting with
50
SrAl2O4 and facilitate conversion to Sr4Al14O25. Therefore, it can be concluded
that B2O3 does not act as an inert high temperature solvent medium (flux); it
actively participates in reactions and depending upon B2O3 concentration,
different phases are stabilized of which evidence are the formation of the
compounds SrAl2O4, Sr4Al14O25 and SrAl12O19. The final product is dependent
on the SrO/Al2O3/B2O3 ratio [109].
4.4. Crystal Structure of SrAl12O19 and LaMgAl11O19
Hexaaluminates with the magnetoplumbite crystal structure have been
receiving considerable attention, because of their diverse applications, in
particular, as luminescent and laser host materials.
β-Alumina and magnetoplumbite structures resemble each other. They
consist of spinel blocks separated by intermediate layers containing large
cations. The main differences between the two exist in the intermediate layer
(mirror plane). In the magnetoplumbite structure, the intermediate layer of a
single unit cell contains a large cation, an Al ion, and three oxygen ions
(Figure 4.7); in the β-alumina structure, it contains only a large cation and an
oxygen ion. The differences in composition of the intermediate layer result in
different overall compositions of β-alumina and magnetoplumbite. The latter
has the overall formula AB12O19 and β-alumina has the overall formula
CB11O19 with B = Fe3+, Ga3+, or Al3+. In general A is a large divalent metal ion
and C is a large monovalent metal ion with respect to the size of the B ions. It
is also possible that A is a large trivalent ion and C is a large divalent ion,
resulting in defect type structures.
Dimensional relations between the sizes of A and B ions have to be
considered. The larger the ions in the B-sites, the larger must be the ions in the
A-sites. In aluminates (B = Al3+, r = 0.0535 nm [110]) the magnetoplumbite
type structure appears when A = Ca2+, Sm2+, Eu2+, Sr2+ and Pb2+ [111]. These
dimensional relations are related to the c/a ratio of the unit-cell: the size of the
c-axis depends strongly on the size of the A ion and the size of the a-axis
depends mainly on the size of the B ion. For the magnetoplumbite type

51
structure the c/a ratio must be in the range of 3.91 (ideal structure) to 3.97
(strongly distorted structure) [111].
The composition for an ideal magnetoplumbite phase based on alumina is
MAl12O19 (where M is typically an alkaline earth such as Sr or Ca) which has a
hexagonal structure, with space group P63/mmc (194). The unit cell parameters
are: a = 0.56581, b = 0.56581, c = 2.16676 nm, α = 90, β = 90, γ = 120° [112].
The unit cell is composed of spinel-structured slabs containing Al3+ cations
separated by mirror planes, which contain one Sr2+ and three oxygen ions per
unit cell (Figure 4.7).
Figure 4.7 (a) Nomenclature of the atomic positions in magnetoplumbite structure, (b) coordination polyhedra of aluminum in the structure, (c) Sr2+ coordination polyhedron.
It has been found that alumina-based magnetoplumbites exhibit a
nonstoichiometry which origin obviously lies in the defect structure of the
material. The large divalent cation can be replaced completely by a trivalent
cation such as La3+ or other rare-earth species with compensation by a different
cation such as Mg2+ substitution for Al3+ in the spinel blocks. Due to the
complexity of the basic crystal structure, however, the knowledge of the
intrinsic defect structures available from experiment is quite limited. For
instance, the distribution of Mg or other small cations over the possible Al sites
52
has not been determined conclusively; in fact several different schemes have
been proposed [20].
The magnetoplumbite-structured SrAl12O19 may be expected to
accommodate diverse luminescence properties because of the variety of
crystallographic sites within the unit cell. The structure is composed of spinel
blocks, which have the usual 4 and 6 coordinated sites for cations, whereas the
interspinel layers have rather unusual 5-fold sites for small cations. The
interspinel layers also provide 12-fold sites to accommodate large cations,
which may be monovalent, divalent, or trivalent. Charge is balanced either in
the interspinel layer (i.e., Na0.5 + La0.5) or in both the interspinel layer and the
spinel block (e.g., La and Mg replacing Sr and Al, respectively).
53
Chapter 5. Experimental
5.1. Methods of Preparation
In general, almost all phosphors are synthesized by solid-state reaction
between raw materials at high temperatures. The high purity materials of host
crystals, activator and fluxes are mixed and blended to get homogeneous
mixture. Then the mixture is fired at high temperature in a container. The fired
product is then crushed, milled and then sorted to remove coarse and
excessively crushed particles.
For combustion synthesis method, firstly, metal salts are dissolved in
distilled water and heated to 65 – 75 °C; if necessary additionally HNO3 is
added to prevent hydrolysis of metals. Secondly, under continuous stirring,
complexing agents and fuels are added and solutions are stirred for an
additional 1h at the same temperature. Subsequently, after concentrating the
mixtures by slow evaporation, sols are turning into transparent gels. Then the
temperature is raised to ≈ 250 °C the self-maintaining gel combustion process
starts, which is accompanied with evolution of huge amount of gases. Finally,
the resulting products are dried in the oven for several hours at 120 °C and
ground to fine powders, which follow preheating and annealing steps. For
annealing under reducing atmosphere, high-temperature tube furnaces with
continuous gas flow were used. For mild reduction active carbon was used (CO
atmosphere), by placing small crucible with sample into bigger vessel with
carbon in it and closing with lid.
5.2. Chemicals
The starting materials were Sm2O3 (99.9 % Alfa Aesar), La2O3 (99.9 %
Treibacher), Gd2O3 (99.9 % Treibacher), MgO (99.95 % Alfa Aesar), SrCO3
(≥99.9 % Aldrich), nano-scale Al2O3 (Evonik Industries), NH4Cl (≥99.5 %
Alfa-Aesar), AlF3 (reagent grade, Aldrich), H3BO3 (≥99.5 % Merck). For
combustion synthesis the gels were prepared using Sm(NO3)3·6H2O (99.9 %
Aldrich), Sr(NO3)2 (>99 % Aldrich) and Al(NO3)3·9H2O (≥98 % Aldrich).
54
Tris(hydroxymethyl)-aminomethane (tris-amine) or ethylenediaminetetraacetic
acid (EDTA) were used as complexing agent and fuel.
5.3. Materials Characterization
5.3.1. Powder X–ray Diffraction
X-ray diffraction (XRD) uses the pattern produced by the diffraction of X-
rays through the lattice of atoms in a material to reveal the nature (symmetric)
structure of that lattice, which usually leads to an understanding of the
structure of the material. The X-ray photons physically interact with the
electrons that surround the atoms. X-rays scattered from a crystalline solid can
constructively interfere, producing a diffraction pattern. This technique works
because in a crystalline material the inter-atomic distances are of the order of
the wavelength of X-ray radiation (10-9 m). As a result, X-ray radiation is
diffracted by the electron clouds in the crystal structure. This gives diffraction
maxima, which are dependent on the type of atoms, their spacing and
distribution. The X-ray diffraction technique, therefore, is not a technique that
produces images. However, the electron density can be reconstructed using the
diffraction pattern, which is obtained from a periodic assembly of units in the
crystal. A model can be preliminarily created using obtained data. Then
calculated diffractions can be compared with observational data, to finally
elaborate an accurate unambiguous 3D physical structure of the material.
Powder X-ray diffraction analysis has been carried out employing a
Rigaku MiniFlex II diffractometer working in Bragg–Brentano (θ/2θ)
geometry. The data were collected within 2θ angle from 10° to 60° at a step of
0.02° and integration time of 1 s using Ni-filtered Cu Kα line.
5.3.2. Spectroscopic Investigations
It is a very well known fact, that interaction of electromagnetic radiation
with matter causes absorption, emission, and scattering of radiation. As a result
of this interaction, it is possible to characterize the optical properties of
materials by measuring the properties of electromagnetic radiation. The most

55
classic experiments in spectroscopy are concerned with the determination of
the transition energies of the optical center [113]. So called transition
"energies" are commonly expressed in terms of energy (eV), frequency ν (s-1)
or ω (rad s-1), wavelength λ (nm), or wavenumbers ϋ (cm-1). Physical
magnitude measured is an intensity of electromagnetic radiation as a function
of photon energy. A graph that plots the intensity versus photon energy is
called a spectrum, and peaks (or dips) in the spectrum reveals the locations of
optical transitions.
Four techniques are commonly used for this kind of experiments:
absorption spectroscopy, diffuse reflection spectroscopy, luminescent
excitation spectroscopy, and emission spectroscopy. In absorption
spectroscopy the photon energy of the radiation incident on the sample is
selected by a scanning monochromator. Absorption spectroscopy is used to
measure the transmitted signal for transparent (non-scattering) samples such as
single crystals or solutions. An alternative for strongly scattering materials,
such as polycrystalline powders, is diffuse reflection spectroscopy. The
difference in set-ups for absorption and reflection spectroscopy is in the
detection compartment. When diffuse reflection spectroscopy is used, the
backscattered signal is detected and compared to the back-scattered signal from
a reference material. Excitation and emission spectroscopy have very low
background levels and a much higher sensitivity. It is used in combination with
samples containing very small quantities of luminescent species. Absorption
and diffuse reflection spectroscopy have much larger background and noise
levels and are used for more concentrated samples.
5.3.3. Room Temperature Spectroscopy
In the case of the excitation spectrum the plot is actually an absorption
spectrum which is obtained by monitoring the luminescence at a specific
wavelength (at the peak of emission). The excitation spectrum is a replica of
the absorption spectrum of the same ion but the position of the energy levels in
excitation spectrum is determined by monitoring the intensity of emission, not

56
by the intensity of radiation passed through the sample as in absorption
spectrum. The wavelength of excitation is varied by scanning the excitation
monochromator for fixed emission wavelengths. By this means the upper
energy levels of the luminescent centres (or ions) are revealed, even when
these levels are non-radiatively relaxing on to the lower excitation level
involved in radiative emission. Consequently, the excitation spectrum is used
to locate the energy levels of the excited states. Depending upon the absorption
cross section of the excitation bands the intensity of the emission varies. From
the excitation spectrum the region of luminescence can be determined, as also
the energy levels of the ions in the host lattice. In the monochromator, white
light from a xenon lamp is collected by an elliptical mirror and directed to the
entrance slit. Then the light is dispersed through the grating and then is
directed to the exit slit of the monochromator (for excitation). A specific
wavelength is selected by the monochromator from the incoming light. The
entrance and exit ports (or silts) of the spectrometer and the monochromator
are adjustable. These are computer controlled slits. To be able to detect the
lamp profile of the output beam, a photodiode is used. The slits of the
monochromator determine the amount of monochromatic light that is used to
illuminate the sample. The spectrometer slits, on the other hand, control the
intensity and resolution of the fluorescence signal that is detected by the
photomultiplier tube (PMT). Eventually the PMT signals are amplified and
processed. By monitoring at different fixed emission wavelengths, complete
knowledge can be defined about the upper energy levels involved directly or
indirectly in the luminescence process.
For the emission spectrum the luminescent centre or the activator ion in a
phosphor that has passed to the excited state returns to the ground state through
either radiationless transitions or by way of emission transitions. Emission
transition is detected as a glow of the materials and registered in the form of a
band in the luminescence spectrum. The position of the band in the
luminescence spectrum of the ion does not depend on the method of excitation
it is only determined by the inter-level spacing. In the diagram of energy
57
levels, however, there can be several emission levels, and transitions from each
one of them can not only be to the ground state, but also onto the intermediate
levels. The ground state can be split into sublevels and then transitions from
each emission level will be onto the ground state sublevels. This can result in
the appearance of complex luminescence spectra consisting of many bands and
are characteristics of trivalent lanthanide ions.
Excitation and photoluminescence spectra were measured at room
temperature using an Edinburgh Instruments FSL900 fluorescence
spectrometer. This spectrometer consists of a light source (a Xe lamp), slits, a
monochromator, sample compartment, reference detector (photo diode), a
spectrometer and a signal detector (PMT). The main advantages of using a
photomultiplier are that the spectra, which are in this case recorded in photon
counting mode, can be easily corrected for the technical response function of
the setup. In addition, time resolved luminescence spectroscopy is fairly easy
realized. Photoluminescence describes the process in which energy is emitted,
in form of light, from a material at a different wavelength under excitation of a
light source at which is absorbed by the sample.
5.3.4. Specific Issues Concerning FSL900
In the measurements of luminescence spectroscopy with Edinburgh
Instruments FSL900, the following issues have to be addressed:
a) Second order diffraction interference of the pump wavelength.
The diffraction relation of a grating is known to be:
𝐝 sin𝛉 = 𝒏𝝀,
where d is the spacing of the adjacent ruled grooves of the grating, n – order of
the diffraction and θ – angular direction of the diffraction.
When the spectrometer is scanning, the sin θ changes until the required
wavelength of the signal is sent to the exit slit. It can be noted, that for the first
order case, with wavelength λ, the signal will be overlapped with the second
58
order of wavelength λ/2. To avoid this problem a cut-off filter is used between
the sample and the entrance slit of the spectrometer.
For example, if it is used 360 nm Xe lamp radiation to pump the sample
and attempting to measure the emission in the spectral range of 500 – 900 nm,
the second order of the pump light (360 nm) will appear at the wavelength 720
nm. Without a cut-off filter, which is blocking the 360 nm pump light, this
light will give a huge peak at 720 nm. This will not only make the scan failed,
but also gives the risk of damaging the PMT.
b) Interference of the lamp background.
It is known that all the optical devices inside the instrument can produce
strong diffuse scattering of the lamp output. Because the lamp illuminates the
internal chamber of the monochromator, the light output is always mixed with
the background of the lamp. In other words, sample that has a weak emission
will have an emission spectrum mixed with a lamp profile in the background.
In order to reduce this interference, a UV band-pass filter can be used. This
filter only allows the excitation light with selected pump wavelength to reach
the sample and rejects the rest of the lamp background, which interferes with
the fluorescence measurement.
c) Normalization of excitation spectrum for lamp profile.
The output of the xenon lamp is obviously a function of the wavelength.
Therefore, a normalization of the excitation spectrum needs to be made. The
relationship of the measured luminescence intensity of the sample [I(λ)], the
absorption [A(λ)], the spectral response of the monochromator [M(λ)] and the
pump power of the lamp [L(λ)] is given by:
𝐈(𝛌) = 𝐌(𝛌) 𝐀(𝛌) 𝐋(𝛌).
From this relation we can obtain the excitation (absorption) spectrum:
𝐀(λ) =𝐈(λ)
�𝐌(λ)𝐋(λ)�= 𝐈(λ) × 𝑐𝑜𝑟𝑟𝑒𝑐𝑡𝑖𝑜𝑛(λ) =
𝐈(λ)𝐑𝐜
,

59
were I(λ) is the luminescent intensity measured by the PMT of the
spectrometer and Rc – corrected lamp signal detected by the photodiode of the
monochromator unit.
d) Correction for Instrumentation spectral response.
The instrument (fluorescence) sensitivity varies with wavelength due to the
fact that in the spectrometer unit diffraction efficiency of gratings, refractive
indexes of lenses and the spectral response of the PMT – all depend on the
wavelength. Therefore, the spectrum measured can be distorted. The
wavelength dependence of the instrumentation is called the instrumentation
spectral response, and has to be corrected. Mathematically it will be
𝐒(𝛌) = 𝐄(𝛌)𝐑(𝛌),
where S is the measured emission signal, E – real emission spectrum and R –
instrumentation spectral response. Then the real emission spectrum of the
materials is:
𝑬(λ) =𝑺(λ)𝑹(λ) = 𝑺(λ)𝐂(λ).
The correction factor of the spectrometer,
𝑪(λ) =1
𝑹(λ),
is pre-measured using a standard light source and is stored in a file called the
correction function. Before emission spectra analysis the raw data is corrected
by correction file.
The steady state luminescence spectra in the ultra-violet (UV), visible
(VIS) and near-infrared region have been recorded on Edinburgh Instruments
FSL900 fluorescence spectrometer equipped with 450 W Xe arc lamp, mirror
optics for powder samples and cooled (−20 °C) single-photon photomultiplier
(Hamamatsu R2658P). The photoluminescence emission spectra were
corrected by correction file obtained from tungsten incandescent lamp certified

60
by NPL (National Physics Laboratory, UK) and excitation spectra were
corrected by reference detector. Reflection spectra were recorded on the same
model spectrometer equipped with integration sphere (150 mm diameter,
BaSO4 coating). The integrating sphere is built in the way that the incoming
light ray is reflected equal in every direction so that the light intensity is the
same in each point of the sphere. BaSO4 (99 % Sigma-Aldrich) was used as a
reflectance standard.
5.3.5. Low Temperature Spectroscopy
For temperature dependent measurements a cryostat “MicrostatN” from
Oxford Instruments had been applied to the Edinburgh Instruments FSL900
fluorescence spectrometer. The cryostat cooled with liquid nitrogen. The
nitrogen is kept in a reservoir near the cryostat. Quartz window give optical
access to the central sample chamber in which nitrogen are continuously
pumped under the sample. The sample is mounted on a thermally conducting
cold boat, which is cooled by the nitrogen. Thermocouple inside the sample
chamber measures the internal temperature. To prevent condensation of
humidity, the chamber were evacuated with vacuum pump. This setup provides
the possibility to cool samples to liquid nitrogen temperature (77 K).
Additionally, installed heating elements allows to heat sample above room
temperature. Measurements were carried out from 100 to 500 K in 50 K steps.
5.3.6. Lifetime Measurements
Excited states of an atom or ion correspond to a higher energy than the
ground state. These excited electrons eventually decay to the ground state. In
nature, the majority decay processes can be well described by an exponential
function:
𝐼(𝑡) = 𝐼0 ∙ exp �−𝑡𝜏�,
where I0 is the initial fluorescence intensity immediately after the excitation
pulse. In practice, the fluorescence decay time (τ) is defined as the time in
which the fluorescence intensity decays to 1/e of the intensity immediately
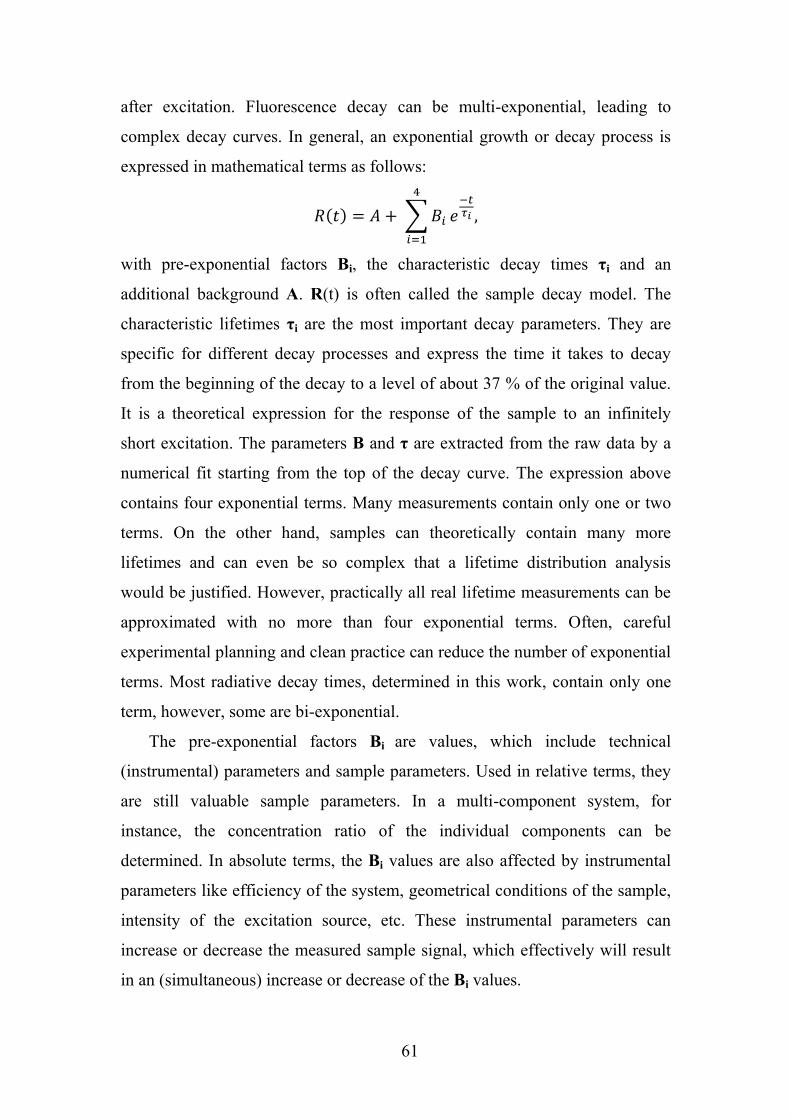
61
after excitation. Fluorescence decay can be multi-exponential, leading to
complex decay curves. In general, an exponential growth or decay process is
expressed in mathematical terms as follows:
𝑅(𝑡) = 𝐴 + �𝐵𝑖
4
𝑖=1
𝑒−𝑡𝜏𝑖 ,
with pre-exponential factors Bi, the characteristic decay times τi and an
additional background A. R(t) is often called the sample decay model. The
characteristic lifetimes τi are the most important decay parameters. They are
specific for different decay processes and express the time it takes to decay
from the beginning of the decay to a level of about 37 % of the original value.
It is a theoretical expression for the response of the sample to an infinitely
short excitation. The parameters B and τ are extracted from the raw data by a
numerical fit starting from the top of the decay curve. The expression above
contains four exponential terms. Many measurements contain only one or two
terms. On the other hand, samples can theoretically contain many more
lifetimes and can even be so complex that a lifetime distribution analysis
would be justified. However, practically all real lifetime measurements can be
approximated with no more than four exponential terms. Often, careful
experimental planning and clean practice can reduce the number of exponential
terms. Most radiative decay times, determined in this work, contain only one
term, however, some are bi-exponential.
The pre-exponential factors Bi are values, which include technical
(instrumental) parameters and sample parameters. Used in relative terms, they
are still valuable sample parameters. In a multi-component system, for
instance, the concentration ratio of the individual components can be
determined. In absolute terms, the Bi values are also affected by instrumental
parameters like efficiency of the system, geometrical conditions of the sample,
intensity of the excitation source, etc. These instrumental parameters can
increase or decrease the measured sample signal, which effectively will result
in an (simultaneous) increase or decrease of the Bi values.
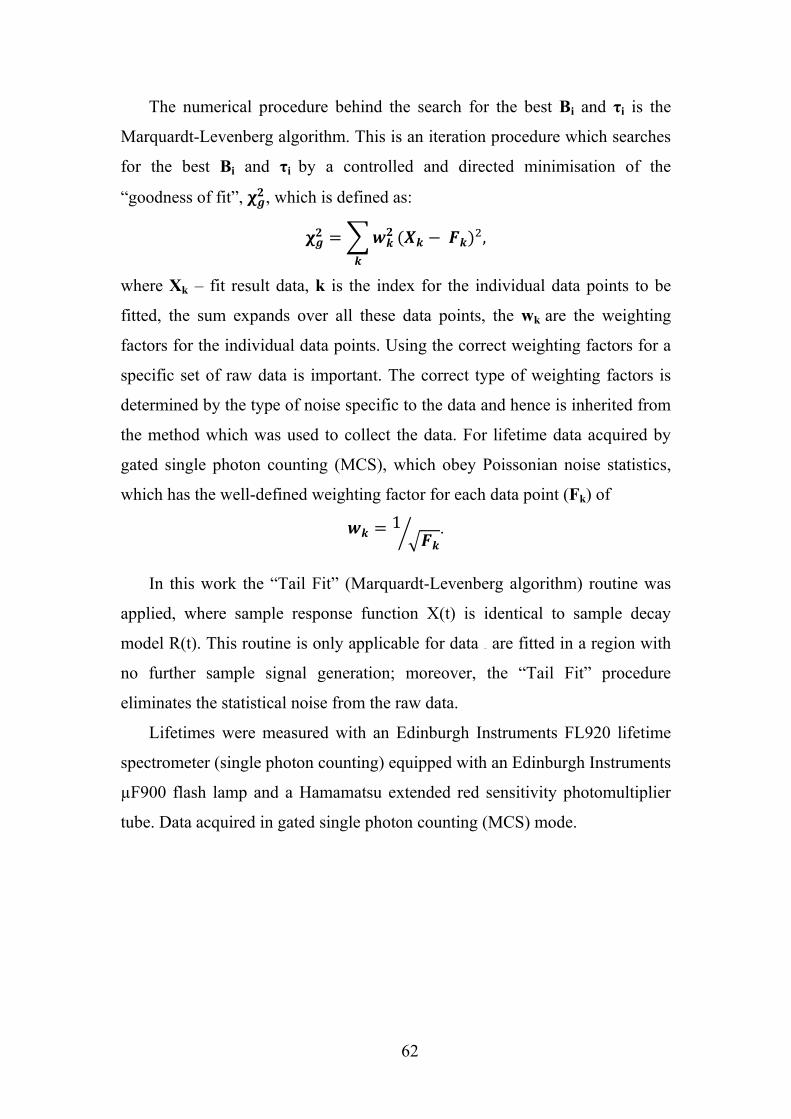
62
The numerical procedure behind the search for the best Bi and τi is the
Marquardt-Levenberg algorithm. This is an iteration procedure which searches
for the best Bi and τi by a controlled and directed minimisation of the
“goodness of fit”, 𝛘𝒈𝟐 , which is defined as:
𝛘𝒈𝟐 = �𝒘𝒌𝟐
𝒌
(𝑿𝒌 − 𝑭𝒌)2,
where Xk – fit result data, k is the index for the individual data points to be
fitted, the sum expands over all these data points, the wk are the weighting
factors for the individual data points. Using the correct weighting factors for a
specific set of raw data is important. The correct type of weighting factors is
determined by the type of noise specific to the data and hence is inherited from
the method which was used to collect the data. For lifetime data acquired by
gated single photon counting (MCS), which obey Poissonian noise statistics,
which has the well-defined weighting factor for each data point (Fk) of
𝒘𝒌 = 1�𝑭𝒌� .
In this work the “Tail Fit” (Marquardt-Levenberg algorithm) routine was
applied, where sample response function X(t) is identical to sample decay
model R(t). This routine is only applicable for data which are fitted in a region with
no further sample signal generation; moreover, the “Tail Fit” procedure
eliminates the statistical noise from the raw data.
Lifetimes were measured with an Edinburgh Instruments FL920 lifetime
spectrometer (single photon counting) equipped with an Edinburgh Instruments
µF900 flash lamp and a Hamamatsu extended red sensitivity photomultiplier
tube. Data acquired in gated single photon counting (MCS) mode.
63
Chapter 6. Photoluminescence Properties of Sm2+ in SrB4O7
6.1. Experimental Details
Samarium-substituted strontium tetraborate (SrB4O7, SrTB) samples were
synthesized by the traditional solid-state method, which is based on the
interaction of boron oxide and strontium (samarium) oxide at high temperature
(~900 °C). Initial materials were Sm2O3 (99.9% Alfa-Aesar), SrCO3 (≥99.9%
Aldrich) and H3BO3 (≥99.5% Merck). The 5 wt% excess of boric acid were
added due to preferential evaporation of boron oxide. The series of Sr1-
xSmxB4O7 samples with x = 0.001, 0.005, 0.010, 0.025, 0.050 and 0.100 were
prepared, corresponding to 0.1, 0.5, 1.0, 2.5, 5.0 and 10.0 % of samarium
substitution, respectively. The selected amounts of raw materials were
thoroughly ground in an agate mortar (acetone was used as medium) and then
preheated in a furnace at 600 °C for 2 h in air. Subsequently, the reground
powders were repeatedly sintered in three steps ([I], [II] and [III]) for 8 h at
900°C in air, with intermediate grinding. Body color of obtained materials
ranged from pale orange (barely visible) to intense red as a function of
substituted samarium concentration.
Excitation (excitation slit 0.2 nm and emission slit 2.0 nm) and emission
(excitation slit 5.0 nm and emission slit 0.2 nm) spectra were recorded in the
ranges of 250 – 640 and 500 – 900 nm (step 0.25 nm, dwell 0.20 s),
measurements were repeated once.
6.2. Data analysis and Discussion
Figure 6.1 present the XRD patterns of 0.1 % samarium substituted
strontium tetraborate phase evolution against the annealing steps. After the first
heating at 900 °C for 8h in air (Figure 6.1a) the blend of three different
strontium borates appears. The major phase is orthorhombic SrB4O7
(ICDD#04-006-8398) and two minor phases, orthorhombic SrB2O4 (ICDD#04-
010-0838) and SrB6O10 are indentified. For latter one there is no assigned file
number and this record stands under asterisk doubtful. Nevertheless, this is
only one reasonable assignment for examined pattern. After second annealing
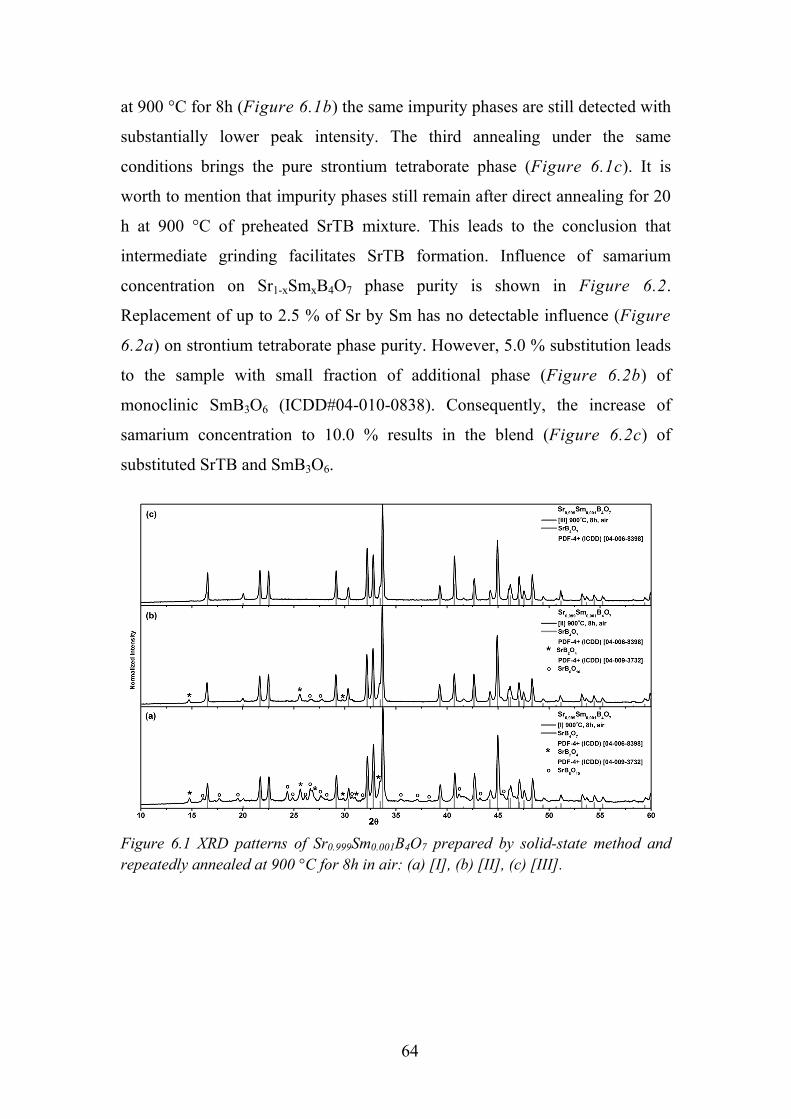
64
at 900 °C for 8h (Figure 6.1b) the same impurity phases are still detected with
substantially lower peak intensity. The third annealing under the same
conditions brings the pure strontium tetraborate phase (Figure 6.1c). It is
worth to mention that impurity phases still remain after direct annealing for 20
h at 900 °C of preheated SrTB mixture. This leads to the conclusion that
intermediate grinding facilitates SrTB formation. Influence of samarium
concentration on Sr1-xSmxB4O7 phase purity is shown in Figure 6.2.
Replacement of up to 2.5 % of Sr by Sm has no detectable influence (Figure
6.2a) on strontium tetraborate phase purity. However, 5.0 % substitution leads
to the sample with small fraction of additional phase (Figure 6.2b) of
monoclinic SmB3O6 (ICDD#04-010-0838). Consequently, the increase of
samarium concentration to 10.0 % results in the blend (Figure 6.2c) of
substituted SrTB and SmB3O6.
Figure 6.1 XRD patterns of Sr0.999Sm0.001B4O7 prepared by solid-state method and repeatedly annealed at 900 °C for 8h in air: (a) [I], (b) [II], (c) [III].
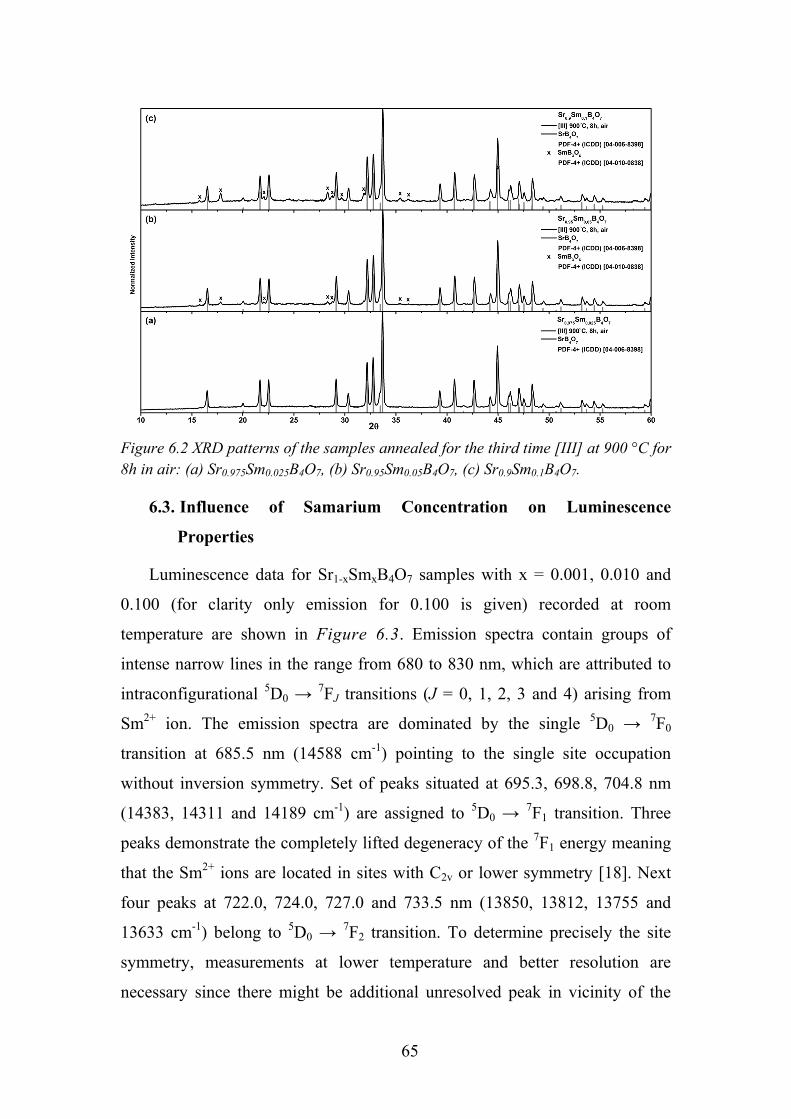
65
Figure 6.2 XRD patterns of the samples annealed for the third time [III] at 900 °C for 8h in air: (a) Sr0.975Sm0.025B4O7, (b) Sr0.95Sm0.05B4O7, (c) Sr0.9Sm0.1B4O7.
6.3. Influence of Samarium Concentration on Luminescence
Properties
Luminescence data for Sr1-xSmxB4O7 samples with x = 0.001, 0.010 and
0.100 (for clarity only emission for 0.100 is given) recorded at room
temperature are shown in Figure 6.3. Emission spectra contain groups of
intense narrow lines in the range from 680 to 830 nm, which are attributed to
intraconfigurational 5D0 → 7FJ transitions (J = 0, 1, 2, 3 and 4) arising from
Sm2+ ion. The emission spectra are dominated by the single 5D0 → 7F0
transition at 685.5 nm (14588 cm-1) pointing to the single site occupation
without inversion symmetry. Set of peaks situated at 695.3, 698.8, 704.8 nm
(14383, 14311 and 14189 cm-1) are assigned to 5D0 → 7F1 transition. Three
peaks demonstrate the completely lifted degeneracy of the 7F1 energy meaning
that the Sm2+ ions are located in sites with C2v or lower symmetry [18]. Next
four peaks at 722.0, 724.0, 727.0 and 733.5 nm (13850, 13812, 13755 and
13633 cm-1) belong to 5D0 → 7F2 transition. To determine precisely the site
symmetry, measurements at lower temperature and better resolution are
necessary since there might be additional unresolved peak in vicinity of the
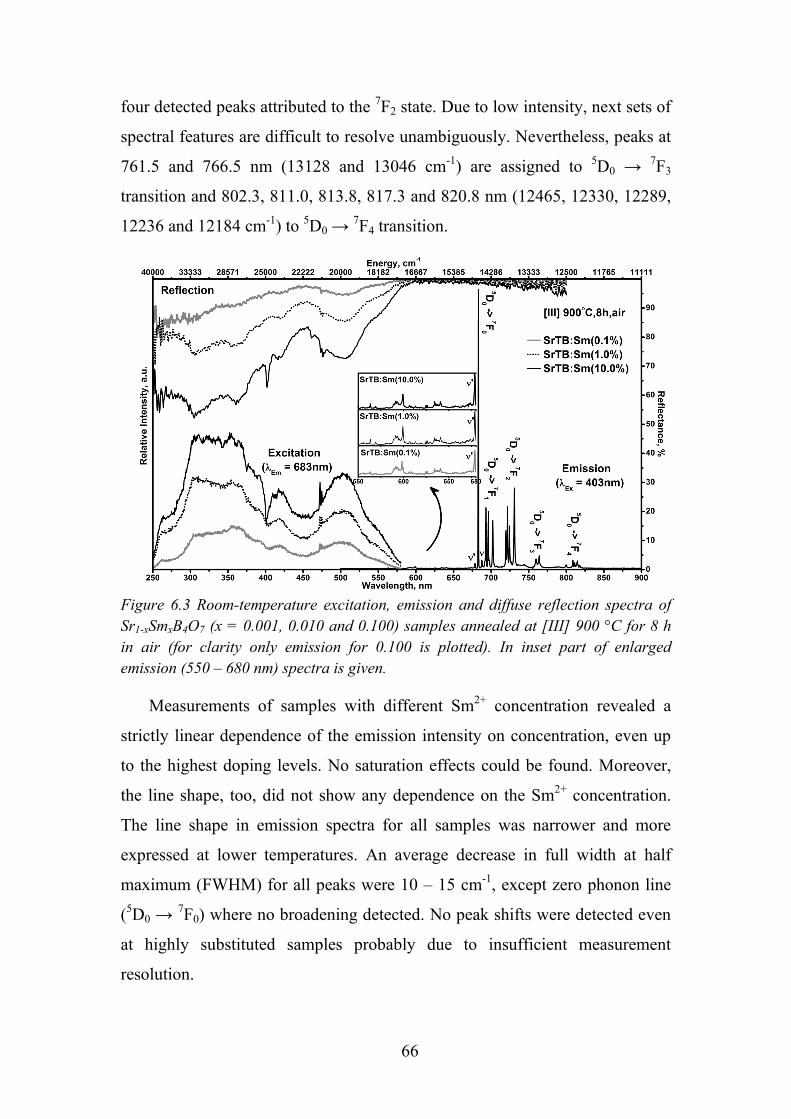
66
four detected peaks attributed to the 7F2 state. Due to low intensity, next sets of
spectral features are difficult to resolve unambiguously. Nevertheless, peaks at
761.5 and 766.5 nm (13128 and 13046 cm-1) are assigned to 5D0 → 7F3
transition and 802.3, 811.0, 813.8, 817.3 and 820.8 nm (12465, 12330, 12289,
12236 and 12184 cm-1) to 5D0 → 7F4 transition.
Figure 6.3 Room-temperature excitation, emission and diffuse reflection spectra of Sr1-xSmxB4O7 (x = 0.001, 0.010 and 0.100) samples annealed at [III] 900 °C for 8 h in air (for clarity only emission for 0.100 is plotted). In inset part of enlarged emission (550 – 680 nm) spectra is given.
Measurements of samples with different Sm2+ concentration revealed a
strictly linear dependence of the emission intensity on concentration, even up
to the highest doping levels. No saturation effects could be found. Moreover,
the line shape, too, did not show any dependence on the Sm2+ concentration.
The line shape in emission spectra for all samples was narrower and more
expressed at lower temperatures. An average decrease in full width at half
maximum (FWHM) for all peaks were 10 – 15 cm-1, except zero phonon line
(5D0 → 7F0) where no broadening detected. No peak shifts were detected even
at highly substituted samples probably due to insufficient measurement
resolution.
67
The weak peaks at the sides of 5D0 → 7F0 transition (Figure 6.3), 680.8
and 690.0 nm (14690 and 14493 cm-1), are ascribed to the vibronic emission
transitions, denoted as υ and υ’, respectively. The energy displacement with the
zero-phonon line 5D0 → 7F0 is about 98 cm-1. With higher temperatures
intensity of those two lines increase indicating that it is a vibronic (electron-
phonon coupled) transition (Inset (II) in Figure 6.5). The vibration involved
is probably coupled from low energy Sm-O vibration [114]. The reflection
spectra mimic excitation data showing absorption of two broad bands in the
range of 550 – 450 and 440 – 350 nm. In the spectrum with the highest
substitution level, the Sm3+ absorption line at 403 nm is clearly visible.
Reflection represents linear relationship between Sm2+ concentration and
increase of samples body color intensity. In the low energy part of the
excitation spectra (17200 – 21700 cm-1) the band with shoulder could be
distinguished, the main peak is designated as the SmB band and the satellite as
the SmA band [115]. The SmA band should be regarded as the first f-d
transition with the weak intensity attributed to the forbidden nature of the
transition. Inset in Figure 6.3 provides zoomed part of emission spectra
between 550-680 nm, where residual Sm3+ emission (4G5/2 → 6H5/2, 6H7/2 and 6H9/2) is visible. Despite the best suitable excitation wavelength for trivalent
samarium (λEx = 403 nm) used; only traces of Sm3+ emission were detected.
Ratio of Sm3+ emission intensity and υ’ vibronic line (Figure 6.3(inset))
remains the same for whole series of samples. This observation suggests the
efficient Sm3+ emission quenching, because excitation and reflection spectra
clearly indicates presence of trivalent samarium in the investigated samples
(absorption at 403 nm). Presence of Sm3+ absorption line for highly doped
SrTB is also justified by phase purity (Figure 6.2c).
6.4. Luminescence and its Temperature Effects on Sm2+
Temperature dependent excitation spectra of Sr0.99Sm0.01B4O7 are shown in
Figure 6.4, data were collected monitoring the emission intensity of 5D0 → 7F0 transition (685.0 nm). Generally, spectra of Sm2+ systems display broad
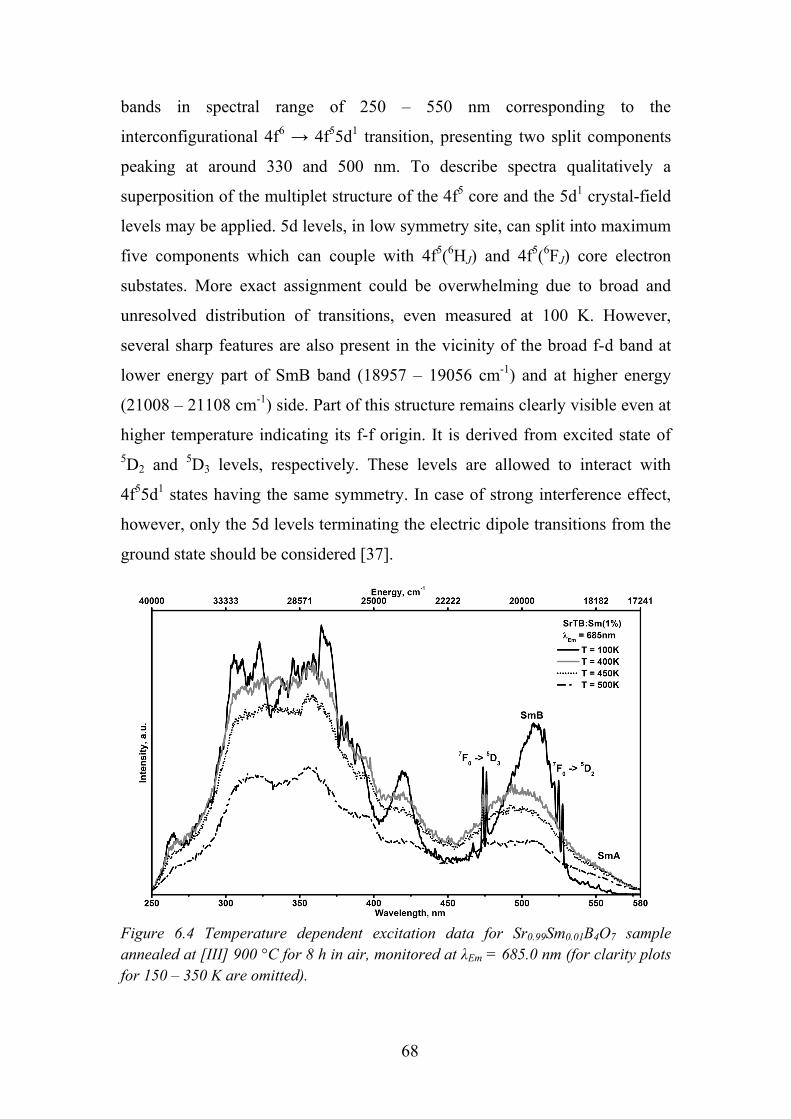
68
bands in spectral range of 250 – 550 nm corresponding to the
interconfigurational 4f6 → 4f55d1 transition, presenting two split components
peaking at around 330 and 500 nm. To describe spectra qualitatively a
superposition of the multiplet structure of the 4f5 core and the 5d1 crystal-field
levels may be applied. 5d levels, in low symmetry site, can split into maximum
five components which can couple with 4f5(6HJ) and 4f5(6FJ) core electron
substates. More exact assignment could be overwhelming due to broad and
unresolved distribution of transitions, even measured at 100 K. However,
several sharp features are also present in the vicinity of the broad f-d band at
lower energy part of SmB band (18957 – 19056 cm-1) and at higher energy
(21008 – 21108 cm-1) side. Part of this structure remains clearly visible even at
higher temperature indicating its f-f origin. It is derived from excited state of 5D2 and 5D3 levels, respectively. These levels are allowed to interact with
4f55d1 states having the same symmetry. In case of strong interference effect,
however, only the 5d levels terminating the electric dipole transitions from the
ground state should be considered [37].
Figure 6.4 Temperature dependent excitation data for Sr0.99Sm0.01B4O7 sample annealed at [III] 900 °C for 8 h in air, monitored at λEm = 685.0 nm (for clarity plots for 150 – 350 K are omitted).
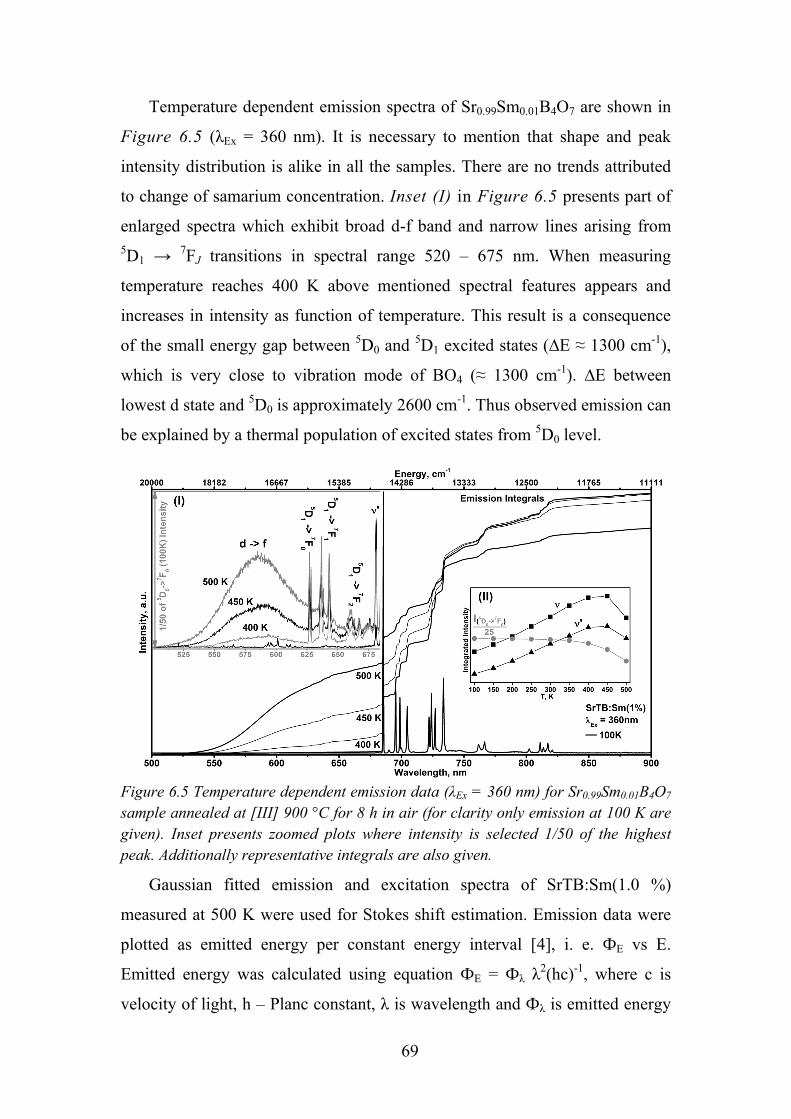
69
Temperature dependent emission spectra of Sr0.99Sm0.01B4O7 are shown in
Figure 6.5 (λEx = 360 nm). It is necessary to mention that shape and peak
intensity distribution is alike in all the samples. There are no trends attributed
to change of samarium concentration. Inset (I) in Figure 6.5 presents part of
enlarged spectra which exhibit broad d-f band and narrow lines arising from 5D1 → 7FJ transitions in spectral range 520 – 675 nm. When measuring
temperature reaches 400 K above mentioned spectral features appears and
increases in intensity as function of temperature. This result is a consequence
of the small energy gap between 5D0 and 5D1 excited states (∆E ≈ 1300 cm-1),
which is very close to vibration mode of BO4 (≈ 1300 cm-1). ∆E between
lowest d state and 5D0 is approximately 2600 cm-1. Thus observed emission can
be explained by a thermal population of excited states from 5D0 level.
Figure 6.5 Temperature dependent emission data (λEx = 360 nm) for Sr0.99Sm0.01B4O7 sample annealed at [III] 900 °C for 8 h in air (for clarity only emission at 100 K are given). Inset presents zoomed plots where intensity is selected 1/50 of the highest peak. Additionally representative integrals are also given.
Gaussian fitted emission and excitation spectra of SrTB:Sm(1.0 %)
measured at 500 K were used for Stokes shift estimation. Emission data were
plotted as emitted energy per constant energy interval [4], i. e. ФE vs E.
Emitted energy was calculated using equation ФE = Фλ λ2(hc)-1, where c is
velocity of light, h – Planc constant, λ is wavelength and Фλ is emitted energy
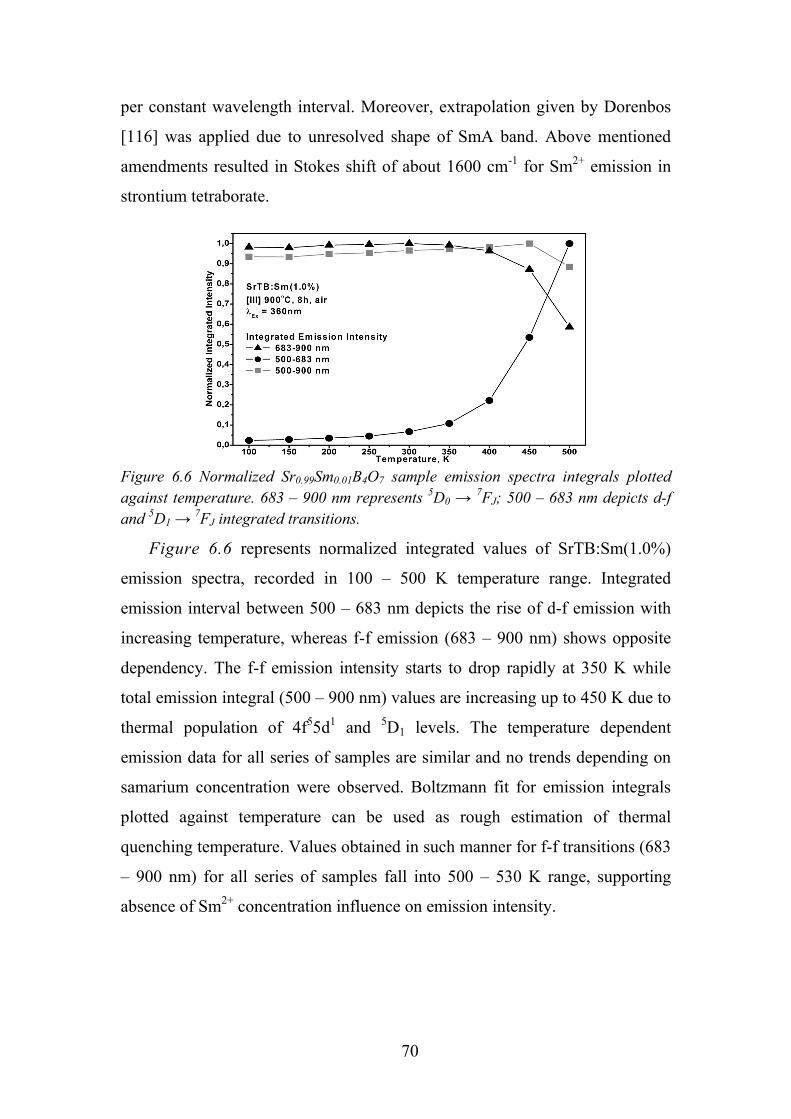
70
per constant wavelength interval. Moreover, extrapolation given by Dorenbos
[116] was applied due to unresolved shape of SmA band. Above mentioned
amendments resulted in Stokes shift of about 1600 cm-1 for Sm2+ emission in
strontium tetraborate.
Figure 6.6 Normalized Sr0.99Sm0.01B4O7 sample emission spectra integrals plotted against temperature. 683 – 900 nm represents 5D0 → 7FJ; 500 – 683 nm depicts d-f and 5D1 → 7FJ integrated transitions.
Figure 6.6 represents normalized integrated values of SrTB:Sm(1.0%)
emission spectra, recorded in 100 – 500 K temperature range. Integrated
emission interval between 500 – 683 nm depicts the rise of d-f emission with
increasing temperature, whereas f-f emission (683 – 900 nm) shows opposite
dependency. The f-f emission intensity starts to drop rapidly at 350 K while
total emission integral (500 – 900 nm) values are increasing up to 450 K due to
thermal population of 4f55d1 and 5D1 levels. The temperature dependent
emission data for all series of samples are similar and no trends depending on
samarium concentration were observed. Boltzmann fit for emission integrals
plotted against temperature can be used as rough estimation of thermal
quenching temperature. Values obtained in such manner for f-f transitions (683
– 900 nm) for all series of samples fall into 500 – 530 K range, supporting
absence of Sm2+ concentration influence on emission intensity.
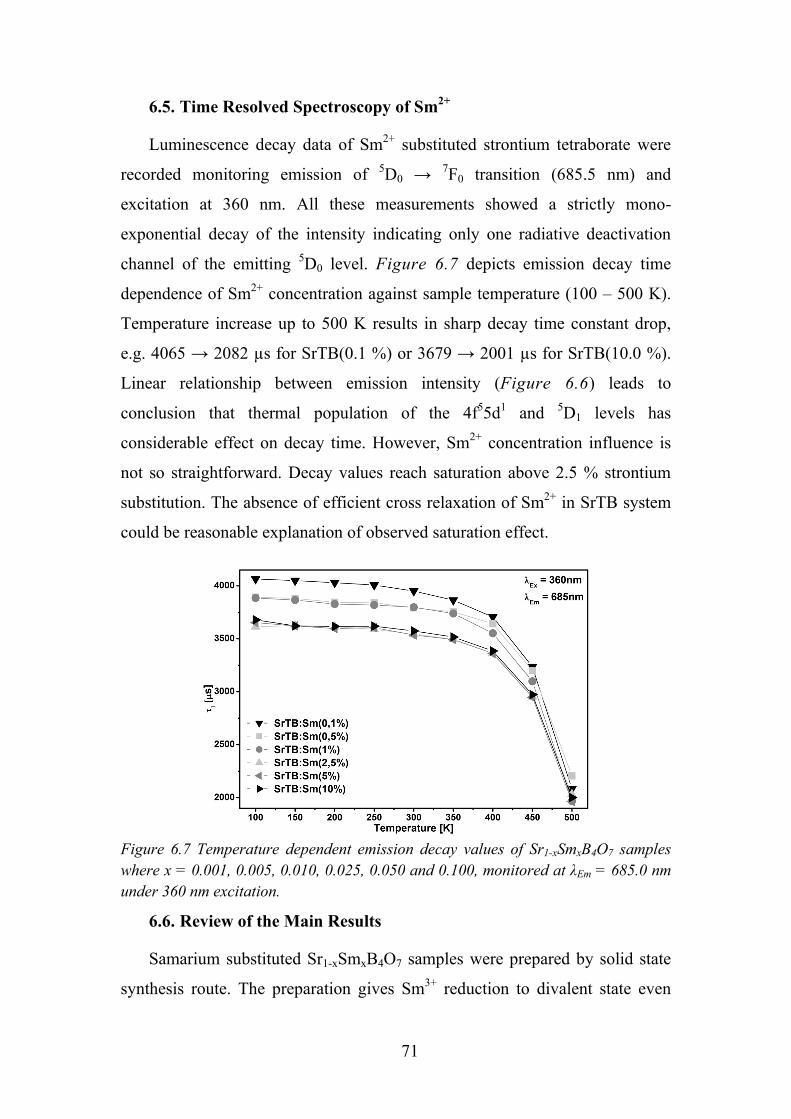
71
6.5. Time Resolved Spectroscopy of Sm2+
Luminescence decay data of Sm2+ substituted strontium tetraborate were
recorded monitoring emission of 5D0 → 7F0 transition (685.5 nm) and
excitation at 360 nm. All these measurements showed a strictly mono-
exponential decay of the intensity indicating only one radiative deactivation
channel of the emitting 5D0 level. Figure 6.7 depicts emission decay time
dependence of Sm2+ concentration against sample temperature (100 – 500 K).
Temperature increase up to 500 K results in sharp decay time constant drop,
e.g. 4065 → 2082 µs for SrTB(0.1 %) or 3679 → 2001 µs for SrTB(10.0 %).
Linear relationship between emission intensity (Figure 6.6) leads to
conclusion that thermal population of the 4f55d1 and 5D1 levels has
considerable effect on decay time. However, Sm2+ concentration influence is
not so straightforward. Decay values reach saturation above 2.5 % strontium
substitution. The absence of efficient cross relaxation of Sm2+ in SrTB system
could be reasonable explanation of observed saturation effect.
Figure 6.7 Temperature dependent emission decay values of Sr1-xSmxB4O7 samples where x = 0.001, 0.005, 0.010, 0.025, 0.050 and 0.100, monitored at λEm = 685.0 nm under 360 nm excitation.
6.6. Review of the Main Results
Samarium substituted Sr1-xSmxB4O7 samples were prepared by solid state
synthesis route. The preparation gives Sm3+ reduction to divalent state even
72
after annealing in air at high temperature. Substitution of strontium up to 10 %
have no substantial influence on the residual Sm3+ emission despite significant
amount of SmB3O6 phase formation. Moreover, no peak shifts were detected
neither against Sm2+ concentration or measuring temperature. Due to the
thermal population, the 5D1 → 7FJ transitions are observed at temperatures
higher than 350 K even though the vibration of borate is a high-frequency one.
The intensity of 5D1 → 7FJ transitions increased with the increasing
temperature while the intensity of 5D0 → 7FJ transitions decreased. The d-f
transitions of Sm2+ in SrB4O7 appear at high temperature due to the low enough
energy position of the 4f55d1 level and the small energy difference between
4f55d1 and 5D0 levels. The study on the temperature dependence of samarium
luminescence in strontium tetraborate shows that the variation of Sm2+
fluorescence is most probably governed by the lowest lying 4f55d1 states.
Obtained Stokes shift for Sm2+ d-f emission is ≈ 1600 cm-1. 5D0 → 7F1 and 5D0
→ 7F2 transitions are split into three and four substates, respectively, thus
suggesting that Sm2+ occupies a site with C2v or lower symmetry (Figure 3.3).
The vibronic transitions with energy difference about 98 cm-1 were found even
at 100 K for the zero phonon line (5D0 → 7F0) of Sm2+ derived from the
coupling of the excited 4f electrons with local phonons. The decay time of
Sm2+ in SrB4O7 is temperature dependent. Nevertheless, all the decay curves
are single exponential. The observed saturation of decay time values for higher
than 2.5 % samarium substitution indicate absence of Sm2+ concentration
quenching, due to negligible interaction between optically active ions.
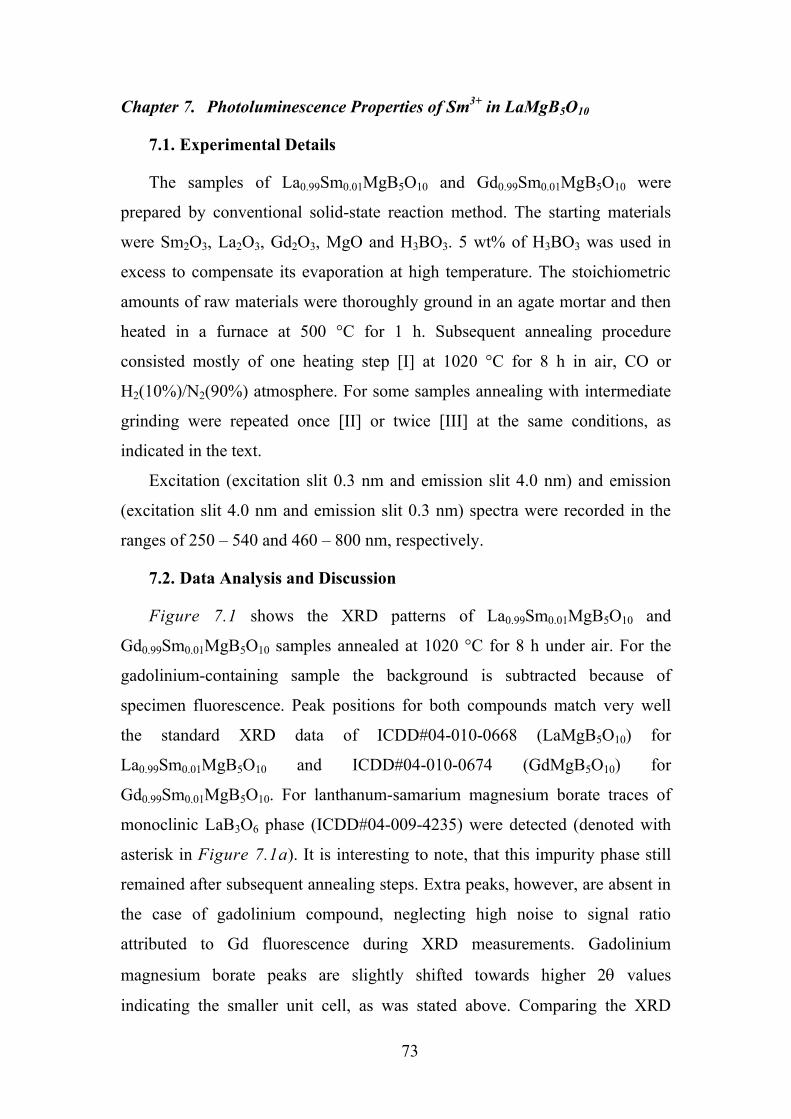
73
Chapter 7. Photoluminescence Properties of Sm3+ in LaMgB5O10
7.1. Experimental Details
The samples of La0.99Sm0.01MgB5O10 and Gd0.99Sm0.01MgB5O10 were
prepared by conventional solid-state reaction method. The starting materials
were Sm2O3, La2O3, Gd2O3, MgO and H3BO3. 5 wt% of H3BO3 was used in
excess to compensate its evaporation at high temperature. The stoichiometric
amounts of raw materials were thoroughly ground in an agate mortar and then
heated in a furnace at 500 °C for 1 h. Subsequent annealing procedure
consisted mostly of one heating step [I] at 1020 °C for 8 h in air, CO or
H2(10%)/N2(90%) atmosphere. For some samples annealing with intermediate
grinding were repeated once [II] or twice [III] at the same conditions, as
indicated in the text.
Excitation (excitation slit 0.3 nm and emission slit 4.0 nm) and emission
(excitation slit 4.0 nm and emission slit 0.3 nm) spectra were recorded in the
ranges of 250 – 540 and 460 – 800 nm, respectively.
7.2. Data Analysis and Discussion
Figure 7.1 shows the XRD patterns of La0.99Sm0.01MgB5O10 and
Gd0.99Sm0.01MgB5O10 samples annealed at 1020 °C for 8 h under air. For the
gadolinium-containing sample the background is subtracted because of
specimen fluorescence. Peak positions for both compounds match very well
the standard XRD data of ICDD#04-010-0668 (LaMgB5O10) for
La0.99Sm0.01MgB5O10 and ICDD#04-010-0674 (GdMgB5O10) for
Gd0.99Sm0.01MgB5O10. For lanthanum-samarium magnesium borate traces of
monoclinic LaB3O6 phase (ICDD#04-009-4235) were detected (denoted with
asterisk in Figure 7.1a). It is interesting to note, that this impurity phase still
remained after subsequent annealing steps. Extra peaks, however, are absent in
the case of gadolinium compound, neglecting high noise to signal ratio
attributed to Gd fluorescence during XRD measurements. Gadolinium
magnesium borate peaks are slightly shifted towards higher 2θ values
indicating the smaller unit cell, as was stated above. Comparing the XRD
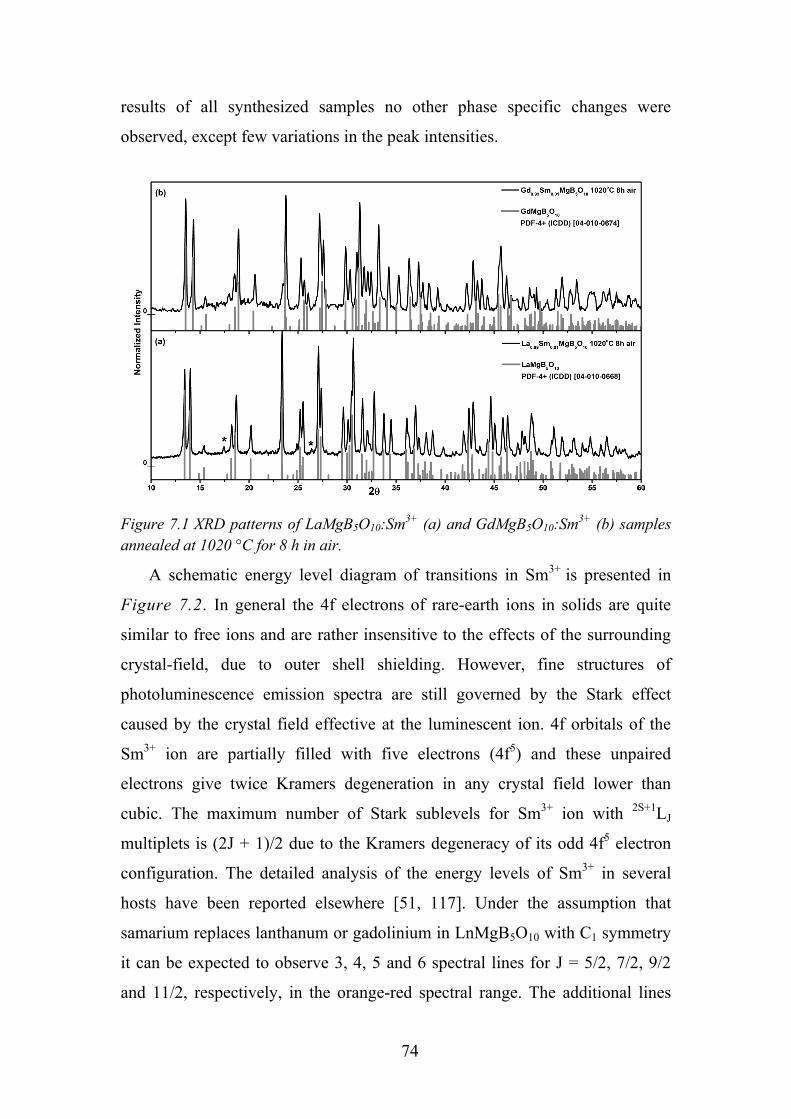
74
results of all synthesized samples no other phase specific changes were
observed, except few variations in the peak intensities.
Figure 7.1 XRD patterns of LaMgB5O10:Sm3+ (a) and GdMgB5O10:Sm3+ (b) samples annealed at 1020 °C for 8 h in air.
A schematic energy level diagram of transitions in Sm3+ is presented in
Figure 7.2. In general the 4f electrons of rare-earth ions in solids are quite
similar to free ions and are rather insensitive to the effects of the surrounding
crystal-field, due to outer shell shielding. However, fine structures of
photoluminescence emission spectra are still governed by the Stark effect
caused by the crystal field effective at the luminescent ion. 4f orbitals of the
Sm3+ ion are partially filled with five electrons (4f5) and these unpaired
electrons give twice Kramers degeneration in any crystal field lower than
cubic. The maximum number of Stark sublevels for Sm3+ ion with 2S+1LJ
multiplets is (2J + 1)/2 due to the Kramers degeneracy of its odd 4f5 electron
configuration. The detailed analysis of the energy levels of Sm3+ in several
hosts have been reported elsewhere [51, 117]. Under the assumption that
samarium replaces lanthanum or gadolinium in LnMgB5O10 with C1 symmetry
it can be expected to observe 3, 4, 5 and 6 spectral lines for J = 5/2, 7/2, 9/2
and 11/2, respectively, in the orange-red spectral range. The additional lines
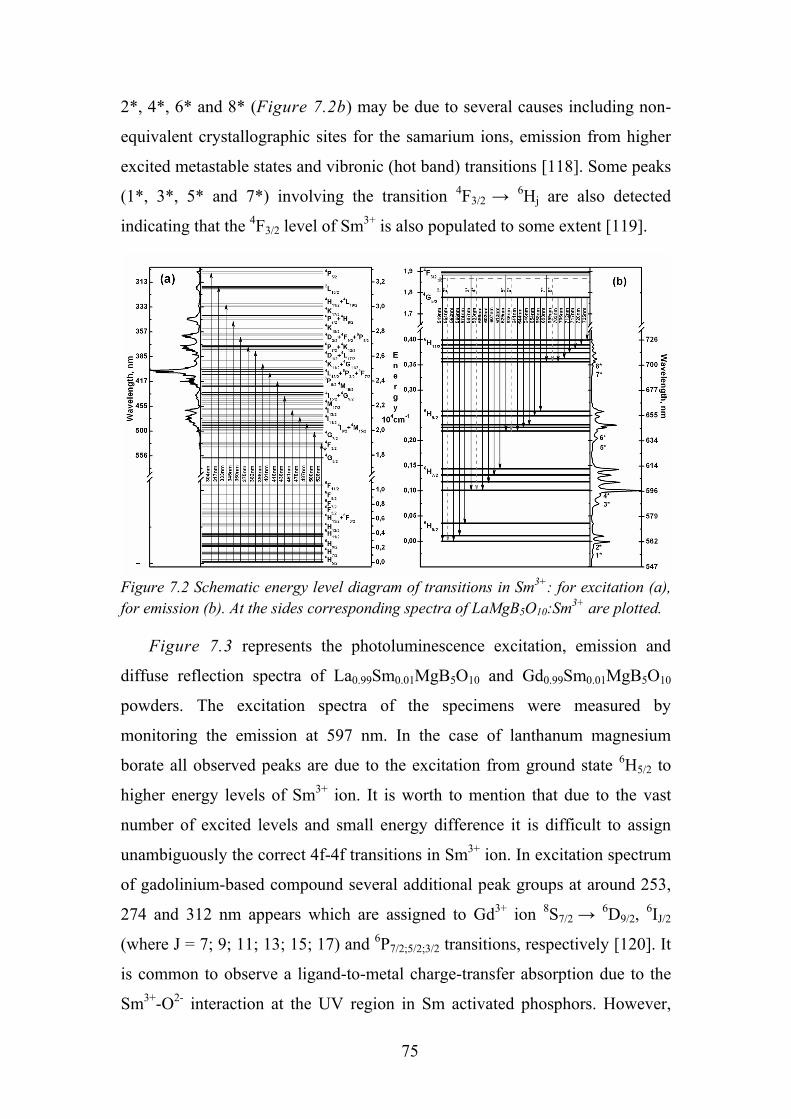
75
2*, 4*, 6* and 8* (Figure 7.2b) may be due to several causes including non-
equivalent crystallographic sites for the samarium ions, emission from higher
excited metastable states and vibronic (hot band) transitions [118]. Some peaks
(1*, 3*, 5* and 7*) involving the transition 4F3/2 → 6Hj are also detected
indicating that the 4F3/2 level of Sm3+ is also populated to some extent [119].
Figure 7.2 Schematic energy level diagram of transitions in Sm3+: for excitation (a), for emission (b). At the sides corresponding spectra of LaMgB5O10:Sm3+ are plotted.
Figure 7.3 represents the photoluminescence excitation, emission and
diffuse reflection spectra of La0.99Sm0.01MgB5O10 and Gd0.99Sm0.01MgB5O10
powders. The excitation spectra of the specimens were measured by
monitoring the emission at 597 nm. In the case of lanthanum magnesium
borate all observed peaks are due to the excitation from ground state 6H5/2 to
higher energy levels of Sm3+ ion. It is worth to mention that due to the vast
number of excited levels and small energy difference it is difficult to assign
unambiguously the correct 4f-4f transitions in Sm3+ ion. In excitation spectrum
of gadolinium-based compound several additional peak groups at around 253,
274 and 312 nm appears which are assigned to Gd3+ ion 8S7/2 → 6D9/2, 6IJ/2
(where J = 7; 9; 11; 13; 15; 17) and 6P7/2;5/2;3/2 transitions, respectively [120]. It
is common to observe a ligand-to-metal charge-transfer absorption due to the
Sm3+-O2- interaction at the UV region in Sm activated phosphors. However,
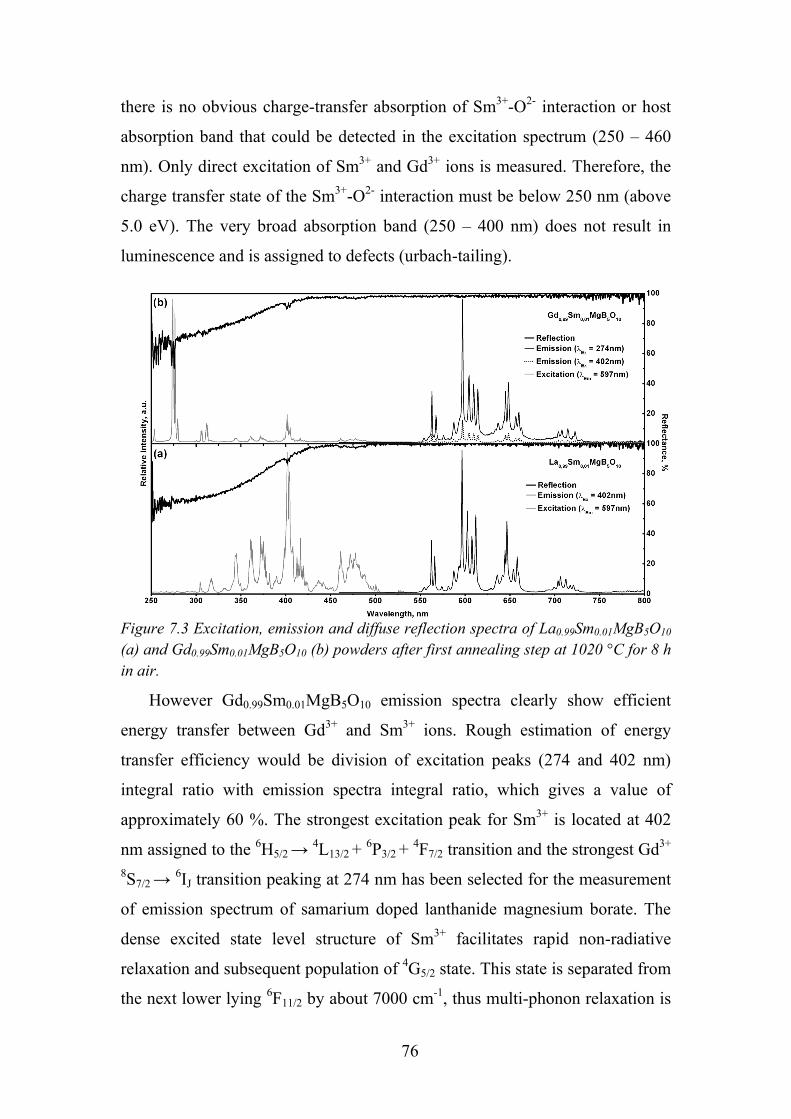
76
there is no obvious charge-transfer absorption of Sm3+-O2- interaction or host
absorption band that could be detected in the excitation spectrum (250 – 460
nm). Only direct excitation of Sm3+ and Gd3+ ions is measured. Therefore, the
charge transfer state of the Sm3+-O2- interaction must be below 250 nm (above
5.0 eV). The very broad absorption band (250 – 400 nm) does not result in
luminescence and is assigned to defects (urbach-tailing).
Figure 7.3 Excitation, emission and diffuse reflection spectra of La0.99Sm0.01MgB5O10 (a) and Gd0.99Sm0.01MgB5O10 (b) powders after first annealing step at 1020 °C for 8 h in air.
However Gd0.99Sm0.01MgB5O10 emission spectra clearly show efficient
energy transfer between Gd3+ and Sm3+ ions. Rough estimation of energy
transfer efficiency would be division of excitation peaks (274 and 402 nm)
integral ratio with emission spectra integral ratio, which gives a value of
approximately 60 %. The strongest excitation peak for Sm3+ is located at 402
nm assigned to the 6H5/2 → 4L13/2 + 6P3/2 + 4F7/2 transition and the strongest Gd3+ 8S7/2 → 6IJ transition peaking at 274 nm has been selected for the measurement
of emission spectrum of samarium doped lanthanide magnesium borate. The
dense excited state level structure of Sm3+ facilitates rapid non-radiative
relaxation and subsequent population of 4G5/2 state. This state is separated from
the next lower lying 6F11/2 by about 7000 cm-1, thus multi-phonon relaxation is
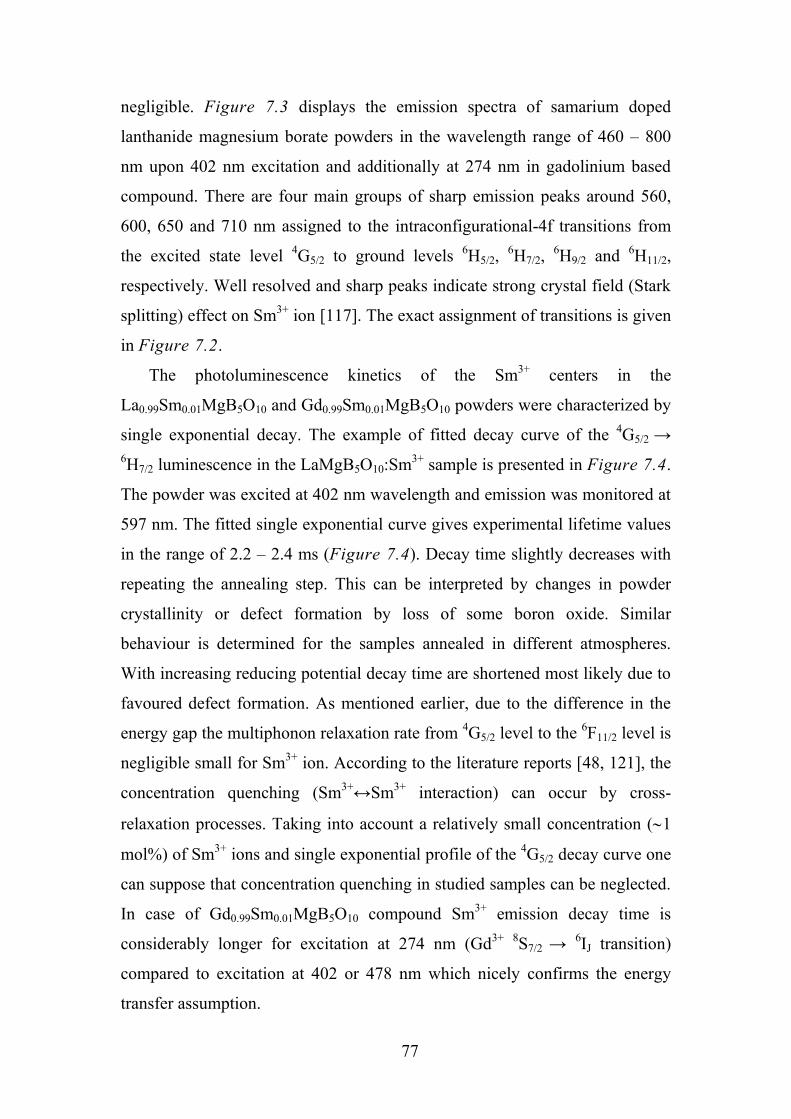
77
negligible. Figure 7.3 displays the emission spectra of samarium doped
lanthanide magnesium borate powders in the wavelength range of 460 – 800
nm upon 402 nm excitation and additionally at 274 nm in gadolinium based
compound. There are four main groups of sharp emission peaks around 560,
600, 650 and 710 nm assigned to the intraconfigurational-4f transitions from
the excited state level 4G5/2 to ground levels 6H5/2, 6H7/2, 6H9/2 and 6H11/2,
respectively. Well resolved and sharp peaks indicate strong crystal field (Stark
splitting) effect on Sm3+ ion [117]. The exact assignment of transitions is given
in Figure 7.2.
The photoluminescence kinetics of the Sm3+ centers in the
La0.99Sm0.01MgB5O10 and Gd0.99Sm0.01MgB5O10 powders were characterized by
single exponential decay. The example of fitted decay curve of the 4G5/2 → 6H7/2 luminescence in the LaMgB5O10:Sm3+ sample is presented in Figure 7.4.
The powder was excited at 402 nm wavelength and emission was monitored at
597 nm. The fitted single exponential curve gives experimental lifetime values
in the range of 2.2 – 2.4 ms (Figure 7.4). Decay time slightly decreases with
repeating the annealing step. This can be interpreted by changes in powder
crystallinity or defect formation by loss of some boron oxide. Similar
behaviour is determined for the samples annealed in different atmospheres.
With increasing reducing potential decay time are shortened most likely due to
favoured defect formation. As mentioned earlier, due to the difference in the
energy gap the multiphonon relaxation rate from 4G5/2 level to the 6F11/2 level is
negligible small for Sm3+ ion. According to the literature reports [48, 121], the
concentration quenching (Sm3+↔Sm3+ interaction) can occur by cross-
relaxation processes. Taking into account a relatively small concentration (∼1
mol%) of Sm3+ ions and single exponential profile of the 4G5/2 decay curve one
can suppose that concentration quenching in studied samples can be neglected.
In case of Gd0.99Sm0.01MgB5O10 compound Sm3+ emission decay time is
considerably longer for excitation at 274 nm (Gd3+ 8S7/2 → 6IJ transition)
compared to excitation at 402 or 478 nm which nicely confirms the energy
transfer assumption.
78
Figure 7.4 Emission decay curve of La0.99Sm0.01MgB5O10 and data for La0.99Sm0.01MgB5O10 and Gd0.99Sm0.01MgB5O10.
7.3. Review of Main Results
Orange-red emitting La0.99Sm0.01MgB5O10 and Gd0.99Sm0.01MgB5O10
photoluminescent materials were synthesized by a solid state reaction method
at 1020 °C for 8 h. Four emission bands corresponding to the 4G5/2→6H5/2, 6H7/2, 6H9/2 and 6H11/2 transitions peaking at 560, 600, 650 and 710 nm,
respectively, upon excitation at 6H5/2→4L13/2+6P3/2+4F7/2 (402 nm) have been
observed. 4F3/2→6Hj transitions are also detected indicating that the 4F3/2 level
of Sm3+ is also populated to some extent. No obvious charge-transfer
absorption of Sm3+-O2- interaction or host absorption band was detected in the
excitation spectrum (250 – 460 nm). By direct excitation of Gd3+ at 274 nm
intense Sm3+ emission was measured indicating an efficient energy transfer
from Gd3+ to Sm3+. The luminescent kinetics data are fitted by single
exponential curve giving experimental lifetime values in the range of 2.2 – 2.4
ms. The decay lifetimes for Sm3+ emission upon direct excitation of Gd3+ is
around 0.1 ms longer, confirming the energy transfer phenomena.
79
Chapter 8. Luminescence of Sm3+ in SrAl12O19 and LaMgAl11O19
8.1. Experimental Details
For samarium-substituted SrAl11O19 and LaMgAl11O19 samples, two main
approaches were selected: conventional solid-state reaction and sol–gel
combustion method. For solid-state synthesis starting materials were Sm2O3,
La2O3, SrCO3 and nano-scale Al2O3. The stoichiometric amounts of raw
materials were thoroughly ground in an agate mortar (acetone was used as
medium) and, as the first step [I], preheated in a furnace at 1000 °C for 4 h in
air. For combustion synthesis the gels were prepared using Sm(NO3)3·6H2O,
Sr(NO3)2 and Al(NO3)3·9H2O. Before synthesis La2O3 was dissolved in diluted
HNO3 and evaporated to dryness, obtained lanthanum salt solution in water,
was used in synthesis. Tris(hydroxymethyl)-aminomethane (tris-amine) or
ethylenediaminetetraacetic acid (EDTA) were used as complexing agent and
fuel. Metal salts were dissolved in distilled water and heated to 65 – 75 °C;
additionally HNO3 was added to prevent hydrolysis of metals. Then, under
continuous stirring, tris(hydroxymethyl)-aminomethane (or EDTA) was added
with the molar ratio of 1:0.5 or 1:1 (to all metal ions) and solutions were stirred
for an additional 1 h at the same temperature. Subsequently, after concentrating
the mixtures by slow evaporation, sols turned into transparent gels. Then the
temperature was raised to 250 °C and the self-maintaining gel combustion
process started and was accompanied with evolution of huge amount of gases.
The resulting products were dried in the oven for several hours at 120 °C and
ground to fine powders, which were preheated for 4 h at 1000 °C in air (the
first step [I]) to remove the residual carbon after the combustion process. In
both cases obtained white powders were further sintered (the second step [II])
for 4 – 12 h at 1400 – 1700 °C under air or H2(20%)/N2(80%) atmosphere.
Excitation (excitation slit 0.5 nm and emission slit 5.0 nm) and emission
(excitation slit 5.0 nm and emission slit 0.5 nm) spectra were recorded in the
ranges of 250 – 500 and 500 – 800 nm, respectively.
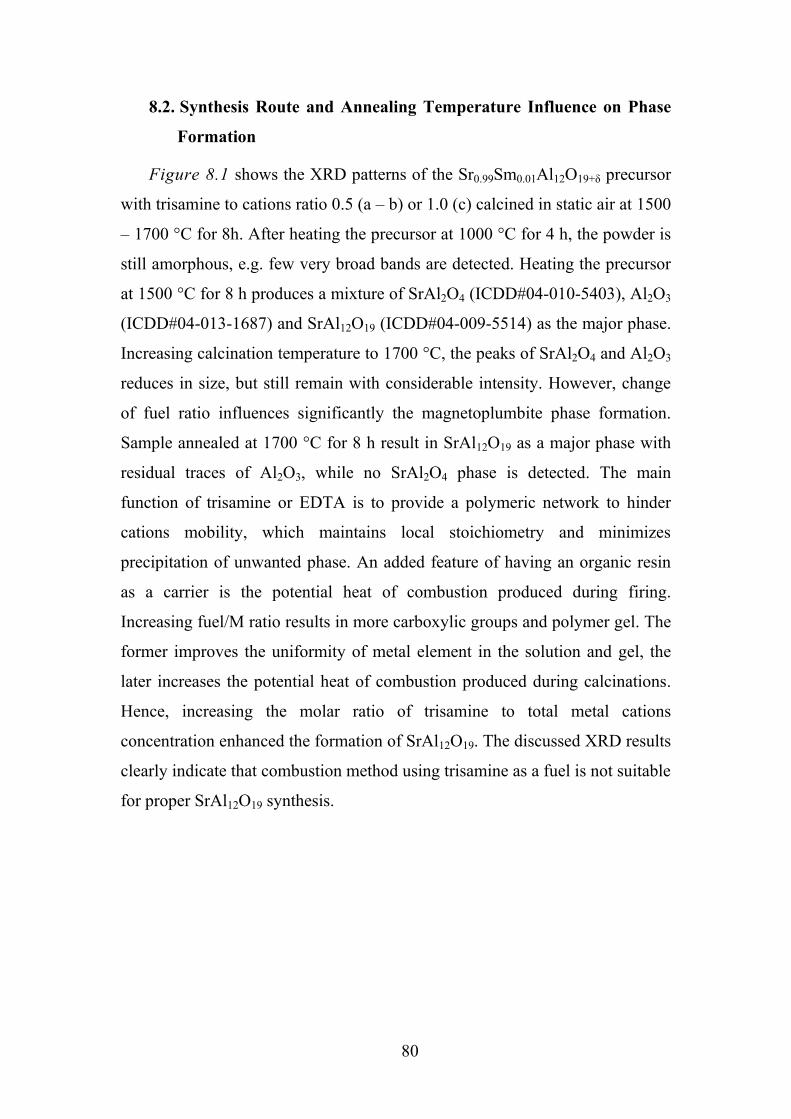
80
8.2. Synthesis Route and Annealing Temperature Influence on Phase
Formation
Figure 8.1 shows the XRD patterns of the Sr0.99Sm0.01Al12O19+δ precursor
with trisamine to cations ratio 0.5 (a – b) or 1.0 (c) calcined in static air at 1500
– 1700 °C for 8h. After heating the precursor at 1000 °C for 4 h, the powder is
still amorphous, e.g. few very broad bands are detected. Heating the precursor
at 1500 °C for 8 h produces a mixture of SrAl2O4 (ICDD#04-010-5403), Al2O3
(ICDD#04-013-1687) and SrAl12O19 (ICDD#04-009-5514) as the major phase.
Increasing calcination temperature to 1700 °C, the peaks of SrAl2O4 and Al2O3
reduces in size, but still remain with considerable intensity. However, change
of fuel ratio influences significantly the magnetoplumbite phase formation.
Sample annealed at 1700 °C for 8 h result in SrAl12O19 as a major phase with
residual traces of Al2O3, while no SrAl2O4 phase is detected. The main
function of trisamine or EDTA is to provide a polymeric network to hinder
cations mobility, which maintains local stoichiometry and minimizes
precipitation of unwanted phase. An added feature of having an organic resin
as a carrier is the potential heat of combustion produced during firing.
Increasing fuel/M ratio results in more carboxylic groups and polymer gel. The
former improves the uniformity of metal element in the solution and gel, the
later increases the potential heat of combustion produced during calcinations.
Hence, increasing the molar ratio of trisamine to total metal cations
concentration enhanced the formation of SrAl12O19. The discussed XRD results
clearly indicate that combustion method using trisamine as a fuel is not suitable
for proper SrAl12O19 synthesis.

81
Figure 8.1 XRD patterns of Sr0.99Sm0.01Al12O19+δ samples prepared by combustion and annealed at: (a) [II] 1500 °C for 8h (Trisamine 1:0.5), (b) [II] 1700 °C for 8h (Trisamine 1:0.5), (c) [II] 1700 °C for 8h (Trisamine 1:1).
Figure 8.2 shows the XRD patterns of the Sr0.99Sm0.01Al12O19-δ precursor
prepared via combustion with EDTA as fuel. EDTA to cations ratio was
selected 1:0.5. The results are completely different as in previous case. Pure
SrAl12O19 phase is obtained even at 1500 °C for 4 h whereas longer annealing
time or higher temperature has no influence on phase purity. There is only
increase in crystallinity of material, because relative peak intensity increases.
Possible explanation for such different influence of synthesis conditions to
phase formation could be differences in initial precursor after combustion.
Samples prepared with trisamine after annealing at high temperature keep the
same volume, while for samples with EDTA decrease in sample volume
observed.
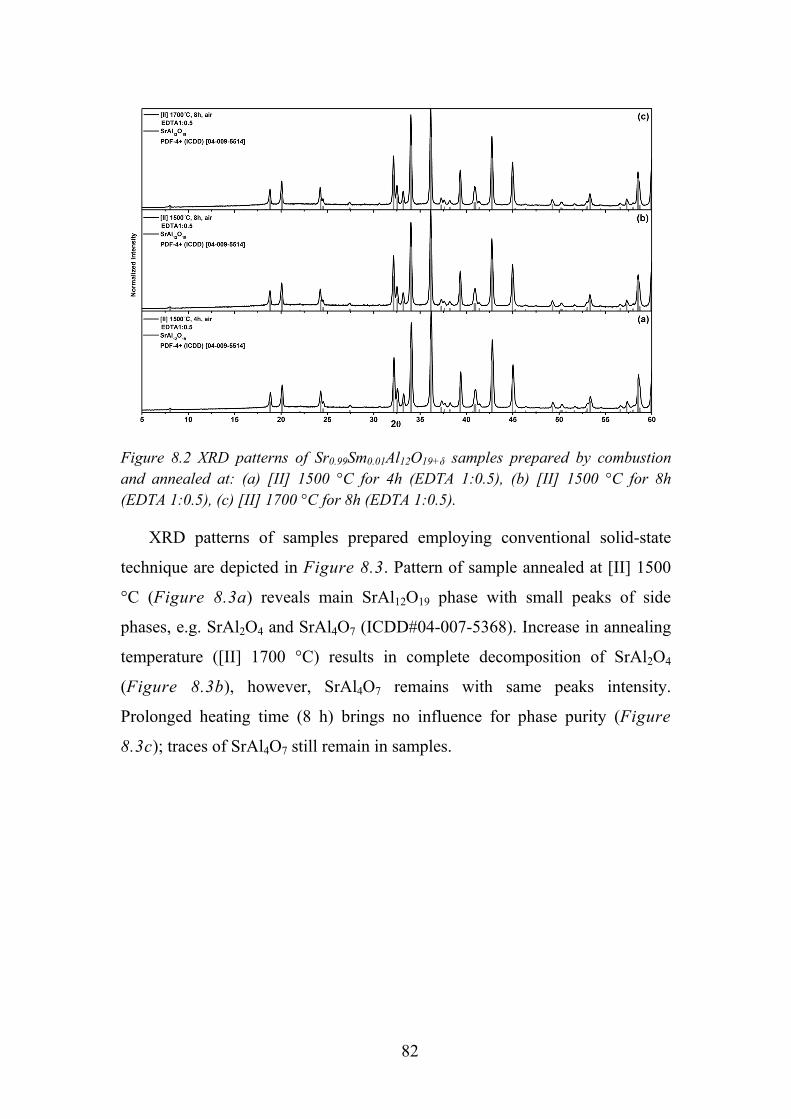
82
Figure 8.2 XRD patterns of Sr0.99Sm0.01Al12O19+δ samples prepared by combustion and annealed at: (a) [II] 1500 °C for 4h (EDTA 1:0.5), (b) [II] 1500 °C for 8h (EDTA 1:0.5), (c) [II] 1700 °C for 8h (EDTA 1:0.5).
XRD patterns of samples prepared employing conventional solid-state
technique are depicted in Figure 8.3. Pattern of sample annealed at [II] 1500
°C (Figure 8.3a) reveals main SrAl12O19 phase with small peaks of side
phases, e.g. SrAl2O4 and SrAl4O7 (ICDD#04-007-5368). Increase in annealing
temperature ([II] 1700 °C) results in complete decomposition of SrAl2O4
(Figure 8.3b), however, SrAl4O7 remains with same peaks intensity.
Prolonged heating time (8 h) brings no influence for phase purity (Figure
8.3c); traces of SrAl4O7 still remain in samples.

83
Figure 8.3 XRD patterns of Sr0.99Sm0.01Al12O19+δ samples prepared by solid-state and annealed at: (a) [II] 1500 °C for 8h, (b) [II] 1700 °C for 4h, (c) [II] 1700 °C for 8h.
In Figure 8.4 is presented XRD data for LaMgAl11O19 prepared via
combustion route. The results are different as compared to SrAl12O19, the
change in fuel nature have no influence on phase formation. Single
magnetolumbite structure phase (ICDD#04-006-2251) is obtained after
annealing preheated powder at [II] 1400 °C for 4 h (Figure 8.4a). There is no
evidence of side phase formation and the same behaviour is observed for
samples annealed at higher temperature ([II] 1700 °C) (Figure 8.4b-c).
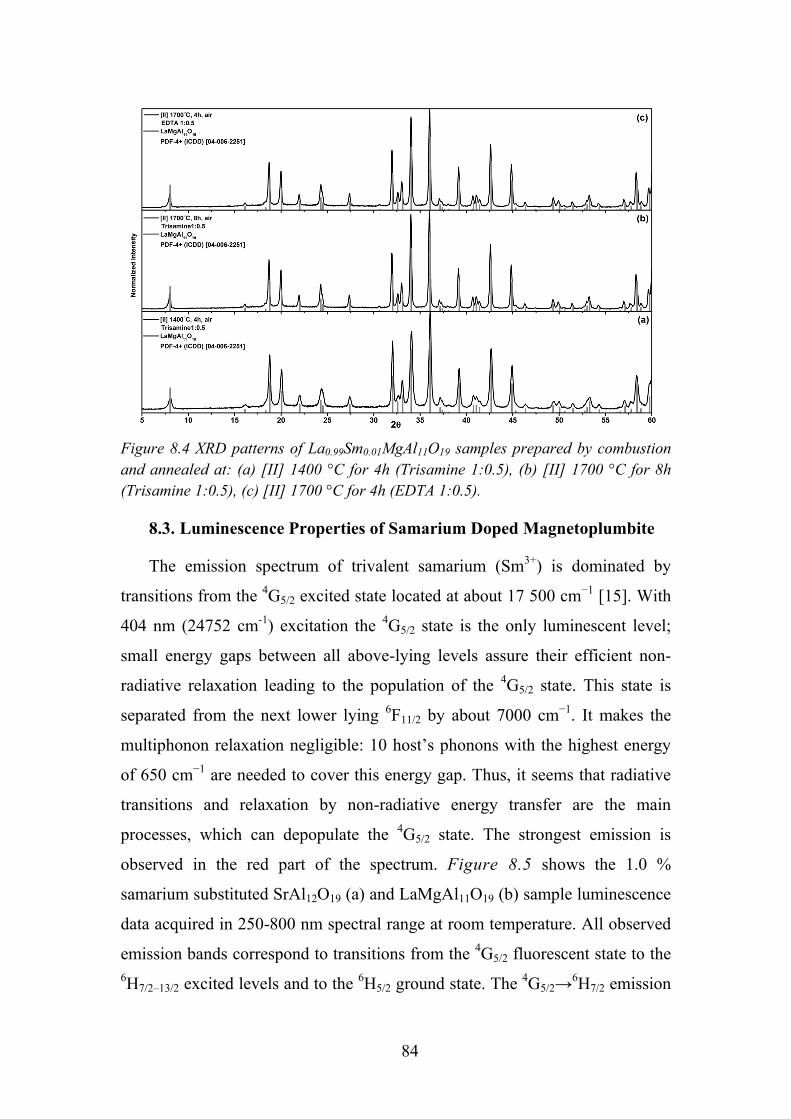
84
Figure 8.4 XRD patterns of La0.99Sm0.01MgAl11O19 samples prepared by combustion and annealed at: (a) [II] 1400 °C for 4h (Trisamine 1:0.5), (b) [II] 1700 °C for 8h (Trisamine 1:0.5), (c) [II] 1700 °C for 4h (EDTA 1:0.5).
8.3. Luminescence Properties of Samarium Doped Magnetoplumbite
The emission spectrum of trivalent samarium (Sm3+) is dominated by
transitions from the 4G5/2 excited state located at about 17 500 cm−1 [15]. With
404 nm (24752 cm-1) excitation the 4G5/2 state is the only luminescent level;
small energy gaps between all above-lying levels assure their efficient non-
radiative relaxation leading to the population of the 4G5/2 state. This state is
separated from the next lower lying 6F11/2 by about 7000 cm−1. It makes the
multiphonon relaxation negligible: 10 host’s phonons with the highest energy
of 650 cm−1 are needed to cover this energy gap. Thus, it seems that radiative
transitions and relaxation by non-radiative energy transfer are the main
processes, which can depopulate the 4G5/2 state. The strongest emission is
observed in the red part of the spectrum. Figure 8.5 shows the 1.0 %
samarium substituted SrAl12O19 (a) and LaMgAl11O19 (b) sample luminescence
data acquired in 250-800 nm spectral range at room temperature. All observed
emission bands correspond to transitions from the 4G5/2 fluorescent state to the 6H7/2–13/2 excited levels and to the 6H5/2 ground state. The 4G5/2→6H7/2 emission
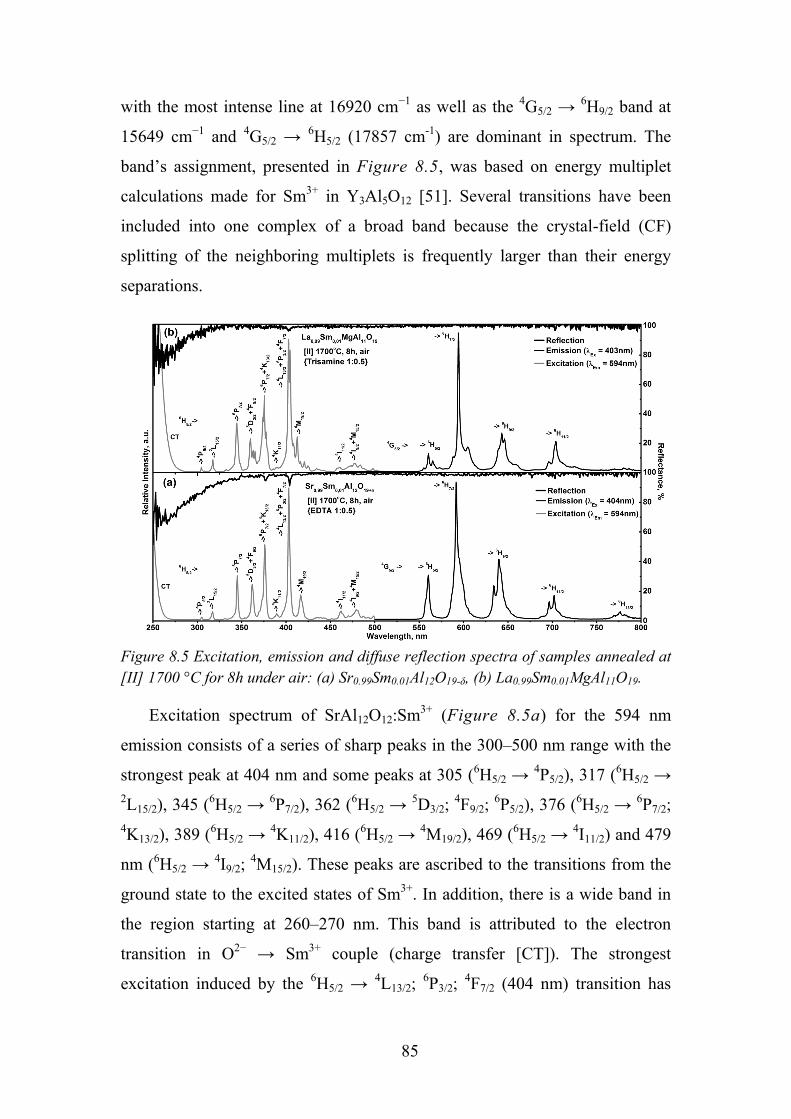
85
with the most intense line at 16920 cm−1 as well as the 4G5/2 → 6H9/2 band at
15649 cm−1 and 4G5/2 → 6H5/2 (17857 cm-1) are dominant in spectrum. The
band’s assignment, presented in Figure 8.5, was based on energy multiplet
calculations made for Sm3+ in Y3Al5O12 [51]. Several transitions have been
included into one complex of a broad band because the crystal-field (CF)
splitting of the neighboring multiplets is frequently larger than their energy
separations.
Figure 8.5 Excitation, emission and diffuse reflection spectra of samples annealed at [II] 1700 °C for 8h under air: (a) Sr0.99Sm0.01Al12O19-δ, (b) La0.99Sm0.01MgAl11O19.
Excitation spectrum of SrAl12O12:Sm3+ (Figure 8.5a) for the 594 nm
emission consists of a series of sharp peaks in the 300–500 nm range with the
strongest peak at 404 nm and some peaks at 305 (6H5/2 → 4P5/2), 317 (6H5/2 → 2L15/2), 345 (6H5/2 → 6P7/2), 362 (6H5/2 → 5D3/2; 4F9/2; 6P5/2), 376 (6H5/2 → 6P7/2; 4K13/2), 389 (6H5/2 → 4K11/2), 416 (6H5/2 → 4M19/2), 469 (6H5/2 → 4I11/2) and 479
nm (6H5/2 → 4I9/2; 4M15/2). These peaks are ascribed to the transitions from the
ground state to the excited states of Sm3+. In addition, there is a wide band in
the region starting at 260–270 nm. This band is attributed to the electron
transition in O2− → Sm3+ couple (charge transfer [CT]). The strongest
excitation induced by the 6H5/2 → 4L13/2; 6P3/2; 4F7/2 (404 nm) transition has
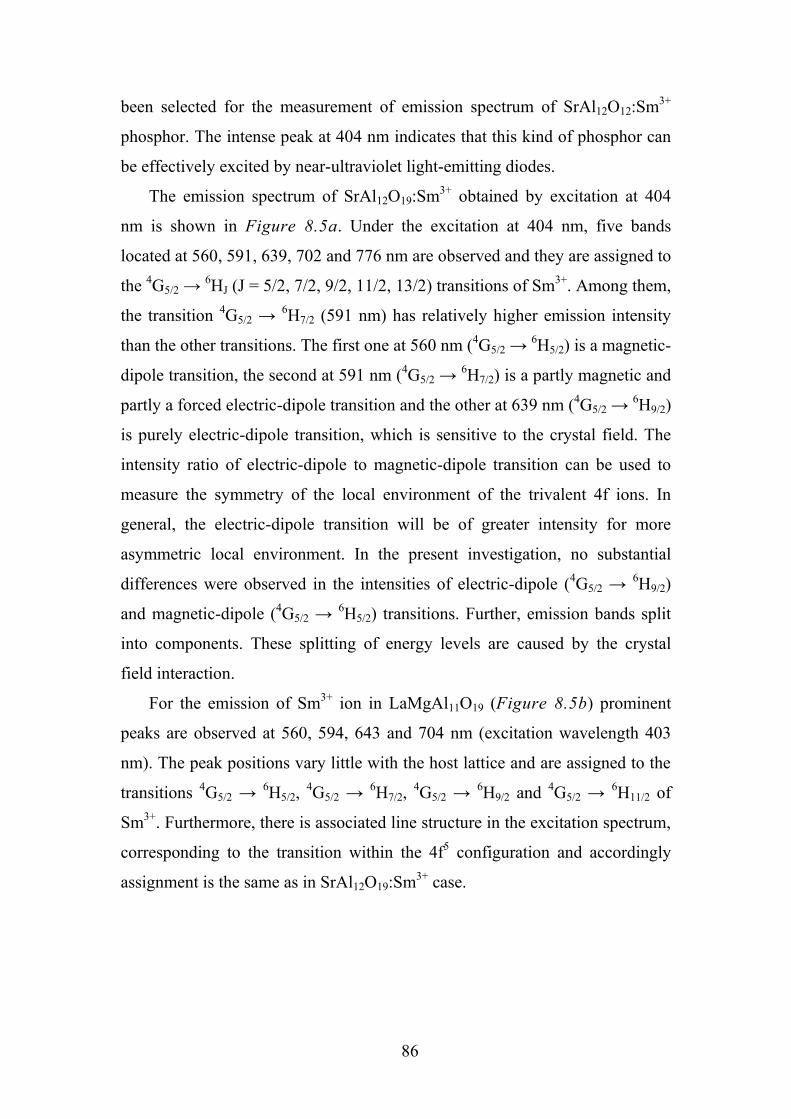
86
been selected for the measurement of emission spectrum of SrAl12O12:Sm3+
phosphor. The intense peak at 404 nm indicates that this kind of phosphor can
be effectively excited by near-ultraviolet light-emitting diodes.
The emission spectrum of SrAl12O19:Sm3+ obtained by excitation at 404
nm is shown in Figure 8.5a. Under the excitation at 404 nm, five bands
located at 560, 591, 639, 702 and 776 nm are observed and they are assigned to
the 4G5/2 → 6HJ (J = 5/2, 7/2, 9/2, 11/2, 13/2) transitions of Sm3+. Among them,
the transition 4G5/2 → 6H7/2 (591 nm) has relatively higher emission intensity
than the other transitions. The first one at 560 nm (4G5/2 → 6H5/2) is a magnetic-
dipole transition, the second at 591 nm (4G5/2 → 6H7/2) is a partly magnetic and
partly a forced electric-dipole transition and the other at 639 nm (4G5/2 → 6H9/2)
is purely electric-dipole transition, which is sensitive to the crystal field. The
intensity ratio of electric-dipole to magnetic-dipole transition can be used to
measure the symmetry of the local environment of the trivalent 4f ions. In
general, the electric-dipole transition will be of greater intensity for more
asymmetric local environment. In the present investigation, no substantial
differences were observed in the intensities of electric-dipole (4G5/2 → 6H9/2)
and magnetic-dipole (4G5/2 → 6H5/2) transitions. Further, emission bands split
into components. These splitting of energy levels are caused by the crystal
field interaction.
For the emission of Sm3+ ion in LaMgAl11O19 (Figure 8.5b) prominent
peaks are observed at 560, 594, 643 and 704 nm (excitation wavelength 403
nm). The peak positions vary little with the host lattice and are assigned to the
transitions 4G5/2 → 6H5/2, 4G5/2 → 6H7/2, 4G5/2 → 6H9/2 and 4G5/2 → 6H11/2 of
Sm3+. Furthermore, there is associated line structure in the excitation spectrum,
corresponding to the transition within the 4f5 configuration and accordingly
assignment is the same as in SrAl12O19:Sm3+ case.
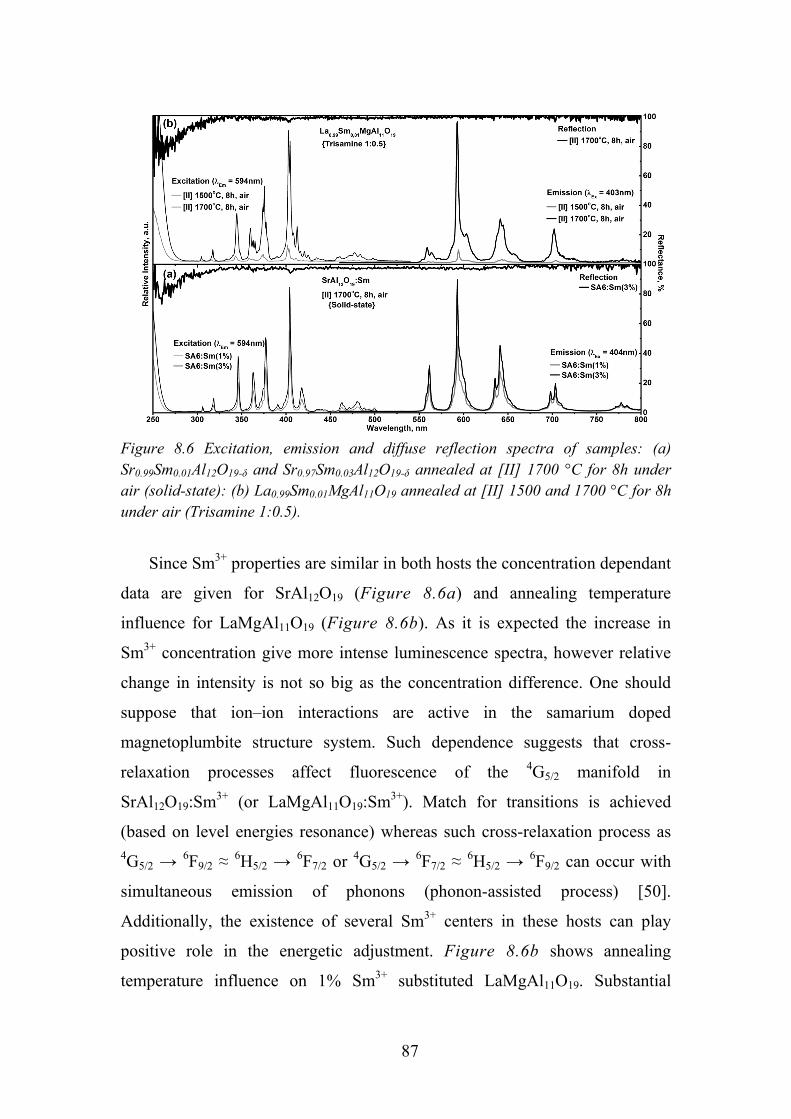
87
Figure 8.6 Excitation, emission and diffuse reflection spectra of samples: (a) Sr0.99Sm0.01Al12O19-δ and Sr0.97Sm0.03Al12O19-δ annealed at [II] 1700 °C for 8h under air (solid-state): (b) La0.99Sm0.01MgAl11O19 annealed at [II] 1500 and 1700 °C for 8h under air (Trisamine 1:0.5).
Since Sm3+ properties are similar in both hosts the concentration dependant
data are given for SrAl12O19 (Figure 8.6a) and annealing temperature
influence for LaMgAl11O19 (Figure 8.6b). As it is expected the increase in
Sm3+ concentration give more intense luminescence spectra, however relative
change in intensity is not so big as the concentration difference. One should
suppose that ion–ion interactions are active in the samarium doped
magnetoplumbite structure system. Such dependence suggests that cross-
relaxation processes affect fluorescence of the 4G5/2 manifold in
SrAl12O19:Sm3+ (or LaMgAl11O19:Sm3+). Match for transitions is achieved
(based on level energies resonance) whereas such cross-relaxation process as 4G5/2 → 6F9/2 ≈ 6H5/2 → 6F7/2 or 4G5/2 → 6F7/2 ≈ 6H5/2 → 6F9/2 can occur with
simultaneous emission of phonons (phonon-assisted process) [50].
Additionally, the existence of several Sm3+ centers in these hosts can play
positive role in the energetic adjustment. Figure 8.6b shows annealing
temperature influence on 1% Sm3+ substituted LaMgAl11O19. Substantial
88
increase in intensity is detected due to higher crystallinity of samples annealed
at higher temperature.
Figure 8.7 Excitation and emission spectra of samples annealed at [II] 1700 °C for 8h under H2(20 %)/N2(80 %): (a) Sr0.995Sm0.005Al12O19-δ, (b) La0.995Sm0.005MgAl11O19.
In Figure 8.7 is presented data for samples annealed under highly
reducing atmosphere (20% H2/N2) at 1700 °C. It is interesting to note that no
traces of Sm2+ are detected. Despite the suitable twelve-coordinated divalent
site in SrAl12O19 samarium still remains in trivalent state. For proper
explanation of this effect additional experiments should be performed, like
sample irradiation with high-energy rays in order to determine host influence
on Sm3+ stability.
In Table 8.1 is depicted time dependant emission data for Sm3+ doped
SrAl12O19 and LaMgAl11O19. The decay curves of all samples were found to be
single exponential. The decay data is measured for 4G5/2 → 6F7/2 transition at
room temperature. All decay values fit into 2.1 – 3.0 ms range, which is
characteristic to trivalent samarium. Decrease in decay value is detected for
samples with higher samarium concentration indicating above mentioned
cross-relaxation process, while reasons for decrease in higher crystallinity
samples are not so obvious. This might be due to facilitated defect formation at
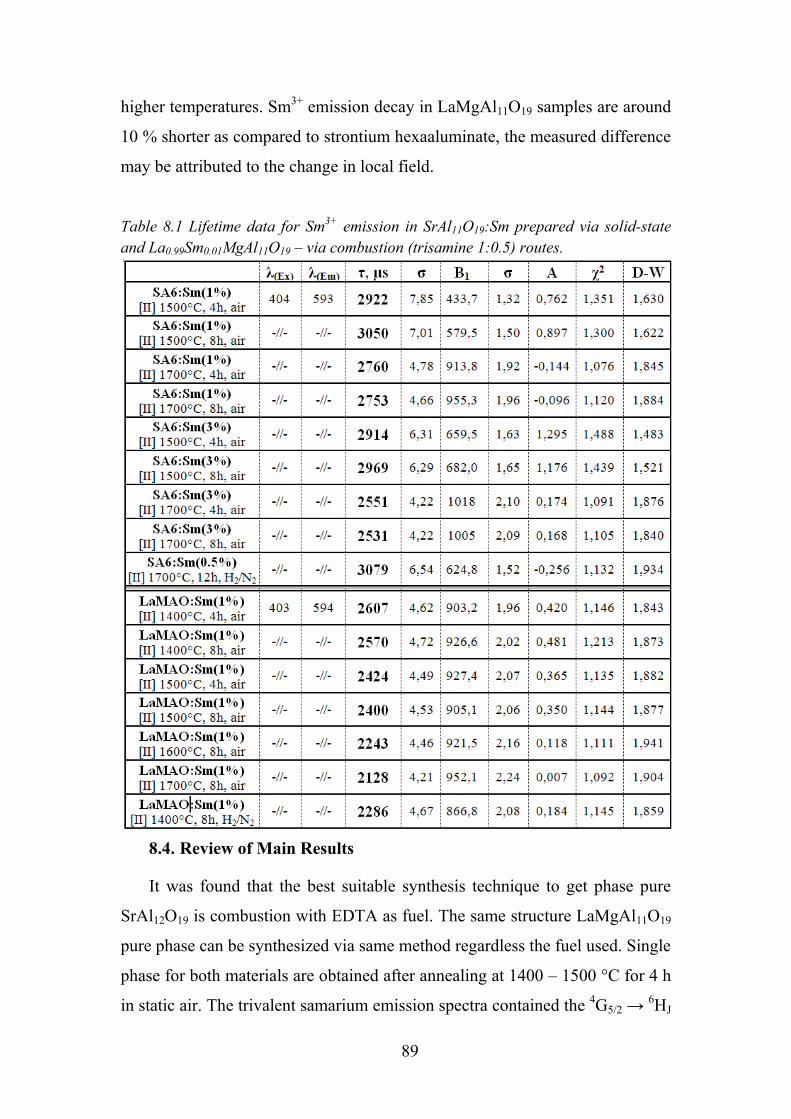
89
higher temperatures. Sm3+ emission decay in LaMgAl11O19 samples are around
10 % shorter as compared to strontium hexaaluminate, the measured difference
may be attributed to the change in local field.
Table 8.1 Lifetime data for Sm3+ emission in SrAl11O19:Sm prepared via solid-state and La0.99Sm0.01MgAl11O19 – via combustion (trisamine 1:0.5) routes.
8.4. Review of Main Results
It was found that the best suitable synthesis technique to get phase pure
SrAl12O19 is combustion with EDTA as fuel. The same structure LaMgAl11O19
pure phase can be synthesized via same method regardless the fuel used. Single
phase for both materials are obtained after annealing at 1400 – 1500 °C for 4 h
in static air. The trivalent samarium emission spectra contained the 4G5/2 → 6HJ
90
(J = 5/2, 7/2, 9/2, 11/2 and 13/2) transitions, which were detected in the 550 –
780 nm range. No obvious conclusion about Sm3+ occupied site symmetry
could be made due to insufficient clarity of the shape and intensity of observed
transitions. Excitation spectra in the range of 250 – 500 nm resulted in sharp
4f5-4f5 transitions, which were labeled using reference data for Sm3+ transitions
in Y3Al5O12. Annealing under highly reducing conditions at high temperature
revealed that examined magnetoplumbite hosts are not suitable for samarium
reduction to divalent state. The measured emission decay values fall into the
range of 2.1 – 2.7 ms for LaMgAl11O19:Sm3+ and 2.5 – 3.0 ms for
SrAl12O19:Sm3+.
91
Chapter 9. Photoluminescence Properties of Sm2+/3+ in Sr4Al14O25
9.1. Experimental Details
For samarium-doped Sr4Al14O25 samples two different approaches were
selected: conventional solid-state reaction and sol–gel combustion method. For
solid-state synthesis starting materials were Sm2O3, SrCO3 and nano-scale
Al2O3. The H3BO3, NH4Cl and AlF3 were selected as fluxes. The
stoichiometric amounts of raw materials were thoroughly ground in an agate
mortar (acetone was used as medium) and then preheated in a furnace at 1000
°C for 4 h in air. For combustion synthesis the gels were prepared using
Sm(NO3)3·6H2O, Sr(NO3)2 and Al(NO3)3·9H2O. Tris(hydroxymethyl)-
aminomethane (tris-amine) or ethylenediaminetetraacetic acid (EDTA) were
used as complexing agent and fuel. Metal salts were dissolved in distilled
water and heated to 65 – 75 °C; additionally HNO3 was added to prevent
hydrolysis of metals. Then, under continuous stirring, tris(hydroxymethyl)-
aminomethane (or EDTA) was added with the molar ratio of 1:0.5 (to all metal
ions) and solutions were stirred for an additional 1h at the same temperature.
Subsequently, after concentrating the mixtures by slow evaporation, sols
turned into transparent gels. Then the temperature was raised to 250 °C and the
self-maintaining gel combustion process started and was accompanied with
evolution of huge amount of gases. The resulting products were dried in the
oven for several hours at 120 °C and ground to fine powders, which were
preheated for 4 h at 1000 °C in air to remove the residual carbon after the
combustion process. In both cases obtained white powders were further
sintered once or twice ([II] or [III] steps) for 8 h at 1300 °C (or 1400 °C) under
CO or H2(10%)/N2(90%) atmosphere.
Excitation (excitation slit 0.5 nm and emission slit 5.0 nm) and emission
(excitation slit 5.0 nm and emission slit 0.5 nm) spectra were recorded in the
ranges of 250 – 640 and 460 – 900 nm, respectively.
92
9.2. Influence of Flux on Sr4Al14O25 Phase Formation
Figure 9.1 and Figure 9.2 present the XRD patterns of strontium
aluminates phase distribution after various synthesis steps. Since attempts to
obtain single-phase Sr4Al14O25 failed, it was chosen to use additives, besides
addition of flux significantly reduces the formation temperature and time
[122]. The influence of different flux on the formation of S4A7 phase, the
boric acid (H3BO3, m.p. 577 °C), ammonium chloride (NH4Cl, m.p. 340 °C)
and aluminum fluoride (AlF3, m.p. 1291 °C) were used. The XRD patterns of
Sr3.88Sm0.12Al14O25 (S4A7:Sm) samples, synthesized via solid-state method, are
shown in Figure 9.1. The patterns (a) and (b) are for the sample prepared with
2.5 wt% of H3BO3 flux. After the first heating at 1000 °C for 4 h in air (Figure
9.1a) the blend of three different strontium aluminates appears. The major
phase is monoclinic SrAl4O7 (ICDD#04-007-5368) and two minor phases,
monoclinic SrAl2O4 (ICDD#04-010-5403) and orthorhombic Sr4Al14O25
(ICDD#01-089-8206) are indentified. After second annealing at 1300 °C for 4h
in H2/N2 (Figure 9.1b) or CO (XRD not included) atmosphere single phase
Sr4Al14O25 was obtained. Therefore, synthesis of Sr4Al14O25 involves complex
reaction processes in which SrAl4O7 and SrAl2O4 are formed as intermediate
phases. However, samples prepared with NH4Cl flux show no traces of S4A7
phase formation even after twice repeated annealing at 1300 °C for 8 h
(Figure 9.1c). NH4Cl addition to the raw materials, after prolonged annealing,
results in composition of three strontium aluminates: SrAl2O4, orthorhombic
SrAl12O19 (ICDD#04-009-5514) and traces of SrAl4O7. The aluminum fluoride
was also used as a flux, where 2 wt% of initial Al2O3 powder were replaced by
AlF3. As indicated in Figure 9.1d, it influences S4A7 phase formation, but
probably the fluoride concentration is too low for the acceleration of initial
reaction. Even twice repeated annealing at 1300 °C for 8 h gives only minor
amount of S4A7 in the mixture of strontium aluminates.
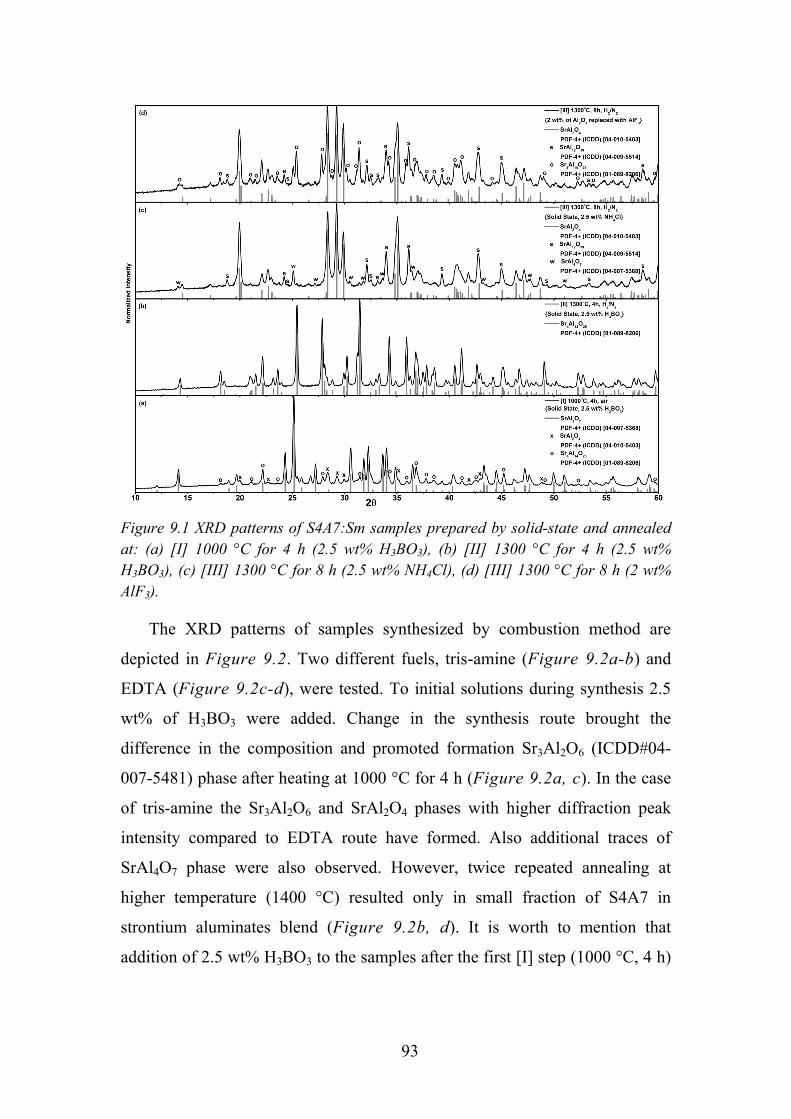
93
Figure 9.1 XRD patterns of S4A7:Sm samples prepared by solid-state and annealed at: (a) [I] 1000 °C for 4 h (2.5 wt% H3BO3), (b) [II] 1300 °C for 4 h (2.5 wt% H3BO3), (c) [III] 1300 °C for 8 h (2.5 wt% NH4Cl), (d) [III] 1300 °C for 8 h (2 wt% AlF3).
The XRD patterns of samples synthesized by combustion method are
depicted in Figure 9.2. Two different fuels, tris-amine (Figure 9.2a-b) and
EDTA (Figure 9.2c-d), were tested. To initial solutions during synthesis 2.5
wt% of H3BO3 were added. Change in the synthesis route brought the
difference in the composition and promoted formation Sr3Al2O6 (ICDD#04-
007-5481) phase after heating at 1000 °C for 4 h (Figure 9.2a, c). In the case
of tris-amine the Sr3Al2O6 and SrAl2O4 phases with higher diffraction peak
intensity compared to EDTA route have formed. Also additional traces of
SrAl4O7 phase were also observed. However, twice repeated annealing at
higher temperature (1400 °C) resulted only in small fraction of S4A7 in
strontium aluminates blend (Figure 9.2b, d). It is worth to mention that
addition of 2.5 wt% H3BO3 to the samples after the first [I] step (1000 °C, 4 h)
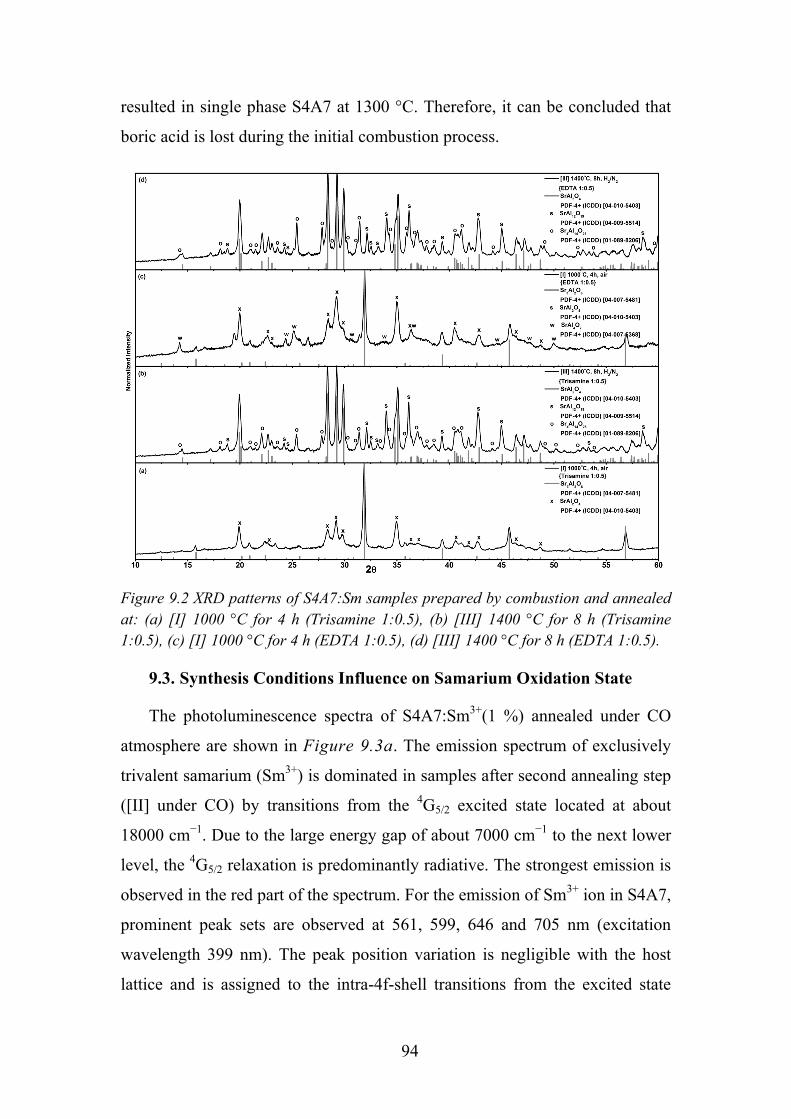
94
resulted in single phase S4A7 at 1300 °C. Therefore, it can be concluded that
boric acid is lost during the initial combustion process.
Figure 9.2 XRD patterns of S4A7:Sm samples prepared by combustion and annealed at: (a) [I] 1000 °C for 4 h (Trisamine 1:0.5), (b) [III] 1400 °C for 8 h (Trisamine 1:0.5), (c) [I] 1000 °C for 4 h (EDTA 1:0.5), (d) [III] 1400 °C for 8 h (EDTA 1:0.5).
9.3. Synthesis Conditions Influence on Samarium Oxidation State
The photoluminescence spectra of S4A7:Sm3+(1 %) annealed under CO
atmosphere are shown in Figure 9.3a. The emission spectrum of exclusively
trivalent samarium (Sm3+) is dominated in samples after second annealing step
([II] under CO) by transitions from the 4G5/2 excited state located at about
18000 cm−1. Due to the large energy gap of about 7000 cm−1 to the next lower
level, the 4G5/2 relaxation is predominantly radiative. The strongest emission is
observed in the red part of the spectrum. For the emission of Sm3+ ion in S4A7,
prominent peak sets are observed at 561, 599, 646 and 705 nm (excitation
wavelength 399 nm). The peak position variation is negligible with the host
lattice and is assigned to the intra-4f-shell transitions from the excited state
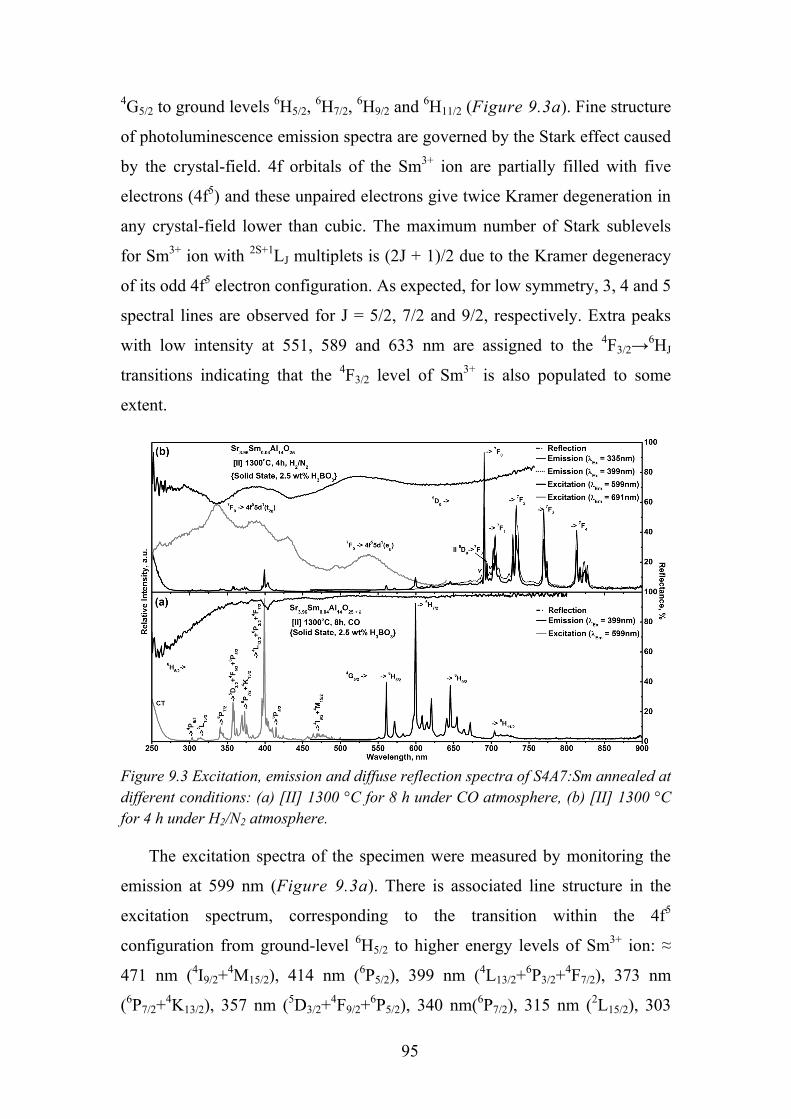
95
4G5/2 to ground levels 6H5/2, 6H7/2, 6H9/2 and 6H11/2 (Figure 9.3a). Fine structure
of photoluminescence emission spectra are governed by the Stark effect caused
by the crystal-field. 4f orbitals of the Sm3+ ion are partially filled with five
electrons (4f5) and these unpaired electrons give twice Kramer degeneration in
any crystal-field lower than cubic. The maximum number of Stark sublevels
for Sm3+ ion with 2S+1LJ multiplets is (2J + 1)/2 due to the Kramer degeneracy
of its odd 4f5 electron configuration. As expected, for low symmetry, 3, 4 and 5
spectral lines are observed for J = 5/2, 7/2 and 9/2, respectively. Extra peaks
with low intensity at 551, 589 and 633 nm are assigned to the 4F3/2→6HJ
transitions indicating that the 4F3/2 level of Sm3+ is also populated to some
extent.
Figure 9.3 Excitation, emission and diffuse reflection spectra of S4A7:Sm annealed at different conditions: (a) [II] 1300 °C for 8 h under CO atmosphere, (b) [II] 1300 °C for 4 h under H2/N2 atmosphere.
The excitation spectra of the specimen were measured by monitoring the
emission at 599 nm (Figure 9.3a). There is associated line structure in the
excitation spectrum, corresponding to the transition within the 4f5
configuration from ground-level 6H5/2 to higher energy levels of Sm3+ ion: ≈
471 nm (4I9/2+4M15/2), 414 nm (6P5/2), 399 nm (4L13/2+6P3/2+4F7/2), 373 nm
(6P7/2+4K13/2), 357 nm (5D3/2+4F9/2+6P5/2), 340 nm(6P7/2), 315 nm (2L15/2), 303
96
nm (4P5/2) [51]. Part of the ligand-to-metal charge-transfer (CT) absorption
band due to the Sm3+-O2- interaction appears at 250 nm. The broad absorption
band (250 – 350 nm) in the reflection spectrum does not result in luminescence
and is assigned to defects (Urbach-tailing). However, after the annealing under
stronger reducing conditions (H2/N2) Sm2+ emission is dominant (Figure
9.3b). In S4A7:Sm2+(1 %) the lowest 4f55d1 state occurs about 18000 cm-1
above the ground 7F0 level of 4f6 and strong 4f-4f luminescence from the 5D0 to 7F0-4 levels is observed upon excitation of the parity-allowed 4f6 → 4f55d1
interconfigurational transitions. The most intensive peak at 691 nm (14472 cm-
1) is assigned to the 5D0 → 7F0 transition representing weaker host influence on
Sm2+ as in comparison to more ionic systems: fluorides or fluorohalides [60].
The position of this level depends on the iconicity of the system and
additionally on the size and coordination of the dopant site. The transition, at
slightly lower energy 695 nm (14409 cm-1), could be assigned to (II) 5D0 → 7F0
of the Sm2+ ions occupying different Sr2+ site. Substantially lower intensity of
this line indicates non-equal Sr2+ site occupation regardless even distribution of
Sr1 and Sr2 cavities [123]. The very weak lines at the both sides of the 5D0 → 7F0 transition are phonon satellite lines, denoted as v in (Figure 9.3b). The
phonon lines are originated from the transition in which 5D0 and 7F0 states have
different lattice vibration levels. The groups of transitions at around 705, 733,
770 and 813 nm are assigned to 5D0 → 7F1, 5D0 → 7F2, 5D0 → 7F3 and 5D0 → 7F4, respectively. The relative intensity between 5D0 → 7F2 and 5D0 → 7F1 is a
measure of rare earth ion site symmetry. A lower symmetry of the crystal field
around Sm2+ will result in a lower emission intensity of 5D0 → 7F1 transition
[124], what is clearly visible in Figure 9.3b. Theoretically, the line number of 5D0 → 7FJ (J = 0, 1, 2, 3, 4) transitions of Sm2+ in site without central
symmetry should be 1, 3, 5, 7, 9 [125]. Mismatch of experimentally obtained
emission spectra could be explained with insufficient equipment resolution.
The excitation spectrum with several bands corresponding to the 4f–5d
transitions, is shown in Figure 9.3b. The lowest peak of the excitation band
corresponding to the absorption from 7F0 ground state to the lowest level of the
97
4f55d1 states is situated at around 530 nm (18868 cm-1). Figure 9.3b gives the
excitation spectra in the range from 250 to 640 nm by monitoring the 691 nm
emission. The spectrum consists of two broad bands peaking around at 530 and
335 nm (29850 cm-1). These bands arise from the 4f6–4f55d1 transitions of
Sm2+ ions. Broad band shape is due to the strong electron-phonon interaction.
As the f–d transitions are susceptible to field effects, the higher energy 5d state
of Sm2+ is split in to an orbital doublet eg and a triplet t2g state [116]. The band
at 530 nm could be assigned as 7F0 → 4f55d1(eg) transitions to doublet state,
due to narrower shape compared to higher energy band at 335 nm, e.g. 7F0 →
4f55d1(t2g) to triplet state. Parity allowed f–d transition overspread spin-
forbidden f–f lines; consequently, no distinctive peaks are visible in excitation
spectrum. As it can be seen in Figure 9.3b traces of trivalent samarium still
remain in S4A7 after annealing at 1300 °C for 4 h under H2/N2 atmosphere.
9.4. Temperature Dependent Luminescence
Figure 9.4 depicts the emission thermal quenching data of samarium-
doped S4A7 sample prepared via combustion method with tris-amine as a fuel.
To obtain single phase material after the first firing step 2.5 wt% of boric acid
was added. Second [II] annealing step at 1300 °C for 8 h under H2/N2 reveal
partial Sm3+ reduction to Sm2+, even twice longer firing time was insufficient
for reduction process. The Sm2+ emission is completely quenched in measured
sample at 300 K, while, as expected [43], no substantial temperature influence
is detected for Sm3+ emission. For more obvious representation of quenching
process in Figure 9.4b emission integrals against temperature are plotted for
mixed valence samarium; for Sm3+ integrated in range 500 – 680 nm and 680 –
900 nm for Sm2+. In Figure 9.4c fitted data are given where rough estimation
of TQ1/2 for Sm3+ is more than twice higher if compared to Sm2+, 666 K and
269 K, respectively. This confirms the theoretical viewpoint that pure f–f
transitions are less susceptible for thermal effects than transitions where d-
states are involved.
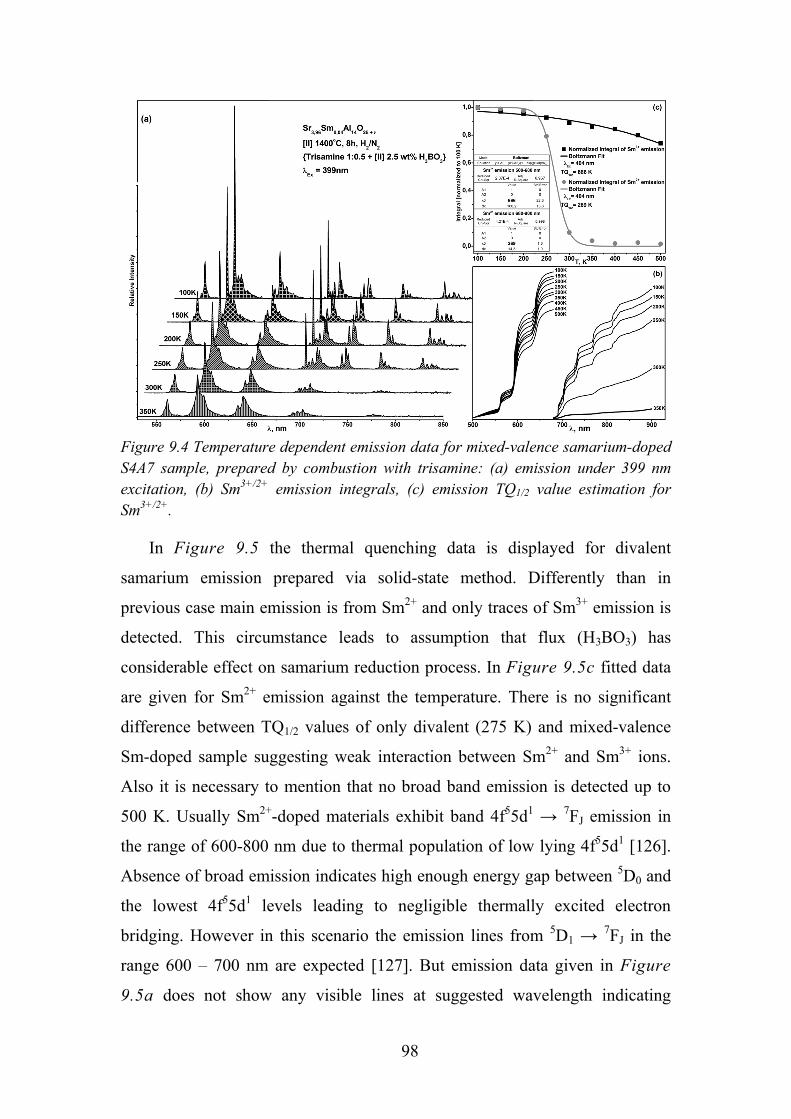
98
Figure 9.4 Temperature dependent emission data for mixed-valence samarium-doped S4A7 sample, prepared by combustion with trisamine: (a) emission under 399 nm excitation, (b) Sm3+/2+ emission integrals, (c) emission TQ1/2 value estimation for Sm3+/2+.
In Figure 9.5 the thermal quenching data is displayed for divalent
samarium emission prepared via solid-state method. Differently than in
previous case main emission is from Sm2+ and only traces of Sm3+ emission is
detected. This circumstance leads to assumption that flux (H3BO3) has
considerable effect on samarium reduction process. In Figure 9.5c fitted data
are given for Sm2+ emission against the temperature. There is no significant
difference between TQ1/2 values of only divalent (275 K) and mixed-valence
Sm-doped sample suggesting weak interaction between Sm2+ and Sm3+ ions.
Also it is necessary to mention that no broad band emission is detected up to
500 K. Usually Sm2+-doped materials exhibit band 4f55d1 → 7FJ emission in
the range of 600-800 nm due to thermal population of low lying 4f55d1 [126].
Absence of broad emission indicates high enough energy gap between 5D0 and
the lowest 4f55d1 levels leading to negligible thermally excited electron
bridging. However in this scenario the emission lines from 5D1 → 7FJ in the
range 600 – 700 nm are expected [127]. But emission data given in Figure
9.5a does not show any visible lines at suggested wavelength indicating
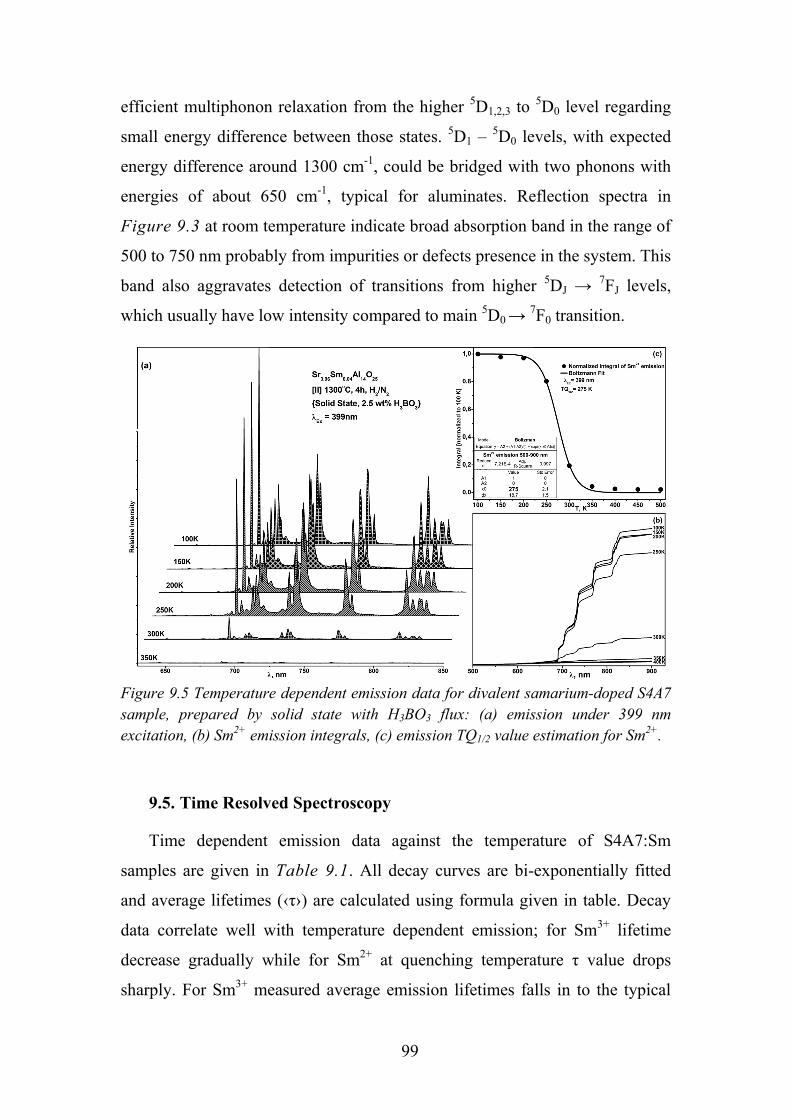
99
efficient multiphonon relaxation from the higher 5D1,2,3 to 5D0 level regarding
small energy difference between those states. 5D1 – 5D0 levels, with expected
energy difference around 1300 cm-1, could be bridged with two phonons with
energies of about 650 cm-1, typical for aluminates. Reflection spectra in
Figure 9.3 at room temperature indicate broad absorption band in the range of
500 to 750 nm probably from impurities or defects presence in the system. This
band also aggravates detection of transitions from higher 5DJ → 7FJ levels,
which usually have low intensity compared to main 5D0 → 7F0 transition.
Figure 9.5 Temperature dependent emission data for divalent samarium-doped S4A7 sample, prepared by solid state with H3BO3 flux: (a) emission under 399 nm excitation, (b) Sm2+ emission integrals, (c) emission TQ1/2 value estimation for Sm2+.
9.5. Time Resolved Spectroscopy
Time dependent emission data against the temperature of S4A7:Sm
samples are given in Table 9.1. All decay curves are bi-exponentially fitted
and average lifetimes (‹τ›) are calculated using formula given in table. Decay
data correlate well with temperature dependent emission; for Sm3+ lifetime
decrease gradually while for Sm2+ at quenching temperature τ value drops
sharply. For Sm3+ measured average emission lifetimes falls in to the typical
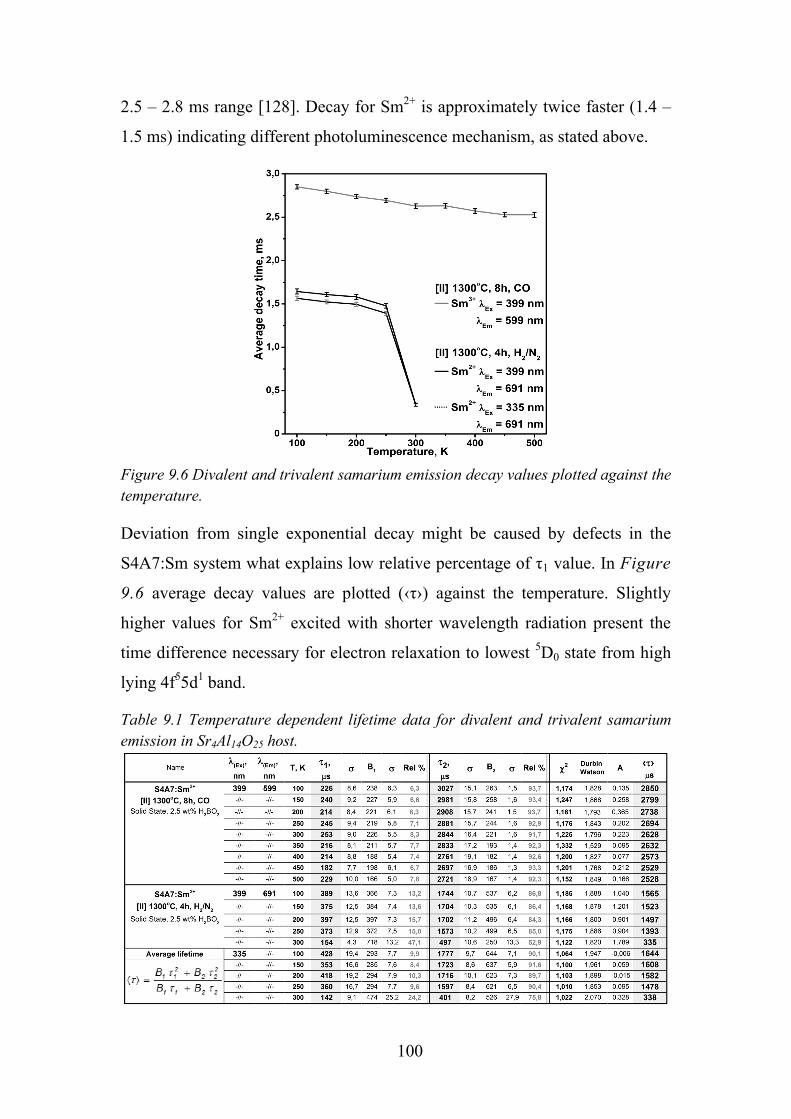
100
2.5 – 2.8 ms range [128]. Decay for Sm2+ is approximately twice faster (1.4 –
1.5 ms) indicating different photoluminescence mechanism, as stated above.
Figure 9.6 Divalent and trivalent samarium emission decay values plotted against the temperature.
Deviation from single exponential decay might be caused by defects in the
S4A7:Sm system what explains low relative percentage of τ1 value. In Figure
9.6 average decay values are plotted (‹τ›) against the temperature. Slightly
higher values for Sm2+ excited with shorter wavelength radiation present the
time difference necessary for electron relaxation to lowest 5D0 state from high
lying 4f55d1 band.
Table 9.1 Temperature dependent lifetime data for divalent and trivalent samarium emission in Sr4Al14O25 host.
101
9.6. Review of Main Results
It was determined that the synthesis route has a crucial influence on the
formation of Sr4Al14O25 phase. The solid-state method with addition of H3BO3
flux leads to monophasic S4A7 compound at 1300 °C for 4 h. However,
formation of phase pure Sr4Al14O25 is aggravated during combustion process
most likely due to fluxing additive loss. Divalent samarium-doped single phase
Sr4Al14O25 was synthesized via solid-state method, while combustion synthesis
resulted only in partial reduction of doped lanthanide. The samarium emission
spectra presented sharp and well resolved peaks; for Sm3+ 4G5/2 → 6HJ (J = 5/2,
7/2, 9/2 and 11/2) transitions were detected in the 550 – 725 nm range, for
Sm2+ 5D0 → 7F0-4 transitions were assigned in the 690 – 840 nm range. The
spectral feature of Sm2+ emission spectrum indicated the low symmetry site
occupation in S4A7. Excitation spectra in the range of 250 – 640 nm resulted
in sharp 4f5-4f5 transitions for Sm3+ and broad 7F0 → 4f55d1 absorption bands
for Sm2+. Difference of estimated emission thermal quenching (TQ1/2) values
was defined for both samarium oxidation states. Sm3+ loses half of its
integrated emission intensity at around 650 K while for Sm2+ temperature
influence is more pronounced (TQ1/2 ≈ 270 K). Additionally temperature
dependent emission lifetimes were determined: ≈ 2.5 – 2.8 ms for Sm3+ and
≈1.45 – 1.65 ms for Sm2+. However, some of observed phenomena still require
more detailed studies. The crystal-field splitting of Sm2+ emission rise some
discrepancies, because there are fewer transitions detected as theory predicts.
Besides, it is not clear broad emission band absence at higher temperature,
which is typical for Sm2+ due to lower 4f55d1 state thermal population.
102
Chapter 10. Conclusions
1. Samarium substituted Sr1-xSmxB4O7 samples were prepared by solid-state
synthesis route at 900 °C. The samarium reduction to divalent state was
achieved under air at high temperature. The phase purity was confirmed by
XRD measurements. To avoid the residual phases annealing should be
repeated at least three times.
2. Minor Sm3+ emission were detected, despite the variation in annealing time
and dopant concentration. Additionally, no influence of SmB3O6 side phase
on Sm3+ emission intensity was observed.
3. The main single 5D0 → 7F0 emission transition of Sm2+ was detected at
685.5 nm (14588 cm-1) indicating single samarium crystallographic site
occupation. Measured crystal field splitting of higher levels resulted in
approximation of C2v or lower symmetry site for Sm2+. Estimated Stokes
shift for Sm2+ d-f emission is ≈ 1600 cm-1 in SrB4O7. The vibronic
transitions with energy difference about 98 cm-1 were found even at 100 K
for the zero phonon line (5D0 → 7F0) of Sm2+.
4. The temperature dependency of emission decay time of Sm2+ in SrB4O7 was
evaluated. All the measured decay curves are fitted with single exponent.
The observed saturation of decay time values for higher than 2.5 %
samarium substitution indicate absence of Sm2+ concentration quenching,
due to negligible interaction between optically active ions.
5. Orange-red emitting La0.99Sm0.01MgB5O10 and Gd0.99Sm0.01MgB5O10
photoluminescent materials were synthesized by a solid state reaction
method at 1020 °C for 8 h. The phase purity was confirmed by XRD
measurements.
6. Exclusively Sm3+ emission was detected containing four emission bands
corresponding to the 4G5/2→6H5/2, 6H7/2, 6H9/2 and 6H11/2 transitions peaking
at 560, 600, 650 and 710 nm, respectively, upon excitation at 6H5/2→4L13/2+6P3/2+4F7/2 (402 nm) have been observed. Additionally, 4F3/2→6Hj transitions were also detected indicating that the 4F3/2 level of
Sm3+ is also populated to some extent.

103
7. By direct excitation of Gd3+ at 274 nm intense Sm3+ emission was measured
indicating an efficient energy transfer from Gd3+ to Sm3+. The luminescent
kinetics data are fitted by single exponential curve giving experimental
lifetime values in the range of 2.2 – 2.4 ms. The decay lifetimes for Sm3+
emission upon direct excitation of Gd3+ is around 0.1 ms longer, confirming
the energy transfer phenomena.
8. It was determined that the synthesis conditions have a crucial influence on
the formation of SrAl12O19 single phase. The combustion with EDTA
resulted in single magnetoplumbite phase at 1500 °C, which was confirmed
by the experimental data.
9. Even strong reducing conditions (H2(20 %)/N2(80 %) and high temperature
(1700 °C) produce trivalent samarium substituted magnetoplumbite
structure (SrAl12O19:Sm3+ and LaMgAl11O19:Sm3+) powder samples.
10. It was determined that H3BO3 flux greatly promotes the formation of
Sr4Al14O25 phase. The S4A7 compound is obtained at 1300 °C for 4 h with
2.5 wt% of flux in precursor mixture. The combustion synthesis route
exhibited the main drawback due to loss of the flux during burning of initial
gels. Divalent samarium-doped single phase Sr4Al14O25 was synthesized via
solid-state method under strong reducing atmosphere (H2/N2).
11. The samarium emission spectra presented sharp and well resolved peaks; for
Sm3+ 4G5/2 → 6HJ (J = 5/2, 7/2, 9/2 and 11/2) transitions were detected in the
550 – 725 nm range, for Sm2+ 5D0 → 7F0-4 transitions were assigned in the
690 – 840 nm range. The spectral feature of Sm2+ emission spectrum
indicated the low symmetry site occupation in S4A7.
12. Difference of estimated emission thermal quenching (TQ1/2) values was
defined for both samarium oxidation states. Sm3+ loses half of its integrated
emission intensity at around 650 K while for Sm2+ temperature influence is
more pronounced (TQ1/2 ≈ 270 K). Additionally temperature dependent
emission lifetimes were determined: ≈ 2.5 – 2.8 ms for Sm3+ and ≈1.45 –
1.65 ms for Sm2+.
104
Chapter 11. List of Publications and Conference Participation
11.1. List of Publications
1. S. Sakirzanovas, A. Katelnikovas, H. Bettentrup, A. Kareiva, T. Jüstel,
“Synthesis and Photoluminescence Properties of Sm3+ doped
LaMgB5O10 and GdMgB5O10”, Journal of Luminescence 131 (2011)
1525–1529.
2. S. Sakirzanovas, A. Katelnikovas, D. Dutczak, A. Kareiva, T. Jüstel,
“Synthesis and Sm2+/Sm3+ doping effects on photoluminescence
properties of Sr4Al14O25”, Journal of Luminescence 131 (2011) 2255–
2262.
3. S. Sakirzanovas, A. Katelnikovas, D. Dutczak, A. Kareiva, T. Jüstel,
“Concentration Influence on Temperature-dependent Luminescence
Properties of Samarium Substituted Strontium Tetraborate”, Journal of
Luminescence (2011) accepted.
11.2. Patent
S. Sakirzanovas, T. Jüstel, H. Winkler, "SM-ACTIVATED
ALUMINATE AND BORATE PHOSPHORS (Sm-aktivierte Aluminat-
und Borat-Leuchtstoffe)", WO/2011/047757 A1 (DE 10 2009 050 542
A1), 2011
11.3. Published Contributions to Academic Conferences
1. S. Sakirzanovas, T. Jüstel. „Influence of Synthesis Conditions on
Samarium Doped Sr4Al14O25 Luminescence“, ECSSC XII-XIIth
European Conference on Solid State Chemistry, Muenster, Germany,
September 20-23, 2009. p. 270
2. S. Sakirzanovas, H. Winkler, A. Kareiva, T. Jüstel. „Luminescence
Properties of Divalent Samarium-Doped Strontium Tetraborate“, 7th
International Conference on f Elements, Cologne, Germany, August 23-
27, 2009. p. P05-32-200
105
11.4. Publications Not Included in the Thesis
1. A. Katelnikovas, H. Bettentrup, D. Uhlich, S. Sakirzanovas, T. Juestel,
A. Kareiva, Synthesis and optical properties of Ce3+-doped
Y3Mg2AlSi2O12 phosphors, J. Lumin. 129 (11), 1356-1361, 2009.
2. S. Sakirzanovas, LD. Sun, CH. Yan, A. Kareiva, Sol-gel synthesis of
nanosized Y3Sc2.5Ga2.5O12 garnet, Mendeleev Commun. 18 (5), 251-
252, 2008.
3. A. Katelnikovas, T. Jüstel, D. Uhlich, J.-E. Jörgensen S. Sakirzanovas,
A. Kareiva, Characterization of Cerium-Doped Yttrium Aluminium
Garnet Nanopowders Synthesized via Sol-Gel Process, Chem. Eng.
Comm. 195 (7), 758-769, 2008.
4. S. Sakirzanovas, A. Kareiva. Sol-gel Synthesis of Nanosized
Lanthanide-doped Mixed-metal Garnets, Lith. J. Phys. 47 (1), 75-80,
2007.
5. E. Garskaite, S. Sakirzanovas, A. Kareiva, J. Glaser, H.J. Meyer.
Synthesis and structure of europium aluminium garnet (EAG). Z.
Anorg. Allg. Chem. 633 (7), 990-993, 2007.
6. A. Beganskienė S. Sakirzanovas, I. Kazadojev, A. Melnikaitis, V.
Sirutkaitis, A. Kareiva, Sol-Gel Derived Antireflective Coatings with
Controlled Thickness and Reflective Index, Materials Science-Poland,
25 (3), 817-824, 2007.
7. Beganskienė S. Šakirzanovas, A. Melnikaitis, V. Sirutkaitis, A. Kareiva.
Sol-Gel Derived Optical Coating with Controlled Parameters.
Medžiagotyra, SSN 1392-1320, 2006.
8. R. Skaudžius, A. Beganskiene, S. Sakirzanovas, D. Jasaitis, A. Kareiva,
„Mixed metal garnets Y3AlxM5-xO12 (M-Ga, In): phase formation
peculiarities“. XLIV Meeting of the Serban Chemical Society, Belgrade,
6-7 February 2006.

106
Conferences Attended
1. S. Sakirzanovas. Sol-gel coatings with controlled parameters. 2nd
Workshop on Laser-induced Damage, Hannover, Germany, July 4-5,
2007.
2. S. Sakirzanovas, T. Jüstel, A. Kareiva. Aqueous sol-gel synthesis and
investigation of doped mixed-metal garnets. Advanced materials and
technologies: 9th international summer school-conference, Palanga,
Lithuania, 27-31 August 2007 p. 79
3. A. Beganskiene, S. Sakirzanovas, A. Melninkaitis, I. Kazadojev, V.
Sirutkaitis, A. Kareiva. Sol-gel derived antireflective coating with
controlled thickness and refractive index. 4th international conference on
sol-gel materials, Kliczkow Castle, Poland, June 18-22, 2006 p. 51
4. S. Sakirzanovas, Ch. Yan, A. Kareiva. Sol-gel preparation and
characterization of lanthanide-doped mixed-metal garnets. Advanced
materials as studied by spectroscopic and diffraction techniques:
specialized colloque AMPERE and Alexander von Humboldt workshop,
Vilnius, Lithuania, September 16-21, 2006 p. P15
5. S. Sakirzanovas, L. Vilciauskas, A. Beganskiene, A. Kareiva.
Chemically modified sol-gel derived nanosilica coatings for
biotechnological applications. Fifth international conference on
inorganic materials, Ljubljana, Slovenia, September 23-26, 2006 p. 173
6. R. Skaudzius, S Sakirzanovas, A. Katelnikovas, A. Beganskienė, A.
Kareiva. Spectroscpic evaluation and characterization of different
mixed-metal garnets. European seminar on infrared spectroscopy, Lyon,
France, April 4-6, 2006 p. 57
7. R. Skaudzius, A. Beganskiene, S. Sakirzanovas, D.J. Jasaitis, A.
Kareiva. Mixed metal garnets Y3AlxM5-xO12 (M-Ga, In): phase
formation peculiarities. 44th meeting of the Serbian chemical society,
Belgrade, February 6-7, 2006 ISBN 867132026X, p. 53
8. R. Skaudzius, S. Sakirzanovas. Sol-gel derived garnets: synthesis of
YAG (Y3Al5O12) and YGG (Y3Ga5O12) at different temperatures.

107
Inorganic Materials: synthesis, properties and application: Vilnius
University Conference for Young Scientists, Vilnius, December 16-17,
2006 p. 12
108
Chapter 12. REFERENCES
[1] B.J. Beaudry, J.K.A. Gschneidner, Chapter 2 Preparation and basic properties of the rare earth metals, in: Karl A. Gschneidner, Jr., E. LeRoy (Eds.) Handbook on the Physics and Chemistry of Rare Earths, Elsevier, 1978, pp. 173-232.
[2] B. Moine, G. Bizarri, Mat. Sci. Eng. B-Solid, 105 (2003) 2-7. [3] C.M. MacRae, N.C. Wilson, Microsc. Microanal., 14 (2008) 184-204. [4] G. Blasse, B.C. Grabmaier, Luminescent materials, Springer-Verlag, Berlin ; New
York, 1994. [5] S. Nakamura, T. Mukai, M. Senoh, Appl Phys Lett, 64 (1994) 1687-1689. [6] R.M. Macfarlane, R.M. Shelby, Opt. Lett., 9 (1984) 533-535. [7] A. Winnacker, R.M. Shelby, R.M. Macfarlane, Opt. Lett., 10 (1985) 350-352. [8] R. Jaaniso, H. Bill, Europhys Lett, 16 (1991) 569-574. [9] W. Chen, M.Z. Su, J. Phys. Chem. Solids, 60 (1999) 371-378. [10] T. Hayakawa, M. Nogami, IPAP Books 2, (2005) 193-198. [11] M. Nogami, K. Suzuki, Adv. Mater., 14 (2002) 923-926. [12] H.W. Song, M. Nogami, J. Non-Cryst. Solids, 297 (2002) 113-119. [13] J.H. Zhang, S.H. Huang, J.Q. Yu, J. Lumin., 56 (1993) 51-55. [14] J.H. Zhang, H.W. Song, Y. Zhao, M.Z. Tian, K. Dou, S.H. Huang, J.Q. Yu, J.
Lumin., 64 (1995) 207-211. [15] G.H. Dieke, H.M. Crosswhite, H. Crosswhite, Spectra and energy levels of rare
earth ions in crystals, Interscience Publishers, New York,, 1968. [16] L.R. Morss, Chemical Reviews, 76 (1976) 827-841. [17] B.M. Nikolai, et al., Russian Chemical Reviews, 61 (1992) 990. [18] C. Görller-Walrand, K. Binnemans, Chapter 155 Rationalization of crystal-field
parametrization, in: Karl A. Gschneidner, Jr., E. LeRoy (Eds.) Handbook on the Physics and Chemistry of Rare Earths, Elsevier, 1996, pp. 121-283.
[19] P. Dorenbos, J. Alloys Compd., 341 (2002) 156-159. [20] A. Lupei, V. Lupei, C. Gheoghe, L. Gheorghe, G. Aka, D. Vivien, Opt. Mater.,
30 (2008) 1677-1681. [21] S. Cotton, Lanthanide and actinide chemistry, Wiley, Chichester, England ;
Hoboken, NJ, 2006. [22] B. Valeur, J.-C. Brochon, New trends in fluorescence spectroscopy :
applications to chemical and life science, Springer, New York, 2001. [23] B.M. van der Ende, L. Aarts, A. Meijerink, Phys Chem Chem Phys, 11 (2009)
11081-11095. [24] J.R. Lakowicz, Principles of fluorescence spectroscopy, 2nd ed., Kluwer
Academic/Plenum, New York, 1999. [25] G.H. Dieke, H.M. Crosswhite, Applied Optics, 2 (1963) 675-686. [26] N. Sabbatini, M. Guardigli, J.M. Lehn, Coordin Chem Rev, 123 (1993) 201-228. [27] W.T. Carnall, Chapter 24 The absorption and fluorescence spectra of rare earth
ions in solution, in: Karl A. Gschneidner, Jr., E. LeRoy (Eds.) Handbook on the Physics and Chemistry of Rare Earths, Elsevier, 1979, pp. 171-208.
[28] B.M. Walsh, Nato Sci Ser Ii Math, 231 (2006) 403-433.
109
[29] Phosphor Research Society., Phosphor handbook, CRC Press, Boca Raton, FL, 1999.
[30] J.C.G. Bünzli, G.R. Choppin, Lanthanide probes in life, chemical, and earth sciences : theory and practice, Elsevier, Amsterdam ; New York, 1989.
[31] J. Holsa, M. Lastusaari, M. Marysko, M. Tukia, J Solid State Chem, 178 (2005) 435-440.
[32] R.M. Macfarlane, R.M. Shelby, A. Winnacker, Phys. Rev. B, 33 (1986) 4207. [33] R. Macfarlane, M., R. Shelby, M., A. Winnacker, Journal de Physique, 46
(1985) C7-537-C537-542. [34] B.R. Judd, Phys. Rev., 127 (1962) 750. [35] G.S. Ofelt, J. Chem. Phys., 37 (1962) 511-520. [36] G.S. Ofelt, J. Chem. Phys., 38 (1963) 2171-2180. [37] R. Jaaniso, H. Bill, Phys. Rev. B, 44 (1991) 2389-2392. [38] P. Mikhail, J. Hulliger, K. Ramseyer, Solid State Commun., 112 (1999) 483-488. [39] B. Henderson, G.F. Imbusch, Optical spectroscopy of inorganic solids,
Clarendon Press ; Oxford University Press, Oxford Oxfordshire New York, 1989.
[40] C. Görller-Walrand, K. Binnemans, Chapter 167 Spectral intensities of f-f transitions, in: Karl A. Gschneidner, Jr., E. LeRoy (Eds.) Handbook on the Physics and Chemistry of Rare Earths, Elsevier, 1998, pp. 101-264.
[41] C.K. Jørgensen, B.R. Judd, Molecular Physics, 8 (1964) 281-290. [42] M. Gaft, R. Reisfeld, G. Panczer, Modern luminescence spectroscopy of
minerals and materials, Springer, Berlin ; New York, 2005. [43] M.D. Chambers, D.R. Clarke, Annu. Rev. Mater. Res., 39 (2009) 325-359. [44] J.M.F. van Dijk, M.F.H. Schuurmans, The Journal of Chemical Physics, 78
(1983) 5317-5323. [45] A. Gilbert, J.E. Baggott, Essentials of molecular photochemistry, Blackwell
Scientific Publications, Oxford ; Boston, 1991. [46] G. Stein, E. Wurzberg, The Journal of Chemical Physics, 62 (1975) 208-213. [47] C.K. Jayasankar, V. Venkatramu, P. Babu, T. Troster, W. Sievers, G. Wortmann,
W.B. Holzapfel, J. Appl. Phys., 97 (2005) -. [48] T. Suhasini, J.S. Kumar, T. Sasikala, K.W. Jang, H.S. Lee, M. Jayasimhadri, J.H.
Jeong, S.S. Yi, L.R. Moorthy, Opt. Mater., 31 (2009) 1167-1172. [49] E. Cavalli, A. Belletti, R. Mahiou, P. Boutinaud, J. Lumin., 130 (2010) 733-736. [50] G. Dominiak-Dzik, J. Alloys Compd., 391 (2005) 26-32. [51] J.B. Gruber, B. Zandi, M.F. Reid, Phys. Rev. B, 60 (1999) 15643-15653. [52] J.B. Gruber, B. Zandi, M. Ferry, L.D. Merkle, J. Appl. Phys., 86 (1999) 4377-
4382. [53] B.C. Jamalaiah, J.S. Kumar, A.M. Babu, T. Suhasini, L.R. Moorthy, J. Lumin.,
129 (2009) 363-369. [54] G. Grenet, M. Kibler, A. Gros, J.C. Souillat, J.C. Gâcon, Phys. Rev. B, 22 (1980)
5052. [55] M. Karbowiak, A. Urbanowicz, M.F. Reid, Phys. Rev. B, 76 (2007) -.
110
[56] D. Nishida, E. Yamade, M. Kusaba, T. Yatsuhashi, N. Nakashima, J. Phys. Chem. A, 114 (2010) 5648-5654.
[57] J. Qiu, K. Hirao, J. Mater. Sci. Lett., 20 (2001) 691-693. [58] E. Malchukova, B. Boizot, G. Petite, D. Ghaleb, J. Non-Cryst. Solids, 353 (2007)
2397-2402. [59] Z. Liu, T. Massil, H. Riesen, Physics Procedia, 3 (2010) 1539-1545. [60] T. Penhouet, H. Hagemann, J. Alloys Compd., 451 (2008) 74-76. [61] Y.R. Shen, K.L. Bray, Phys. Rev. B, 58 (1998) 11944-11958. [62] A. Meijerink, G.J. Dirksen, J. Lumin., 63 (1995) 189-201. [63] Y.R. Shen, W.B. Holzapfel, Phys. Rev. B, 52 (1995) 12618-12626. [64] Y. Huang, W. Kai, Y. Cao, K. Jang, H.S. Lee, I. Kim, E. Cho, J. Appl. Phys.,
103 (2008) 053501-053507. [65] Y.L. Huang, W.X. Zhao, L. Shi, H.J. Seo, J. Alloys Compd., 477 (2009) 936-
940. [66] P. Mikhail, A. Sieber, T. Samtleben, B. Trusch, T. Luthi, J. Hulliger, J Solid
State Chem, 154 (2000) 535-541. [67] H.B. Liang, Q.H. Zeng, T.D. Hu, S.B. Wang, Q. Su, Solid State Sci., 5 (2003)
465-467. [68] Q.H. Zeng, Z.W. Pei, Q. Su, S.Z. Lu, J. Lumin., 82 (1999) 241-249. [69] P. Mikhail, J. Hulliger, Comments Inorg. Chem., 21 (1999) 263-283. [70] M.Y. Peng, Z.W. Pei, G.Y. Hong, Q. Su, Chem. Phys. Lett., 371 (2003) 1-6. [71] E.J. Nassar, L.A. Rocha, E.F. Molina, K.J. Ciuffi, P.S. Calefi, Mater Chem Phys,
101 (2007) 238-241. [72] W. Szuszkiewicz, B. Keller, M. Guzik, T. Aitasalo, J. Niittykoski, J. Holsa, J.
Legendziewicz, J Alloy Compd, 341 (2002) 297-306. [73] R.E. Bradbury, E.Y. Wong, Phys. Rev. B, 4 (1971) 702. [74] G.R. Choppin, Z.M. Wang, Inorg Chem, 36 (1997) 249-252. [75] S.T. Frey, W.D. Horrocks, Inorg Chim Acta, 229 (1995) 383-390. [76] M.C. Montoya, D. Megias, R. Marrero, B.M. Del Peso, M.A. Garcia, J.J. Bravo-
Cordero, A. Garcia-Grande, A. Santos, Microsc Res Techniq, 72 (2009) 1-11. [77] R. Nudelman, B.V. Bronk, S. Efrima, Appl Spectrosc, 54 (2000) 445-449. [78] A. Perloff, S. Block, Acta Crystallogr., 20 (1966) 274-279. [79] J.W.M. Verwey, G.J. Dirksen, G. Blasse, J. Phys. Chem. Solids, 53 (1992) 367-
375. [80] Z.W. Pei, Q. Su, J.Y. Zhang, J. Alloys Compd., 198 (1993) 51-53. [81] K. Machida, G. Adachi, J. Shiokawa, J. Lumin., 21 (1979) 101-110. [82] G. Heller, A survey of structural types of borates and polyborates, in: Structural
Chemistry of Boron and Silicon, Springer Berlin / Heidelberg, 1986, pp. 39-98. [83] D.A. Keszler, Current Opinion in Solid State and Materials Science, 4 (1999)
155-162. [84] J.B. Kim, K.S. Lee, I.H. Suh, J.H. Lee, J.R. Park, Y.H. Shin, Acta Crystallogr C,
52 (1996) 498-500. [85] N.L. Ross, R.J. Angel, J Solid State Chem, 90 (1991) 27-30.
111
[86] Q.S. Lin, W.D. Cheng, J.T. Chen, J.S. Huang, J Solid State Chem, 144 (1999) 30-34.
[87] Z.F. Wei, X.L. Chen, F.M. Wang, W.C. Li, M. He, Y. Zhang, J Alloy Compd, 327 (2001) L10-L13.
[88] Q.H. Zeng, Z.W. Pei, S.B. Wang, Q. Su, Spectrosc. Lett., 32 (1999) 895-912. [89] X.A. Chen, Z.H. Tang, M. Li, Solid State Sci, 10 (2008) 894-900. [90] A. Lapshin, E. Litovchik, I. Polyakova, Y. Shepelev, Russian Journal of
Inorganic Chemistry, 52 (2007) 839-843. [91] C.F. Chenot, Journal of the American Ceramic Society, 50 (1967) 117-118. [92] R. Komatsu, H. Kawano, Z. Oumaru, K. Shinoda, V. Petrov, J. Cryst. Growth,
275 (2005) e843-e847. [93] Q.H. Zeng, Z.W. Pei, S.B. Wang, Q.A. Su, S.Z. Lu, J. Mater. Sci. Technol., 15
(1999) 449-452. [94] B. Saubat, M. Vlasse, C. Fouassier, J Solid State Chem, 34 (1980) 271-277. [95] J.M. Fan, Z.B. Lin, L.Z. Zhang, G.F. Wang, Chinese Journal of Structural
Chemistry, 25 (2006) 709-713. [96] J. Hölsä, M. Leskelä, Molecular Physics: An International Journal at the
Interface Between Chemistry and Physics, 54 (1985) 657 - 667. [97] D.W. Goodwin, A.J. Lindop, Acta Crystallographica Section B, 26 (1970) 1230-
1235. [98] A.J. Lindop, D.W. Goodwin, Acta Crystallographica Section B, 28 (1972) 2625-
2626. [99] R.X. Fischer, H. Schneider, M. Schmucker, Am Mineral, 79 (1994) 983-990. [100] T.N. Nadezhina, E.A. Pobedimskaya, N.V. Belov, Kristallografiya, 25 (1980)
938-943. [101] Q. Li, J.W. Zhao, F.L. Sun, J. Rare Earths, 28 (2010) 26-29. [102] F. Massazza, Chim. Ind. (Milan), 41 (1959) 108-115. [103] E.M. Levin, C.R. Robbins, H.F. McMurdie, Phase diagrams for ceramists, in:
United States. National Bureau of Standards., American Ceramic Society., Institute for Materials Science and Engineering (U.S.). Ceramics Division., Materials Science and Engineering Laboratory (U.S.). Ceramics Division. (Eds.), American Ceramic Society, Columbus, OH, 1964, pp. v.
[104] M.Q. Wang, W. Dong, G.L. Lu, Mat. Sci. Eng. B-Solid, 57 (1998) 18-23. [105] D. Wang, M.Q. Wang, G.L. Lu, J. Mater. Sci., 34 (1999) 4959-4964. [106] T.N. Nadezhina, E.A. Pobedimskaya, N.V. Belov, Kristallografiya, 21 (1976)
826-828. [107] M. Capron, F. Fayon, D. Massiot, A. Douy, Chem. Mater., 15 (2003) 575-579. [108] A. Douy, M. Capron, J. Eur. Ceram. Soc., 23 (2003) 2075-2081. [109] A. Nag, T.R.N. Kutty, J. Alloys Compd., 354 (2003) 221-231. [110] R. Shannon, Acta Crystallographica Section A, 32 (1976) 751-767. [111] R. Collongues, D. Gourier, A. Kahnharari, A.M. Lejus, J. Thery, D. Vivien,
Annu. Rev. Mater. Sci., 20 (1990) 51-82.
112
[112] J.-G. Park, A.N. Cormack, Korean Journal of Crystallography, 11 (2000) 176-181.
[113] C.R. Ronda, Luminescence : from theory to applications, Wiley-VCH, Weinheim, 2008.
[114] Q.H. Zeng, Z.W. Pei, Q. Su, S.H. Huang, Phys. Status Solidi B, 212 (1999) 207-219.
[115] D.L. Wood, W. Kaiser, Phys. Rev., 126 (1962) 2079. [116] P. Dorenbos, J. Phys. Condens. Matter, 15 (2003) 575-594. [117] X.Y. Chen, M.P. Jensen, G.K. Liu, J. Phys. Chem. B, 109 (2005) 13991-13999. [118] C.A. Kodaira, R. Stefani, A.S. Maia, M.C.F.C. Felinto, H.F. Brito, J. Lumin.,
127 (2007) 616-622. [119] A.K. Singh, S.K. Singh, R. Prakash, S.B. Rai, Chem. Phys. Lett., 485 (2010)
309-314. [120] E.J. Bosze, G.A. Hirata, L.E. Shea-Rohwer, J. McKittrick, J. Lumin., 104
(2003) 47-54. [121] R. Praveena, V. Venkatramu, P. Babu, C.K. Jayasankar, Physica B-Condensed
Matter, 403 (2008) 3527-3534. [122] Z.C. Wu, M.L. Gong, J.X. Shi, Q. Su, J. Alloys Compd., 458 (2008) 134-137. [123] T. Nakamura, K. Kaiya, N. Takahashi, T. Matsuzawa, C.C. Rowlands, V.
Beltran-Lopez, G.M. Smith, P.C. Riedi, J. Mater. Chem., 10 (2000) 2566-2569. [124] J.Y. Wang, Y.D. Li, Y.L. Huang, L. Shi, H.J. Seo, Mater. Chem. Phys., 120
(2010) 598-602. [125] K. Fujita, K. Tanaka, K. Hirao, N. Soga, J. Appl. Phys., 81 (1997) 924-930. [126] C. Wickleder, J. Lumin., 94 (2001) 127-132. [127] A. Edgar, C.R. Varoy, C. Koughia, D. Tonchev, G. Belev, G. Okada, S.O.
Kasap, H. von Seggern, M. Ryan, Opt. Mater., 31 (2009) 1459-1466. [128] A. Herrmann, D. Ehrt, J. Non-Cryst. Solids, 354 (2008) 916-926.