Embed Size (px)
Citation preview
VIOLENT INCIDENTS MONITORING SYSTEMS: A METHODS TOOLKIT
VIMSAdrian Morel July 2016


Adrian Morel July 2016
VIOLENT INCIDENTS MONITORING SYSTEMS: A METHODS TOOLKIT
VIMS
This work is the results of collaboration between The Asia Foundation (www.asiafoundation.org), The World Bank Group (www.worldbankgroup.org)
and the International Development Research Centre (www.idrc.ca)
Rights and PermissionsThis work is available under the Creative Commons Attribution 3.0 IGO license (CC BY 3.0 IGO)
https://openknowledge.worldbank.org/terms-of-use
All queries on rights and licenses should be addressed to the Publishing and Knowledge Division, The World Bank,
1818 H Street NW, Washington, DC 20433, USA; fax: 202-522-2625; e-mail: [email protected].
This paper is a product of staff from The Asia Foundation. It was financed by the World Bank through the Korea Trust Fund for Economic and Peacebuilding Transitions (KTF), along with co-financing from the International Development Research Center (IDRC) of the Government of Canada and
UK aid from the UK Government.
The findings, interpretations and conclusions expressed do not necessarily reflect the views of The Asia Foundation, IDRC, the governments of the United Kingdom and Canada, the Korea Trust Fund, the World Bank and its affiliated organizations, or those of the Executive Directors of the World Bank
or the governments they represent.
The Asia Foundation and the World Bank do not guarantee the accuracy of the data included in this work. The boundaries, colors, denominations, and other information shown on any map in this work
do not imply any judgement from The Asia Foundation or the funders on the legal status of any territory or the endorsement or acceptance of such boundaries.
TABLE OF CONTENTS
SUMMARY 2
INTRODUCTION 4
1.1 Why monitor violence? 4
1.2 Definition and comparative value of a VIMS 7
DSW, BCMS and NVMS profiles 9
1st MODULE DEFINING GOALS AND SCOPE 12
II. Defining objectives 12
2.1 Balancing specificity and flexibility in defining objectives 12
2.2 Managing expectations 14
III. Defining the scope of violence 15
3.1 Which types of violence should be included? 15
3.2 Monitoring violence or monitoring conflict? 16
3.3 Should all violence be monitored? 17
Proposed scope of violence for a VIMS 18
2nd MODULE GENERATING DATA 20
IV. Selecting Sources 20
4.1 Source specifications 20
4.2 Common VIMS sources 21
4.2.1 News reports 22
4.2.2 Security forces 23
4.2.3 Crowdsourcing, crowdseeding, and social media monitoring 24
4.2.4 NGO/CSO reports 25
4.2.5 Other sources 26
Selecting sources : summary of key principles and guidance 26
V. Coding Incidents 28
5.1 Definition of coding and benefits of standardization 28
5.2 Defining a violent event 29
Proposed definition of a violent event 30
5.3 Variables: What to record about each incident, and how? 31
5.3.1 Time and location 32
5.3.2 Form(s) of violence 33
5.3.3 Causes of violence 36
5.3.4 Actors 40
5.3.5 Impacts 43
Final remarks on coding incidents 44
Box 1.1 Measuring progress against Sustainable Development Goal 16.1 4
Box 1.2 VIMS specifications 7
Box 2.1 DSID, BCMS and NVMS: initial objectives, their evolution over time, and design implications 13
Box 3.1 Monitoring non-violent
Box 4.1 Crowdseeding vs. crowdsourcing 25
Box 5.1 Standardization – Lessons from Deep South Watch 29
Box 5.2 The WHO’s definition of Interpersonal and Collective Violence 35
Box 5.3 Deductive versus inductive approaches to establishing Cause categories 36
Box 5.4 What to record about Actors? Lessons from the NVMS, DSW, and BCMS 41
Box 5.5 Capturing the gender dimension of violence 43
Box 6.1 Digitization of source materials – Example from the NVMS 47
Box 6.2 Automated versus manual selection and encoding 47
Box 6.3 NVMS quality control procedures 48
Box 6.4 BCMS’ Multi-Stakeholder Validation Groups (MSVGs) 49
Box 6.5 Deep South Watch: the difficulty of managing a violence monitoring system in the absence of predictable funding
52
Box 7.1 NVMS’ arguments for public access 55
Box 7.2 Should violence data analysis be performed in-house or outsourced? 57
Box 7.3 Features of a violence monitoring web portal 57
Box 7.4 Geographic Information Systems (GIS) and spatial analysis of violence 58
Box 8.1 The Deep South Watch ‘recipe’ for influencing policy 61
BOXES
REFERENCE LIST 62
ENDNOTES 66
VI. Operational aspects: running a violence monitoring system 46
6.1 The production cycle 46
6.1.1 Quality control 48
6.1.2 Timing 49
6.2 Budget, staffing, and implementation arrangements 50
6.3 Sustainability 51
3rd MODULE: OPTIMIZING POLICY IMPACTS 54
VII. Analysis and dissemination 54
7.1 Should the data be publicly accessible? 54
7.2 Analytical products 55
7.3 Dissemination 56
VIII. Optimizing policy impacts 59
8.1 Strategies to influence policy 59
8.1.1 Institutional arrangements 59
8.1.2 Engagement strategies 60
8.2 Seizing opportunities 60
TABLE OF CONTENTS
ANNEXESAnnex IV.1 Assessing sourcesAnnex IV.2 Why use local newspapers?Annex IV.3 NVMS, DSW and BCMS data sourcesAnnex V.1 NVMS Coding KeyAnnex V.2 DSID Coding GuideAnnex V.3 BCMS Manual
All annexes referenced in this document can be accessed online at the following address: http://www.asiafoundation.org/tag/violence-monitoring. This Toolkit is a living document. In addition to the above-listed annexes, more content will be added to the webpage, including documentation on the DSW, NVMS and BCMS projects and other violence monitoring projects supported by The Asia Foundation, and related analytical pieces, blogs and videos. Complementary guidance will also be made available on aspects that could not be covered in this piece for lack of space and time. This may include complementary guidance on costing, planning for sustainability, and managing the incremental expansion of small-scale violence monitoring systems into larger monitoring efforts.
Figure 1.1 Deaths by violence type, Aceh 1998-2014 (NVMS data) 5
Figure 1.2 The role of violence data will vary depending on a given conflict’s stage of transition 6
Figure 5.1 Selecting from predetermined standardized choices in the data entry interface (BCMS example) 28
Figure 6.1 Database production cycle 46
Figure 7.1 Violence and geographic features in Thailand’s Deep South 58
Table 4.1: The advantages and disadvantages of common source types 21
Table 5.1: Operational definitions of a violent event – DSW, BCMS and NVMS 30
Table 5.2: Indicative list of Form categories 33
Table 5.3: Proposed weapons categories 35
Table 5.4: Proposed main Cause categories, definitions, and indicative subcategories 38
Table 5.5: Proposed generic categories for group affiliation 42
Table 6.1: Data volume and its implications 50
Table 6.2: Advantages and limitations of potential local host institutions for violence monitoring projects 51
Table 7.1: Distinctive features of data updates, policy-oriented reports and research papers 56
TABLES
FIGURES
ACKNOWLEDGEMENTSThis toolkit was written by Adrian Morel. It was produced as part of the Cross Regional Violence Monitoring Knowledge Exchange (CRVME) project, which aims to foster knowledge exchange among violence monitoring systems in Asia, and disseminate lessons learned in the region and beyond. The CRVME is implemented by The Asia Foundation and funded by the World Bank via the Korea Trust Fund for Economic and Peacebuilding Transitions, with co-support from Canada’s International Development Research Centre (IDRC). The UK Department for InternationalDevelopment (DFID) provided additional support through the ProgrammePartnership Arrangement.
This document is based in large part on practical experience gained through the Philippines’ Bangsamoro Conflict Monitoring System, implemented by Interna-tional Alert, with funding from the World Bank; Thailand’s Deep South Watch, an independent project hosted by Prince of Songkla University in Pattani, and; Indo-nesia’s National Violence Monitoring System, implemented by the World Bank, on behalf of the Coordinating Ministry for Human Development and Culture until 2015. The authors are grateful to the project teams for their invaluable contributions and insights. In particular, we would like to thank Francisco Jota Lara, Nikki de la Rosa, Liezl Bugtay, Ever Abasolo, and their colleagues (International Alert, Philippines); Assad Baunto (World Bank, Philippines); Prof. Srisompob Jitpiromsri, Muhammad Ayub Pathan, Supaporn Panatnachee, Anders Engvall, and their colleagues (Deep South Watch/DSID); Rita Maria and Embun Maharani (JRI-Research Indonesia); Wahyu Handoyo (World Bank, Indonesia), and; Imron Rasyid, Ima Abdulrahim, and their team (The Habibie Center, Indonesia).
Matthew Stephens, Pamornrat Tansanguanwong, Bernhard Metz, Ellen Hamilton, Andres Villaveces, Sabine Palmreuther, Ingo Wiederhofer, Nadia Piffaretti (World Bank), and Clionadh Raleigh (Armed Conflict Location and Event Data Project) reviewed this paper. Giselle Lopez from the PeaceTech Lab of the United States Institute of Peace (USIP) provided inputs on the use of crowdsourcing and social media as data sources.
Former Deputy Minister Willem Rampangilei from Indonesia’s Coordinating Minis-try for Human Development and Culture, and Undersecretary Luisito Montalbo from the Philippines’ Office of the Presidential Adviser on the Peace Process provided useful insights from the perspective of policy-makers.
Ann Bishop provided editorial assistance, and Landry Dunand designed the publication. We would also like to thank Anton Baare and Milena Stefanova (World Bank), Florencio Ceballos and Cam Do (IDRC), as well as Patrick Barron, Bryony Lau, Pauline Tweedie, Sasiwan Chingchit and Victor Bernard (The Asia Foundation) for providing critical institutional and analytical support.
Figure 1.1 Deaths by violence type, Aceh 1998-2014 (NVMS data) 5
Figure 1.2 The role of violence data will vary depending on a given conflict’s stage of transition 6
Figure 5.1 Selecting from predetermined standardized choices in the data entry interface (BCMS example) 28
Figure 6.1 Database production cycle 46
Figure 7.1 Violence and geographic features in Thailand’s Deep South 58
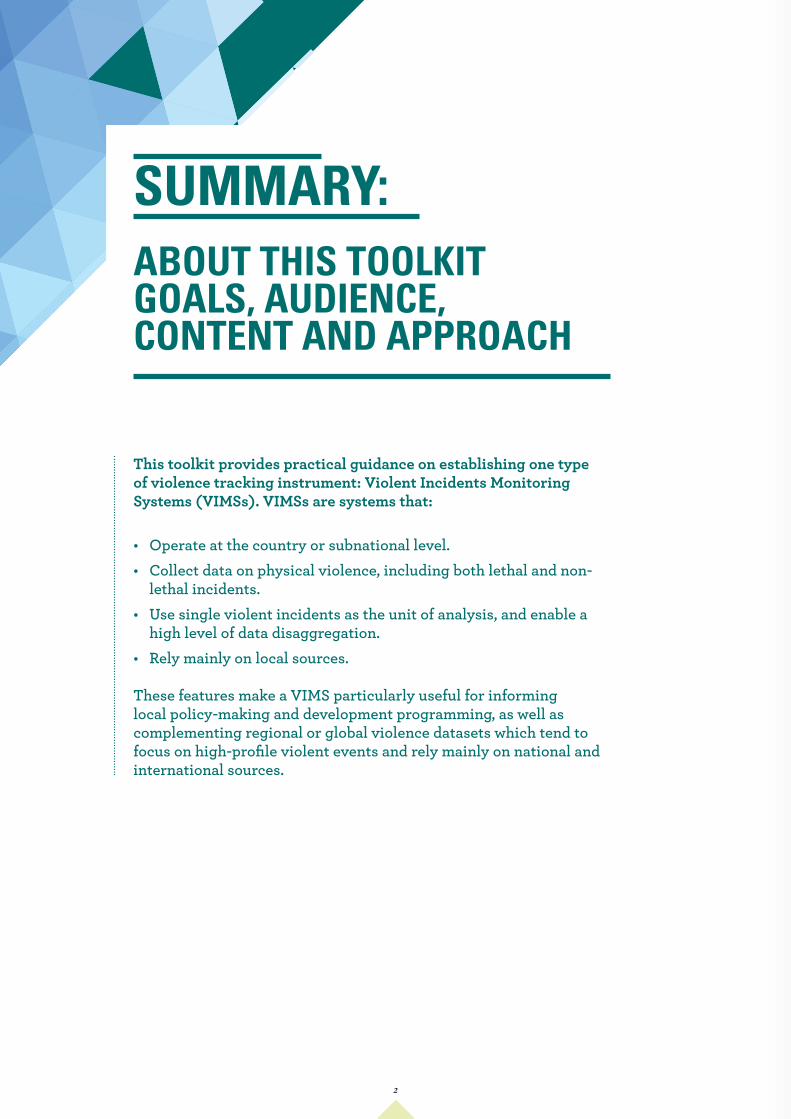
This toolkit provides practical guidance on establishing one type of violence tracking instrument: Violent Incidents Monitoring Systems (VIMSs). VIMSs are systems that:
• Operate at the country or subnational level.• Collect data on physical violence, including both lethal and non-
lethal incidents.• Use single violent incidents as the unit of analysis, and enable a
high level of data disaggregation.• Rely mainly on local sources.
These features make a VIMS particularly useful for informing local policy-making and development programming, as well as complementing regional or global violence datasets which tend to focus on high-profile violent events and rely mainly on national and international sources.
ABOUT THIS TOOLKIT GOALS, AUDIENCE, CONTENT AND APPROACH
SUMMARY:
2
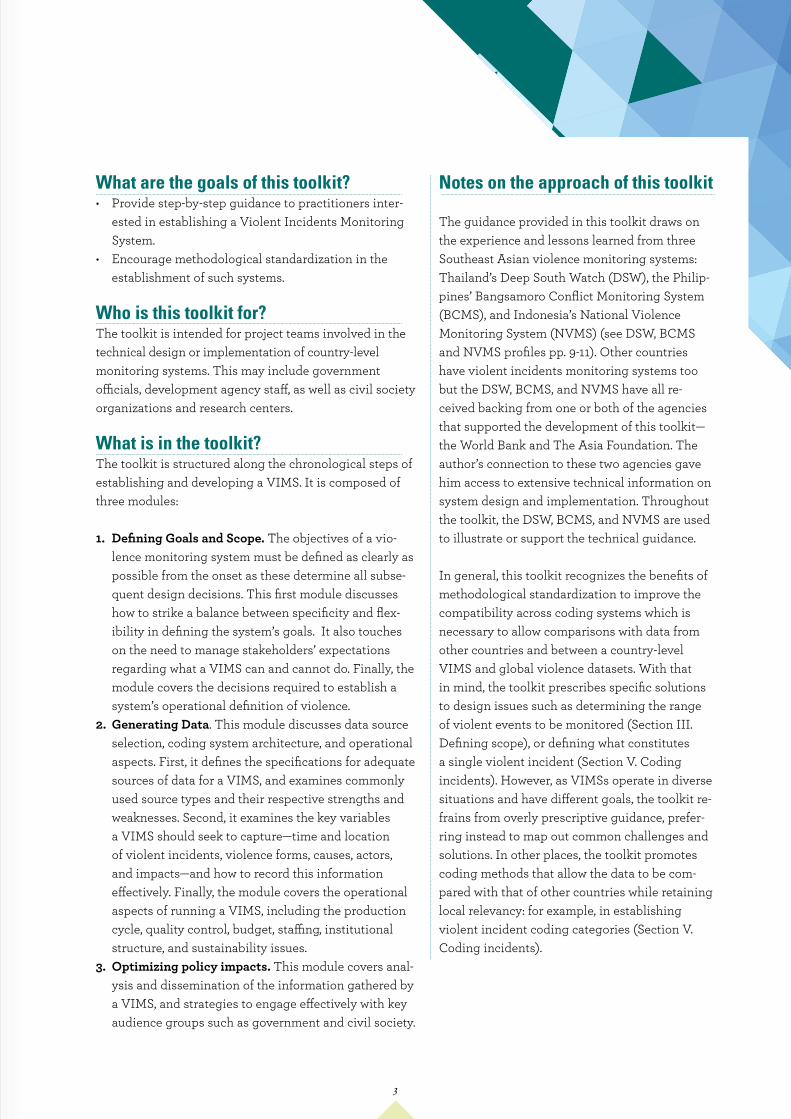
What are the goals of this toolkit? • Provide step-by-step guidance to practitioners inter-
ested in establishing a Violent Incidents Monitoring System.
• Encourage methodological standardization in the establishment of such systems.
Who is this toolkit for? The toolkit is intended for project teams involved in the technical design or implementation of country-level monitoring systems. This may include government officials, development agency staff, as well as civil society organizations and research centers.
What is in the toolkit?The toolkit is structured along the chronological steps of establishing and developing a VIMS. It is composed of three modules:
1. Defining Goals and Scope. The objectives of a vio-lence monitoring system must be defined as clearly as possible from the onset as these determine all subse-quent design decisions. This first module discusses how to strike a balance between specificity and flex-ibility in defining the system’s goals. It also touches on the need to manage stakeholders’ expectations regarding what a VIMS can and cannot do. Finally, the module covers the decisions required to establish a system’s operational definition of violence.
2. Generating Data. This module discusses data source selection, coding system architecture, and operational aspects. First, it defines the specifications for adequate sources of data for a VIMS, and examines commonly used source types and their respective strengths and weaknesses. Second, it examines the key variables a VIMS should seek to capture—time and location of violent incidents, violence forms, causes, actors, and impacts—and how to record this information effectively. Finally, the module covers the operational aspects of running a VIMS, including the production cycle, quality control, budget, staffing, institutional structure, and sustainability issues.
3. Optimizing policy impacts. This module covers anal-ysis and dissemination of the information gathered by a VIMS, and strategies to engage effectively with key audience groups such as government and civil society.
Notes on the approach of this toolkit
The guidance provided in this toolkit draws on the experience and lessons learned from three Southeast Asian violence monitoring systems: Thailand’s Deep South Watch (DSW), the Philip-pines’ Bangsamoro Conflict Monitoring System (BCMS), and Indonesia’s National Violence Monitoring System (NVMS) (see DSW, BCMS and NVMS profiles pp. 9-11). Other countries have violent incidents monitoring systems too but the DSW, BCMS, and NVMS have all re-ceived backing from one or both of the agencies that supported the development of this toolkit—the World Bank and The Asia Foundation. The author’s connection to these two agencies gave him access to extensive technical information on system design and implementation. Throughout the toolkit, the DSW, BCMS, and NVMS are used to illustrate or support the technical guidance.
In general, this toolkit recognizes the benefits of methodological standardization to improve the compatibility across coding systems which is necessary to allow comparisons with data from other countries and between a country-level VIMS and global violence datasets. With that in mind, the toolkit prescribes specific solutions to design issues such as determining the range of violent events to be monitored (Section III. Defining scope), or defining what constitutes a single violent incident (Section V. Coding incidents). However, as VIMSs operate in diverse situations and have different goals, the toolkit re-frains from overly prescriptive guidance, prefer-ring instead to map out common challenges and solutions. In other places, the toolkit promotes coding methods that allow the data to be com-pared with that of other countries while retaining local relevancy: for example, in establishing violent incident coding categories (Section V. Coding incidents).
3
Box 1.1 Measuring progress against Sustainable Development Goal 16.1
SDG 16.1 calls on states and development actors to “significantly reduce all forms of violence and related deaths rates everywhere.” Data on homicides1 and conflict deaths are generated by a broad range of national and international agencies. The World Health Orga-nization (WHO 2014) and the United Nations Office on Drugs and Crime (UNODC 2014) publish homicide rates (homicides /100,000/year) based on national statistics collated by criminal justice and public health systems. However, reliable official data on homicides are often scarce in fragile contexts. International conflict death datasets, such as the Uppsala Conflict Data Program and the Armed Conflict Location and Event Data project (ACLED 2015), do not cover all countries. Finally, combined homicide and conflict data do not pro-vide comprehensive coverage of all violent deaths. The wording of SDG 16.1—“all forms of violence”—calls for a broader set of indicators that more comprehensively capture violent deaths, as well as non-lethal violence.2
Country violence monitoring systems such as VIMSs (Section 1.2 Definition and compar-ative value of a VIMS) that do not rely entirely on official information, and collect infor-mation on both lethal and non-lethal violence, have a role to play in monitoring progress against SDG 16.1. As such, they contribute to filling information gaps and verifying, comple-menting, or balancing official statistics.
Conflict and violence devastate lives and stymie economic and social development. The new Sustain-able Development Goals include promoting “peaceful and inclusive societies,” and providing targets to “significantly reduce all forms of violence and related death rates everywhere” (SDG 16.1) Addressing conflict and fragility, and measuring progress against SDG16.1, requires instruments that accurately track violence. Violence monitoring systems are one such tool. These systems include a variety of instruments that produce quantitative data on violence: from global armed conflict datasets to violence observatories that focus on urban crime in Latin American and Carribean cities.
INTRODUCTION
1.1 Why monitor violence?
Violence monitoring instruments can be used to measure progress against global violence reduction targets and to inform country-level efforts to support conflict-to-peace transitions.
4
1 Violence data for planning. In conflict-affected areas, a rig-orous analysis of conflict drivers and pathways to stability is crucial for any actor seeking to support the transition to peace. A range of conflict analysis instruments have been developed to inform country strategies and project designs. Violence monitoring systems can also provide valuable inputs. The increasing prevalence of subnational conflicts and fragility has made investments in gathering data below the country level particularly import-ant (Parks, Colletta, and Oppenheim 2013; Straus 2012). A VIMS responds to this need by enabling a high level of data disaggregation across variables and geographical units (Section 1.2 Definition and compar-ative value of a VIMS). A VIMS can greatly improve understanding of local variations in conflict dynamics and intensity, help map out the actors and population groups most exposed to violence, and isolate the drivers of conflict.
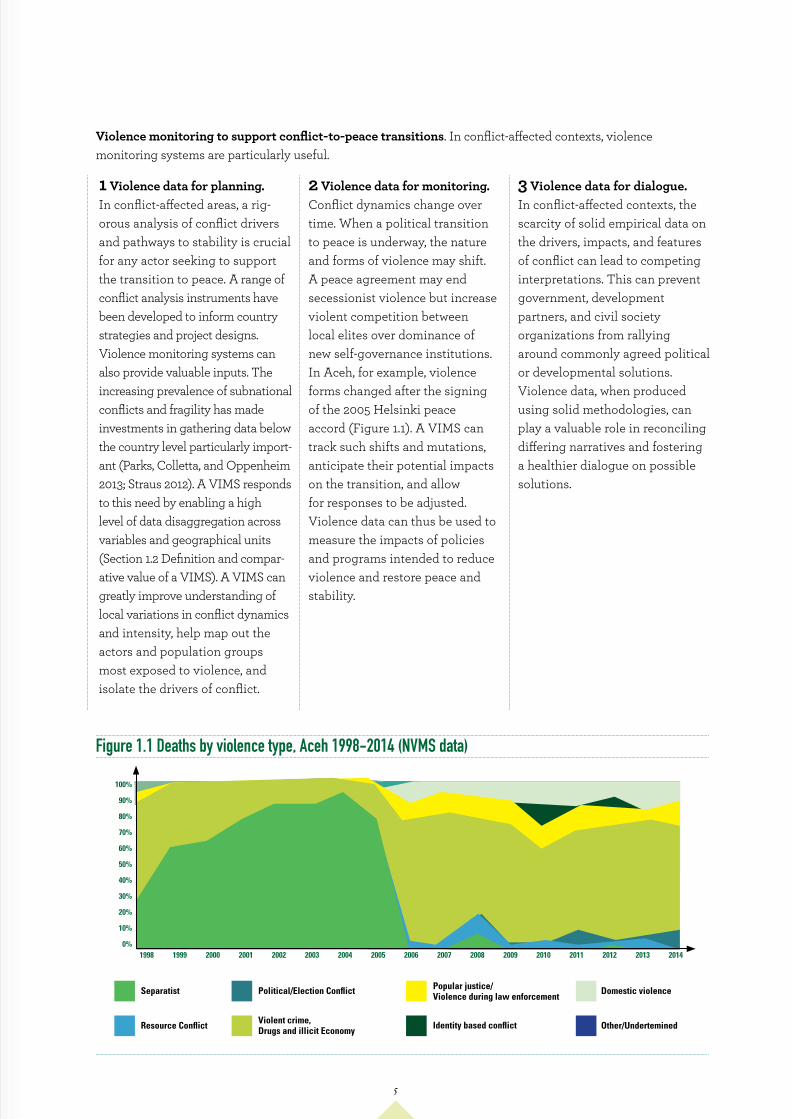
2 Violence data for monitoring. Conflict dynamics change over time. When a political transition to peace is underway, the nature and forms of violence may shift. A peace agreement may end secessionist violence but increase violent competition between local elites over dominance of new self-governance institutions. In Aceh, for example, violence forms changed after the signing of the 2005 Helsinki peace accord (Figure 1.1). A VIMS can track such shifts and mutations, anticipate their potential impacts on the transition, and allow for responses to be adjusted. Violence data can thus be used to measure the impacts of policies and programs intended to reduce violence and restore peace and stability.
3 Violence data for dialogue. In conflict-affected contexts, the scarcity of solid empirical data on the drivers, impacts, and features of conflict can lead to competing interpretations. This can prevent government, development partners, and civil society organizations from rallying around commonly agreed political or developmental solutions. Violence data, when produced using solid methodologies, can play a valuable role in reconciling differing narratives and fostering a healthier dialogue on possible solutions.
Violence monitoring to support conflict-to-peace transitions. In conflict-affected contexts, violence monitoring systems are particularly useful.
Separatist
1998 1999 2000 2001 2002 2003 2004 2005 2006 2007 2008 2009 2010 2011 2012 2013 2014
100%
90%
80%
70%
60%
50%
40%
30%
20%
10%
0%
Political/Election Conflict Popular justice/Violence during law enforcement
Domestic violence
Resource Conflict Violent crime, Drugs and illicit Economy Identity based conflict Other/Undertemined
Figure 1.1 Deaths by violence type, Aceh 1998-2014 (NVMS data)
5
Violence monitoring beyond armed conflict. The value of violence monitoring systems is not restricted to countries or regions affected by armed conflict. Violent competition over land and natural resources, communal tensions, urban crime, and gender-based violence may lead to significant fatalities and cumulative developmental impacts. Violence observatories
in South and Central America demonstrate the usefulness of violence monitoring for the prevention of urban crime or juvenile violence. In such contexts, the functions of violence monitoring systems remain the same: generating consensus on problems and solutions, informing strategy and intervention design, tracking changes in dynamics, and monitoring results.
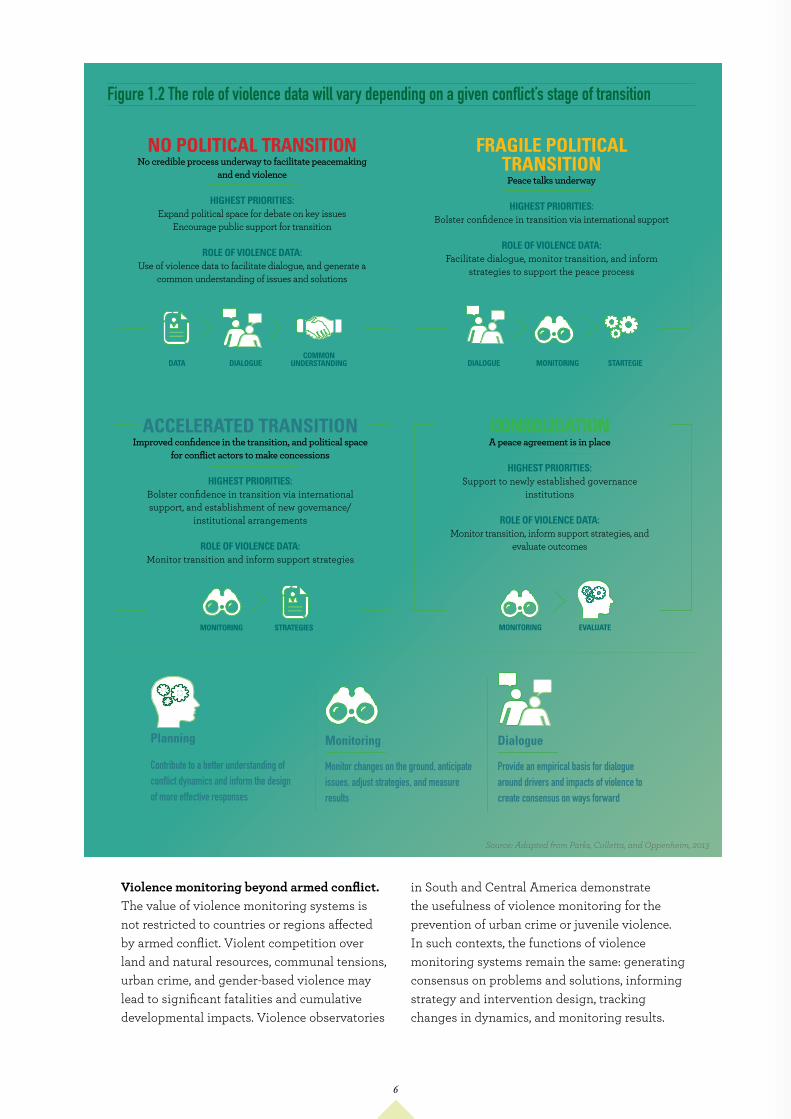
Source: Adapted from Parks, Colletta, and Oppenheim, 2013
Figure 1.2 The role of violence data will vary depending on a given conflict’s stage of transition
NO POLITICAL TRANSITIONNo credible process underway to facilitate peacemaking
and end violence
HIGHEST PRIORITIES: Expand political space for debate on key issues
Encourage public support for transition
ROLE OF VIOLENCE DATA: Use of violence data to facilitate dialogue, and generate a
common understanding of issues and solutions
DATA DIALOGUECOMMON
UNDERSTANDING
ACCELERATED TRANSITIONImproved confidence in the transition, and political space
for conflict actors to make concessions
HIGHEST PRIORITIES: Bolster confidence in transition via international support, and establishment of new governance/
institutional arrangements
ROLE OF VIOLENCE DATA: Monitor transition and inform support strategies
MONITORING STRATEGIES
CONSOLIDATION A peace agreement is in place
HIGHEST PRIORITIES: Support to newly established governance
institutions
ROLE OF VIOLENCE DATA: Monitor transition, inform support strategies, and
evaluate outcomes
MONITORING EVALUATE
FRAGILE POLITICAL TRANSITION
Peace talks underway
HIGHEST PRIORITIES: Bolster confidence in transition via international support
ROLE OF VIOLENCE DATA: Facilitate dialogue, monitor transition, and inform
strategies to support the peace process
DIALOGUE MONITORING STARTEGIE
Contribute to a better understanding of conflict dynamics and inform the design of more effective responses
Planning Monitoring
Monitor changes on the ground, anticipate issues, adjust strategies, and measure results
Dialogue
Provide an empirical basis for dialogue around drivers and impacts of violence to create consensus on ways forward
6
1.2 Definition and comparative value of a VIMS
What is a VIMS? A VIMS operates at the country level and monitors violence nationwide or in a subnational region affected by conflict. A VIMS has a number of defining features (Box 1.2).
• Single violent incidents are the unit of analysis. A VIMS provides information separately about each reported violent “event”: a particular violent incident in a par-ticular locality (for a more detailed definition of a violent event, see Section V. Coding incidents). A VIMS differs from datasets that aggregate data at a higher level (armed conflict deaths per year or national homicide statistics).
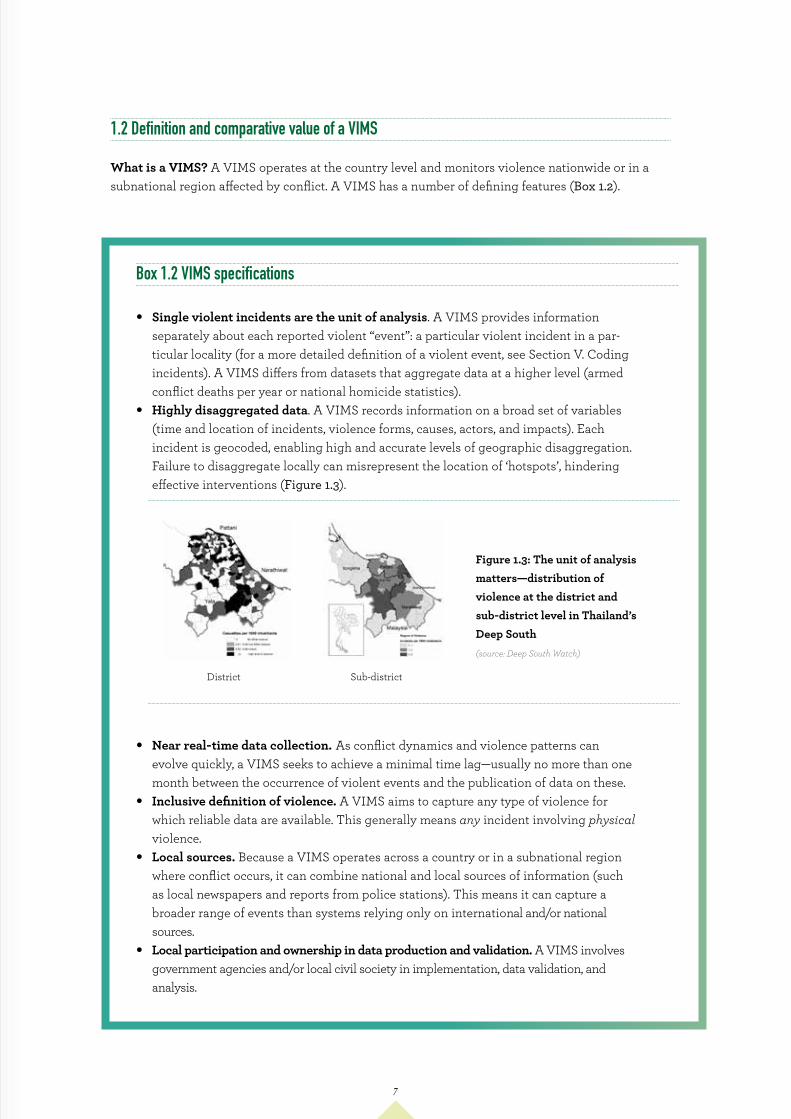
• Highly disaggregated data. A VIMS records information on a broad set of variables (time and location of incidents, violence forms, causes, actors, and impacts). Each incident is geocoded, enabling high and accurate levels of geographic disaggregation. Failure to disaggregate locally can misrepresent the location of ‘hotspots’, hindering effective interventions (Figure 1.3).
Figure 1.3: The unit of analysis matters—distribution of violence at the district and sub-district level in Thailand’s Deep South (source: Deep South Watch)
• Near real-time data collection. As conflict dynamics and violence patterns can evolve quickly, a VIMS seeks to achieve a minimal time lag—usually no more than one month between the occurrence of violent events and the publication of data on these.
• Inclusive definition of violence. A VIMS aims to capture any type of violence for which reliable data are available. This generally means any incident involving physical violence.
• Local sources. Because a VIMS operates across a country or in a subnational region where conflict occurs, it can combine national and local sources of information (such as local newspapers and reports from police stations). This means it can capture a broader range of events than systems relying only on international and/or national sources.
• Local participation and ownership in data production and validation. A VIMS involves government agencies and/or local civil society in implementation, data validation, and analysis.
Box 1.2 VIMS specifications
District Sub-district
7
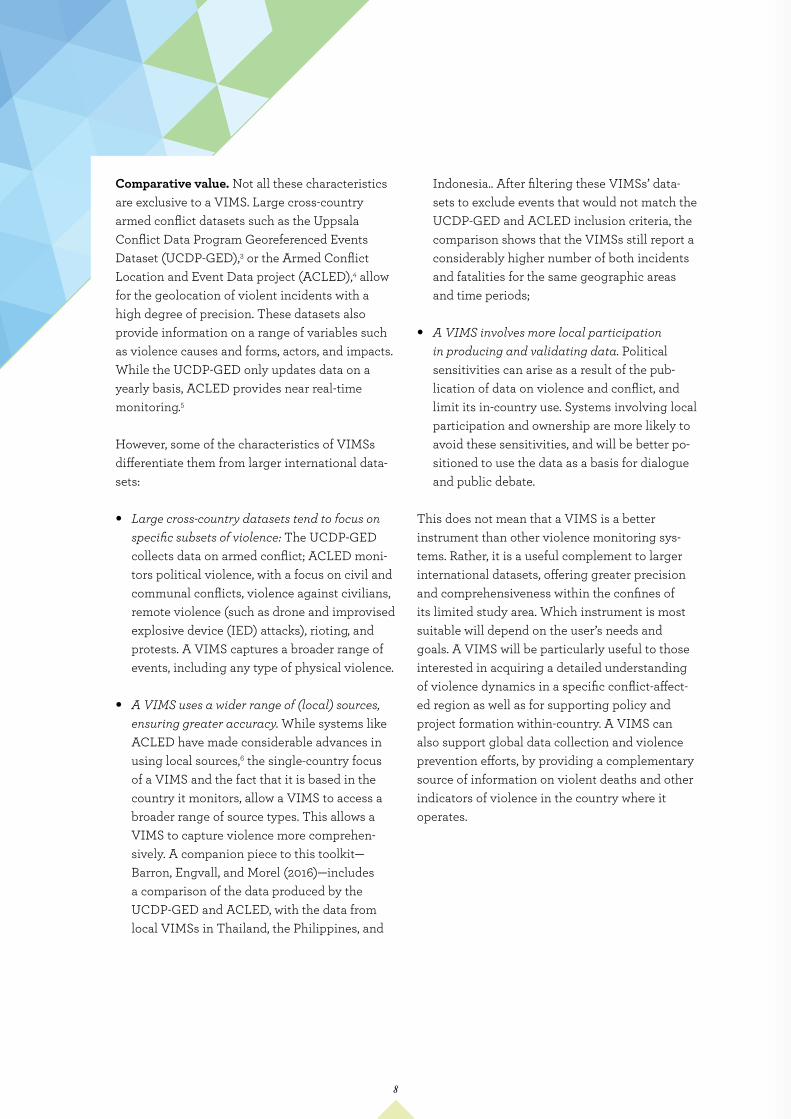
Comparative value. Not all these characteristics are exclusive to a VIMS. Large cross-country armed conflict datasets such as the Uppsala Conflict Data Program Georeferenced Events Dataset (UCDP-GED),3 or the Armed Conflict Location and Event Data project (ACLED),4 allow for the geolocation of violent incidents with a high degree of precision. These datasets also provide information on a range of variables such as violence causes and forms, actors, and impacts. While the UCDP-GED only updates data on a yearly basis, ACLED provides near real-time monitoring.5
However, some of the characteristics of VIMSs differentiate them from larger international data-sets:
• Large cross-country datasets tend to focus on specific subsets of violence: The UCDP-GED collects data on armed conflict; ACLED moni-tors political violence, with a focus on civil and communal conflicts, violence against civilians, remote violence (such as drone and improvised explosive device (IED) attacks), rioting, and protests. A VIMS captures a broader range of events, including any type of physical violence.
• A VIMS uses a wider range of (local) sources, ensuring greater accuracy. While systems like ACLED have made considerable advances in using local sources,6 the single-country focus of a VIMS and the fact that it is based in the country it monitors, allow a VIMS to access a broader range of source types. This allows a VIMS to capture violence more comprehen-sively. A companion piece to this toolkit— Barron, Engvall, and Morel (2016)—includes a comparison of the data produced by the UCDP-GED and ACLED, with the data from local VIMSs in Thailand, the Philippines, and
Indonesia.. After filtering these VIMSs’ data-sets to exclude events that would not match the UCDP-GED and ACLED inclusion criteria, the comparison shows that the VIMSs still report a considerably higher number of both incidents and fatalities for the same geographic areas and time periods;
• A VIMS involves more local participation in producing and validating data. Political sensitivities can arise as a result of the pub-lication of data on violence and conflict, and limit its in-country use. Systems involving local participation and ownership are more likely to avoid these sensitivities, and will be better po-sitioned to use the data as a basis for dialogue and public debate.
This does not mean that a VIMS is a better instrument than other violence monitoring sys-tems. Rather, it is a useful complement to larger international datasets, offering greater precision and comprehensiveness within the confines of its limited study area. Which instrument is most suitable will depend on the user’s needs and goals. A VIMS will be particularly useful to those interested in acquiring a detailed understanding of violence dynamics in a specific conflict-affect-ed region as well as for supporting policy and project formation within-country. A VIMS can also support global data collection and violence prevention efforts, by providing a complementary source of information on violent deaths and other indicators of violence in the country where it operates.
8
Bangsamoro Conflict Monitoring System (BCMS) Philippines
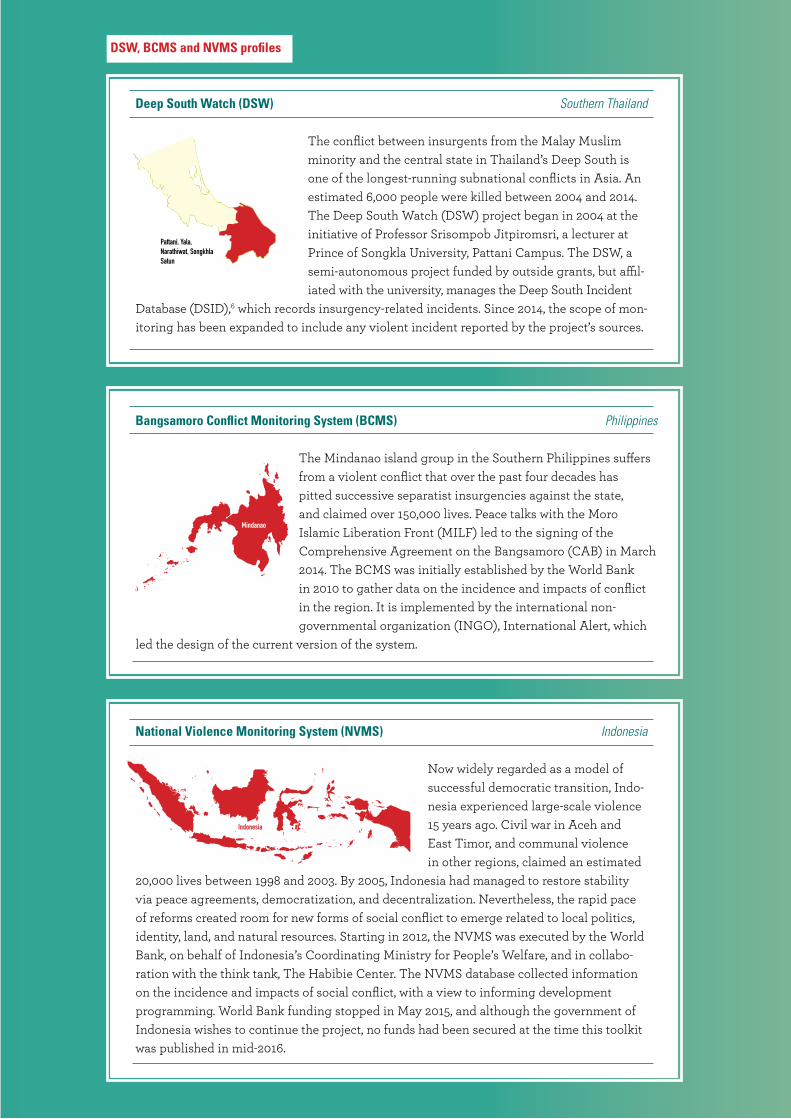
The Mindanao island group in the Southern Philippines suffers from a violent conflict that over the past four decades has pitted successive separatist insurgencies against the state, and claimed over 150,000 lives. Peace talks with the Moro Islamic Liberation Front (MILF) led to the signing of the Comprehensive Agreement on the Bangsamoro (CAB) in March 2014. The BCMS was initially established by the World Bank in 2010 to gather data on the incidence and impacts of conflict in the region. It is implemented by the international non-governmental organization (INGO), International Alert, which
led the design of the current version of the system.
Deep South Watch (DSW) Southern Thailand
The conflict between insurgents from the Malay Muslim minority and the central state in Thailand’s Deep South is one of the longest-running subnational conflicts in Asia. An estimated 6,000 people were killed between 2004 and 2014. The Deep South Watch (DSW) project began in 2004 at the initiative of Professor Srisompob Jitpiromsri, a lecturer at Prince of Songkla University, Pattani Campus. The DSW, a semi-autonomous project funded by outside grants, but affil-iated with the university, manages the Deep South Incident
Database (DSID),6 which records insurgency-related incidents. Since 2014, the scope of mon-itoring has been expanded to include any violent incident reported by the project’s sources.
National Violence Monitoring System (NVMS) Indonesia
Now widely regarded as a model of successful democratic transition, Indo-nesia experienced large-scale violence 15 years ago. Civil war in Aceh and East Timor, and communal violence in other regions, claimed an estimated
20,000 lives between 1998 and 2003. By 2005, Indonesia had managed to restore stability via peace agreements, democratization, and decentralization. Nevertheless, the rapid pace of reforms created room for new forms of social conflict to emerge related to local politics, identity, land, and natural resources. Starting in 2012, the NVMS was executed by the World Bank, on behalf of Indonesia’s Coordinating Ministry for People’s Welfare, and in collabo-ration with the think tank, The Habibie Center. The NVMS database collected information on the incidence and impacts of social conflict, with a view to informing development programming. World Bank funding stopped in May 2015, and although the government of Indonesia wishes to continue the project, no funds had been secured at the time this toolkit was published in mid-2016.
DSW, BCMS and NVMS profiles
Pattani, Yala,Narathiwat, SongkhlaSatun
Mindanao
Indonesia
DSW BCMS NVMS
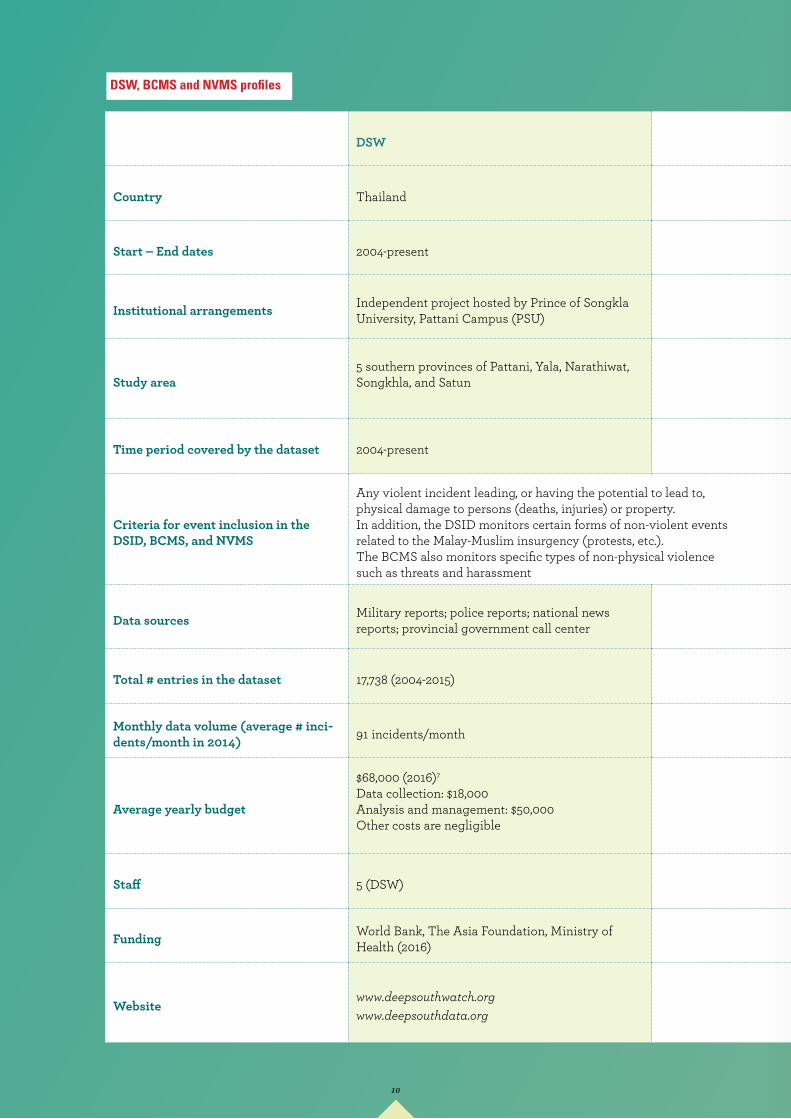
Country Thailand Philippines Indonesia
Start – End dates 2004-present 2011-present 2012-2015
Institutional arrangements Independent project hosted by Prince of Songkla University, Pattani Campus (PSU)
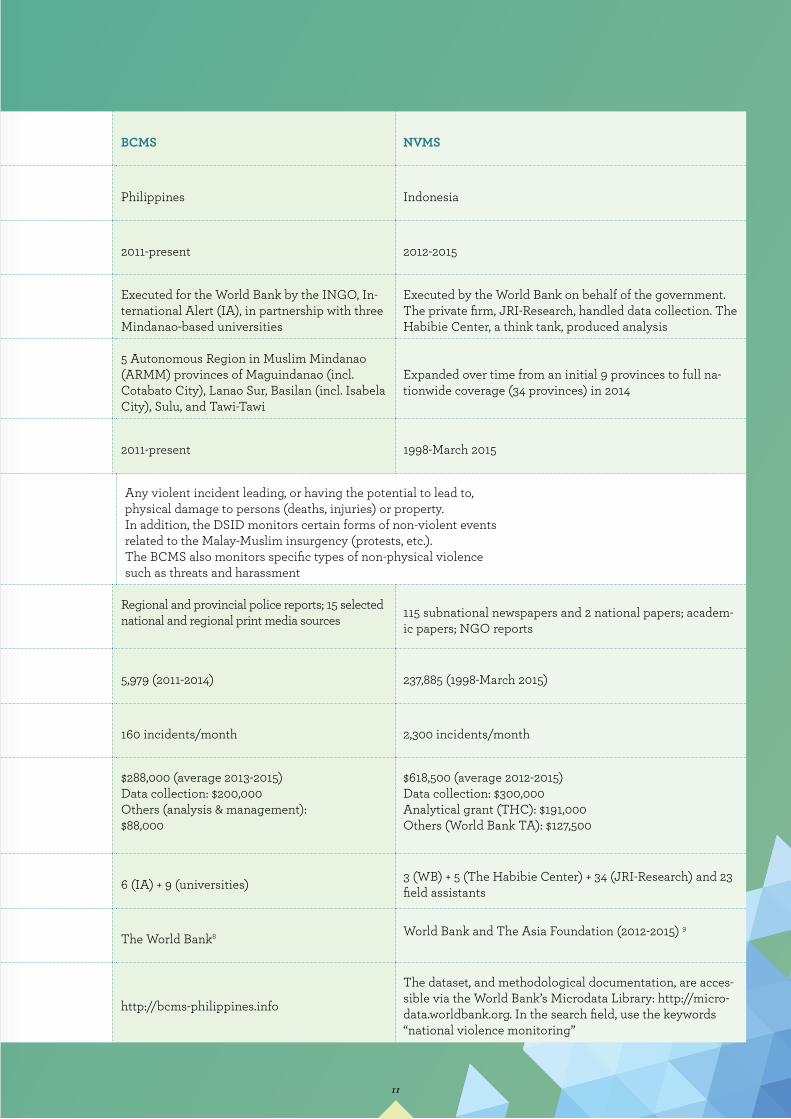
Executed for the World Bank by the INGO, In-ternational Alert (IA), in partnership with three Mindanao-based universities
Executed by the World Bank on behalf of the government. The private firm, JRI-Research, handled data collection. The Habibie Center, a think tank, produced analysis
Study area5 southern provinces of Pattani, Yala, Narathiwat, Songkhla, and Satun
5 Autonomous Region in Muslim Mindanao (ARMM) provinces of Maguindanao (incl. Cotabato City), Lanao Sur, Basilan (incl. Isabela City), Sulu, and Tawi-Tawi
Expanded over time from an initial 9 provinces to full na-tionwide coverage (34 provinces) in 2014
Time period covered by the dataset 2004-present 2011-present 1998-March 2015
Criteria for event inclusion in the DSID, BCMS, and NVMS
Any violent incident leading, or having the potential to lead to, physical damage to persons (deaths, injuries) or property. In addition, the DSID monitors certain forms of non-violent events related to the Malay-Muslim insurgency (protests, etc.). The BCMS also monitors specific types of non-physical violence such as threats and harassment
Any violent incident leading, or having the potential to lead to, physical damage to persons (deaths, injuries) or property. In addition, the DSID monitors certain forms of non-violent events related to the Malay-Muslim insurgency (protests, etc.). The BCMS also monitors specific types of non-physical violence such as threats and harassment
Data sources Military reports; police reports; national news reports; provincial government call center
Regional and provincial police reports; 15 selected national and regional print media sources 115 subnational newspapers and 2 national papers; academ-
ic papers; NGO reports
Total # entries in the dataset 17,738 (2004-2015) 5,979 (2011-2014) 237,885 (1998-March 2015)
Monthly data volume (average # inci-dents/month in 2014) 91 incidents/month 160 incidents/month 2,300 incidents/month
Average yearly budget
$68,000 (2016)7 Data collection: $18,000Analysis and management: $50,000 Other costs are negligible
$288,000 (average 2013-2015)Data collection: $200,000Others (analysis & management): $88,000
$618,500 (average 2012-2015)Data collection: $300,000Analytical grant (THC): $191,000Others (World Bank TA): $127,500
Staff 5 (DSW) 6 (IA) + 9 (universities) 3 (WB) + 5 (The Habibie Center) + 34 (JRI-Research) and 23 field assistants
Funding World Bank, The Asia Foundation, Ministry of Health (2016) The World Bank8 World Bank and The Asia Foundation (2012-2015) 9
Websitewww.deepsouthwatch.orgwww.deepsouthdata.org
http://bcms-philippines.info
The dataset, and methodological documentation, are acces-sible via the World Bank’s Microdata Library: http://micro-data.worldbank.org. In the search field, use the keywords “national violence monitoring”
DSW, BCMS and NVMS profiles
10
DSW BCMS NVMS
Country Thailand Philippines Indonesia
Start – End dates 2004-present 2011-present 2012-2015
Institutional arrangements Independent project hosted by Prince of Songkla University, Pattani Campus (PSU)
Executed for the World Bank by the INGO, In-ternational Alert (IA), in partnership with three Mindanao-based universities
Executed by the World Bank on behalf of the government. The private firm, JRI-Research, handled data collection. The Habibie Center, a think tank, produced analysis
Study area5 southern provinces of Pattani, Yala, Narathiwat, Songkhla, and Satun
5 Autonomous Region in Muslim Mindanao (ARMM) provinces of Maguindanao (incl. Cotabato City), Lanao Sur, Basilan (incl. Isabela City), Sulu, and Tawi-Tawi
Expanded over time from an initial 9 provinces to full na-tionwide coverage (34 provinces) in 2014
Time period covered by the dataset 2004-present 2011-present 1998-March 2015
Criteria for event inclusion in the DSID, BCMS, and NVMS
Any violent incident leading, or having the potential to lead to, physical damage to persons (deaths, injuries) or property. In addition, the DSID monitors certain forms of non-violent events related to the Malay-Muslim insurgency (protests, etc.). The BCMS also monitors specific types of non-physical violence such as threats and harassment
Any violent incident leading, or having the potential to lead to, physical damage to persons (deaths, injuries) or property. In addition, the DSID monitors certain forms of non-violent events related to the Malay-Muslim insurgency (protests, etc.). The BCMS also monitors specific types of non-physical violence such as threats and harassment
Data sources Military reports; police reports; national news reports; provincial government call center
Regional and provincial police reports; 15 selected national and regional print media sources 115 subnational newspapers and 2 national papers; academ-
ic papers; NGO reports
Total # entries in the dataset 17,738 (2004-2015) 5,979 (2011-2014) 237,885 (1998-March 2015)
Monthly data volume (average # inci-dents/month in 2014) 91 incidents/month 160 incidents/month 2,300 incidents/month
Average yearly budget
$68,000 (2016)7 Data collection: $18,000Analysis and management: $50,000 Other costs are negligible
$288,000 (average 2013-2015)Data collection: $200,000Others (analysis & management): $88,000
$618,500 (average 2012-2015)Data collection: $300,000Analytical grant (THC): $191,000Others (World Bank TA): $127,500
Staff 5 (DSW) 6 (IA) + 9 (universities) 3 (WB) + 5 (The Habibie Center) + 34 (JRI-Research) and 23 field assistants
Funding World Bank, The Asia Foundation, Ministry of Health (2016) The World Bank8 World Bank and The Asia Foundation (2012-2015) 9
Websitewww.deepsouthwatch.orgwww.deepsouthdata.org
http://bcms-philippines.info
The dataset, and methodological documentation, are acces-sible via the World Bank’s Microdata Library: http://micro-data.worldbank.org. In the search field, use the keywords “national violence monitoring”
11
An effective VIMS is designed from the outset with clear objectives in mind. The project team needs to balance the practical benefits of focusing on specific and limited goals while allowing the project to grow and adapt as the context changes. This section discusses this trade-off and stresses the need to manage stakeholders’ expectations as to what a violence monitoring system can and cannot do.
2.1 Balancing specificity and flexibility in defining objectives
Importance of well-defined objectives. What types of violence will be monitored, and for what purpose? What are the intended outcomes of a VIMS? Which policies and programs should it support or influence? Answers to these questions will determine the range of incidents a VIMS will monitor, decisions regarding sources, vari-ables, and implementation arrangements, as well as a system’s analytical agenda and strategy to influence policy. A system’s objectives will shape project design in ways that can be irreversible or difficult to adjust later. Thus, the goals of a VIMS should be defined carefully.
The benefits of specificity. Violence monitoring systems are often established in reaction to events or changes in a country’s situation or policy envi-ronment. A spike in the intensity of a subnational conflict, an increase in crime levels, the signing of a peace agreement, or changes in the govern-
DEFINING GOALS AND SCOPE
1st MODULE
II. Defining objectives
ment’s approach to handling conflict can each create demand for better instruments to monitor the situation, inform the design of policies and programs, or evaluate the effectiveness of policies. Even when this is not the case, thinking through the specific programmatic or policy goals that a VIMS wishes to shape is key. It will be easier to secure the buy-in of government counterparts and development partners, and the support of civil society, when a system supports particular political priorities such as monitoring a ceasefire, supporting reforms in the state’s approach to crime prevention, etc. When a system’s main tar-get audience is government, it should be designed to feed easily into government systems for data management, monitoring and evaluation (M&E), or program implementation. This will enable the system to demonstrate value early on, and facili-tate policy uptake.
The need for flexibility. However, defining objec-tives too narrowly can result in a lack of adaptabil-ity and versatility. Both are important as conflict and violence dynamics evolve, political priorities change, and programs come to an end. When a system is too closely related to specific policies or interventions, it may become difficult to adjust it to serve other purposes in the future. Ensuring some level of flexibility in design is therefore necessary to allow a system to grow, adapt, and endure. Box 2.1 illustrates how the NVMS, DSW, and BCMS evolved over time, adjusting their designs to new objectives and priorities.
12
Box 2.1 DSW, BCMS and NVMS: initial objectives, their evolution over time, and design implications
Deep South Watch (DSW), a civil society initiative, was established in 2004 as the intensity of the Malay Muslim insurgency in Southern Thailand suddenly escalated to unprecented levels. The project’s initial goal was to raise national and international awareness about the intensity and nature of the conflict, and to promote a political solution. The DSW only monitored insurgency-related incidents. However, as the DSW system gained visibility, and the first steps towards peace talks were taken, DSW staff realized that they needed to make adjustments to prepare for a possible evolution of the context. First, to prepare for a possible peace accord, the DSW started monitoring a broader range of incidents so it could capture shifts in the dynamics of violence (e.g. from insurgency to crime or political violence). Second, it professionalized its methodology to better match international standards, making it easier for external observers to use the dataset.
The Bangsamoro Conflict Monitoring System (BCMS) was initiated by the World Bank in the Philippines in 2010, in anticipation of peace talks that led to the signing of the Compre-hensive Agreement on the Bangsamoro (CAB). The BCMS seeks to monitor the implemen-tation of the CAB, and help with the design of state and donor development programming. Since 2011, the BCMS has been implemented by the INGO, International Alert (IA). IA led a redesign of the BCMS to improve quality and allow for exploration of how the armed conflict intersects with localized forms of violence such as clan feuds and local competition over political power and economic resources. At the request of its donors, IA recently expanded BCMS coverage to include Eastern Mindanao where conflict dynamics take a different form due to the presence of the New People’s Army (NPA), a communist armed group.
The National Violence Monitoring System (NVMS) in Indonesia was preceded by a series of violence monitoring projects, initiated and executed by the World Bank, and focused on subnational conflict. For example, the Aceh Conflict Monitoring Updates (ACMU) project was established after the signing of the 2005 Aceh peace agreement and its data were used to monitor the peace process and inform post-conflict programming. The Violent Conflict in Indonesia Study (ViCIS; 2008-2012) used a similar methodology to investigate variations in how conflict dynamics evolved in provinces formerly affected by communal or ethno-na-tionalist conflict. In 2012, the Coordinating Ministry for People’s Welfare asked the World Bank to adapt the ViCIS methodology so it could monitor social conflict and inform social development programs. Ownership of the new system, the NVMS, was then transferred to the government, with the World Bank executing the project on its behalf. In order to better align the NVMS with the government’s own terminology and analytical categories, its operational definitions had to be adjusted. The NVMS also had to monitor social conflict nationwide so that it would be effective in informing national-level policy. Starting in 2012, NVMS data collection efforts were gradually scaled up to cover all 34 of Indonesia’s provinces.
13
To resolve the tension between specificity and flexibility, one must distinguish between data collec-tion objectives and analytical goals:
• Violence monitoring can identify the root causes of violence. Violence monitoring systems only capture the proximate cause of violent incidents (the issue that motivated perpetrators to act violently), not their ultimate causes (the underlying social, economic, or institutional factors that created the condi-tions for violence to happen). At the aggregate level, data analysis will nonetheless generate reliable information on which types of issues (e.g. political contestation, or competition over natural resources) lead to violence. Economet-ric analysis investigating correlations between incidences of violence and other socio-econom-ic conditions (e.g. poverty, inequality, or ethnic diversity) will provide insights into the under-lying causes of violence in a particular context. Project teams should, nonetheless, be explicit about the fact that violence data alone does not provide answers to all questions; it is only when combined with other data and investigative in-struments that it can acquire explanatory value.
• Violence monitoring systems can predict violence. There has been growing interest in developing analytical tools to anticipate violent events so that response mechanisms can be triggered in time to mitigate their impact on the population.10 Violence monitoring systems are often expected to fulfill that function. It is assumed that by analyzing past violence, it will be possible to predict future incidents. However, the predictive value of violence data is limited. Macro-level statistical analysis that pairs violence with other data can help identify which combinations of political, economic, and social conditions are correlated with conflict or social unrest, and estimate the probability of such events occuring. However, analysis cannot establish exactly when and how violence will occur. Subnationally, the precision of predictive instruments is even more limited. Experimenta-tion with local-level violence forecasting has led to encouraging, but mixed results.11 The accuracy of predictive models will likely increase with further research and technological develop-ments. But a violence monitoring system is not a ‘crystal ball’ that allows the future to be read.
• On the other hand, analytical and policy goals should be defined with greater precision and specificity. The project team must identify practical opportunities for the data to support concrete policy change, or program design, and adjust its analytical agenda accordingly. This is particularly important in the early stages of a project’s development, when it will be under pressure to demonstrate value. This does not mean that analytical objectives are set in stone. Data versatility will allow for adjustments to the analytical agenda as the project grows and evolves, or as demand shifts towards new priorities.
2.2 Managing expectations
In defining violence monitoring system objectives, project teams should take care to manage the expecta-tions of their audience and counterparts by being very clear about what their datasets can and cannot do. Two misperceptions are particularly common:
• Violence monitoring systems should aim to capture as broad a range of violent incidents as possible, within the limitations imposed by data reliability and budget constraints. In practice, this toolkit recommends the monitor-ing of any incident involving physical violence (Section III. Defining scope). Casting a broad data collection ‘net’ will enable greater flexibili-ty in analytical use and policy applications.
14
III. Defining the scope of violence
The next step in designing a VIMS is defining its scope: the range of events it will monitor. Key questions in this regard include:
• Which types of violent incidents will be monitored for the dataset, and which will be excluded?
• Should some types of non-violent events also be monitored?
A violence monitoring system must establish unambiguous criteria for incident inclusion (and exclusion). This is important in order to ensure consistency in the way different data entry staff make decisions on which incidents should be included in the dataset. As a system grows and the scale of data collection increases, unequivocal operational definitions will become increasingly important. Decisions about inclusion criteria should depend on a system’s objectives, the amount of funding available, and the absorption capacity of the implementing team.
3.1 Which types of violence should be included?
Should violence monitoring systems focus on physical violence or adopt a broader definition? The World Health Organization (WHO) defines violence as “the intentional use of physical force or power, threatened or actual, against oneself, another person, or against a group or community, which either results in or has a high likelihood of resulting in injury, death, psychological harm, maldevelopment, or deprivation” (Krug et al. 2002). This broad definition acknowledges that violence can be exerted through means other than physical force. If focusing solely on physical violence, violence monitoring systems can be criticized for misrepresenting social issues that are complex and multidimensional in nature, or for underestimating their impact. Most people involved in the prevention of gender-based violence, for example, define it in a way that emcompasses harassment and other forms of non-physical abuse.
These concerns are legitimate. Nonetheless, there are a number of reasons why project teams should be careful not to stretch their operational definition of violence too broadly:• Quantitative analysis requires reliable indi-
cators and consistent reporting. Physical violence—violence leading (or having the potential to lead) to physical harm to persons (such as death and injury), or damage to property (e.g. destruction of homes, schools, or government buildings)—is a relatively objective inclusion criterion. When violence is defined more broadly to include non-phys-ical impacts such as psychological harm and deprivation (as in the WHO definition above), the boundaries of what constitutes a violent event and what does not become blurry. This can lead to inconsistencies in incident selection. As non-physical forms of violence or abuse are less consistently reported by data sources such as the police and media, misleading data gaps and variation can result.
• Defining violence too broadly can place a considerable burden on a monitoring sys-tem’s capacity. How violence is defined has implications for the volume of data a system must process, and therefore implications for staffing and budget. Including non-physical violence will significantly increase the scale of data collection. It may also strain the ana-lytical capacity of a system as it will need to make sense of a broader range of phenomena.
It is advisable to restrict monitoring to inci-dents of physical violence, but violence should not be defined too restrictively. Concerns about the reliability of data sources and resource con-straints might lead project teams to limit moni-toring to the most reliable indicators of violence, such as deaths. This is a reasonable decision when systems focus on macro-level or cross-country analysis. However, defining the scope of vio-lence to be monitored too narrowly can impair a system’s capacity to contribute to more in-depth analysis of violence dynamics (Section 3.3 Should all violence be monitored?).
15
3.2 Monitoring violence or monitoring conflict?
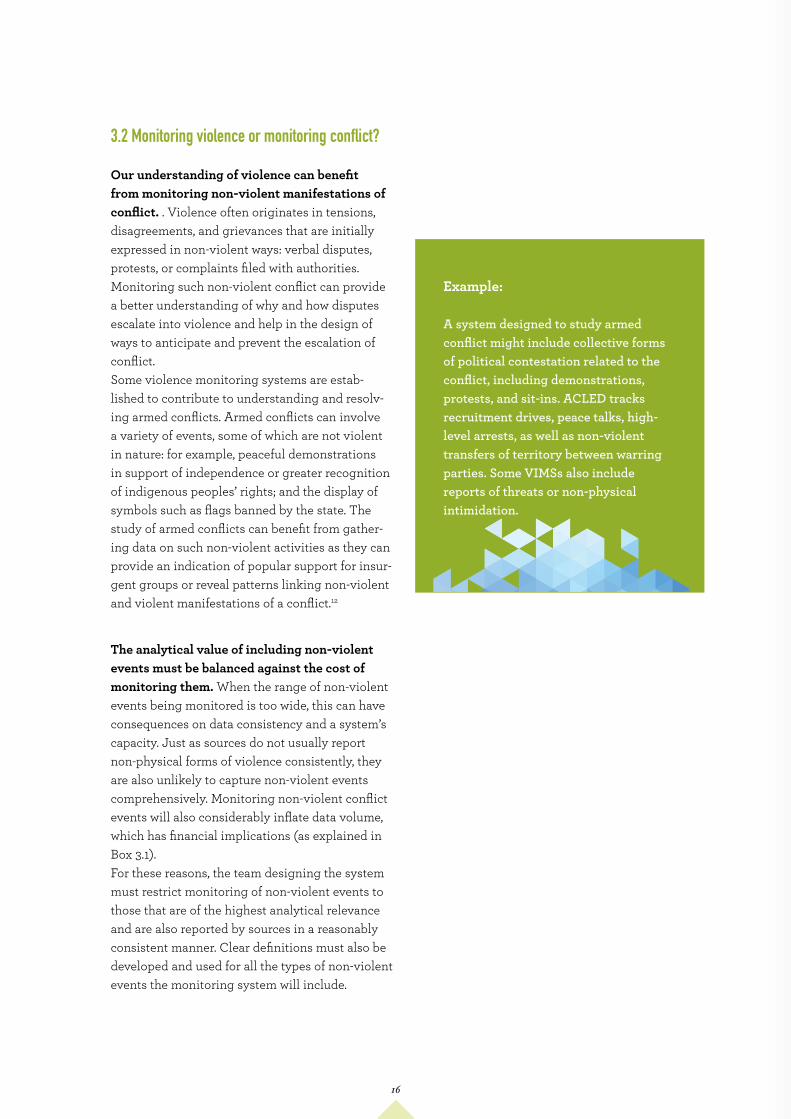
Our understanding of violence can benefit from monitoring non-violent manifestations of conflict. . Violence often originates in tensions, disagreements, and grievances that are initially expressed in non-violent ways: verbal disputes, protests, or complaints filed with authorities. Monitoring such non-violent conflict can provide a better understanding of why and how disputes escalate into violence and help in the design of ways to anticipate and prevent the escalation of conflict. Some violence monitoring systems are estab-lished to contribute to understanding and resolv-ing armed conflicts. Armed conflicts can involve a variety of events, some of which are not violent in nature: for example, peaceful demonstrations in support of independence or greater recognition of indigenous peoples’ rights; and the display of symbols such as flags banned by the state. The study of armed conflicts can benefit from gather-ing data on such non-violent activities as they can provide an indication of popular support for insur-gent groups or reveal patterns linking non-violent and violent manifestations of a conflict.12
The analytical value of including non-violent events must be balanced against the cost of monitoring them. When the range of non-violent events being monitored is too wide, this can have consequences on data consistency and a system’s capacity. Just as sources do not usually report non-physical forms of violence consistently, they are also unlikely to capture non-violent events comprehensively. Monitoring non-violent conflict events will also considerably inflate data volume, which has financial implications (as explained in Box 3.1).For these reasons, the team designing the system must restrict monitoring of non-violent events to those that are of the highest analytical relevance and are also reported by sources in a reasonably consistent manner. Clear definitions must also be developed and used for all the types of non-violent events the monitoring system will include.
Example:
A system designed to study armed conflict might include collective forms of political contestation related to the conflict, including demonstrations, protests, and sit-ins. ACLED tracks recruitment drives, peace talks, high-level arrests, as well as non-violent transfers of territory between warring parties. Some VIMSs also include reports of threats or non-physical intimidation.
16
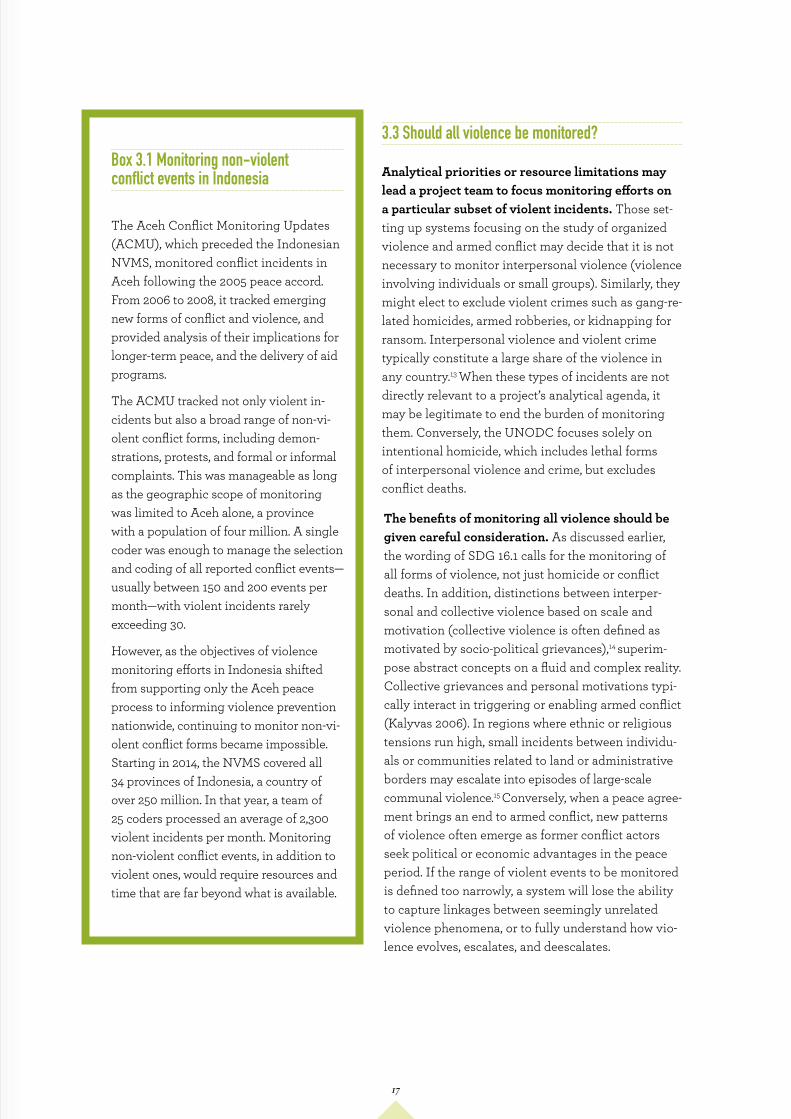
Box 3.1 Monitoring non-violent conflict events in Indonesia
The Aceh Conflict Monitoring Updates (ACMU), which preceded the Indonesian NVMS, monitored conflict incidents in Aceh following the 2005 peace accord. From 2006 to 2008, it tracked emerging new forms of conflict and violence, and provided analysis of their implications for longer-term peace, and the delivery of aid programs.
The ACMU tracked not only violent in-cidents but also a broad range of non-vi-olent conflict forms, including demon-strations, protests, and formal or informal complaints. This was manageable as long as the geographic scope of monitoring was limited to Aceh alone, a province with a population of four million. A single coder was enough to manage the selection and coding of all reported conflict events—usually between 150 and 200 events per month—with violent incidents rarely exceeding 30.
However, as the objectives of violence monitoring efforts in Indonesia shifted from supporting only the Aceh peace process to informing violence prevention nationwide, continuing to monitor non-vi-olent conflict forms became impossible. Starting in 2014, the NVMS covered all 34 provinces of Indonesia, a country of over 250 million. In that year, a team of 25 coders processed an average of 2,300 violent incidents per month. Monitoring non-violent conflict events, in addition to violent ones, would require resources and time that are far beyond what is available.
3.3 Should all violence be monitored?
Analytical priorities or resource limitations may lead a project team to focus monitoring efforts on a particular subset of violent incidents. Those set-ting up systems focusing on the study of organized violence and armed conflict may decide that it is not necessary to monitor interpersonal violence (violence involving individuals or small groups). Similarly, they might elect to exclude violent crimes such as gang-re-lated homicides, armed robberies, or kidnapping for ransom. Interpersonal violence and violent crime typically constitute a large share of the violence in any country.13 When these types of incidents are not directly relevant to a project’s analytical agenda, it may be legitimate to end the burden of monitoring them. Conversely, the UNODC focuses solely on intentional homicide, which includes lethal forms of interpersonal violence and crime, but excludes conflict deaths.
The benefits of monitoring all violence should be given careful consideration. As discussed earlier, the wording of SDG 16.1 calls for the monitoring of all forms of violence, not just homicide or conflict deaths. In addition, distinctions between interper-sonal and collective violence based on scale and motivation (collective violence is often defined as motivated by socio-political grievances),14 superim-pose abstract concepts on a fluid and complex reality. Collective grievances and personal motivations typi-cally interact in triggering or enabling armed conflict (Kalyvas 2006). In regions where ethnic or religious tensions run high, small incidents between individu-als or communities related to land or administrative borders may escalate into episodes of large-scale communal violence.15 Conversely, when a peace agree-ment brings an end to armed conflict, new patterns of violence often emerge as former conflict actors seek political or economic advantages in the peace period. If the range of violent events to be monitored is defined too narrowly, a system will lose the ability to capture linkages between seemingly unrelated violence phenomena, or to fully understand how vio-lence evolves, escalates, and deescalates.
17
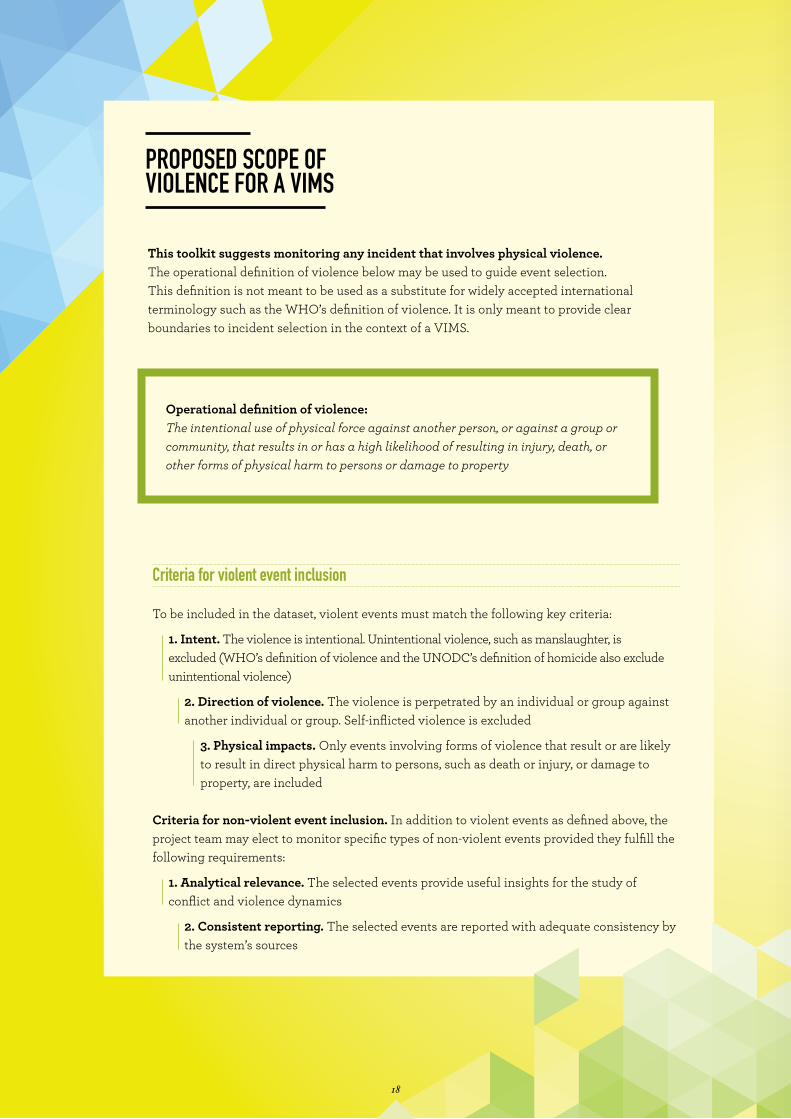
This toolkit suggests monitoring any incident that involves physical violence. The operational definition of violence below may be used to guide event selection. This definition is not meant to be used as a substitute for widely accepted international terminology such as the WHO’s definition of violence. It is only meant to provide clear boundaries to incident selection in the context of a VIMS.
PROPOSED SCOPE OF VIOLENCE FOR A VIMS
Criteria for violent event inclusion To be included in the dataset, violent events must match the following key criteria:
1. Intent. The violence is intentional. Unintentional violence, such as manslaughter, is excluded (WHO’s definition of violence and the UNODC’s definition of homicide also exclude unintentional violence)
2. Direction of violence. The violence is perpetrated by an individual or group against another individual or group. Self-inflicted violence is excluded
3. Physical impacts. Only events involving forms of violence that result or are likely to result in direct physical harm to persons, such as death or injury, or damage to property, are included
Criteria for non-violent event inclusion. In addition to violent events as defined above, the project team may elect to monitor specific types of non-violent events provided they fulfill the following requirements:
1. Analytical relevance. The selected events provide useful insights for the study of conflict and violence dynamics
2. Consistent reporting. The selected events are reported with adequate consistency by the system’s sources
Operational definition of violence: The intentional use of physical force against another person, or against a group or community, that results in or has a high likelihood of resulting in injury, death, or other forms of physical harm to persons or damage to property
18
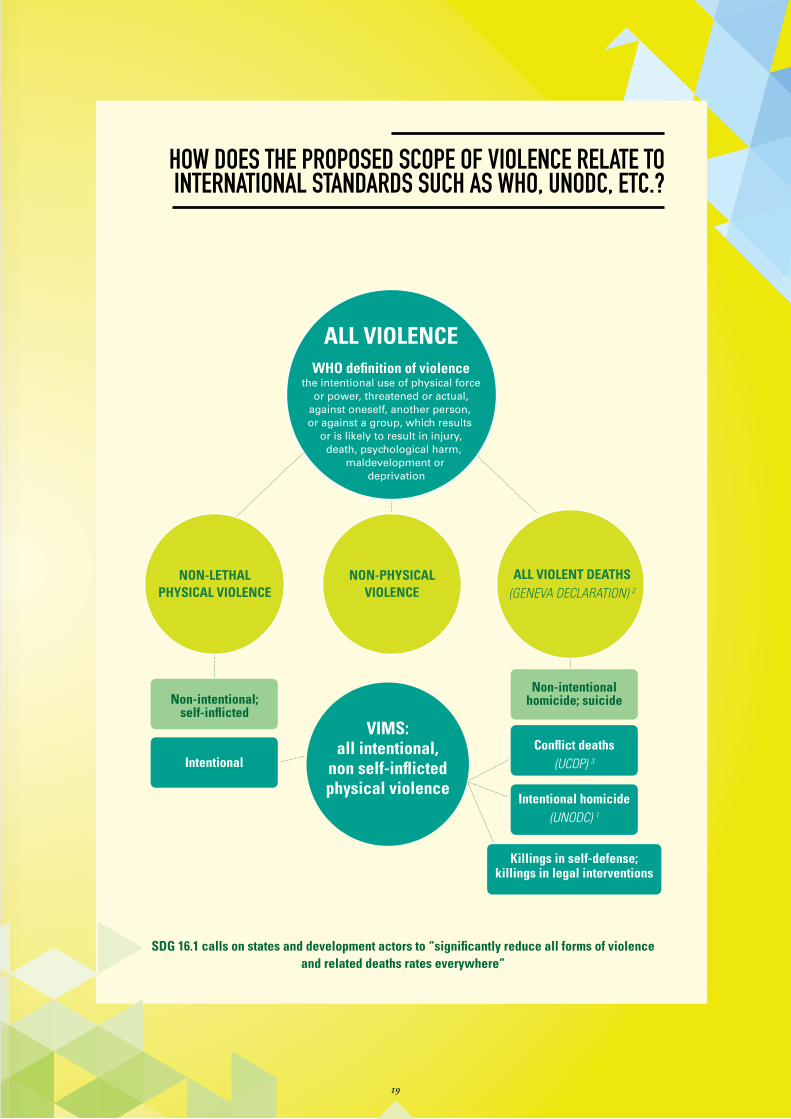
HOW DOES THE PROPOSED SCOPE OF VIOLENCE RELATE TO INTERNATIONAL STANDARDS SUCH AS WHO, UNODC, ETC.?
Non-intentional homicide; suicide
Intentional
Non-intentional; self-inflicted
NON-PHYSICAL VIOLENCE
ALL VIOLENT DEATHS(GENEVA DECLARATION) 2
VIMS: all intentional,
non self-inflicted physical violence
NON-LETHAL PHYSICAL VIOLENCE
Conflict deaths (UCDP) 3
Intentional homicide(UNODC) 1
Killings in self-defense; killings in legal interventions
ALL VIOLENCE WHO definition of violence
the intentional use of physical force or power, threatened or actual,
against oneself, another person, or against a group, which results
or is likely to result in injury, death, psychological harm,
maldevelopment or deprivation
SDG 16.1 calls on states and development actors to “significantly reduce all forms of violence and related deaths rates everywhere”
19
GENERATING DATA
2nd MODULE:
This section discusses data sources. It starts by specifying adequate data sources for a VIMS. Next, it lists the most commonly-used sources, and discusses their respective strengths and weaknesses. In the concluding section, this module proposes a number of basic principles for selecting sources.
Some of the characteristics of a VIMS have implications for source selection. These include: (a) single incidents as the unit of analysis; (b) an inclusive definition of violence; and (c) real-time data collection. Some information sources will be more valuable than others for a VIMS.
The most useful sources will match the follow-ing specifications:
• The source provides information on single violent incidents.
• The source collects information on all forms of violence with potential to physically impact persons and/or property in the target geo-graphic area or part of that area. Taken togeth-er, the selected sources should allow for the capture of incidents as comprehensively as pos-sible within the range of violence, as defined by the project’s objectives and scope.
• The source reports detailed information on incidents, including: time, location, violence forms, causes, actors, and impacts. A high level of detail will make it easier to check facts and ascertain the credibility of sources.
IV. Selecting Sources
• The source updates information regularly, according to a consistent timeframe (ideally, daily, weekly or monthly).
• The source provides a basic level of profes-sionalism and methodological consistency in the collection of information on violent incidents. Sources should provide reasonably accurate and trustworthy information.
Triangulation. No single source of information will provide an accurate account of every violent incident. Individual sources may focus on specif-ic geographic areas or types of violence. Using several source types, in combination, is the best approach. Triangulation allows information on a wider range of incidents to be collected and for data from individual sources to be validated through cross-verification. Overall, triangulation can dramatically improve the quality of the data-set, and lend it greater credibility.
4.1 Source specifications
20

4.2 Common VIMS sources
This section discusses a number of source types for a VIMS: news reports, data from security forces, and NGO reports, as well as new sources that have emerged with recent developments in information technology— crowdsourcing, crowdseeding, and social media monitoring.
Main advantages Main disadvantages Recommendations
News
repo
rts Usually rely on multiple primary and secondary sources
Publicly accessible
Selection is biased toward more newsworthy incidents, i.e. homicides, politics, crime
Possible underrepresentation of rural violence, and uneven geographic coverage
Possible subjective biases, self-censorship, and perceived or actual credibility issues
Mitigate biases by using subnational rather than national news reports, and using as many media sources as possible for a single target area
Mitigate credibility issues by using news reports in combination with other source types
Secu
rity f
orce
s
Methodological consistency and level of descriptive detail
Geographic coverage and access to high-risk areas
Credibility (for a government audience)
Restricted access, or sustainability of access, is not guaranteed
Sometimes less effective at identifying motives/causes of incidents
Reporting influenced by bureaucratic and political considerations; credibility issues (to a non-government audience)
Use in combination with independent sources
NGO
repo
rts
Direct reporting by primary sources
Grassroots networks and independence
Often, preference for a qualitative and case-based approach to reporting, limited in scope, and focused on specific policy issues
Frequency of reporting
Use in combination with sources that allow for more systematic and comprehensive data collection on violent incidents
Crow
dsou
rcing
, cr
owds
eedin
g, an
d soc
ial m
edia
monit
oring
Real-time collection of information directly from technology users, or from trained informants in the field
Dependent upon access to the Internet and/or mobile networks
Demographic and socio-economic bias
Validation issues
Cost and links with institutional response
Use in combination with traditional sources
Table 4.1: The advantages and disadvantages of common source types
Table 4.1 summarizes the main strengths and limitations of these source types, as well as related recommendations.
21
4.2.1 News reportsMost violence datasets use news service and newspaper reports.16 Publicly accessible, they summarize informa-tion from various primary sources. Selection biases can be partly mitigated by using subnational news sources in addition to national ones.
Reasons for their frequent use include the following:
• News reports are publicly available. A subscription to a news service or a collection of newspapers is all one needs to start collecting data.
• Violence sells. News outlets tend to have a commercial inter-est in reporting on conflict and violent events, leading to good coverage of violent incidents.
• Triangulation. If journalists are properly trained, their news reports will integrate informa-tion from multiple sources such as police reports and interviews with eye-witnesses and other key informants. In a good news article about a violent incident, information has already been verified.
However, news reports have poten-tial selection biases:
• Newsworthiness. Based on what will ‘sell’, news outlets cover certain types of violence more than others:• News outlets are more likely
to report incidents when they lead to deaths. Conversely, they likely underrepresent incidents involving non-lethal forms of violence.
• Group or mass violence attracts greater interest. Incidents that directly or indirectly impact many people are of greater interest than those affecting just a few. For this reason, news outlets tend to report on crime, terrorism, and political violence more consistently.
• Urban/rural bias and uneven geographic coverage. News outlets report more consistent-ly on incidents that happen near cities where their offices, correspondents, and readers are located, and, consequently, they may underreport rural violence.17 Generally, the quality of cov-erage is likely to be uneven geographically.
• Subjective reporting. This is particularly relevant for conflict reporting. The decision to report or not report specific incidents, and their interpretation, may be influenced by journalists’ concerns about self-preserva-tion, their political sympathies or affiliations.18
A number of measures can be taken to mitigate selection bias in the news media:
• Using subnational news reports. National media will only allocate resources and column space to major incidents, i.e. incidents that involve multiple fatalities, particularly gruesome violence, or that are otherwise of interest to a national audience. Regional, provincial or local news outlets such as local newspapers and community radio will usually apply much lower threshold for newsworthiness, and therefore report on a much broader range of incidents in their locale.19 When possible, national media should be complemented by local media (see Annex IV.2: Why use local newspapers?).
• Mitigating subjective biases. A thorough assessment of sources, including a review of news re-ports and conducting interviews with editorial staff and media observers, will help weed out the most unreliable news outlets (see Annex IV.1: Assessing sources). In addition, using as many news sources as possible in a given region should partial-ly compensate for the biases of each individual outlet.
22
4.2.2 Security forces
When data from the police and/or the military are accessible, they can be a precious source of information for VIMSs.20
Security force information has several advantages:
• It is official data. As such, it is likely to be re-garded as reliable and trustworthy by govern-ments, and, as a result, analytical findings and recommendations may get more attention.
• Geographic coverage. In most countries, the police have stations located at the lowest ad-ministrative units, and can dispatch officers to remote places when needed. This ensures a better and tighter data coverage grid than most other sources. In countries affected by armed conflict, the military maintain a presence in high-risk areas which may be beyond the reach of the news media or even the police.
• Consistency and precision in data col-lection. Police and army reporting systems often use standardized templates that ensure greater data consistency across geographic areas, and these usually require detailed and accurate information on each incident.21 Data include forensic information such as impacts and weapons used, as well as information on victims and perpetrators. The DSW and BCMS teams have praised the precision of police and military reports, which they found markedly superior to other sources.
Military or police data also have important downsides:
• Access. Access to military data is generally re-stricted. Publicly available police data are often aggregated provincially or nationally, and are published on a quarterly or yearly basis. Access to individual incident reports might be difficult to negotiate, or subject to conditions. Chang-es in personnel or political conditions could compromise it. However, in the Philippines and Thailand, the police and/or the army have found it in their interest to share information with trusted partners (see Annex IV.3: NVMS, BCMS and DSW data sources).
• Information gaps. The DSW and BCMS expe-riences suggest that police and military reports are less able to identify the causes of incidents.22 Police or army reports are often issued shortly after an incident, before a full investigation has been conducted. This may lead to signifi-cant information gaps in the systems that rely primarily on these data.23
• Variation in the quality of reporting. Imbalances in police and military resources across different provinces or districts, or across high-risk areas and more peaceful ones, may lead to variation. Military reports will focus on armed conflict incidents at the expense of community-level disputes, thus leading to underrepresentation of the latter in the official record.24 Bureaucratic and political incentives might also generate reporting biases (see Annex IV.3: NVMS, BCMS, and DSW data sources).
• Public trust. In contexts where the state is a party to conflict, some elements of society may regard official data, and, in particular data from security forces, as biased and untrustworthy.
23
Crowdsourcing involves obtaining information by soliciting direct contributions from citizens via elec-tronic means. An often-cited example is Ushahidi, an open-source software for information collection and interactive mapping. Ushahidi was first used in the aftermath of Kenya’s disputed presidential election in 2007.26
Crowdseeding uses mobile phones to source information from a trusted network of trained field informants.27 Social media monitoring extracts information on specific topics from social media platforms such as Facebook, Twitter, Instagram, or Google Plus.
These instruments have a number of limitations:
• All three instruments depend on the public’s access to cell phones and/or the Internet. While Internet and cell phone penetration rates have been growing fast in developing countries, cover-age remains incomplete and uneven in some. The Internet is often only available in urban centers. Mobile networks are typically better at reaching rural areas, but may not extend to remote regions. The poor are also less likely to own a smart phone or be able to access the Internet. For violence monitoring, the latter may be a crucial drawback, as the poor are often more exposed to conflict and violence than anyone else.
• Crowdsourcing and social media monitoring suffer from demographic bias. People active on social media, or reporting events to a crowdsourc-ing platform, are typically better educated, better informed, better off economically, and more likely to live in cities. Reports of violence may therefore reflect the perspectives of the urban middle class. This socio-economic bias might map onto other types of social divisions, such as ethnicity, reli-gion, or political affiliation.
• Reliability and validation issues. Reports sub-mitted to a crowdsourcing system, or circulating on social media, may be based on unverified rumors, reflect subjective or partisan views, or even constitute hate speech or misinformation. To mitigate these risks, crowdsourcing systems establish mechanisms to validate the information. This usually involves a) authenticating the source as reliable and b) triangulating content.28
In conclusion, information technologies have opened new exciting territories for violence prevention and crisis management. Further experimentation should definitely be supported and encouraged. In the meantime, these tools should be used in combination with more traditional data sources.
4.2.3 Crowdsourcing, crowdseeding, and social media monitoringThe dramatic expansion of Internet and cell phone coverage, and the greater affordability of digital devices, provides new opportunities for collecting information on violence via instruments such as crowdsourcing, crowdseeding, and social media monitoring:
24
NGOs and civil society groups are useful sources of data for the following reasons:
• Field networks and access to primary informa-tion. NGOs/CSOs often maintain a field presence and more or less structured networks of local staff through which victims or witnesses to violent acts can submit reports.
• Independence. The independence of NGOs/CSOs from government can inspire the trust of community members who are fearful of reporting incidents through official channels. These organi-zations may also have better access to armed rebel groups, and greater penetration into the territories controlled by armed groups.
However, methodological issues may limit the value of this information for a VIMS:
• Approach to data collection. Few NGOs or civil society organizations collect information on inci-dents in a consistent and comprehensive fashion, or feed that information into regularly updated quantitative datasets. Most collect qualitative information on specific cases, with an emphasis on emblematic incidents they can use for advo-cacy work. Keeping an exhaustive record of all incidents is not their priority. This makes NGO/CSO data less useful for a VIMS.
• Frequency of publication. NGOs and civil society organizations may publish too infrequently for a VIMS to rely on them.
4.2.4 NGO/CSO reportsLocal NGOs and civil society organizations (CSOs)25 may gather information on violence in general, or on
specific topics (armed conflict, human rights violations, gender-based violence, etc.). They might be a valuable
complementary data source.
NGO
Box 4.1 Crowdseeding vs. crowdsourcing
The crowdseeding approach was designed to overcome the limitations of crowdsourcing (demographic bias and validation issues). Crowdseeding brings technical means and ca-pacity to informants selected from within target communities, provided with cell phones, and trained on how to use them to report. By rely-ing on a finite network of identified and trained informants, crowdseeding mitigates the risk of collecting dubious information. However, the Voix des Kivus experiment in the Democratic Republic of Congo (DRC) points to a number of important conditions for the success of a crowd-seeding system:
• Scale. Small projects can operate at a rela-tively low cost and without major logistical complications. Voix des Kivus operated in 18 villages. However, operating a crowd-seeding system across thousands of villages will require the financial and organizational capacity that only governments or the largest aid organizations can afford. Operating on a large scale is also likely to dilute the trust rela-tionship between field informants and project staff, and decrease the quality of the reporting.
• Security risks. Mobilizing informants to report on sensitive information may expose them to serious security risks. While no infor-mant was threatened during the implementa-tion of Voix des Kivus, this is one reason why the project was discontinued.
• Linkages with response mechanisms. If there is no visible, timely, and effective re-sponse to incident reports, informants and/or participating communities will lose interest in the project, affecting the quality of reporting. Financial incentives, when used as a sub-stitute, may introduce reporting bias. To be sustainable, a crowdseeding system must be closely and effectively linked with institutions able to guarantee the safety of informants and take action on reports.
For more on Voix des Kivus, please refer to Van der Windt and Humphreys (2012).
25
Three basic principles should guide source selection:
1. Prioritize triangulation. Triangulation will not entirely eliminate gaps and biases. Even when several sources type are used in combination, these will inevitably present only a partial picture of violence. Any system will tend to cover homicides and urban violence more comprehen-sively than non-fatal and rural incidents. False negatives and positives are inescapable, but the project team should make every possible effort to minimize them.
2. Be pragmatic. Information in conflict-affected countries or regions is typically scarce or difficult to access. Project teams may struggle to secure enough sources for triangulation. This should not prevent a VIMS from being implemented. Provided the system generates better data than existing datasets, the project team should move ahead. Later, as the system gains visibility, builds an audience, and secures support, more sources may be-come available.
3. Acknowledge limitations. The project team must develop a precise understanding of the limitations of its sources, and therefore of its instrument, take these limitations into account during data analysis, and duly acknowledge them when dissemi-nating outputs.
In most countries, government agencies and in-dependent institutions collect, collate, and publish violence data such as homicide rates. When these data are aggregated at the provincial or national level and/or rely on single indicators (such as number of homicides), their value to a VIMS is low. However, they can be used to triangulate the VIMS data, test its consistency with official figures, and identify possible gaps and reporting biases. In developing countries, and in particular during conflicts or humanitarian crises, UN agencies and aid organizations might collect information on security incidents to protect field staff or inform humanitarian assistance. When these datasets are accessible, they should be used. However, they often focus on armed or collective violence, and underrepresent other forms of violence. Health facilities record fatalities and injuries resulting from violence. Because they collect little information beyond the identity of victims and their injuries, they are more useful for checking and validating data acquired from other sources.Academic articles and books, as well as policy papers, such as those published by organizations like the International Crisis Group or Human Rights Watch, can be used to verify and validate data. Surveys and direct field data collection can provide important information on violent incidents. However, surveys are expensive and collecting follow-up data to update results cannot be done frequently.29
4.2.5 Other sources
OTHERSOURCES
SELECTING SOURCES : SUMMARY OF KEY PRINCIPLES AND GUIDANCE
26
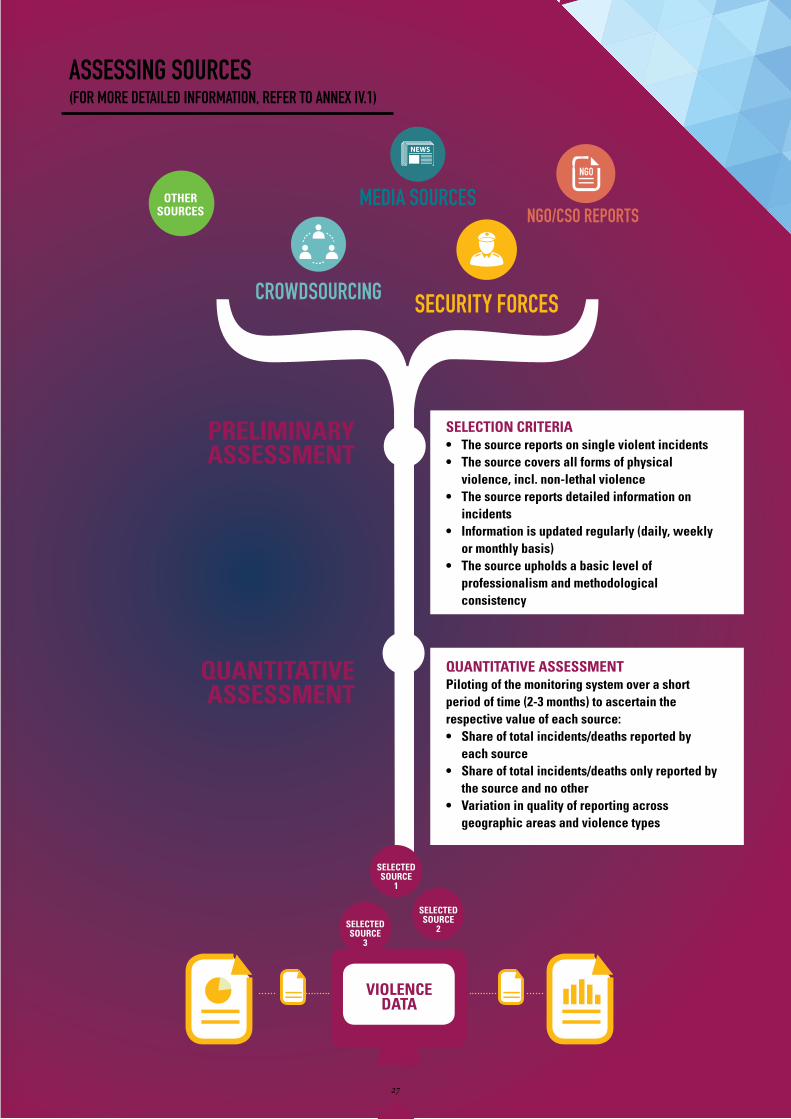
QUANTITATIVE ASSESSMENT Piloting of the monitoring system over a short period of time (2-3 months) to ascertain the respective value of each source:• Share of total incidents/deaths reported by
each source• Share of total incidents/deaths only reported by
the source and no other• Variation in quality of reporting across
geographic areas and violence types
OTHERSOURCES
SELECTION CRITERIA• The source reports on single violent incidents• The source covers all forms of physical
violence, incl. non-lethal violence• The source reports detailed information on
incidents• Information is updated regularly (daily, weekly
or monthly basis)• The source upholds a basic level of
professionalism and methodological consistency
PRELIMINARY ASSESSMENT
QUANTITATIVE ASSESSMENT
MEDIA SOURCES
CROWDSOURCING
VIOLENCE DATA
SELECTED SOURCE
1
SELECTED SOURCE
2
NGO
NGO/CSO REPORTS
ASSESSING SOURCES (FOR MORE DETAILED INFORMATION, REFER TO ANNEX IV.1)
SECURITY FORCES
SELECTED SOURCE
3
27
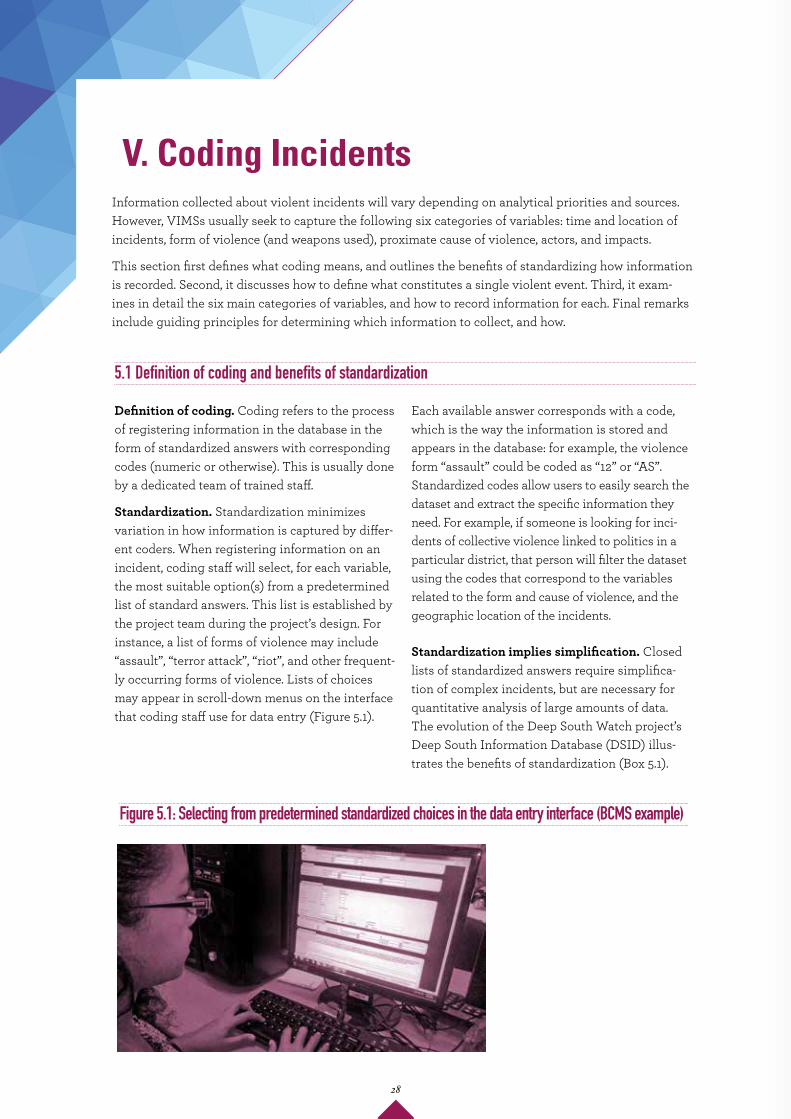
V. Coding Incidents
Definition of coding. Coding refers to the process of registering information in the database in the form of standardized answers with corresponding codes (numeric or otherwise). This is usually done by a dedicated team of trained staff.
Standardization. Standardization minimizes variation in how information is captured by differ-ent coders. When registering information on an incident, coding staff will select, for each variable, the most suitable option(s) from a predetermined list of standard answers. This list is established by the project team during the project’s design. For instance, a list of forms of violence may include “assault”, “terror attack”, “riot”, and other frequent-ly occurring forms of violence. Lists of choices may appear in scroll-down menus on the interface that coding staff use for data entry (Figure 5.1).
Information collected about violent incidents will vary depending on analytical priorities and sources. However, VIMSs usually seek to capture the following six categories of variables: time and location of incidents, form of violence (and weapons used), proximate cause of violence, actors, and impacts.
This section first defines what coding means, and outlines the benefits of standardizing how information is recorded. Second, it discusses how to define what constitutes a single violent event. Third, it exam-ines in detail the six main categories of variables, and how to record information for each. Final remarks include guiding principles for determining which information to collect, and how.
Each available answer corresponds with a code, which is the way the information is stored and appears in the database: for example, the violence form “assault” could be coded as “12” or “AS”. Standardized codes allow users to easily search the dataset and extract the specific information they need. For example, if someone is looking for inci-dents of collective violence linked to politics in a particular district, that person will filter the dataset using the codes that correspond to the variables related to the form and cause of violence, and the geographic location of the incidents.
Standardization implies simplification. Closed lists of standardized answers require simplifica-tion of complex incidents, but are necessary for quantitative analysis of large amounts of data. The evolution of the Deep South Watch project’s Deep South Information Database (DSID) illus-trates the benefits of standardization (Box 5.1).
5.1 Definition of coding and benefits of standardization
Figure 5.1: Selecting from predetermined standardized choices in the data entry interface (BCMS example)
28
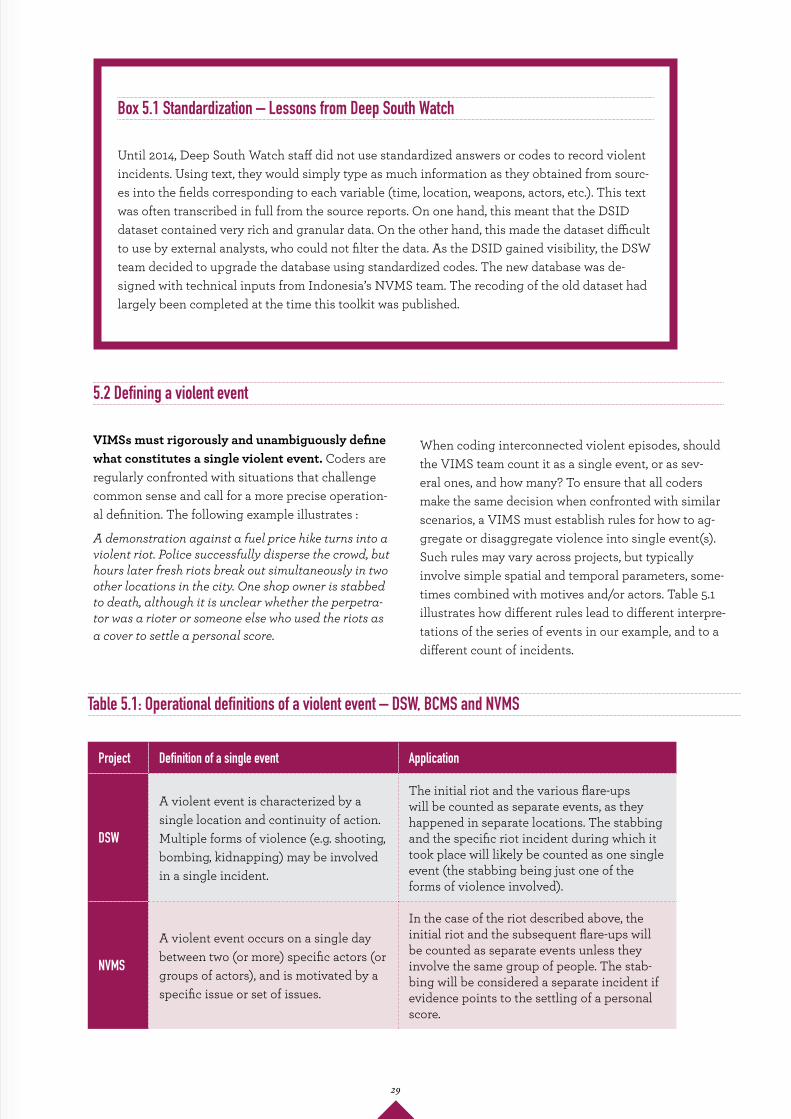
Box 5.1 Standardization – Lessons from Deep South Watch
Until 2014, Deep South Watch staff did not use standardized answers or codes to record violent incidents. Using text, they would simply type as much information as they obtained from sourc-es into the fields corresponding to each variable (time, location, weapons, actors, etc.). This text was often transcribed in full from the source reports. On one hand, this meant that the DSID dataset contained very rich and granular data. On the other hand, this made the dataset difficult to use by external analysts, who could not filter the data. As the DSID gained visibility, the DSW team decided to upgrade the database using standardized codes. The new database was de-signed with technical inputs from Indonesia’s NVMS team. The recoding of the old dataset had largely been completed at the time this toolkit was published.
5.2 Defining a violent event
VIMSs must rigorously and unambiguously define what constitutes a single violent event. Coders are regularly confronted with situations that challenge common sense and call for a more precise operation-al definition. The following example illustrates :
A demonstration against a fuel price hike turns into a violent riot. Police successfully disperse the crowd, but hours later fresh riots break out simultaneously in two other locations in the city. One shop owner is stabbed to death, although it is unclear whether the perpetra-tor was a rioter or someone else who used the riots as a cover to settle a personal score.
When coding interconnected violent episodes, should the VIMS team count it as a single event, or as sev-eral ones, and how many? To ensure that all coders make the same decision when confronted with similar scenarios, a VIMS must establish rules for how to ag-gregate or disaggregate violence into single event(s). Such rules may vary across projects, but typically involve simple spatial and temporal parameters, some-times combined with motives and/or actors. Table 5.1 illustrates how different rules lead to different interpre-tations of the series of events in our example, and to a different count of incidents.
Table 5.1: Operational definitions of a violent event – DSW, BCMS and NVMS
Project Definition of a single event Application
DSW
A violent event is characterized by a single location and continuity of action. Multiple forms of violence (e.g. shooting, bombing, kidnapping) may be involved in a single incident.
The initial riot and the various flare-ups will be counted as separate events, as they happened in separate locations. The stabbing and the specific riot incident during which it took place will likely be counted as one single event (the stabbing being just one of the forms of violence involved).
NVMS
A violent event occurs on a single day between two (or more) specific actors (or groups of actors), and is motivated by a specific issue or set of issues.
In the case of the riot described above, the initial riot and the subsequent flare-ups will be counted as separate events unless they involve the same group of people. The stab-bing will be considered a separate incident if evidence points to the settling of a personal score.
29
This toolkit proposes the following definition, which is simple and intuitive:
Definition of a violent event: an incident where physical force is used intentional-ly by a person or a group against another person or group, at a specific location and date, and in a way that involves continuity of action.
This definition can be broken down into the following constitutive elements:1. Intentional use of physical force. This refers to the proposed event inclusion criteria given in Section III (Box 3.2). All forms of physical violence—lethal or non-lethal—are monitored, with the exception of non-intentional and self-inflicted violence.
2. Person or group. Any person or group, regardless of their affiliation with formal or informal organizations.
3. Specific location. The location is identified by a corresponding name and administrative code and, when possible, latitude and longitude coordinates.
4. Specific date. Events happen at a specific time on a specific day. A single event might unfold over an extended period of time, within the same day, provided the action is uninterrupted. An event cannot extend across several days. In that case, separate events should be recorded for each day of action.
5. Continuity of action. When violent action is interrupted to resume later at the same location or a different one, even when this happens within the same day, each episode should be coded as a separate event.
Forms, causes, and actors: A single event may be associated with multiple forms of violence, actors, or motives. For example, a riot about fuel subsidies might lead to clashes between protesters and police and then spill over into the looting of ethnic minority-owned shops. Because the action is continuous, this will be counted as a single event. Defining incidents based on single actors, violence forms, or motives may break up continuous events and fail to capture the complexity and propensity of violence to evolve or escalate rapidly.
Incident ID: Each single incident is assigned a distinctive identification code in the dataset. These ID codes are typically system-generated in order to avoid human errors such as duplication (assignment of the same code to two distinct incidents).
PROPOSED DEFINITION OF A VIOLENT EVENT
30
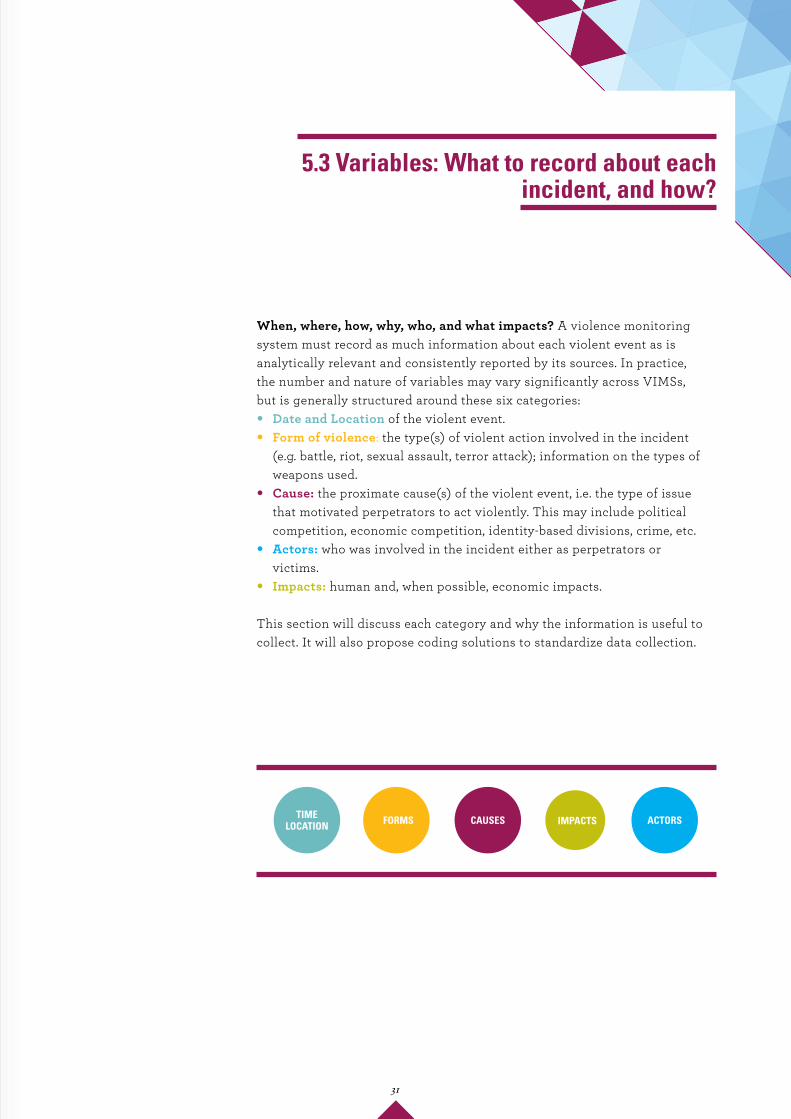
When, where, how, why, who, and what impacts? A violence monitoring system must record as much information about each violent event as is analytically relevant and consistently reported by its sources. In practice, the number and nature of variables may vary significantly across VIMSs, but is generally structured around these six categories:
• Date and Location of the violent event. • Form of violence: the type(s) of violent action involved in the incident
(e.g. battle, riot, sexual assault, terror attack); information on the types of weapons used.
• Cause: the proximate cause(s) of the violent event, i.e. the type of issue that motivated perpetrators to act violently. This may include political competition, economic competition, identity-based divisions, crime, etc.
• Actors: who was involved in the incident either as perpetrators or victims.
• Impacts: human and, when possible, economic impacts.
This section will discuss each category and why the information is useful to collect. It will also propose coding solutions to standardize data collection.
5.3 Variables: What to record about each incident, and how?
IMPACTSTIME LOCATION ACTORSCAUSESFORMS
31
Analytical value. Time and location are important parameters in the definition of an event. They are key variables allowing for diachronic and cross-sectional analysis of patterns of violence. They also enable the geocoding and mapping of incidents, and should be recorded with as much precision as sources allow.
Coding time and location. The date and time of an event will usually be recorded numerically (DDM-MYYYY 00:00), using the date and time about which most sources agree. The location information must be broken down to the smallest possible administra-tive level (village, hamlet, or ward ). To make it easier to use VIMS data in combination with other datasets, official administrative codes from the government statistics agency or other government institutions should be used for locations. When available, the global positioning system (GPS) geolocation of an incident (or the nearest identifiable location) will be particularly useful for visualization on a map.
5.3.1 Time and location
TIME LOCATION
Example: Using codes from Indonesia’s Central Statistics Agency, the NVMS records a separate code for each adminis-trative level – province, district, sub-district, and village – where each incident occurs. The BCMS uses the Philippine Standard Geographic Code system—nine digits indicating the region, province, municipal-ity/city, and barangay (village or ward). In addition to administrative codes, the DSW assigns two sets of GPS geolocations to most incidents: one from the military, and one assigned by the DSW team.
32
Analytical value. Information on the form that violence takes and the types of weapons used (see Weapons below) helps distinguish between cat-egories of violence that may command different policy responses: for example, between collective violence and interpersonal violence, or between lethal and more benign forms of violence.
Coding forms of violence. Incidents are usual-ly assigned one or more violence forms from a pre-established list, with a specific numeric code for each. Table 5.2 provides an indicative list of Form categories, and corresponding definitions. This table offers basic analytical compatibility with most global violence datasets, although these might monitor a narrower range of violence forms (such as battles, violence against civilians, demon-strations/riots, and terror attacks).31
In establishing this list and defining each Form category, three main parameters were used:
• Size of groups involved: Certain forms of vi-olence are defined as being perpetrated by indi-viduals or small groups; others by large groups. Project teams may decide to define with greater precision what constitutes a small group (e.g. up to 5 individuals, or up to 10) and a large one (over 5 or over 10). This toolkit recommends caution in using overly rigid definitions and thresholds. Other parameters will help ascer-tain which of the proposed Form categories is the best match for a particular incident.
• One-sided or two-sided violence: One-sided violence refers to incidents where violence is inflicted by an individual or group upon anoth-er, and a clear distinction between perpetrators and victims can be made. Two-sided violence refers to incidents where two individuals or groups engage in violence against each other, and no clear distinction can be made between perpetrators and victims.
• Level of organization: Organized group refers to a cohesive group identified by a name and/or a command structure, and assembled for a collective ideological or political purpose (e.g. separatist movement, terrorist organization, mili-tia). Informally organized group refers to a more loosely structured group whose existence may be transitory, but which is assembled for a discern-ible collective purpose, and whose members identify with during the commission of a violent act or a series of violent actions. Mob refers to a large group of individuals assembled on the spot during the commission of a single violent action, without any durable collective purpose.32
Collective vs. interpersonal violence. Analysts may have an interest in disaggregating the data along the broader categories of violence often used in the international literature on conflict and violence prevention, such as collective violence and interpersonal violence. The WHO’s definition for these categories combines references to the size of groups involved (individual, small groups, or large groups), their collective identity (or lack thereof), and the purpose of the violence (Box 5.3). The definitions for some of the Form catego-ries listed above match the WHO’s definition for collective violence : for example, Battle, Violence Against Civilians or Violent Demonstration, are always associated with collective violence. Other violence forms could be associated with either collective or interpersonal violence. In these cases, analysts will have to use Form categories in combination with Cause and Actor variables (Section 5.3.3 and 5.3.4) to determine which of the WHO’s categories should be used to categorize specific incidents.
5.3.2 Form(s) of violenceDefinition. Form refers to the type of violent action involved in an incident.30
FORMS
33
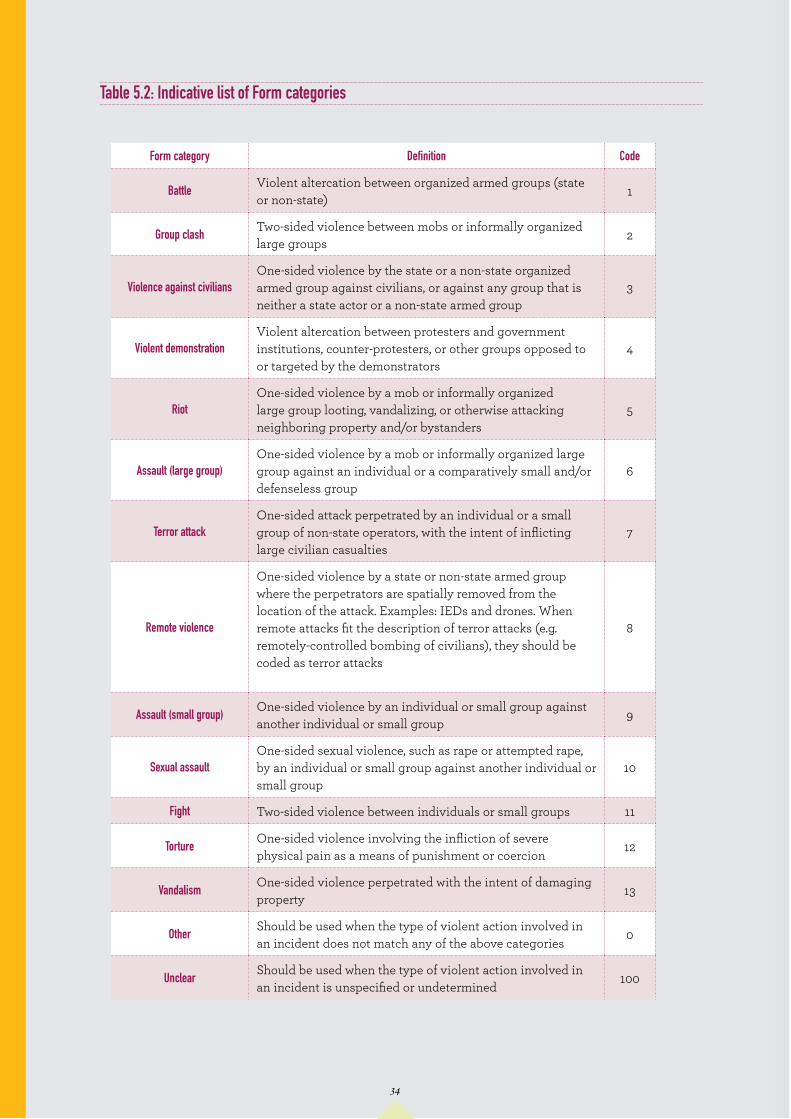
Form category Definition Code
BattleViolent altercation between organized armed groups (state or non-state)
1
Group clashTwo-sided violence between mobs or informally organized large groups
2
Violence against civiliansOne-sided violence by the state or a non-state organized armed group against civilians, or against any group that is neither a state actor or a non-state armed group
3
Violent demonstration Violent altercation between protesters and government institutions, counter-protesters, or other groups opposed to or targeted by the demonstrators
4
Riot One-sided violence by a mob or informally organized large group looting, vandalizing, or otherwise attacking neighboring property and/or bystanders
5
Assault (large group)One-sided violence by a mob or informally organized large group against an individual or a comparatively small and/or defenseless group
6
Terror attackOne-sided attack perpetrated by an individual or a small group of non-state operators, with the intent of inflicting large civilian casualties
7
Remote violence
One-sided violence by a state or non-state armed group where the perpetrators are spatially removed from the location of the attack. Examples: IEDs and drones. When remote attacks fit the description of terror attacks (e.g. remotely-controlled bombing of civilians), they should be coded as terror attacks
8
Assault (small group)One-sided violence by an individual or small group against another individual or small group
9
Sexual assaultOne-sided sexual violence, such as rape or attempted rape, by an individual or small group against another individual or small group
10
Fight Two-sided violence between individuals or small groups 11
TortureOne-sided violence involving the infliction of severe physical pain as a means of punishment or coercion
12
VandalismOne-sided violence perpetrated with the intent of damaging property
13
OtherShould be used when the type of violent action involved in an incident does not match any of the above categories
0
UnclearShould be used when the type of violent action involved in an incident is unspecified or undetermined
100
Table 5.2: Indicative list of Form categories
34
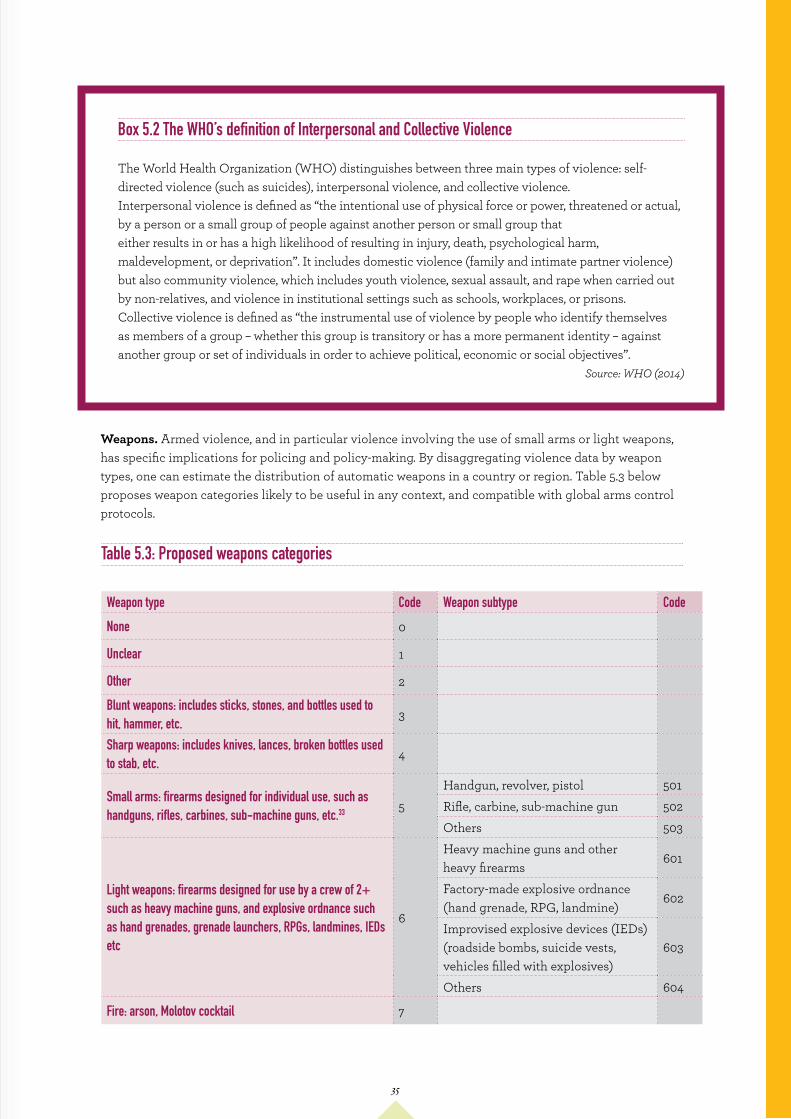
Weapons. Armed violence, and in particular violence involving the use of small arms or light weapons, has specific implications for policing and policy-making. By disaggregating violence data by weapon types, one can estimate the distribution of automatic weapons in a country or region. Table 5.3 below proposes weapon categories likely to be useful in any context, and compatible with global arms control protocols.
Table 5.3: Proposed weapons categories
Weapon type Code Weapon subtype Code
None 0
Unclear 1
Other 2
Blunt weapons: includes sticks, stones, and bottles used to hit, hammer, etc.
3
Sharp weapons: includes knives, lances, broken bottles used to stab, etc.
4
Small arms: firearms designed for individual use, such as handguns, rifles, carbines, sub-machine guns, etc.33 5
Handgun, revolver, pistol 501Rifle, carbine, sub-machine gun 502Others 503
Light weapons: firearms designed for use by a crew of 2+ such as heavy machine guns, and explosive ordnance such as hand grenades, grenade launchers, RPGs, landmines, IEDs etc
6
Heavy machine guns and other heavy firearms
601
Factory-made explosive ordnance (hand grenade, RPG, landmine)
602
Improvised explosive devices (IEDs) (roadside bombs, suicide vests, vehicles filled with explosives)
603
Others 604
Fire: arson, Molotov cocktail 7
Box 5.2 The WHO’s definition of Interpersonal and Collective Violence The World Health Organization (WHO) distinguishes between three main types of violence: self-directed violence (such as suicides), interpersonal violence, and collective violence. Interpersonal violence is defined as “the intentional use of physical force or power, threatened or actual, by a person or a small group of people against another person or small group thateither results in or has a high likelihood of resulting in injury, death, psychological harm, maldevelopment, or deprivation”. It includes domestic violence (family and intimate partner violence) but also community violence, which includes youth violence, sexual assault, and rape when carried out by non-relatives, and violence in institutional settings such as schools, workplaces, or prisons. Collective violence is defined as “the instrumental use of violence by people who identify themselves as members of a group – whether this group is transitory or has a more permanent identity – against another group or set of individuals in order to achieve political, economic or social objectives”.
Source: WHO (2014)
35
Analytical value and limitations. Better understand-ing why violence happens, and which issues tend to lead to collective or deadly violence, can improve the state response and prevention measures. Government counterparts value information on drivers of violence, as their own data collection systems, such as police data, may only focus on aspects relevant to the penal code (form of violence, weapons used, actors). At the same time, violence data has limitations when it comes to identifying causes. VIMSs capture proximate causes of violent events (the issue that appears to have motivated perpetrators to act violently, based on source materials), not their ultimate causes (the underlying social, economic, or institutional factors that created the conditions for violence to happen). Even capturing proximate causes can be problematic. Sources will often be vague on the motive behind a violent event, and it will be difficult for coders to determine when the attributed motives are grounded in evidence, and when they are pure speculation. Coders may also face situa-tions where different sources present different interpre-tations. This has two practical implications:
• Coders should only record causes that are explicitly mentioned by sources, and about which there appears to be consensus.
• The project team should be cautious about its interpretation of the causes of violence. To ascertain causality, violence data should be used in combination with other approaches, such as qualitative field research or econometric analysis.
Coding causes. Similar to forms, violent events are usually assigned one or more Cause categories from a pre-established list, with a specific numeric code for each.35 Box 5.4 discusses two approaches to establishing lists of Cause categories.
Box 5.3 Deductive versus inductive approaches to establishing Cause categories
In the deductive approach, the project team will use insights from the literature and empirical experience to identify generic types of issues that tend to lead to violence (political competition, eco-nomic competition, ethnic or religious divisions, etc.). They will then break down these generic categories into more specific and concrete subcategories (competition over elections, religious identity, etc.).
The inductive approach starts from the reality on the ground, listing most common drivers of violence in the study area, and grouping them as needed into more abstract and globally relevant categories.
5.3.3 Causes of violenceDefinition. Cause refers to the proximate cause of an incident—the type of issue that motivated perpetrators to act violently.34 For example, this may include political competition or religious divisions.
CAUSES
36
Balancing universality and context-specificity in a single coding system. In practice, establishing lists of Cause categories will likely involve combining deductive and inductive approaches. Thus, the categories for causes deduced from theories of violence are adjusted to match the reality of a specific context, and categories inferred from context are integrated into a universal theoretical framework. This will allow establishing a list of codes that is, at the same time, both globally and locally relevant. To that effect, this toolkit recommends a two-tiered system for coding causes:
• Main Cause categories. Incidents are first assigned a cause from a list of broad generic categories (e.g. polit-ical competition, economic competition, identity) that correspond to the most common drivers of violence identified in the literature, and offer a basic level of compatibility with global violence datasets.
• Subcategories. Within each main category, incidents can be assigned a subcategory referring to a more precise type of violence driver (e.g. competition over elections, religious identity, ethnic identity, etc.). This will enable a more refined analysis. Subcategories can also be used to track violence drivers that are specific to the country or region under study.
Table 5.4 illustrates. Main categories and their defini-tions are merely suggestions. Project teams may use them as a basis to establish their own system. High-lighted subcategories are examples of country-specific violence causes, drawn from a monitoring system under development in Nepal.
The proposed list of categories first separates out armed conflict—defined as protracted armed violence between states and/or non-state organized armed groups—from other violence types. This category refers as much to violence forms and actor types as to vio-lence drivers, but it allows data users to easily separate out a type of violence of particular interest to the users of most cross-country datasets.36
Violence outside of the context of armed conflict is broken down into the basic types of issues driving violence. Some of these Cause categories, such as political and economic competition, or identity, refer to drivers which the WHO associates with collective vio-lence (Box 5.4). Others, such as crime or gender-based violence, point to drivers associated with interpersonal violence. Used in combination with the Form and Actor categories, the Cause variable will help researchers to disaggregate the data accordingly.
Multiple causes. The project team must decide wheth-er coders can assign more than one cause to a single incident. Ascribing multiple causes to an incident will allow greater flexibility and more accurately reflect the complex nature of violence. Assigning up to two different causes, ranked by importance, is a reasonable solution.
37
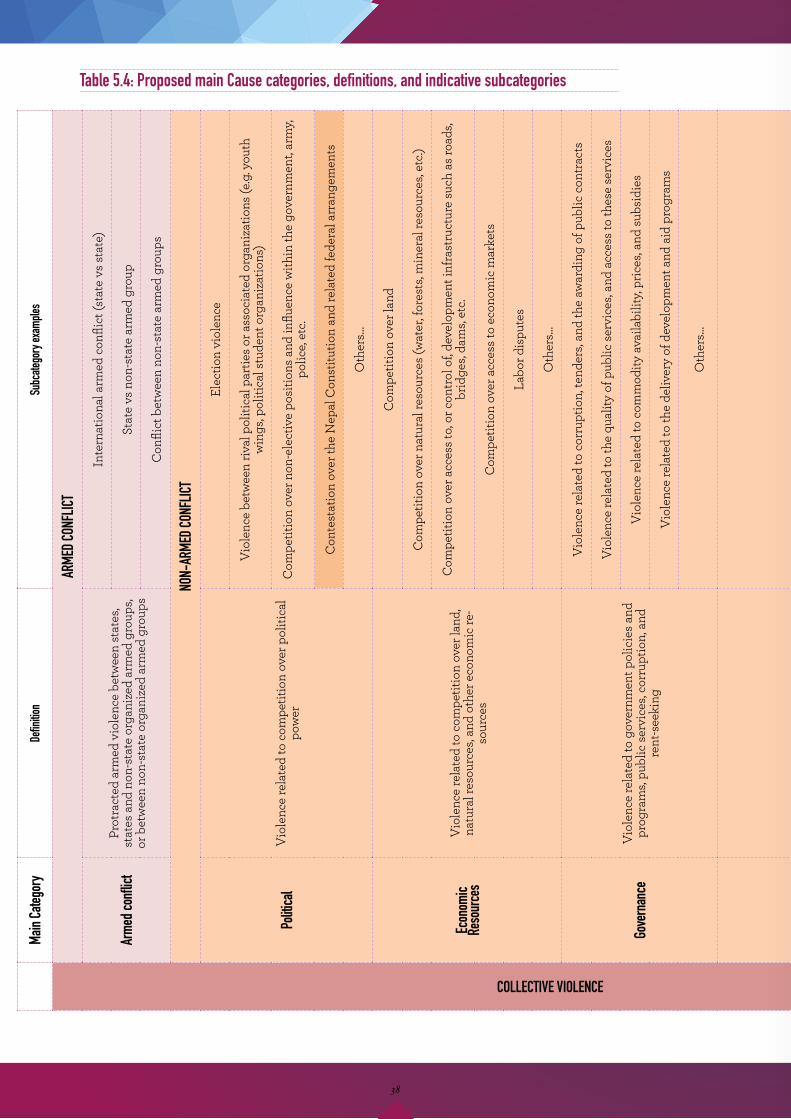
Main
Categ
ory
Defin
ition
Subc
atego
ry ex
ample
s
COLLECTIVE VIOLENCE
ARME
D CON
FLICT
Arme
d con
flict
Prot
ract
ed a
rmed
vio
lenc
e be
twee
n st
ates
, st
ates
and
non
-sta
te o
rgan
ized
arm
ed g
roup
s, or
bet
wee
n no
n-st
ate
orga
nize
d ar
med
gro
ups
Inte
rnat
iona
l arm
ed c
onfli
ct (s
tate
vs s
tate
)
Stat
e vs
non
-sta
te a
rmed
gro
up
Con
flict
bet
wee
n no
n-st
ate
arm
ed g
roup
s
NON-
ARME
D CON
FLICT
Politi
cal
Vio
lenc
e re
late
d to
com
petit
ion
over
pol
itica
l po
wer
Elec
tion
viol
ence
Vio
lenc
e be
twee
n riv
al p
oliti
cal p
artie
s or a
ssoc
iate
d or
gani
zatio
ns (e
.g. y
outh
w
ings
, pol
itica
l stu
dent
org
aniz
atio
ns)
Com
petit
ion
over
non
-ele
ctiv
e po
sitio
ns a
nd in
fluen
ce w
ithin
the
gove
rnm
ent,
arm
y, po
lice,
etc.
Con
test
atio
n ov
er th
e N
epal
Con
stitu
tion
and
rela
ted
fede
ral a
rran
gem
ents
Oth
ers…
Econ
omic
Reso
urce
sV
iole
nce
rela
ted
to c
ompe
titio
n ov
er la
nd,
natu
ral r
esou
rces
, and
oth
er e
cono
mic
re-
sour
ces
Com
petit
ion
over
land
Com
petit
ion
over
nat
ural
reso
urce
s (w
ater
, for
ests
, min
eral
reso
urce
s, et
c.)
Com
petit
ion
over
acc
ess t
o, o
r con
trol
of,
deve
lopm
ent i
nfra
stru
ctur
e su
ch a
s roa
ds,
brid
ges,
dam
s, et
c.
Com
petit
ion
over
acc
ess t
o ec
onom
ic m
arke
ts
Labo
r dis
pute
s
Oth
ers…
Gove
rnan
ceV
iole
nce
rela
ted
to g
over
nmen
t pol
icie
s and
pr
ogra
ms,
publ
ic se
rvic
es, c
orru
ptio
n, a
nd
rent
-see
king
Vio
lenc
e re
late
d to
cor
rupt
ion,
tend
ers,
and
the
awar
ding
of p
ublic
con
trac
ts
Vio
lenc
e re
late
d to
the
qual
ity o
f pub
lic se
rvic
es, a
nd a
cces
s to
thes
e se
rvic
es
Vio
lenc
e re
late
d to
com
mod
ity a
vaila
bilit
y, pr
ices
, and
subs
idie
s
Vio
lenc
e re
late
d to
the
deliv
ery
of d
evel
opm
ent a
nd a
id p
rogr
ams
Oth
ers…
Identi
tyV
iole
nce
rela
ted
to g
roup
iden
titie
s oth
er
than
gen
der (
ethn
icity
, rel
igio
n, c
aste
, etc
.)
Ethn
ic-b
ased
vio
lenc
e
Vio
lenc
e re
late
d to
relig
ious
iden
tity
Vio
lenc
e re
late
d to
regi
onal
iden
titie
s
Mig
ratio
n-re
late
d vi
olen
ce
Rela
ted
to d
iscr
imin
atio
n su
ch a
s aga
inst
Dal
its (“
Unt
ouch
able
” cas
te)
Vio
lenc
e re
late
d to
oth
er g
roup
iden
titie
s
Crim
eV
iole
nce
rela
ted
to c
rimin
al a
ctiv
ity, o
r ex-
tra-
judi
cial
resp
onse
to c
rime
Rela
ted
to o
rgan
ized
crim
e an
d ill
egal
trad
e (d
rugs
, arm
s, sm
uggl
ing,
gan
g vi
olen
ce)
Kid
napp
ing
for r
anso
m
Robb
ery/
viol
ent t
heft
Extr
a-ju
dici
al re
spon
se to
crim
e (e
.g. l
ynch
ing
of a
thie
f by
civi
lians
)
Oth
ers…
Gend
er-ba
sed
violen
ceV
iole
nce
targ
etin
g in
divi
dual
s or g
roup
s on
the
basi
s of t
heir
gend
er
Rape
/sex
ual a
ssau
lt
Gen
der-b
ased
hum
an tr
affick
ing
Dom
estic
vio
lenc
e
Oth
ers…
Pers
onal
issue
sV
iole
nce
perp
etra
ted
by in
divi
dual
s or s
mal
l gro
ups o
f civ
ilian
s for
per
sona
l rea
sons
Lega
l Int
erve
ntion
Vio
lenc
e pe
rpet
rate
d by
secu
rity
forc
es in
the
cour
se o
f the
ir offi
cial
dut
ies
Othe
rSh
ould
be
used
whe
n th
e is
sue
at st
ake
in a
n in
cide
nt is
iden
tified
but
doe
s not
fit a
ny o
f the
abo
ve c
ateg
orie
s
Uncle
arSh
ould
be
used
whe
n th
e is
sue
at st
ake
in a
n in
cide
nt is
und
eter
min
ed/u
nspe
cifie
d
Table 5.4: Proposed main Cause categories, definitions, and indicative subcategories
38
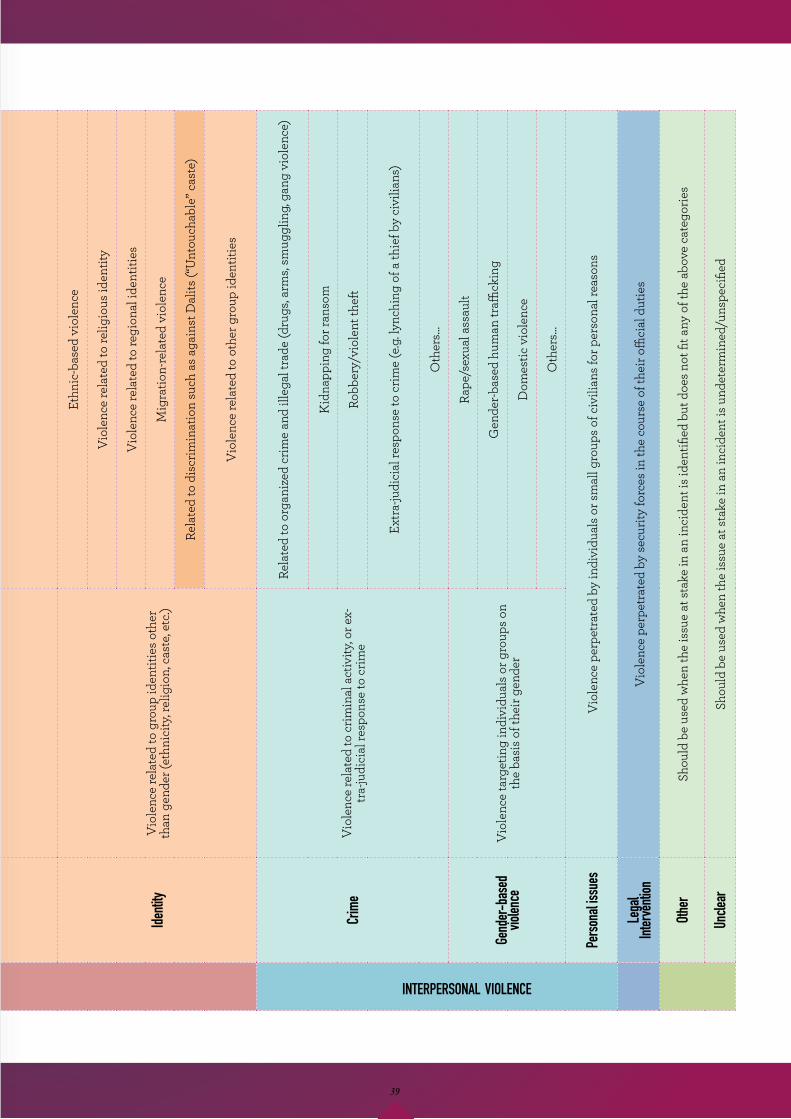
Main
Categ
ory
Defin
ition
Subc
atego
ry ex
ample
s
COLLECTIVE VIOLENCE
ARME
D CON
FLICT
Arme
d con
flict
Prot
ract
ed a
rmed
vio
lenc
e be
twee
n st
ates
, st
ates
and
non
-sta
te o
rgan
ized
arm
ed g
roup
s, or
bet
wee
n no
n-st
ate
orga
nize
d ar
med
gro
ups
Inte
rnat
iona
l arm
ed c
onfli
ct (s
tate
vs s
tate
)
Stat
e vs
non
-sta
te a
rmed
gro
up
Con
flict
bet
wee
n no
n-st
ate
arm
ed g
roup
s
NON-
ARME
D CON
FLICT
Politi
cal
Vio
lenc
e re
late
d to
com
petit
ion
over
pol
itica
l po
wer
Elec
tion
viol
ence
Vio
lenc
e be
twee
n riv
al p
oliti
cal p
artie
s or a
ssoc
iate
d or
gani
zatio
ns (e
.g. y
outh
w
ings
, pol
itica
l stu
dent
org
aniz
atio
ns)
Com
petit
ion
over
non
-ele
ctiv
e po
sitio
ns a
nd in
fluen
ce w
ithin
the
gove
rnm
ent,
arm
y, po
lice,
etc.
Con
test
atio
n ov
er th
e N
epal
Con
stitu
tion
and
rela
ted
fede
ral a
rran
gem
ents
Oth
ers…
Econ
omic
Reso
urce
sV
iole
nce
rela
ted
to c
ompe
titio
n ov
er la
nd,
natu
ral r
esou
rces
, and
oth
er e
cono
mic
re-
sour
ces
Com
petit
ion
over
land
Com
petit
ion
over
nat
ural
reso
urce
s (w
ater
, for
ests
, min
eral
reso
urce
s, et
c.)
Com
petit
ion
over
acc
ess t
o, o
r con
trol
of,
deve
lopm
ent i
nfra
stru
ctur
e su
ch a
s roa
ds,
brid
ges,
dam
s, et
c.
Com
petit
ion
over
acc
ess t
o ec
onom
ic m
arke
ts
Labo
r dis
pute
s
Oth
ers…
Gove
rnan
ceV
iole
nce
rela
ted
to g
over
nmen
t pol
icie
s and
pr
ogra
ms,
publ
ic se
rvic
es, c
orru
ptio
n, a
nd
rent
-see
king
Vio
lenc
e re
late
d to
cor
rupt
ion,
tend
ers,
and
the
awar
ding
of p
ublic
con
trac
ts
Vio
lenc
e re
late
d to
the
qual
ity o
f pub
lic se
rvic
es, a
nd a
cces
s to
thes
e se
rvic
es
Vio
lenc
e re
late
d to
com
mod
ity a
vaila
bilit
y, pr
ices
, and
subs
idie
s
Vio
lenc
e re
late
d to
the
deliv
ery
of d
evel
opm
ent a
nd a
id p
rogr
ams
Oth
ers…
Identi
tyV
iole
nce
rela
ted
to g
roup
iden
titie
s oth
er
than
gen
der (
ethn
icity
, rel
igio
n, c
aste
, etc
.)
Ethn
ic-b
ased
vio
lenc
e
Vio
lenc
e re
late
d to
relig
ious
iden
tity
Vio
lenc
e re
late
d to
regi
onal
iden
titie
s
Mig
ratio
n-re
late
d vi
olen
ce
Rela
ted
to d
iscr
imin
atio
n su
ch a
s aga
inst
Dal
its (“
Unt
ouch
able
” cas
te)
Vio
lenc
e re
late
d to
oth
er g
roup
iden
titie
s
Crim
eV
iole
nce
rela
ted
to c
rimin
al a
ctiv
ity, o
r ex-
tra-
judi
cial
resp
onse
to c
rime
Rela
ted
to o
rgan
ized
crim
e an
d ill
egal
trad
e (d
rugs
, arm
s, sm
uggl
ing,
gan
g vi
olen
ce)
Kid
napp
ing
for r
anso
m
Robb
ery/
viol
ent t
heft
Extr
a-ju
dici
al re
spon
se to
crim
e (e
.g. l
ynch
ing
of a
thie
f by
civi
lians
)
Oth
ers…
Gend
er-ba
sed
violen
ceV
iole
nce
targ
etin
g in
divi
dual
s or g
roup
s on
the
basi
s of t
heir
gend
er
Rape
/sex
ual a
ssau
lt
Gen
der-b
ased
hum
an tr
affick
ing
Dom
estic
vio
lenc
e
Oth
ers…
Pers
onal
issue
sV
iole
nce
perp
etra
ted
by in
divi
dual
s or s
mal
l gro
ups o
f civ
ilian
s for
per
sona
l rea
sons
Lega
l Int
erve
ntion
Vio
lenc
e pe
rpet
rate
d by
secu
rity
forc
es in
the
cour
se o
f the
ir offi
cial
dut
ies
Othe
rSh
ould
be
used
whe
n th
e is
sue
at st
ake
in a
n in
cide
nt is
iden
tified
but
doe
s not
fit a
ny o
f the
abo
ve c
ateg
orie
s
Uncle
arSh
ould
be
used
whe
n th
e is
sue
at st
ake
in a
n in
cide
nt is
und
eter
min
ed/u
nspe
cifie
d
INTERPERSONAL VIOLENCE
39
Analytical value and limitations. Identifying perpetrators and victims, and what demographic or social groups they belong to, allows analysis of which groups and communities are more likely to engage in violence or be targeted. A system’s sources will deter-mine the level of information that can be collected on Actors (Box 5.5).
Differentiating perpetrators from victims. These categories may be blurry, especially in cases of two-sided violence, such as in a clash between two ri-val armed groups. Both are then considered perpetra-tors. For this reason, it will be helpful to first identify whether an incident involves one-sided or two-sided violence (See 5.3.2 Forms of violence). When the vio-lence is unilateral, perpetrator and victim information must be differentiated.
5.3.4 ActorsDefinition. Actors include both the perpetrators and victims of violent acts. Perpetrators are those who commit an act of violence. Victims are those targeted or harmed by the act of violence.
Examples:
The NVMS records two actor groups, numbered Actor 1 and Actor 2. In cases of one-sided violence, perpetrator data are recorded under Actor 1, and victim infor-mation under Actor 2. In cases of two-sid-ed violence, Actors 1 and 2 are equally considered perpetrators. The DSW uses separate templates to record information on perpetrators and victims.
Coding actors. The dataset should record the number of individuals in each actor group, and their most relevant group affiliation (e.g. membership in an ethnic group if this identity is relevant to the in-cident). Lists of group affiliations are too context-de-pendent for this toolkit to propose a standardized set.37 However, Table 5.5 suggests generic categories as a starting point.
Coding for specific organizations. Under each cate-gory, specific codes can be established for the groups most often involved in violence in a specific context. For example, in Myanmar, Actor code “100” could refer to non-state armed group, and associated sub-codes 101, 102, 103, and so on, could refer to specific active armed groups (the Kachin Indepen-dence Army, Karen National Union, Shan State Army-South, etc.). Similarly, specific codes could be attributed to political parties, religious organi-zations, criminal organizations, and other groups most often engaged in, or targeted by, violence.
Personal information. Personal information on vic-tims and perpetrators of violence might have value. For instance, victims’ data might be used to verify the accuracy of existing or future targeted compen-sation programs.38 Personal information can identify perpetrators or victims involved in multiple events. On the other hand, this personal data should be kept confidential and erased from the public version of the dataset. The master database must also be pro-tected (for example, the BCMS encrypts it).
ACTORS
40
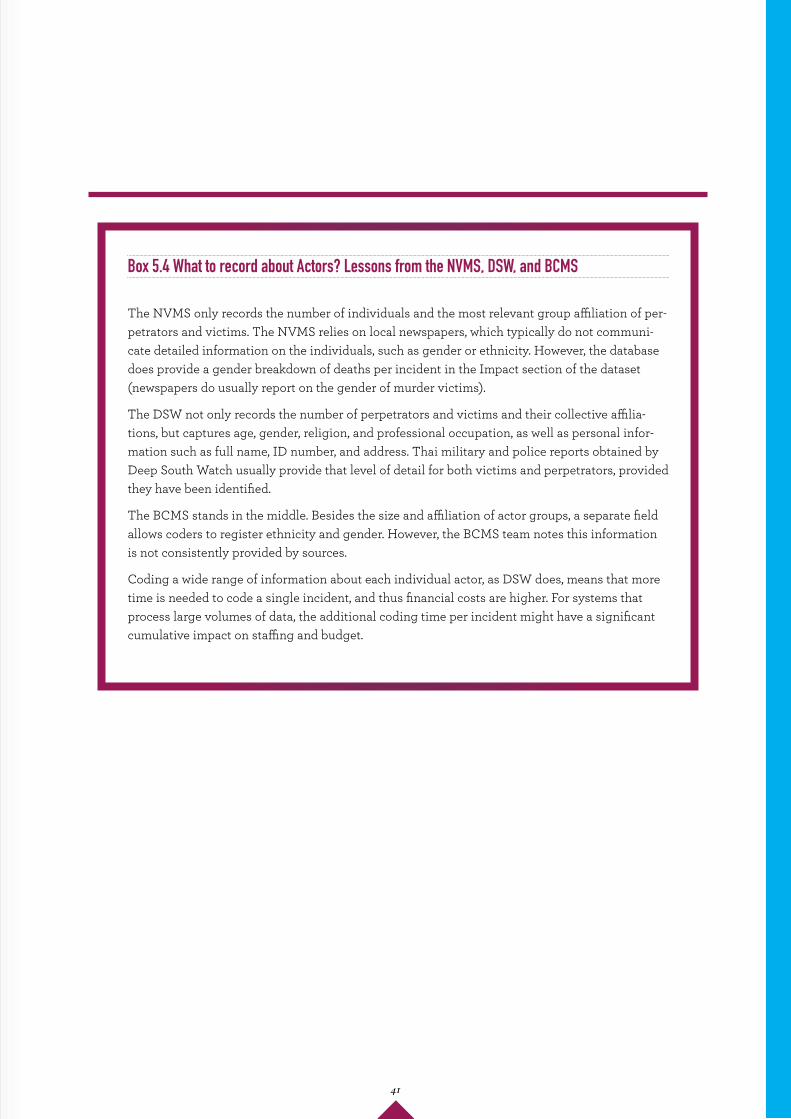
Box 5.4 What to record about Actors? Lessons from the NVMS, DSW, and BCMS
The NVMS only records the number of individuals and the most relevant group affiliation of per-petrators and victims. The NVMS relies on local newspapers, which typically do not communi-cate detailed information on the individuals, such as gender or ethnicity. However, the database does provide a gender breakdown of deaths per incident in the Impact section of the dataset (newspapers do usually report on the gender of murder victims).
The DSW not only records the number of perpetrators and victims and their collective affilia-tions, but captures age, gender, religion, and professional occupation, as well as personal infor-mation such as full name, ID number, and address. Thai military and police reports obtained by Deep South Watch usually provide that level of detail for both victims and perpetrators, provided they have been identified.
The BCMS stands in the middle. Besides the size and affiliation of actor groups, a separate field allows coders to register ethnicity and gender. However, the BCMS team notes this information is not consistently provided by sources.
Coding a wide range of information about each individual actor, as DSW does, means that more time is needed to code a single incident, and thus financial costs are higher. For systems that process large volumes of data, the additional coding time per incident might have a significant cumulative impact on staffing and budget.
41
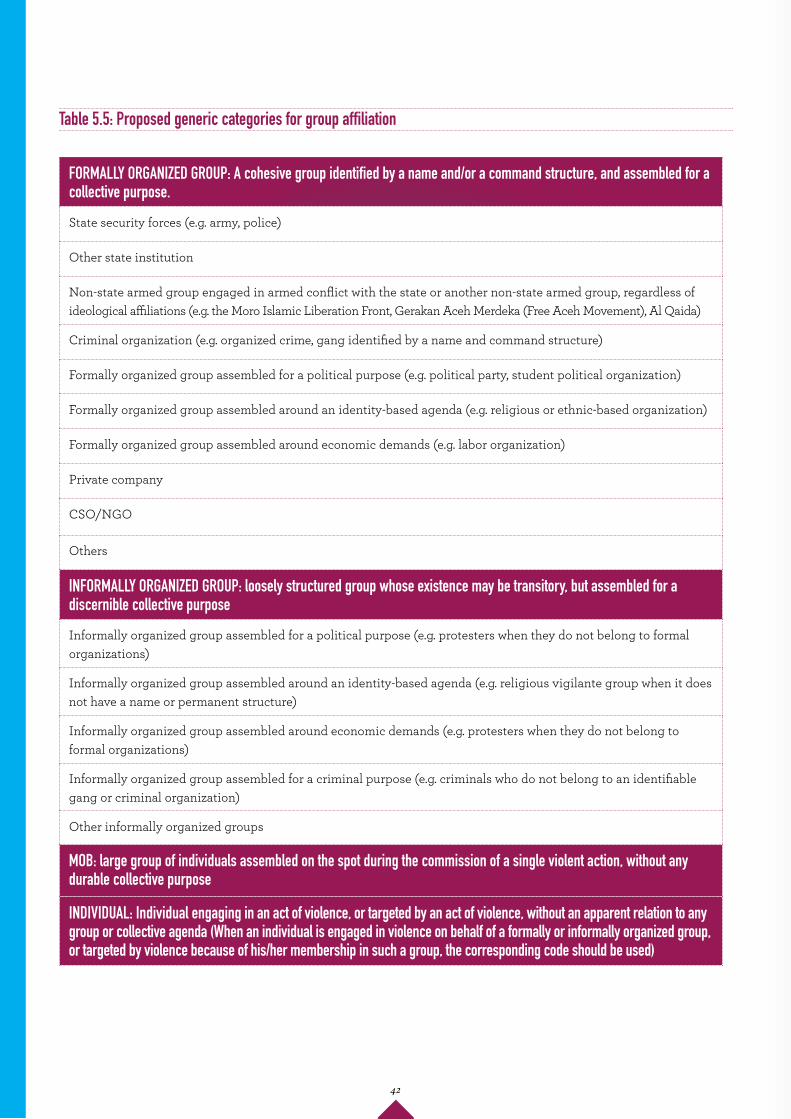
Table 5.5: Proposed generic categories for group affiliation
FORMALLY ORGANIZED GROUP: A cohesive group identified by a name and/or a command structure, and assembled for a collective purpose.
State security forces (e.g. army, police)
Other state institution
Non-state armed group engaged in armed conflict with the state or another non-state armed group, regardless of ideological affiliations (e.g. the Moro Islamic Liberation Front, Gerakan Aceh Merdeka (Free Aceh Movement), Al Qaida)
Criminal organization (e.g. organized crime, gang identified by a name and command structure)
Formally organized group assembled for a political purpose (e.g. political party, student political organization)
Formally organized group assembled around an identity-based agenda (e.g. religious or ethnic-based organization)
Formally organized group assembled around economic demands (e.g. labor organization)
Private company
CSO/NGO
Others
INFORMALLY ORGANIZED GROUP: loosely structured group whose existence may be transitory, but assembled for a discernible collective purpose
Informally organized group assembled for a political purpose (e.g. protesters when they do not belong to formal organizations)
Informally organized group assembled around an identity-based agenda (e.g. religious vigilante group when it does not have a name or permanent structure)
Informally organized group assembled around economic demands (e.g. protesters when they do not belong to formal organizations)
Informally organized group assembled for a criminal purpose (e.g. criminals who do not belong to an identifiable gang or criminal organization)
Other informally organized groups
MOB: large group of individuals assembled on the spot during the commission of a single violent action, without any durable collective purpose
INDIVIDUAL: Individual engaging in an act of violence, or targeted by an act of violence, without an apparent relation to any group or collective agenda (When an individual is engaged in violence on behalf of a formally or informally organized group, or targeted by violence because of his/her membership in such a group, the corresponding code should be used)
42
Box 5.5 Capturing the gender dimension of violence
Women and children represent a large share of the casualties of contemporary conflicts. However, armed conflict impacts men, women, and children in differ-ent ways: most of those killed are young men, but 75% of people displaced by war are women and children (UN Women 2000). Rape and sexual violence are prevalent in conflict zones, either as a by-product of violence or as a weapon of war. Outside of conflict zones, women account for 20% of all murder victims, but are two-thirds of the victims of intimate partner homicides (UNODC 2014). A gender analysis of violence data is a first step towards better policies to address the needs of men and women, and their roles in violence prevention and peacebuilding. A VIMS can capture gender-related information in several ways:
• Causes. Systems may include gender-based violence in their list of Cause categories, either as a stand-alone category or as a subset of identi-ty-based violence.
• Violence forms. Violence forms should include codes for sexual assault and possibly other forms of sexual violence, to which women and members of gender minorities are particularly exposed.
• Actors and impacts. When possible, the gender of perpetrators and victims should be captured. It is particularly important to provide a gender breakdown of homicide victims: fatal violence may be the only form of violence for which the sex of the victim(s) will be consistently reported by most data sources. Including rape/sexual assault as an impact separate from deaths and injuries may also be useful.
However, data will be only as good as their sources, and reporting on the gender aspects of violence tends to be flawed and unreliable. First, the sex of perpe-trators and victims of violence might not be consis-tently reported in news and security forces reports. Second, certain forms such as sexual assaults and domestic violence largely tend to be under-reported because of the shame associated with them, cultural and religious values, and/or the victims’ lack of confi-dence in the authorities. Still, a VIMS should attempt to capture gender-re-lated information. When under-reporting can be assumed to be relatively even across the study area, even partial data may show the prevalence of sexual and domestic violence, and their geographic distri-bution.
Human impacts: analytical value and limitations. The number of deaths is gen-erally regarded as the most reliable proxy to measure the extent and cost of violence in a particular region or country, and it is often re-corded fairly comprehensively (WHO 2002). Because of this, violent deaths are a conve-nient indicator for cross-country compari-son. However, non-fatal outcomes, such as injuries, are more frequent and should not be overlooked.39 When different sources report different casualties for the same incident, it is advisable to use the most conservative estimate.
Economic impacts: limitations. Estimating the economic cost of violent incidents, while desirable, is difficult. One would have to take into account direct as well as indirect costs incurred from deaths and injuries, as well as damage to property and related economic losses. Sources are unlikely to provide suffi-cient information, and damage to property is an unreliable proxy. In some contexts, data on damage to specific types of buildings, such as schools, government offices, or reli-gious buildings, might be relevant for conflict dynamics or policy response, and therefore worth monitoring.
Coding of impacts. A VIMS should register the number of people/properties affected by each impact category: deaths, injuries, rapes, buildings destroyed, etc. A gender break-down should be provided when applicable.
5.3.5 ImpactsDefinition. Damage to persons (deaths and
injuries) and property incurred through violent incidents.
IMPACTS
43
The project team may find the following advice use-ful in defining variables:
• Not all information is analytically useful. VIMSs do not need to record all the information acquired from sources. Certain types of information may not be reported with sufficient consistency to be analytically useful at the aggregate level. Based on the time and resources available, the project team should focus on collecting the information that can be acquired from sources reliably, and which aligns with the database’s analytical priorities.
• Strike the right balance between global compat-ibility and country-specificity. When designing a violence monitoring system, tension will inevi-tably arise between two conflicting objectives: on one hand, ensuring cross-country compatibility; on the other, ensuring that the system’s design reflects the idiosyncrasies of violence in the study area. A VIMS should strive for international compatibility and global relevance. But failing to sufficiently reflect dynamics on the ground will make it less useful to a local audience. Combin-ing generic categories and more country-specific subcategory codes (as illustrated in 5.3.3 Causes of violence, and 5.3.4 Actors), will help resolve this tension.
• Descriptive summaries. In addition to coded information, databases should also include a short narrative summary of each incident. This records details that could not otherwise be captured in the dataset. This will also be useful for quality control (verifying that incidents have been coded ade-quately).
• Coding key and coding manual. The resulting system must be carefully noted in a coding key. For each type of information or variable, this coding key provides the list of pre-established cat-egories and subcategories a coder can pick from, and corresponding codes. (For examples of these, see the NVMS, DSID, and BCMS coding keys in Annexes V.1, 2, and 3, respectively). In addition, a coding manual must be developed that includes step-by-step guidance and protocols for resolving potential issues.
FINAL REMARKS ON CODING INCIDENTS
44
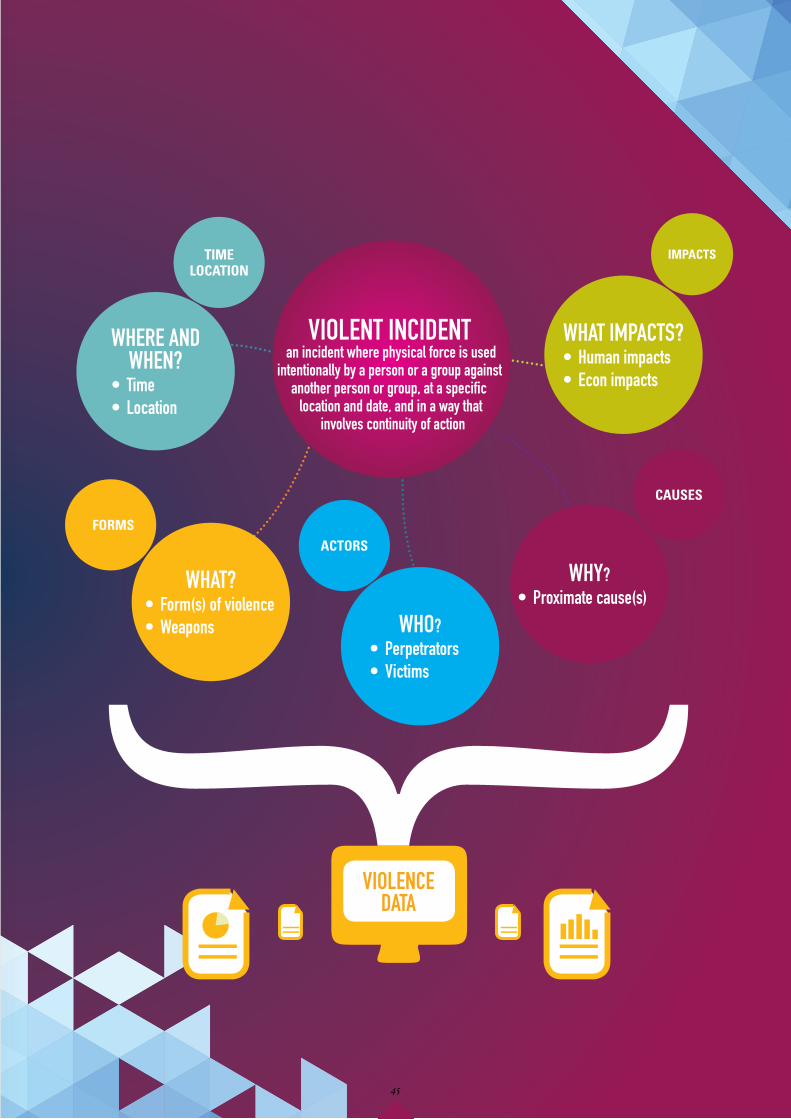
WHERE AND WHEN?
• Time• Location
WHAT?• Form(s) of violence• Weapons
WHY?• Proximate cause(s)
WHO?• Perpetrators• Victims
WHAT IMPACTS?• Human impacts • Econ impacts
VIOLENT INCIDENT an incident where physical force is used
intentionally by a person or a group against another person or group, at a specific
location and date, and in a way that involves continuity of action
IMPACTSTIME LOCATION
ACTORS
CAUSES
FORMS
VIOLENCE DATA
45
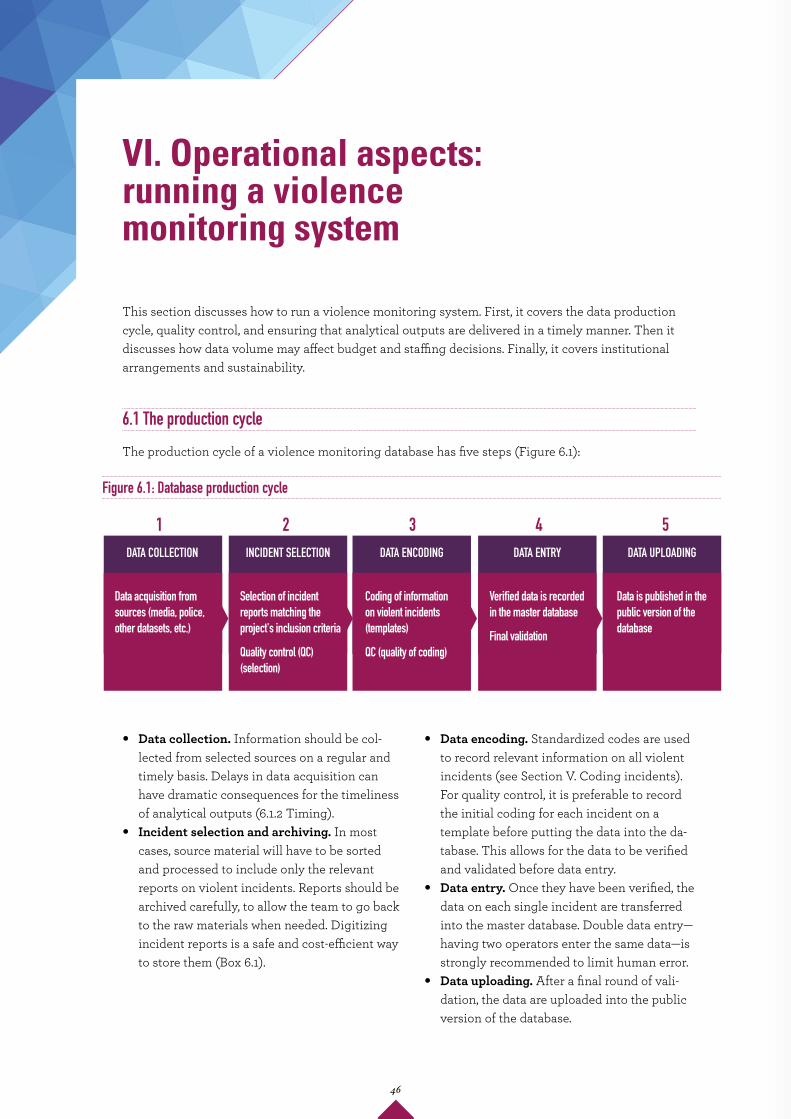
The production cycle of a violence monitoring database has five steps (Figure 6.1):
VI. Operational aspects: running a violence monitoring system
This section discusses how to run a violence monitoring system. First, it covers the data production cycle, quality control, and ensuring that analytical outputs are delivered in a timely manner. Then it discusses how data volume may affect budget and staffing decisions. Finally, it covers institutional arrangements and sustainability.
6.1 The production cycle
DATA COLLECTION INCIDENT SELECTION DATA ENCODING DATA ENTRY DATA UPLOADING
Data acquisition from sources (media, police, other datasets, etc.)
Selection of incident reports matching the project's inclusion criteria
Quality control (QC) (selection)
Coding of information on violent incidents (templates)
QC (quality of coding)
Verified data is recorded in the master database
Final validation
Data is published in the public version of the database
1 2 3 4 5
• Data collection. Information should be col-lected from selected sources on a regular and timely basis. Delays in data acquisition can have dramatic consequences for the timeliness of analytical outputs (6.1.2 Timing).
• Incident selection and archiving. In most cases, source material will have to be sorted and processed to include only the relevant reports on violent incidents. Reports should be archived carefully, to allow the team to go back to the raw materials when needed. Digitizing incident reports is a safe and cost-efficient way to store them (Box 6.1).
Figure 6.1: Database production cycle
• Data encoding. Standardized codes are used to record relevant information on all violent incidents (see Section V. Coding incidents). For quality control, it is preferable to record the initial coding for each incident on a template before putting the data into the da-tabase. This allows for the data to be verified and validated before data entry.
• Data entry. Once they have been verified, the data on each single incident are transferred into the master database. Double data entry—having two operators enter the same data—is strongly recommended to limit human error.
• Data uploading. After a final round of vali-dation, the data are uploaded into the public version of the database.
46
Box 6.1 Digitization of source materials – Example from the NVMS
JRI-Research, the private firm hired to handle NVMS data collection, uses 20 megapixel cam-eras to photograph all pages in the 117 daily newspapers for which the NVMS has subscrip-tions. Photographs, as shown below, achieve much greater definition than digital scanners. Three NVMS staff photograph 1,400 pages per day. Coders then select relevant articles from the digital files and code relevant information into the NVMS database. In the process of building the database, which dates back to 1998, the staff are therefore creating an unprec-edented archive of local news-papers from all 34 Indonesian provinces. Discussions are underway about handing over a copy of this archive to the National Archive or a public university.
Box 6.2 Automated versus manual selection and encoding
A large share of the cost of a VIMS is the staff time invested in event selection and encoding. A large database like the NVMS employed 34 full-time staff in 2014, including 25 coders. Automating some coding tasks would be more cost-efficient. Selecting relevant incident reports from raw source materials could be automated to some extent. The NVMS team experimented with using character recognition software and keywords to skim through digitized newspapers articles, and identify reports of violent incidents. However, they found that manual selection by a staff coder was more accurate. Automating coding is harder, especially for systems recording information on a broad range of variables. GDELT (http://gdeltproject.org/) is an example of a fully automated system. This project, which is supported by Google, monitors broadcast, print, and Internet-based media in over 100 languages to provide a global overview of contemporary events, including conflict. Among other variables, GDELT uses keywords to identify the time and location of events, the actors involved, and the nature of their interactions. However, GDELT does not provide a comprehensive account of conflict incidents, and tends to place events of a very different nature and scale on the same level (for example, all the Tahrir Square protests in Egypt are counted as one event, on the same level as a single insurgent attack in Afghanistan). Automated systems may also struggle to capture causes of violence, as GDELT notes in its project’s documentation. While experimentation with automated coding continues, manual coding remains more reliable and accurate for monitoring violent incidents.
47
6.1.1 Quality control The quality of a dataset hinges on consistency at all stages of the production cycle. Subjective variation in the way incidents are selected and coded cannot be entirely eliminated, but it should be minimized. This is all the more important when the volume of data requires large teams of coders (Box 6.3).
Steps to improve database consistency, and therefore quality, include:
• Clear operational definitions and standard operating procedures recorded in a coding manual. This is crucial in order to minimize subjective interpretation when selecting and coding incidents. This applies to a project’s definition of violence, its definition of an event, as well as every category and subcategory listed as possible choices under each variable (forms of violence, causes, etc.). Detailed defini-tions should be put in a coding manual, along with guidance for each step in the database production cycle, and protocols to resolve potential coding issues.
Box 6.3 NVMS quality control procedures
The NVMS handles a large volume of data: in 2014, an average of 2,300 violent incidents were recorded every month. JRI, the firm responsible for developing and updating the NVMS database, and hiring and training the 25 full-time coders, assigns a different group to carry out each of the three key functions: data collection and digitization, incident selection and encoding, and data entry. Quality control (QC) is undertaken by senior JRI staff at every step of the production cycle.
When staff are new, 100% of their monthly output is checked by the QC staff who verify that the selected, coded, and entered data are all correct. As the quality of new staff members’ work improves, QC staff check an incrementally smaller sample of their monthly output:
• Output > 94% correct: 10% of output will be audited the following month • Output 90-94% correct: 25% of output will be audited the following month • Output 85-89% correct: 50% of output will be audited the following month • Output < 85% correct: 100% of output will be audited the following month
Every two months, QC staff check the coding consistency of all coders. QC staff pick comparable inci-dents coded by different team members to verify if they were coded the same way, and in conformity with project guidelines. When issues arise, they are discussed collectively to agree on a course of action moving forward: definitions and guidelines, when still insufficiently clear, may need to be adjusted.
• Multi-layered quality control should take place throughout the production cycle. Qual-ity control to check what coders enter should be undertaken by other team members at key stages, such as:
• Incident selection: Verify that the coder applied the selection criteria correctly, and did not miss any important incident report.
• Data encoding: Verify that incidents were coded correctly, in accordance with project guidelines.
• Data entry: Minimize human error during data entry and detect any remaining coding mistakes or anomalies.
• A last round of validation should be per-formed before data are uploaded.
External validation by stakeholders such as gov-ernment counterparts, CSO partners, and repre-sentatives of the project’s audience can improve ownership and data quality (Box 6.4).
48
6.1.2 Timing
Well-timed analysis is key for any violence moni-toring project. VIMSs monitor ongoing violence and produce analysis of the latest incidents and trends. A VIMS will be expected to produce analysis of violent incidents shortly after they happen, when the atten-tion of policy-makers, the media, and other stake-holders, is still on them. Timeliness in the delivery of the analysis will help build an audience and influence policy. Failing to provide timely analysis results in the system losing its relevance.
VIMSs usually update and publish data monthly. The time lag between violent events and the publica-tion of data and basic statistics must be minimized. Depending on data volume, a time lag of one to two weeks after the end of the reporting period may be necessary to collect late incident reports, and verify and validate the data before publishing them. Besides the data, most projects publish monthly to quarterly analytical reports (see Section VII. Analysis and dissemination). Analytical reports are usually disseminated in the second half of the month follow-ing the reporting period.
Basic steps for managing time pressure. Updating the database on a monthly basis implies that the whole production cycle must be completed within a month, and this cycle is repeated without fail during project implementation.The following measures can
minimize delays:
• Ensure timely data collection. Collect reports from sources as soon as possible after incidents occur, following a planned timeframe. Examples: The NVMS relies mainly on provincial or district newspapers, most of which do not have systems in place to ship papers to the country’s capital where the data collection firm is located. There-fore the firm employs a network of field agents who subscribe to local papers, collect them, and ship the papers to the NVMS every week. Deep South Watch receives police and Internal Security Operations Command (ISOC) incident reports by email every morning.
• Distribute the workload throughout the month. Incident selection and coding, as well as quality control, should be done as incident reports come in, rather than doing all the work at the end of the month.
Box 6.4 BCMS’ Multi-Stakeholder Validation Groups (MSVGs)
When writing up reports on violent incidents, the Philippine police do not consistently record the causes or motives for the incidents. As the BCMS relies heavily on these police reports, the database features a large percentage of incidents with no clearly identified cause (40.1% of incidents for the period 2011-2014).
International Alert (IA) established three local multi-stakeholder validation groups (MSVGs) in different parts of Mindanao: one for Maguindanao and Cotabato; one for Lanao Del Norte and Lanao Del Sur; and one in Zamboanga, covering the island provinces. Each MSVG includes local representatives of the se-curity forces, civil society (some with ties to insurgent groups), academics, and journalists. The MSVGs meet monthly or bi-monthly to discuss the latest data and the cases with undetermined causes.
Through their meetings, the MSVGs have helped fill information gaps on the causes of violence, and IA is considering improving MSVG performance by communicating more frequently with individual MSVG members. These validation groups have been effective in raising local stakeholders’ awareness about the BCMS, building local ownership, and facilitating the dissemination of analytical findings.
49
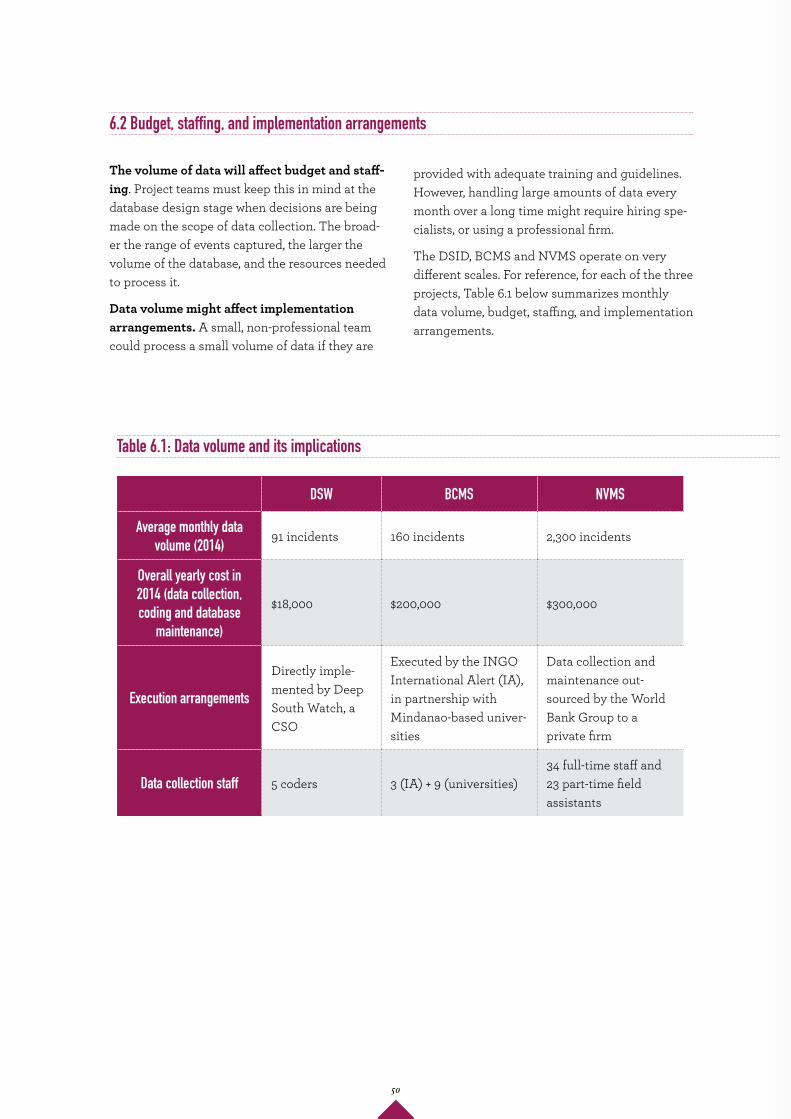
6.2 Budget, staffing, and implementation arrangements
The volume of data will affect budget and staff-ing. Project teams must keep this in mind at the database design stage when decisions are being made on the scope of data collection. The broad-er the range of events captured, the larger the volume of the database, and the resources needed to process it.
Data volume might affect implementation arrangements. A small, non-professional team could process a small volume of data if they are
provided with adequate training and guidelines. However, handling large amounts of data every month over a long time might require hiring spe-cialists, or using a professional firm.
The DSID, BCMS and NVMS operate on very different scales. For reference, for each of the three projects, Table 6.1 below summarizes monthly data volume, budget, staffing, and implementation arrangements.
Table 6.1: Data volume and its implications
DSW BCMS NVMS
Average monthly data volume (2014)
91 incidents 160 incidents 2,300 incidents
Overall yearly cost in 2014 (data collection, coding and database
maintenance)
$18,000 $200,000 $300,000
Execution arrangements
Directly imple-mented by Deep South Watch, a CSO
Executed by the INGO International Alert (IA), in partnership with Mindanao-based univer-sities
Data collection and maintenance out-sourced by the World Bank Group to a private firm
Data collection staff 5 coders 3 (IA) + 9 (universities)34 full-time staff and 23 part-time field assistants
50
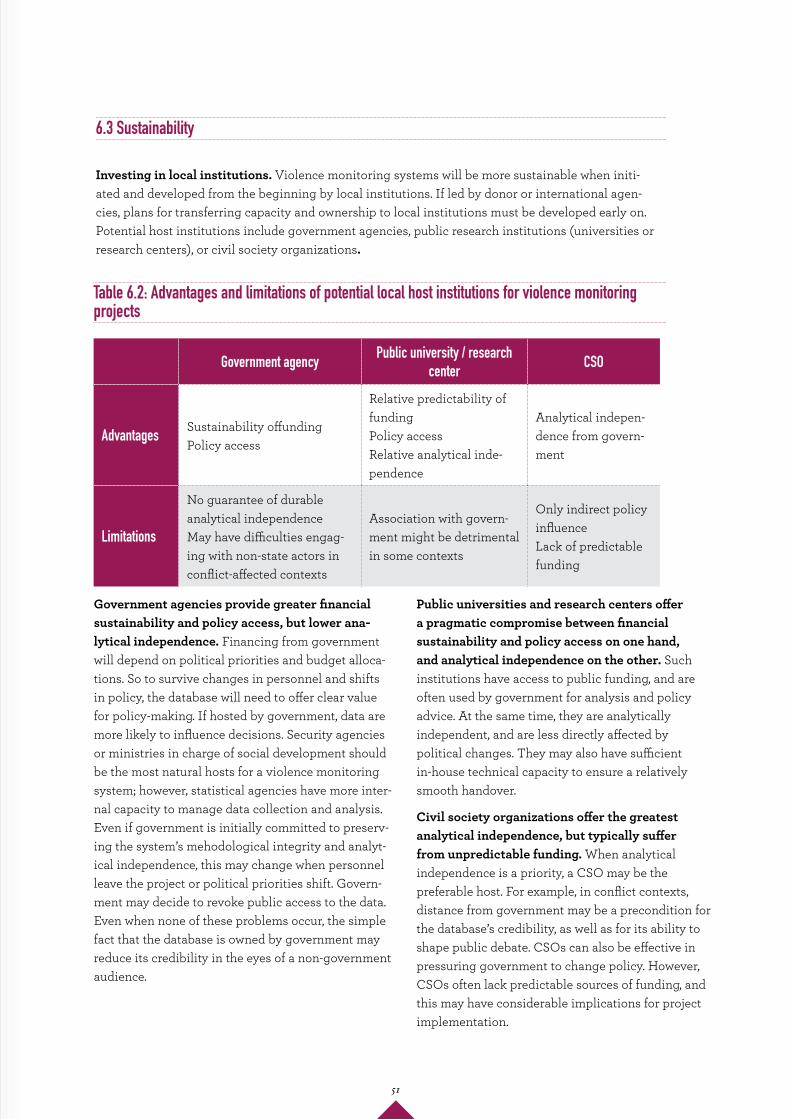
6.3 Sustainability
Investing in local institutions. Violence monitoring systems will be more sustainable when initi-ated and developed from the beginning by local institutions. If led by donor or international agen-cies, plans for transferring capacity and ownership to local institutions must be developed early on. Potential host institutions include government agencies, public research institutions (universities or research centers), or civil society organizations.
Government agencies provide greater financial sustainability and policy access, but lower ana-lytical independence. Financing from government will depend on political priorities and budget alloca-tions. So to survive changes in personnel and shifts in policy, the database will need to offer clear value for policy-making. If hosted by government, data are more likely to influence decisions. Security agencies or ministries in charge of social development should be the most natural hosts for a violence monitoring system; however, statistical agencies have more inter-nal capacity to manage data collection and analysis. Even if government is initially committed to preserv-ing the system’s mehodological integrity and analyt-ical independence, this may change when personnel leave the project or political priorities shift. Govern-ment may decide to revoke public access to the data. Even when none of these problems occur, the simple fact that the database is owned by government may reduce its credibility in the eyes of a non-government audience.
Table 6.2: Advantages and limitations of potential local host institutions for violence monitoring projects
Government agency Public university / research center CSO
AdvantagesSustainability offundingPolicy access
Relative predictability of fundingPolicy accessRelative analytical inde-pendence
Analytical indepen-dence from govern-ment
Limitations
No guarantee of durable analytical independenceMay have difficulties engag-ing with non-state actors in conflict-affected contexts
Association with govern-ment might be detrimental in some contexts
Only indirect policy influenceLack of predictable funding
Public universities and research centers offer a pragmatic compromise between financial sustainability and policy access on one hand, and analytical independence on the other. Such institutions have access to public funding, and are often used by government for analysis and policy advice. At the same time, they are analytically independent, and are less directly affected by political changes. They may also have sufficient in-house technical capacity to ensure a relatively smooth handover.
Civil society organizations offer the greatest analytical independence, but typically suffer from unpredictable funding. When analytical independence is a priority, a CSO may be the preferable host. For example, in conflict contexts, distance from government may be a precondition for the database’s credibility, as well as for its ability to shape public debate. CSOs can also be effective in pressuring government to change policy. However, CSOs often lack predictable sources of funding, and this may have considerable implications for project implementation.
51
Transition challenges. Handing over a project from an international or foreign institution to a local recipient demands time and resources to en-sure that technical capacity is properly transferred, and that financial arrangements are in place that will allow data collection and analysis to continue uninterrupted after the handover. Even temporary funding gaps can damage a violence monitoring system’s visibility and relevance. Project teams should anticipate a transition period of six months to one year, during which they will provide on-the-job training, supervision, and transitional funding to the recipient, before completing the full handover.
The importance of funding predictability. Fund-ing gaps have serious implications for violence monitoring systems:
• Visibility and relevance. Violence monitoring systems strive to provide timely and continu-ously updated information on ongoing inci-dents. Their capacity to deliver near real-time analysis as violent events unfold is key to ensuring the attention and interest of their au-dience. Funding gaps interrupt data collection and when funding starts up again, collecting missing data requires extra time and effort on top of ongoing data collection. As a result, a project may struggle to make up for the time lost. When gaps are too long, and delays in data collection accumulate, this can have an irre-versible negative impact on the project’s public image and relevance.
• Retaining technical capacity. Funding gaps make it difficult to retain experienced staff. Vio-lence monitoring systems are technical endeav-ors and it takes time to train new staff. Any drop in the quality of data collection or encoding may jeopardize the database’s integrity.
For these reasons, it is of the utmost importance to ensure continuity and predictability in fund-ing. Donors should consider supporting violence monitoring projects over extended periods of time, and support recipients when they seek alternative funding sources if the first donor/s grants are going to end. Grant amounts should be calculated so as to enable institutional growth and capacity improvements (Box 6.5).
Box 6.5 Deep South Watch: the difficulty of managing a violence monitoring system in the absence of predictable funding
For more than a decade (2004-2016), the DSW project has had to rely on small, short-term grants from international donors and public institutions. While DSW managed to avoid significant gaps in data collection, this lack of long-term budget security has made it hard to plan ahead beyond the next couple years. The project has struggled to retain long-term staff, hire new recruits, and improve the quality of the database and its communication strategy.
In addition, short-term funding is often tied to specific research outputs commissioned by donor institutions, which may or may not align with the project’s own goals. This has distracted DSW from its own analytical and policy agenda. Grant amounts are usually calculated so most of the funds are spent on activities, allowing very little room for institutional development and investments in technical capacity.
52

53
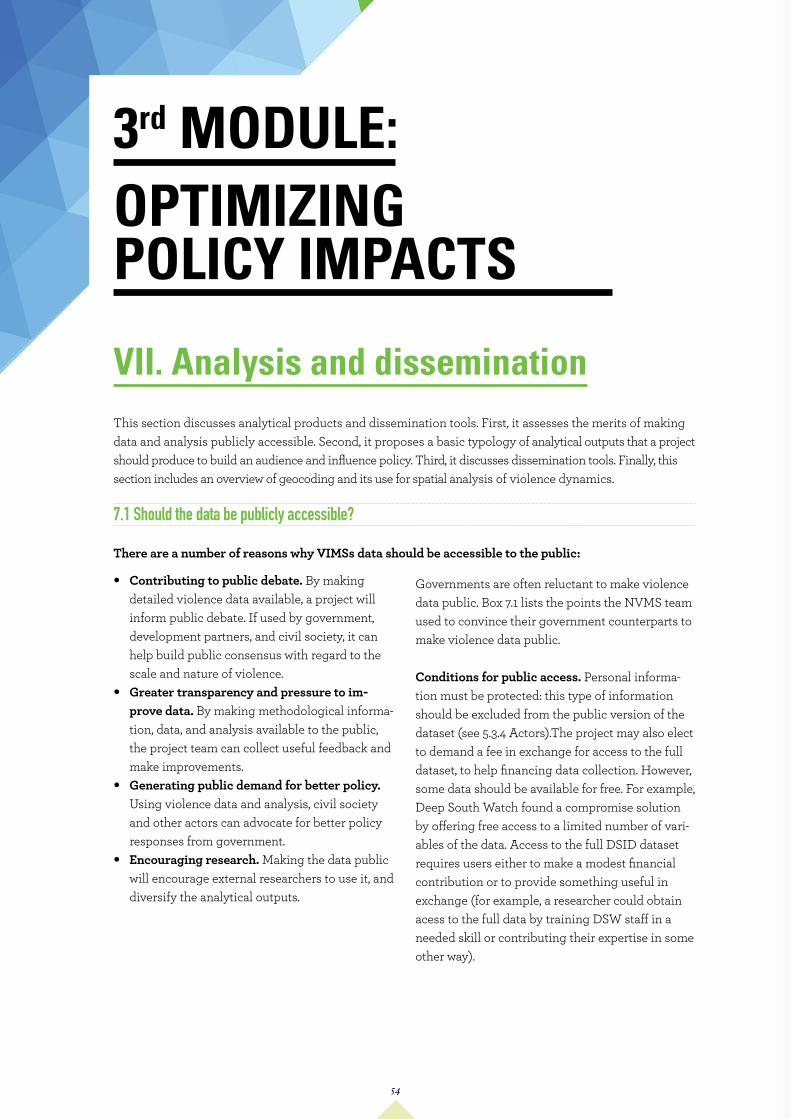
• Contributing to public debate. By making detailed violence data available, a project will inform public debate. If used by government, development partners, and civil society, it can help build public consensus with regard to the scale and nature of violence.
• Greater transparency and pressure to im-prove data. By making methodological informa-tion, data, and analysis available to the public, the project team can collect useful feedback and make improvements.
• Generating public demand for better policy. Using violence data and analysis, civil society and other actors can advocate for better policy responses from government.
• Encouraging research. Making the data public will encourage external researchers to use it, and diversify the analytical outputs.
Governments are often reluctant to make violence data public. Box 7.1 lists the points the NVMS team used to convince their government counterparts to make violence data public.
Conditions for public access. Personal informa-tion must be protected: this type of information should be excluded from the public version of the dataset (see 5.3.4 Actors).The project may also elect to demand a fee in exchange for access to the full dataset, to help financing data collection. However, some data should be available for free. For example, Deep South Watch found a compromise solution by offering free access to a limited number of vari-ables of the data. Access to the full DSID dataset requires users either to make a modest financial contribution or to provide something useful in exchange (for example, a researcher could obtain acess to the full data by training DSW staff in a needed skill or contributing their expertise in some other way).
OPTIMIZING POLICY IMPACTS
3rd MODULE:
VII. Analysis and disseminationThis section discusses analytical products and dissemination tools. First, it assesses the merits of making data and analysis publicly accessible. Second, it proposes a basic typology of analytical outputs that a project should produce to build an audience and influence policy. Third, it discusses dissemination tools. Finally, this section includes an overview of geocoding and its use for spatial analysis of violence dynamics.
7.1 Should the data be publicly accessible?
There are a number of reasons why VIMSs data should be accessible to the public:
54
7.2 Analytical products
Function of analytical products. Regularly updated data on violence is, in itself, a public good. However, policymakers or civil society organizations may not have the technical capacity or time to analyze the raw data themselves. For this reason, projects produce a range of analytical outputs that present the latest patterns of violence and trends, and analyze their implications.
Typology of analytical outputs. Analytical outputs will likely include: monthly to quarterly data up-dates, policy-oriented reports, and research papers. Table 7.1 below summarizes the distinctive features of each.
• Monthly to quarterly data updates.These updates provide a concise overview of recent violence, and ready-to-use figures and statistics. Typically, they include graphs and maps, updat-ed from one edition to the next, and illustrating the evolution of violence levels over time, the geographic distribution of incidents, as well as statistics on violence forms, drivers, and actor types. Key findings and prominent incidents are briefly discussed, along with their implications.40 These products will be particularly useful to government staff, international agencies, and journalists who report regularly on a conflict, or violence trends.
• Policy-oriented reports. These reports provide more in-depth analysis, and are published on a biannual to yearly basis. They might adopt a thematic focus (e.g. land conflicts, ethnicity and violence, urban crime), and combine quantitative analysis of the violence data with other investi-gative tools such as qualitative fieldwork. These reports emphasize policy recommendations. Policy-makers and international agencies may use the reports to design policy or programs. Re-searchers and civil society organizations might use findings and recommendations for advocacy.
• Research papers. Academic studies and articles are published either by the project team or exter-nal researchers, and build knowledge, expand the system’s visibility in academic circles, and may also influence policy.
Box 7.1 NVMS’ arguments for public access
The NVMS’ main government stakeholder, the Coordinating Ministry for People’s Welfare, was willing from the start to make the data public. However, Indonesian security ministries and intelligence agencies had reservations. The Coordinating Ministry changed their minds, using the following arguments:
• The data is gathered from open sources (newspapers) and is, therefore, already public.
• The database contains no personal information (names of individuals).
• Indonesia’s Law on Social Conflict emphasizes government and civil society cooperation in responding to local conflicts.
55
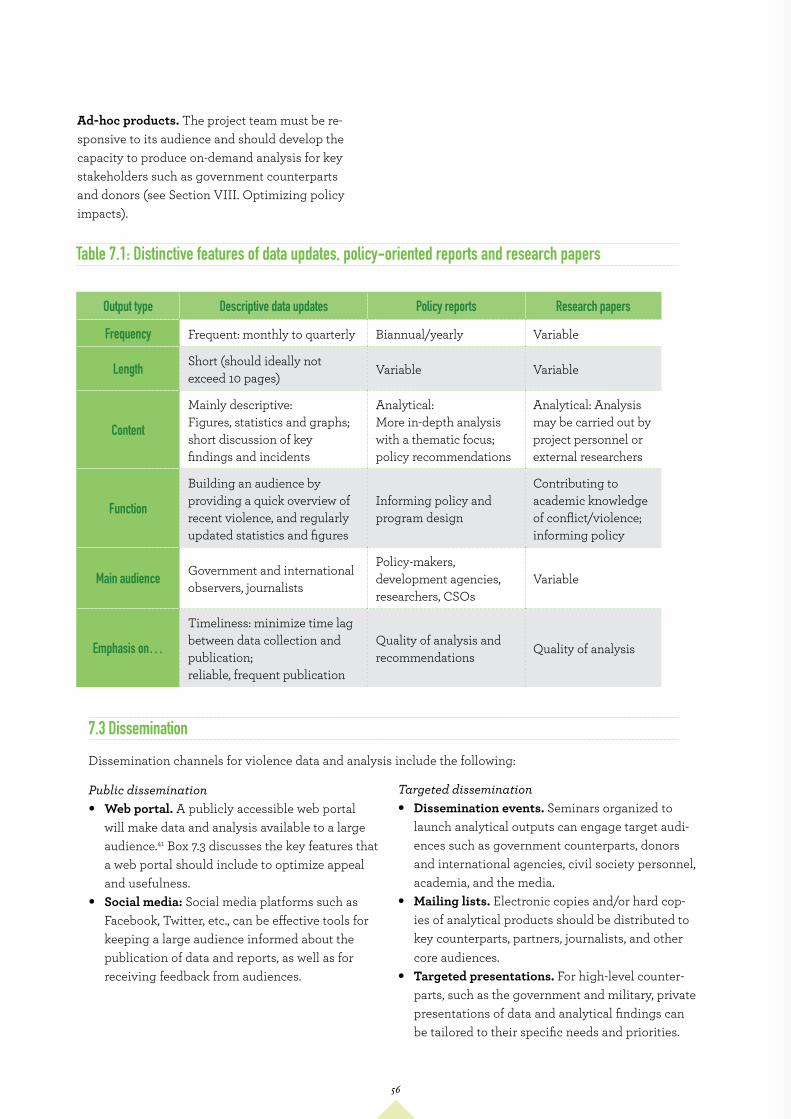
Ad-hoc products. The project team must be re-sponsive to its audience and should develop the capacity to produce on-demand analysis for key stakeholders such as government counterparts and donors (see Section VIII. Optimizing policy impacts).
Public dissemination • Web portal. A publicly accessible web portal
will make data and analysis available to a large audience.41 Box 7.3 discusses the key features that a web portal should include to optimize appeal and usefulness.
• Social media: Social media platforms such as Facebook, Twitter, etc., can be effective tools for keeping a large audience informed about the publication of data and reports, as well as for receiving feedback from audiences.
Table 7.1: Distinctive features of data updates, policy-oriented reports and research papers
Output type Descriptive data updates Policy reports Research papers
Frequency Frequent: monthly to quarterly Biannual/yearly Variable
Length Short (should ideally not exceed 10 pages)
Variable Variable
Content
Mainly descriptive:Figures, statistics and graphs; short discussion of key findings and incidents
Analytical:More in-depth analysis with a thematic focus; policy recommendations
Analytical: Analysis may be carried out by project personnel or external researchers
Function
Building an audience by providing a quick overview of recent violence, and regularly updated statistics and figures
Informing policy and program design
Contributing to academic knowledge of conflict/violence; informing policy
Main audience Government and international observers, journalists
Policy-makers, development agencies, researchers, CSOs
Variable
Emphasis on…
Timeliness: minimize time lag between data collection and publication;reliable, frequent publication
Quality of analysis and recommendations
Quality of analysis
Targeted dissemination • Dissemination events. Seminars organized to
launch analytical outputs can engage target audi-ences such as government counterparts, donors and international agencies, civil society personnel, academia, and the media.
• Mailing lists. Electronic copies and/or hard cop-ies of analytical products should be distributed to key counterparts, partners, journalists, and other core audiences.
• Targeted presentations. For high-level counter-parts, such as the government and military, private presentations of data and analytical findings can be tailored to their specific needs and priorities.
7.3 Dissemination
Dissemination channels for violence data and analysis include the following:
56
Box 7.2 Should violence data analysis be performed in-house or outsourced?
VIMSs usually produce a range of regular and ad hoc analytical outputs. Producing these outputs can become very demanding for a small team with limited internal research capacity. For that reason, some projects contract out the analysis or partner with a more capable research organization. In Thailand, Deep South Watch collaborates with the Center for Conflict Studies and Cultural Diversity (CSCD) at Prince of Songkla University’s Pattani Campus. In Indonesia, some of the NVMS’ analytical ouputs are produced by the government, with World Bank technical assistance. Other NVMS outputs such as its quarterly reports and thematic studies are produced by The Habibie Center, a think tank.
Box 7.3 Features of a violence monitoring web portal
A web portal should be the core medium for a violence monitoring dissemination strategy. The portal provides a single platform for accessing data, analytical products, and broader information about the project. For this reason, the project needs to invest in adequate web infrastructure and technical expertise to ensure a stable and user friendly portal. The website and uploaded documentation should be available in all the major languages used by the audience.Key features of a violence monitoring web portal include:
• Ready-to-use graphs and maps. Updated at the end of each reporting period, these provide users with a quick overview of how much violence has happened, what type, where, and who has been affected:
• Graphs show the evolution of violence over time (the number of incidents and deaths). • Maps show the geographic distribution of violence. • Graphs illustrate the nature of violence, including motives, forms of violence, and actors.
• Interactive data features. As users may want to produce maps and graphs tailored to their needs and interests, the web portal should enable them to select and adjust the variables on display.
• Data download. Some users may want to download the raw data, subject to the project’s terms for access to the full dataset (see Section 7.1).
• Analytical outputs. All analytical outputs should be accessible and possible to download. • Methodology. Methodological information and the coding manual should be available online. • Other features. Information should be available about project-related events such as seminars and
training, as well as press releases and fact sheets on project outcomes and policy impacts.
Monitoring use and audience. It is useful to monitor both the size and composition of the audience, track data use, and collect feedback from users. Simple ways to do this are:
• Monitoring website traffic. Monitoring could include the number of page views, single visitors and returns; the number of downloads; the geographic location of visitors; and other useful information.
• Registration. Asking users to register and log in is a simple way to collect useful information such as a user’s name, organization, and contact information.
• Database referencing. To make it easy for the project to track all of the studies and articles which use the database for research, ask the authors to cite the database using a specific wording (for example, the Uppsala Conflict Data Program requires that users always cite the database as follows: Uppsala Conflict Data Program (date of retrieval) UCDP Conflict Encyclopedia: www.ucdp.uu.se/database, Uppsala University).
• User surveys. Freeware such as Survey Monkey can be used to collect feedback.
57
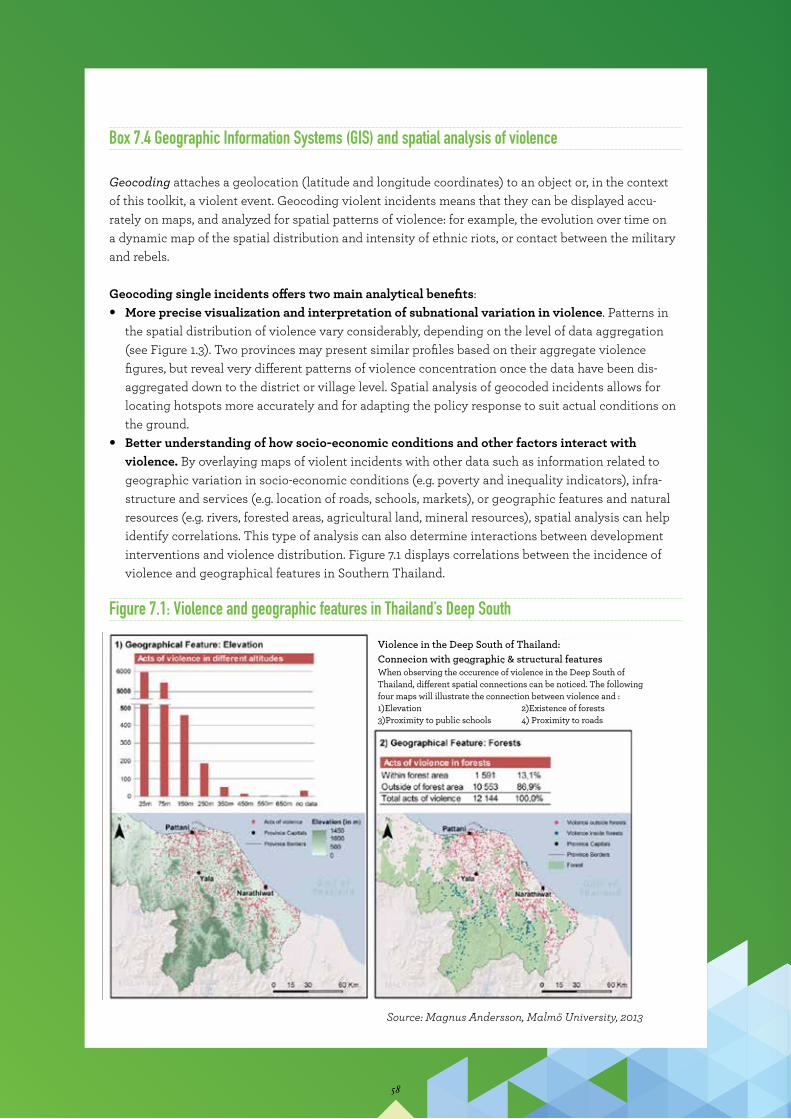
Box 7.4 Geographic Information Systems (GIS) and spatial analysis of violence
Geocoding attaches a geolocation (latitude and longitude coordinates) to an object or, in the context of this toolkit, a violent event. Geocoding violent incidents means that they can be displayed accu-rately on maps, and analyzed for spatial patterns of violence: for example, the evolution over time on a dynamic map of the spatial distribution and intensity of ethnic riots, or contact between the military and rebels.
Geocoding single incidents offers two main analytical benefits: • More precise visualization and interpretation of subnational variation in violence. Patterns in
the spatial distribution of violence vary considerably, depending on the level of data aggregation (see Figure 1.3). Two provinces may present similar profiles based on their aggregate violence figures, but reveal very different patterns of violence concentration once the data have been dis-aggregated down to the district or village level. Spatial analysis of geocoded incidents allows for locating hotspots more accurately and for adapting the policy response to suit actual conditions on the ground.
• Better understanding of how socio-economic conditions and other factors interact with violence. By overlaying maps of violent incidents with other data such as information related to geographic variation in socio-economic conditions (e.g. poverty and inequality indicators), infra-structure and services (e.g. location of roads, schools, markets), or geographic features and natural resources (e.g. rivers, forested areas, agricultural land, mineral resources), spatial analysis can help identify correlations. This type of analysis can also determine interactions between development interventions and violence distribution. Figure 7.1 displays correlations between the incidence of violence and geographical features in Southern Thailand.
Figure 7.1: Violence and geographic features in Thailand’s Deep South
Source: Magnus Andersson, Malmö University, 2013
Violence in the Deep South of Thailand:Connecion with geographic & structural featuresWhen observing the occurence of violence in the Deep South of Thailand, different spatial connections can be noticed. The following four maps will illustrate the connection between violence and :1)Elevation 2)Existence of forests 3)Proximity to public schools 4) Proximity to roads
58
VIII. Optimizing policy impacts
There are two ways in which a violence moni-toring project can influence policy:
• By working with government to feed data and analysis into the design of policies and programs related to conflict and violence (supply-side).
• By providing civil society and the broader public with the information they need to advo-cate more effectively for policy improvements (demand-side).
These two strategies are not mutually exclu-sive. A project team can work from both sides, depending on project objectives, context, and opportunity. The project team should consider the levels of interest and capacity of different audiences to use data, and identify the most effective channels to influence policy in a given context. This approach should inform practical decisions regarding the most adequate institu-tional arrangements, as well as the analytical and outreach strategies.
8.1.1 Institutional arrangements
A project’s institutional structure will be de-termined partly by who initiated it. If the idea originated from a government agency or a CSO, they are likely to remain in charge of it. How-ever, project teams may still have some latitude to involve other potential users in the project’s organizational structure.
Government as a stakeholder. When a project does not originate from government, the team must decide how to practically engage with it:
• Should government be a direct stakeholder in the project?
• Or, should the project remain independent and engage with government only as one audience?
Government could be made a direct stakeholder by involving it in the design and implementation of the project, and granting it a certain level of control and ownership over the data and analysis. However, this requires obtaining a commitment from government stakeholders to the following basic principles: methodological soundness, analytical independence, and making data and analysis accessible to the public. In certain con-texts, direct government involvement may be det-rimental to project objectives: for example, when a project monitors a conflict in which government is a party. In this situation, it may be preferable to emphasize neutrality and analytical indepen-dence by leaving government out of the project’s institutional set-up.
Civil society as a stakeholder. For similar reasons, government-led projects may find it beneficial to involve independent actors in project implementation as this will lend it greater neutrality and credibility, and greater appeal to a non-government audience.
A violence monitoring system can influence policy by producing evidence to better understand conflict and violence dynamics, and adjust policies and programs accordingly. Data can show which regions or groups are most in need of assistance, and evaluate the effectiveness of state and donor interventions.A companion piece to this toolkit—Barron, Engvall, and Morel (2016)— explores the analytical potential of violence data and its policy and programmatic applications. This section discusses how to ensure that data and analysis are well received by government and civil society, by chosing adequate institutional arrangements and engagement strategies. It also emphasizes the importance of seizing opportunities offered by developments on the ground to increase the data’s relevance to policy-makers and civil society partners.
8.1 Strategies to influence policy
59
8.1.2 Engagement strategies
Influencing different audiences demands different approaches, strategies, and tactics.
Engaging with government.42 When government is a key audience of a project, the project team should respond to its needs and priorities:
• Navigating the political context. Government policy is driven by budget allocations and political priorities, as much as by evidence. The government’s timeframe is determined by budget cycles, elections, mandates, and policy approval processes. Project teams need to un-derstand the political and bureaucratic context to identify windows of opportunity and deliver data and analysis at the time when government counterparts can act on it.
• Producing useful evidence. Governments typically have limited use and patience for ana-lytical inputs that are too generic or ‘academic’ when under pressure to deliver results within short timeframes. Governments need timely, actionable evidence that relates to the priori-ties at hand, and that can be easily translated into concrete steps and measures to improve policies and programs.
• Securing the support of “champions”. A project’s influence on government policy is only as great as the influence of its champions within government. Early on, the project team should identify which agencies and individuals are interested in the data, and have the political capital, budget resources, and technical capaci-ty to use it with the greatest impact.
• Adapting language and communication strategy. Policy-makers do not have time to read lengthy reports. Analysis targeted at gov-ernment should always include short executive summaries written in simple, straightforward language, and emphasizing practical recom-mendations. Besides regular dissemination channels, project teams should meet key government counterparts on a regular basis to tailor anlysis to their needs and priorities.
Entry points for policy and programmatic use of the violence data. There are a few practical applications that provide entry points for policy-makers to use violence data:
• Understanding context. The project team can deliver, on demand, tailored information and statistics related to violence that provide an empirical grounding for government reports, briefings, policies, and development plans.
• Targeting. Violence data can be used in combi-nation with other indicators to allocate assis-tance to the regions and groups most in need.
• Measuring impacts. Violence data can provide empirical measures of the impact of specific policies and programs on violence levels and dynamics.
Supporting civil society. Engaging with civil society requires a dramatically different approach: it will often be best for project teams to let civil society identify for themselves how violence data and analysis can help them advance their goals and agenda. The project team should simply focus on promoting the data as a free public resource. Dissemination events and workshops can be com-plemented with more technical training programs for interested civil society partners.
8.2 Seizing opportunities
A project team’s capacity to seize opportunities presented by events on the ground to increase the project’s visibility and relevance will often gener-ate the greatest impact. Such opportunities may arise, for example, when a spike in violent inci-dents draws greater public and political attention to a subnational conflict, when peace talks begin, or when a peace accord is signed. When a project team reacts and responds by providing timely analysis and policy recommendations, it will more easily secure the attention of both policy-makers and civil society partners.
60
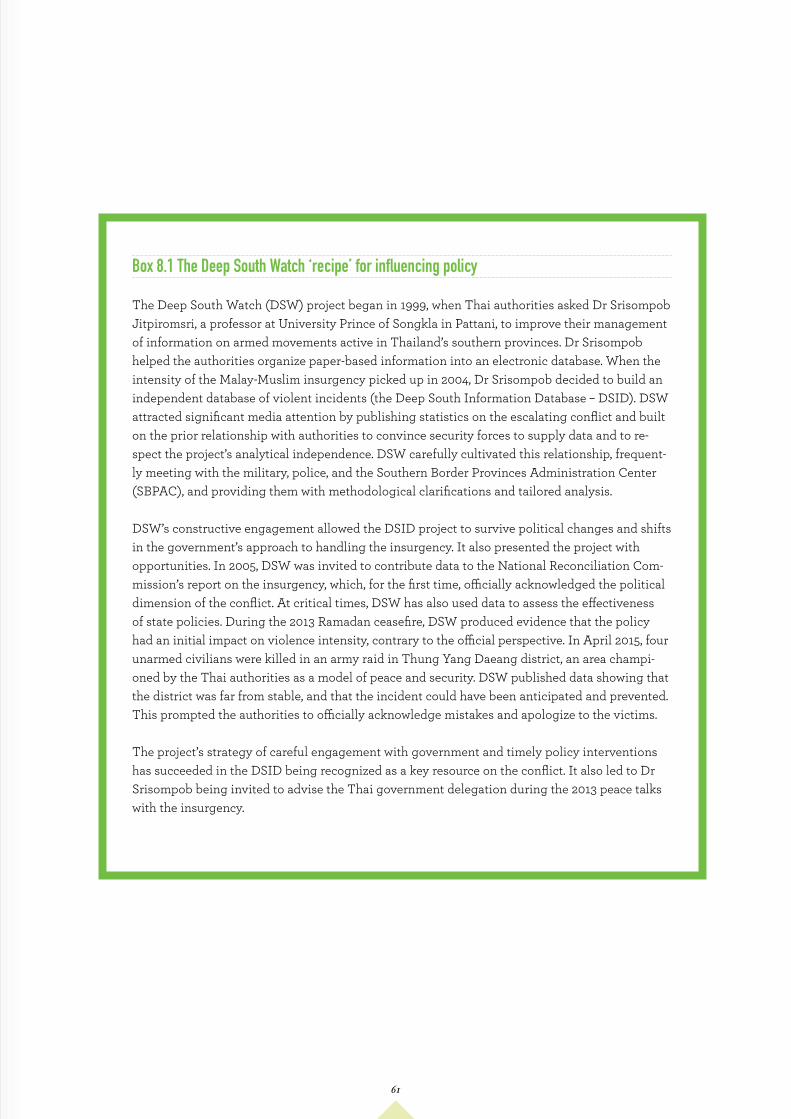
Box 8.1 The Deep South Watch ‘recipe’ for influencing policy
The Deep South Watch (DSW) project began in 1999, when Thai authorities asked Dr Srisompob Jitpiromsri, a professor at University Prince of Songkla in Pattani, to improve their management of information on armed movements active in Thailand’s southern provinces. Dr Srisompob helped the authorities organize paper-based information into an electronic database. When the intensity of the Malay-Muslim insurgency picked up in 2004, Dr Srisompob decided to build an independent database of violent incidents (the Deep South Information Database – DSID). DSW attracted significant media attention by publishing statistics on the escalating conflict and built on the prior relationship with authorities to convince security forces to supply data and to re-spect the project’s analytical independence. DSW carefully cultivated this relationship, frequent-ly meeting with the military, police, and the Southern Border Provinces Administration Center (SBPAC), and providing them with methodological clarifications and tailored analysis.
DSW’s constructive engagement allowed the DSID project to survive political changes and shifts in the government’s approach to handling the insurgency. It also presented the project with opportunities. In 2005, DSW was invited to contribute data to the National Reconciliation Com-mission’s report on the insurgency, which, for the first time, officially acknowledged the political dimension of the conflict. At critical times, DSW has also used data to assess the effectiveness of state policies. During the 2013 Ramadan ceasefire, DSW produced evidence that the policy had an initial impact on violence intensity, contrary to the official perspective. In April 2015, four unarmed civilians were killed in an army raid in Thung Yang Daeang district, an area champi-oned by the Thai authorities as a model of peace and security. DSW published data showing that the district was far from stable, and that the incident could have been anticipated and prevented. This prompted the authorities to officially acknowledge mistakes and apologize to the victims.
The project’s strategy of careful engagement with government and timely policy interventions has succeeded in the DSID being recognized as a key resource on the conflict. It also led to Dr Srisompob being invited to advise the Thai government delegation during the 2013 peace talks with the insurgency.
61
ENDNOTES
1. The United Nations Office on Drugs and Crime defines “homicide” as the unlawful and intentional killing of a person by another (UNODC 2014). As such, it excludes deaths resulting from war or legal intervention.
2. The Geneva Declaration on Armed Violence and Development, which publishes the Global Burden of Violence, recognizes the need for a more comprehensive indicator. For this reason, it collects data on overall violent deaths, including homicide, conflict deaths, unintentional homicide, and deaths resulting from legal intervention. However, it does not cover non-lethal violence. See http://www.genevadeclaration.org/fileadmin/docs/GBAV3/GBAV3-Methodological-Annexe.pdf
3. The UCDP-GED contains information on three categories of armed conflict: (1) state-based conflict, defined as armed conflicts between two governments or a government and a rebel group; (2) non-state conflict (armed conflict between two non-state organized actors); and (3) one-sided violence, where an organized actor (a government or non-state group) kills unarmed civilians. The UCDP-GED dataset for the period 1989 to 2014 contains 103,665 events. It covers Asia, Africa, and the Middle East (excluding Syria) from 1989 to 2014, and the entirety of the Americas and Europe from 2005 to 2014. For further information on the database’s design, event inclusion criteria, and operational definitions, please refer to Sundberg and Melander (2013) and Croicu and Sundberg (2015).
4. ACLED monitors political violence with a focus on civil and communal conflicts, violence against civilians, remote violence, rioting, and protesting. Each event is coded by date and location. In total, 60 countries in Africa and Asia are covered, with data from Asia available since the beginning of 2015. As of October 2015, the global dataset contained around 100,000 events. For further information on the database’s design, event inclusion criteria, and operational definitions, please refer to http://www.acleddata.com/wp-content/uploads/2016/01/ACLED_Codebook_2016.pdf.
5. In addition to the UCDP-GED and ACLED, there are other global and regional datasets. ACLED has published a useful review of the main regional systems: http://www.acleddata.com/wp-content/uploads/2015/10/Conflict-Datasets-Typology-Overview-Regional1.pdf.
6. In this toolkit, the acronym DSW will be used to refer to both the Deep South Watch project and the DSID database.
7. All dollars are US dollars unless otherwise indicated.
8. Via the WB-managed State and Peacebuilding Fund (SPF) and Korea Trust Fund for Economic and Peacebuilding Transitions (KTF).
9. From January 2012 to May 2015, funding for the project came mainly from the Korea Trust Fund for Economic and Peacebuilding Transitions (KTF), managed by the World Bank Group. The Habibie Center, a civil society organization, received grants from the World Bank and The Asia Foundation. The World Bank, the United States Agency for International Development (USAID), Australia’s Department of Foreign Affairs and Trade (DFAT), and the Embassy of the Kingdom of the Netherlands contributed funding to the Violent Conflict in Indonesia Study (ViCIS) prior to 2012. Data collected under ViCIS became the baseline for the NVMS dataset.
10. Such tools are sometimes referred to as ‘early warning systems’. In the strict sense, early warning systems, when applied to conflict or violence, refer to community-level mechanisms linking alerts to institutional responses.
62
11. Blair, Blattman, and Hartman (2015) tested models to predict outbreaks of local violence in Liberia, using data from 242 communities. They predicted 88% of violence outbreaks in 2012, but this came at the cost of a large number of ‘false positives’. The overall accuracy of their forecasts ranged from 33-50%, depending on the model they applied.
12. For example, DSW monitors cases where the insurgents use cultural symbols such as pinning white cloth on the doors of homes of future targets as a warning or threat. Such acts may announce that attacks are coming. ACLED tracks non-violent events related to armed conflict dynamics, including rallies, recruitment drives, peace talks, and high-level arrests, as well as non-violent transfers of territory between warring parties.
13. According to the NVMS, crime accounted for 60% of all violent deaths in Indonesia in 2014; another 15% resulted from domestic violence.
14. WHO (2014) defines collective violence as “the instrumental use of violence by people who identify themselves as members of a group – whether this group is transitory or has a more permanent identity – against another group or set of individuals in order to achieve political, economic or social objectives” (Emphasis added by the author).
15. For a discussion of small-scale land and administrative disputes developing into large-scale communal war in North Maluku, see Wilson (2008).
16. Newswires are the primary data source for the UCDP/PRIO Armed Conflict Database (http://www.ucdp.uu.se/gpdatabase/search.php). According to Wigmore-Shepherd (2015) media sources are used for over three-quarters of the events included in ACLED. The NVMS, DSID, and BCMS all use newspapers either as the primary or a complementary data source.
17. Urban bias in media monitoring is documented in a number of studies, including those of Barranco and Wisler (1999) and Kalyvas (2004). However, Wigmore-Shepherd (2015) argues that the penetration of the Internet and the growth of online publications have attenuated this bias.
18. For a more detailed discussion of the benefits and limitations associated with using news sources to monitor violence, see Barron and Sharpe (2005).
19. In their study of Indonesian newspapers, Barron and Sharpe (2005) found that district-level papers were likely to report any incident involving even a single death.
20. With regard to police or military data, this section refers to narrative incident reports procured from security forces. The BCMS and DSW receive their information as descriptive reports. In other contexts, security forces may provide information in the form of coded datasets. The latter could add a layer of complexity in processing the information, as the police or military data would then have to be “translated” from one coding system into another. For the purpose of a VIMS, raw narrative information is more valuable than pre-coded or aggregated statistics.
21. The military reports obtained by Deep South Watch include the GPS coordinates of incidents.
22. In the context of this paper, “Cause” refers to the issue that led perpetrators to act violently: for instance, political contestation, competition over natural resources, or inter-religious tensions (see Section V. Coding Incidents).
63
ENDNOTES23. A total of 40.1% of incidents recorded by the BCMS from 2011 to 2014 were categorized as “undetermined”
because their causes were not identified in Philippine National Police reports.
24. In conflict-affected contexts, the dominant conflict narrative may also tend to obfuscate more marginal or secondary sources of violence, and provide security forces with a convenient label to pin on unexplained incidents. For instance, DSW has found that the Thai military tend to categorize a broad range of violent incidents in Thailand’s Deep South as related to the Malay-Muslim insurgency, even when the evidence is not conclusive.
25. This section focuses on national or local organizations. International NGOs might play a similar role in particular contexts, although they usually tend to rely on local partners for information collection. INGOs might be useful in contexts of crisis response when allowed to maintain a large field presence in areas that are contested or difficult to access, and especially when local civil society has been suppressed or otherwise rendered incapable of fulfilling an effective data collection function.
26. Ushahidi’s software program was used for a website that collected direct eyewitness reports of election-related violence, and located incidents via Google Maps. Reports could be submitted via email or cell phone text messages (SMS). The website kept users informed of the security situation, and provided relief organizations with valuable information on the geographic distribution of incidents. Multiple initiatives using Ushahidi or similar software to monitor violence have followed Kenya’s lead. For instance, Ushahidi was used to monitor unrest in the Democratic Republic of Congo (DRC) in 2008, and by the Al Jazeera television network to track violence in Gaza. The software has also been used in various countries for election monitoring, reporting corruption cases, or helping with the distribution of relief assistance in the aftermath of natural disasters, such as the Haiti earthquake. It has been used globally too to gather reports on the 2009 swine flu outbreak.
27. The term ‘crowdseeding’ originated with the Voix des Kivus project in DRC (2009-2011), led by Macartan Humphreys and Peter van der Windt from the Columbia Center for Development Strategies at Columbia University in New York. The researchers selected informants from a representative sample of 18 villages in South Kivu, and provided them with mobile phones, phone credit, and training. Via cell phone text messages, informants reported events affecting their daily lives, from disease outbreaks and crop failures, to population movements and conflict incidents. Voix des Kivus used the open source FrontlineSMS software. For more information on the project see http://cu-csds.org/projects/event-mapping-in-congo/
28. Authenticating sources and triangulating information may require the use of more traditional instruments, such as a network of trusted informants (e.g. civil society or aid agency personnel in the field) that the team can rely upon to verify information. The costs and delays associated with validation processes run contrary to some of the presumed advantages of crowdsourcing: the speed and cost-efficiency of information collection.
29. For a detailed analysis of the respective reporting biases of different source types (media, government, civil society, etc.) and scales (international, national, local etc.), please refer to Wigmore-Shepherd (2015). The paper also examines the influence on conflict reporting of governance aspects, such as press freedom and polity scores.
30. It is analytically important to distinguish between the form that violence takes and its motives or causes (Cause variable, Section 5.3.3). These are often conflated into a single analytical category (e.g. “ethnic riots”). Most definitions of terrorism also combine criteria related to form and motivation, resulting in significant confusion. See http://thediplomat.com/2016/01/who-is-a-terrorist-lessons-from-thailand-and-the-philippines/
64
31. Lists of the violence form categories for the NVMS, DSW, and BCMS are provided in Annexes V.1, 2, and 3, respectively. All annexes referenced in this document can be accessed online at the following address: http://www.asiafoundation.org/tag/violence-monitoring
32. “Organized violence” is sometimes defined narrowly as violence perpetrated by the state or formally organized groups in a context of armed conflict (for example, http://www.hsrgroup.org/our-work/security-stats/Organized-Violence.aspx). In this manual’s list, only incidents coded as “Battle”, “Violence against civilians”, “Terror attack,” or “Remote violence” would automatically match that definition. Other forms of incidents could possibly match “Organized violence” if perpetrated by state actors or members of formally organized groups engaged in armed conflict.
33. The definitions for small arms and light weapons used here come from the United Nations’ “International Instrument to Enable States to Identify and Trace, in a Timely and Reliable Manner, Illicit Small Arms and Light Weapons” (International Tracing Instrument, or ITI). The ITI can be found here: http://www.unodc.org/documents/organized-crime/Firearms/ITI.pdf
34. Different systems may use different names for this category of information. The DSW and BCMS call it “cause” and the NVMS calls it “violence type”.
35. For examples of lists of Cause categories, please refer to the NVMS, DSID, and BCMS coding keys in Annexes V.1, 2, and 3, respectively. All annexes referenced in this document can be accessed online at the following address: http://www.asiafoundation.org/tag/violence-monitoring
36. Armed conflict is the main focus of the Uppsala Conflict Data Program (UCDP) and one of the main analytical interests of ACLED. The Geneva declaration disaggregates data on violent deaths into: a) armed conflict; b) intentional homicide; c) unintentional homicide, and; d) deaths from legal intervention. On the other hand, Organisation for Economic Co-operation and Development (OECD) homicide data exclude deaths from armed conflict. Isolating armed conflict in one category therefore facilitates comparative analysis between a VIMS and these datasets.
37. The affiliation lists of the NVMS, DSW, and BCMS present many differences and range from 18 to 43 different choices.
38. The DSID dataset, which includes extensive personal information on actors, has exchanged information with the Deep South Coordination Center, a separate database run by another unit of Prince of Songkla University. The latter database is used to verify government data on insurgency victims entitled to compensation.
39. The NVMS limits reporting to injuries requiring hospital treatment.
40. For examples, see the State of Conflict in Southern Thailand reports produced by DSW http://deepsouthwatch.org/dsid
41. In 2015, Deep South Watch’s website had a monthly average of 25,000 individual visitors, with a peak at 147,000 single visitors in February 2015 when it published an article investigating links between the Malay-Muslim insurgency and global terrorist organizations such as ISIS.
42. The following points assume a democratic government. In authoritarian contexts, other strategies might be required, or it might be preferable not to engage at all.
65
ACLED (2015) “Select Publically Available Conflict and Violence Datasets - Regional Typology Overview”. http://www.acleddata.com/wp-content/uploads/2015/10/Conflict-Datasets-Typolo-gy-Overview-Regional1.pdf
ACMU (2008) Aceh Conflict Monitoring Update (2006-2008) http://www.worldbank.org/en/country/indonesia/research/all?qterm=&teratopic_exact=Public+Sector+Development&docty_ex-act=Newsletter
Barranco, Jose and Dominique Wisler (1999) “Validity and Systematicity of Newspaper Data in Event Analysis”. European Sociological Review 15 (3): 301-322. http://esr.oxfordjournals.org/con-tent/15/3/301.short
Barron, Patrick and Joanne Sharp (2005) Counting conflicts - using newspaper reports to under-stand violence in Indonesia. Social development papers. Conflict Prevention and Reconstruc-tion Series. no. CPR 25. Washington, DC: World Bank. http://documents.worldbank.org/curated/en/2005/05/5817871/counting-conflicts-using-newspaper-reports-understand-violence-indonesia
Barron, Patrick, Anders Engvall, and Adrian Morel (2016) “Understanding Subnational Violence in Southeast Asia: The Contribution of Violent Incidents Monitoring Systems”, San Francisco: The Asia Foundation (in press)
Blair, Robert, Christoper Blattman, and Alexandra Hartman (April 2015) “Predicting Local Violence” http://papers.ssrn.com/sol3/papers.cfm?abstract_id=2497153
Croicu, Mihai and Ralph Sundberg (2015) “UCDP GED Codebook version 4.0”, Department of Peace and Conflict Research. Uppsala: Uppsala University.
Geneva Declaration Secretariat (2006) “The Geneva Declaration on Armed Violence and Develop-ment”. http://www.genevadeclaration.org/fileadmin/docs/GD-Declaration-091020-EN.pdf
Geneva Declaration Secretariat(2015) “Methodological Annexe of the Global Burden of Armed Vio-lence 2015: Every Body Counts”. Draft. http://www.genevadeclaration.org/fileadmin/docs/GBAV3/GBAV3-Methodological-Annexe.pdf
Human Security Report Project (2010) “Organized violence”. Burnaby, Canada: Simon Fraser Uni-versity. http://www.hsrgroup.org/our-work/security-stats/Organized-Violence.aspx
Kalyvas, Stathis (2004) “The Urban Bias in Research on Civil Wars.” Security Studies. 13:3, 1-3.
Kalyvas, Statis(2006) The Logic of Violence in Civil War. Cambridge, United Kingdom: Cambridge University Press. http://www.cambridge.org/us/academic/subjects/politics-international-relations/comparative-politics/logic-violence-civil-war
Krug, Etienne, Linda Dahlberg, James Mercy, Anthony Zwi, and Rafael Lozano (2002) “World report on violence and health”, Geneva: World Health Organization. http://www.who.int/violence_inju-ry_prevention/violence/world_report/en/
REFERENCE LIST
66
Parks, Tom, Colletta, Oppenheim (2013) “The Contested Corners of Asia: Subnational Conflict and International Development Assistance”. San Francisco: The Asia Foundation. http://asiafoundation.org/publications/pdf/1226
Raleigh, Clionadh, Andrew Linke, Håvard Hegre, and Joakim Karlsen (2010) “Introducing ACLED-Armed Conflict Location and Event Data”. Journal of Peace Research 47(5) 651-660.
Raleigh, Clionadh and Caitriona Dowd (2016) “Armed Conflict Location and Event Data Project (ACLED) Codebook” .2016. http://www.acleddata.com/wp-content/uploads/2016/01/ACLED_Code-book_2016.pdf
Straus, Scott (2012) “Wars do end! Changing patterns of political violence in Sub-Saharan Africa”, African Affairs. March 2012 pp 179-201.http://users.polisci.wisc.edu/straus/Straus%20Wars%20Do%20End%202012.pdf
Sundberg, Ralph, and Erik Melander (2013) “Introducing the UCDP Georeferenced Event Dataset”, Journal of Peace Research vol.50. 523-532. http://jpr.sagepub.com/content/50/4/523.full.pdf+html
UCDP (2016) “Uppsala Conflict Data Program Georeferenced Events Dataset” (UCDP-GED). http://ucdp.uu.se/ged/
UN (2005) “International Instrument to Enable States to Identify and Trace, in a Timely and Reli-able Manner, Illicit Small Arms and Light Weapons”. New York: United Nations. http://www.poa-iss.org/InternationalTracing/ITI_English.pdf
UNODC (2014) “Global Study Homicide 2013: Trends/Contexts/Data.” Vienna. United Nations Office on Drugs and Crime. http://www.unodc.org/documents/gsh/pdfs/2014_GLOBAL_HOMI-CIDE_BOOK_web.pdf
UN Women (2000) “Women and Armed Conflict”. New York: United Nations http://www.un.org/womenwatch/daw/followup/session/presskit/fs5.htm
Van der Windt, Peter, and Macartan Humphreys (2012) “Voix des Kivus: Reflections on a Crowd-seeding Approach to Conflict Event Data Gathering”. Columbia Center for Development Strategies. New York: Columbia University. http://cu-csds.org/wp-content/uploads/2012/07/Voix-des-Kivus-UBC.pdf
Varshney, Ashutosh, Mohammad Tadjoeddin, and Rizal Panggabean (2010). “Patterns of Collective Violence in Indonesia” in Ashutosh Varshney (ed.) Collective Violence in Indonesia. Boulder: Lynne Rienner Publishers, pp. 19–50.
Voix des Kivus (2011) “Event Mapping in Congo. 2009-2011”. Columbia Center for Development Strategies. New York: Columbia University. http://cu-csds.org/projects/event-mapping-in-congo/
WHO (2002) “World Report on Violence and Health – Summary”.Geneva: World Health Organiza-tion. http://www.who.int/violence_injury_prevention/violence/world_report/en/summary_en.pdf
67
WHO (2014) “Global Status Report on Violence Prevention 2014” Geneva: World Health Organiza-tion. http://www.who.int/violence_injury_prevention/violence/status_report/2014/en/
Wigmore-Shepherd, Daniel (2015) “Reporting Sources”. ACLED Working Paper 5. Armed Conflict and Event Location Data Project. http://www.acleddata.com/wp-content/uploads/2015/04/ACLED_Reporting-Sources-Working-Paper-No.-5_2015.pdf
Wilson, Chris (2008) Ethno-religious violence in Indonesia: from soil to God, London and New York: Routledge Contemporary Southeast Asia. http://www.amazon.com/Ethno-Religious-Violence-Indo-nesia-Routledge-Contemporary/dp/0415502004
REFERENCE LIST
68

69

70

71
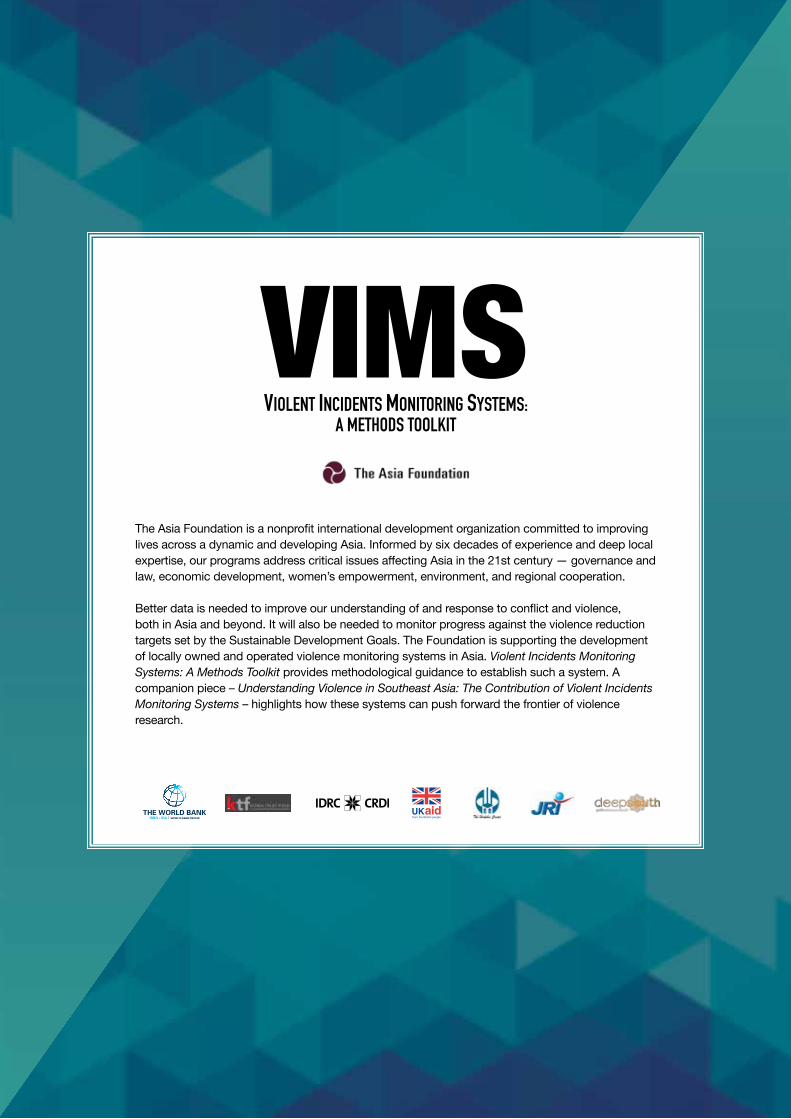
The Asia Foundation is a nonprofit international development organization committed to improving lives across a dynamic and developing Asia. Informed by six decades of experience and deep local expertise, our programs address critical issues affecting Asia in the 21st century — governance and law, economic development, women’s empowerment, environment, and regional cooperation.
Better data is needed to improve our understanding of and response to conflict and violence, both in Asia and beyond. It will also be needed to monitor progress against the violence reduction targets set by the Sustainable Development Goals. The Foundation is supporting the development of locally owned and operated violence monitoring systems in Asia. Violent Incidents Monitoring Systems: A Methods Toolkit provides methodological guidance to establish such a system. A companion piece – Understanding Violence in Southeast Asia: The Contribution of Violent Incidents Monitoring Systems – highlights how these systems can push forward the frontier of violence research.
VIOLENT INCIDENTS MONITORING SYSTEMS: A METHODS TOOLKIT
VIMS