Embed Size (px)
Citation preview
VIRAL TRANSMISSION,
NEUROPATHOGENESIS AND THERAPEUTIC
ANTIBODY STUDIES IN A MURINE MODEL OF
ENTEROVIRUS 71 ENCEPHALOMYELITIS.
TAN SOON HAO
THESIS SUBMITTED IN FULFILMENT OF
THE REQUIREMENTS FOR THE DEGREE
OF DOCTOR OF PHILOSOPHY
FACULTY OF MEDICINE
UNIVERSITY OF MALAYA
KUALA LUMPUR
2017

iii
ABSTRACT
Enterovirus A71 (EV-A71), a single, positive-stranded RNA virus, belongs to the
Picornaviridae family within the Enterovirus genus. Rarely, EV-A71 could lead to
severe neurological complications such as aseptic meningitis, encephalitis and
poliomyelitis-like acute flaccid paralysis. Patients with fatal brainstem encephalitis
usually die within a few hours after hospital admission due to sudden cardiopulmonary
arrest. The objectives of this project were to investigate various aspects of viral
transmission, neuropathogenesis and effectiveness of therapeutic antibodies in a murine
model of EV-A71 encephalomyelitis.
EV-A71 retrograde axonal transport up peripheral spinal nerves has been
previously reported. However, whether EV-A71 could use retrograde axonal transport
up cranial nerves to enter the brainstem remains unknown. To investigate this, mouse-
adapted-virus-strain (MAVS) was injected into unilateral jaw/facial muscles of groups
of mice. Infected mice were sacrificed at several time points for pathological (H&E,
immunohistochemistry and in situ hybridisation) and viral titration analysis. Viral
antigens/RNA were visualised within the cranial nerves and brainstem (motor-related
region), ipsilateral to the injection site. Brainstem viral titres were also significantly
higher than spinal cord titres at early time point.
The distribution of neuronal infection in human or mouse brain was distinct and
rather stereotyped. This could be due to the variable susceptibility of different neurons
to EV-A71 infection, or related to virus entry routes into the CNS. To study this, 2
groups of mice were intra-cerebrally (thalamus/hypothalamus or pons/medulla)
inoculated with MAVS. Infected mice were sacrificed at various time points for
pathological and viral titration analysis. In addition, a primary motor neuron cell was
also prepared from E14 mouse spinal cord to study the permissiveness of mouse motor
iv
neuron to MAVS infection. Based on the results, MAVS was not found to be replicating
extensively in the brain or primary motor neuron cells.
Skeletal muscle injury has been shown to facilitate poliovirus retrograde axonal
transport and subsequently enhances viral invasion into the CNS. To study the
possibility of involvement of this important paralytic risk factor in EV-A71 infection,
groups of mice with muscle-traumatised or non-traumatised hindlimb were
intraperitoneally-infected with MAVS. Both groups of mice did not show significant
differences in viral antigens/RNA and viral titres in hindlimb muscles and spinal cords.
To date, neither licenced vaccines nor therapeutic drugs were available to
prevent or treat EV-A71 patients with CNS manifestations. A mouse IgM MAb was
previously developed and showed cross-neutralisation of EV-A71 strains with
genotypes B3-B5, and C1-C5. With an optimum dose of MAb given after MAVS CNS
infection, a reduction of disease severity (reduced viral antigens/RNA and viral titres in
the CNS) and mortality were observed in treated mice.
In conclusion, MAVS could utilise cranial nerves to achieve brainstem infection
via retrograde axonal transport. The stereotype distribution of neuronal infection was
more likely due to viral entry routes but not due to differences in neuron susceptibility.
Skeletal muscle injury did not enhance the retrograde axonal transport of MAVS.
Mouse monoclonal antibody was useful in preventing and ameliorating CNS infection.
v
ABSTRAK
Enterovirus A71 (EV-A71), adalah virus RNA berbenang tunggal yang tergolong dalam
keluarga Pikornaviridae dalam genus enterovirus. Kadang-kala, EV-A71 boleh
mengakibatkan komplikasi neurologikal yang serius seperti meningitis aseptik,
ensefalitis dan kekakuan dan kelumpuhan flasid. Biasanya, pesakit dengan ensefalitis
mati akibat kegagalan jantung atau system pernafasan secara tiba-tiba, selepas beberapa
jam diwadkan. Tujuan utama pengajian ini adalah untuk mengaji tentang penyebaran,
neuropatogenesis dan kesan antibodi terapeutik dalam model tetikus jangkitan
Enterovirus 71. EV-A71 yang disesuaikan dalam tetikus (MAVS) dan tikus ICR yang
berumur 2 minggu digunakan dalam sepanjang kajian ini.
Sebelum ini, ramai telah melaporkan bahawa, EV-A71 boleh memasuki saraf
pusat melalui hujung saraf otot, akan tetapi, pengajian atas saraf kranial masih tidak
diketahui. Oleh itu, MAVS telah disuntik ke dalam otot muka/rahang kanan tikus. Tikus
kemudian dikorbankan pada titk masa tertentu untuk patologi (H&E, immunohistokimia
dan hibridisasi in situ) dan virus kuantifikasi analisasi. Antigen/RNA virus telah
diperhatikan dalam saraf kranial dan batang otak (kawasan neuron motorik), pada sisi
suntikan yang sama. Virus dalam batang otak juga jauh lebih tinggi daripada saraf
tulang belakang pada masa awal.
Lokasi virus dalam otak manusia atau tetikus adalah unik dan stereotipe. Ini
mungkin disebabkan oleh kecenderungan infeksi yang berbeza oleh EV-A71 dalam sel
neuron yang berbeza, atau berkait dengan laluan kemasukan virus ke dalam saraf pusat.
Dengan ini, MAVS disuntikan ke thalamus/hipotalamus atau pons/medulla dalam 2
kumpulan tikus yang berbeza. Tikus yang terlibat dikorbankan pada titik masa tertentu
untuk patologi dan kuantifikasi virus analisasi. Di samping itu, sel neuron motorik
dalam tulang belakang juaga diasingkan dari E14 tikus untuk mengaji permisif sel
vi
neuron motorik kepada jangkitan MAVS. Berdasarkan kajian ini, MAVS tidak dapat
berkembang biak secara cekap dalam sel-sel otak atau neuron motorik tulang belakang.
Dalam jangkitan poliovirus, kecederaan otot telah dibuktikan akan
meningkatkan jangkitan saraf pusat melalui penyebaran hujung saraf otot. Untuk
mengaji faktor risiko lumpuh yang penting ini dalam jangkitan EV-A71, 2 kumpulan
tikus dengan trauma otot kaki belakang atau tidak, dijangkiti dengan MAVS secara
intraperitoneum. Kedua-dua kumpulan tikus tersebut tidak menunjukkan sebarang
perbezaan yang signifikasi dalam antigen/RNA virus dan titer virus dalam otot kaki
belakang dan tulang belakang.
Setakat ini, tiada vaksin ataupun ubat terapeutik yang berlesen untuk mencegah
atau merawat pesakit EV-A71 dengan jangkitan saraf pusat. Satu antibody IgM tetikus
(MAb) yang disediakan sebelum ini menunjukkan peneutralan kepada genotipe B3-B5,
dan C1-C5 EV-A71. MAb dalam kuantiti yang optimum diberikan selepas jangkitan
saraf pusat oleh MAVS, boleh melegakan penyakit teruk (dengan mengurangkan
antigen/RNA virus dan titer virus dalam saraf pusat) dan menurunkan kadar kematian
dalam tikus yang dirawati.
Kesimpulannya, MAVS boleh menggunakan saraf kranial untuk jangkitan
batang otak melalui penyebaran hujung saraf otot. Lokasi virus yang unik dalam
jangkitan saraf pusat adalah lebih mungkin disebabkan oleh laluan kemasukan virus dan
bukannya disebabkan oleh kecenderungan infeksi yang berbeza dalam sel neuron yang
berbeza. Kecederaan otot tidak meningkatkan jangkitan saraf pusat oleh MAVS.
Antibodi monoklonal tetikus adalah berguna dalam mencegah dan melegakan jangkitan
saraf pusat.
vii
ACKNOWLEDGEMENT
First and foremost, my sincere thanks and appreciation to the University of Malaya for
the scholarship support. Special thanks to my most respected supervisors; Professor Dr.
Wong Kum Thong and Dr. Ong Kien Chai; for their constant guidance, understanding,
and support. I must also thank Dr. Satoshi Koike, Dr. Ohka seii, Dr. Ken Fujii for the
teaching and guidance in primary motor neuron cells culture experiments. I am
especially thankful to my fellow labmates and friends for the help and inspirations they
extended. Last but not least, I would like to extend my heartfelt gratitude to my amazing
family members for their never-ending love, vital encouragement, and much-needed
motivation.
viii
TABLE OF CONTENT
Page
PREFACE i - xx
1 Introduction 1
2 Literature review 5
2.1 Enterovirus 71 5
2.1.1 Classification 5
2.1.2 Physical and chemical properties 7
2.1.3 EV-A71 infection and clinical manifestations 7
2.1.4 Pathogenesis 11
2.1.5 “Provocation Poliomyelitis” 12
2.1.6 Autopsy findings in EV-A71 CNS infection 14
2.1.7 Neuropathogenesis 15
2.2 Immune response 17
2.3 Animal models 20
2.4 Anti-viral therapeutics and vaccines 25
2.4.1 Inactivated vaccines 25
2.4.2 Baculovirus-expressed vaccines 26
2.4.3 Intravenous immunoglobulin (IVIG) treatment 27
2.4.4 Monoclonal antibody (MAb) 28
3 Materials and methods 29
3.1 Cell lines 29
3.2 Virus preparation and concentration 30
3.2.1 Preparation of fluorescence-labelled EV-A71
3.2.2 Preparation of light-sensitive MAVS
32
32
3.3 Preparation of hyperimmune sera against MAVS 32
3.4 Preparation of specific monoclonal antibody against MAVS 33
3.4.1 MAb characterisation 34
3.5 Microneutralising assay 34
ix
3.6 Mouse infection experiments 34
3.6.1 MAVS infection via unilateral jaw/facial muscle inoculation 35
3.6.1.1 Histopathological analysis 36
3.6.1.1 (a) IHC to detect viral antigens 36
3.6.1.1 (b) ISH to detect viral RNA 37
3.6.1.2 Virus titration analysis 37
3.6.2 Optimisation of passive immunisation in mice infected via
unilateral jaw/facial muscle 38
3.6.2.1 Histopathological analysis and IHC 39
3.6.2.2 Virus titration analysis 39
3.6.2.3 Viral RNA extraction, RT-PCR and qPCR 39
3.6.3 Mice infected via unilateral jaw/facial muscle and treated with
optimised passive immunisation 40
3.6.3.1 Histopathological analysis, IHC and ISH 40
3.6.3.2 Viral titration analysis 40
3.6.4 MAVS infection via intra-cerebral (thalamus/hypothalamus and
pons/medulla) inoculation 41
3.6.4.1 Histopathological analysis, IHC and ISH staining 41
3.6.4.2 Viral titration analysis 42
3.6.5 Investigation of the “provocation poliomyelitis” phenomenon in
MAVS infection 42
3.6.5.1 Histopathological analysis, IHC staining 43
3.6.5.2 Viral titration analysis 43
3.6.5.3 Total protein extraction and WGA quantification 43
3.6.6 Investigation of the link between muscle infection and
retrograde axonal transport in spinal cord infection. 44
3.6.6.1 Viral titration analysis 44
3.6.7 Prevention and treatment of MAVS infection using neutralising
antibodies 44
3.6.7.1 Histopathological analysis, IHC and ISH staining 46
3.6.7.2 Viral titration analysis 46
3.6.7.3 Viral RNA extraction, RT-PCR, qPCR 46
3.7 Primary murine motor neuron culture 47
3.7.1 Transfection of primary murine motor neurons 47
x
3.7.2 Double immunofluorescence staining for EV-A71 and
hSCARB2 48
3.8 Statistic Analysis 49
4 Results 50
4.1 Fluorescent labelled EV-A71 50
4.2 Brainstem infection via retrograde axonal transport in cranial nerves 51
4.2.1 MAVS infection via unilateral jaw/facial muscles 51
4.2.1.1 Pathological studies 51
4.2.1.2 Viral titration analysis 59
4.2.2 Optimisation of passive immunisation in unilaterally-infected
mice to abrogate viraemia 61
4.2.3 Mice unilaterally-infected in the jaw/facial muscles and given
optimised passive immunisation to abrogate viraemia 64
4.2.3.1 Pathological studies 64
4.2.3.2 Viral titration analysis 67
4.3 Susceptibility of neurons to direct MAVS infection 68
4.3.1 MAVS infection of neurons in IC-inoculated
(thalamus/hypothalamus) mice 68
4.3.1.1 Pathological studies 68
4.3.1.2 Viral titration analysis 73
4.3.2 MAVS infection of neurons in IC-inoculated (pons/medulla)
mice 75
4.3.2.1 Pathological studies 75
4.3.2.2 Viral titration analysis 79
4.3.3 MAVS infection of primary murine motor neurons 81
4.3.3.1 MAVS infection of primary motor neurons transfected
with hSCARB2 82
4.4 Retrograde axonal transport in hSCARB2 primary motor neurons 83
4.4.1 Primary motor neuron study 83
4.4.1.1 Viral titration analysis 85
4.5 EV-A71 “Provocation poliomyelitis” 87
4.5.1 MAVS infection in mice with experimentally-traumatised
gastrocnemius muscles 87
4.5.1.1 Pathological studies 87
xi
4.5.1.2 Viral titration analysis 90
4.5.2 Infection studies on light-sensitive MAVS 92
4.5.2.1 Viral titration analysis 92
4.6 Prevention and treatment of MAVS infection using neutralising
antibodies 94
4.6.1 Hyperimmune sera treatment of MAVS-infected mice with
CNS involvement 94
4.6.1.1 Survival analysis 94
4.6.1.2 Pathological studies 95
4.6.1.3 Viral titration analysis 99
4.6.2 MAb in treatment of MAVS-infected mice with CNS
involvement 100
4.6.2.1 MAb production and characteristics 100
4.6.2.2 Survival analysis 101
4.6.2.3 Pathological studies 106
4.6.2.4 Viral titration analysis 110
4.6.2.5 Real-time PCR (qPCR) analysis 112
5 Discussion 114
5.1 Enterovirus 71 Brainstem Infection via Cranial Nerves 114
5.2 Infectivity of EV-A71 in Neuronal Cells 118
5.3 Enterovirus 71 Provocation Acute Flaccid Paralysis 129
5.4 Infectivity of EV-A71 (MAVS) in non-neuronal tissues 131
5.5 Prevention and treatment of EV-A71 CNS infection 134
6 Conclusion 139
7
Limitation and future studies 139
References 141
List of publications and papers presented 154
Appendix 155
xii
LIST OF FIGURES
Figure Page
2.1 Structure of EV71 virion. 6
2.2 Mucocutaneous lesions in hand, foot, and mouth disease. 8
2.3 MRI characteristics of EV-A71 encephalomyelitis. 10
2.4 MRI characteristics of EV-A71 related AFP. 10
3.1 Schedule of MAb 3D1 treatment, animal sacrifice and tissue sampling
following MAVS infection, in Experiment 3. 46
4.1 NAP5 fractionation of Alexafluor-555 labelled EV-A71. 50
4.2 Clinical observation, and pathological findings following unilateral
jaw/facial muscle infection. 53
4.3 Approximation of the distribution of viral antigens/RNA in the CNS
following unilateral jaw/facial muscles infection. 55
4.4 Pathological findings following unilateral jaw/facial muscles infection. 56
4.5 Viral titres in muscle tissues and sera following unilateral jaw/facial
muscles infection. 60
4.6 Viral titres in CNS tissues and sera following unilateral jaw/facial
muscles infection. 60
4.7 Viral antigens in muscles and motor trigeminal nucleus following
unilateral jaw/facial muscles infection of pre-immunised mice. 63
4.8 Approximation of the distribution of viral antigens/RNA/inflammation
in the CNS following unilateral jaw/facial muscles infection in pre-
infection immunised mice without presence of viraemia.
65
4.9 Pathological findings in mice following unilateral jaw/facial muscle
infection and passively immunised to abrogate viraemia. 66
4.10 Viral titres in CNS tissues and sera following unilateral jaw/facial
muscle infection and passively immunised to abrogate viraemia. 67
4.11 Approximation of the distribution of viral antigens in the CNS
following IC-inoculation (right thalamus/hypothalamus*). 70
4.12 Pathological findings following IC-inoculation
(thalamus/hypothalamus). 71
xiii
4.13 Viral titres in muscle tissues and sera following IC-inoculation
(thalamus/hypothalamus). 74
4.14 Viral titres in CNS tissues and sera following IC-inoculation
(thalamus/hypothalamus). 74
4.15 Approximation of the distribution of viral antigens/RNA in the CNS
following IC-inoculation (pons/medulla). 77
4.16 Pathological findings following IC-inoculation (pons/medulla). 78
4.17 Viral titres in muscle tissues and sera following IC-inoculation
(pons/medulla). 80
4.18 Viral titres in CNS tissues and sera following IC-inoculation
(pons/medulla). 80
4.19 EV-A71 infection of primary murine motor neurons. 81
4.20 EV-A71 infection of primary murine motor neurons transfected with
hSCARB2. 82
4.21 Live cell imaging of infected primary motor neurons. 84
4.22 Double immunofluorescence staining of EV-A71 and hSCARB2. 85
4.23 Mean viral titres from both neuronal cell body and axon terminal
chambers, after introduction of virus into the cell body chamber. 86
4.24 Mean viral titres from both neuronal cell body and axon terminal
chambers, after introduction of virus into the axon terminal chamber. 86
4.25 Pathological findings following IP-inoculation, in gastrocnemius
muscle-traumatised and non-traumatised mice. 89
4.26 IHC detection of WGA dot blotted onto nitrocellulose membrane. 90
4.27 Viral titres in CNS and muscle tissues following IP-inoculation at 1.78
x 102 CCID50 (A) and 90 CCID50 (B), in gastrocnemius muscle-
traumatised and non-traumatised mice.
91
4.28 Viral titres in muscle tissues and CNS following IM-inoculation,
sacrificed at 24 (A), 48 (B) and 72 hpi (C). 93
4.29 Survival graph of infected animals in mock-treated, 12 hpi treated, 24
hpi treated, and pre-infection immunised groups followed for 21 days. 95
4.30 Approximation of the distribution of viral antigens/RNA in the CNS
following unilateral right jaw/facial muscles inoculation in treated and
mock-treated mice.
97
xiv
4.31 Viral antigens in mock-treated, 12 hpi treated, 24 hpi treated, and pre-
infection immunised mice. 98
4.32 Viral titres in CNS tissues and sera following IM-inoculation and
treated at 12 and 24 hpi. 99
4.33 Survival graph of infected animals in mock-treated, and treated at 24
and 48 hpi (A); treated at 72 and 96 hpi (B); and treated daily for 3
consecutive days at 120 µg of MAb (C), for 21 days.
103
4.34 Clinical scores of infected animals in mock-treated, and treated at 24
and 48 hpi (A); treated at 72 and 96 hpi (B); and treated daily for 3
consecutive days at 120 µg of MAb (C), for 21 days.
105
4.35 Approximation of the distribution of viral antigens in the CNS
following IP-inoculation in mock-treated and treated animals. 108
4.36 Pathological findings following IP-inoculation in mock-treated and
treated animals at different hpi. 109
4.37 Viral titres in muscle tissues following IP-inoculation in mock-treated
and treated animals. 111
4.38 Viral titres in CNS following IP-inoculation in mock-treated and
treated animals. 111
4.39 Viral copy number of muscle tissues following IP-inoculation in mock-
treated and treated animals. 112
4.40 Viral copy number of CNS tissues following IP-inoculation in mock-
treated and treated animals. 113
5.1 Comparison of brainstem viral titres from intra-muscular, intra-
thalamus/hypothalamus and intra-pons/medulla inoculated mice
sacrificed at 24, 48, and 72 hpi.
125
xv
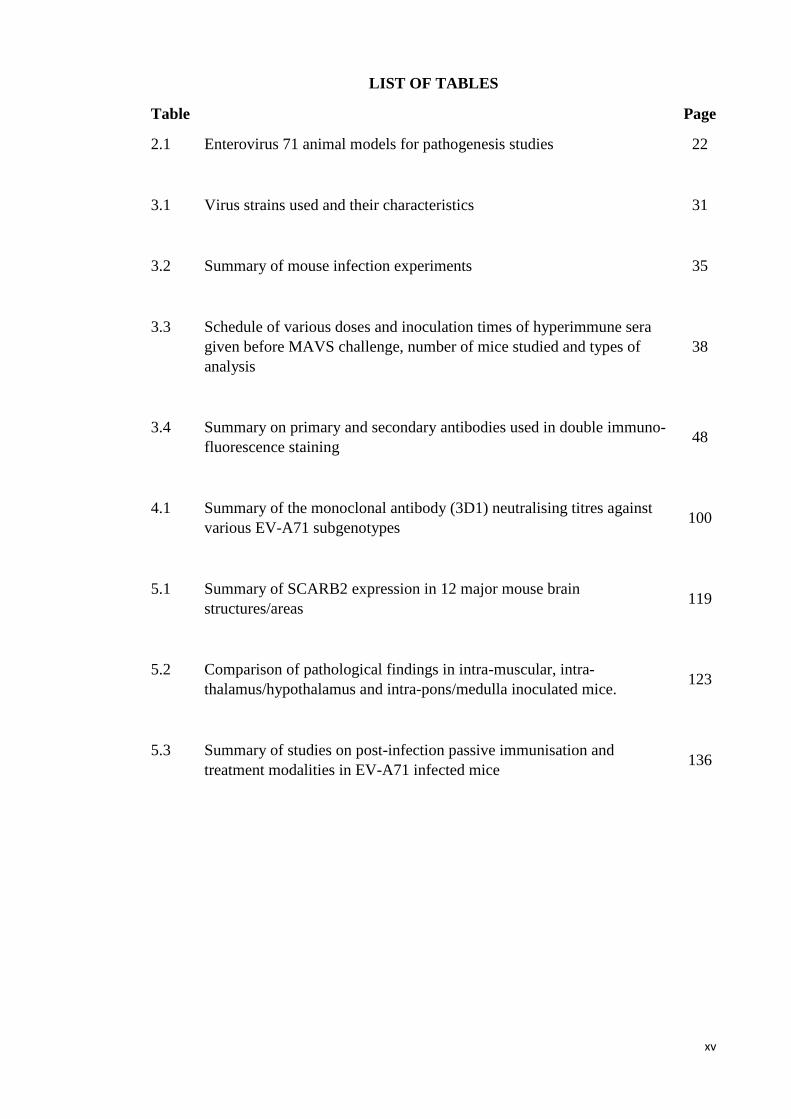
LIST OF TABLES
Table Page
2.1 Enterovirus 71 animal models for pathogenesis studies 22
3.1 Virus strains used and their characteristics 31
3.2 Summary of mouse infection experiments 35
3.3 Schedule of various doses and inoculation times of hyperimmune sera
given before MAVS challenge, number of mice studied and types of
analysis
38
3.4 Summary on primary and secondary antibodies used in double immuno-
fluorescence staining 48
4.1 Summary of the monoclonal antibody (3D1) neutralising titres against
various EV-A71 subgenotypes 100
5.1 Summary of SCARB2 expression in 12 major mouse brain
structures/areas 119
5.2 Comparison of pathological findings in intra-muscular, intra-
thalamus/hypothalamus and intra-pons/medulla inoculated mice. 123
5.3 Summary of studies on post-infection passive immunisation and
treatment modalities in EV-A71 infected mice 136
xvi
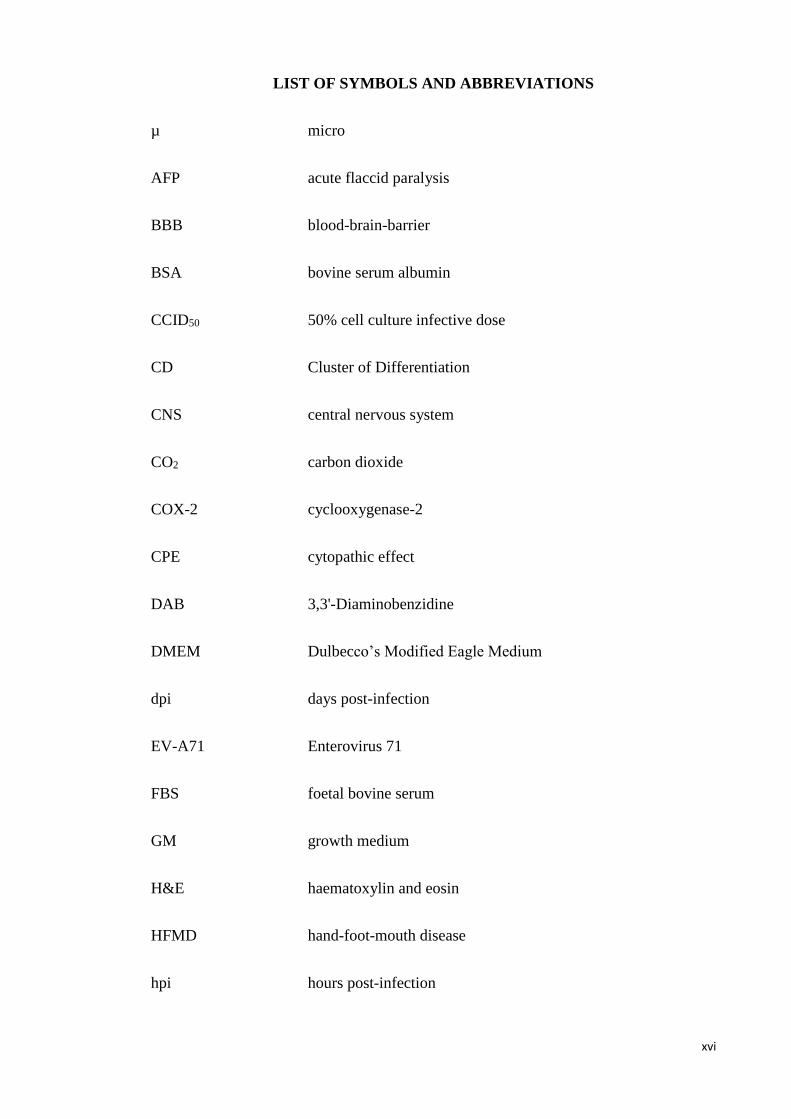
LIST OF SYMBOLS AND ABBREVIATIONS
µ micro
AFP acute flaccid paralysis
BBB blood-brain-barrier
BSA bovine serum albumin
CCID50 50% cell culture infective dose
CD Cluster of Differentiation
CNS central nervous system
CO2 carbon dioxide
COX-2 cyclooxygenase-2
CPE cytopathic effect
DAB 3,3'-Diaminobenzidine
DMEM Dulbecco’s Modified Eagle Medium
dpi days post-infection
EV-A71 Enterovirus 71
FBS foetal bovine serum
GM growth medium
H&E haematoxylin and eosin
HFMD hand-foot-mouth disease
hpi hours post-infection
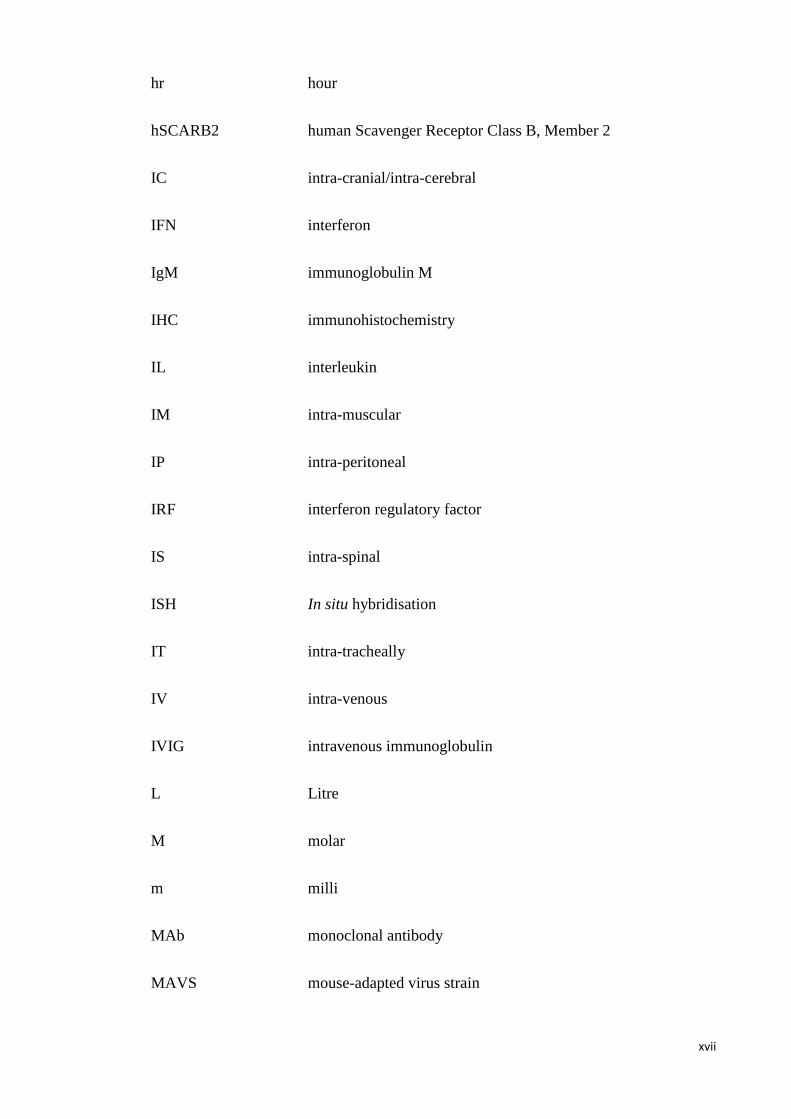
xvii
hr hour
hSCARB2 human Scavenger Receptor Class B, Member 2
IC intra-cranial/intra-cerebral
IFN interferon
IgM immunoglobulin M
IHC immunohistochemistry
IL interleukin
IM intra-muscular
IP intra-peritoneal
IRF interferon regulatory factor
IS intra-spinal
ISH In situ hybridisation
IT intra-tracheally
IV intra-venous
IVIG intravenous immunoglobulin
L Litre
M molar
m milli
MAb monoclonal antibody
MAVS mouse-adapted virus strain
xviii
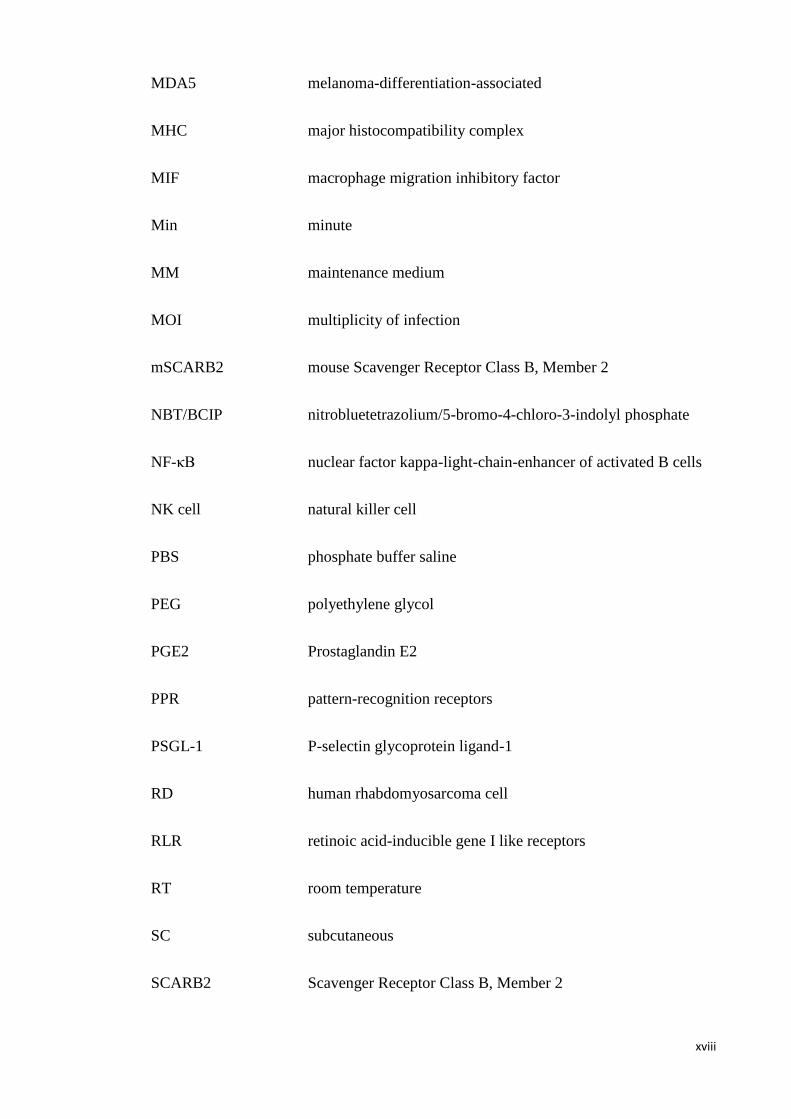
MDA5 melanoma-differentiation-associated
MHC major histocompatibility complex
MIF macrophage migration inhibitory factor
Min minute
MM maintenance medium
MOI multiplicity of infection
mSCARB2 mouse Scavenger Receptor Class B, Member 2
NBT/BCIP nitrobluetetrazolium/5-bromo-4-chloro-3-indolyl phosphate
NF-κB nuclear factor kappa-light-chain-enhancer of activated B cells
NK cell natural killer cell
PBS phosphate buffer saline
PEG polyethylene glycol
PGE2 Prostaglandin E2
PPR pattern-recognition receptors
PSGL-1 P-selectin glycoprotein ligand-1
RD human rhabdomyosarcoma cell
RLR retinoic acid-inducible gene I like receptors
RT room temperature
SC subcutaneous
SCARB2 Scavenger Receptor Class B, Member 2
xix
sec second
TBS Tris-buffer saline
TD T cell dependent
Tg transgenic
TI T cell independent
TLR toll-like receptors
TNF tumour necrosis factors
USA The United States of America
VCAM-1 vascular cell adhesion molecule 1
VERO African green monkey kidney cell
VLP virus-like particles
VSMC vascular smooth muscle cells
WGA wheat germ agglutinin
wt/vol weight/volume
xx
LIST OF APPENDICES
Page
Appendix A
Solution for IHC
153
Appendix B
Solution for ISH
154
Appendix C
Primers and probe for qPCR
160
1
1.0 Introduction
Human Enterovirus A71 (EV-A71) belongs to the Picornaviridae family and genus of
Enterovirus (Fields, Knipe, & Howley, 2013). EV-A71 is one of the major causative
agents for hand-foot-mouth disease (HFMD), affecting mainly children below 5 years
old. In some cases, it may progress to central nervous system (CNS) causing aseptic
meningitis, encephalomyelitis and acute flaccid paralysis (AFP). Severe
encephalomyelitis can be fatal, especially in younger patients (Ong & Wong, 2015;
Solomon et al., 2010).
EV-A71 was first isolated in 1969, from a CNS-infected patient in California,
USA, and reported by Schmidt, Lennette, and Ho (1974). Since then, there have been
many more reports of EV-A71 outbreaks periodically in many parts of the world – USA,
Europe, Asia, Australia, and Africa (World Health Organization, 2011). Recently, large
outbreaks of HFMD mainly due to EV-A71 infection, appeared across the Asia Pacific
regions, causing fatal neurologic complications. During the outbreak in mainland China
in 2009, 1,155,525 cases with 13,810 severe cases and 353 deaths were reported (World
Health Organization, 2011). Typically, after a few days of nonspecific fever, cough,
with or without skin lesions, children with severe EV-A71 encephalomyelitis usually
die from sudden cardiorespiratory collapse and pulmonary oedema within hours of
hospital admission (Ong & Wong, 2015; K. T. Wong et al., 2008). Based on autopsy
studies, fatal EV-A71 cases showed severe inflammation within the spinal cord,
brainstem, hypothalamus, and cerebellar dentate nucleus (Lu et al., 2009; Wei, Li, &
Chen, 2010; K. T. Wong et al., 2008; Yang et al., 2009). This distinct and stereotyped
distribution of inflammation suggested the possibility that EV-A71 could utilise
retrograde axonal transport via peripheral nerves to reach the CNS.
2
Several animal experiments support the hypothesis of retrograde axonal
transport from peripheral nerves (Ong et al., 2008; Y. F. Wang & Yu, 2014). We
hypothesised that EV-A71 can utilise cranial nerves to directly infect the brainstem,
resulting in a sudden cardiopulmonary collapse in fatal encephalomyelitis. Very little is
known about transmission and spread of EV-A71 within the CNS after viral entry via
peripheral nerves. After entry into the CNS, following neuronal infection, viral cytolysis
occurs but immune mediated or bystander effects might also play an important role in
tissue injury. In support of viral cytolysis, EV-A71 antigens/RNA were visualised
within the neuronal bodies and processes in human autopsy reports and animal models
(Ong & Wong, 2015).
Among the various possible viral entry receptors for EV-A71, Scavenger
Receptor Class B, Member 2 (SCARB2) appears to be the most promising so far. The
essential role of SCARB2 in the development of EV-A71 neurological disease in vivo
was shown in a recent transgenic (Tg) mouse model (Yamayoshi, Fujii, & Koike, 2014).
The association of SCARB2 receptors and viral tissue tropism was also suggested in
human and other mouse studies but the results have yet to be confirmed (Fujii et al.,
2013; Y. He et al., 2014; Jiao, Guo, Huang, Chang, & Qiu, 2014; Yu et al., 2014).
“Provocation poliomyelitis” defined as muscle weakness (or paralysis) caused
by poliovirus infection in motor neurons within spinal cord has been known for a long
time. It is believed to be due to injured muscle tissues from the trauma of injection that
aids the poliovirus infection of the spinal cord (Gromeier & Wimmer, 1998; John &
Vashishtha, 2013). Since EV-A71 belongs to the same Enterovirus genus as poliovirus,
and could cause similar AFP, it is possible that EV-A71 infection may be associated
with the same “provocation poliomyelitis” phenomenon (Gorson & Ropper, 2001). EV-
A71 provocation AFP was studied by comparing the viral localisation and quantitation
3
in the CNS in a muscle-traumatised and non-traumatised mouse model of EV-A71
encephalomyelitis.
Although several vaccines are actively being studied and clinical trials are
progressing well, there are still no vaccines and therapeutic drugs licenced for EV-A71
infection (Ng, He, & Kwang, 2015). Intravenous immunoglobulin (IVIG) at high
neutralising titres, have been recommended as possible therapeutic treatments against
severe EV-A71 infection in Taiwan and China (R. Cao, Han, Qin, & Qin, 2011; C. C.
Huang, 2001). However, the effectiveness of IVIG varies according to different
manufacturers and times of collection causing batch to batch variations in the pooled
sera (Ng et al., 2015). Several monoclonal antibodies (MAbs) as an alternative options
to IVIG had been proven to have good prophylactic effect in animal models.
Nevertheless, to date, most MAbs have been tested on animal models of EV-A71
infection, that display both myositis and CNS infection. Since, myositis and/or CNS
infection could lead to limb paralysis or death, improvements in survival or
amelioration/prevention of paralysis, without histopathological analysis is not sufficient
to show if MAb is effective after CNS infection has occurred. This is particularly
important since in human infections, CNS involvement is a major cause of death.
4
The objectives of this study are as follows:
1. To determine the role of cranial nerves in direct brainstem infection.
2. To investigate neuronal susceptibility to EV-A71 transmission within the brain,
and its association with SCARB2 receptors.
3. To investigate the phenomenon of “provocation poliomyelitis” in EV-A71
infection.
4. To investigate the effectiveness of a MAb after established CNS infection.
5
2.0 Literature review
2.1 Enterovirus 71
2.1.1 Classification
Enterovirus 71 (EV-A71) belongs to the Enterovirus genus of the Picornaviridae family.
The name “Picornavirus” is derived from the prefix pica (meaning very small) + RNA +
virus. Picornaviruses are non-enveloped viruses, each with a single positive strand of
RNA (Fields et al., 2013). The genus Enterovirus consists of 12 species: Enterovirus A-
H, Enterovirus J and Rhinovirus A-C, based on molecular and biological properties of
the viruses. Serotypes EV-A71 and coxsackieviruses A2-A8, A10, A12, A14, A16 and
enteroviruses A76, A89-92, A114, A119-121 and the simian enteroviruses SV19, SV43,
SV46 and baboon enterovirus A13 are all belong to the species Enterovirus A (Adams,
King, & Carstens, 2013). EV-A71 can be further classified into three genogroups (A, B
and C) based on the complete VP1 sequence. Genogroup A consists of a single member,
strain BrCr-CA-70. Genogroups B and C, each can be divided into five distinct
subgenogroups (B1 to B5, and C1 to C5) (Brown, Oberste, Alexander, Kennett, &
Pallansch, 1999).
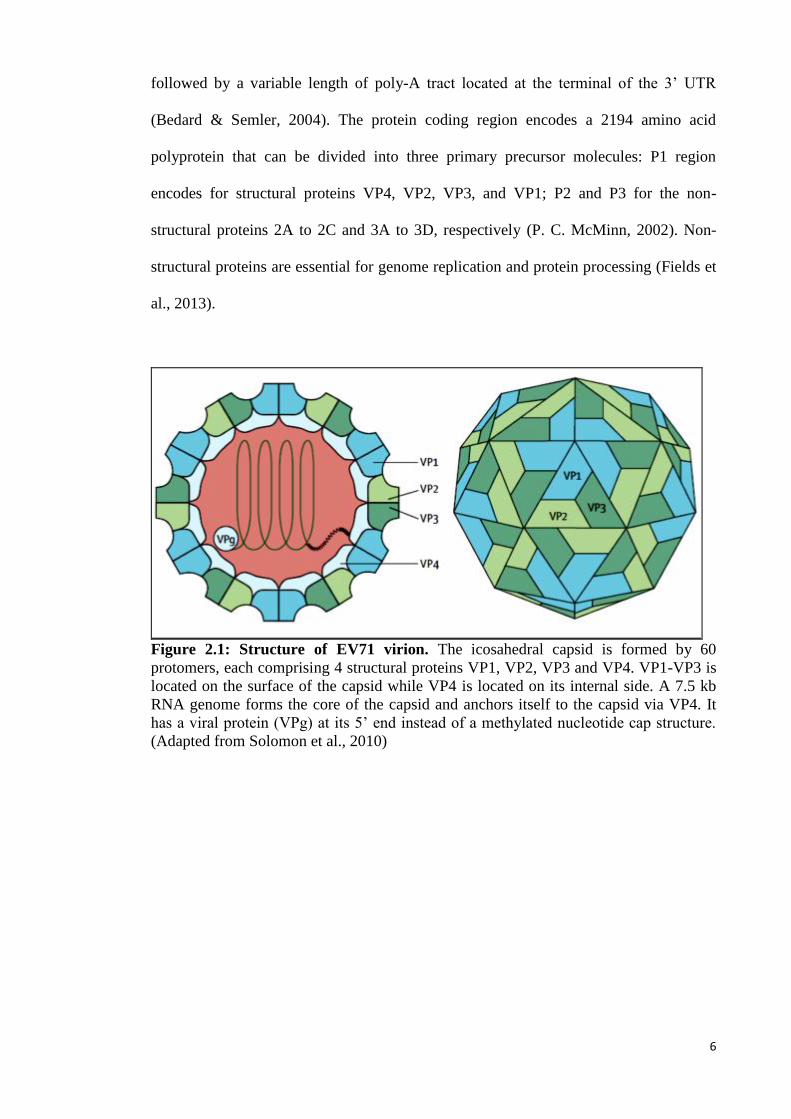
Like other enteroviruses, EV-A71 has a diameter of approximately 30 nm, a
non-enveloped, pentameric icosahedral capsid, which comprises 60 identical protomers.
Each protomer consists of 4 structural viral proteins (VP1 to VP4) (Figure 2.1). The
VP1, VP2 and VP3 proteins are located on the external surface of the capsid whereas
VP4 is located on the inside (Fields et al., 2013; Plevka, Perera, Cardosa, Kuhn, &
Rossmann, 2012). Within the viral capsid is the RNA genome, which is about 7.4 kb.
The viral protein (VPg) is covalently anchored at the 5’ terminal and acts as a protein
primer to initiate RNA synthesis during the viral replication (Figure 2.1). The coding
region is flanked by 5’ and 3’ untranslated regions (UTR) at both ends, respectively,
6
followed by a variable length of poly-A tract located at the terminal of the 3’ UTR
(Bedard & Semler, 2004). The protein coding region encodes a 2194 amino acid
polyprotein that can be divided into three primary precursor molecules: P1 region
encodes for structural proteins VP4, VP2, VP3, and VP1; P2 and P3 for the non-
structural proteins 2A to 2C and 3A to 3D, respectively (P. C. McMinn, 2002). Non-
structural proteins are essential for genome replication and protein processing (Fields et
al., 2013).
Figure 2.1: Structure of EV71 virion. The icosahedral capsid is formed by 60
protomers, each comprising 4 structural proteins VP1, VP2, VP3 and VP4. VP1-VP3 is
located on the surface of the capsid while VP4 is located on its internal side. A 7.5 kb
RNA genome forms the core of the capsid and anchors itself to the capsid via VP4. It
has a viral protein (VPg) at its 5’ end instead of a methylated nucleotide cap structure.
(Adapted from Solomon et al., 2010)
7
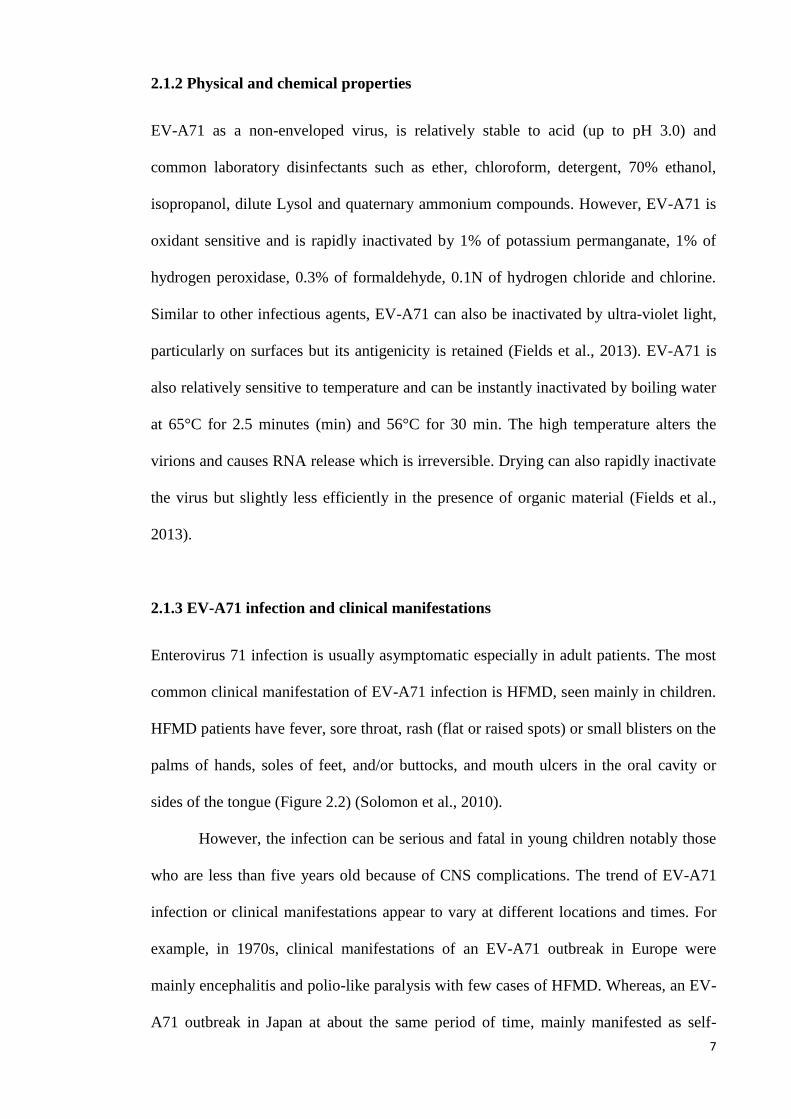
2.1.2 Physical and chemical properties
EV-A71 as a non-enveloped virus, is relatively stable to acid (up to pH 3.0) and
common laboratory disinfectants such as ether, chloroform, detergent, 70% ethanol,
isopropanol, dilute Lysol and quaternary ammonium compounds. However, EV-A71 is
oxidant sensitive and is rapidly inactivated by 1% of potassium permanganate, 1% of
hydrogen peroxidase, 0.3% of formaldehyde, 0.1N of hydrogen chloride and chlorine.
Similar to other infectious agents, EV-A71 can also be inactivated by ultra-violet light,
particularly on surfaces but its antigenicity is retained (Fields et al., 2013). EV-A71 is
also relatively sensitive to temperature and can be instantly inactivated by boiling water
at 65°C for 2.5 minutes (min) and 56°C for 30 min. The high temperature alters the
virions and causes RNA release which is irreversible. Drying can also rapidly inactivate
the virus but slightly less efficiently in the presence of organic material (Fields et al.,
2013).
2.1.3 EV-A71 infection and clinical manifestations
Enterovirus 71 infection is usually asymptomatic especially in adult patients. The most
common clinical manifestation of EV-A71 infection is HFMD, seen mainly in children.
HFMD patients have fever, sore throat, rash (flat or raised spots) or small blisters on the
palms of hands, soles of feet, and/or buttocks, and mouth ulcers in the oral cavity or
sides of the tongue (Figure 2.2) (Solomon et al., 2010).
However, the infection can be serious and fatal in young children notably those
who are less than five years old because of CNS complications. The trend of EV-A71
infection or clinical manifestations appear to vary at different locations and times. For
example, in 1970s, clinical manifestations of an EV-A71 outbreak in Europe were
mainly encephalitis and polio-like paralysis with few cases of HFMD. Whereas, an EV-
A71 outbreak in Japan at about the same period of time, mainly manifested as self-
8
limiting HFMD with only a minority of cases with CNS involvement (Ho, 2000; S. S.
Wong, Yip, Lau, & Yuen, 2010). In 1998, an EV-A71 outbreak in Taiwan appeared to
have caused the largest number of severe cases (405 cases) and deaths (78 cases) at that
time (T. Y. Lin, Chang, Hsia, et al., 2002; S. M. Wang et al., 1999). However, only 7%
of patients were reported to have CNS complications in Australia at the same period (P.
McMinn, Stratov, Nagarajan, & Davis, 2001).
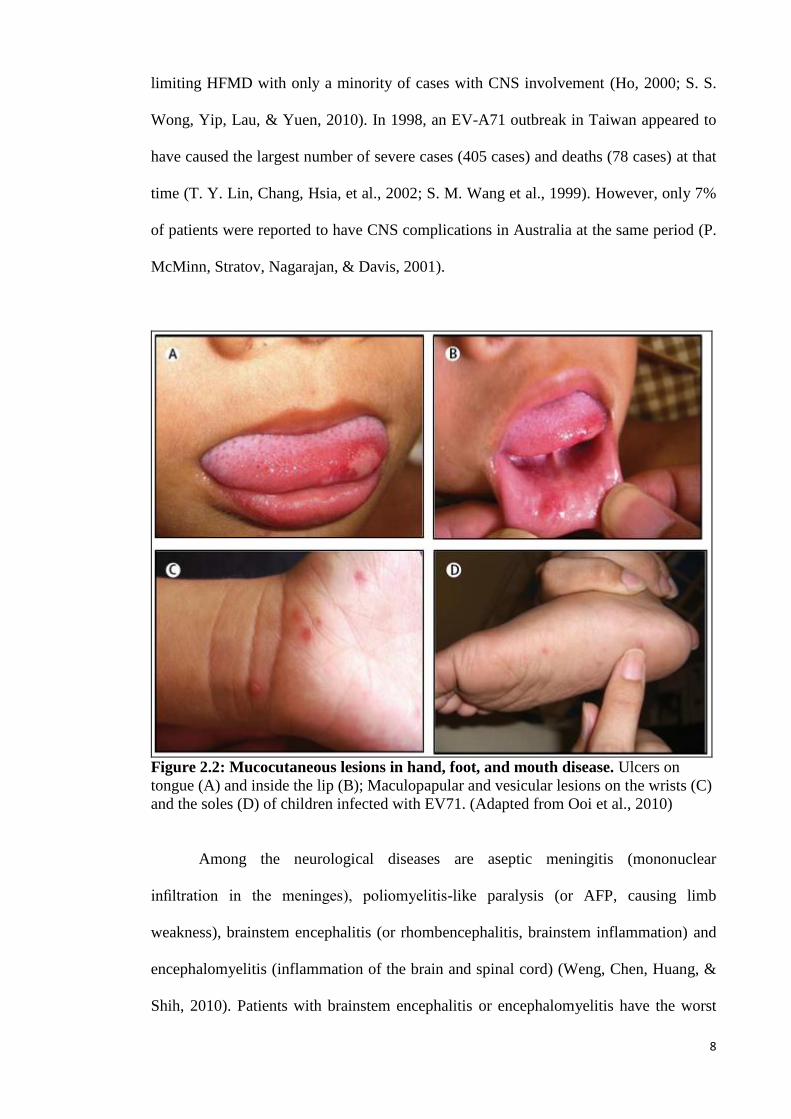
Figure 2.2: Mucocutaneous lesions in hand, foot, and mouth disease. Ulcers on
tongue (A) and inside the lip (B); Maculopapular and vesicular lesions on the wrists (C)
and the soles (D) of children infected with EV71. (Adapted from Ooi et al., 2010)
Among the neurological diseases are aseptic meningitis (mononuclear
infiltration in the meninges), poliomyelitis-like paralysis (or AFP, causing limb
weakness), brainstem encephalitis (or rhombencephalitis, brainstem inflammation) and
encephalomyelitis (inflammation of the brain and spinal cord) (Weng, Chen, Huang, &
Shih, 2010). Patients with brainstem encephalitis or encephalomyelitis have the worst
9
prognoses and are usually associated with pulmonary oedema and myocardial
dysfunction (Lum, Wong, Lam, Chua, & Goh, 1998; Weng et al., 2010). C. C. Huang et
al. (1999) had analysed 44 cases of EV-A71 CNS involvement during the 1998 Taiwan
outbreak and divided the brainstem encephalitis / encephalomyelitis into 3 stages based
on degree of CNS infection. The first stage is defined by muscle tremors and ataxia
from which 5% of the children develop permanent neurological sequelae. The second
stage is muscle tremors and cranial nerve involvement which is associated with
permanent neurological sequelae in 20% of the children. The last stage is defined by
rapid cardiopulmonary failure and fatality in 80% of the children. Survivors are often
left with serious sequelae (C. C. Huang et al., 1999).
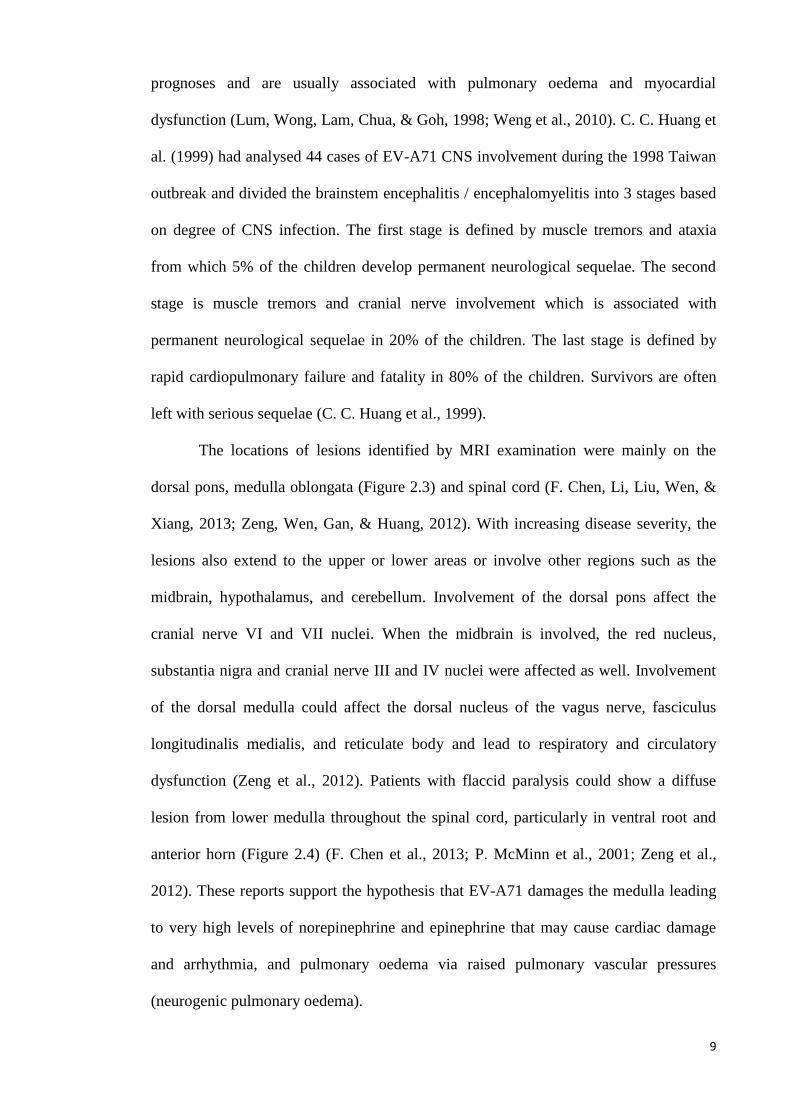
The locations of lesions identified by MRI examination were mainly on the
dorsal pons, medulla oblongata (Figure 2.3) and spinal cord (F. Chen, Li, Liu, Wen, &
Xiang, 2013; Zeng, Wen, Gan, & Huang, 2012). With increasing disease severity, the
lesions also extend to the upper or lower areas or involve other regions such as the
midbrain, hypothalamus, and cerebellum. Involvement of the dorsal pons affect the
cranial nerve VI and VII nuclei. When the midbrain is involved, the red nucleus,
substantia nigra and cranial nerve III and IV nuclei were affected as well. Involvement
of the dorsal medulla could affect the dorsal nucleus of the vagus nerve, fasciculus
longitudinalis medialis, and reticulate body and lead to respiratory and circulatory
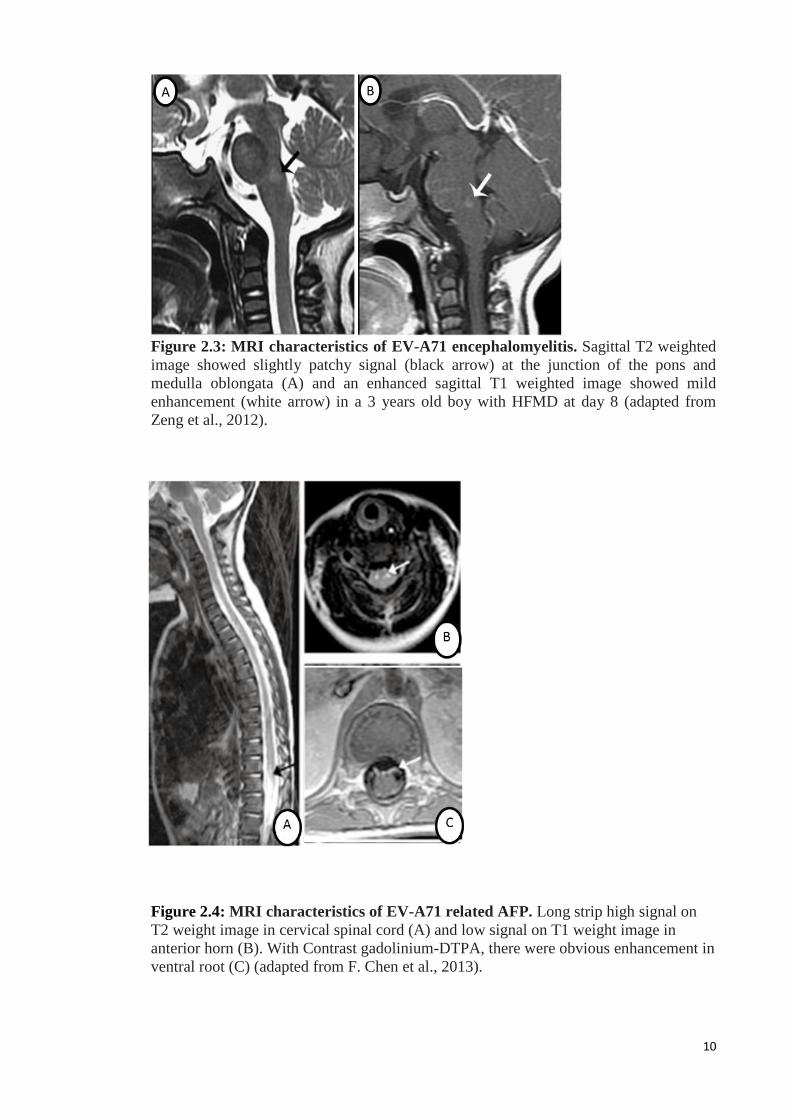
dysfunction (Zeng et al., 2012). Patients with flaccid paralysis could show a diffuse
lesion from lower medulla throughout the spinal cord, particularly in ventral root and
anterior horn (Figure 2.4) (F. Chen et al., 2013; P. McMinn et al., 2001; Zeng et al.,
2012). These reports support the hypothesis that EV-A71 damages the medulla leading
to very high levels of norepinephrine and epinephrine that may cause cardiac damage
and arrhythmia, and pulmonary oedema via raised pulmonary vascular pressures
(neurogenic pulmonary oedema).
10
A
A
B
A
Figure 2.3: MRI characteristics of EV-A71 encephalomyelitis. Sagittal T2 weighted
image showed slightly patchy signal (black arrow) at the junction of the pons and
medulla oblongata (A) and an enhanced sagittal T1 weighted image showed mild
enhancement (white arrow) in a 3 years old boy with HFMD at day 8 (adapted from
Zeng et al., 2012).
Figure 2.4: MRI characteristics of EV-A71 related AFP. Long strip high signal on
T2 weight image in cervical spinal cord (A) and low signal on T1 weight image in
anterior horn (B). With Contrast gadolinium-DTPA, there were obvious enhancement in
ventral root (C) (adapted from F. Chen et al., 2013).
11
2.1.4 Pathogenesis
EV-A71 pathogenesis is still not fully understood and is being actively studied at the
moment. It is widely accepted that EV-A71 is transmitted via faecal-oral route
(Solomon et al., 2010). However, it may also spread through contact with virus-
contaminated oral secretions, vesicular fluids, surfaces and respiratory droplets (Ong &
Wong, 2015). Similar to what is believed to be happening in poliovirus infection, EV-
A71 may start its initial replication in lymphoid tissues of the oropharyngeal cavity
(tonsils) and the (Peyer’s patches) small bowels. Previous reports had shown that viral
titres from throat swabs were significantly higher than viral titres from rectal swabs or
faeces (M. H. Ooi et al., 2009; M. H. Ooi, Wong, et al., 2007). Furthermore, viral
antigens and RNA were detected in squamous epithelium lining of tonsillar crypts via
immunohistochemistry (IHC) and in situ hybridisation (ISH) staining, respectively,
suggesting that the palatine tonsil and other parts of the oral mucosa could be the
primary replication sites for EV-A71 (Y. He et al., 2014). On the other hand, so far
gastrointestinal tract has not been found to be infected in any of the infected human
cases, but various animal models suggested that the viruses may be able to replicate in
gastrointestinal epithelium (Y. C. Chen et al., 2004; Phyu, Ong, & Wong, 2016). In in
vitro studies, EV-A71 had been shown to infect, replicate and induce apoptosis in
endothelial cells (C. C. Liang et al., 2004). Following primary replication, viruses could
enter the tonsil and/or oropharyngeal mucosa to further spread into regional lymph
nodes and leading to mild viraemia. However, lymph node infection/replication has not
been demonstrated so far.
Based on poliovirus CNS infection as a model, EV-A71 could theoretically
invade the CNS via two routes, either by a haematogenous route and a retrograde
peripheral nerve axonal transport route. EV-A71 could penetrate the blood-brain-barrier
(BBB) following viraemia (C. S. Chen et al., 2007) with or without infection of
12
leucocytes (as with measles and mumps virus). The infected leucocytes may then
migrate across the BBB due to upregulation of cellular adhesion molecules (Jackson,
2013; Tyler, 2009). Alternatively, alteration of the BBB’s permeability as a result of
pro-inflammatory cytokines such as tumour necrosis factor, interleukin 1β (IL-1β) and
IL-6, caused by infection in other organs could permit the virus entry or virus may be
taken up by receptors. Pinocytotic vesicles on endothelial cells that contain virus may
be actively transported into the CNS as in Semliki Forest virus infection (Jackson, 2013;
Tyler, 2009). EV A71 may also enter the CNS by retrograde axonal transport via the
peripheral motor nerves (C. S. Chen et al., 2007; Ong et al., 2008). Various in vivo
models and autopsy reports had suggested the possibility of retrograde axonal transport
based on tissue tropism and CNS distribution of inflammation and virus (C. S. Chen et
al., 2007; Lu et al., 2009; Ong et al., 2008; Y. F. Wang et al., 2004; Y. F. Wang & Yu,
2014; Wei et al., 2010; K. T. Wong et al., 2008; Yang et al., 2009). Furthermore, Ohka,
Yang, Terada, Iwasaki, and Nomoto (1998) had shown retrograde transport of intact
poliovirus through the axon via the fast transport system in a transgenic mouse model.
2.1.5 “Provocation Poliomyelitis”
“Provocation poliomyelitis” is defined as a phenomenon in which skeletal muscle injury
predisposes the patient who has concurrent poliovirus infection to neurological
complications such as muscle weakness (or paralysis). The history of “provocation
poliomyelitis” can be traced to the 1940s in the USA when vaccines were not yet
available. Initially, “provocation poliomyelitis” among unvaccinated children in
endemic countries was believed to be due to poor hygiene or immigrant populations.
After poliovirus was found to involve spinal cords, the causes of “provocation
poliomyelitis was expanded to include the effects of diet, fatigue and hygiene
(Mawdsley, 2014). In 1940s, based on 2000 case studies, the Harvard Infantile Paralysis
13
Commission suggested that tonsillectomies could lead to respiratory paralysis due to
bulbar polio (Mawdsley, 2014). On the other hand, German doctors suggested that
paediatric injections could provoke poliomyelitis. Although these observations were
supported by doctors in France and Italy, it did not gain much attention until the end of
World War 2. Several studies from United Kingdom, Australia and USA, reported that
diphtheria, tetanus, and pertussis vaccines could provoke poliomyelitis suggesting to
some that injured tissues at the injection site could somehow aggravate poliovirus
infection. Others believed that the injections delivered poliovirus on the surface of skin
into deeper tissues.
In 1955, Salk’s polio vaccine, made by inactivating poliovirus with
formaldehyde, had been approved by authorities in the USA. Five pharmaceutical
companies, Eli Lilly, Parke-Davis, Wyeth, Pitman-Moore, and Cutter were licensed for
vaccine production. Two weeks after the release of the vaccine, Cutter’s vaccine was
immediately recalled, but 380,000 doses had already been administered. Two
production pools made by Cutter Laboratories (accounting for 120,000 doses) contained
live poliovirus. Among the children who had received the vaccine from these pools,
abortive polio (characterised by headache, stiff neck, fever, and muscle weakness)
developed in 40,000 children; 51 were permanently paralysed; and 5 died. Cutter’s
vaccine also started a polio epidemic in which 113 people in the affected children’s
families or communities were paralysed, and 5 died. Subsequent studies found that cell
debris contained in Cutter’s vaccine had prevented adequate exposure of virus particles
to formaldehyde. Later, safer inactivated polio vaccines successfully decreased the
incidence of poliomyelitis (Nathanson & Langmuir, 1995; Offit, 2005).
“Provocation poliomyelitis” in 1980s again became an important issue when
WHO introduced vaccines into third world countries where poliovirus epidemics were
occurring and children were reported to develop paralysis after vaccination. Studies
14
proposed that injections within 30 days of onset were a risk factor for paralysis.
Although some refused the findings, injections were done more carefully in epidemic
regions (Mawdsley, 2014; Strebel, Ion-Nedelcu, Baughman, Sutter, & Cochi, 1995).
The most likely mechanism for “poliovirus provocation” was first published in
1998 by State University of New York. Injured tissues from the physical act of injection
induces retrograde axonal transport of poliovirus and thereby facilitates viral invasion of
the central nervous system and the progression of spinal cord damage. It was also
proposed that other enteroviruses may cause “provocation poliomyelitis” (Gromeier &
Wimmer, 1998). As far as we are aware, there have been no report of EV-A71 causing a
“provocation poliomyelitis”-like phenomenon.
2.1.6 Autopsy findings in EV-A71 CNS infection
Upon gross assessment of the brain, flattened cerebral gyri, shallowed intervening sulci
and cerebral oedema may be observed (Yang et al., 2009). Under light microscopy,
inflammation was found in different regions of CNS including all levels of the spinal
cord, brainstem and cerebrum (especially hypothalamus and cerebellar dentate nucleus)
(Ong & Wong, 2015). Typical viral encephalitic features such as widespread
perivascular cuffing, mild mononuclear meningitis, multifocal necrosis, microglial
nodules and neuronophagia were observed. However, no viral inclusions were found.
These neuropathological changes were mostly found in the medulla, pons, midbrain
posterior to the corticospinal tracts (crus cerebri), hypothalamus, subthalamic nucleus
and grey matter of anterior and posterior horns of spinal cord. Inflammation in the
cerebral cortex was less intense and mostly in the motor cortex (Ong & Wong, 2015;
Yang et al., 2009).
EV-A71 antigens and RNA can be found in inflamed regions, although the viral
antigens/RNA may be very focal even in severely inflamed areas. EV-A71
15
antigens/RNA had been shown in the cytoplasm of neuronal cell bodies, processes and
inflammatory cells (Ong & Wong, 2015). The inflammatory cells were predominantly
CD68+ macrophages/microglias, followed by CD15+ neutrophils, CD4+ lymphocytes,
CD8+ lymphocytes and a small percentage of CD20+ B cells. CD68+ macrophages
were mostly found in the brainstem, meninges, perivascular areas and in microglia
nodules. Whereas, CD15+ neutrophils, lymphocytes and B cells were mainly found as
perivascular cuffing and in meninges (Ong & Wong, 2015; Yang et al., 2009).
Some cases showed pulmonary oedema with or without inflammation. However,
EV-A71 was never isolated from any lung samples nor antigens/RNA localised within
the lung. Whereas, viruses had been isolated from myocardium although the
antigens/RNA staining were negative so far. Other organs positive for viral isolation
were tonsils, intestine and pancreas (Ong & Wong, 2015).
In conclusion, autopsy studies of EV-A71 patients suggest that EV-A71 could
reach the CNS via peripheral motor nerves via retrograde axonal transport, and both
severe brainstem encephalomyelitis and neurogenic pulmonary oedema were the major
cause of death.
2.1.7 Neuropathogenesis
Neuropathogenesis of EV-A71 infection is actively being studied at the moment. At
least two possible mechanisms may be involved in direct neuronal damage by
apoptosis/necrosis and immune mediated neuronal damage (Weng et al., 2010). EV-
A71 antigens and RNA were often detected in degenerated neurons and in neurons
being phagocytosed (neuronophagia) in human autopsy cases and several animal
models, suggesting viral cytolysis as a pathogenic mechanism (Ong & Wong, 2015).
However, several in vitro experiments have suggested that EV-A71 induced apoptosis
can occur. Phosphatidylserine had been detected on the outer plasma membranes
16
indicating an early apoptosis event in EV-A71 infected neuronal cells (S. C. Chang, Lin,
Lo, Li, & Shih, 2004). In addition, S. C. Chang et al. (2004) had shown that efflux of
cytochrome c from the mitochondria to cytoplasm, and cleaved activated caspase 9
which could lead to apoptosis. In another study, EV-A71 infection triggered Abl and
thus activated the cyclin-dependent kinase 5 kinase activity which led to neuronal
apoptosis (S. C. Chang et al., 2004). In addition, Li et al. (2002) had shown that EV-
A71 3C protease is a key factor in apoptosis. Transient expression of EV-A71 3C
protease in SF268 cells (human glioblastoma cell line) caused DNA fragmentation by
the caspase 3 pathway. In another study, host cell mRNA polyadenylation could be
impaired by cleavage of EV-A71 3C protease protein leading to apoptosis (Weng, Li,
Hung, & Shih, 2009).
Another mechanism of tissue injury induced by inflammation in adjacent CNS
regions (bystander effect) cannot be excluded. In autopsy studies, the extensive areas of
inflammation within the CNS could be due to immune dysregulation by inappropriate
activation of pro-inflammatory cytokines, whose actions lead to pathological
consequences/ neuronal damage of non-infected cells (Ong & Wong, 2015). Infected
inflammatory cells are believed to trigger the pro-inflammatory cytokines production in
patients with severe EV-A71 infection. Infected human T cell lines (Jurkat),
macrophage cell lines (THP-1) and human peripheral blood mononuclear cells were
found to be infected in vitro to produce Tumor Necrosis Factor-α (TNF-α) and
“macrophage migration inhibitory factor” (MIF) (Gong et al., 2012). Whereas, infected
human dendritic cells via the “Dendritic Cell-Specific Intercellular adhesion molecule-
3-Grabbing Non-integrin” (DC-SIGN) receptor could trigger the production of IL-6, IL-
12 and TNF-α (Y. W. Lin, Wang, Tung, & Chen, 2009). EV-A71 infection could also
activate the “nuclear factor kappa-light-chain-enhancer of activated B cells” (NF-κB)
pathway which leads to production of Interferon-β (IFN-β) and TNF-α (Chu et al., 1999)
17
and could increase the expression of “vascular cell adhesion molecule 1” (VCAM-1)
which facilitates the binding of neutrophils and leukocytes to “vascular smooth muscle
cells” (VSMC) (Tung et al., 2007). Expression of “cyclooxygenase-2” (COX-2), a
neurotoxic mediator, increase with EV-A71 infection in SK-N-SH cells. The metabolite
of COX-2, “Prostaglandin E2” PGE2, had been shown to accelerate EV-A71 infection
in cells (N. Chen & Reis, 2002; Hinson & Tyor, 2001). Lastly, the immune mediated
auto-antigen effect cannot be excluded. Fan et al. (2015) suggested that the common
epitope between VP1 of EV-A71 and “human mediator complex subunit 25” could lead
to autoantigen effect.
2.2 Immune response
Innate immunity, the non-antigen-specific immunity, is the early phase defence against
viral infection. It reacts immediately to kill pathogens, by activating the adaptive
immunity as well (Elgert, 2009; Levinson & Jawetz, 1992). Immune cells, such as
macrophages, and non-immune cells, such as epithelial cells, have “pattern-recognition
receptors” (PPRs) located on the surface of cell membranes, within the cytoplasm or in
the endosome (Elgert, 2009; Levinson & Jawetz, 1992). PPRs can be triggered by two
classes of molecules: “Pathogen-Associated Molecular Pattern” (which included viral
DNA/RNA and bacterial lipopolysaccharide), and “Danger Associated Molecular
Pattern” (endogenous molecules released from stressed or dying cells such as heat
shock protein, high-mobility group box1, cytosolic RNAs, cytosolic DNAs and
mitochondria DNAs). All these signals activate innate immunity and pro-inflammatory
responses (Pathinayake, Hsu, & Wark, 2015).
There are three major types of PPRs; namely “toll-like receptors” (TLRs),
“retinoic acid-inducible gene I like receptors” (RLRs) and “nucleotide oligomerisation
domain like receptors” (Pathinayake et al., 2015). Picornaviruses are mainly recognised
18
by “melanoma-differentiation-associated” (MDA5), RLRs. Binding of viral RNA leads
to conformation changes on MDA5, and activation of a series of cascade effects
downstream (Gitlin et al., 2006). Briefly, MDA5 activates the mitochondrial antiviral
signalling to phosphorylate “interferon regulatory factor 3” (IRF-3) and IRF-7, thereby
resulting in the expression of the type I IFN gene (Gitlin et al., 2006; Kato et al., 2006).
NF-κB is also activated by mitochondrial antiviral signalling, and in turn activates pro-
inflammatory cytokines, adhesion molecules, chemokines, acute phase proteins and
inducible enzymes (Takeuchi & Akira, 2008). In addition, TLR3, a member of TLRs,
can be activated by RNA of picornaviruses, to activate the NF-κB (Oshiumi et al., 2011).
Several studies show that 3C and 2A protease of EV-A71 are the main antagonists of
innate immunity by cleaving and binding to different antiviral signalling molecules
(such as MDA5, IRF3, IRF7, cellular micro RNAs, mitochondrial antiviral signalling
and NF-κB.) (Pathinayake et al., 2015).
Natural killer (NK) cells are also important in innate immunity. Type 1 IFN can
increase NK cells cytotoxicity through perforin to cause death of infected cells. Besides,
“killer immunoglobulin-like receptors” on NK cells can recognise downregulation of
“major histocompatibility complex” (MHC) class I molecules, as transformation or
virus infection are known to downregulate its expression. In addition, NK cells can
activate both dendritic cells and T cells which are involved in adaptive immunity (Paust,
Senman, & von Andrian, 2010; Warren & Smyth, 1999).
Adaptive immunity is involved in a later phase of infection and is important for
immunological memory. It is highly antigen-specific and can be divided into cell-
mediated and humoral immunity (Elgert, 2009; Pathinayake et al., 2015). Little is
known about cell-mediated immunity response to EV-A71 infection, even for other
picornaviruses such as poliovirus and coxsackievirus (Dotzauer & Kraemer, 2012; Paust
et al., 2010). Dendritic cells and macrophages had been shown to be important antigen
19
presenting cells via MHC class II molecules in poliovirus and coxsackievirus infection
(Dotzauer & Kraemer, 2012). EV-A71 specific CD4+ T cells (T helper cells) were
induced in vaccinated children in a few vaccine trial studies (Collins, 1974; L. Liu et al.,
2015; Ng et al., 2015; F. C. Zhu et al., 2013). In general, activated T helper 1 cells
produce the cytokines IFN-γ and IL-2. IFN- γ secreting T cells had been shown in
vaccinated EV-A71 patients, which theoretically can lyse the infected cells via
activation of NK cells. Activated T helper 2 cells produce IL-4, IL-5 and IL-10 which
are important to regulate antibody and allergic responses (Seder & Hill, 2000). In
addition, virus-specific cytotoxic T lymphocytes (CD8+) are believed to be important in
preventing viral multiplication. These cells had been shown to help in viral elimination
in poliovirus infection via MHC class I pathway (Dotzauer & Kraemer, 2012). However,
coxsackieviruses had been reported to strongly inhibit antigen presentation via MHC
class I pathway and thus evade CD8+ T cell immunity (Kemball, Alirezaei, & Whitton,
2010).
Humoral immunity is activated when B cell receptors are activated by specific
antigens via T cell independent (TI) or dependent (TD) pathways. TI response is faster
but is short-lived compared to the TD response. After exposure to viral particles or
RNA, the TI response leads to secretion of Immunoglobulin M (IgM) antibodies. TD
response is activated when naïve T helper cells or T helper cells recognise the presented
viral particle on the MHC class II molecule, resulting in cytokine production which is
important in B cell proliferation and antibody production (mainly IgG). IgG antibodies
are important for long-term memory (Elgert, 2009). All these neutralising antibodies are
important in controlling viraemia and hence could help with the infection (Dotzauer &
Kraemer, 2012; Kemball et al., 2010). In addition, certain antibodies could activate the
complement system to eliminate infected cells (Elgert, 2009).
20
Neutralising antibodies could be present in adults, especially in regions with
EV-A71 epidemics. Luo et al. (2009) had shown that about 50-60% of pregnant women
had serum EV-A71 antibodies which helped in protection against EV-A71 infection
immediately after birth. However, the maternal antibodies decline and are almost
undetectable in 99% of infants by 6 months (Kim et al., 2015; Luo et al., 2009; E. E.
Ooi, Phoon, Ishak, & Chan, 2002). Pre-existing maternal neutralising antibodies could
interfere with the production of neutralising antibody secreting cells following active
immunisation (Kim et al., 2015). Consequently, EV-A71 vaccines were suggested to
target infants > 6 months of age.
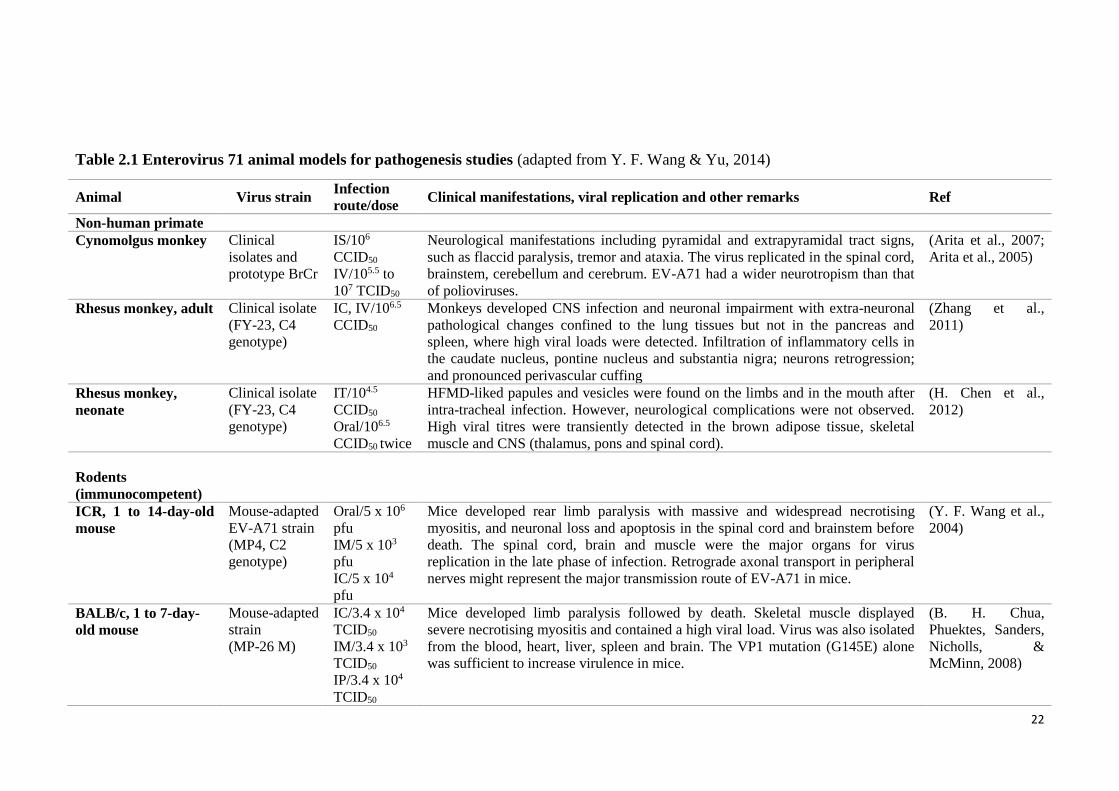
2.3 Animal models
The only natural host for EV-A71 infection is human beings. Severe outbreaks in 1990s
in the Asia Pacific region, drove researchers to develop several animal models for EV-
A71 studies as summarised by Y. F. Wang and Yu (2014) in Table 2.1.
Up to date, none of the models are perfect. Different monkey models
(Cynomolgus monkey, adult and neonatal rhesus monkeys) present different tissue
tropism, primary viral replication sites and disease manifestations. However,
observations in monkey studies had advanced our understanding on viral transmission,
clinical manifestations, pathogenesis, viral distribution and immune responses of EV-
A71 infection (Y. F. Wang & Yu, 2014). Infected cynomolgus monkeys display both
pyramidal tract signs (flaccid paralysis) and extrapyramidal tract signs (including tremor
and ataxia) with a broad viral antigen distribution that involves the spinal cord,
brainstem, cerebellar cortex, dentate nuclei and cerebrum which was similar to humans
(Table 2.1). However, the monkeys do not manifest cutaneous lesions or develop
pulmonary oedema (Arita et al., 2007; Arita et al., 2005). Neonatal rhesus monkeys did
demonstrate HFMD-like papules and vesicles on the limbs and in the mouths. Although
21
both medulla oblongata and thalamus contain very high virus titres and display
neuropathological lesions, the neonatal rhesus monkeys did not display the typical
neurological complications such as flaccid paralysis and ataxia (H. Chen et al., 2012).
So far, mouse models are more frequently used in EV-A71 research. Several
infected mouse models demonstrated strong neuronotropism in the CNS which shared
many features with the human encephalomyelitis. These models strengthened the
hypothesis that virus enters the CNS via peripheral motor nerves (Table 2.1). However,
these animal models showed age-dependent susceptibility toward EV-A71 infection and
demonstrated strong myotropism. In addition, pulmonary oedema was not demonstrated
in any of the models. Virus strains produced by passaging to adapt virus to mouse
models have been attempted but full infectivity in adult mice has not been achieved
(Table 2.1). In 2013, a SCARB2 Tg mice model became available. These hSCARB2-
expressing mice exhibited ataxia, paralysis, and death after infection. The pathological
features in these mice were generally similar to those of EV-A71 encephalomyelitis in
humans and experimentally infected monkeys. Although the Tg mice showed some
level of muscle infection, it should be useful to replace the monkey and other mice
models (Y. F. Wang & Yu, 2014). Recently, an orally-infected hamster model for EV-
A71 encephalomyelitis which demonstrated squamous lesions in the paws, skin and oral
cavity reminiscent of HFMD was described by Phyu et al. (2016). This hamster model
which was consistently infected via the natural oral route should be useful to study
squamous epitheliotropism, neuropathogenesis, oral/faecal shedding in EV-A71
infection, person-to-person transmission, and to test anti-viral drugs and vaccines.
22
Table 2.1 Enterovirus 71 animal models for pathogenesis studies (adapted from Y. F. Wang & Yu, 2014)
Animal Virus strain Infection
route/dose Clinical manifestations, viral replication and other remarks Ref
Non-human primate
Cynomolgus monkey Clinical
isolates and
prototype BrCr
IS/106
CCID50
IV/105.5 to
107 TCID50
Neurological manifestations including pyramidal and extrapyramidal tract signs,
such as flaccid paralysis, tremor and ataxia. The virus replicated in the spinal cord,
brainstem, cerebellum and cerebrum. EV-A71 had a wider neurotropism than that
of polioviruses.
(Arita et al., 2007;
Arita et al., 2005)
Rhesus monkey, adult Clinical isolate
(FY-23, C4
genotype)
IC, IV/106.5
CCID50
Monkeys developed CNS infection and neuronal impairment with extra-neuronal
pathological changes confined to the lung tissues but not in the pancreas and
spleen, where high viral loads were detected. Infiltration of inflammatory cells in
the caudate nucleus, pontine nucleus and substantia nigra; neurons retrogression;
and pronounced perivascular cuffing
(Zhang et al.,
2011)
Rhesus monkey,
neonate
Clinical isolate
(FY-23, C4
genotype)
IT/104.5
CCID50
Oral/106.5
CCID50 twice
HFMD-liked papules and vesicles were found on the limbs and in the mouth after
intra-tracheal infection. However, neurological complications were not observed.
High viral titres were transiently detected in the brown adipose tissue, skeletal
muscle and CNS (thalamus, pons and spinal cord).
(H. Chen et al.,
2012)
Rodents
(immunocompetent)
ICR, 1 to 14-day-old
mouse
Mouse-adapted
EV-A71 strain
(MP4, C2
genotype)
Oral/5 x 106
pfu
IM/5 x 103
pfu
IC/5 x 104
pfu
Mice developed rear limb paralysis with massive and widespread necrotising
myositis, and neuronal loss and apoptosis in the spinal cord and brainstem before
death. The spinal cord, brain and muscle were the major organs for virus
replication in the late phase of infection. Retrograde axonal transport in peripheral
nerves might represent the major transmission route of EV-A71 in mice.
(Y. F. Wang et al.,
2004)
BALB/c, 1 to 7-day-
old mouse
Mouse-adapted
strain
(MP-26 M)
IC/3.4 x 104
TCID50
IM/3.4 x 103
TCID50
IP/3.4 x 104
TCID50
Mice developed limb paralysis followed by death. Skeletal muscle displayed
severe necrotising myositis and contained a high viral load. Virus was also isolated
from the blood, heart, liver, spleen and brain. The VP1 mutation (G145E) alone
was sufficient to increase virulence in mice.
(B. H. Chua,
Phuektes, Sanders,
Nicholls, &
McMinn, 2008)
23
Table 2.1, continued
Animal Virus strain Infection
route/dose Clinical manifestations, viral replication and other remarks Ref
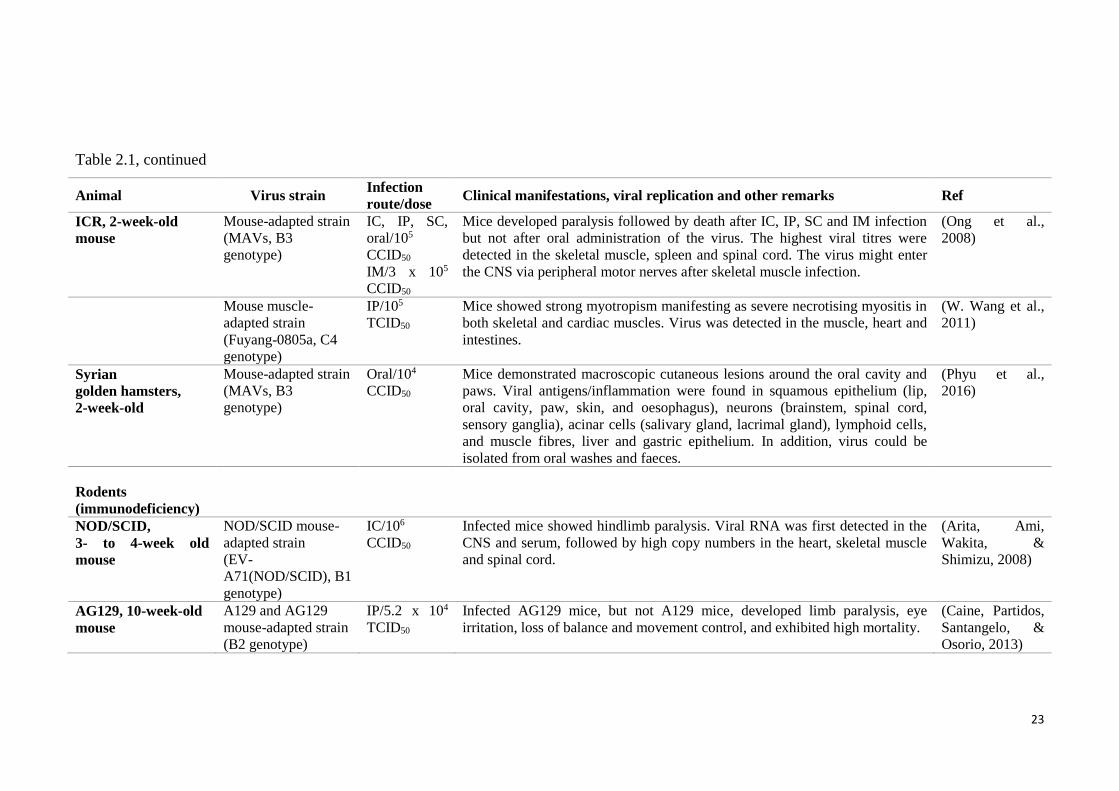
ICR, 2-week-old
mouse
Mouse-adapted strain
(MAVs, B3
genotype)
IC, IP, SC,
oral/105
CCID50
IM/3 x 105
CCID50
Mice developed paralysis followed by death after IC, IP, SC and IM infection
but not after oral administration of the virus. The highest viral titres were
detected in the skeletal muscle, spleen and spinal cord. The virus might enter
the CNS via peripheral motor nerves after skeletal muscle infection.
(Ong et al.,
2008)
Mouse muscle-
adapted strain
(Fuyang-0805a, C4
genotype)
IP/105
TCID50
Mice showed strong myotropism manifesting as severe necrotising myositis in
both skeletal and cardiac muscles. Virus was detected in the muscle, heart and
intestines.
(W. Wang et al.,
2011)
Syrian
golden hamsters,
2-week-old
Mouse-adapted strain
(MAVs, B3
genotype)
Oral/104
CCID50
Mice demonstrated macroscopic cutaneous lesions around the oral cavity and
paws. Viral antigens/inflammation were found in squamous epithelium (lip,
oral cavity, paw, skin, and oesophagus), neurons (brainstem, spinal cord,
sensory ganglia), acinar cells (salivary gland, lacrimal gland), lymphoid cells,
and muscle fibres, liver and gastric epithelium. In addition, virus could be
isolated from oral washes and faeces.
(Phyu et al.,
2016)
Rodents
(immunodeficiency)
NOD/SCID,
3- to 4-week old
mouse
NOD/SCID mouse-
adapted strain
(EV-
A71(NOD/SCID), B1
genotype)
IC/106
CCID50
Infected mice showed hindlimb paralysis. Viral RNA was first detected in the
CNS and serum, followed by high copy numbers in the heart, skeletal muscle
and spinal cord.
(Arita, Ami,
Wakita, &
Shimizu, 2008)
AG129, 10-week-old
mouse
A129 and AG129
mouse-adapted strain
(B2 genotype)
IP/5.2 x 104
TCID50
Infected AG129 mice, but not A129 mice, developed limb paralysis, eye
irritation, loss of balance and movement control, and exhibited high mortality.
(Caine, Partidos,
Santangelo, &
Osorio, 2013)
24
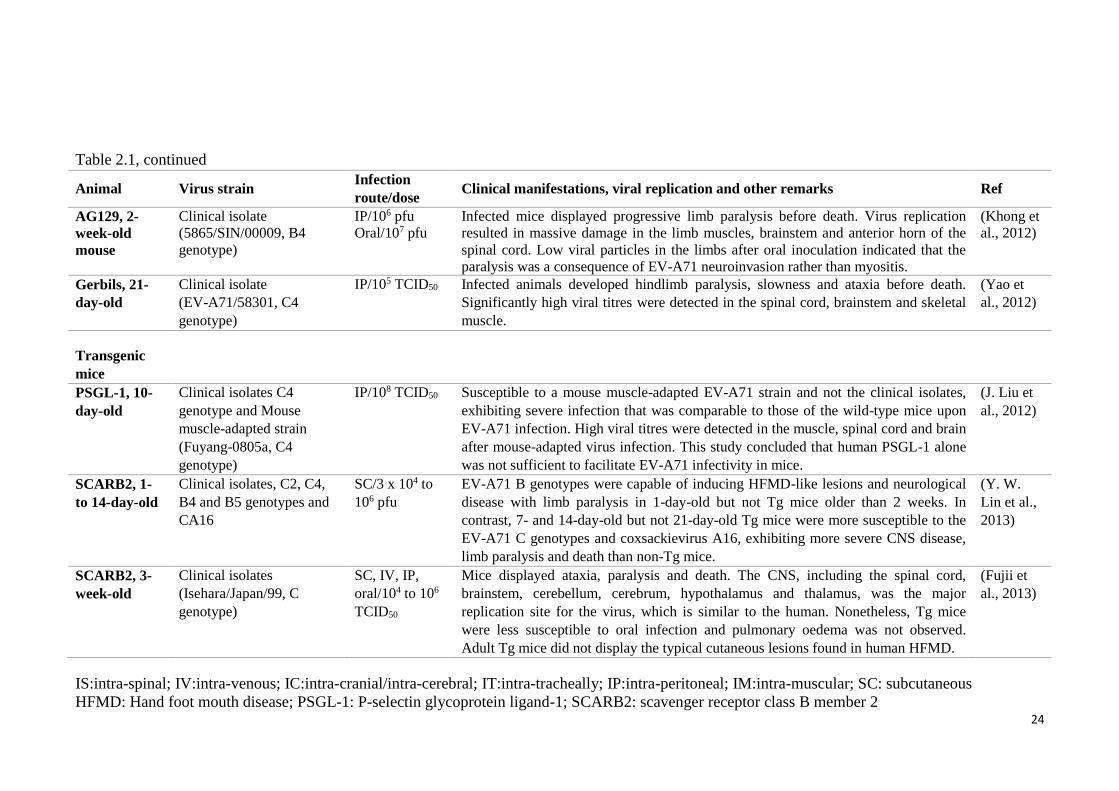
Table 2.1, continued
Animal Virus strain Infection
route/dose Clinical manifestations, viral replication and other remarks Ref
AG129, 2-
week-old
mouse
Clinical isolate
(5865/SIN/00009, B4
genotype)
IP/106 pfu
Oral/107 pfu
Infected mice displayed progressive limb paralysis before death. Virus replication
resulted in massive damage in the limb muscles, brainstem and anterior horn of the
spinal cord. Low viral particles in the limbs after oral inoculation indicated that the
paralysis was a consequence of EV-A71 neuroinvasion rather than myositis.
(Khong et
al., 2012)
Gerbils, 21-
day-old
Clinical isolate
(EV-A71/58301, C4
genotype)
IP/105 TCID50 Infected animals developed hindlimb paralysis, slowness and ataxia before death.
Significantly high viral titres were detected in the spinal cord, brainstem and skeletal
muscle.
(Yao et
al., 2012)
Transgenic
mice
PSGL-1, 10-
day-old
Clinical isolates C4
genotype and Mouse
muscle-adapted strain
(Fuyang-0805a, C4
genotype)
IP/108 TCID50 Susceptible to a mouse muscle-adapted EV-A71 strain and not the clinical isolates,
exhibiting severe infection that was comparable to those of the wild-type mice upon
EV-A71 infection. High viral titres were detected in the muscle, spinal cord and brain
after mouse-adapted virus infection. This study concluded that human PSGL-1 alone
was not sufficient to facilitate EV-A71 infectivity in mice.
(J. Liu et
al., 2012)
SCARB2, 1-
to 14-day-old
Clinical isolates, C2, C4,
B4 and B5 genotypes and
CA16
SC/3 x 104 to
106 pfu
EV-A71 B genotypes were capable of inducing HFMD-like lesions and neurological
disease with limb paralysis in 1-day-old but not Tg mice older than 2 weeks. In
contrast, 7- and 14-day-old but not 21-day-old Tg mice were more susceptible to the
EV-A71 C genotypes and coxsackievirus A16, exhibiting more severe CNS disease,
limb paralysis and death than non-Tg mice.
(Y. W.
Lin et al.,
2013)
SCARB2, 3-
week-old
Clinical isolates
(Isehara/Japan/99, C
genotype)
SC, IV, IP,
oral/104 to 106
TCID50
Mice displayed ataxia, paralysis and death. The CNS, including the spinal cord,
brainstem, cerebellum, cerebrum, hypothalamus and thalamus, was the major
replication site for the virus, which is similar to the human. Nonetheless, Tg mice
were less susceptible to oral infection and pulmonary oedema was not observed.
Adult Tg mice did not display the typical cutaneous lesions found in human HFMD.
(Fujii et
al., 2013)
IS:intra-spinal; IV:intra-venous; IC:intra-cranial/intra-cerebral; IT:intra-tracheally; IP:intra-peritoneal; IM:intra-muscular; SC: subcutaneous
HFMD: Hand foot mouth disease; PSGL-1: P-selectin glycoprotein ligand-1; SCARB2: scavenger receptor class B member 2
25
In this laboratory, an EV-A71 encephalomyelitis mouse model that shared many
features with human CNS disease was developed, using a “mouse-adapted virus strain”
(MAVS). This model, generally demonstrated similar tissue tropism, including
neurotropism by most routes of infection (IP, IM, SC and oral). Despite the presence of
only sparse inflammation, the distribution of CNS viral RNA and antigens seems to
parallel the distribution of inflammation and virus in human EV-A71 encephalomyelitis.
Anterior horn of spinal cord, medulla, pons (sparing the pontine nuclei), midbrain, and
lateral cerebellar nucleus were often severely infected (Ong et al., 2008). These were
also the areas in which inflammation was found to be severe in human cases. In addition,
the rarity and absence of virus in the murine motor cortex and cerebellar hemisphere,
respectively, also seem to resemble the human infection. Although peripheral nerve
viral transmission was first reported using another mouse model (C. S. Chen et al.,
2007), based on findings in this model, peripheral spinal motor nerves were postulated
to be responsible for viral entry into the CNS, most likely by retrograde axonal transport
after skeletal muscle infection.
2.4 Anti-viral therapeutics and vaccines
2.4.1 Inactivated vaccines
Various types of inactivated EV-A71 vaccines have been reported. However, the 3
leading and best developed and/or tested vaccines are all formalin-inactivated EV-A71,
subgenotype C4, vaccines (Z. Liang & Wang, 2014). All three vaccines had completed
phase III clinical trials and one of them, had just been approved by the China Food and
Drug Administration in December 2015 (Mao, Wang, Bian, Xu, & Liang, 2016). From
the clinical reports, these vaccines were able to induce high “Geometric Mean Titres”,
and thus could potentially prevent 80% of EV-A71 associated diseases (F. C. Zhu et al.,
26
2013; F. Zhu et al., 2014). Unfortunately, these vaccines were all prepared from a single
subgenotype C4 strain, and thus showed limited cross-immunity and cross-
neutralisation of other genotypes (Z. Liang & Wang, 2014; Ng et al., 2015). This may
be challenging if the vaccines are deployed worldwide, as different EV-A71 genotypes
circulate in different regions at different times. For example, subgenotype B3 was
circulating during the 1997 outbreak in Sarawak, Malaysia (Cardosa et al., 2003), while
subgenotypes B4 and C1 dominated in the 2000 outbreak. Subgenotype B5 and C1 was
circulating during the 2005 outbreak in Peninsular Malaysia (K. B. Chua et al., 2007).
Genomic sequence variations found in different subgenotypes and the antigen
destruction/masking by formaldehyde could be some of the reasons behind this limited
cross-immunity of the vaccines (Wilton, Dunn, Eastwood, Minor, & Martin, 2014). It is
possible that limited cross-immunity could trigger “antibody-dependent enhancement”
in which antibodies against the one EV-A71 subgenotype binds to but does not
neutralise other subgenotypes, thus enhancing viral entry into the cells (R. Y. Cao et al.,
2013; Han et al., 2011; Tirado & Yoon, 2003; S. M. Wang et al., 2010). Furthermore,
although these vaccines were intended for use in regions where subgenotype C4 is
predominant, there is always the possibility that other subgenotypes may shift to this
region and this has to be taken into consideration.
2.4.2 Baculovirus-expressed vaccines
Baculovirus is a lepidopteran-specific (insect-specific) pathogen widely used in protein
expression nowadays because of its ability to express native conformation-eukaryotic
proteins by post-translational modification, and to produce multi-protein subunit
complexes with tertiary structures, which cannot be done in E. coli expression systems
(Jarvis, 2009). With the baculovirus system, several groups had successfully produced
27
EV-A71 virus-like particles (VLPs) which were similar to the native viruses without the
viral genome. These VLPs had proven to induce high neutralising titres of up to 1:5042.
Particles with complete viral surfaces are able to stimulate both innate and cell-mediated
immunity (Chung et al., 2010; Ku et al., 2013; S. Y. Lin et al., 2015). Unfortunately,
baculovirus expression systems are too low-yielding and too expensive for mass
production of VLPs, despite efforts to increase the yield using different cells.
Others had tried to express the VP1 protein on the surface of the baculovirus
envelope, also known as baculovirus surface display vaccines, to improve yield of VLPs.
Although the sera derived from this system have neutralising titres lower than the
conventional baculovirus system, it is still higher compared to titres with formalin
inactivated vaccines. Currently, research groups are focusing on co-display all three
VP1-3 on the baculovirus to induce more neutralising epitopes (Meng, Kolpe, Kiener,
Chow, & Kwang, 2011; Premanand et al., 2012).
2.4.3 Intravenous immunoglobulin (IVIG) treatment
IVIG, a highly purified blood product containing IgG antibodies, have been actively
used in immunocompromised or autoimmune disease patients to provide passive
immunisation against infectious diseases such as tetanus, botulism, hepatitis B, rabies,
and varicella. In severe cases of EV-A71 infection, it has been successfully used to
change both pro- and anti-inflammatory cytokine levels and thus save the patient’s life.
Moreover, neutralising antibodies against EV-A71 found therein may play a therapeutic
as well as prophylactic role. However, IVIG products are subjected to batch-to-batch
variations, as a result of blood pooling from a large group of healthy individuals
contributing to different compositions and thus different degrees of effectiveness and
consistency. Besides, use of blood-derived products could lead to spread of blood-borne
28
pathogens (R. Cao et al., 2010; Hemming, 2001; Jolles, Sewell, & Misbah, 2005; S. M.
Wang et al., 2006).
2.4.4 Monoclonal antibody (MAb)
Specific neutralising antibodies are important in antiviral immunity for preventing and
modulating viral infections such as infections by respiratory syncytial virus, human
immunodeficiency virus, cytomegalovirus, hepatitis C virus and rabies (Hemming,
2001). Many researchers have reported that anti-EV-A71 MAbs targeted against VP1,
VP2 and VP3 are effective against EV-A71 infection (G. H. Chang et al., 2010; Deng et
al., 2015; D. L. He et al., 2012; Kiener, Jia, Meng, Chow, & Kwang, 2014; Lee et al.,
2013; Lim et al., 2012; C. C. Liu et al., 2011; Xu et al., 2014). However, to date, only 2
antibodies, showed cross-immunity against all EV-A71 subgenotypes, and both of them
are IgM antibodies (Ng et al., 2015). As there are no licensed vaccines available at the
moment, passive immunisation of antibodies may offer an effective
prophylactic/therapeutic measure against encephalomyelitis, to reduce morbidity and
mortality. Although a few studies described the efficacy of antibodies in early infection
(Bek et al., 2011; G. H. Chang et al., 2010; H. W. Chang et al., 2013; Foo, Alonso,
Chow, & Poh, 2007; Y. X. Li et al., 2014; Z. Li et al., 2014; Liou et al., 2010; Tian et al.,
2012; Xu et al., 2014), the effectiveness of antibodies after disease onset or more
importantly after CNS involvement has not been adequately investigated (Ng et al.,
2015). Hence, the effectiveness of MAb was tested in CNS infected mice as part of our
investigations.
29
3.0 Materials and methods
The majority of the work was done at the University of Malaya, Malaysia while all the
primary motor neuron studies (section 4.3.3, page 81; section 4.4, page 83) were
performed at the Tokyo Metropolitan Institute of Medical Science, Japan.
3.1 Cell lines
African green monkey kidney (VERO) cells were grown in Dulbecco’s Modified Eagle
Medium (DMEM; Sigma, USA) growth medium (GM), supplemented with 5% foetal
bovine serum (FBS), 0.02 M HEPES (pH 7.4), 0.0825% sodium bicarbonate, 1 mM
sodium pyruvate and 50 µg/mL gentamycin. Infected VERO cells were maintained in
DMEM maintenance medium (MM) supplemented with 2% FBS, 0.02 M HEPES,
0.19% sodium bicarbonate and 1 mM sodium pyruvate and 50 µg/mL gentamycin.
In the Tokyo laboratory, human rhabdomyosarcoma (RD) cells transfected with
hSCARB2 receptor gene were grown in RPMI-1640 GM, supplemented with 10% FBS
or 6% FBS for MM. These cells were used for virus titration analysis in section 4.4.1.1
(page 83), according to approved protocols submitted to the Animal Use and Care
Committee, Tokyo Metropolitan Institute of Medical Science.
30
3.2 Virus preparation and concentration
All the viruses used in this project (Table 3.1) were propagated in VERO cells or RD
cells at a multiplicity of infection (MOI) of 0.1 until 90% of cells showed cytopathic
effect (CPE). The infected cells were subjected to 3 freeze-thawing cycles before
centrifugation at 4000 rpm, 4°C for 15 min to remove cell debris. The supernatant was
then further concentrated by polyethylene glycol (PEG) precipitation as described
previously (Yamamoto, Alberts, Benzinger, Lawhorne, & Treiber, 1970). Briefly, PEG
6000 (Fluka, USA) and sodium chloride were added to the virus suspension to a final
concentration of 8% (wt/vol) and 0.3 M, respectively. The mixture was stirred overnight
at 4°C and centrifuged at 4000 x g, 4°C for 1 hour (hr). The PEG 6000-supernatant was
discarded, and virus-containing pellet was re-suspended in a small volume of phosphate
buffer saline (PBS, pH 7.4) and filtered through a 0.2 µM pore size filter. Small aliquots
were stored at -80oC. Virus stock titre was determined by standard microtitration assay
in VERO cells (section 3.6.1.2, page 37).
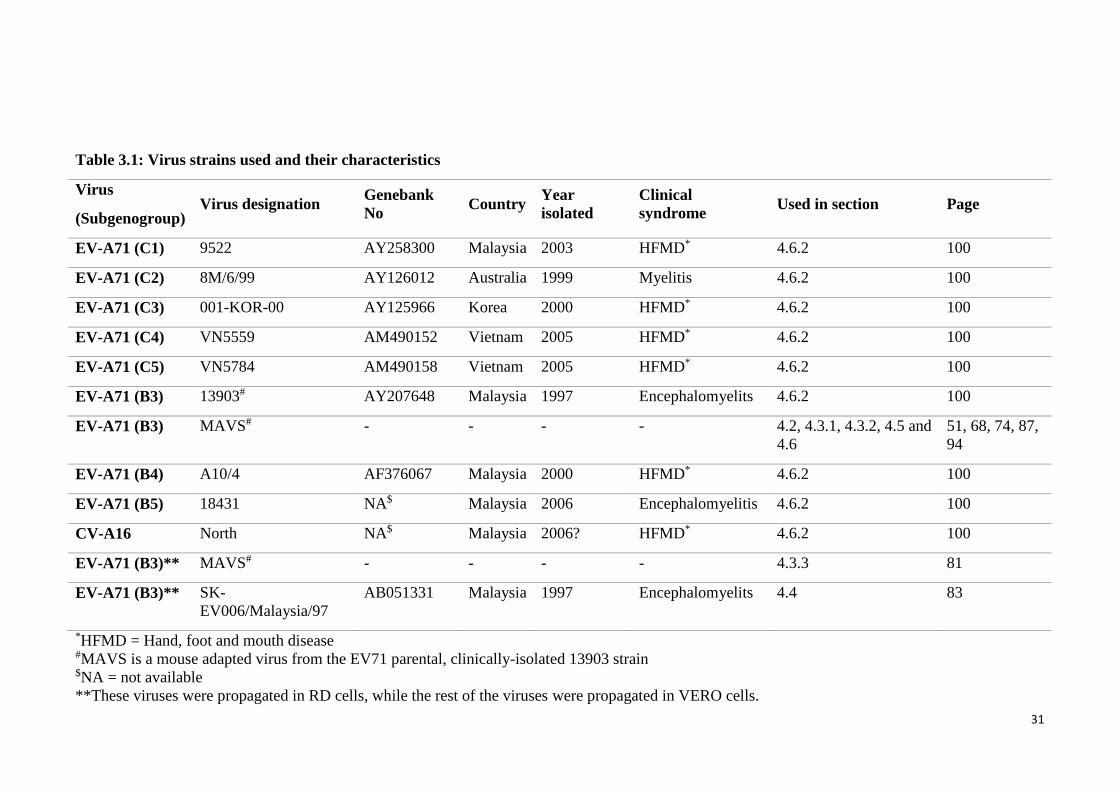
31
Table 3.1: Virus strains used and their characteristics
Virus
(Subgenogroup) Virus designation
Genebank
No Country
Year
isolated
Clinical
syndrome Used in section Page
EV-A71 (C1) 9522 AY258300 Malaysia 2003 HFMD* 4.6.2 100
EV-A71 (C2) 8M/6/99 AY126012 Australia 1999 Myelitis 4.6.2 100
EV-A71 (C3) 001-KOR-00 AY125966 Korea 2000 HFMD* 4.6.2 100
EV-A71 (C4) VN5559 AM490152 Vietnam 2005 HFMD* 4.6.2 100
EV-A71 (C5) VN5784 AM490158 Vietnam 2005 HFMD* 4.6.2 100
EV-A71 (B3) 13903# AY207648 Malaysia 1997 Encephalomyelits 4.6.2 100
EV-A71 (B3) MAVS# - - - - 4.2, 4.3.1, 4.3.2, 4.5 and
4.6
51, 68, 74, 87,
94
EV-A71 (B4) A10/4 AF376067 Malaysia 2000 HFMD* 4.6.2 100
EV-A71 (B5) 18431 NA$ Malaysia 2006 Encephalomyelitis 4.6.2 100
CV-A16 North NA$ Malaysia 2006? HFMD* 4.6.2 100
EV-A71 (B3)** MAVS# - - - - 4.3.3 81
EV-A71 (B3)** SK-
EV006/Malaysia/97
AB051331 Malaysia 1997 Encephalomyelits 4.4 83
*HFMD = Hand, foot and mouth disease #MAVS is a mouse adapted virus from the EV71 parental, clinically-isolated 13903 strain $NA = not available
**These viruses were propagated in RD cells, while the rest of the viruses were propagated in VERO cells.
32
3.2.1 Preparation of fluorescence-labelled EV-A71
EV-A71 (SK-EV006/Malaysia/97 virus) was fluorescence-labelled according to the
manufacturer’s protocol (Molecular Probes, USA). Briefly, purified EV-A71 in 0.1 M
sodium bicarbonate solution was prepared by dialysis. The total protein concentration of
the virus was measured using Pierce BCA Protein Assay Kit (Thermo Fisher, USA)
according to manufacturer’s protocol. Then 50 µL of 1.0 M bicarbonate (pH 8.3) was
added to 0.5 mL of 2 mg/mL virus followed by a vial of reactive dye. After stirring at
room temperature (RT) for an hour in the dark, excess dye was removed by a NAP5
resin column. The fraction containing the labelled virus was determined by absorbance
measurements at 280 nm and 555 nm. The degree of labelling was calculated using the
manufacturer’s formula. Virus titre was determined by a standard microtitration assay
using RD hSCARB2 cells (section 3.6.1.2, page 37).
3.2.2 Preparation of light-sensitive MAVS
MAVS was propagated in VERO cells at an MOI of 0.1 for an hour at 36°C. Then, MM
supplemented with 10 μg/ml of neutral red was added and incubated in the dark until
90% of cells showed CPE (about ~ 6 days). Viruses were harvested as usual (section 3.2,
page 30) via freeze-thaw cycles but the whole process was performed in the dark.
3.3 Preparation of hyperimmune sera against MAVS
All animal experiments were approved and performed in Malaysia, according to the
University of Malaya’s Animal Welfare and Use Committee guidelines (2014-02-
14/PATHO/R/WKT). Hyperimmune sera with neutralising antibodies against MAVS
were prepared by inoculating 16 µg of formaldehyde-inactivated MAVS virus,
33
containing 0.5 mg/mL aluminium hydroxide as adjuvant, into a group of 6-8 week-old
ICR mice (n= 40), followed by 2 boosters given 2 weeks apart via the intra-peritoneal
(IP) route. Mock-immunised mice received the same concentration of formaldehyde-
fixed VERO cell lysates. All mice were sacrificed 6-week post-immunisation or 3 days
after the second booster. Blood was harvested by cardiac puncture at the time of
euthanasia, and sera separated, pooled and heat-inactivated at 56°C for 30 min. Sera
were tested for neutralising antibodies against EV-A71 by the microneutralisation test
using VERO cells (section 3.5, page 34) as described previously (Ong, Devi, Cardosa,
& Wong, 2010).
3.4 Preparation of specific monoclonal antibody against MAVS
BALB/c mice were immunised with MAVS by IP inoculation of approximately 105
CCID50 (50% cell culture infective dose) virus emulsified in complete or incomplete
Freund adjuvant (Sigma-Aldrich, USA), in a total of 3 inoculations given 3 weeks apart.
Three days after the last booster (without adjuvant), the spleen cells were harvested, and
fused with SP2/0 mouse myeloma cells at a ratio of 10:1 as described previously (Lim
et al., 2012). The fused cells were suspended in hypoxanthine-aminopterin-thymidine
medium. After 10 to 14 days, the supernatant from wells with hybridoma cells were
screened by a microneutralising assay as described previously (section 3.5, page 34)
(Ong et al., 2010). Hybridoma cells secreting neutralising antibodies were subcloned by
limiting dilution and cultured as described previously (Lim et al., 2012). A monoclonal
antibody (MAb) designated as MAb 3D1 was selected out of 48 clones for further
experiments because it demonstrated complete neutralisation against EV-A71 in the
neutralising assay.
34
3.4.1 MAb characterisation
MAb isotype was determined using the commercially-available IsoStrip Mouse
Monoclonal Antibody Isotyping Kit (Roche, German), by dipping the strip into the
MAb solution. The Pierce™ BCA Protein Assay Kit (USA) was used for measurement
of the protein concentration. Briefly, 25 µL of samples were mixed well with 200 µL of
working solution in a 96 well plate. After incubation at 37°C for 30 min, the plate was
allowed to cool before absorbance reading at 540 nm.
3.5 Microneutralising assay
Two-fold dilutions of heat inactivated sera or MAb (1:2 to 1:1024) in MM were
prepared. Diluted sera or MAb was mixed with equal volumes of 100 CCID50 EV-A71
(Table 3.1, page 31) at 37°C for 2 hr and then transferred to duplicate wells containing
90%-confluent VERO cells and incubated at 36°C for 7 days. In this way, neutralising
titres defined as the highest dilution of serum that completely inhibited CPE for EV-
A71 (C1 – C5 and B3 – B5, Table 3.1, page 31) were determined. Negative control
wells contained cells incubated with MM only while positive control wells contained
cells incubated with a mixture of MM and virus without any antibodies.
3.6 Mouse infection experiments
All animal experiments were approved and performed in Malaysia, according to the
University of Malaya’s Animal Welfare and Use Committee guidelines (2014-02-
14/PATHO/R/WKT). Hence all mice were sacrificed with lethal dose of isoflurane at
the end of experiment or at the moribund stage. Table 3.2 summarises all the animal
experiments done in this study.
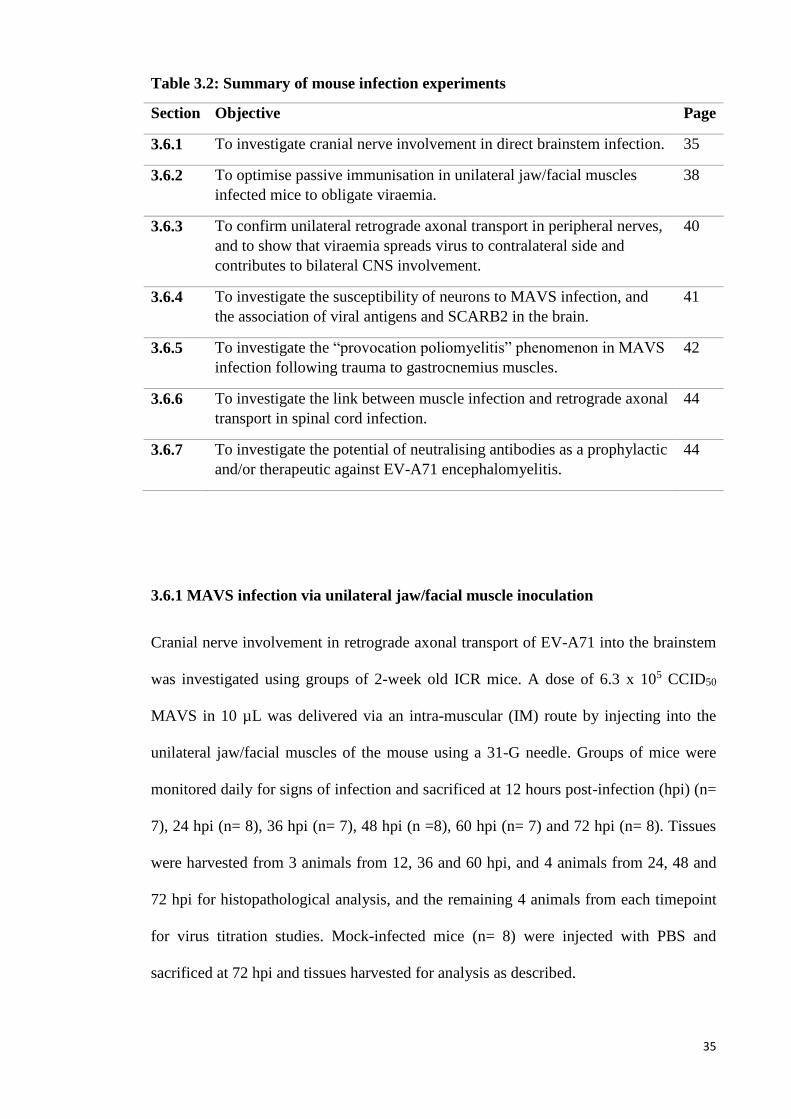
35
Table 3.2: Summary of mouse infection experiments
Section Objective Page
3.6.1 To investigate cranial nerve involvement in direct brainstem infection. 35
3.6.2 To optimise passive immunisation in unilateral jaw/facial muscles
infected mice to obligate viraemia.
38
3.6.3 To confirm unilateral retrograde axonal transport in peripheral nerves,
and to show that viraemia spreads virus to contralateral side and
contributes to bilateral CNS involvement.
40
3.6.4 To investigate the susceptibility of neurons to MAVS infection, and
the association of viral antigens and SCARB2 in the brain.
41
3.6.5 To investigate the “provocation poliomyelitis” phenomenon in MAVS
infection following trauma to gastrocnemius muscles.
42
3.6.6 To investigate the link between muscle infection and retrograde axonal
transport in spinal cord infection.
44
3.6.7 To investigate the potential of neutralising antibodies as a prophylactic
and/or therapeutic against EV-A71 encephalomyelitis.
44
3.6.1 MAVS infection via unilateral jaw/facial muscle inoculation
Cranial nerve involvement in retrograde axonal transport of EV-A71 into the brainstem
was investigated using groups of 2-week old ICR mice. A dose of 6.3 x 10⁵ CCID50
MAVS in 10 µL was delivered via an intra-muscular (IM) route by injecting into the
unilateral jaw/facial muscles of the mouse using a 31-G needle. Groups of mice were
monitored daily for signs of infection and sacrificed at 12 hours post-infection (hpi) (n=
7), 24 hpi (n= 8), 36 hpi (n= 7), 48 hpi (n =8), 60 hpi (n= 7) and 72 hpi (n= 8). Tissues
were harvested from 3 animals from 12, 36 and 60 hpi, and 4 animals from 24, 48 and
72 hpi for histopathological analysis, and the remaining 4 animals from each timepoint
for virus titration studies. Mock-infected mice (n= 8) were injected with PBS and
sacrificed at 72 hpi and tissues harvested for analysis as described.
36
3.6.1.1 Histopathological analysis
Tissue fixation and processing were carried out as previously described (Tan, Ong, &
Wong, 2014). In brief, the whole animal carcass was fixed in 10 % neutral buffered
formalin and then transversely cut into seven standard cross-sectional tissue blocks
which include all of the main organs. After overnight decalcification in 5% formic acid
and routine processing, 4 µm thick sections were prepared from paraffinised tissue
blocks and stained with haematoxylin and eosin (H&E) for light microscopy,
immunohistochemistry (IHC) to detect viral antigens and in situ hybridisation (ISH) to
detect viral RNA.
3.6.1.1 (a) IHC to detect viral antigens
IHC was performed as described previously (Tan et al., 2014). Briefly, slides containing
tissues were dewaxed and rehydrated with serial xylene and graded alcohols,
respectively. After antigen retrieval with citrate buffer (pH 6) at 99⁰C for 20 min, tissue
slides were allowed to cool for 10 min. This was followed by peroxidase blocking with
3% hydrogen peroxidase in methanol. Background blocking was done with 5% of
normal goat serum in Tris-buffer saline (TBS). Primary polyclonal rabbit anti EV-A71
antibody (A gift from Dr Shimizu, National Institute of Infectious Diseases, Japan)
diluted in PBS at 1:3000, was applied for 2 hr at RT. After TBS washing twice, goat
anti-mouse secondary antibody polymer complexes (EnVision + System - peroxidase;
Dako, Denmark) were added in the dark for 30 min, followed by TBS washing twice.
The 3,3'-Diaminobenzidine (DAB) substrate was added and incubated for 5 min. After
counterstaining with Harris hematoxylin, tissue sections were mounted with DPX
mounting medium. Tissues from a previously known EV-A71 infected mouse served as
positive controls whereas normal healthy mouse tissues served as negative controls.
37
3.6.1.1 (b) ISH to detect viral RNA
ISH was performed as described previously (Tan et al., 2014). Tissue sections were
dewaxed and rehydrated as for IHC (section 3.6.1.1 (a), page 36). After treatment with
hydrochloric acid and proteinase K at 37⁰C for 20 min, approximately 1 ng of
digoxigenin-labeled DNA probe (obtained from Ong et al. (2008)) in hybridisation
buffer was applied on the tissue sections and heated at 110⁰C for 12 min followed by
the probe hybridisation step at 42⁰C for 16 hr. Hybridised probes were visualised with
an anti-digoxigenin antibody conjugated to alkaline phosphatase (Roche, Mannheim,
Germany) in the dark for 16 hr and followed by nitrobluetetrazolium/5-bromo-4-chloro-
3-indolyl phosphate (NBT/BCIP) substrate development. After counterstaining with
Mayer haematoxylin, tissue sections were mounted with Faramount mounting medium
(Dako, Denmark). Similar positive and negative tissue controls described in section
3.6.1.1 (a) (page 36) were used.
3.6.1.2 Virus titration analysis
Mouse tissues, sera, hindlimb and forelimb muscles, whole brainstems, upper half and
lower half of spinal cords were harvested for viral titration. Different dissection sets and
careful handling of harvested tissues were observed to prevent cross contamination
between tissue types and between animals. The medium DMEM MM was added to each
tissue homogenate to a final 10% (wt/vol) concentration. Serial 10-fold dilutions of
homogenates in 50 µl were added to quadruplicate wells each containing 90% confluent
VERO cells and incubated at 36°C for 1 hr before topping up with 100 µL of MM per
well. Further incubation at 36°C for 7 days was followed by viral titre determination
using CCID50 by CPE observation and calculated using the Karber method as described
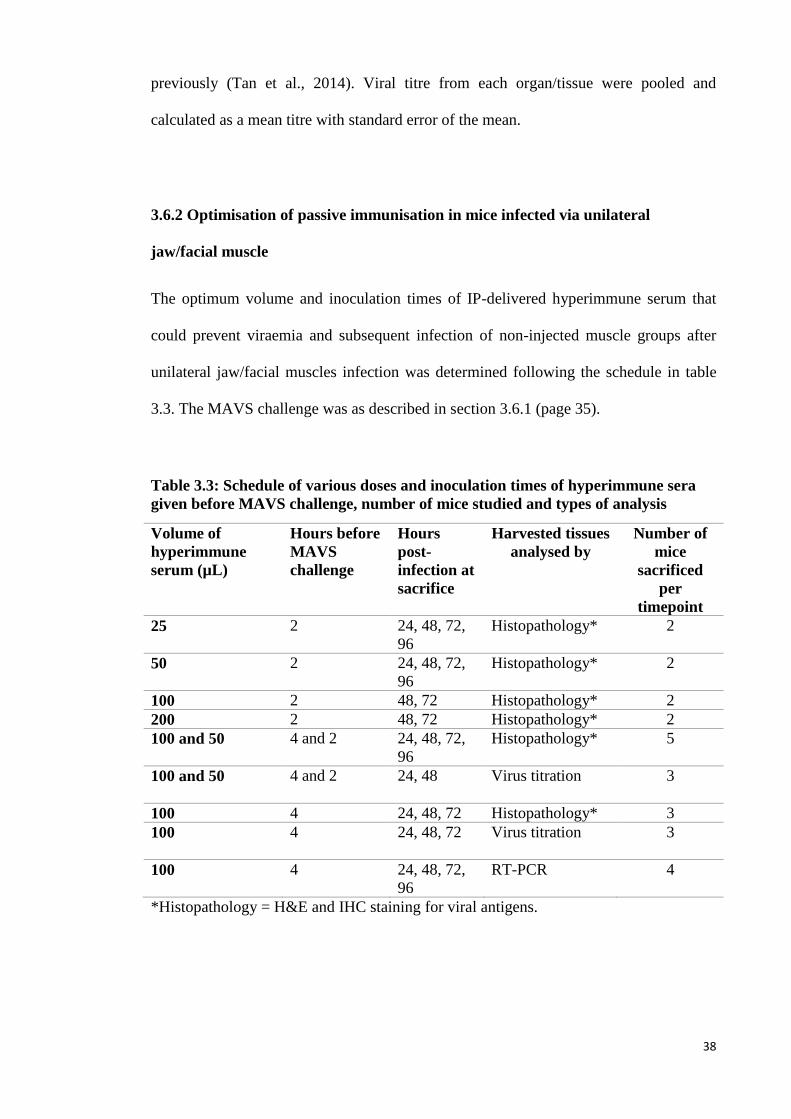
38
previously (Tan et al., 2014). Viral titre from each organ/tissue were pooled and
calculated as a mean titre with standard error of the mean.
3.6.2 Optimisation of passive immunisation in mice infected via unilateral
jaw/facial muscle
The optimum volume and inoculation times of IP-delivered hyperimmune serum that
could prevent viraemia and subsequent infection of non-injected muscle groups after
unilateral jaw/facial muscles infection was determined following the schedule in table
3.3. The MAVS challenge was as described in section 3.6.1 (page 35).
Table 3.3: Schedule of various doses and inoculation times of hyperimmune sera
given before MAVS challenge, number of mice studied and types of analysis
Volume of
hyperimmune
serum (µL)
Hours before
MAVS
challenge
Hours
post-
infection at
sacrifice
Harvested tissues
analysed by
Number of
mice
sacrificed
per
timepoint
25 2 24, 48, 72,
96
Histopathology* 2
50 2 24, 48, 72,
96
Histopathology* 2
100 2 48, 72 Histopathology* 2
200 2 48, 72 Histopathology* 2
100 and 50 4 and 2 24, 48, 72,
96
Histopathology* 5
100 and 50 4 and 2 24, 48
Virus titration 3
100 4 24, 48, 72 Histopathology* 3
100
4 24, 48, 72 Virus titration 3
100 4 24, 48, 72,
96
RT-PCR
4
*Histopathology = H&E and IHC staining for viral antigens.
39
3.6.2.1 Histopathological analysis and IHC
Histopathological analysis and IHC of harvested tissues were performed as before
(section 3.6.1.1 (page 36) and section 3.6.1.1 (a) (page 36), respectively).
3.6.2.2 Virus titration analysis
Viral titration assay was performed as before (section 3.6.1.2, page 37).
3.6.2.3 Viral RNA extraction, RT-PCR and qPCR
Tissues, sera, hindlimb and forelimb muscles, whole brainstems, upper half and lower
half of spinal cords were harvested as in section 3.6.1.2 for total viral RNA extraction
using a commercial kit (Hybrid-R, GeneAll, Korea) following the manufacturer’s
protocol. Extracted RNA diluted to 1 mg for cDNA generation by reverse transcription
(Transcriptor First Strand cDNA Synthesis Kit, Roche, German) was added to the
Random Hexamer Primer and denatured for 10 min at 65°C with a heated lid, followed
by immediate ice treatment. Buffer, RNase inhibitor, dNTPs and transcriptor reverse
transcriptase was added and incubated at 25°C for 10 min, followed by 55°C for 30 min
for the reverse transcription step, and heat inactivation at 85°C for 5 min. The first
strand cDNA product was then used for PCR and qPCR.
The PCR mixture consisted of 1 µL of cDNA template, 1.5 units of recombinant
Taq DNA polymerase (Fermentas, USA), 1X Taq Buffer with ammonium sulfate, 0.5
µM of each primer (Appendix C, page 160) and 0.2 mM dNTP mix. The conditions
were: 94°C for 3 min, 35 cycles of thermal cycling (15 seconds (sec) at 94°C, 30 sec at
60°C and 30 sec at 72°C) and final extension at 72°C, 5 min. The PCR products were
40
analysed by electrophoresis in 15% (wt/vol) Tris-borate-EDTA agarose gel containing
0.5 µg/mL ethidium bromide.
3.6.3 Mice infected via unilateral jaw/facial muscle and treated with optimised
passive immunisation
Based on results obtained from Section 3.6.2 (page 38), the optimum dose of 100 µL of
hyperimmune sera was IP-inoculated at 4 hr before MAVS infection in a group of mice
(n= 18) as described in section 3.6.1 (page 35). Animals were sacrificed at 12 hpi (n= 3),
24 hpi (n= 4), 48 hpi (n= 4), 72 hpi (n= 4) and 96 hpi (n= 3) for histopathological
analysis, IHC and ISH. An additional 4 animals were sacrificed at each timepoint, and
tissues harvested for virus titration. Mock-immunised mice (n= 8) which received
formaldehyde-fixed VERO cell lysates at the same time of MAVS infection, were
sacrificed at 72 hpi.
3.6.3.1 Histopathological analysis, IHC and ISH
Histopathological analysis, IHC and ISH staining were performed as before (section
3.6.1.1 (page 36), section 3.6.1.1 (a) (page 36) and section 3.6.1.1 (b) (page 37),
respectively).
3.6.3.2 Viral titration analysis
Viral titration assay was performed as before (section 3.6.1.2, page 37).
41
3.6.4 MAVS infection via intra-cerebral (thalamus/hypothalamus and
pons/medulla) inoculation
The susceptibility of neurons to MAVS infection by the intra-cerebral (IC) route, and
the association of viral antigens and mSCARB2 in the brain was investigated in 2
animal experiments. In the first experiment, 6.3 x 10⁵ CCID50 of MAVS in 10 µL was
IC-inoculated into the thalamus/hypothalamus region of a 2-week old ICR mouse using
31-G needles. Neurons in this region are known to have a high expression of
mSCARB2 (Lein et al., 2007). Tissues were harvested as before from 5 inoculated
animals, at 24, 48 and 72 hpi timepoints for histopathological analysis, and 4 additional
animals per timepoint for virus titration studies.
In the second experiment, the same amount of MAVS was IC-inoculated into the
pons/medulla which also expressed a similar level of mSCARB2 as the
thalamus/hypothalamus area. Three mice each were sacrificed at 24, 48 and 72 hpi for
histopathological analysis, IHC and ISH, and another 4 animals per timepoint for virus
titration analysis. Control mice (n= 6 for each experiment) were mock-infected with
sterile PBS.
3.6.4.1 Histopathological analysis, IHC and ISH staining
Generally, histopathological analysis, IHC and ISH staining were performed similar to
section 3.6.1.1 (page 36), section 3.6.1.1 (a) (page 36) and section 3.6.1.1 (b) (page 37),
respectively. However, in the current IHC procedure, a commercially-obtained, mouse
monoclonal anti EV-A71 antibody (Millipore, USA) diluted 1:50, was used instead of
the proprietary primary polyclonal rabbit anti EV-A71 antibody because the latter ran
out. Our preliminary testing showed this new antibody to be similar to the previous one.
42
3.6.4.2 Viral titration analysis
Viral titration assay was performed as before (section 3.6.1.2, page 37).
3.6.5 Investigation of the “provocation poliomyelitis” phenomenon in MAVS
infection
The phenomenon of “provocation poliomyelitis” was classically described in poliovirus
infection in which injured tissues from the act of injection (vaccination), aided
poliovirus infection and travel into the spinal cord, causing paralysis. In this experiment,
the possibility of a similar phenomenon occurring with EV-A71 infection was
investigated. Two groups of 2-week old ICR mice were IP-inoculated with ~90 CCID50
of MAVS. In the first group of mice (n= 10), bilateral gastrocnemius muscles were
traumatised 5 times by repeatedly inserting a 28-G needle into the muscle at 0 hpi, 12
hpi, 24 hpi, 36 hpi, 48 hpi and 60 hpi. A second group of animals (n= 10) served as a
non-traumatised control group. At 72 hpi, tissues were harvested as usual from 5
sacrificed animals from each group for histopathological analysis. The other 5 animals
in the same group were sacrificed for virus titration.
The entire experiment was repeated with a higher 1.78 x 10² CCID50 MAVS
dose. Wheat germ agglutinin (WGA) protein, well known as a retrograde tracer (Ohka
et al., 2009), was used to monitor the retrograde axonal transport rate in traumatised and
non-traumatised mice. As positive controls, 10 µg of WGA protein were IM-inoculated
into the bilateral gastrocnemius muscles of traumatised (n= 3) and non-traumatised mice
(n= 3). Mice were sacrificed at 12 hpi for total protein extraction and WGA
quantification.
43
3.6.5.1 Histopathological analysis, IHC staining
Generally, histopathological analysis and IHC were performed as before (section 3.6.1.1
(page 36) and section 3.6.1.1 (a) (page 36).
3.6.5.2 Viral titration analysis
Viral titration assay was performed as before (section 3.6.1.2, page 37).
3.6.5.3 Total protein extraction and WGA quantification
Tissues (hindlimb muscles, upper half and lower half of spinal cords) from sacrificed
positive control WGA-inoculated mice were used for total protein extraction according
to the manufacturer’s protocol (T-PER™ Tissue Protein Extraction Reagent, Thermo
Fisher, USA). Briefly, the extraction reagent with protease inhibitor (Pierce™ Protease
Inhibitor Tablets, EDTA-free, USA) was added to each tissue to a final concentration of
10% (wt/vol). Homogenised tissues were incubated for 30 min at 4°C, then centrifuged
at 10000 x g for 5 min to remove debris.
WGA concentration in extracted protein was semi-quantified by dot blot
analysis as previously described (Lancaster & Pfeiffer, 2010). Briefly, 5 µL of each
sample was dropped onto a nitrocellulose membrane and air dried. Non-specific sites
were blocked by 5% skim milk in TBS-Tween20 for 3 hr at RT. Rabbit anti-lectin
(triticum vulgaris) primary antibody (Sigma, St Louis, USA) at 1:4000 dilution was
added and incubated at 4°C overnight, followed by addition of goat anti-rabbit IgG AP-
conjugated (Pierce, USA) secondary antibody (1:5000 dilution, RT in dark for 1 hr) and
1-Step™ NBT/BCIP Substrate Solution (Thermo Fisher, USA) in dark for 10 min for
visualisation.
44
3.6.6 Investigation of the link between muscle infection and retrograde axonal
transport in spinal cord infection.
The link between muscle infection and retrograde axonal transport was investigated by
IM-inoculating 3.16 x 10³ CCID50 light-sensitive MAVS into both gastrocnemius
muscles of 2-week old ICR mice (n= 15). Tissues were harvested in the dark from 5
animals for virus titration study at each 24, 48 and 72 hpi timepoints.
3.6.6.1 Viral titration analysis
Generally, viral titration assay was performed as before (section 3.6.1.2, page 37) with
slight modifications. Harvested tissue samples were divided equally into light-treated
and light-protected samples. Light-treated samples were exposed to direct white light at
4°C for 30 min before titrated as in section 3.6.1.2 (page 37), and the whole titration
process was done in the dark.
3.6.7 Prevention and treatment of MAVS infection using neutralising antibodies
Prevention and treatment of MAVS infection in 2-week old ICR mice using neutralising
antibodies was investigated in 3 separate experiments. In experiment 1, 200 µL of
hyperimmune sera containing polyclonal antibodies which could neutralise EV-A71
was IP-inoculated into each 2-week old ICR mice 4 hr before MAVS infection, and at
12 hr and 24 hr after MAVS infection, respectively. The mice were then challenged
with MAVS as described in section 3.6.1 (page 36). Four animals per group were
sacrificed at 72 hpi, and tissues harvested for histopathological analysis, and another 4
animals were sacrificed for virus titration study, respectively. A further 4 animals in
45
each group were monitored to assess survival over a period of 21 days. Mock-treated
infected animals (n= 12) received VERO cell lysate-derived serum at 12 hpi.
In experiment 2, the effectiveness of MAb for treatment was investigated. Six
groups (each group, n= 4) of 2-week old ICR mice were infected via the IP route with
10 LD50 MAVS in 100 µL. Each group was then IP-inoculated for 2 consecutive days at
24 and 48 hpi with 30, 60, 120 µg of MAb or PBS (mock-treated control group),
respectively. Similar groups of mice were likewise treated for 2 consecutive days at 72
and 96 hpi using the same MAb doses. Mice were observed daily for up to 21 days post
infection (dpi) for signs of infection. The signs of infection were scored as follows: 0=
healthy; 1= weight loss; 2= limb weakness; 3= hind limb paralysis; and 4= moribund
and/or death.
In experiment 3, MAb effectiveness before and after CNS involvement was
evaluated. Two groups of mice (each group, n= 16) were similarly infected as in
experiment 2. Group 1 mice were treated with an optimal 120 µg MAb for 3
consecutive days at 24, 48 and 72 hpi. Group 2 received treatment at 72, 96, and 120 hpi.
Group 1 was sacrificed for histopathology (n= 4), virus titration (n= 4) and quantitative
real-time PCR (n= 4) at 96 hpi, while the same number of animals from Group 2 was
sacrificed at 144 hpi. The remaining 4 treated mice from each group were further
observed daily for signs of infection for 21 days. Thirty-two additional PBS-treated,
infected mice served as mock-treated controls. From this control group, 4 mice each
were sacrificed at 24, 72 and 96 hpi and tissues collected for histopathology and virus
titration, respectively. Tissues from an additional 4 mice sacrificed at 96 hpi were
obtained for quantitative real-time PCR (qPCR). The remaining 4 mock-treated mice
were further observed for signs of infection for 21 days. A summary of the schedule for
animal sacrifice and tissue sampling is showed in Figure 3.1.
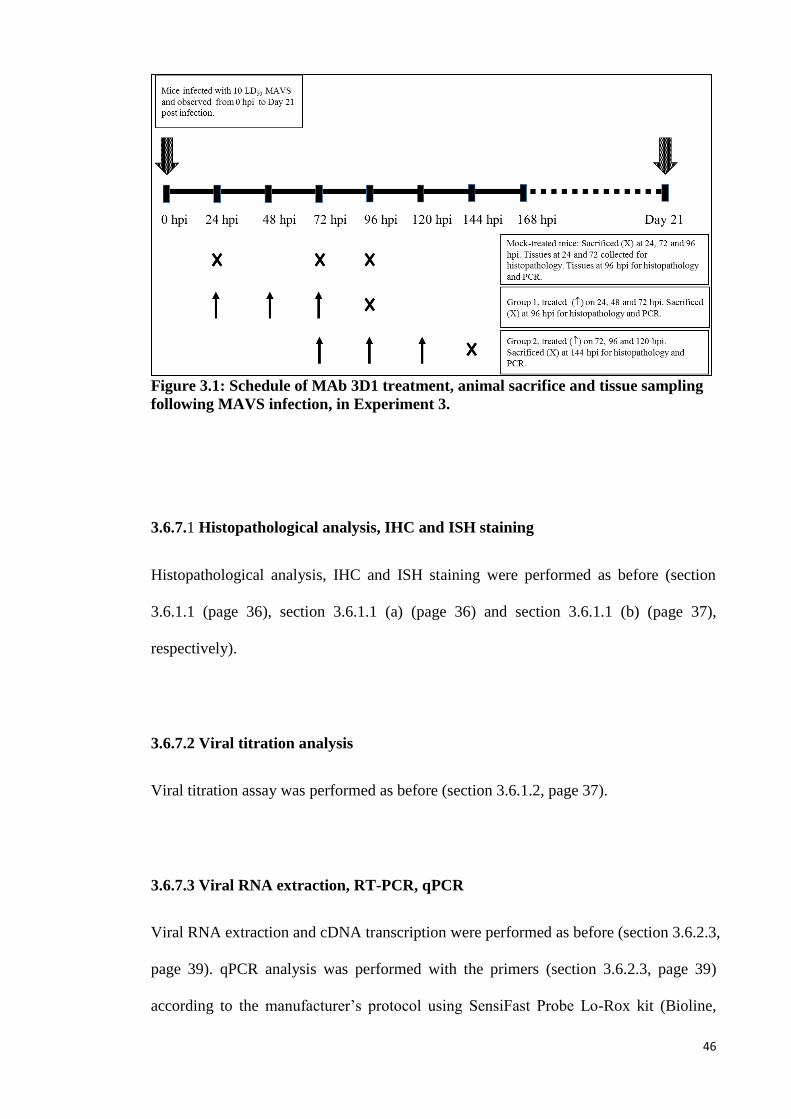
46
Figure 3.1: Schedule of MAb 3D1 treatment, animal sacrifice and tissue sampling
following MAVS infection, in Experiment 3.
3.6.7.1 Histopathological analysis, IHC and ISH staining
Histopathological analysis, IHC and ISH staining were performed as before (section
3.6.1.1 (page 36), section 3.6.1.1 (a) (page 36) and section 3.6.1.1 (b) (page 37),
respectively).
3.6.7.2 Viral titration analysis
Viral titration assay was performed as before (section 3.6.1.2, page 37).
3.6.7.3 Viral RNA extraction, RT-PCR, qPCR
Viral RNA extraction and cDNA transcription were performed as before (section 3.6.2.3,
page 39). qPCR analysis was performed with the primers (section 3.6.2.3, page 39)
according to the manufacturer’s protocol using SensiFast Probe Lo-Rox kit (Bioline,
47
UK). The qPCR mixture consisted of 2 µL of cDNA template, 1X sensifast probe mix,
400 nM of each primer and 100 nm of probe. The conditions were: 95°C for 5 min for
polymerase activation and 40 cycles of thermal cycling (10 sec at 95°C and 30 sec at
60°C). Full length of MAVS was reverse transcripted and served as standard control for
absolute quantification.
3.7 Primary murine motor neuron culture
Primary motor neuron culture (Ohka et al., 2009) was performed in Tokyo, Japan,
following guidelines of Animal Use and Care Committee of the Tokyo Metropolitan
Institute of Medical Science. Briefly, spinal cords of E14 mouse embryos were
dissected in sterile PBS using a dissecting microscope. The meninges, dorsal root
ganglia and dorsal column were removed using a fine-tip forcep. Minced spinal cords
tissues were treated with trypsin for 10 min at 37°C with agitation every 5 min followed
by DNase I treatment. Tissues were triturated in neurobasal medium supplemented with
10% bovine serum albumin (BSA) in L15 medium and DNase I, to separate the motor
neuron cells from the tissue fragments. After the tissue fragments were allowed to settle
for 3 min, the supernatant was collected and centrifuged with a cushion of BSA/L15
medium at 1400 rpm for 5 min. Cell pellets were resuspended in a small volume of
freshly prepared complete GM and plated at a density of 40 000 cells /mL.
3.7.1 Transfection of primary murine motor neurons
Transfection of primary murine motor neurons was performed according to the
manufacturer’s protocol (4D-Nucleofector™ System, Lonza, Switzerland). Briefly,
primary motor neurons were seeded onto a 24 well plate at 1.5 x 10⁵ cells/well. After 4
days of incubation in a humidified 37°C/7% CO2 incubator, half of media was replaced
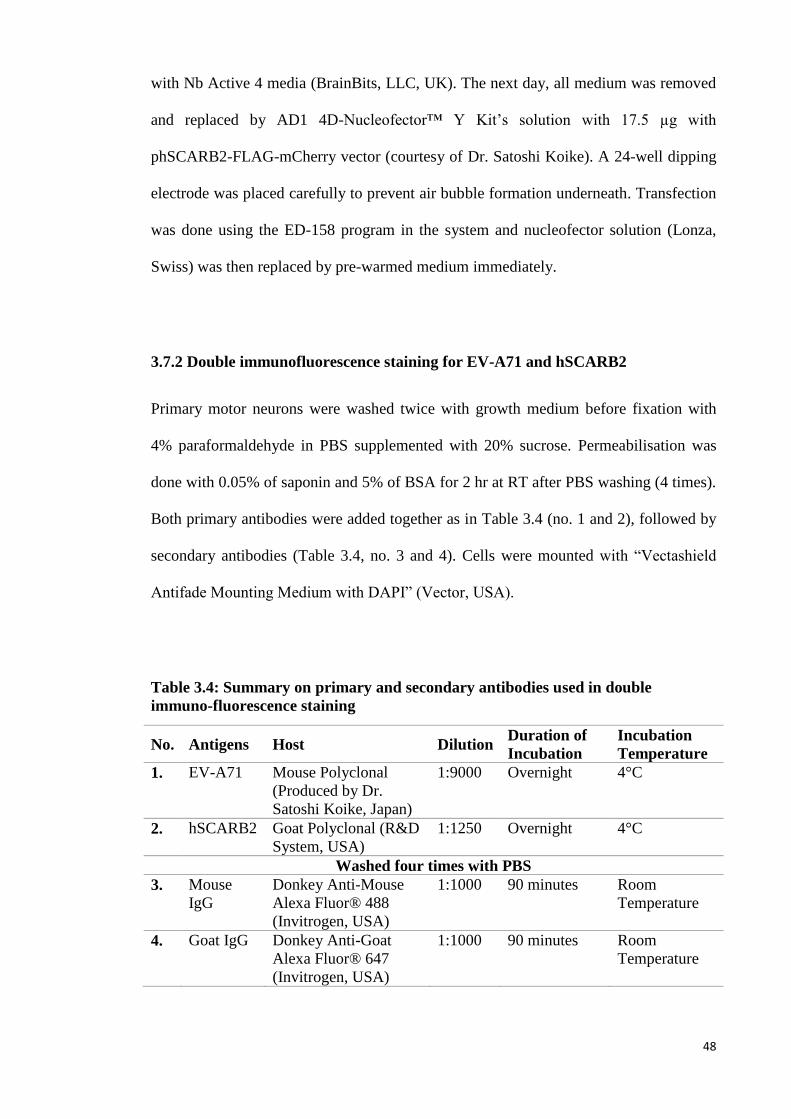
48
with Nb Active 4 media (BrainBits, LLC, UK). The next day, all medium was removed
and replaced by AD1 4D-Nucleofector™ Y Kit’s solution with 17.5 µg with
phSCARB2-FLAG-mCherry vector (courtesy of Dr. Satoshi Koike). A 24-well dipping
electrode was placed carefully to prevent air bubble formation underneath. Transfection
was done using the ED-158 program in the system and nucleofector solution (Lonza,
Swiss) was then replaced by pre-warmed medium immediately.
3.7.2 Double immunofluorescence staining for EV-A71 and hSCARB2
Primary motor neurons were washed twice with growth medium before fixation with
4% paraformaldehyde in PBS supplemented with 20% sucrose. Permeabilisation was
done with 0.05% of saponin and 5% of BSA for 2 hr at RT after PBS washing (4 times).
Both primary antibodies were added together as in Table 3.4 (no. 1 and 2), followed by
secondary antibodies (Table 3.4, no. 3 and 4). Cells were mounted with “Vectashield
Antifade Mounting Medium with DAPI” (Vector, USA).
Table 3.4: Summary on primary and secondary antibodies used in double
immuno-fluorescence staining
No. Antigens Host Dilution Duration of
Incubation
Incubation
Temperature
1. EV-A71 Mouse Polyclonal
(Produced by Dr.
Satoshi Koike, Japan)
1:9000 Overnight 4°C
2. hSCARB2 Goat Polyclonal (R&D
System, USA)
1:1250 Overnight 4°C
Washed four times with PBS
3. Mouse
IgG
Donkey Anti-Mouse
Alexa Fluor® 488
(Invitrogen, USA)
1:1000 90 minutes Room
Temperature
4. Goat IgG Donkey Anti-Goat
Alexa Fluor® 647
(Invitrogen, USA)
1:1000 90 minutes Room
Temperature
49
3.8 Statistic Analysis
Statistical analyses were performed using SPSS Statistics 21. All virus titration analysis
and viral copy numbers from qPCR results were analysed using the Kruskal-Wallis test
to determine statistical significance in viral titres across all tissue types. The Mann-
Whitney U test was used to determine if any 2 particular tissue types were different.
The survival and clinical score of treated and mock treated animals (section
3.6.7, page 46) were analysed using the log-rank test. A value of P< 0.05 was
considered significant.
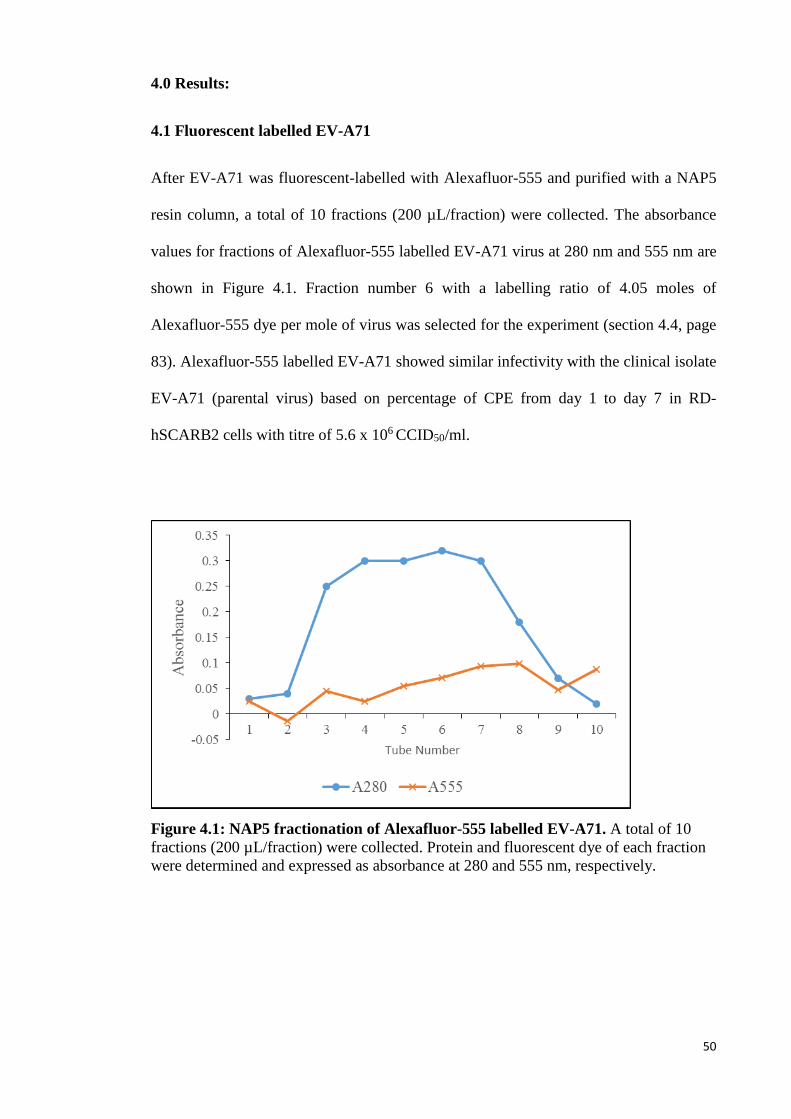
50
4.0 Results:
4.1 Fluorescent labelled EV-A71
After EV-A71 was fluorescent-labelled with Alexafluor-555 and purified with a NAP5
resin column, a total of 10 fractions (200 µL/fraction) were collected. The absorbance
values for fractions of Alexafluor-555 labelled EV-A71 virus at 280 nm and 555 nm are
shown in Figure 4.1. Fraction number 6 with a labelling ratio of 4.05 moles of
Alexafluor-555 dye per mole of virus was selected for the experiment (section 4.4, page
83). Alexafluor-555 labelled EV-A71 showed similar infectivity with the clinical isolate
EV-A71 (parental virus) based on percentage of CPE from day 1 to day 7 in RD-
hSCARB2 cells with titre of 5.6 x 10⁶ CCID50/ml.
Figure 4.1: NAP5 fractionation of Alexafluor-555 labelled EV-A71. A total of 10
fractions (200 µL/fraction) were collected. Protein and fluorescent dye of each fraction
were determined and expressed as absorbance at 280 and 555 nm, respectively.
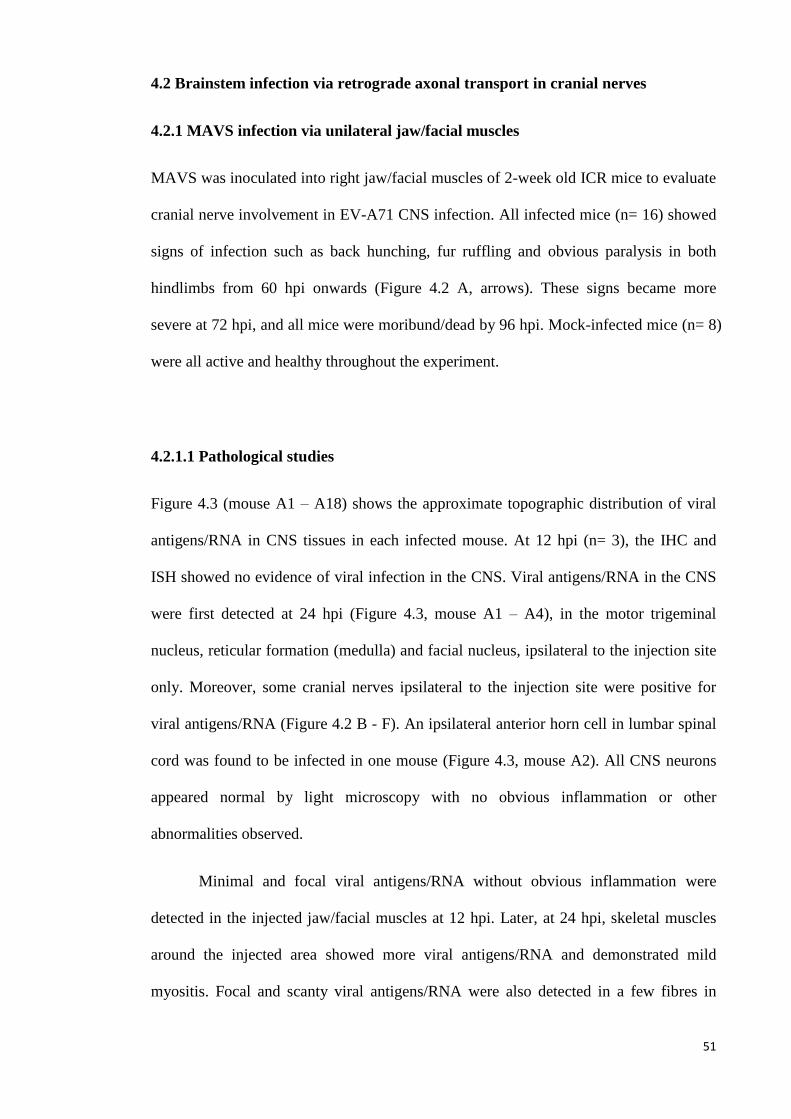
51
4.2 Brainstem infection via retrograde axonal transport in cranial nerves
4.2.1 MAVS infection via unilateral jaw/facial muscles
MAVS was inoculated into right jaw/facial muscles of 2-week old ICR mice to evaluate
cranial nerve involvement in EV-A71 CNS infection. All infected mice (n= 16) showed
signs of infection such as back hunching, fur ruffling and obvious paralysis in both
hindlimbs from 60 hpi onwards (Figure 4.2 A, arrows). These signs became more
severe at 72 hpi, and all mice were moribund/dead by 96 hpi. Mock-infected mice (n= 8)
were all active and healthy throughout the experiment.
4.2.1.1 Pathological studies
Figure 4.3 (mouse A1 – A18) shows the approximate topographic distribution of viral
antigens/RNA in CNS tissues in each infected mouse. At 12 hpi (n= 3), the IHC and
ISH showed no evidence of viral infection in the CNS. Viral antigens/RNA in the CNS
were first detected at 24 hpi (Figure 4.3, mouse A1 – A4), in the motor trigeminal
nucleus, reticular formation (medulla) and facial nucleus, ipsilateral to the injection site
only. Moreover, some cranial nerves ipsilateral to the injection site were positive for
viral antigens/RNA (Figure 4.2 B - F). An ipsilateral anterior horn cell in lumbar spinal
cord was found to be infected in one mouse (Figure 4.3, mouse A2). All CNS neurons
appeared normal by light microscopy with no obvious inflammation or other
abnormalities observed.
Minimal and focal viral antigens/RNA without obvious inflammation were
detected in the injected jaw/facial muscles at 12 hpi. Later, at 24 hpi, skeletal muscles
around the injected area showed more viral antigens/RNA and demonstrated mild
myositis. Focal and scanty viral antigens/RNA were also detected in a few fibres in
52
contralateral jaw/facial muscles, and other skeletal muscles such as tongue and limbs
bilaterally. All other tissues were negative.
Bilateral CNS infection was observed in all mice starting from 36 hpi (Figure
4.3, mouse A5 - A7). The distribution of viral antigens/RNA in brainstem neurons was
almost similar to the findings at 24 hpi. However, in general, CNS infection on the
ipsilateral side was more severe compared to the contralateral side (Figure 4.3, mouse
A5 – A7). Viral antigens/RNA were found mainly in the motor trigeminal nuclei
(Figure 4.4 A - D), reticular formation (Figure 4.4 E) and facial nuclei (Figure 4.4 F). A
few neurons in thalamus (Figure 4.3, mouse A7; Figure 4.4 Q) and motor cortex (Figure
4.3, mouse A5 and A6; Figure 4.4 G) were infected too. Infected neurons showed
neuronal vacuolation and damage (Figure 4.4 A). Bilateral involvement of anterior horn
cells in spinal cord was observed in a single mouse (Figure 4.3, mouse A7). MAVS
inoculated jaw/facial muscles showed dense viral antigens/RNA, severe inflammation
and necrosis. Brown adipose tissues and other systemic skeletal muscles were infected
bilaterally but inflammation was minimal.
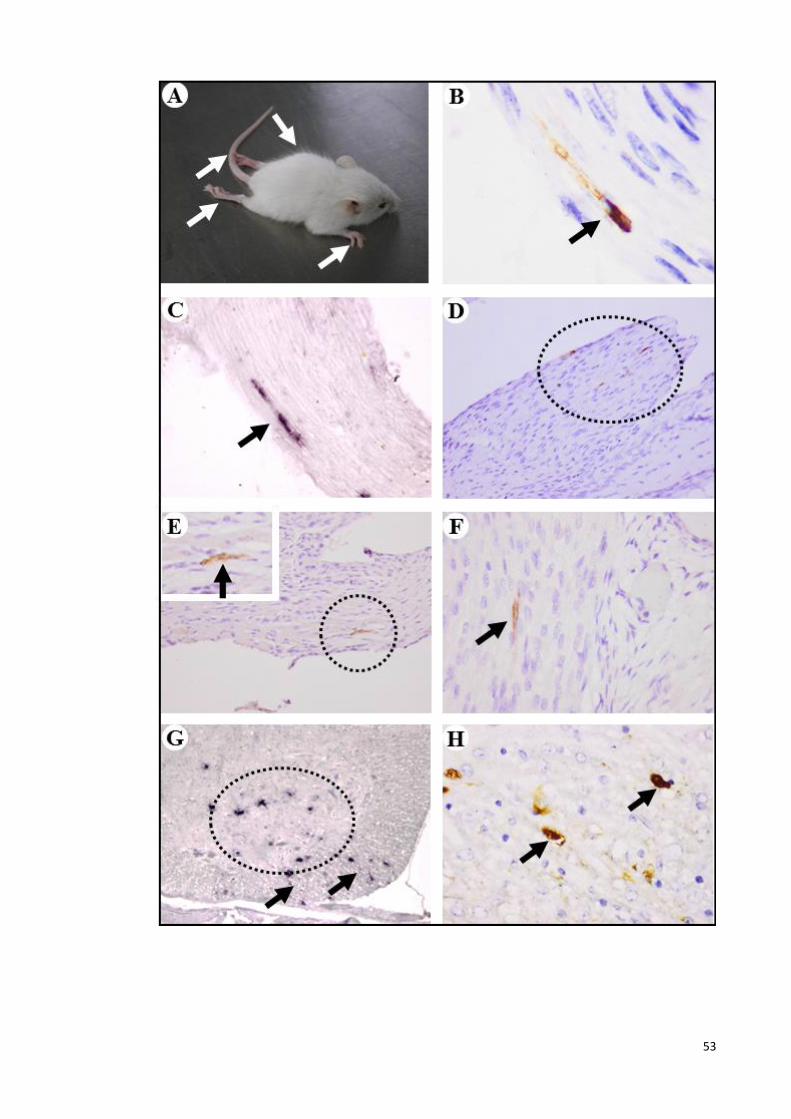
53
54
Figure 4.2: Clinical observation, and pathological findings following unilateral
jaw/facial muscle infection. Infected mice showed back hunching (arrow), and obvious
paralysis in both hindlimbs (arrows) and forelimbs (arrow) at 72 hpi. Viral antigens (B
arrow, D circle, E circle and F arrow) and RNA (C arrow) were found in cranial nerves
ipsilateral to the injection site. In the spinal cord, viral RNA (G arrows) and antigens (H
arrows) were often detected in white matter axons adjacent to anterior horn cells that
were positive for viral antigens or RNA (G circle). IHC with DAB chromogen and
haematoxylin counterstain (B, D – F and H). ISH with haematoxylin counterstain (C
and G). Original magnification: 100x objective (B); 40x objective (C, F, H and inset);
20x objective (D and E); 10x objective (G).
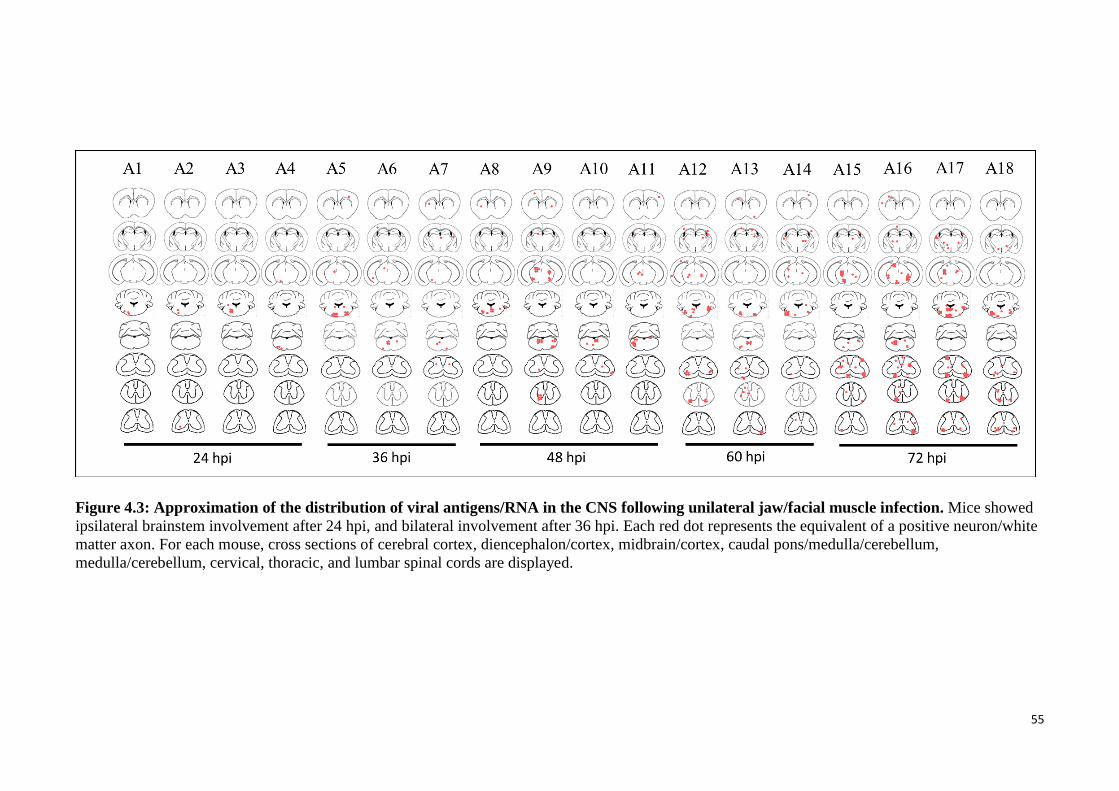
55
Figure 4.3: Approximation of the distribution of viral antigens/RNA in the CNS following unilateral jaw/facial muscle infection. Mice showed
ipsilateral brainstem involvement after 24 hpi, and bilateral involvement after 36 hpi. Each red dot represents the equivalent of a positive neuron/white
matter axon. For each mouse, cross sections of cerebral cortex, diencephalon/cortex, midbrain/cortex, caudal pons/medulla/cerebellum,
medulla/cerebellum, cervical, thoracic, and lumbar spinal cords are displayed.
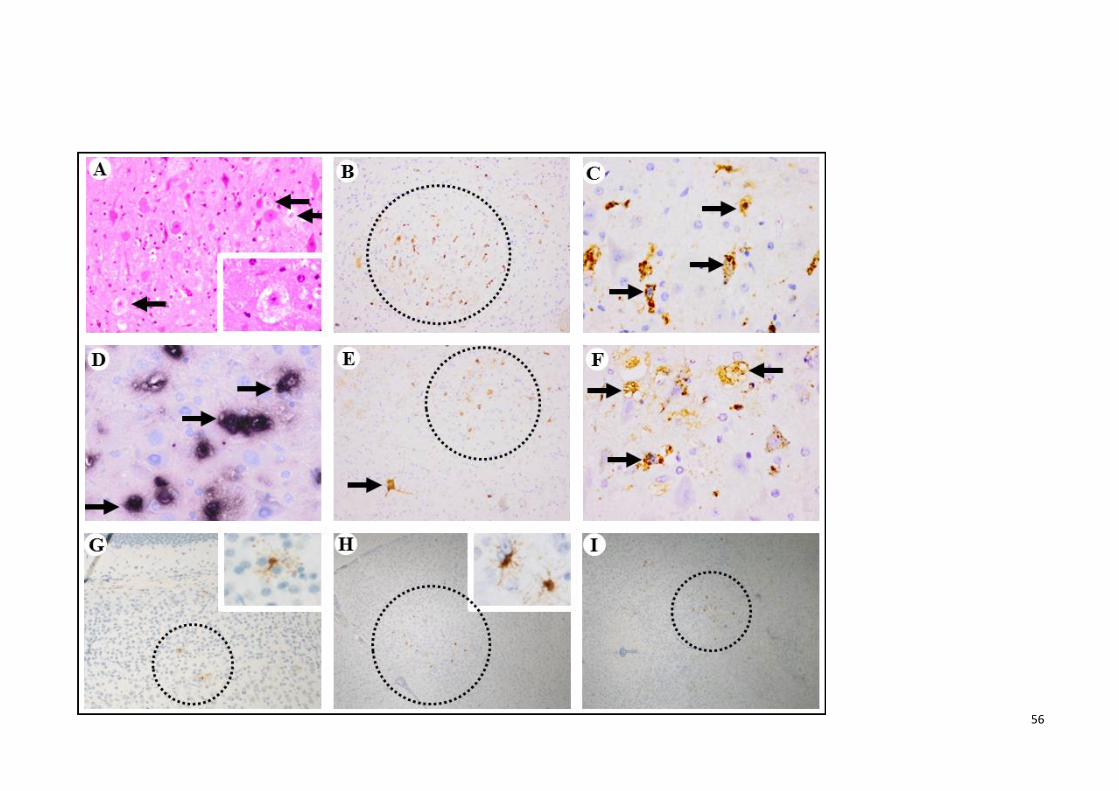
56
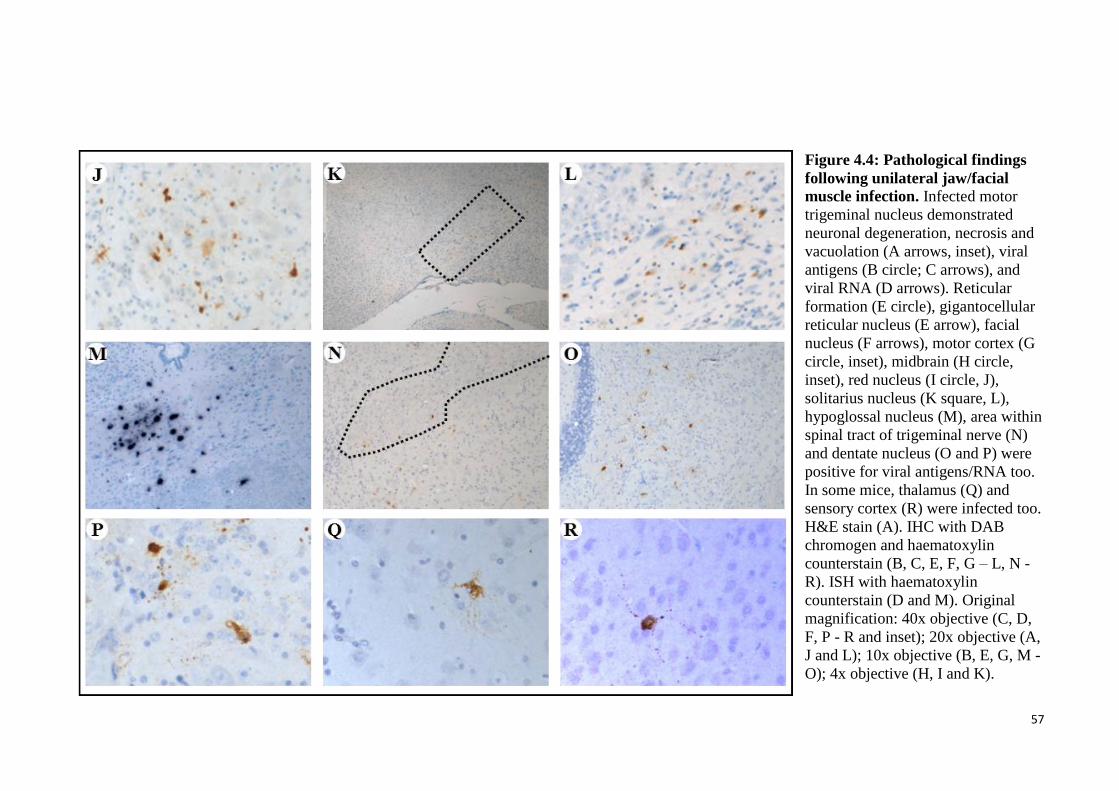
57
Figure 4.4: Pathological findings
following unilateral jaw/facial
muscle infection. Infected motor
trigeminal nucleus demonstrated
neuronal degeneration, necrosis and
vacuolation (A arrows, inset), viral
antigens (B circle; C arrows), and
viral RNA (D arrows). Reticular
formation (E circle), gigantocellular
reticular nucleus (E arrow), facial
nucleus (F arrows), motor cortex (G
circle, inset), midbrain (H circle,
inset), red nucleus (I circle, J),
solitarius nucleus (K square, L),
hypoglossal nucleus (M), area within
spinal tract of trigeminal nerve (N)
and dentate nucleus (O and P) were
positive for viral antigens/RNA too.
In some mice, thalamus (Q) and
sensory cortex (R) were infected too.
H&E stain (A). IHC with DAB
chromogen and haematoxylin
counterstain (B, C, E, F, G – L, N -
R). ISH with haematoxylin
counterstain (D and M). Original
magnification: 40x objective (C, D,
F, P - R and inset); 20x objective (A,
J and L); 10x objective (B, E, G, M -
O); 4x objective (H, I and K).
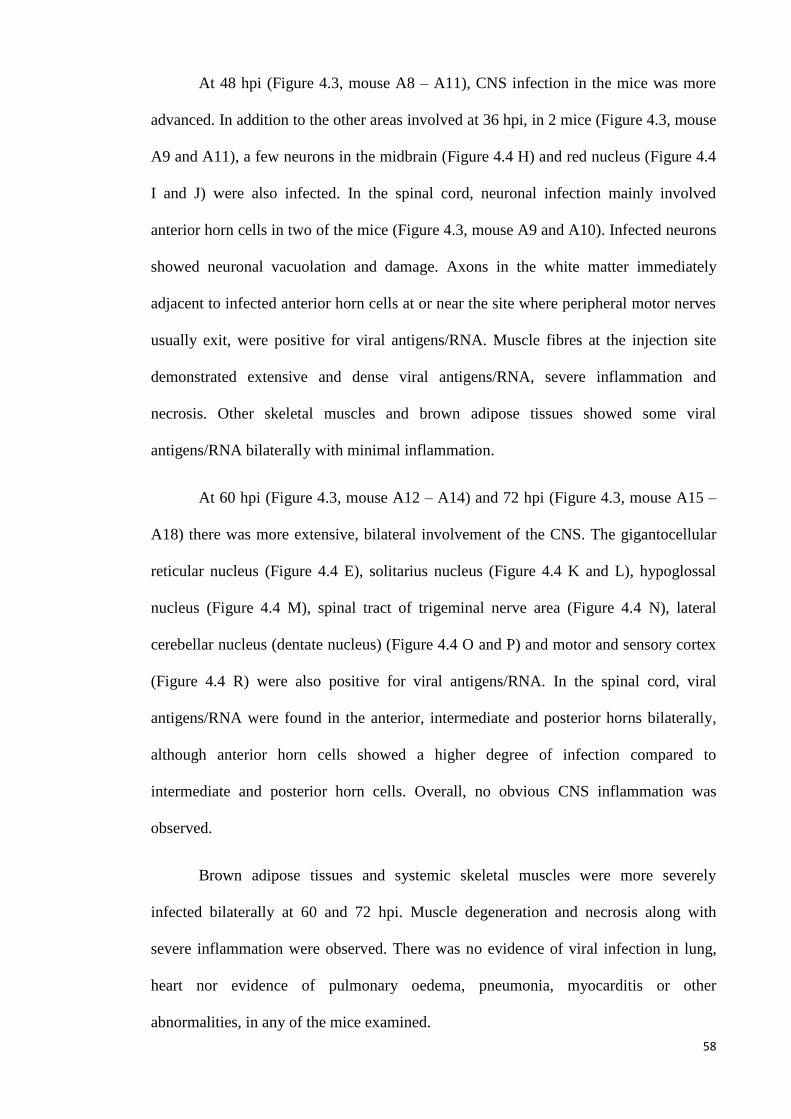
58
At 48 hpi (Figure 4.3, mouse A8 – A11), CNS infection in the mice was more
advanced. In addition to the other areas involved at 36 hpi, in 2 mice (Figure 4.3, mouse
A9 and A11), a few neurons in the midbrain (Figure 4.4 H) and red nucleus (Figure 4.4
I and J) were also infected. In the spinal cord, neuronal infection mainly involved
anterior horn cells in two of the mice (Figure 4.3, mouse A9 and A10). Infected neurons
showed neuronal vacuolation and damage. Axons in the white matter immediately
adjacent to infected anterior horn cells at or near the site where peripheral motor nerves
usually exit, were positive for viral antigens/RNA. Muscle fibres at the injection site
demonstrated extensive and dense viral antigens/RNA, severe inflammation and
necrosis. Other skeletal muscles and brown adipose tissues showed some viral
antigens/RNA bilaterally with minimal inflammation.
At 60 hpi (Figure 4.3, mouse A12 – A14) and 72 hpi (Figure 4.3, mouse A15 –
A18) there was more extensive, bilateral involvement of the CNS. The gigantocellular
reticular nucleus (Figure 4.4 E), solitarius nucleus (Figure 4.4 K and L), hypoglossal
nucleus (Figure 4.4 M), spinal tract of trigeminal nerve area (Figure 4.4 N), lateral
cerebellar nucleus (dentate nucleus) (Figure 4.4 O and P) and motor and sensory cortex
(Figure 4.4 R) were also positive for viral antigens/RNA. In the spinal cord, viral
antigens/RNA were found in the anterior, intermediate and posterior horns bilaterally,
although anterior horn cells showed a higher degree of infection compared to
intermediate and posterior horn cells. Overall, no obvious CNS inflammation was
observed.
Brown adipose tissues and systemic skeletal muscles were more severely
infected bilaterally at 60 and 72 hpi. Muscle degeneration and necrosis along with
severe inflammation were observed. There was no evidence of viral infection in lung,
heart nor evidence of pulmonary oedema, pneumonia, myocarditis or other
abnormalities, in any of the mice examined.
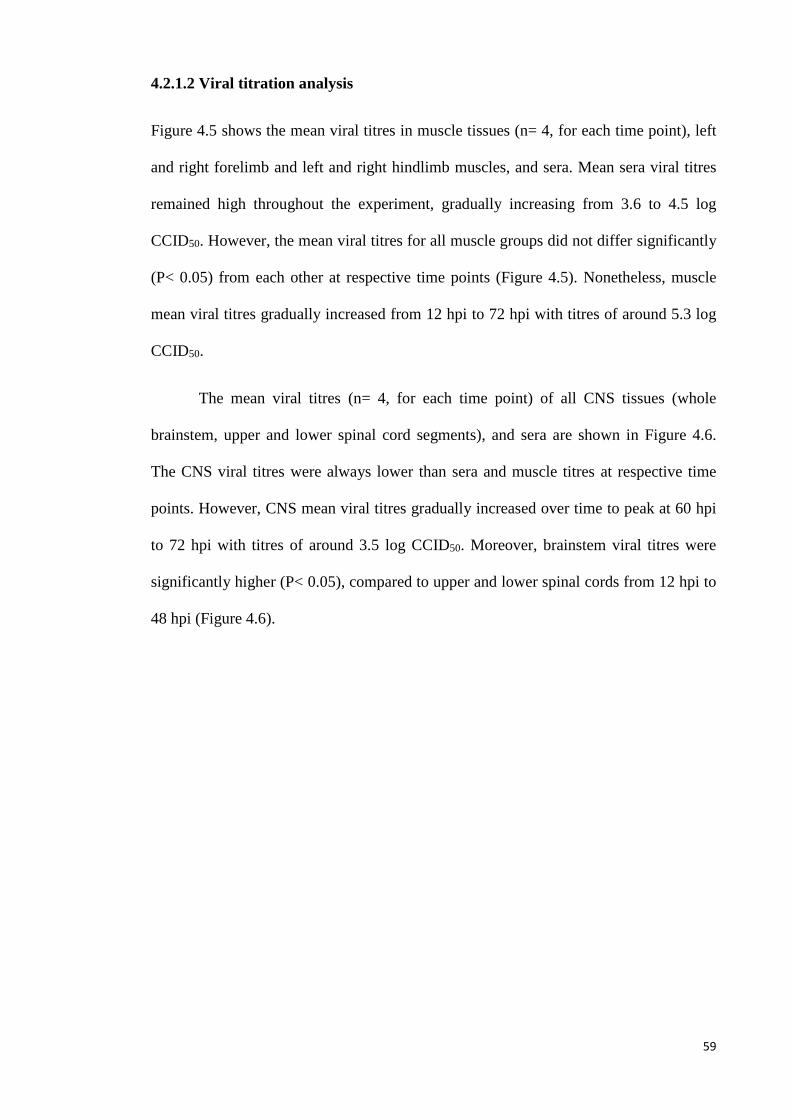
59
4.2.1.2 Viral titration analysis
Figure 4.5 shows the mean viral titres in muscle tissues (n= 4, for each time point), left
and right forelimb and left and right hindlimb muscles, and sera. Mean sera viral titres
remained high throughout the experiment, gradually increasing from 3.6 to 4.5 log
CCID50. However, the mean viral titres for all muscle groups did not differ significantly
(P< 0.05) from each other at respective time points (Figure 4.5). Nonetheless, muscle
mean viral titres gradually increased from 12 hpi to 72 hpi with titres of around 5.3 log
CCID50.
The mean viral titres (n= 4, for each time point) of all CNS tissues (whole
brainstem, upper and lower spinal cord segments), and sera are shown in Figure 4.6.
The CNS viral titres were always lower than sera and muscle titres at respective time
points. However, CNS mean viral titres gradually increased over time to peak at 60 hpi
to 72 hpi with titres of around 3.5 log CCID50. Moreover, brainstem viral titres were
significantly higher (P< 0.05), compared to upper and lower spinal cords from 12 hpi to
48 hpi (Figure 4.6).
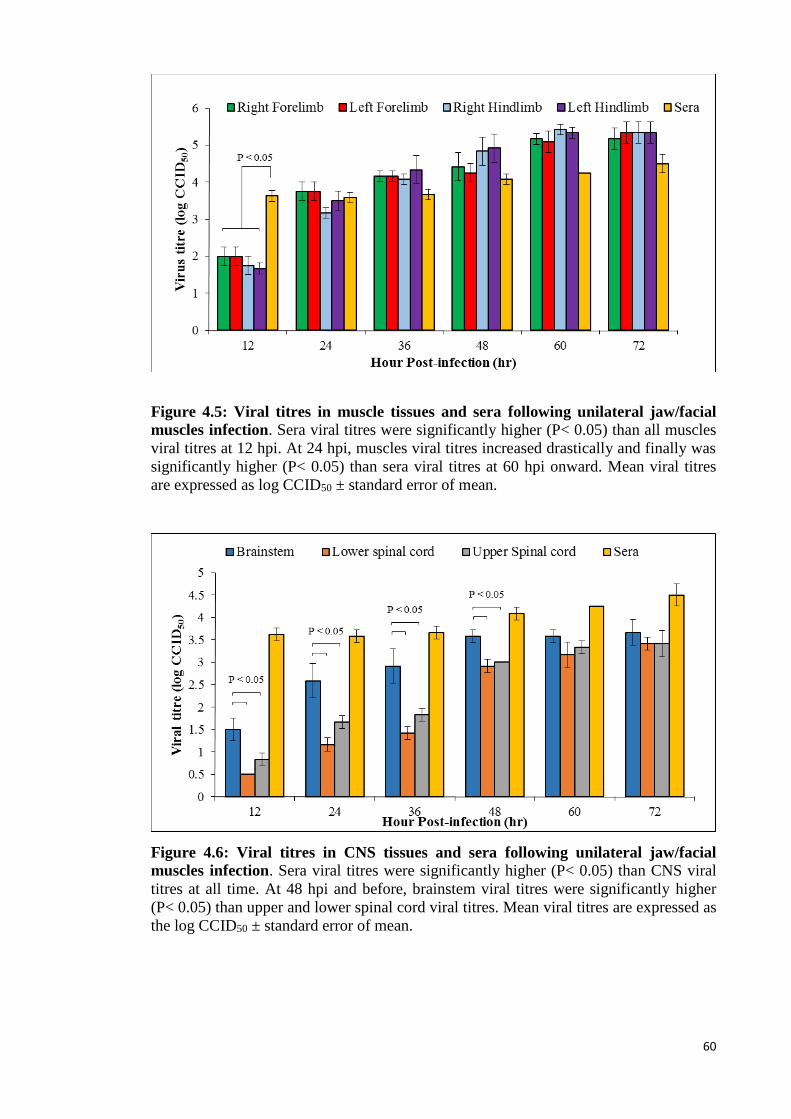
60
Figure 4.5: Viral titres in muscle tissues and sera following unilateral jaw/facial
muscles infection. Sera viral titres were significantly higher (P< 0.05) than all muscles
viral titres at 12 hpi. At 24 hpi, muscles viral titres increased drastically and finally was
significantly higher (P< 0.05) than sera viral titres at 60 hpi onward. Mean viral titres
are expressed as log CCID50 ± standard error of mean.
Figure 4.6: Viral titres in CNS tissues and sera following unilateral jaw/facial
muscles infection. Sera viral titres were significantly higher (P< 0.05) than CNS viral
titres at all time. At 48 hpi and before, brainstem viral titres were significantly higher
(P< 0.05) than upper and lower spinal cord viral titres. Mean viral titres are expressed as
the log CCID50 ± standard error of mean.
61
4.2.2 Optimisation of passive immunisation in unilaterally-infected mice to
abrogate viraemia
Following unilateral jaw/facial muscle inoculation, bilateral CNS involvement starting
from 36 hpi (section 4.2.1.1, page 51) was most likely due to viraemia causing
widespread virus infection. Hence hyperimmune sera were given at various doses and
time points before inoculation in an attempt to abrogate viraemia to confirm unilateral
retrograde axonal transport in peripheral nerves, and to show that bilateral CNS
involvement follows viraemia that spreads virus to the contralateral side.
Mice (n= 8) receiving 25 µL of hyperimmune sera 2 hr before infection showed
delayed onset of CNS infection compared to mock-treated mice. Treated mice sacrificed
at 24 hpi (n= 2), showed viral antigens in the injected right jaw/facial muscles, part of
shoulder muscles and forelimb muscles bilaterally as shown in Figure 4.7 A and B,
respectively, without CNS involvement. In mice sacrificed at 48 hpi (n= 2), viral
antigens were also found bilaterally in the brainstem reticular formation and motor
trigeminal nucleus (Figure 4.7 C). Spinal cord anterior horn cells were involved at 72
hpi (n= 4).
Mice (n= 8) receiving a higher dose (50 µL) of hyperimmune sera at 2 hr before
infection, showed viral antigens in injected right jaw/facial muscles and part of shoulder
muscles (Figure 4.7, D and E) at 24 hpi (n= 2). At 48 hpi (n= 2), bilateral brainstem
reticular formation and motor trigeminal nucleus (Figure 4.7 F) and forelimb muscles
were infected. Anterior horn cells of the spinal cord were involved from 96 hpi (n= 2).
Mice (n= 4) receiving 100 µL of hyperimmune sera at 2 hr before infection,
showed similar results to mice receiving 50 µL of hyperimmune sera at early time
points, up to 48 hpi. However, there was no evidence of infection in the forelimb
muscles and spinal cord (Figure 4.7 G - I). In the fourth trial, mice (n= 4) receiving the
62
highest dose of 200 µL of hyperimmune sera at 2 hr before infection, only showed
minimal infection in the injected right jaw/facial muscles throughout the experiment
(Figure 4.7 J - L) without any CNS involvement.
Further variations of passive immunisation in which mice (n= 20) receiving 100
µL of hyperimmune sera at 4 hr before infection and 50 µL of hyperimmune sera at 2 hr
before infection showed minimal infection at the injected right jaw/facial muscles
throughout the experiment without CNS infection (Figure 4.7 M - O). Finally, mice (n=
9) receiving 100 µL of hyperimmune sera at 4 hr before infection, showed minimal
involvement in the injected right jaw/facial muscles only and unilateral brainstem
involvement after 48 hpi. Sera, left and right forelimb and hindlimb muscles collected
for viral titration (n= 9) were negative. Viral RNA were not detectable in the extracted
samples (n= 16) by RT-PCR. Hence this passive treatment modality was used in Section
4.2.3.
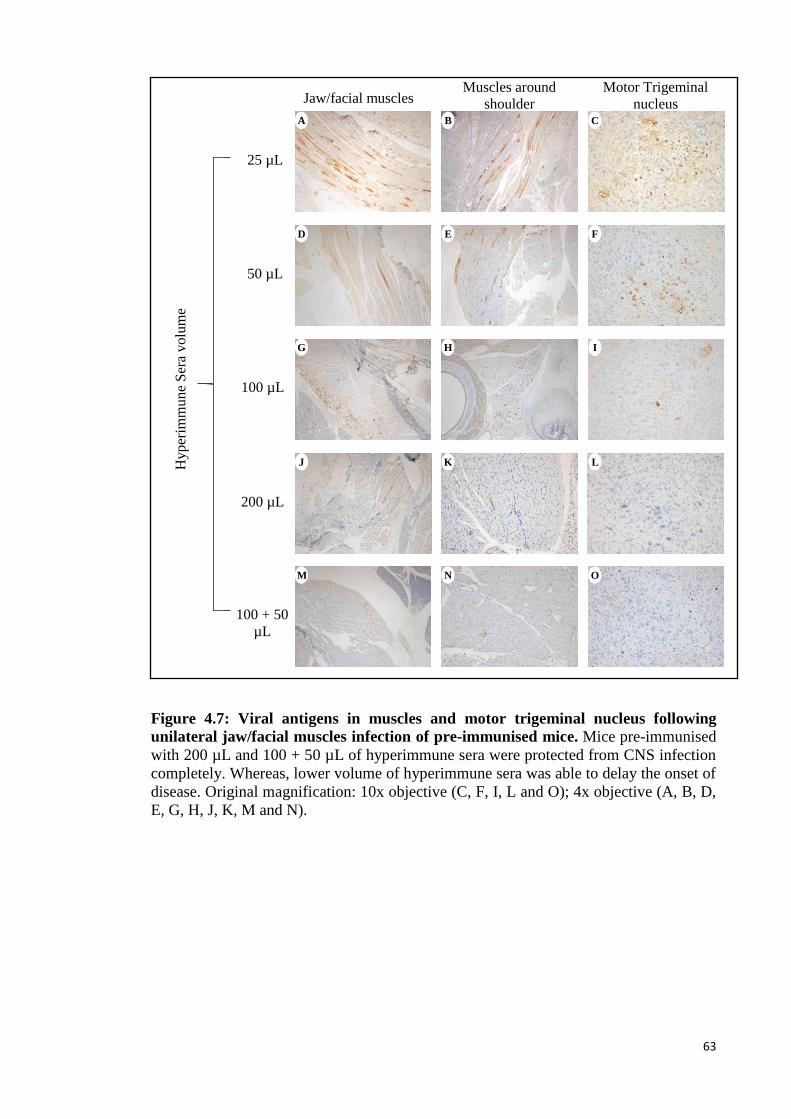
63
Figure 4.7: Viral antigens in muscles and motor trigeminal nucleus following
unilateral jaw/facial muscles infection of pre-immunised mice. Mice pre-immunised
with 200 µL and 100 + 50 µL of hyperimmune sera were protected from CNS infection
completely. Whereas, lower volume of hyperimmune sera was able to delay the onset of
disease. Original magnification: 10x objective (C, F, I, L and O); 4x objective (A, B, D,
E, G, H, J, K, M and N).
25 µL
50 µL
100 µL
Hyper
imm
un
e S
era
volu
me
Jaw/facial muscles Muscles around
shoulder A B
E D
H G
Motor Trigeminal
nucleus C
F
I
100 + 50
µL
N M O
200 µL
L K J
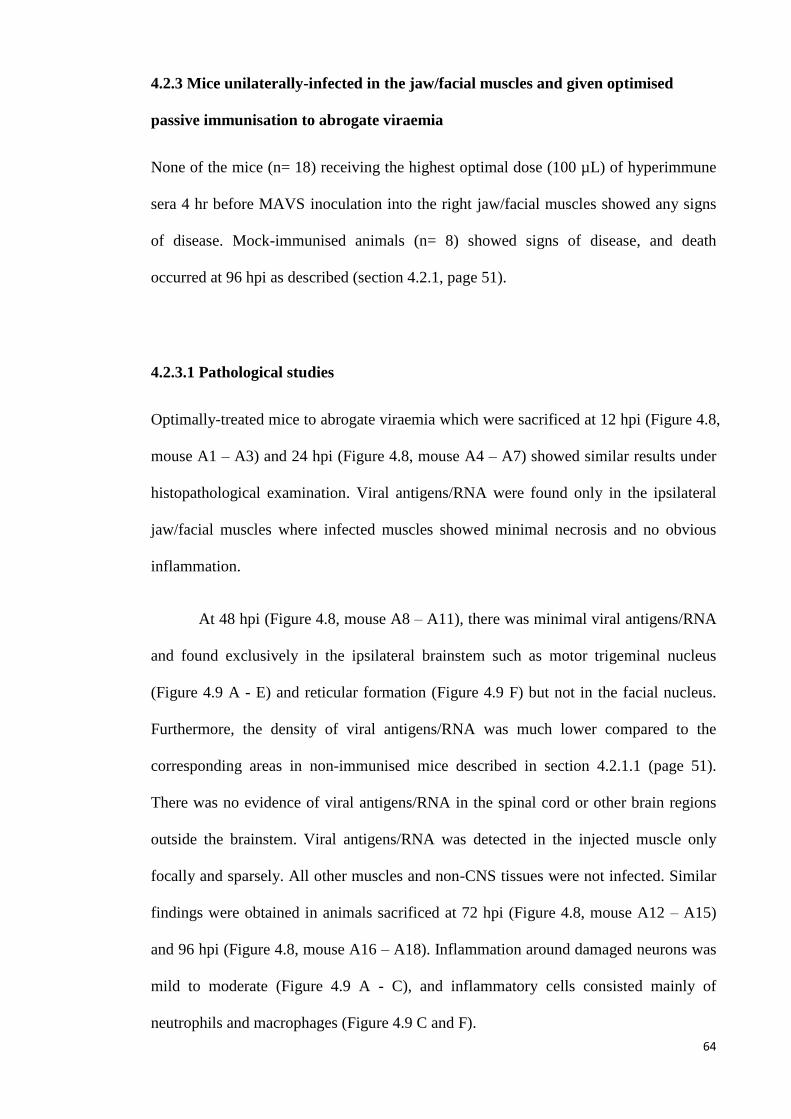
64
4.2.3 Mice unilaterally-infected in the jaw/facial muscles and given optimised
passive immunisation to abrogate viraemia
None of the mice (n= 18) receiving the highest optimal dose (100 µL) of hyperimmune
sera 4 hr before MAVS inoculation into the right jaw/facial muscles showed any signs
of disease. Mock-immunised animals (n= 8) showed signs of disease, and death
occurred at 96 hpi as described (section 4.2.1, page 51).
4.2.3.1 Pathological studies
Optimally-treated mice to abrogate viraemia which were sacrificed at 12 hpi (Figure 4.8,
mouse A1 – A3) and 24 hpi (Figure 4.8, mouse A4 – A7) showed similar results under
histopathological examination. Viral antigens/RNA were found only in the ipsilateral
jaw/facial muscles where infected muscles showed minimal necrosis and no obvious
inflammation.
At 48 hpi (Figure 4.8, mouse A8 – A11), there was minimal viral antigens/RNA
and found exclusively in the ipsilateral brainstem such as motor trigeminal nucleus
(Figure 4.9 A - E) and reticular formation (Figure 4.9 F) but not in the facial nucleus.
Furthermore, the density of viral antigens/RNA was much lower compared to the
corresponding areas in non-immunised mice described in section 4.2.1.1 (page 51).
There was no evidence of viral antigens/RNA in the spinal cord or other brain regions
outside the brainstem. Viral antigens/RNA was detected in the injected muscle only
focally and sparsely. All other muscles and non-CNS tissues were not infected. Similar
findings were obtained in animals sacrificed at 72 hpi (Figure 4.8, mouse A12 – A15)
and 96 hpi (Figure 4.8, mouse A16 – A18). Inflammation around damaged neurons was
mild to moderate (Figure 4.9 A - C), and inflammatory cells consisted mainly of
neutrophils and macrophages (Figure 4.9 C and F).
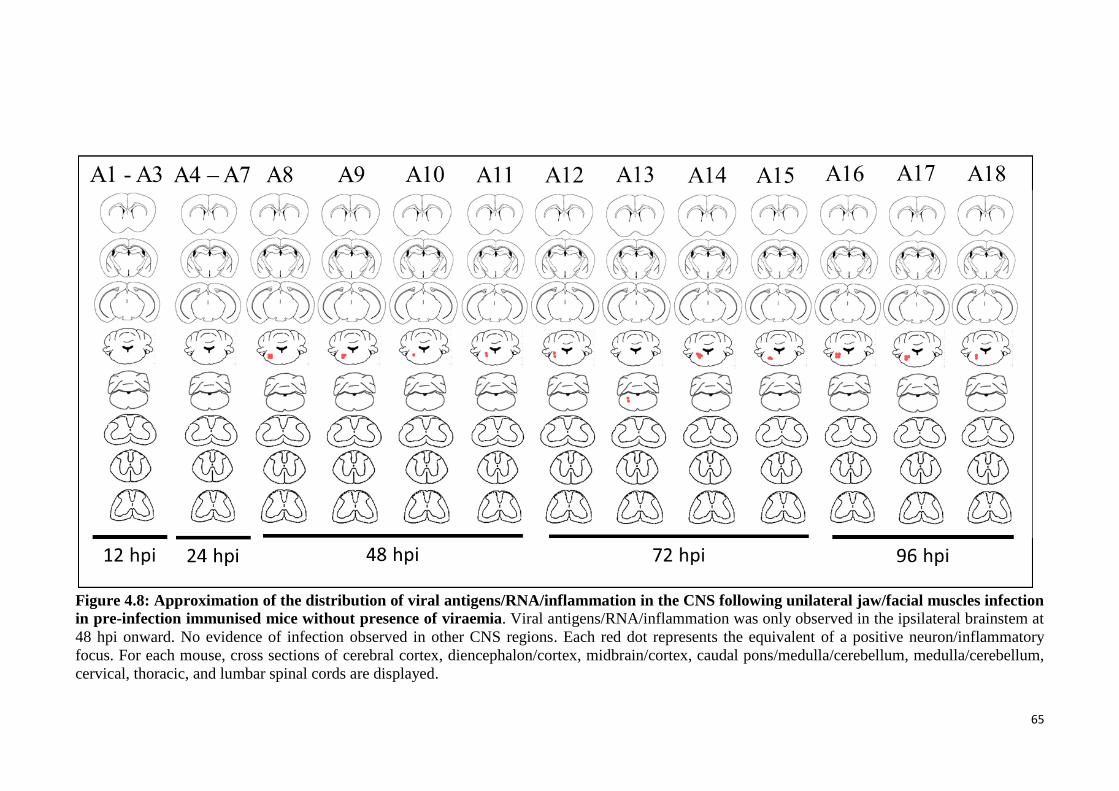
65
Figure 4.8: Approximation of the distribution of viral antigens/RNA/inflammation in the CNS following unilateral jaw/facial muscles infection
in pre-infection immunised mice without presence of viraemia. Viral antigens/RNA/inflammation was only observed in the ipsilateral brainstem at
48 hpi onward. No evidence of infection observed in other CNS regions. Each red dot represents the equivalent of a positive neuron/inflammatory
focus. For each mouse, cross sections of cerebral cortex, diencephalon/cortex, midbrain/cortex, caudal pons/medulla/cerebellum, medulla/cerebellum,
cervical, thoracic, and lumbar spinal cords are displayed.
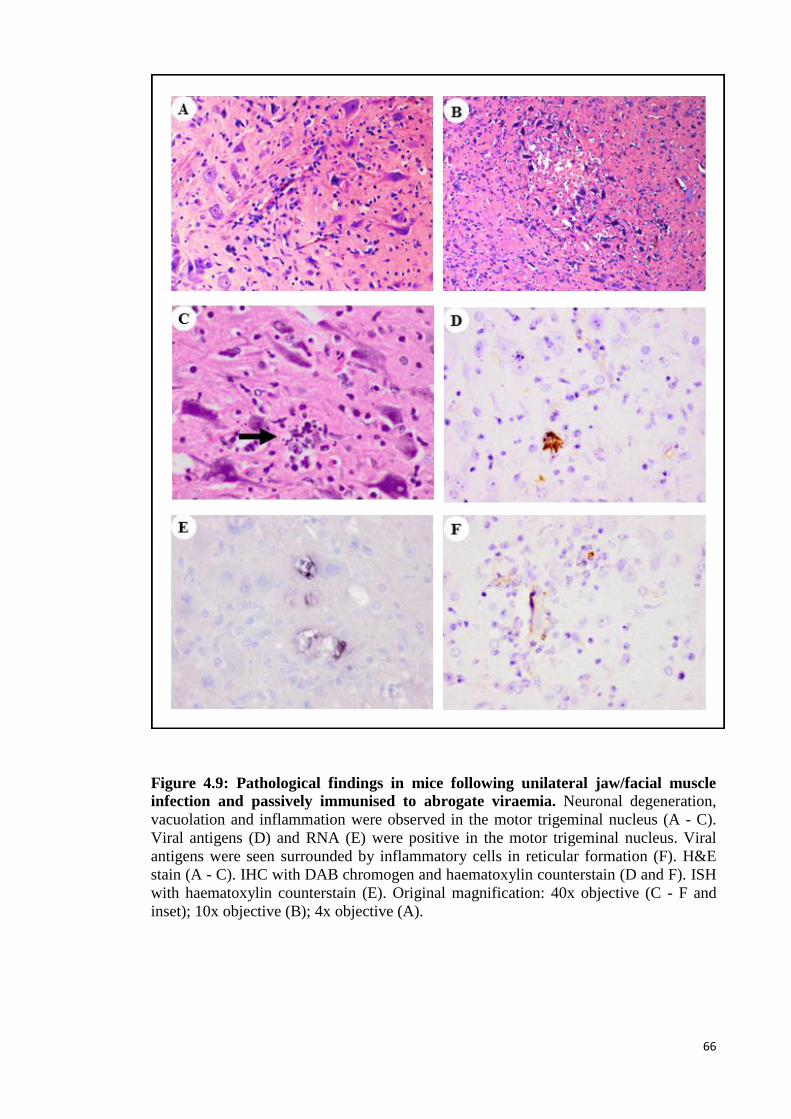
66
Figure 4.9: Pathological findings in mice following unilateral jaw/facial muscle
infection and passively immunised to abrogate viraemia. Neuronal degeneration,
vacuolation and inflammation were observed in the motor trigeminal nucleus (A - C).
Viral antigens (D) and RNA (E) were positive in the motor trigeminal nucleus. Viral
antigens were seen surrounded by inflammatory cells in reticular formation (F). H&E
stain (A - C). IHC with DAB chromogen and haematoxylin counterstain (D and F). ISH
with haematoxylin counterstain (E). Original magnification: 40x objective (C - F and
inset); 10x objective (B); 4x objective (A).
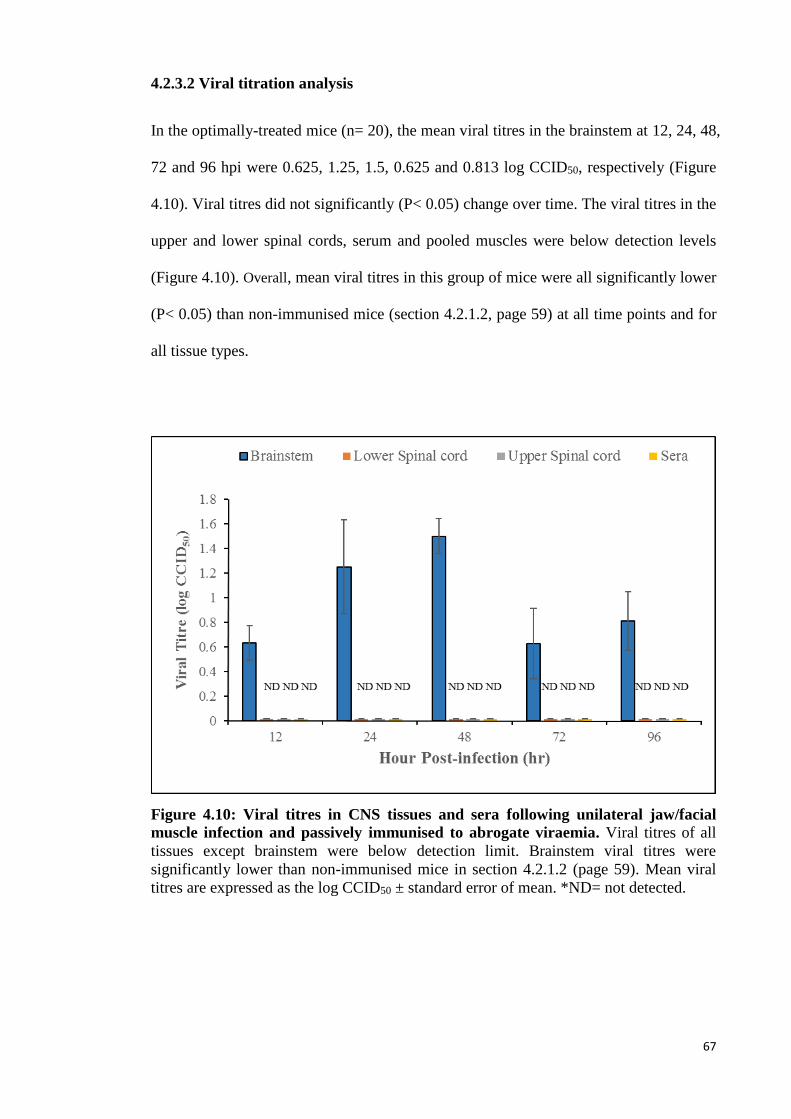
67
4.2.3.2 Viral titration analysis
In the optimally-treated mice (n= 20), the mean viral titres in the brainstem at 12, 24, 48,
72 and 96 hpi were 0.625, 1.25, 1.5, 0.625 and 0.813 log CCID50, respectively (Figure
4.10). Viral titres did not significantly (P< 0.05) change over time. The viral titres in the
upper and lower spinal cords, serum and pooled muscles were below detection levels
(Figure 4.10). Overall, mean viral titres in this group of mice were all significantly lower
(P< 0.05) than non-immunised mice (section 4.2.1.2, page 59) at all time points and for
all tissue types.
Figure 4.10: Viral titres in CNS tissues and sera following unilateral jaw/facial
muscle infection and passively immunised to abrogate viraemia. Viral titres of all
tissues except brainstem were below detection limit. Brainstem viral titres were
significantly lower than non-immunised mice in section 4.2.1.2 (page 59). Mean viral
titres are expressed as the log CCID50 ± standard error of mean. *ND= not detected.
68
4.3 Susceptibility of neurons to direct MAVS infection
4.3.1 MAVS infection of neurons in IC-inoculated (thalamus/hypothalamus) mice
MAVS was unilaterally and IC-inoculated into the thalamus/hypothalamus area to study
neuronal and non-neuronal cell susceptibility to direct viral infection. All mice (n= 9)
inoculated by this route developed mild paralysis in both hindlimbs at 72 hpi, while
mock-infected mice (n= 7) remained healthy.
4.3.1.1 Pathological studies
Figure 4.11 shows the approximate topographic distribution of viral antigens in CNS
tissues in each mouse (mouse A1 – A15). Non-specific tissue damage with
haemorrhages was observed at the injection site/needle tract (Figure 4.12 C). At 24 hpi
(Figure 4.11, mouse A1 – A5), viral antigens/RNA were detected focally around the
needle tract in the thalamus region, part of cerebral cortex (retrosplenial cortex and
posterior parietal association cortex) (Figure 4.12 A) and around the corpus callosum
(Figure 4.12 A, outlined). The antigen-positive cells were mostly non-neuronal cells
such as glial cells and astrocytes. In addition, a few neurons in dentate gyrus of the
hippocampus (Figure 4.12 B) were positive in 2 of the mice (Figure 4.11, mouse A2 and
A4). There was no evidence of viral infection in other CNS regions. Inflammatory cells
with viral antigens were seen in the meninges near to the injection site (Figure 4.12 D).
Outside the CNS, brown adipose tissues and a few fibres in limb skeletal muscles were
positive for viral antigens/RNA. Thus, at 24 hpi, there was already evidence of extra
CNS infection.
In mice sacrificed at 48 hpi (Figure 4.11, mouse A6 – A10), viral antigen density
around the injected site was relatively lower than at 24 hpi. Well away from the injected
site, the brainstem reticular formation and motor trigeminal nucleus were infected
69
bilaterally (Figure 4.12 E). Several different levels of spinal cords were infected in 3 of
the mice, mainly involving anterior horn cells (Figure 4.11, mouse A6, A8 and A10).
Brown adipose tissues and skeletal muscles were relatively more severely infected
compared to 24 hpi.
In mice sacrificed at 72 hpi (Figure 4.11, mouse A11 – A15), viral
antigens/RNA around the injected site were further reduced compared to 48 hpi and 24
hpi (Figure 4.12 F). In other parts of the CNS, away from the injected site, there was
even more extensive bilateral brainstem infection involving the midbrain (motor-related
regions such as reticular nucleus, ventra tegmental area, periaqueductal gray, red
nucleus, substantia nigra (reticular part), anterior tegmental nucleus), motor trigeminal
nucleus (Figure 4.12 G and H), dentate nucleus and reticular formation compared to 48
hpi. The viral antigen distribution within the midbrain and brainstem was similar to the
IM-infected mice (Section 4.2.1.1, page 51). In the spinal cord, neurons in the anterior,
intermediate and posterior horns were involved, although anterior horn cells were more
severely infected. Infected CNS neurons showed neuronal damage and vacuolation with
mild inflammation. Brown adipose tissues and skeletal muscles were all severely
infected.
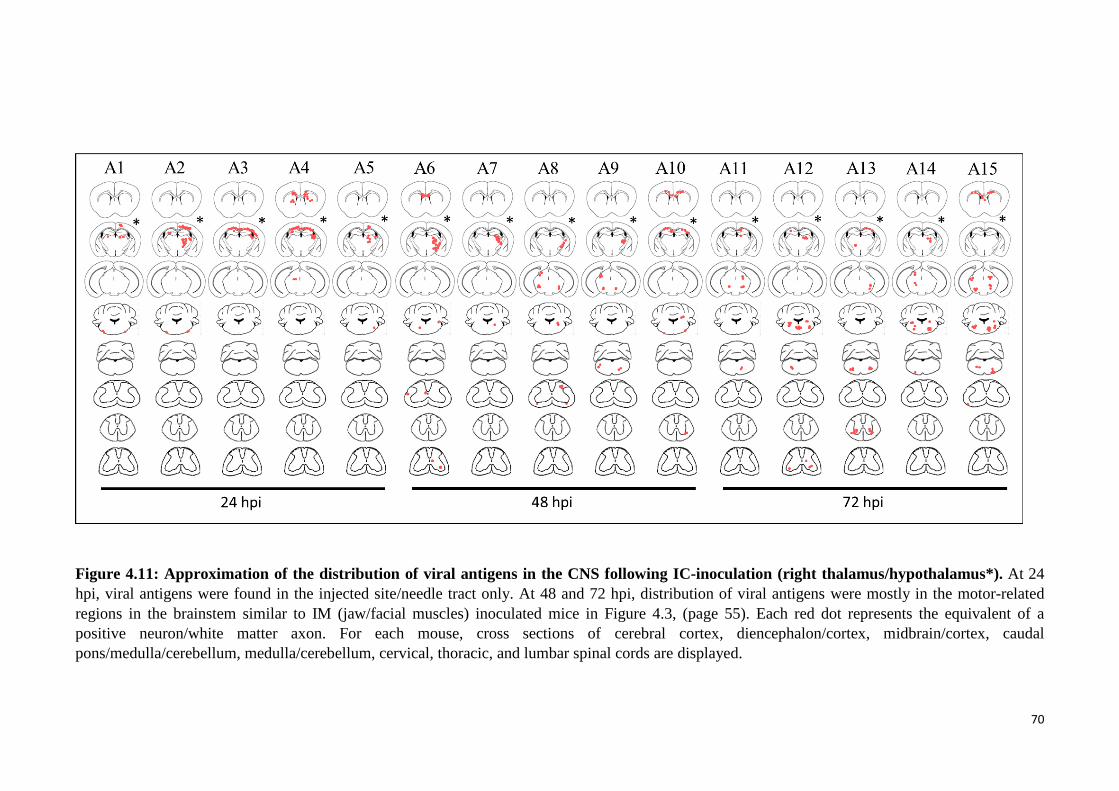
70
Figure 4.11: Approximation of the distribution of viral antigens in the CNS following IC-inoculation (right thalamus/hypothalamus*). At 24
hpi, viral antigens were found in the injected site/needle tract only. At 48 and 72 hpi, distribution of viral antigens were mostly in the motor-related
regions in the brainstem similar to IM (jaw/facial muscles) inoculated mice in Figure 4.3, (page 55). Each red dot represents the equivalent of a
positive neuron/white matter axon. For each mouse, cross sections of cerebral cortex, diencephalon/cortex, midbrain/cortex, caudal
pons/medulla/cerebellum, medulla/cerebellum, cervical, thoracic, and lumbar spinal cords are displayed.
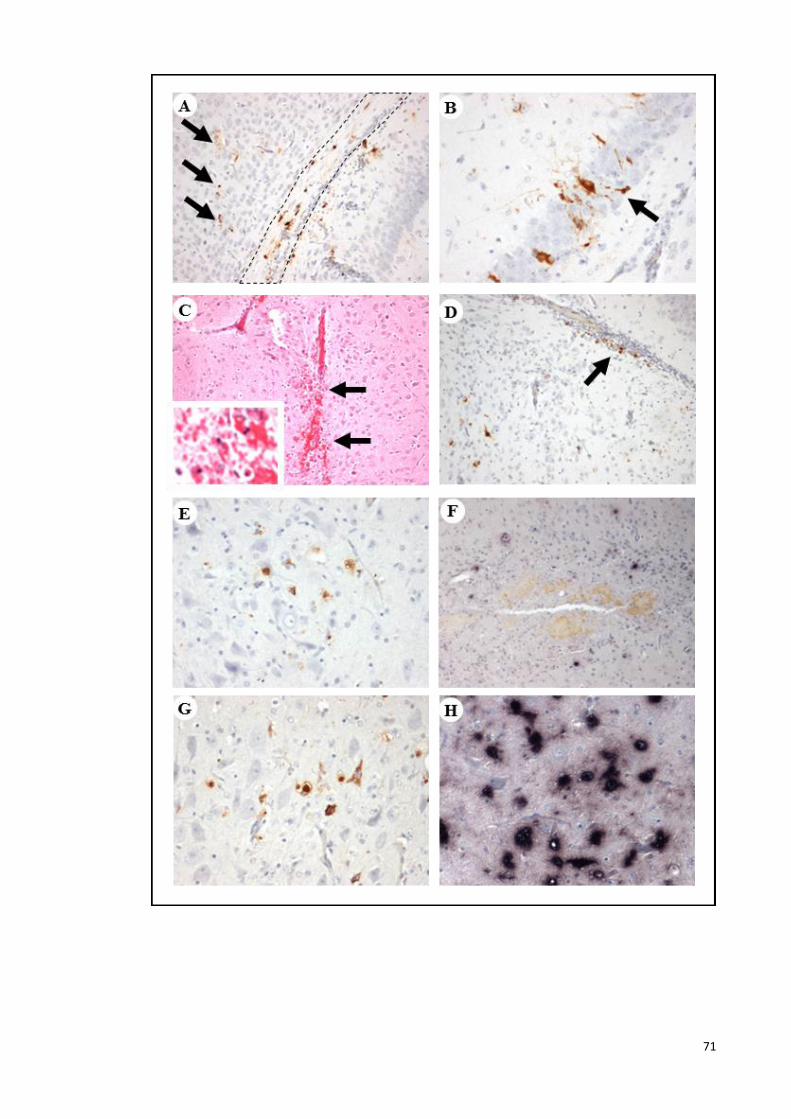
71
72
Figure 4.12: Pathological findings following IC-inoculation
(thalamus/hypothalamus). Viral antigens were found in the cerebral cortex (A,
arrows), corpus callosum (A, outlined), dentate gyrus of hippocampus (B, arrow) at the
MAVS injected site. Neuronal tissue damage and haemorrhage (C, arrows); meningitis
and viral antigens (D, arrow) were observed at/near the injected site. At 48 hpi, motor
trigeminal nucleus were infected (E). At 72 hpi, viral antigens and RNA (F) density was
lower at/near the injected site. However, motor trigeminal nucleus was severely infected
(G and H). IHC with DAB chromogen and haematoxylin counterstain (A, B, D, E and
G). H&E stain (C). ISH with haematoxylin counterstain (F and H). Original
magnification: 20x objective (B, C inset, E, G and F); 10x objective (A, C, D and F).
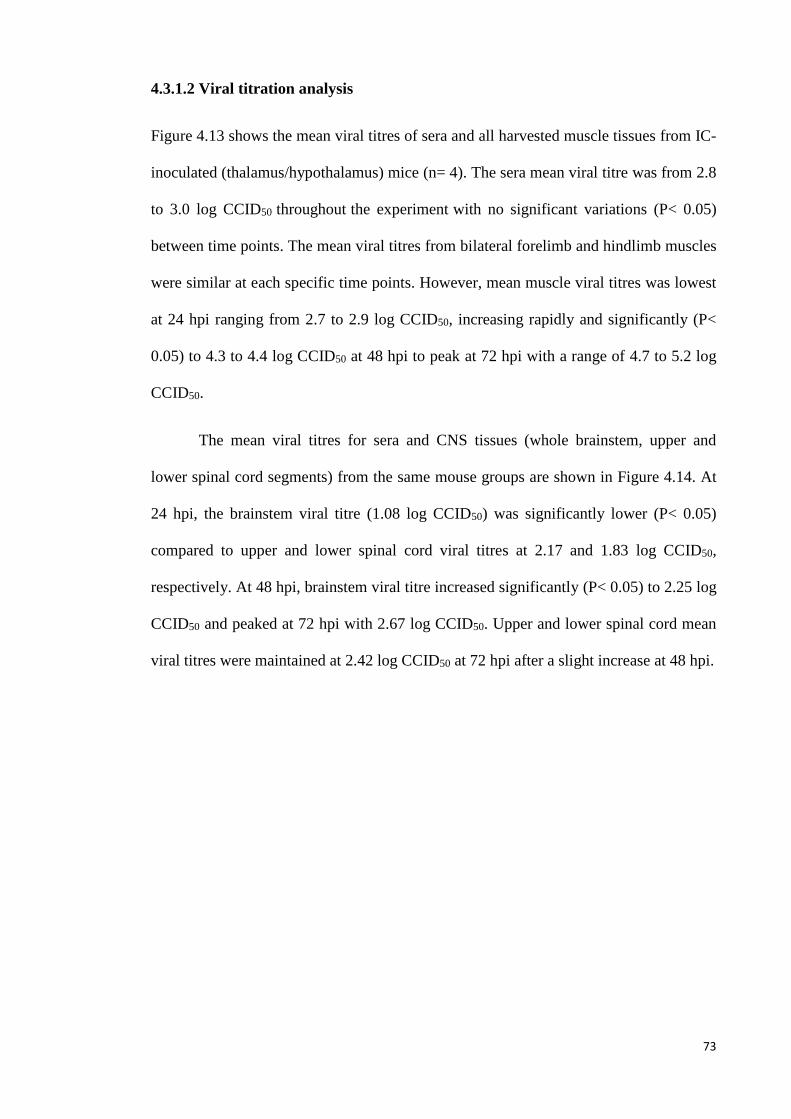
73
4.3.1.2 Viral titration analysis
Figure 4.13 shows the mean viral titres of sera and all harvested muscle tissues from IC-
inoculated (thalamus/hypothalamus) mice (n= 4). The sera mean viral titre was from 2.8
to 3.0 log CCID50 throughout the experiment with no significant variations (P< 0.05)
between time points. The mean viral titres from bilateral forelimb and hindlimb muscles
were similar at each specific time points. However, mean muscle viral titres was lowest
at 24 hpi ranging from 2.7 to 2.9 log CCID50, increasing rapidly and significantly (P<
0.05) to 4.3 to 4.4 log CCID50 at 48 hpi to peak at 72 hpi with a range of 4.7 to 5.2 log
CCID50.
The mean viral titres for sera and CNS tissues (whole brainstem, upper and
lower spinal cord segments) from the same mouse groups are shown in Figure 4.14. At
24 hpi, the brainstem viral titre (1.08 log CCID50) was significantly lower (P< 0.05)
compared to upper and lower spinal cord viral titres at 2.17 and 1.83 log CCID50,
respectively. At 48 hpi, brainstem viral titre increased significantly (P< 0.05) to 2.25 log
CCID50 and peaked at 72 hpi with 2.67 log CCID50. Upper and lower spinal cord mean
viral titres were maintained at 2.42 log CCID50 at 72 hpi after a slight increase at 48 hpi.
74
Figure 4.13: Viral titres in muscle tissues and sera following IC-inoculation
(thalamus/hypothalamus). Overall, mean viral titres of muscles were insignificant (P<
0.05) different at each specific time point. Muscle tissues mean viral titres were
increased over time and peak at 72 hpi. Mean viral titres are expressed as the log
CCID50 ± standard error of mean.
Figure 4.14: Viral titres in CNS tissues and sera following IC-inoculation
(thalamus/hypothalamus). Brainstem mean viral titres were lower than upper and
lower spinal cord at 24 hpi. In general, CNS and sera mean viral titres were increased
gradually but insignificantly (P< 0.05) over time. Mean viral titres are expressed as the
log CCID50 ± standard error of mean.
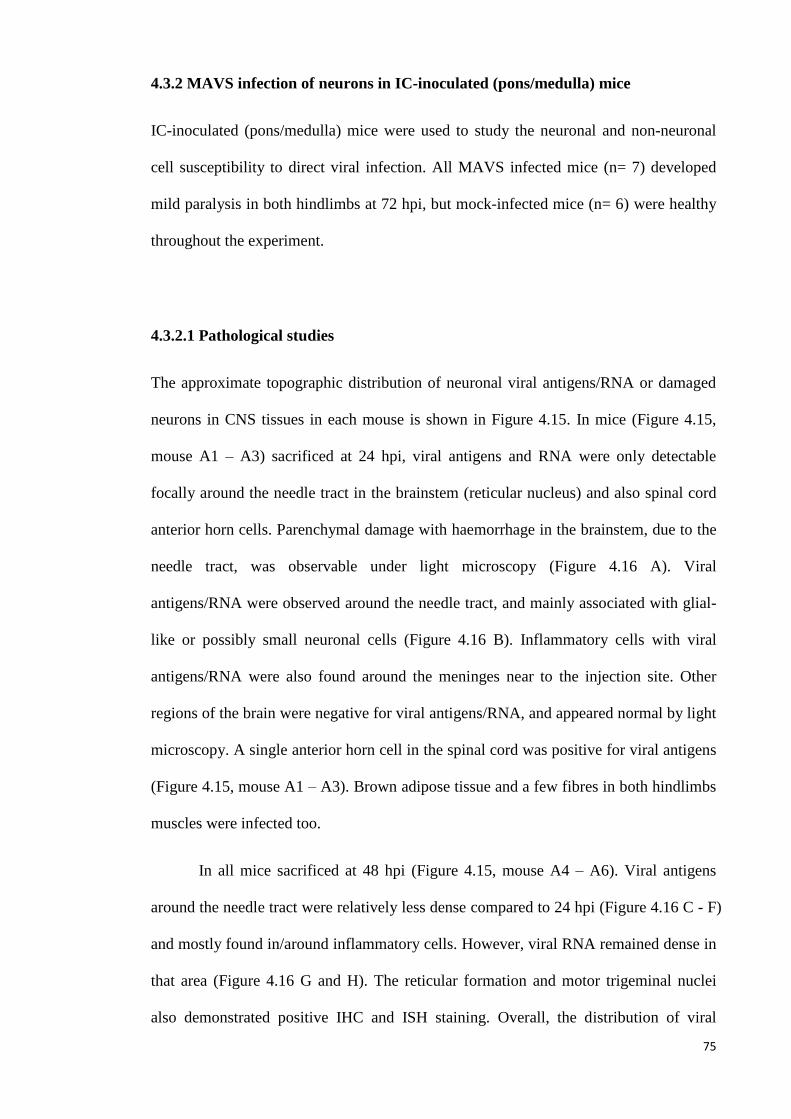
75
4.3.2 MAVS infection of neurons in IC-inoculated (pons/medulla) mice
IC-inoculated (pons/medulla) mice were used to study the neuronal and non-neuronal
cell susceptibility to direct viral infection. All MAVS infected mice (n= 7) developed
mild paralysis in both hindlimbs at 72 hpi, but mock-infected mice (n= 6) were healthy
throughout the experiment.
4.3.2.1 Pathological studies
The approximate topographic distribution of neuronal viral antigens/RNA or damaged
neurons in CNS tissues in each mouse is shown in Figure 4.15. In mice (Figure 4.15,
mouse A1 – A3) sacrificed at 24 hpi, viral antigens and RNA were only detectable
focally around the needle tract in the brainstem (reticular nucleus) and also spinal cord
anterior horn cells. Parenchymal damage with haemorrhage in the brainstem, due to the
needle tract, was observable under light microscopy (Figure 4.16 A). Viral
antigens/RNA were observed around the needle tract, and mainly associated with glial-
like or possibly small neuronal cells (Figure 4.16 B). Inflammatory cells with viral
antigens/RNA were also found around the meninges near to the injection site. Other
regions of the brain were negative for viral antigens/RNA, and appeared normal by light
microscopy. A single anterior horn cell in the spinal cord was positive for viral antigens
(Figure 4.15, mouse A1 – A3). Brown adipose tissue and a few fibres in both hindlimbs
muscles were infected too.
In all mice sacrificed at 48 hpi (Figure 4.15, mouse A4 – A6). Viral antigens
around the needle tract were relatively less dense compared to 24 hpi (Figure 4.16 C - F)
and mostly found in/around inflammatory cells. However, viral RNA remained dense in
that area (Figure 4.16 G and H). The reticular formation and motor trigeminal nuclei
also demonstrated positive IHC and ISH staining. Overall, the distribution of viral
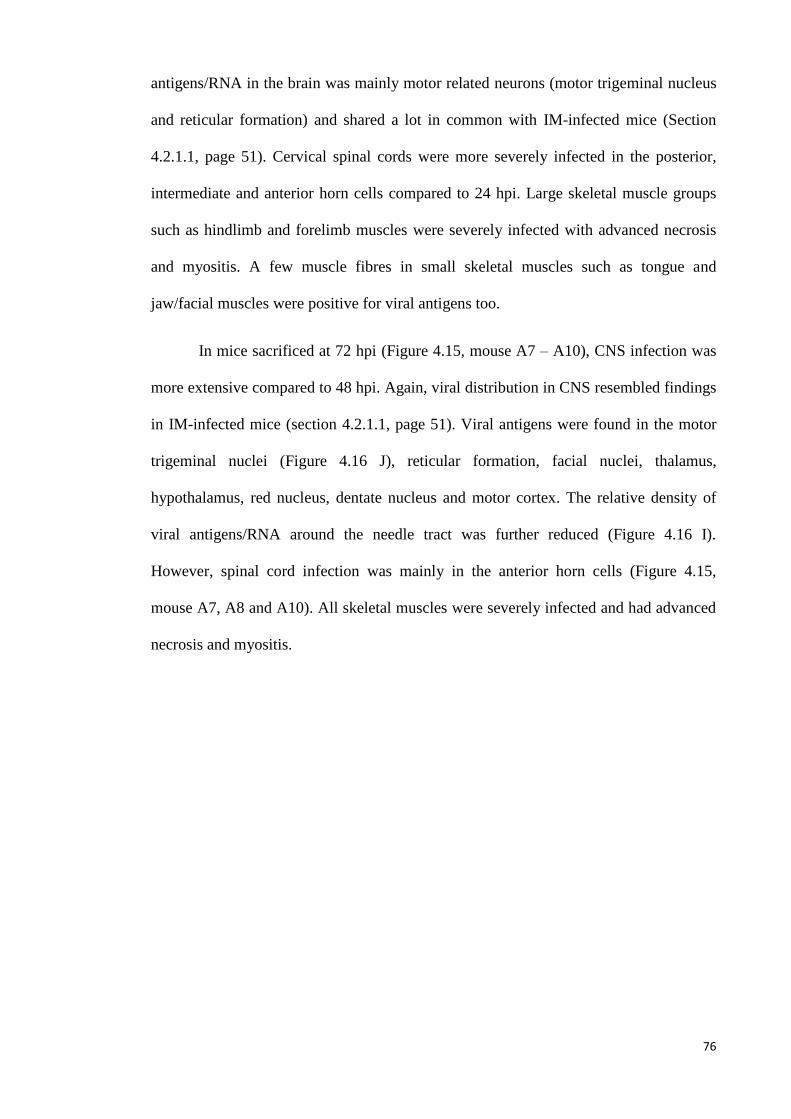
76
antigens/RNA in the brain was mainly motor related neurons (motor trigeminal nucleus
and reticular formation) and shared a lot in common with IM-infected mice (Section
4.2.1.1, page 51). Cervical spinal cords were more severely infected in the posterior,
intermediate and anterior horn cells compared to 24 hpi. Large skeletal muscle groups
such as hindlimb and forelimb muscles were severely infected with advanced necrosis
and myositis. A few muscle fibres in small skeletal muscles such as tongue and
jaw/facial muscles were positive for viral antigens too.
In mice sacrificed at 72 hpi (Figure 4.15, mouse A7 – A10), CNS infection was
more extensive compared to 48 hpi. Again, viral distribution in CNS resembled findings
in IM-infected mice (section 4.2.1.1, page 51). Viral antigens were found in the motor
trigeminal nuclei (Figure 4.16 J), reticular formation, facial nuclei, thalamus,
hypothalamus, red nucleus, dentate nucleus and motor cortex. The relative density of
viral antigens/RNA around the needle tract was further reduced (Figure 4.16 I).
However, spinal cord infection was mainly in the anterior horn cells (Figure 4.15,
mouse A7, A8 and A10). All skeletal muscles were severely infected and had advanced
necrosis and myositis.
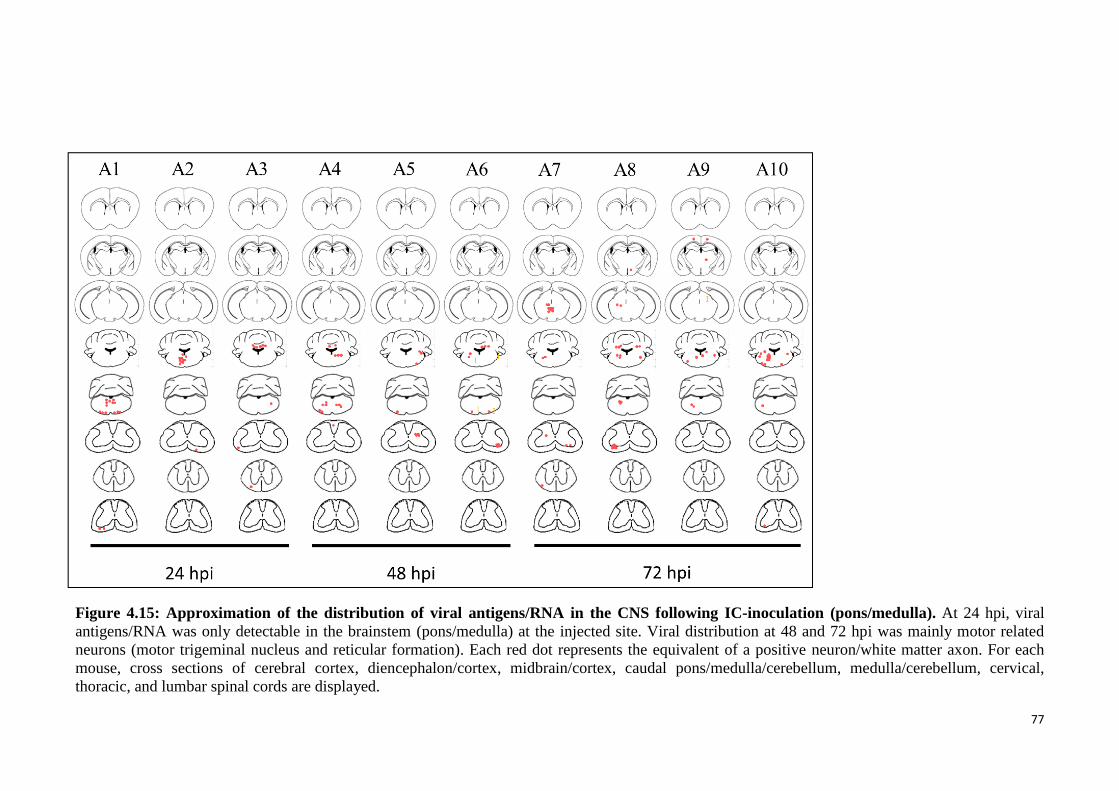
77
Figure 4.15: Approximation of the distribution of viral antigens/RNA in the CNS following IC-inoculation (pons/medulla). At 24 hpi, viral
antigens/RNA was only detectable in the brainstem (pons/medulla) at the injected site. Viral distribution at 48 and 72 hpi was mainly motor related
neurons (motor trigeminal nucleus and reticular formation). Each red dot represents the equivalent of a positive neuron/white matter axon. For each
mouse, cross sections of cerebral cortex, diencephalon/cortex, midbrain/cortex, caudal pons/medulla/cerebellum, medulla/cerebellum, cervical,
thoracic, and lumbar spinal cords are displayed.
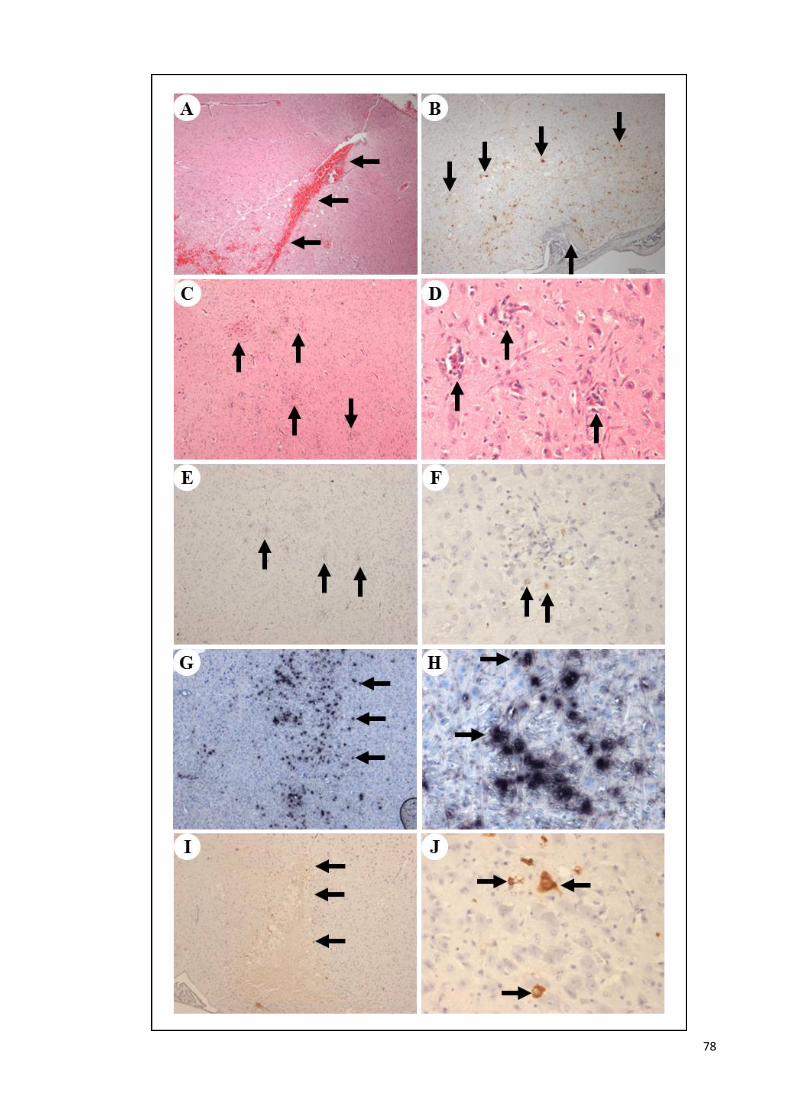
78
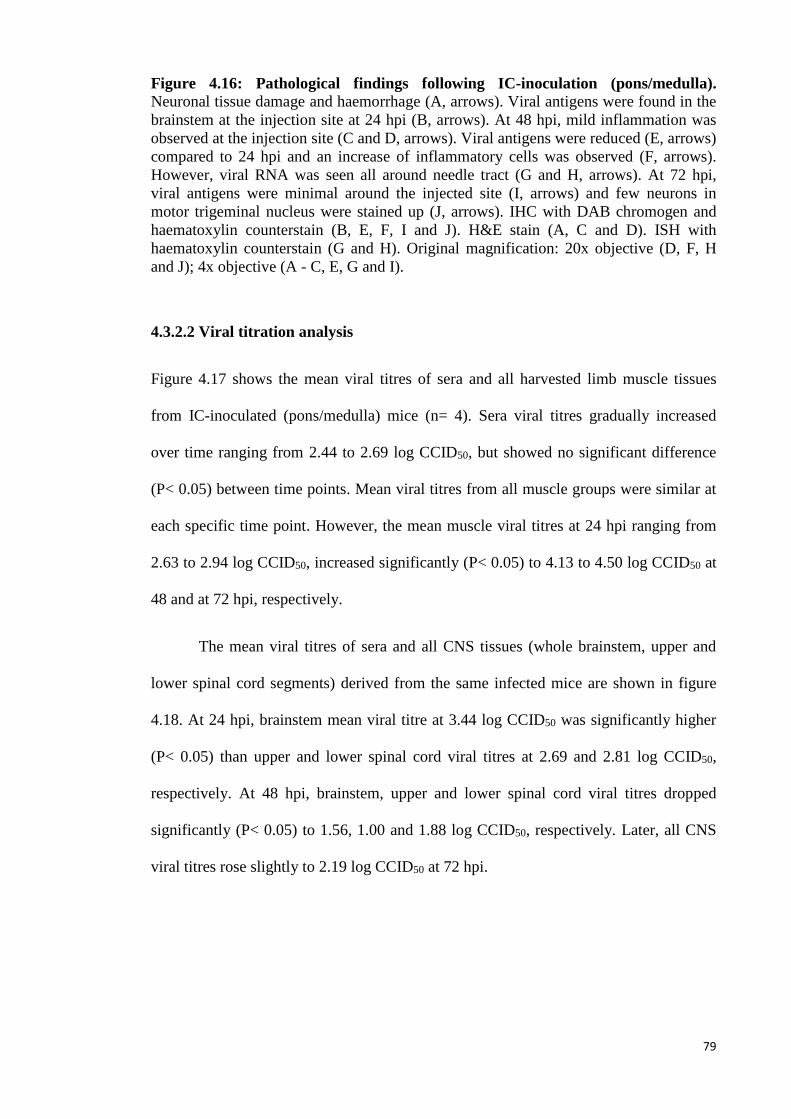
79
Figure 4.16: Pathological findings following IC-inoculation (pons/medulla). Neuronal tissue damage and haemorrhage (A, arrows). Viral antigens were found in the
brainstem at the injection site at 24 hpi (B, arrows). At 48 hpi, mild inflammation was
observed at the injection site (C and D, arrows). Viral antigens were reduced (E, arrows)
compared to 24 hpi and an increase of inflammatory cells was observed (F, arrows).
However, viral RNA was seen all around needle tract (G and H, arrows). At 72 hpi,
viral antigens were minimal around the injected site (I, arrows) and few neurons in
motor trigeminal nucleus were stained up (J, arrows). IHC with DAB chromogen and
haematoxylin counterstain (B, E, F, I and J). H&E stain (A, C and D). ISH with
haematoxylin counterstain (G and H). Original magnification: 20x objective (D, F, H
and J); 4x objective (A - C, E, G and I).
4.3.2.2 Viral titration analysis
Figure 4.17 shows the mean viral titres of sera and all harvested limb muscle tissues
from IC-inoculated (pons/medulla) mice (n= 4). Sera viral titres gradually increased
over time ranging from 2.44 to 2.69 log CCID50, but showed no significant difference
(P< 0.05) between time points. Mean viral titres from all muscle groups were similar at
each specific time point. However, the mean muscle viral titres at 24 hpi ranging from
2.63 to 2.94 log CCID50, increased significantly (P< 0.05) to 4.13 to 4.50 log CCID50 at
48 and at 72 hpi, respectively.
The mean viral titres of sera and all CNS tissues (whole brainstem, upper and
lower spinal cord segments) derived from the same infected mice are shown in figure
4.18. At 24 hpi, brainstem mean viral titre at 3.44 log CCID50 was significantly higher
(P< 0.05) than upper and lower spinal cord viral titres at 2.69 and 2.81 log CCID50,
respectively. At 48 hpi, brainstem, upper and lower spinal cord viral titres dropped
significantly (P< 0.05) to 1.56, 1.00 and 1.88 log CCID50, respectively. Later, all CNS
viral titres rose slightly to 2.19 log CCID50 at 72 hpi.
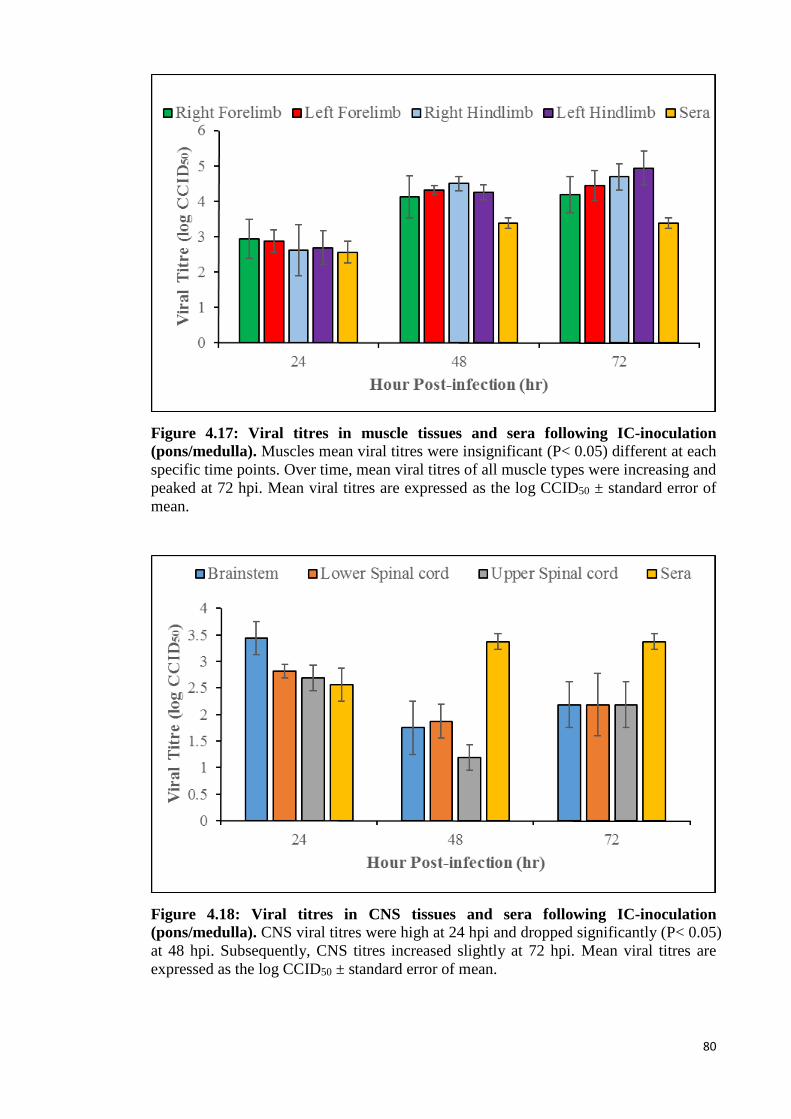
80
Figure 4.17: Viral titres in muscle tissues and sera following IC-inoculation
(pons/medulla). Muscles mean viral titres were insignificant (P< 0.05) different at each
specific time points. Over time, mean viral titres of all muscle types were increasing and
peaked at 72 hpi. Mean viral titres are expressed as the log CCID50 ± standard error of
mean.
Figure 4.18: Viral titres in CNS tissues and sera following IC-inoculation
(pons/medulla). CNS viral titres were high at 24 hpi and dropped significantly (P< 0.05)
at 48 hpi. Subsequently, CNS titres increased slightly at 72 hpi. Mean viral titres are
expressed as the log CCID50 ± standard error of mean.
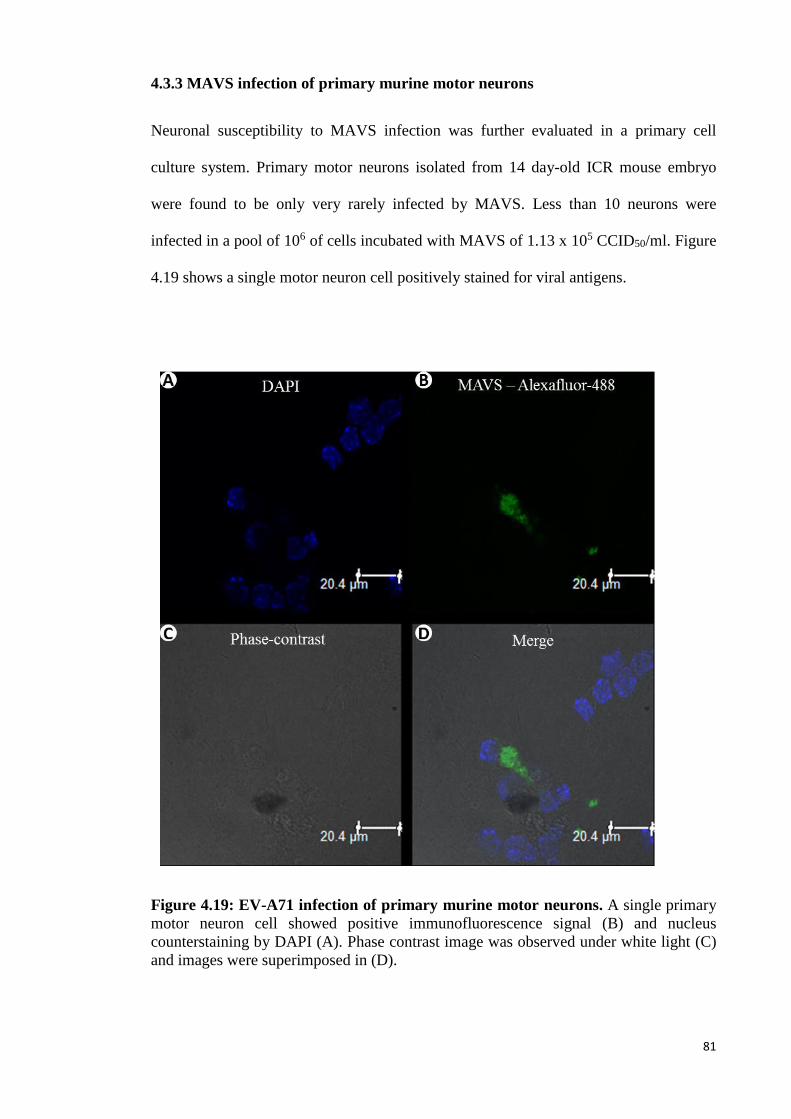
81
4.3.3 MAVS infection of primary murine motor neurons
Neuronal susceptibility to MAVS infection was further evaluated in a primary cell
culture system. Primary motor neurons isolated from 14 day-old ICR mouse embryo
were found to be only very rarely infected by MAVS. Less than 10 neurons were
infected in a pool of 106 of cells incubated with MAVS of 1.13 x 10⁵ CCID50/ml. Figure
4.19 shows a single motor neuron cell positively stained for viral antigens.
Figure 4.19: EV-A71 infection of primary murine motor neurons. A single primary
motor neuron cell showed positive immunofluorescence signal (B) and nucleus
counterstaining by DAPI (A). Phase contrast image was observed under white light (C)
and images were superimposed in (D).
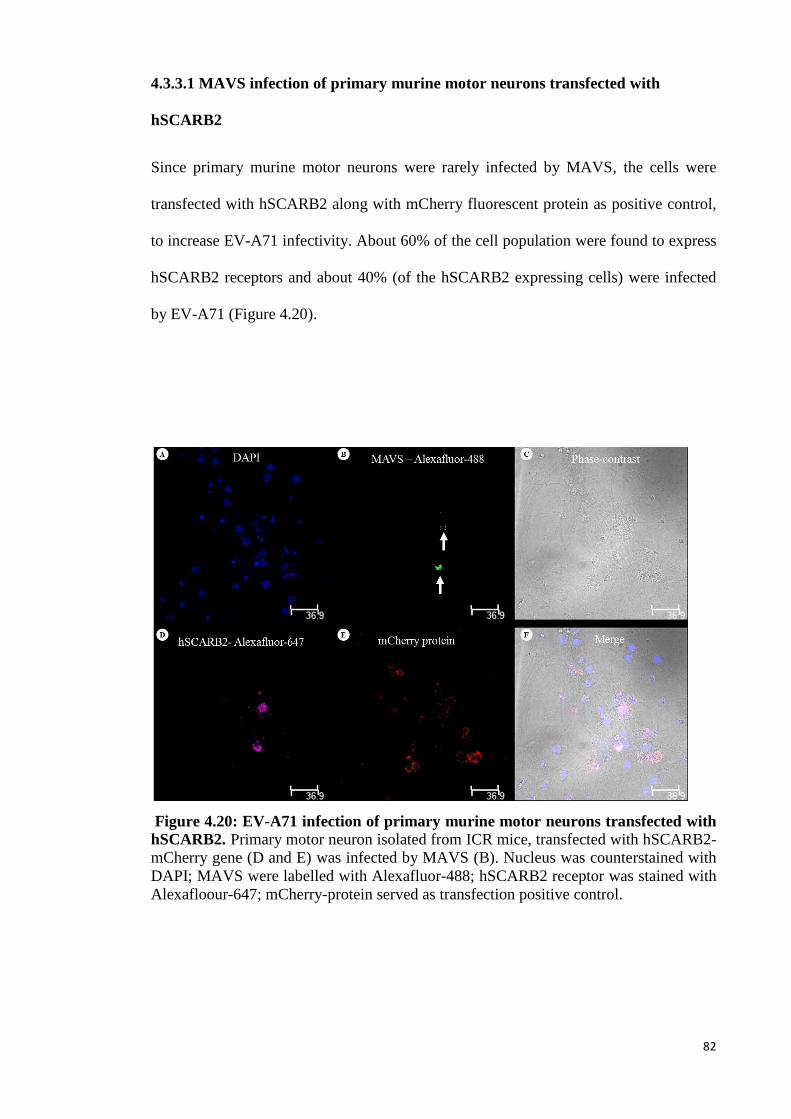
82
4.3.3.1 MAVS infection of primary murine motor neurons transfected with
hSCARB2
Since primary murine motor neurons were rarely infected by MAVS, the cells were
transfected with hSCARB2 along with mCherry fluorescent protein as positive control,
to increase EV-A71 infectivity. About 60% of the cell population were found to express
hSCARB2 receptors and about 40% (of the hSCARB2 expressing cells) were infected
by EV-A71 (Figure 4.20).
Figure 4.20: EV-A71 infection of primary murine motor neurons transfected with
hSCARB2. Primary motor neuron isolated from ICR mice, transfected with hSCARB2-
mCherry gene (D and E) was infected by MAVS (B). Nucleus was counterstained with
DAPI; MAVS were labelled with Alexafluor-488; hSCARB2 receptor was stained with
Alexafloour-647; mCherry-protein served as transfection positive control.
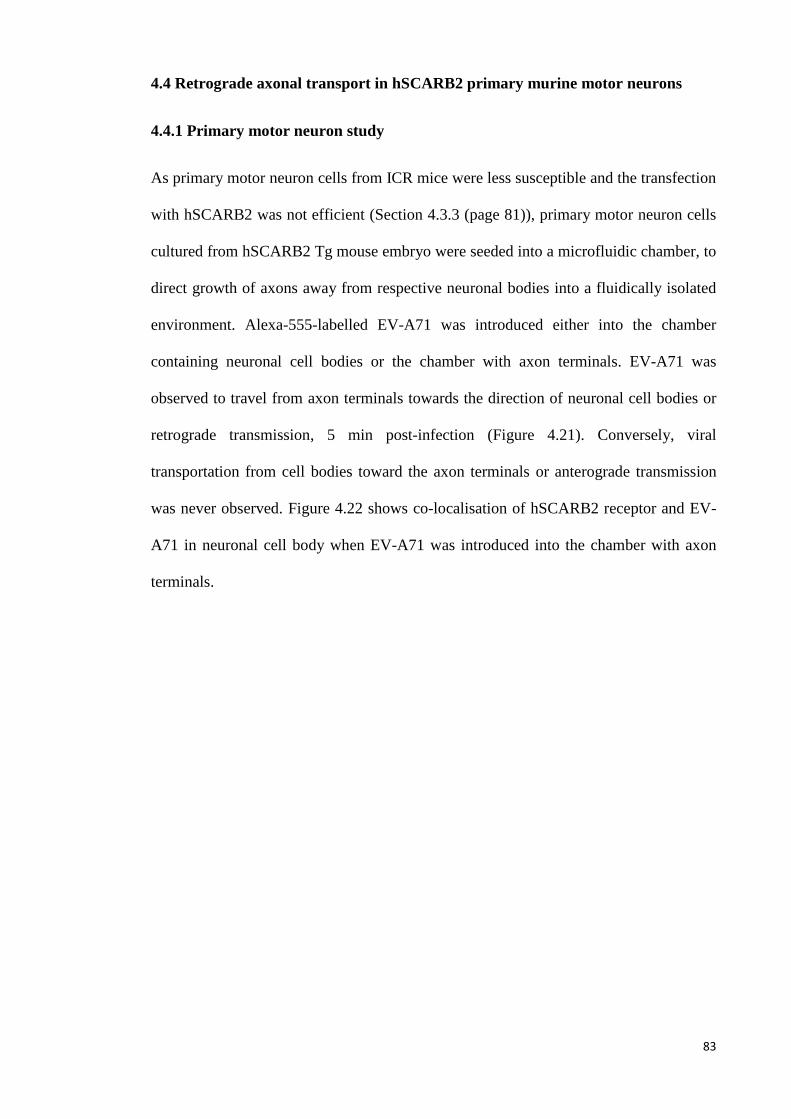
83
4.4 Retrograde axonal transport in hSCARB2 primary murine motor neurons
4.4.1 Primary motor neuron study
As primary motor neuron cells from ICR mice were less susceptible and the transfection
with hSCARB2 was not efficient (Section 4.3.3 (page 81)), primary motor neuron cells
cultured from hSCARB2 Tg mouse embryo were seeded into a microfluidic chamber, to
direct growth of axons away from respective neuronal bodies into a fluidically isolated
environment. Alexa-555-labelled EV-A71 was introduced either into the chamber
containing neuronal cell bodies or the chamber with axon terminals. EV-A71 was
observed to travel from axon terminals towards the direction of neuronal cell bodies or
retrograde transmission, 5 min post-infection (Figure 4.21). Conversely, viral
transportation from cell bodies toward the axon terminals or anterograde transmission
was never observed. Figure 4.22 shows co-localisation of hSCARB2 receptor and EV-
A71 in neuronal cell body when EV-A71 was introduced into the chamber with axon
terminals.
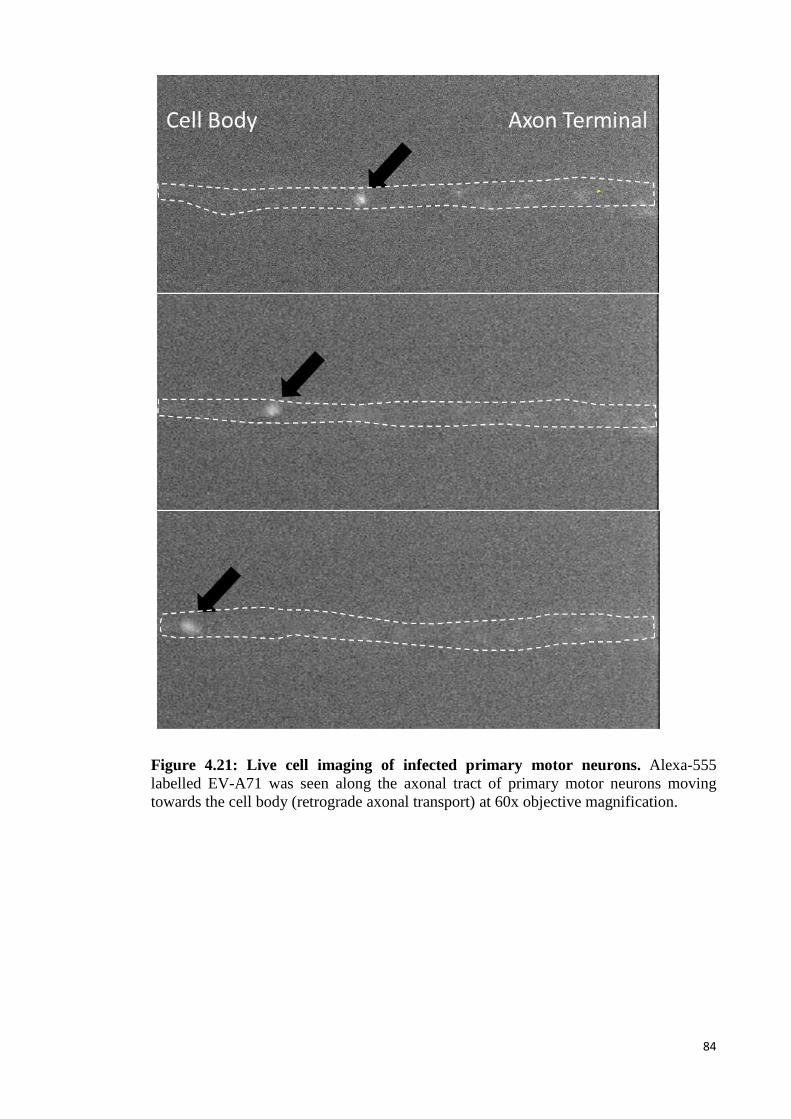
84
Figure 4.21: Live cell imaging of infected primary motor neurons. Alexa-555
labelled EV-A71 was seen along the axonal tract of primary motor neurons moving
towards the cell body (retrograde axonal transport) at 60x objective magnification.
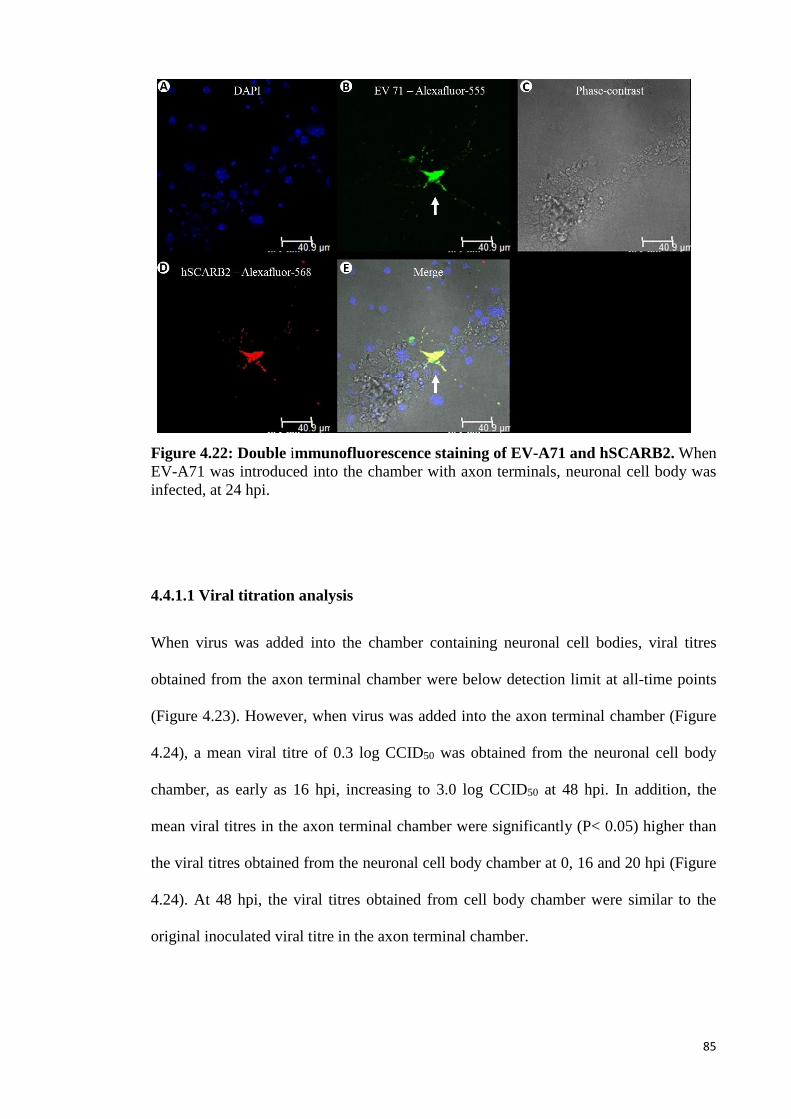
85
Figure 4.22: Double immunofluorescence staining of EV-A71 and hSCARB2. When
EV-A71 was introduced into the chamber with axon terminals, neuronal cell body was
infected, at 24 hpi.
4.4.1.1 Viral titration analysis
When virus was added into the chamber containing neuronal cell bodies, viral titres
obtained from the axon terminal chamber were below detection limit at all-time points
(Figure 4.23). However, when virus was added into the axon terminal chamber (Figure
4.24), a mean viral titre of 0.3 log CCID50 was obtained from the neuronal cell body
chamber, as early as 16 hpi, increasing to 3.0 log CCID50 at 48 hpi. In addition, the
mean viral titres in the axon terminal chamber were significantly (P< 0.05) higher than
the viral titres obtained from the neuronal cell body chamber at 0, 16 and 20 hpi (Figure
4.24). At 48 hpi, the viral titres obtained from cell body chamber were similar to the
original inoculated viral titre in the axon terminal chamber.
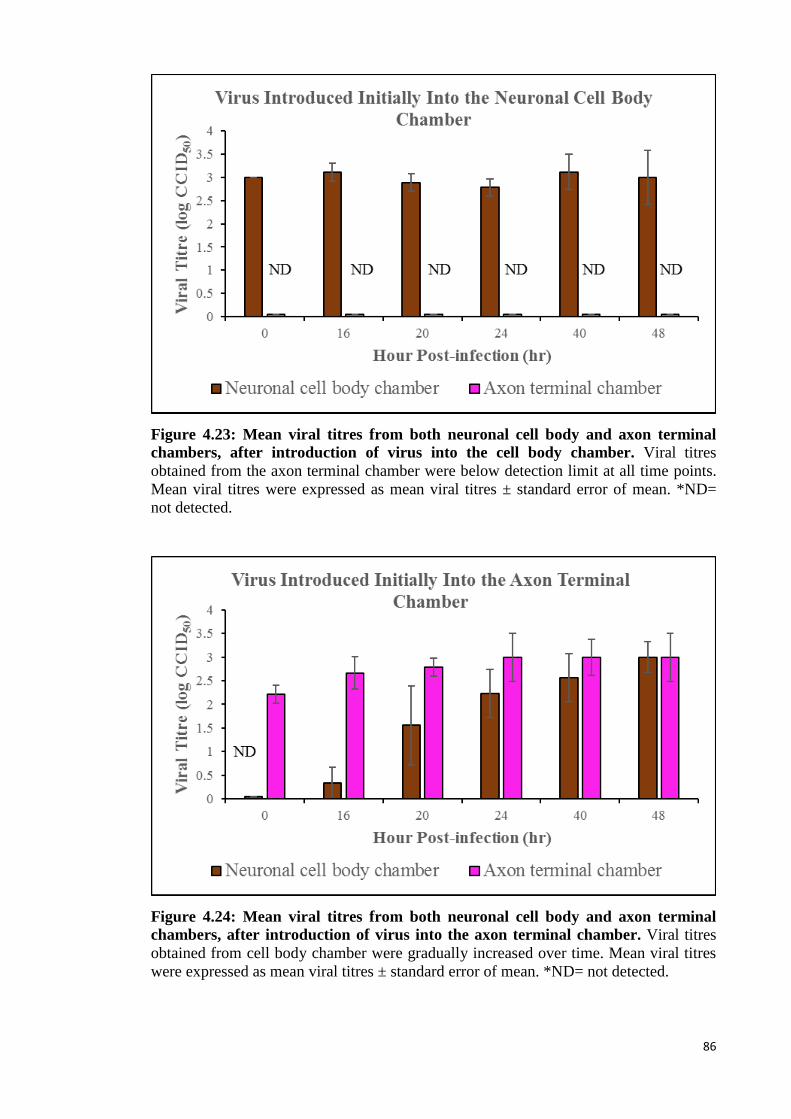
86
Figure 4.23: Mean viral titres from both neuronal cell body and axon terminal
chambers, after introduction of virus into the cell body chamber. Viral titres
obtained from the axon terminal chamber were below detection limit at all time points.
Mean viral titres were expressed as mean viral titres ± standard error of mean. *ND=
not detected.
Figure 4.24: Mean viral titres from both neuronal cell body and axon terminal
chambers, after introduction of virus into the axon terminal chamber. Viral titres
obtained from cell body chamber were gradually increased over time. Mean viral titres
were expressed as mean viral titres ± standard error of mean. *ND= not detected.
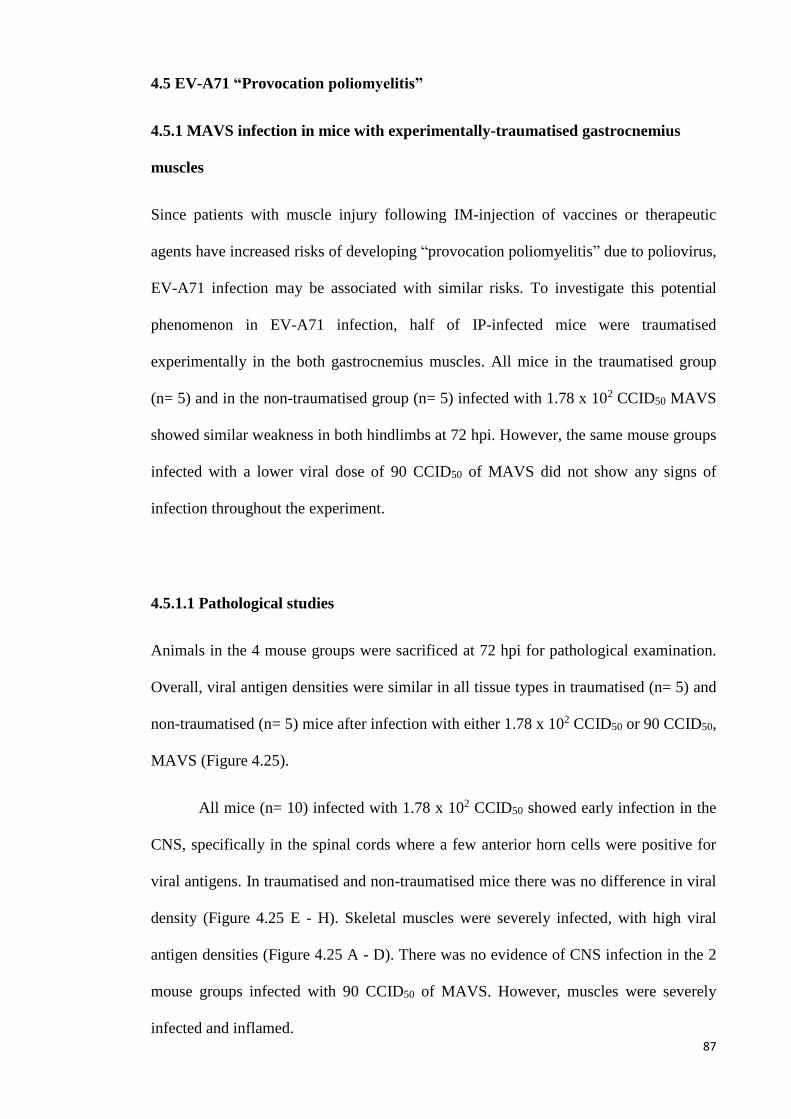
87
4.5 EV-A71 “Provocation poliomyelitis”
4.5.1 MAVS infection in mice with experimentally-traumatised gastrocnemius
muscles
Since patients with muscle injury following IM-injection of vaccines or therapeutic
agents have increased risks of developing “provocation poliomyelitis” due to poliovirus,
EV-A71 infection may be associated with similar risks. To investigate this potential
phenomenon in EV-A71 infection, half of IP-infected mice were traumatised
experimentally in the both gastrocnemius muscles. All mice in the traumatised group
(n= 5) and in the non-traumatised group (n= 5) infected with 1.78 x 10² CCID50 MAVS
showed similar weakness in both hindlimbs at 72 hpi. However, the same mouse groups
infected with a lower viral dose of 90 CCID50 of MAVS did not show any signs of
infection throughout the experiment.
4.5.1.1 Pathological studies
Animals in the 4 mouse groups were sacrificed at 72 hpi for pathological examination.
Overall, viral antigen densities were similar in all tissue types in traumatised (n= 5) and
non-traumatised (n= 5) mice after infection with either 1.78 x 10² CCID50 or 90 CCID50,
MAVS (Figure 4.25).
All mice (n= 10) infected with 1.78 x 10² CCID50 showed early infection in the
CNS, specifically in the spinal cords where a few anterior horn cells were positive for
viral antigens. In traumatised and non-traumatised mice there was no difference in viral
density (Figure 4.25 E - H). Skeletal muscles were severely infected, with high viral
antigen densities (Figure 4.25 A - D). There was no evidence of CNS infection in the 2
mouse groups infected with 90 CCID50 of MAVS. However, muscles were severely
infected and inflamed.
88
Control mice (n= 6) were injected with WGA at 10 µg per mouse in 10 µL to
verify that the experimentally-traumatised muscle could facilitate retrograde axonal
transport. Traumatised mice showed a higher concentration of WGA in lower spinal
cords segment compared to non-traumatised mice at 12 hpi (Figure 4.26).
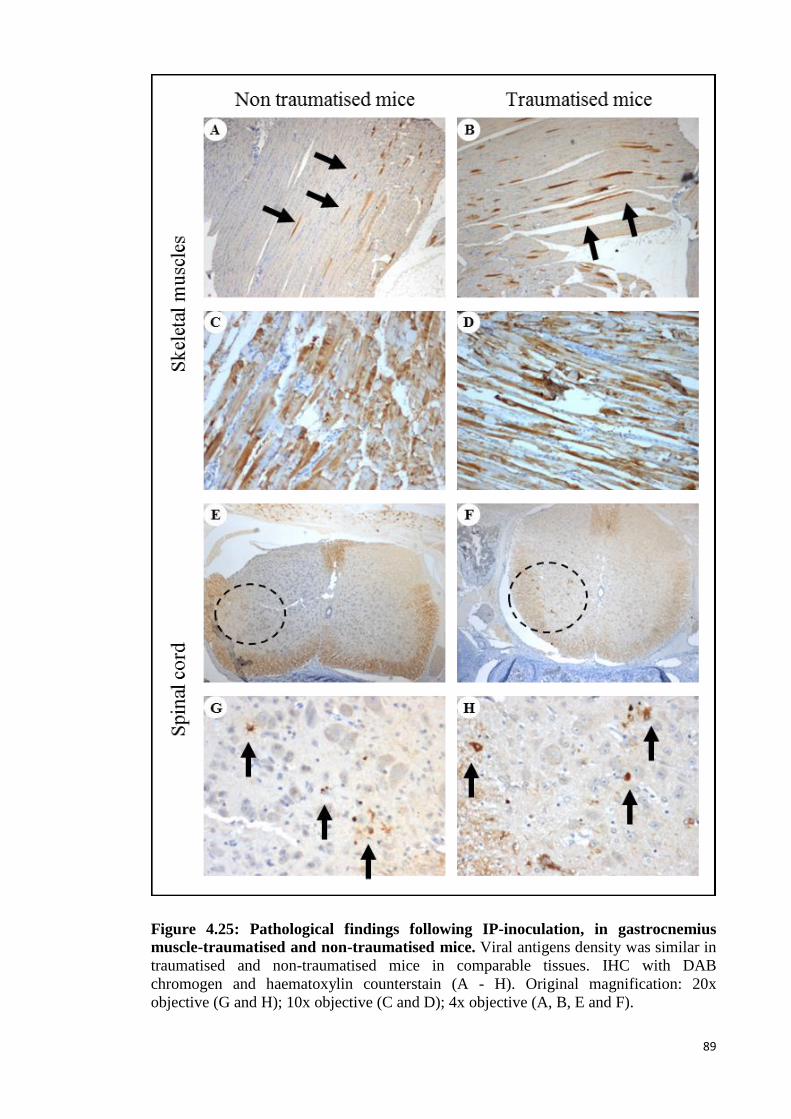
89
Figure 4.25: Pathological findings following IP-inoculation, in gastrocnemius
muscle-traumatised and non-traumatised mice. Viral antigens density was similar in
traumatised and non-traumatised mice in comparable tissues. IHC with DAB
chromogen and haematoxylin counterstain (A - H). Original magnification: 20x
objective (G and H); 10x objective (C and D); 4x objective (A, B, E and F).
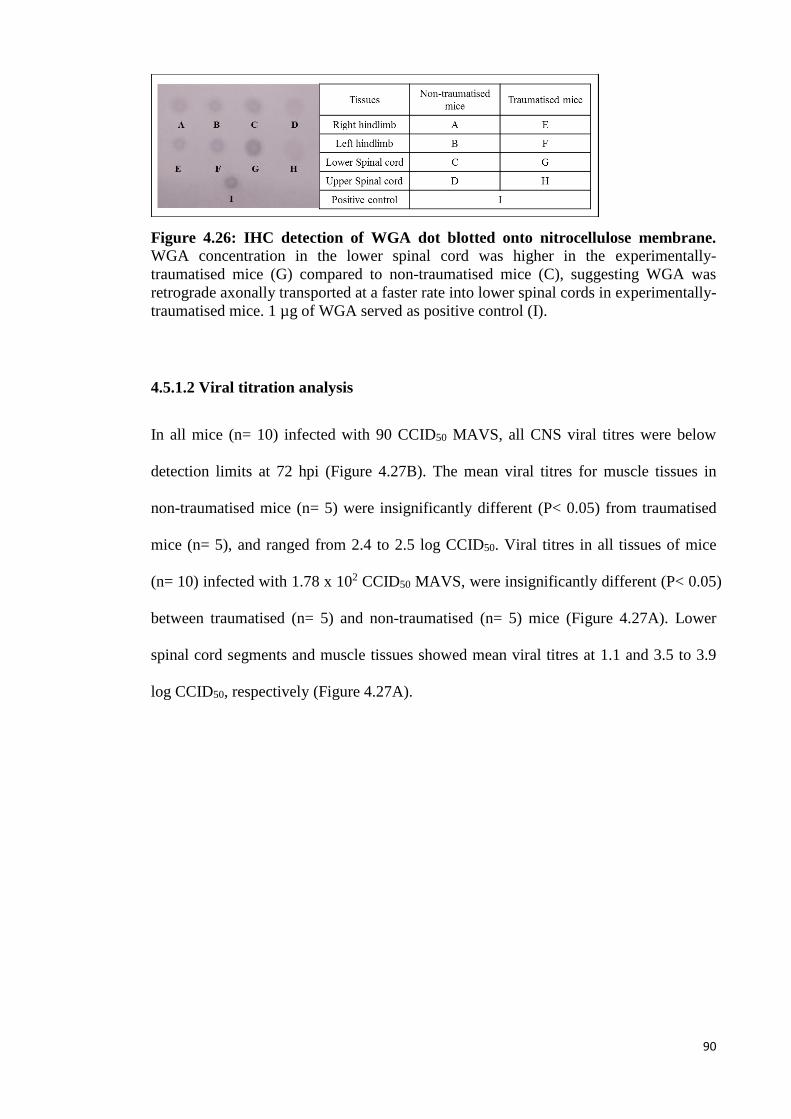
90
Figure 4.26: IHC detection of WGA dot blotted onto nitrocellulose membrane. WGA concentration in the lower spinal cord was higher in the experimentally-
traumatised mice (G) compared to non-traumatised mice (C), suggesting WGA was
retrograde axonally transported at a faster rate into lower spinal cords in experimentally-
traumatised mice. 1 µg of WGA served as positive control (I).
4.5.1.2 Viral titration analysis
In all mice (n= 10) infected with 90 CCID50 MAVS, all CNS viral titres were below
detection limits at 72 hpi (Figure 4.27B). The mean viral titres for muscle tissues in
non-traumatised mice (n= 5) were insignificantly different (P< 0.05) from traumatised
mice (n= 5), and ranged from 2.4 to 2.5 log CCID50. Viral titres in all tissues of mice
(n= 10) infected with 1.78 x 10² CCID50 MAVS, were insignificantly different (P< 0.05)
between traumatised (n= 5) and non-traumatised (n= 5) mice (Figure 4.27A). Lower
spinal cord segments and muscle tissues showed mean viral titres at 1.1 and 3.5 to 3.9
log CCID50, respectively (Figure 4.27A).
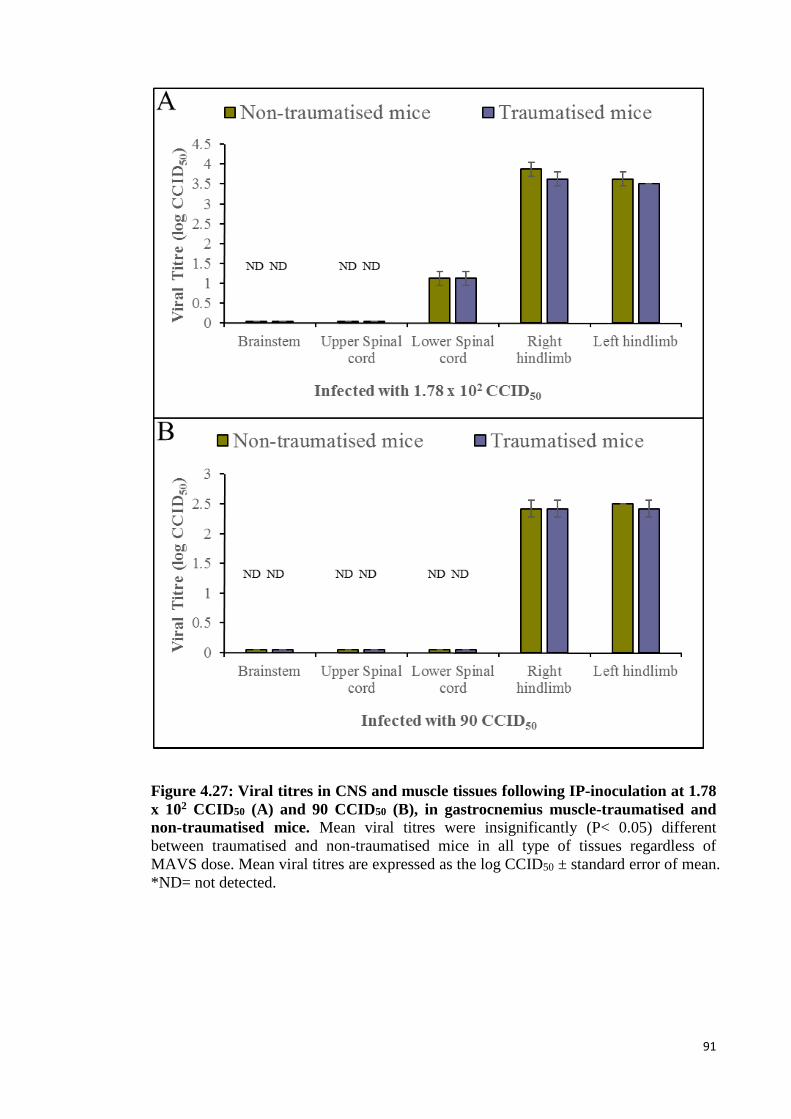
91
Figure 4.27: Viral titres in CNS and muscle tissues following IP-inoculation at 1.78
x 102 CCID50 (A) and 90 CCID50 (B), in gastrocnemius muscle-traumatised and
non-traumatised mice. Mean viral titres were insignificantly (P< 0.05) different
between traumatised and non-traumatised mice in all type of tissues regardless of
MAVS dose. Mean viral titres are expressed as the log CCID50 ± standard error of mean.
*ND= not detected.
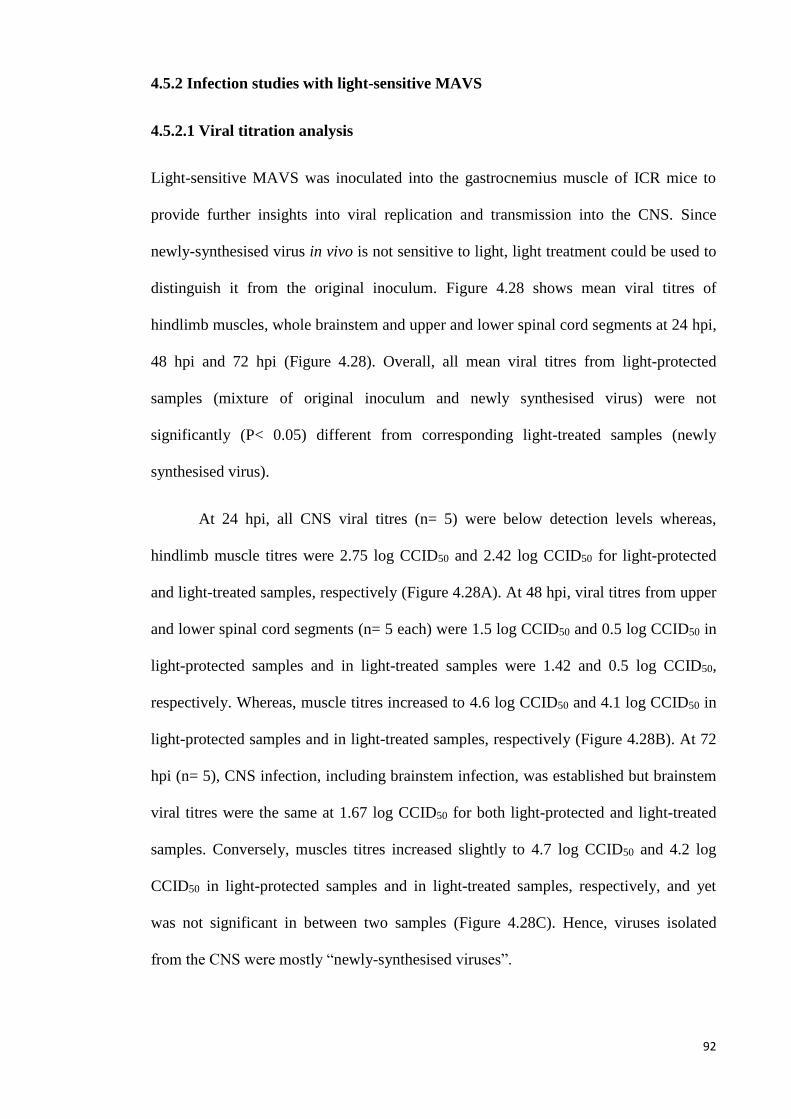
92
4.5.2 Infection studies with light-sensitive MAVS
4.5.2.1 Viral titration analysis
Light-sensitive MAVS was inoculated into the gastrocnemius muscle of ICR mice to
provide further insights into viral replication and transmission into the CNS. Since
newly-synthesised virus in vivo is not sensitive to light, light treatment could be used to
distinguish it from the original inoculum. Figure 4.28 shows mean viral titres of
hindlimb muscles, whole brainstem and upper and lower spinal cord segments at 24 hpi,
48 hpi and 72 hpi (Figure 4.28). Overall, all mean viral titres from light-protected
samples (mixture of original inoculum and newly synthesised virus) were not
significantly (P< 0.05) different from corresponding light-treated samples (newly
synthesised virus).
At 24 hpi, all CNS viral titres (n= 5) were below detection levels whereas,
hindlimb muscle titres were 2.75 log CCID50 and 2.42 log CCID50 for light-protected
and light-treated samples, respectively (Figure 4.28A). At 48 hpi, viral titres from upper
and lower spinal cord segments (n= 5 each) were 1.5 log CCID50 and 0.5 log CCID50 in
light-protected samples and in light-treated samples were 1.42 and 0.5 log CCID50,
respectively. Whereas, muscle titres increased to 4.6 log CCID50 and 4.1 log CCID50 in
light-protected samples and in light-treated samples, respectively (Figure 4.28B). At 72
hpi (n= 5), CNS infection, including brainstem infection, was established but brainstem
viral titres were the same at 1.67 log CCID50 for both light-protected and light-treated
samples. Conversely, muscles titres increased slightly to 4.7 log CCID50 and 4.2 log
CCID50 in light-protected samples and in light-treated samples, respectively, and yet
was not significant in between two samples (Figure 4.28C). Hence, viruses isolated
from the CNS were mostly “newly-synthesised viruses”.
93
Figure 4.28: Viral titres in muscle tissues and CNS following IM-inoculation,
sacrificed at 24 (A), 48 (B) and 72 hpi (C). Mean viral titres were not significant (P<
0.05) different between light-protected and light-treated samples in all type of tissues
and time. Mean viral titres are expressed as the log CCID50 ± standard error of mean.
*ND= not detected.
94
4.6 Prevention and treatment of MAVS infection using neutralising antibodies
4.6.1 Hyperimmune sera treatment of MAVS-infected mice with CNS involvement
4.6.1.1 Survival analysis
Hyperimmune sera which showed a high neutralising titre against EV-A71 at 1/512
dilution in VERO cells, were IP-inoculated into mice infected via the right jaw/facial
muscles to evaluate the effectiveness of hyperimmune sera in preventing and treating
CNS infection. All treated groups (n= 4 for each group) and mock-treated mice (n= 4)
were kept and observed daily for 21 days (Figure 4.29). The mouse group receiving 200
µL of hyperimmune serum at 4 hr pre-infection did not show any signs of infection. In
the group receiving hyperimmune sera at 12 hpi, two out of four mice showed ruffled
fur and weight loss with no observable paralysis from day 8 onwards but died on day 13
(Figure 4.29). Two out of the four mice in the group receiving hyperimmune sera at 24
hpi, showed ruffled fur and mild paralysis of one hindlimb from 72 hpi onwards and
died on day 10 (Figure 4.29). One additional mouse from this group which showed only
weight loss from day 6, died on day 11 (Figure 4.29). The mock-treated control mice all
showed signs of infection such as back hunching, fur ruffling and obvious paralysis in
both hindlimbs from 60 hpi onward, becoming more severe at 72 hpi and progressed to
moribund/death stage at 96 hpi (Figure 4.29).
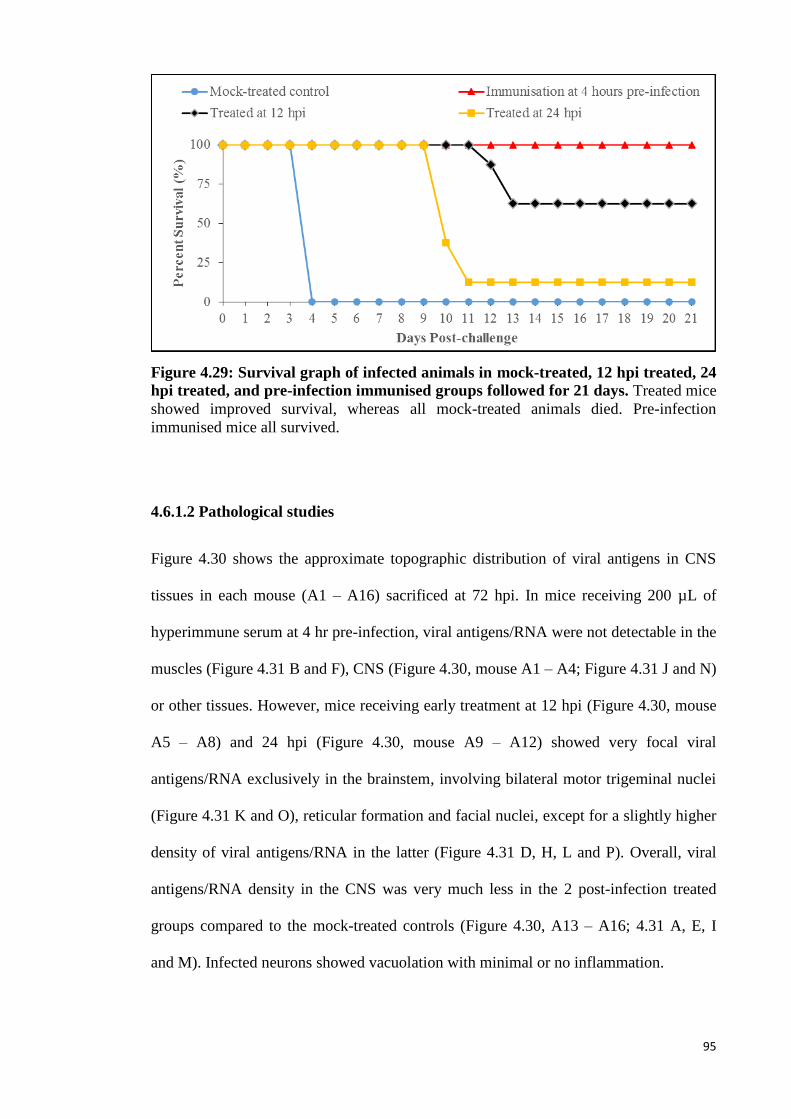
95
Figure 4.29: Survival graph of infected animals in mock-treated, 12 hpi treated, 24
hpi treated, and pre-infection immunised groups followed for 21 days. Treated mice
showed improved survival, whereas all mock-treated animals died. Pre-infection
immunised mice all survived.
4.6.1.2 Pathological studies
Figure 4.30 shows the approximate topographic distribution of viral antigens in CNS
tissues in each mouse (A1 – A16) sacrificed at 72 hpi. In mice receiving 200 µL of
hyperimmune serum at 4 hr pre-infection, viral antigens/RNA were not detectable in the
muscles (Figure 4.31 B and F), CNS (Figure 4.30, mouse A1 – A4; Figure 4.31 J and N)
or other tissues. However, mice receiving early treatment at 12 hpi (Figure 4.30, mouse
A5 – A8) and 24 hpi (Figure 4.30, mouse A9 – A12) showed very focal viral
antigens/RNA exclusively in the brainstem, involving bilateral motor trigeminal nuclei
(Figure 4.31 K and O), reticular formation and facial nuclei, except for a slightly higher
density of viral antigens/RNA in the latter (Figure 4.31 D, H, L and P). Overall, viral
antigens/RNA density in the CNS was very much less in the 2 post-infection treated
groups compared to the mock-treated controls (Figure 4.30, A13 – A16; 4.31 A, E, I
and M). Infected neurons showed vacuolation with minimal or no inflammation.

96
Skeletal muscles throughout the body were most extensively and severely
infected in mock-treated animals followed by mice treated at 24 hpi and 12 hpi,
respectively (Figure 4.31 A - H).
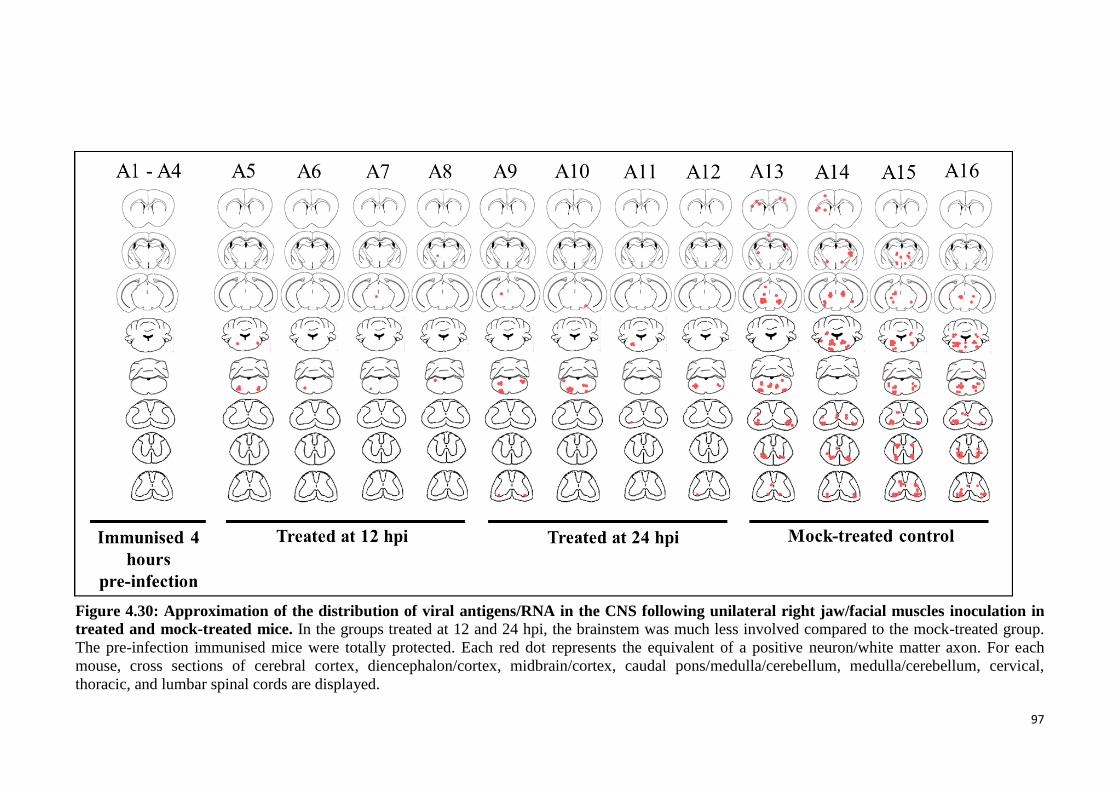
97
Figure 4.30: Approximation of the distribution of viral antigens/RNA in the CNS following unilateral right jaw/facial muscles inoculation in
treated and mock-treated mice. In the groups treated at 12 and 24 hpi, the brainstem was much less involved compared to the mock-treated group.
The pre-infection immunised mice were totally protected. Each red dot represents the equivalent of a positive neuron/white matter axon. For each
mouse, cross sections of cerebral cortex, diencephalon/cortex, midbrain/cortex, caudal pons/medulla/cerebellum, medulla/cerebellum, cervical,
thoracic, and lumbar spinal cords are displayed.
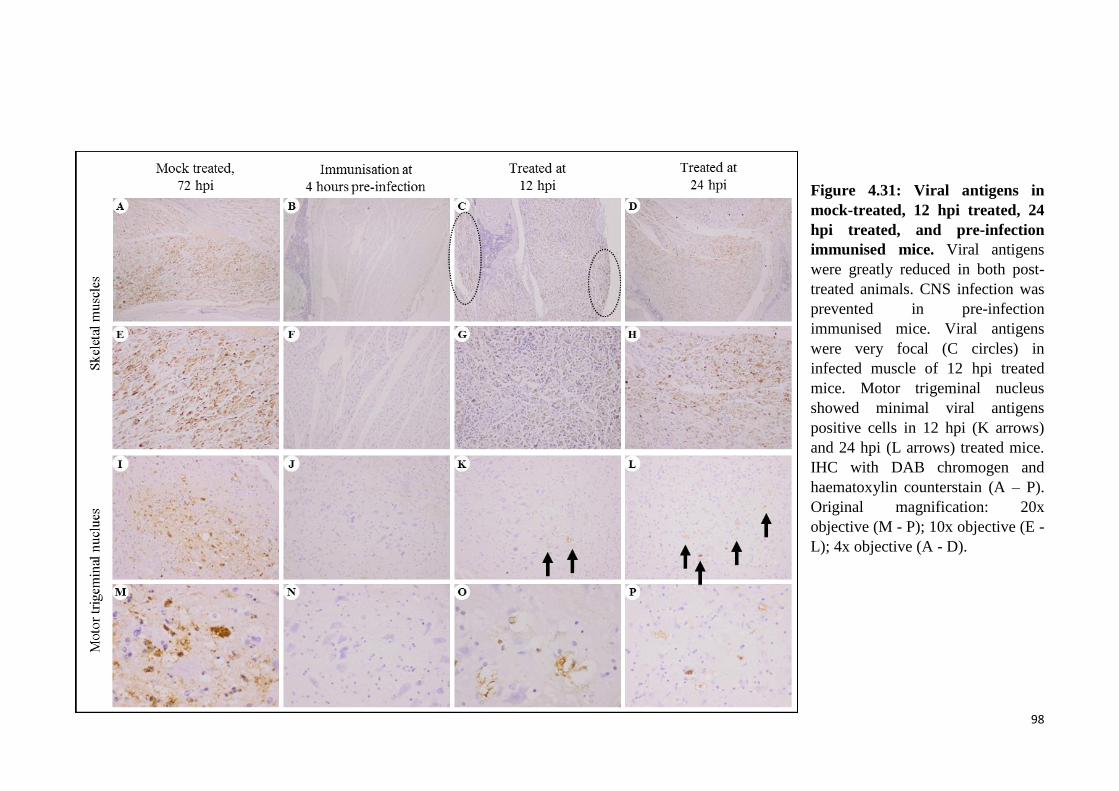
98
Figure 4.31: Viral antigens in
mock-treated, 12 hpi treated, 24
hpi treated, and pre-infection
immunised mice. Viral antigens
were greatly reduced in both post-
treated animals. CNS infection was
prevented in pre-infection
immunised mice. Viral antigens
were very focal (C circles) in
infected muscle of 12 hpi treated
mice. Motor trigeminal nucleus
showed minimal viral antigens
positive cells in 12 hpi (K arrows)
and 24 hpi (L arrows) treated mice.
IHC with DAB chromogen and
haematoxylin counterstain (A – P).
Original magnification: 20x
objective (M - P); 10x objective (E -
L); 4x objective (A - D).
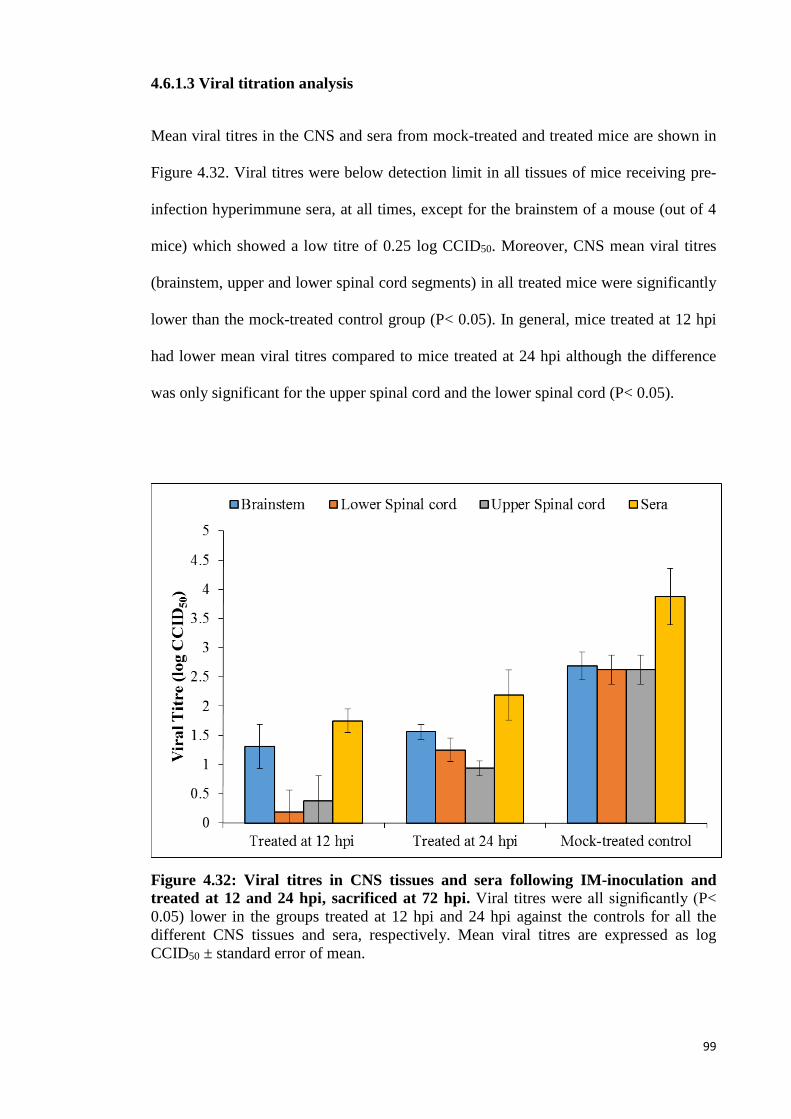
99
4.6.1.3 Viral titration analysis
Mean viral titres in the CNS and sera from mock-treated and treated mice are shown in
Figure 4.32. Viral titres were below detection limit in all tissues of mice receiving pre-
infection hyperimmune sera, at all times, except for the brainstem of a mouse (out of 4
mice) which showed a low titre of 0.25 log CCID50. Moreover, CNS mean viral titres
(brainstem, upper and lower spinal cord segments) in all treated mice were significantly
lower than the mock-treated control group (P< 0.05). In general, mice treated at 12 hpi
had lower mean viral titres compared to mice treated at 24 hpi although the difference
was only significant for the upper spinal cord and the lower spinal cord (P< 0.05).
Figure 4.32: Viral titres in CNS tissues and sera following IM-inoculation and
treated at 12 and 24 hpi, sacrificed at 72 hpi. Viral titres were all significantly (P<
0.05) lower in the groups treated at 12 hpi and 24 hpi against the controls for all the
different CNS tissues and sera, respectively. Mean viral titres are expressed as log
CCID50 ± standard error of mean.
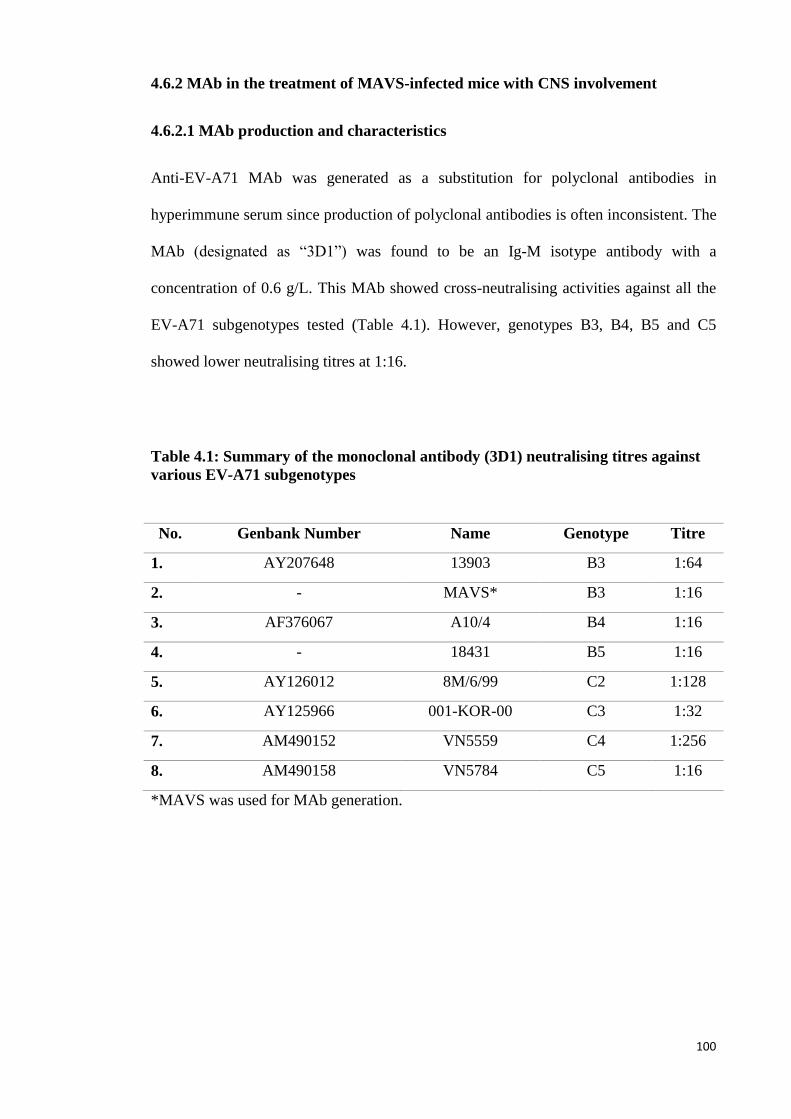
100
4.6.2 MAb in the treatment of MAVS-infected mice with CNS involvement
4.6.2.1 MAb production and characteristics
Anti-EV-A71 MAb was generated as a substitution for polyclonal antibodies in
hyperimmune serum since production of polyclonal antibodies is often inconsistent. The
MAb (designated as “3D1”) was found to be an Ig-M isotype antibody with a
concentration of 0.6 g/L. This MAb showed cross-neutralising activities against all the
EV-A71 subgenotypes tested (Table 4.1). However, genotypes B3, B4, B5 and C5
showed lower neutralising titres at 1:16.
Table 4.1: Summary of the monoclonal antibody (3D1) neutralising titres against
various EV-A71 subgenotypes
No. Genbank Number Name Genotype Titre
1. AY207648 13903 B3 1:64
2. - MAVS* B3 1:16
3. AF376067 A10/4 B4 1:16
4. - 18431 B5 1:16
5. AY126012 8M/6/99 C2 1:128
6. AY125966 001-KOR-00 C3 1:32
7. AM490152 VN5559 C4 1:256
8. AM490158 VN5784 C5 1:16
*MAVS was used for MAb generation.
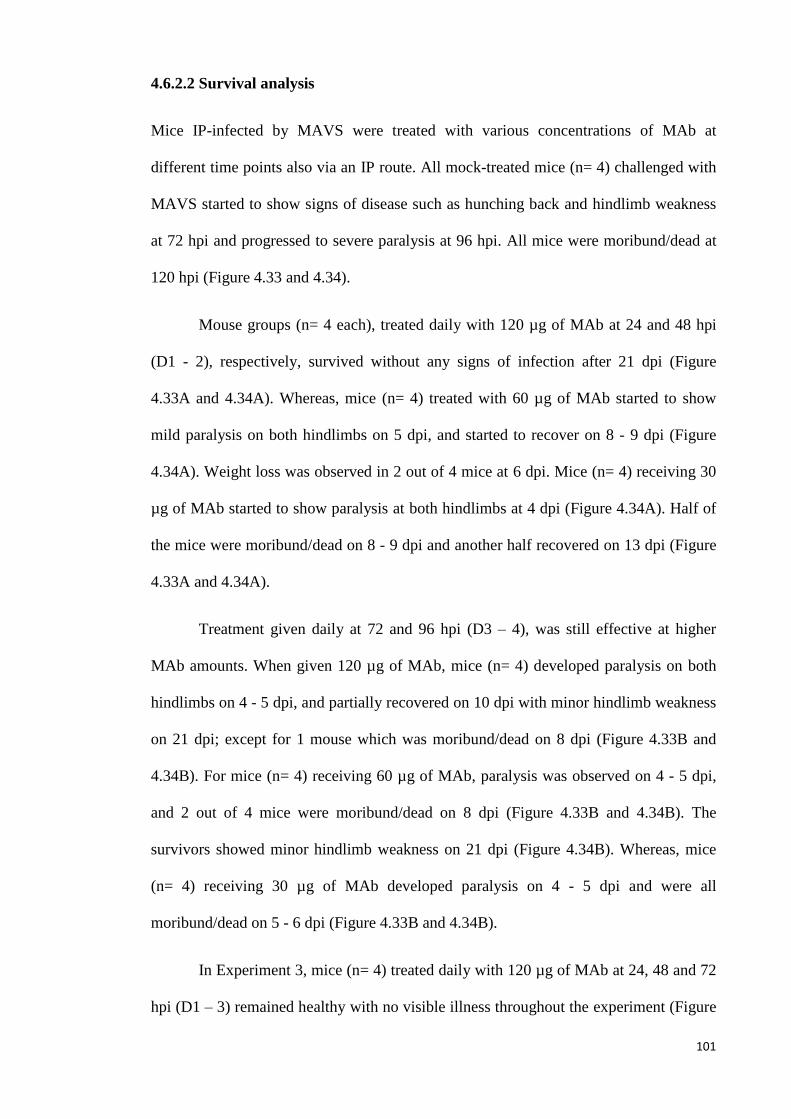
101
4.6.2.2 Survival analysis
Mice IP-infected by MAVS were treated with various concentrations of MAb at
different time points also via an IP route. All mock-treated mice (n= 4) challenged with
MAVS started to show signs of disease such as hunching back and hindlimb weakness
at 72 hpi and progressed to severe paralysis at 96 hpi. All mice were moribund/dead at
120 hpi (Figure 4.33 and 4.34).
Mouse groups (n= 4 each), treated daily with 120 µg of MAb at 24 and 48 hpi
(D1 - 2), respectively, survived without any signs of infection after 21 dpi (Figure
4.33A and 4.34A). Whereas, mice (n= 4) treated with 60 µg of MAb started to show
mild paralysis on both hindlimbs on 5 dpi, and started to recover on 8 - 9 dpi (Figure
4.34A). Weight loss was observed in 2 out of 4 mice at 6 dpi. Mice (n= 4) receiving 30
µg of MAb started to show paralysis at both hindlimbs at 4 dpi (Figure 4.34A). Half of
the mice were moribund/dead on 8 - 9 dpi and another half recovered on 13 dpi (Figure
4.33A and 4.34A).
Treatment given daily at 72 and 96 hpi (D3 – 4), was still effective at higher
MAb amounts. When given 120 µg of MAb, mice (n= 4) developed paralysis on both
hindlimbs on 4 - 5 dpi, and partially recovered on 10 dpi with minor hindlimb weakness
on 21 dpi; except for 1 mouse which was moribund/dead on 8 dpi (Figure 4.33B and
4.34B). For mice (n= 4) receiving 60 µg of MAb, paralysis was observed on 4 - 5 dpi,
and 2 out of 4 mice were moribund/dead on 8 dpi (Figure 4.33B and 4.34B). The
survivors showed minor hindlimb weakness on 21 dpi (Figure 4.34B). Whereas, mice
(n= 4) receiving 30 µg of MAb developed paralysis on 4 - 5 dpi and were all
moribund/dead on 5 - 6 dpi (Figure 4.33B and 4.34B).
In Experiment 3, mice (n= 4) treated daily with 120 µg of MAb at 24, 48 and 72
hpi (D1 – 3) remained healthy with no visible illness throughout the experiment (Figure
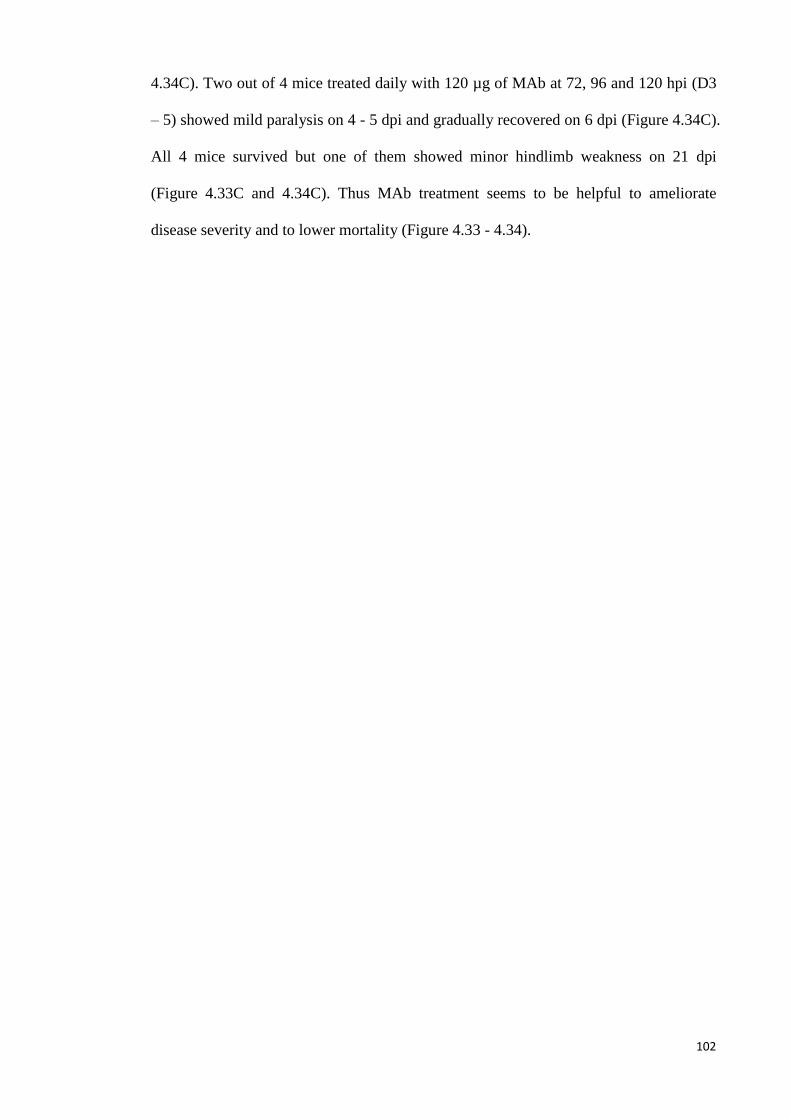
102
4.34C). Two out of 4 mice treated daily with 120 µg of MAb at 72, 96 and 120 hpi (D3
– 5) showed mild paralysis on 4 - 5 dpi and gradually recovered on 6 dpi (Figure 4.34C).
All 4 mice survived but one of them showed minor hindlimb weakness on 21 dpi
(Figure 4.33C and 4.34C). Thus MAb treatment seems to be helpful to ameliorate
disease severity and to lower mortality (Figure 4.33 - 4.34).
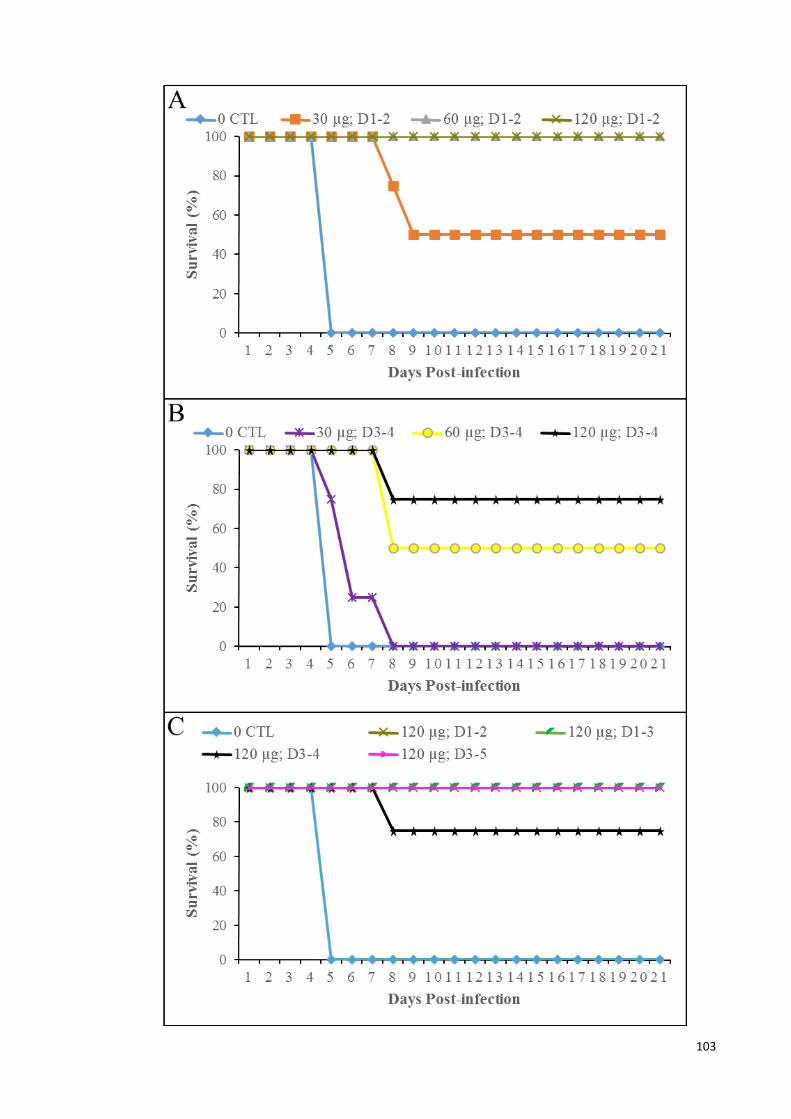
103
104
Figure 4.33: Survival graph of infected animals in mock-treated, and treated at 24
and 48 hpi (A); treated at 72 and 96 hpi (B); and treated daily for 3 consecutive
days at 120 µg of MAb (C), for 21 days. Mice treated at 24 and 48 hpi (D1 – 2) (A)
showed greatly improved survival. However, when mice were treated later at 72 and 96
hpi (D3 – 4), only mice receiving 60 µg and 120 µg of MAb showed improved survival
rate (B). All mice treated daily for 3 consecutive days at 120 µg of MAb showed
improved survival rate even though first treatment started at 72 hpi. All mock-treated
animals died at 120 hpi. *CTL= mock-treated; D1-2= treated at 24 and 48 hpi; D3-4=
treated at 72 and 96 hpi; D1-3= treated at 24, 48 and 72 hpi; D3-5= treated at 72, 96 and
120 hpi.
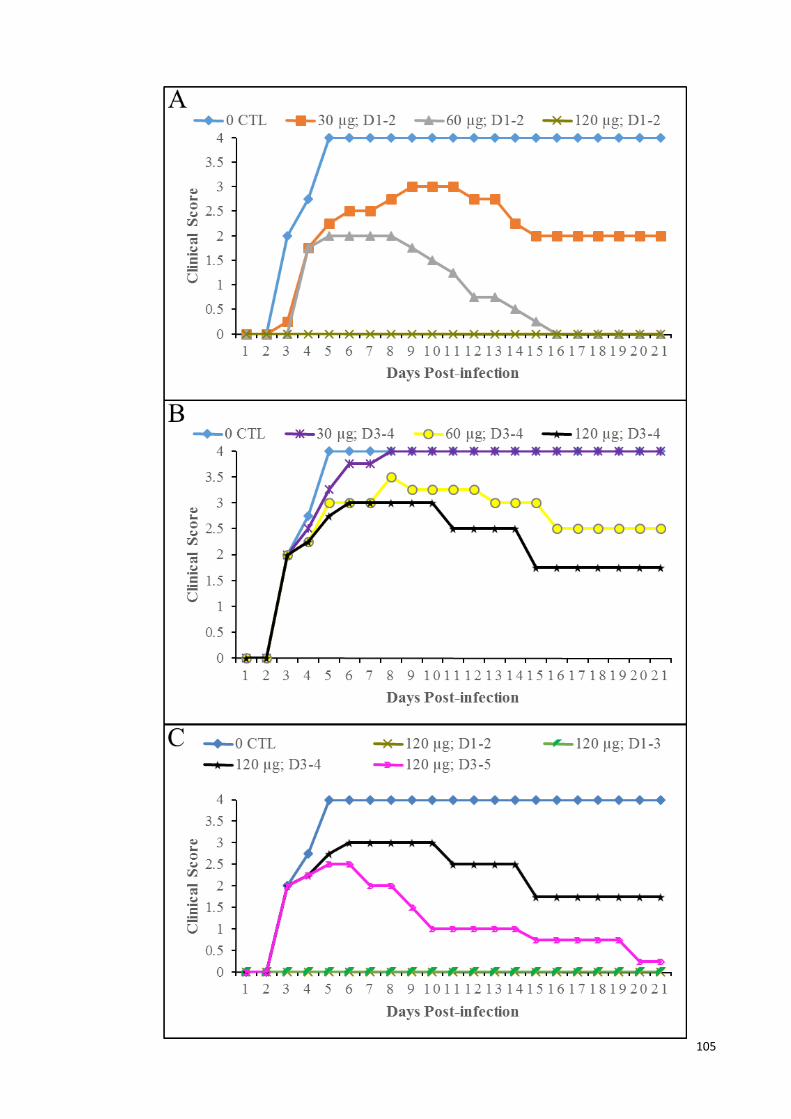
105
106
Figure 4.34: Clinical scores of infected animals in mock-treated, and treated at 24
and 48 hpi (A); treated at 72 and 96 hpi (B); and treated daily for 3 consecutive
days at 120 µg of MAb (C), for 21 days. All mice treated at 120 µg of MAb showed
improved clinical scores even though 1st treatment started at 72 hpi. Clinical scores
were graded as follows: 0, healthy; 1, weight loss; 2, limb weakness; 3, hindlimb
paralysis; and 4, moribund and death. Log-rank test analysis showed that all treated
groups demonstrated statistically significant (P< 0.05) in survival from the control
group. *CTL= mock-treated; D1-2= treated at 24 and 48 hpi; D3-4= treated at 72 and 96
hpi; D1-3= treated at 24, 48 and 72 hpi; D3-5= treated at 72, 96 and 120 hpi.
4.6.2.3 Pathological studies
Figure 4.35 shows the approximate topographic distribution of neuronal viral
antigens/RNA or damaged neurons in CNS tissues in each mouse. In all 4 IP-infected,
mock-treated mice sacrificed at 24 hpi (Figure 4.35, mouse C1 – C4), viral antigens
could only be detected in the large skeletal muscles such as forelimb and hindlimb
muscles and myositis was minimal. All other tissues including the CNS were negative
and appeared normal under microscopic observation.
Viral antigens began to appear in CNS tissues in mice sacrificed at 72 hpi
(Figure 4.35, mouse C5 – C8; Figure 4.36 I, M and Q), especially involving bilateral
spinal cords (Figure 4.36 Q), where anterior horn cells were most severely infected
(Figure 4.35, mouse C5 – C8). Furthermore, white matter axons immediately adjacent
to infected anterior horn cells at or near the site where peripheral motor nerves usually
exit, were positive for viral antigens too. Bilateral involvement of motor trigeminal
nucleus, reticular formation and thalamus were observed. Severe myositis with dense
viral antigens and inflammatory cells were observed in skeletal muscles (Figure 4.36 A
and E). Brown adipose tissues showed some viral antigens with minimal inflammation.
Mice sacrificed at 96 hpi (Figure 4.35, mouse C9 – C12) showed similar
infection to mice sacrificed at 72 hpi although the motor trigeminal nucleus and
reticular formation were more severely involved. Similarly, skeletal muscles (Figure
107
4.36 B and F) and brown adipose tissues were also more severely infected. Infected
neurons showed neuronal vacuolation and damage (Figure 4.36 J, N and R).
In mouse groups treated daily at 24, 48 and 72 hpi (Day 1 to day 3 (D1-3)) and
sacrificed at 96 hpi (Figure 4.35, mouse A1 – A4; and Figure 4.38 K, O and S), there
was no evidence of CNS infection. A few large skeletal muscles such as hindlimb
muscles were positive for viral antigens (Figure 4.36 C and G). Viral antigens and
inflammation were absent in all other tissues.
Overall, animals treated daily at 72, 96 and 120 hpi (D3-5) and sacrificed at 144
hpi (Figure 4.35, mouse A5 – A8), showed lower viral antigens density compared to
mock-treated mice sacrificed at 72 and 96 hpi, respectively (Figure 4.35, mouse C5 –
C12; and Figure 4.36). Viral antigens were observed mainly in the anterior horn cells of
the spinal cords (Figure 4.36 T), motor trigeminal nucleus (Figure 4.36 L and P),
reticular formation and hypothalamus of the brain. Infected neurons showed neuronal
vacuolation and damage (Figure 4.36 L). A few fibres in systemic skeletal muscles
(Figure 4.36 D and H) and brown adipose tissues were infected and inflamed.
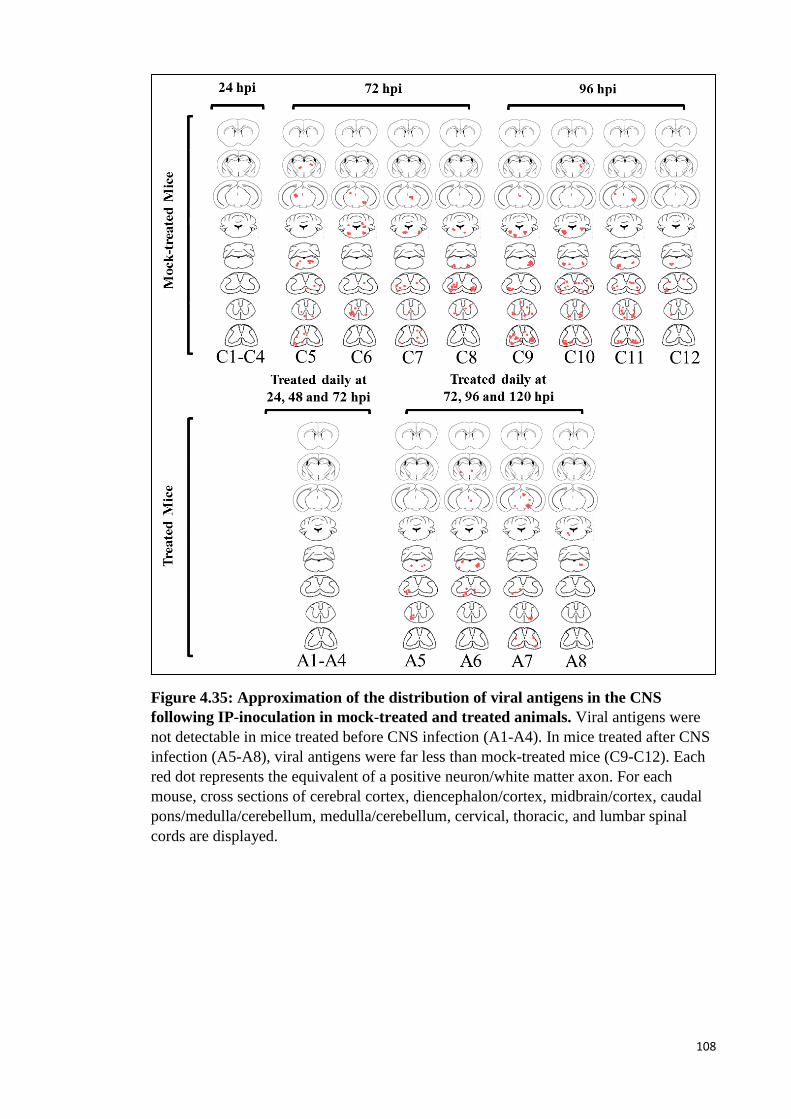
108
Figure 4.35: Approximation of the distribution of viral antigens in the CNS
following IP-inoculation in mock-treated and treated animals. Viral antigens were
not detectable in mice treated before CNS infection (A1-A4). In mice treated after CNS
infection (A5-A8), viral antigens were far less than mock-treated mice (C9-C12). Each
red dot represents the equivalent of a positive neuron/white matter axon. For each
mouse, cross sections of cerebral cortex, diencephalon/cortex, midbrain/cortex, caudal
pons/medulla/cerebellum, medulla/cerebellum, cervical, thoracic, and lumbar spinal
cords are displayed.
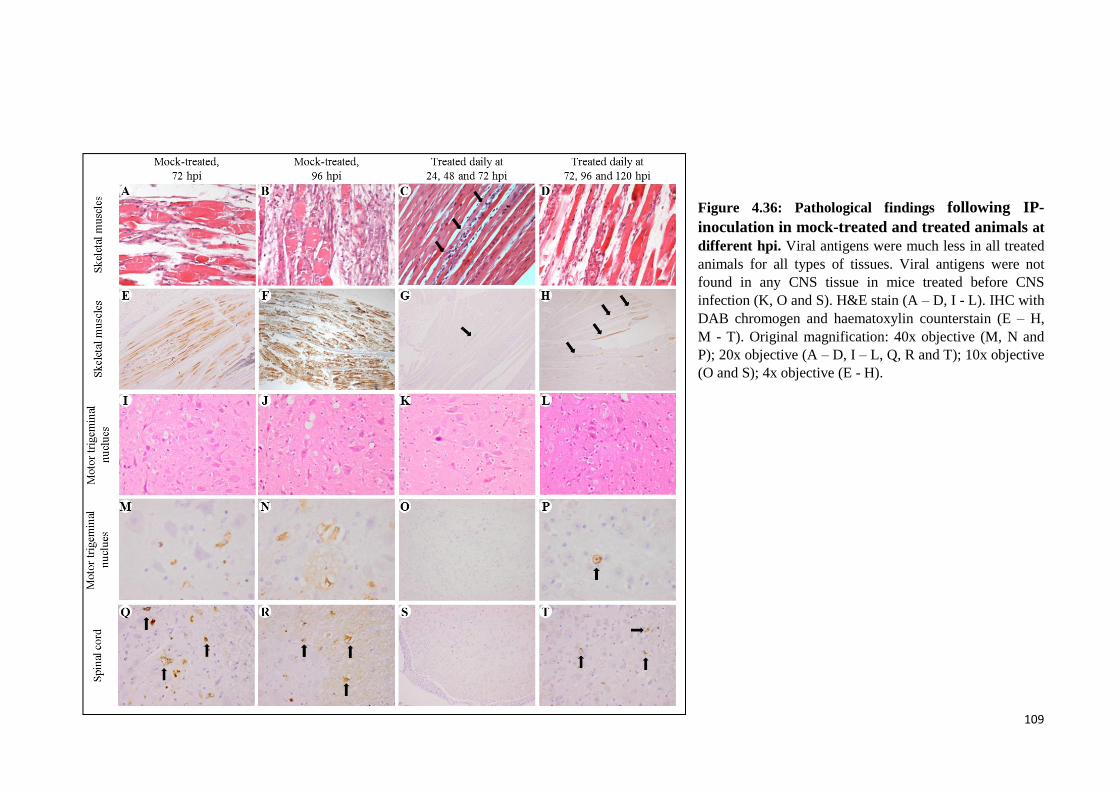
109
Figure 4.36: Pathological findings following IP-
inoculation in mock-treated and treated animals at
different hpi. Viral antigens were much less in all treated
animals for all types of tissues. Viral antigens were not
found in any CNS tissue in mice treated before CNS
infection (K, O and S). H&E stain (A – D, I - L). IHC with
DAB chromogen and haematoxylin counterstain (E – H,
M - T). Original magnification: 40x objective (M, N and
P); 20x objective (A – D, I – L, Q, R and T); 10x objective
(O and S); 4x objective (E - H).
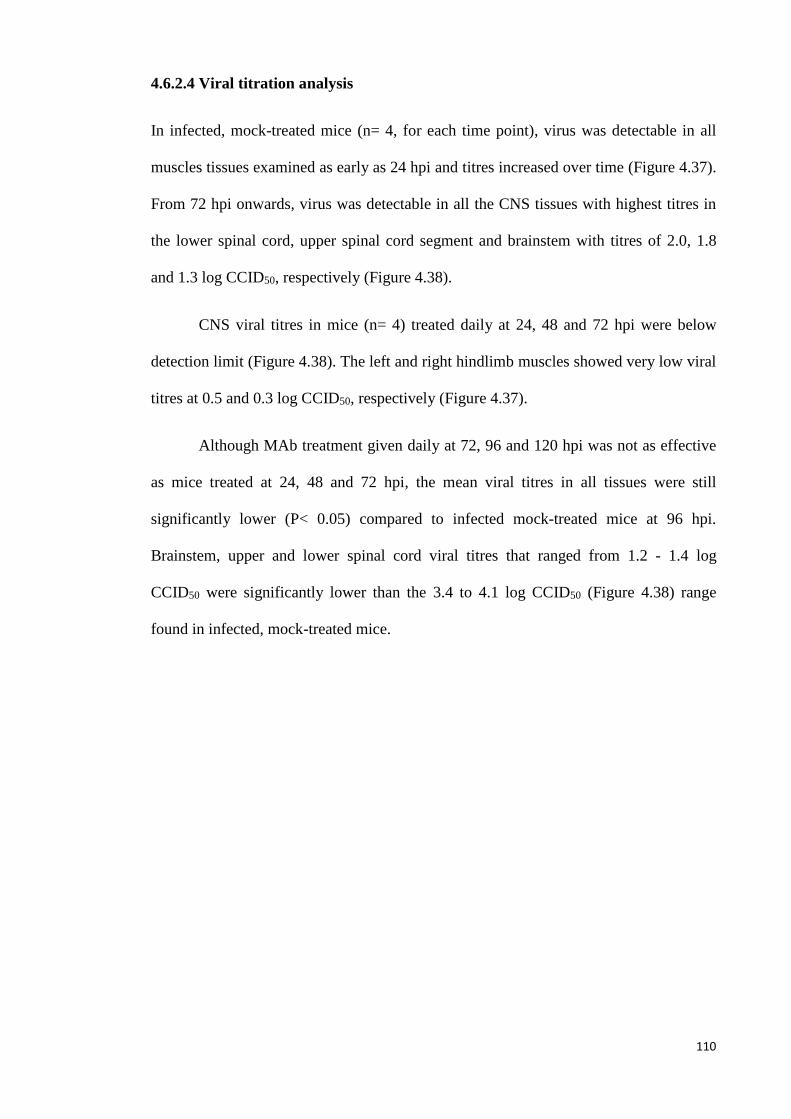
110
4.6.2.4 Viral titration analysis
In infected, mock-treated mice (n= 4, for each time point), virus was detectable in all
muscles tissues examined as early as 24 hpi and titres increased over time (Figure 4.37).
From 72 hpi onwards, virus was detectable in all the CNS tissues with highest titres in
the lower spinal cord, upper spinal cord segment and brainstem with titres of 2.0, 1.8
and 1.3 log CCID50, respectively (Figure 4.38).
CNS viral titres in mice (n= 4) treated daily at 24, 48 and 72 hpi were below
detection limit (Figure 4.38). The left and right hindlimb muscles showed very low viral
titres at 0.5 and 0.3 log CCID50, respectively (Figure 4.37).
Although MAb treatment given daily at 72, 96 and 120 hpi was not as effective
as mice treated at 24, 48 and 72 hpi, the mean viral titres in all tissues were still
significantly lower (P< 0.05) compared to infected mock-treated mice at 96 hpi.
Brainstem, upper and lower spinal cord viral titres that ranged from 1.2 - 1.4 log
CCID50 were significantly lower than the 3.4 to 4.1 log CCID50 (Figure 4.38) range
found in infected, mock-treated mice.
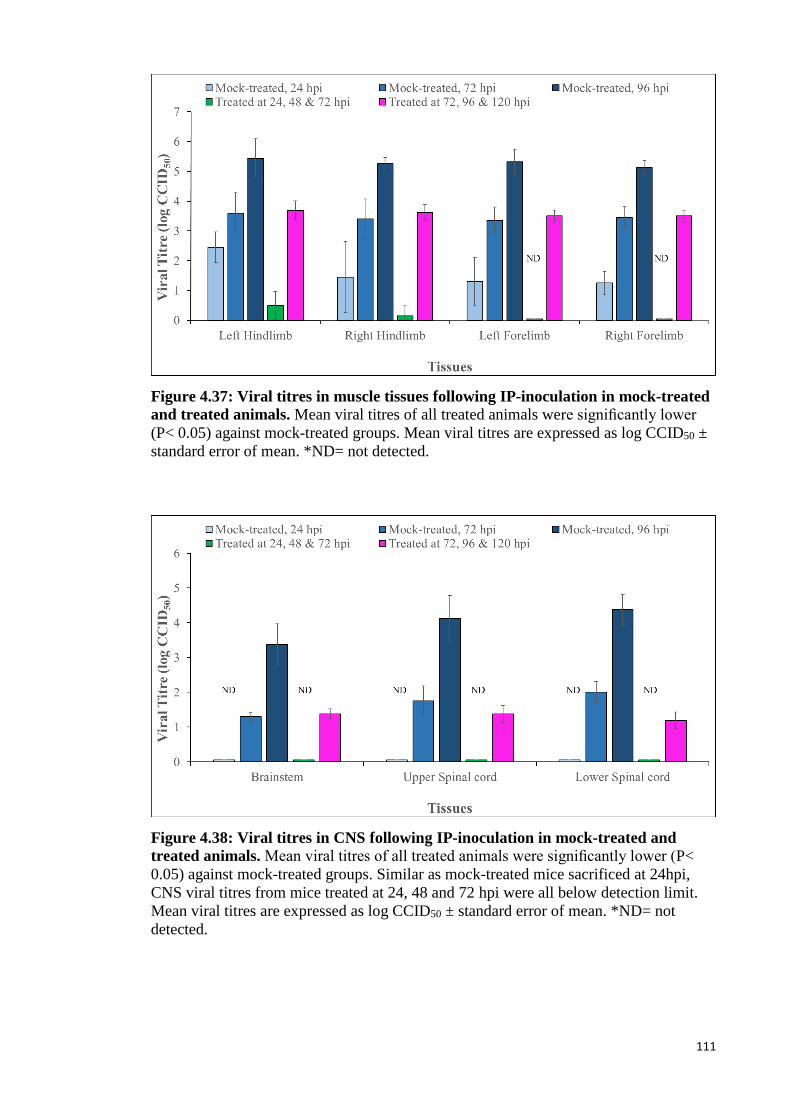
111
Figure 4.37: Viral titres in muscle tissues following IP-inoculation in mock-treated
and treated animals. Mean viral titres of all treated animals were significantly lower
(P< 0.05) against mock-treated groups. Mean viral titres are expressed as log CCID50 ±
standard error of mean. *ND= not detected.
Figure 4.38: Viral titres in CNS following IP-inoculation in mock-treated and
treated animals. Mean viral titres of all treated animals were significantly lower (P<
0.05) against mock-treated groups. Similar as mock-treated mice sacrificed at 24hpi,
CNS viral titres from mice treated at 24, 48 and 72 hpi were all below detection limit.
Mean viral titres are expressed as log CCID50 ± standard error of mean. *ND= not
detected.
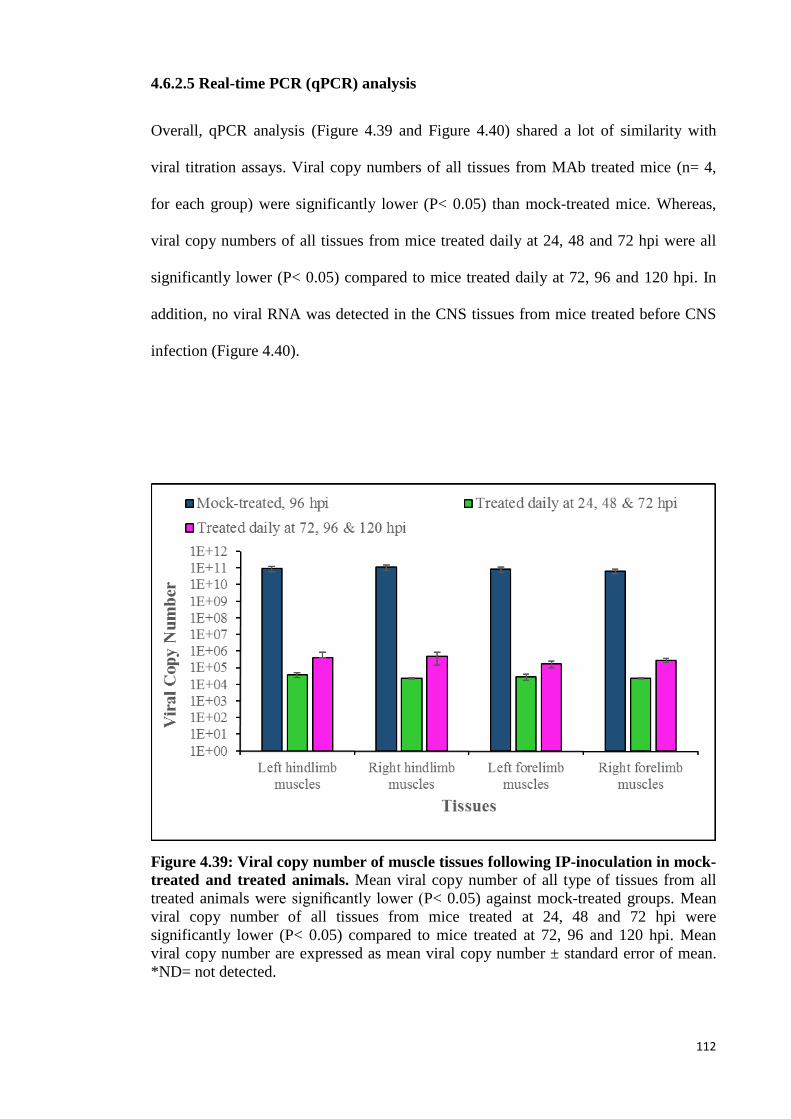
112
4.6.2.5 Real-time PCR (qPCR) analysis
Overall, qPCR analysis (Figure 4.39 and Figure 4.40) shared a lot of similarity with
viral titration assays. Viral copy numbers of all tissues from MAb treated mice (n= 4,
for each group) were significantly lower (P< 0.05) than mock-treated mice. Whereas,
viral copy numbers of all tissues from mice treated daily at 24, 48 and 72 hpi were all
significantly lower (P< 0.05) compared to mice treated daily at 72, 96 and 120 hpi. In
addition, no viral RNA was detected in the CNS tissues from mice treated before CNS
infection (Figure 4.40).
Figure 4.39: Viral copy number of muscle tissues following IP-inoculation in mock-
treated and treated animals. Mean viral copy number of all type of tissues from all
treated animals were significantly lower (P< 0.05) against mock-treated groups. Mean
viral copy number of all tissues from mice treated at 24, 48 and 72 hpi were
significantly lower (P< 0.05) compared to mice treated at 72, 96 and 120 hpi. Mean
viral copy number are expressed as mean viral copy number ± standard error of mean.
*ND= not detected.
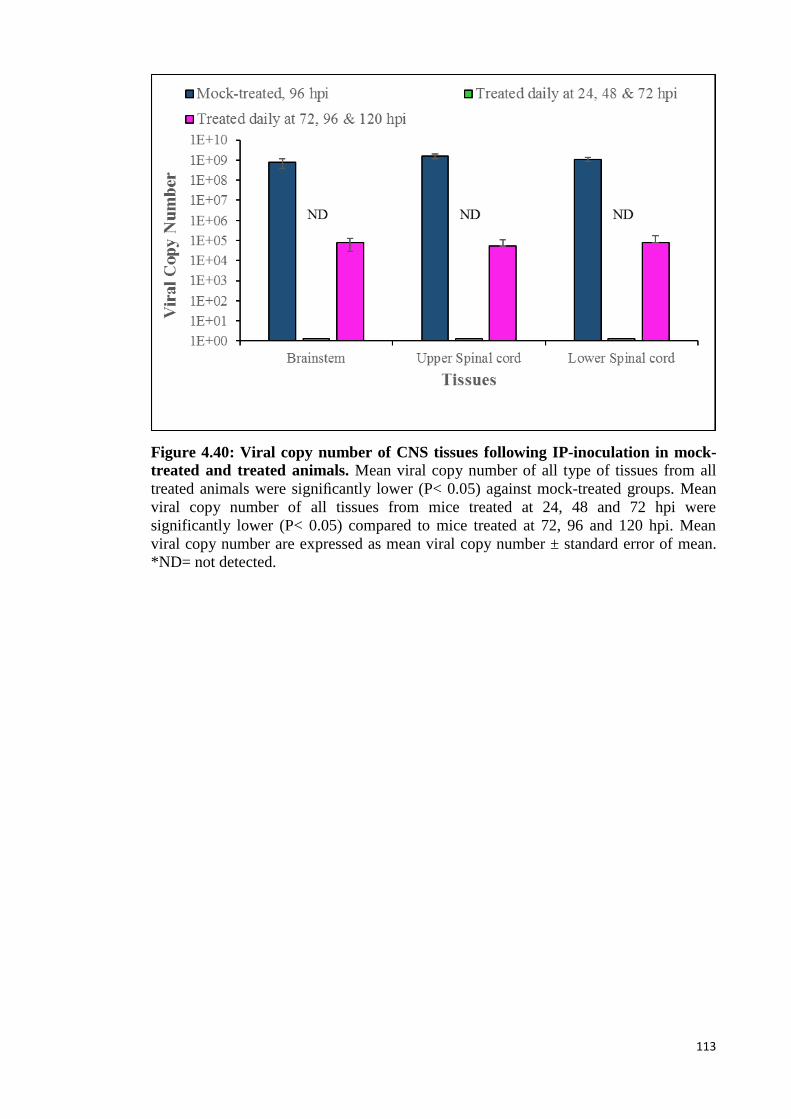
113
Figure 4.40: Viral copy number of CNS tissues following IP-inoculation in mock-
treated and treated animals. Mean viral copy number of all type of tissues from all
treated animals were significantly lower (P< 0.05) against mock-treated groups. Mean
viral copy number of all tissues from mice treated at 24, 48 and 72 hpi were
significantly lower (P< 0.05) compared to mice treated at 72, 96 and 120 hpi. Mean
viral copy number are expressed as mean viral copy number ± standard error of mean.
*ND= not detected.
114
5.0 Discussion
5.1 Enterovirus 71 Brainstem Infection via Cranial Nerves
EV-A71 infection can cause a diverse spectrum of diseases that are dermatotropic
and/or neurotropic in nature (Solomon et al., 2010). Although CNS infection is rare,
children with severe EV-A71 encephalomyelitis usually die from rapid cardio-
respiratory collapse, often within a few hours of hospital admission (K. T. Wong et al.,
2008). Recent findings from human autopsies or animal models of EV-A71
encephalomyelitis had suggested that retrograde axonal transport in motor nerves play
an important role in EV-A71 neuroinvasion (Arita et al., 2007; C. S. Chen et al., 2007;
Fujii et al., 2013; Lu et al., 2009; Ong et al., 2008; Tan et al., 2014; Wei et al., 2010; K.
T. Wong et al., 2008; K. T. Wong et al., 2012; Yan, Wang, Liu, Yang, & Su, 2000;
Yang et al., 2009). Hence, cranial nerves, in particular, motor components of these
nerves, might be involved in rapid and direct EV-A71 invasion into the brainstem to
cause sudden cardio-respiratory collapse.
After unilateral jaw/facial muscle injection, the results (Section 4.2, page 51)
suggest that EV-A71 was indeed able to enter and directly infect the murine brainstem
via cranial nerves, most likely by retrograde axonal transport rather than by the
haematogenous route (via the blood-brain-barrier). Based on pathological findings
(Section 4.2.1.1, page 51), viral antigens and RNA were first visualised within the
cranial nerves and brainstem ipsilateral to the injected side as early as 24 hpi. This is the
first time cranial nerve involvement has been demonstrated. The infected ipsilateral
brainstem regions included motor trigeminal nucleus, reticular formation and facial
nucleus, are mostly motor-related regions. We believe that inoculated MAVS after
infecting skeletal muscles crossed the neuromuscular junctions into the distal motor
nerve terminals. From there, virus travelled by retrograde axonal transport up motor
nerves of the 5th and 7th cranial nerves to infect the motor trigeminal nucleus and facial
115
nucleus, respectively. In human EV-A71 acute flaccid paralysis, MRI examinations of
the CNS have shown hyperintensities in ventral nerve roots and anterior horn areas of
the spinal cord (F. Chen et al., 2013; Zeng et al., 2012). So far, brain MRI scans have
not shown similar hyperintensities in cranial nerves. Previously, Ong et al. (2008) had
also shown that the virus could enter the spinal cord via peripheral spinal motor nerves
after unilateral thigh muscle infection in the same mouse model. Furthermore, the viral
titration assays (section 4.2.1.2, page 59) demonstrated that brainstem viral titres were
significantly higher (P< 0.05) than both upper and lower spinal cord segments up to 48
hpi, consistent with early infection of the brainstem. Taken together, we believe that
EV-A71 was able to enter the CNS (brainstem and spinal cord) via retrograde axonal
transport in peripheral motor nerves.
Following brainstem infection, the results showed greater involvement of the
motor cortex compared to other cerebral areas (Figure 4.3, page 55) suggesting that
within the CNS, the motor pathways (corticospinal/corticobulbar tracts) could spread
virus beyond the brainstem and spinal cord. This is consistent with findings from other
animal and human studies (Ong et al., 2008; K. T. Wong et al., 2008). The severely
involved reticular formation is likely to facilitate viral spread within the CNS to the
hypothalamus, other brainstem areas and beyond. Lateral cerebellar nucleus
involvement could be via pathways that connect it to the red nucleus and the medulla.
Similarly, the thalamus and other sensory neurons could become infected via the
complex interlinks of other neural pathways in the CNS.
Viraemia was detected as early as 12 hpi, probably from the viral replication in
the injected muscles and/or leakage of the site of inoculation. Viraemia was likely to
have spread infection to contralateral and other skeletal muscles as early as 12 hpi
(Figure 4.5, page 60). Viral titres in the blood were significantly (P < 0.05) higher than
the titres in CNS tissues at all times. We speculate that following bilateral skeletal
116
muscle infection, MAVS continued to travel up respective motor nerves to involve other
parts of the CNS (both ipsilateral and contralateral sides) as seen at later time points
from 36 hpi onwards. There was bilateral marked increase of anterior horn cell infection
in the spinal cords (Figure 4.3, page 55). Moreover, the role of viraemia to cause
widespread CNS infection was clearly shown in section 4.2.3 (page 64), where infected
mice in which viraemia was prevented/reduced by hyperimmune sera demonstrated only
ipsilateral brainstem and muscle infection/inflammation; the contralateral CNS and
other skeletal muscles were uninfected. If CNS infection occurred by the
haematogenous route, one might expect early bilateral infection of the CNS at early
time points and a similar degree of infection in the cerebral cortex, hippocampus,
thalamus, hypothalamus and other brain regions due to simultaneous exposure to virus.
Following unilateral jaw/facial muscle injection, (Section 4.2, page 51) the
motor trigeminal nucleus and reticular formation were the first sites of infection in the
brainstem. Infection of the reticular formation was most likely via the rich and extensive
neuronal inter-connections with the motor trigeminal and facial nuclei. Since the
reticular formation extends to the whole brainstem, including the medulla, viral spread
to medullary nuclei via the reticular formation is entirely possible (Conn &
SpringerLink, 2008; Heimer, 1995; Wilson-Pauwels, Akesson, & Stewart, 2002).
Although direct medullary infection via 9th and 12th cranial nerves was not done in these
studies because of technical difficulties injecting muscle groups innervated by these
nerves, viral transmission from motor trigeminal and facial nuclei to the medulla is
likely to have occurred. In human infections, brain MRI examination revealed lesions
mainly in dorsal pons and the whole medulla oblongata, findings that were confirmed
by autopsy of patients with fatal encephalomyelitis (K. T. Wong et al., 2008; Zeng et al.,
2012). Direct medullary infection, via 9th and 12th cranial nerves (motor components)
could cause sudden death as a result of the involvement and inflammation of medullary
117
cardio-respiratory centres (Baker, 1957; Fu et al., 2004; Fu et al., 2006; Hoff, Nishimura,
Garcia-Uria, & Miranda, 1981). The fact that patients with fatal encephalomyelitis
almost always suffer a catastrophic terminal event, often within a few hours of hospital
admission, is consistent with direct brainstem infection and destruction of the cardio-
respiratory centres. Following medullary inflammation and damage, high levels of
norepinephrine and epinephrine could be released to raise the pulmonary vascular
pressure, leading to cardiac damage and arrhythmia, and neurogenic pulmonary oedema
(Kao, Yang, Hsu, & Chen, 2004; Yang et al., 2009).
Another theory suggests that the terminal events in fatal encephalomyelitis is
associated with a “cytokine storm”. In many human studies, increased inflammatory
cytokines including IL-1β, IL-6, IL-10, IL-13 and IFN-γ had been reported. These
cytokines are believed to increase pulmonary vascular permeability leading to
pulmonary oedema and death (T. Y. Lin, Chang, Huang, et al., 2002; S. M. Wang et al.,
2003; S. M. Wang, Lei, & Liu, 2012). However, none of the animal models studied so
far has demonstrated pulmonary oedema, including the current study (Y. F. Wang & Yu,
2014). The inflammatory cytokines could be associated with severe/terminal infection
rather than the direct cause of death. Some authors believe direct brainstem infection to
be more important than “cytokine storm”-induced pulmonary oedema/functional
dysregulation as a cause of death (T. Y. Lin, Hsia, Huang, Wu, & Chang, 2003; S. M.
Wang et al., 2003; S. M. Wang et al., 2012). Further investigations are needed to
confirm this. Lastly, the possibility of myositis causing respiratory muscular paralysis
and failure, and thereby contributing to death in mouse models cannot be ignored.
However, myositis has not been reported in human EV-A71 encephalomyelitis.
118
5.2 Infectivity of EV-A71 in Neuronal Cells
The stereotyped distribution of inflammation and antigens/RNA in the human and
murine CNS (Ong et al., 2008; K. T. Wong et al., 2008) could be due to at least two
possibilities. Firstly, upon entering the spinal cord and brainstem via retrograde motor
nerve transmission, viruses first infect the motor neuronal cell bodies in the spinal cord
(anterior horn cells) and brainstem (e.g. cranial nerve nuclei) and spread from these
neurons to other regions via established neural pathways. Secondly, assuming that
haematogenous spread occurs, and there is an equitable distribution of virus, there may
be different neuronal susceptibility in different CNS regions depending on the
density/availability of SCARB2 receptors. The SCARB2 receptor is probably a primary
determinant of viral entry into cells and hence, play an important role in tissue tropism
(P. Chen et al., 2012; Yamayoshi et al., 2014; Yamayoshi et al., 2009). After virus has
entered the CNS parenchyma either by peripheral nerves or haematogenous route, it is
also possible that more distant neurons or groups of neurons with a higher density of
viral receptors will more likely be infected in contrast to neurons with fewer SCARB2
receptors.
To investigate viral spread within the murine CNS, MAVS was inoculated into
thalamus/hypothalamus and pons/medulla regions by an IC route (Section 4.3, page 68).
The thalamus/hypothalamus and pons/medulla regions were chosen because according
to the Allen Brain Atlas Data Portal, the C57BL/6J mouse at 56 days of age, expresses
SCARB2 receptor in all parts of brain with the highest expressions in the pons,
hypothalamus and medulla regions (Table 5.1) (Lein et al., 2007). We assume that this
also applies to the ICR mice used in our experiments.
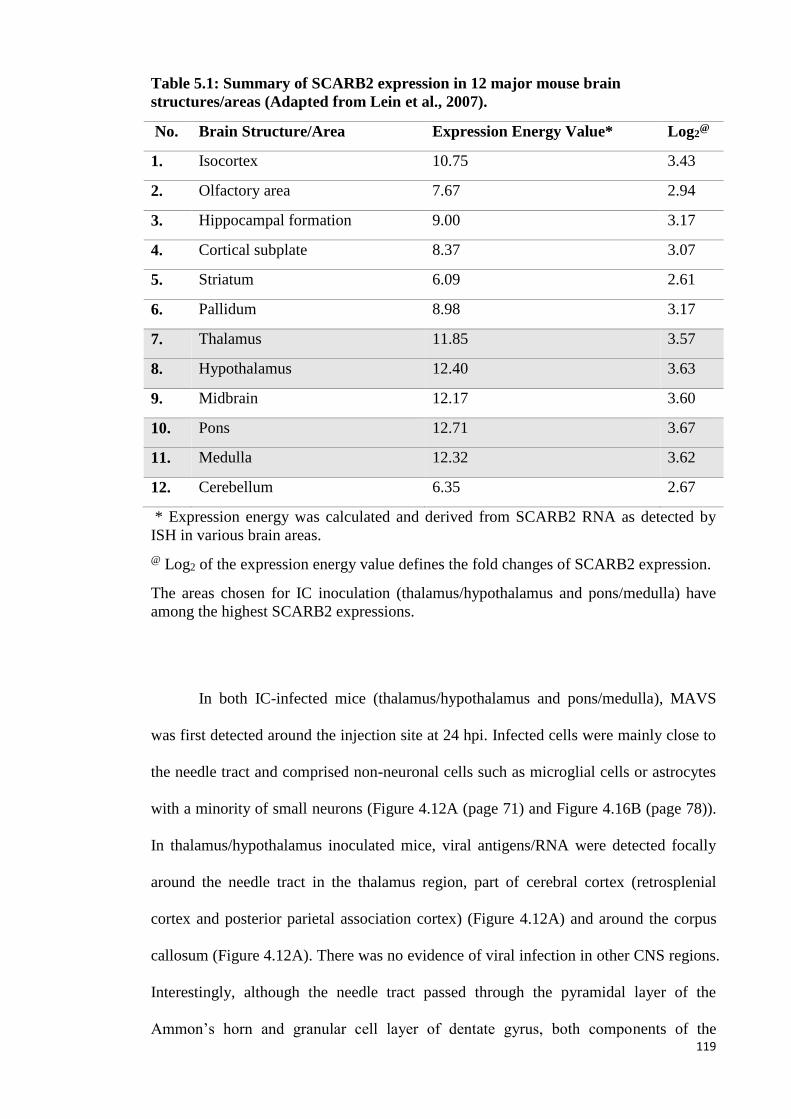
119
Table 5.1: Summary of SCARB2 expression in 12 major mouse brain
structures/areas (Adapted from Lein et al., 2007).
No. Brain Structure/Area Expression Energy Value* Log2@
1. Isocortex 10.75 3.43
2. Olfactory area 7.67 2.94
3. Hippocampal formation 9.00 3.17
4. Cortical subplate 8.37 3.07
5. Striatum 6.09 2.61
6. Pallidum 8.98 3.17
7. Thalamus 11.85 3.57
8. Hypothalamus 12.40 3.63
9. Midbrain 12.17 3.60
10. Pons 12.71 3.67
11. Medulla 12.32 3.62
12. Cerebellum 6.35 2.67
* Expression energy was calculated and derived from SCARB2 RNA as detected by
ISH in various brain areas.
@ Log2 of the expression energy value defines the fold changes of SCARB2 expression.
The areas chosen for IC inoculation (thalamus/hypothalamus and pons/medulla) have
among the highest SCARB2 expressions.
In both IC-infected mice (thalamus/hypothalamus and pons/medulla), MAVS
was first detected around the injection site at 24 hpi. Infected cells were mainly close to
the needle tract and comprised non-neuronal cells such as microglial cells or astrocytes
with a minority of small neurons (Figure 4.12A (page 71) and Figure 4.16B (page 78)).
In thalamus/hypothalamus inoculated mice, viral antigens/RNA were detected focally
around the needle tract in the thalamus region, part of cerebral cortex (retrosplenial
cortex and posterior parietal association cortex) (Figure 4.12A) and around the corpus
callosum (Figure 4.12A). There was no evidence of viral infection in other CNS regions.
Interestingly, although the needle tract passed through the pyramidal layer of the
Ammon’s horn and granular cell layer of dentate gyrus, both components of the
120
hippocampal formation, which demonstrate the strongest SCARB2 expression (Lein et
al., 2007), there was very little infection of the neuronal cells. Only a few dentate gyrus
neurons were positive for viral antigens/RNA in 2 mice (Figure 4.11, mouse A2 and A4,
page 70).
In pons/medulla inoculated mice, viral antigens/RNA were only detectable
focally around the needle tract in the brainstem reticular formation. Although the needle
tract passed through the purkinje cell layer of the cerebellum which demonstrate the
strongest SCARB2 expression (Lein et al., 2007), there was no infection of these
neuronal cells.
At 48 and 72 hpi, around the needle tract, viral antigens/RNA were found to be
reduced. These findings suggested that there was little, if any cell-to-cell viral spread
(centrifugal spread) from the needle tract to surrounding neurons. It is assumed that
following cytolysis of infected neurons, the released virus in the
microenvironment/neurophil could infect the adjacent neurons, but this was not
observed in our experiment. The reason for this surprising finding is unknown. It is
possible that an innate immune response may inhibit the entry and replication to limit
virus spread in adjacent neurons. Although strong neuronal mSCARB2 expression has
been reported in the Allen Brain Atlas Data Portal (Lein et al., 2007), it is possible that
the MAVS after adaptation, may not use mSCARB2 efficiently for viral entry. Using
transfected L-929 (murine fibroblast cells), Yamayoshi et al. (2009) have reported that
mSCARB2 may not be a functional receptor for EV-A71, due to its low efficiency for
viral entry compared to hSCARB2. Furthermore, using IHC, Yu et al. (2014) found no
correlation between the distribution of mSCARB2 and EV-A71 antigens in their mouse
model. Hence, it is possible that our MAVS utilised an unknown receptor(s) for
neuronal entry instead of mSCARB2. This unknown receptor(s) may not be present in
sufficient quantities to support cell-to-cell virus spread in the thalamus/hypothalamus
121
and pons/medulla regions. Alternatively, an unknown viral co-receptor may be absent in
these cells without which mSCARB2 alone is insufficient for viral entry as was shown
in HIV infection (Fields et al., 2013). Further investigations are needed to confirm this.
At 48 hpi, viral antigens/RNA distribution away the needle tract was similar in
both intra-thalamus/hypothalamus and intra-pons/medulla inoculated mice. The motor-
related regions such as motor trigeminal nucleus and reticular formation, were positive
for viral antigens/RNA bilaterally (Figure 4.11 (page 71) and Figure 4.15 (page 77)).
We believe that retrograde transport from peripheral nerves is likely to have caused
infection in these areas. This is because, these infected motor regions were further away
from the thalamus/hypothalamus inoculated site compared to pons/medulla, but yet both
showed similar bilateral neuronal involvement. As was shown in IM-inoculated mice
(Section 4.2, page 51), the motor trigeminal nucleus and reticular formation were the
first brainstem neurons to be infected at 24 hpi after retrograde axonal transmission.
Bilateral infection of these regions was observed at 48 hpi, and the pattern of brainstem
involvement was very similar to both intra-thalamus/hypothalamus and intra-
pons/medulla inoculated mouse brains. Hence, the infection of these areas was similar
to IM-inoculated mice, and probably originated from leaked MAVS into the blood
causing viraemia. Disseminated viruses caused systemic skeletal muscle infection
followed by retrograde viral transmission into the brainstem and spinal cord.
At 72 hpi, viral antigens/RNA distribution away the needle tract was again
similar in both intra-thalamus/hypothalamus and intra-pons/medulla inoculated mice.
Compared to 48 hpi, the same regions were also involved but other regions such as
thalamus, hypothalamus, red nucleus, dentate nucleus and motor cortex were more
severely infected. Compared to IM-inoculated mice at 72 hpi, viral antigens/RNA
distribution was also similar.
122
Table 5.2 summarises the pathological changes in systemic skeletal muscles and
motor trigeminal nucleus over various time points in IM, intra-thalamus/hypothalamus
and intra-pons/medulla inoculated mice. The severity of the skeletal muscle and motor
trigeminal nucleus infection over time were used as an indicator of systematic viral
spread and retrograde viral transmission, respectively. As early as 24 hpi, systemic
skeletal muscles showed evidence of viral antigens/RNA because of viraemia (serum
viral titres always positive). In general, the density of viral antigens/RNA in skeletal
muscles were always higher than in the CNS (brainstem/spinal cord) for all time points,
especially at 48 and 72 hpi. However, intra-thalamus/hypothalamus and intra-
pons/medulla inoculated mice demonstrated delayed skeletal muscle and corresponding
CNS infection most likely due to lower serum viral titres. On the contrary, higher
viraemia and earlier viral replication in skeletal muscles accelerated retrograde viral
transport into the motor trigeminal nucleus to cause the earlier infection and higher
brainstem viral titres in IM-inoculated mice (Table 5.2).
Serum viral titres in IM-inoculated mice were significantly higher than both
intra-thalamus/hypothalamus and intra-pons/medulla inoculated mice at earlier and
subsequent time points (Figure 4.5 (page 60), Figure 4.13 (page 73), Figure 4.17 (page
80)). This suggested that viraemia occurred earlier, either from increased viral leakage
from injection site, early primary replication in injected muscles or other unknown
factors. Presumably, the earlier and more severe involvement of the skeletal muscles
and motor trigeminal nucleus could have caused earlier limb paralysis in IM-inoculated
mice.
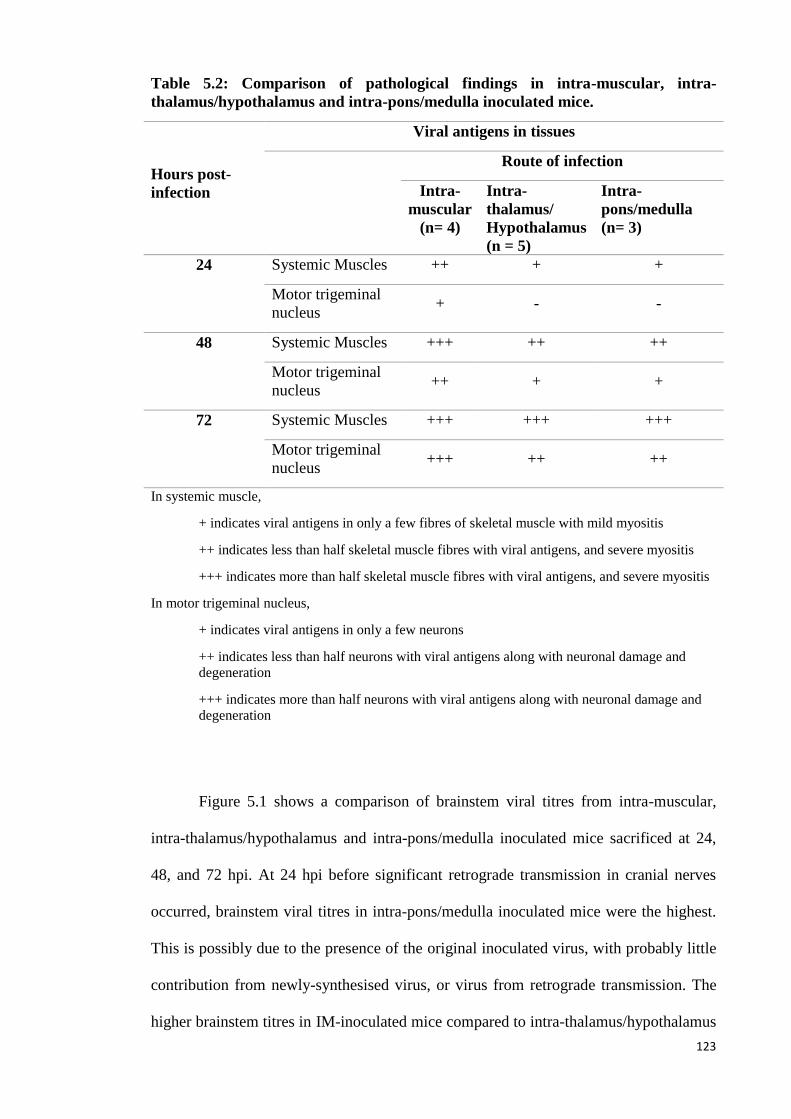
123
Table 5.2: Comparison of pathological findings in intra-muscular, intra-
thalamus/hypothalamus and intra-pons/medulla inoculated mice.
Hours post-
infection
Viral antigens in tissues
Route of infection
Intra-
muscular
(n= 4)
Intra-
thalamus/
Hypothalamus
(n = 5)
Intra-
pons/medulla
(n= 3)
24 Systemic Muscles ++ + +
Motor trigeminal
nucleus + - -
48 Systemic Muscles +++ ++ ++
Motor trigeminal
nucleus ++ + +
72 Systemic Muscles +++ +++ +++
Motor trigeminal
nucleus +++ ++ ++
In systemic muscle,
+ indicates viral antigens in only a few fibres of skeletal muscle with mild myositis
++ indicates less than half skeletal muscle fibres with viral antigens, and severe myositis
+++ indicates more than half skeletal muscle fibres with viral antigens, and severe myositis
In motor trigeminal nucleus,
+ indicates viral antigens in only a few neurons
++ indicates less than half neurons with viral antigens along with neuronal damage and
degeneration
+++ indicates more than half neurons with viral antigens along with neuronal damage and
degeneration
Figure 5.1 shows a comparison of brainstem viral titres from intra-muscular,
intra-thalamus/hypothalamus and intra-pons/medulla inoculated mice sacrificed at 24,
48, and 72 hpi. At 24 hpi before significant retrograde transmission in cranial nerves
occurred, brainstem viral titres in intra-pons/medulla inoculated mice were the highest.
This is possibly due to the presence of the original inoculated virus, with probably little
contribution from newly-synthesised virus, or virus from retrograde transmission. The
higher brainstem titres in IM-inoculated mice compared to intra-thalamus/hypothalamus
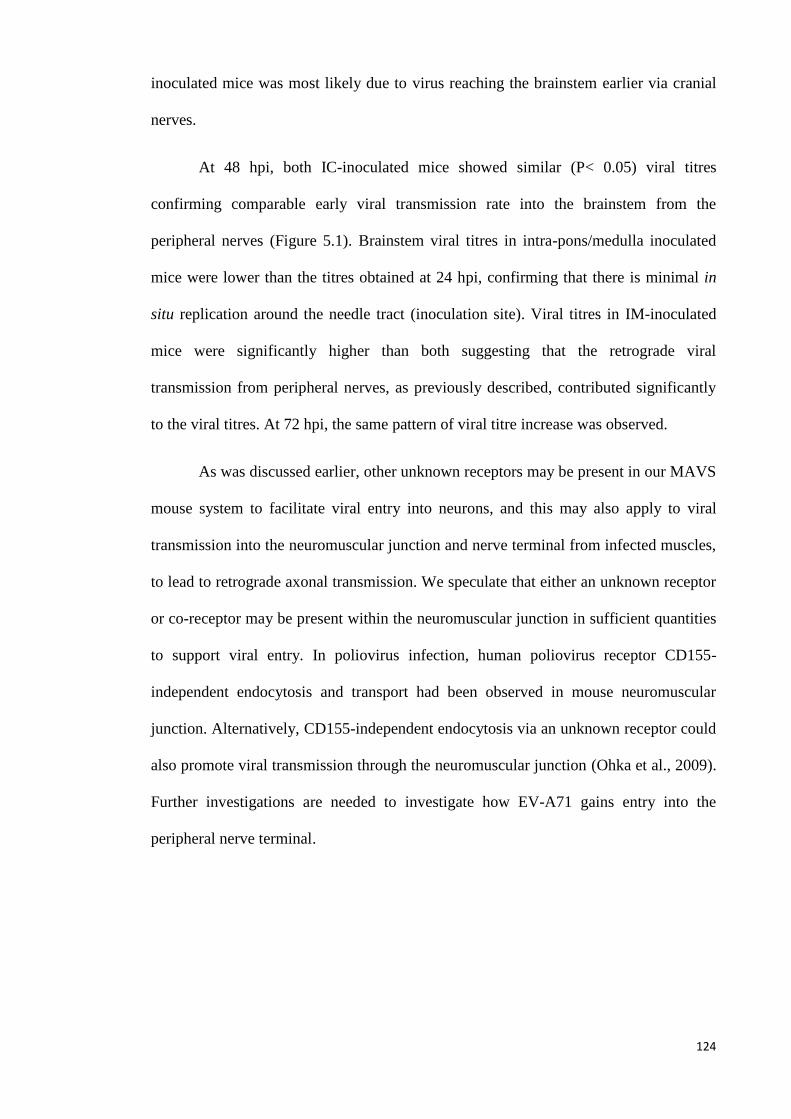
124
inoculated mice was most likely due to virus reaching the brainstem earlier via cranial
nerves.
At 48 hpi, both IC-inoculated mice showed similar (P< 0.05) viral titres
confirming comparable early viral transmission rate into the brainstem from the
peripheral nerves (Figure 5.1). Brainstem viral titres in intra-pons/medulla inoculated
mice were lower than the titres obtained at 24 hpi, confirming that there is minimal in
situ replication around the needle tract (inoculation site). Viral titres in IM-inoculated
mice were significantly higher than both suggesting that the retrograde viral
transmission from peripheral nerves, as previously described, contributed significantly
to the viral titres. At 72 hpi, the same pattern of viral titre increase was observed.
As was discussed earlier, other unknown receptors may be present in our MAVS
mouse system to facilitate viral entry into neurons, and this may also apply to viral
transmission into the neuromuscular junction and nerve terminal from infected muscles,
to lead to retrograde axonal transmission. We speculate that either an unknown receptor
or co-receptor may be present within the neuromuscular junction in sufficient quantities
to support viral entry. In poliovirus infection, human poliovirus receptor CD155-
independent endocytosis and transport had been observed in mouse neuromuscular
junction. Alternatively, CD155-independent endocytosis via an unknown receptor could
also promote viral transmission through the neuromuscular junction (Ohka et al., 2009).
Further investigations are needed to investigate how EV-A71 gains entry into the
peripheral nerve terminal.
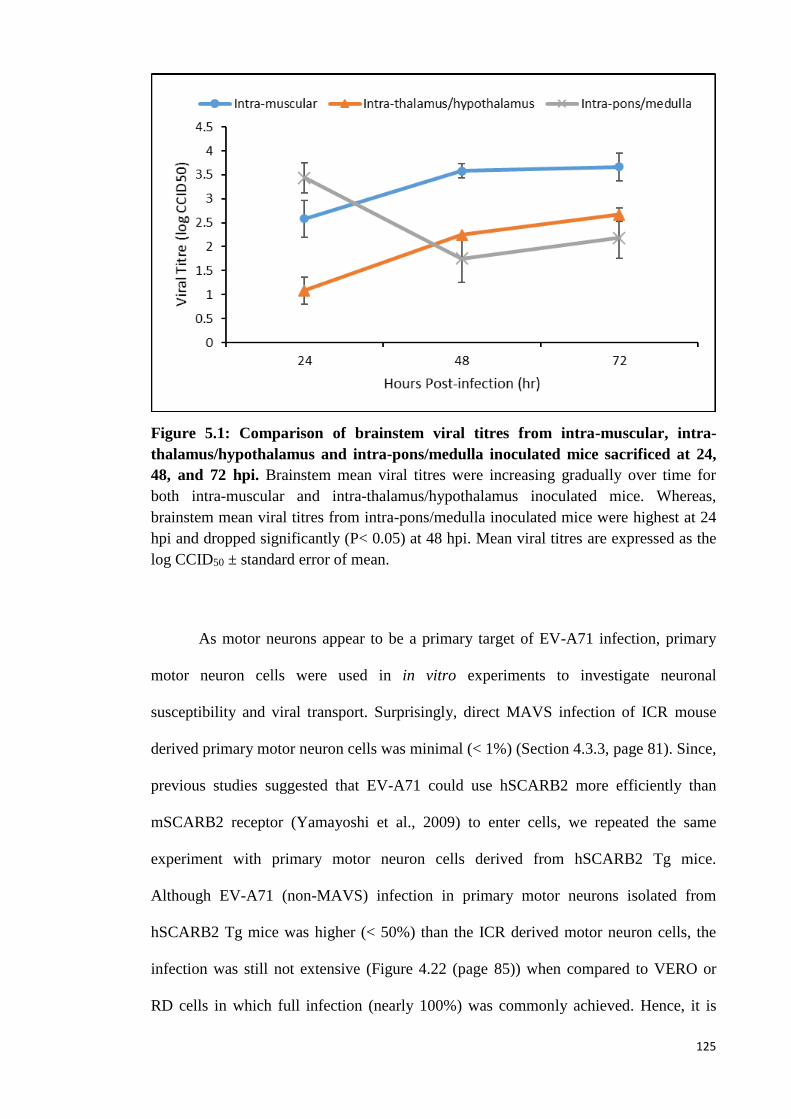
125
Figure 5.1: Comparison of brainstem viral titres from intra-muscular, intra-
thalamus/hypothalamus and intra-pons/medulla inoculated mice sacrificed at 24,
48, and 72 hpi. Brainstem mean viral titres were increasing gradually over time for
both intra-muscular and intra-thalamus/hypothalamus inoculated mice. Whereas,
brainstem mean viral titres from intra-pons/medulla inoculated mice were highest at 24
hpi and dropped significantly (P< 0.05) at 48 hpi. Mean viral titres are expressed as the
log CCID50 ± standard error of mean.
As motor neurons appear to be a primary target of EV-A71 infection, primary
motor neuron cells were used in in vitro experiments to investigate neuronal
susceptibility and viral transport. Surprisingly, direct MAVS infection of ICR mouse
derived primary motor neuron cells was minimal (< 1%) (Section 4.3.3, page 81). Since,
previous studies suggested that EV-A71 could use hSCARB2 more efficiently than
mSCARB2 receptor (Yamayoshi et al., 2009) to enter cells, we repeated the same
experiment with primary motor neuron cells derived from hSCARB2 Tg mice.
Although EV-A71 (non-MAVS) infection in primary motor neurons isolated from
hSCARB2 Tg mice was higher (< 50%) than the ICR derived motor neuron cells, the
infection was still not extensive (Figure 4.22 (page 85)) when compared to VERO or
RD cells in which full infection (nearly 100%) was commonly achieved. Hence, it is
126
possible that our murine primary motor neuron cells derived from hSCARB2 Tg mice
were more susceptible to EV-A71 infections, because the hSCARB2 was more efficient
for viral entry compared to mSCARB2 (Yamayoshi et al., 2009). The relatively lower
infection rate of hSCARB2 Tg mouse neurons compared to VERO and RD cells were
similar to in vitro findings reported by H. I. Huang et al. (2014) and Yap et al. (2016).
Using motor neurons derived from human neural stem cell or neural progenitor cells,
they reported that differentiated neuronal cells were less susceptible to EV-A71
infection. They speculated that poor susceptibility of differentiated cells could be
associated with deficiency of appropriate EV-A71 receptors, or reduced mitotic rate of
these cells as was shown in Coxsackievirus infection. These may partially explain the
pathological findings in both IC inoculated mice (thalamus/hypothalamus, section
4.3.1.1 (page 68), and pons/medulla, section 4.3.2.1 (page 74)), where non-neuronal
cells around the needle tract such as glial cells or astrocytes were more infected than
neuronal cells with apparently little or no cell-to-cell viral spread (centrifugal spread).
Using the microfluidic chamber culture system, axons of hSCARB2 motor
neurons were directed to grow away from respective neuronal bodies into a fluidically
isolated environment, designated as axon terminal chamber (contained only axon
terminals). Whereas, the original motor neuron cells seeding chamber was designated as
cell body chamber (contained mainly cell bodies). When virus was introduced into the
axon terminal chamber, replicating virus was detected in the cell body chamber (Figure
4.23 page 86). In contrast, no replicating virus was detected in the axon terminal
chamber after introduction of virus into the cell body chamber. In addition, cell body
chamber viral titres did not show significant differences at all timepoints implying
replication of EV-A71 in neuronal cells may be limited. Overall, this strongly suggests
retrograde axonal transport of virus from axon terminal to cell body but not in the
reverse direction. It is well known that microtubules are oriented with the (+) end at
127
axon terminal, and the (−) end toward the cell body. The kinesin family of motor
proteins generally mediates (+) end-directed anterograde transport (from the cell body
to the axon terminus), and dynein motor complexes generally mediate (−) end-directed
retrograde transport (from axon terminus to cell body). If it is true that EV-A71 is
transported in a retrograde fashion, after axonal terminal entry, virus particles must use
the dynein motor complexes to move along microtubules toward the cell body (Kapitein
& Hoogenraad, 2011). It has been found that another picornavirus, poliovirus, binds the
dynein light chain Tctex-1 to engage the retrograde transport machinery (Ohka et al.,
2004) via the poliovirus cellular receptor, CD155, which is endocytosed along with the
virion. However, other neurotropic viruses such as the rabies virus could directly bind to
the LC8 dynein light chain (part of the dynein motor complexes) for retrograde
transport, without endocytic vesicles. As there is no information about EV-A71
retrograde transport to date, further investigations are needed. We also speculate that the
virus may not utilise the kinesin motor complexes for anterograde transport as shown by
our microfluidic chamber data.
Another possible explanation for no apparent anterograde transport of virus from
the neuronal cell body to the axon terminal (Figure 4.23 (page 86)) may be that viral
receptors, like SCARB2 and other receptor(s), are under or not expressed on the cell
body. It has been reported that many viral endocytic cellular receptors are concentrated
at nerve or axonal terminals including CD155 for poliovirus, and adenovirus receptor
for coxsackievirus (Koyuncu, Hogue, & Enquist, 2013) thus favouring retrograde
transport. Currently, we have no information on the distribution/expression of EV-A71
receptors on neuronal cell bodies and axon terminals in our Tg mouse.
In conclusion, at least in this mouse model, we believe the viral transmission
into the CNS is mainly due to retrograde axonal transport from peripheral nerves. Virus
spread into the CNS by a haematogenous/BBB route cannot be excluded completely,
128
since Volle et al. (2015) has found that human cerebral microvascular endothelial cells
were infectable by EV-A71. If a haematogenous/BBB route into the CNS is involved,
following viraemia, all CNS neurons should be theoretically more or less equally
exposed to virus, and therefore have a similar chance to be infected. In all our mouse in
vivo infection experiments, although there was high viraemia, widespread neuronal
infection, for example, in the isocortex (cerebral hemisphere), was not observed at all
time points. Instead, spinal cords and brainstem neurons were the most severely infected.
As we have discussed earlier, we also believe that neuronal infection may not be related
to the distribution/density of mSCARB2 (Yu et al., 2014). Moreover, our MAVS may
use an unknown non-mSCARB2 receptor (s) (Fields et al., 2013) for viral entry.
129
5.3 Enterovirus 71 Provocation Acute Flaccid Paralysis
Provocation poliomyelitis had been linked to multiple IM-injections of various
therapeutic agents or vaccines administered, predisposing patients who have concurrent
poliovirus infection to AFP (Gromeier & Wimmer, 1998). It was thought that injured
muscle tissues may increase poliovirus propagation and retrograde axonal transport up
the peripheral nerves to cause this phenomenon. We speculated that muscle trauma
could likewise predispose patients with EV-A71 infection to AFP similar to provocation
poliomyelitis.
Using a mouse model developed for the study of EV-A71 provocation AFP
(Section 4.5.1, page 87), the non-traumatised control mice only showed paralysis from
72 hpi onwards. In the repeatedly traumatised mouse group, the onset of paralysis was
no different from the control group. The degree of myositis and density of viral antigens
in skeletal muscles were the same between traumatised and non-traumatised groups.
Similarly, viral antigens in the spinal cords were the same. Hence, the results showed
that muscle injury did not seem to lead to increased viral replication in skeletal muscles
and spinal cords, or increased retrograde transmission, suggesting that EV-A71
provocation AFP did not occur.
Using an IV-inoculated, CD155-Tg mouse model for poliovirus infection, it was
found that poliovirus replicated efficiently in the traumatised muscles but not at all in
non-traumatised muscles (Gromeier & Wimmer, 1998). This increase of virus growth in
traumatised muscles was thought to increase retrograde axonal transport of poliovirus
into the spinal cord to give rise to provocation poliomyelitis. The authors speculated
that this may be due to increased poliovirus cellular binding in the muscles or increased
viral load within inflamed muscle as a result of infiltrating inflammatory cells which
were virus infected (Gromeier & Wimmer, 1998). Although EV-A71 possibly shares
130
the same retrograde axonal transmission pathway into the CNS, we are uncertain why
our model did not show any evidence of provocation AFP. One possible reason may be
the early and extensive infection in non-traumatised skeletal muscle seen in our model,
may have obscured any further increase of viral replication as a result of trauma. As far
as we are aware, EV-A71 provocation AFP has never been reported in humans but we
believe it still remains a possibility. In human EV-A71 infection, there is apparently no
evidence of myositis or skeletal muscle infection (Ong & Wong, 2015) but just like in
the poliovirus Tg mouse model, IM-injections may increase viral replication in skeletal
muscles leading to provocation paralysis.
131
5.4 Infectivity of EV-A71 (MAVS) in non-neuronal tissues
In our MAVS mouse model, skeletal muscle fibres showed remarkable degeneration,
necrosis, varying degrees of inflammation and viral antigens/RNA. Although skeletal
muscle infection has not been found in humans so far, EV-A71 had been reported to
exhibit strong myotropism in mouse, hamster, monkey and gerbil models infected with
clinical isolates of EV-A71 and/or adapted virus strains (Phyu et al., 2016; Y. F. Wang
& Yu, 2014). Tg and immuno-deficient mouse models also showed myotropism (Y. F.
Wang & Yu, 2014). Interestingly, skeletal muscle infection was reported in younger
mice only (Y. F. Wang & Yu, 2014). In addition, human rhabdomyosarcoma cell lines
(neoplastic cells with skeletal muscle differentiation) are readily susceptible to EV-A71,
and have been used extensively by other investigators and us for virus isolation and
detection (Leong & Chow, 2006).
We produced a light-sensitive virus which could infect and replicate in cells as
usual, but newly-synthesised viruses will not be light-sensitive. Therefore, light-
protected virus titres would include both original and newly-synthesised virus, whereas
light-treated virus titres were all newly-synthesised viruses. The results in section 4.5.2
(page 92) demonstrated a high replication rate of virus in skeletal muscles, and light-
treated virus titres were not significantly (P< 0.05) different from light-protected titres
at all time points. Thus, most of the isolated viruses were newly-synthesised (> 90%).
Furthermore, virus isolated from the lower spinal cords were mostly newly-synthesised
viruses (Figure 4.27, page 91). These results suggested that the inoculated virus
replicated very efficiently in the injected muscles to produce a large amount of virus
progeny which then underwent retrograde transport to the lower spinal cord. These
observations confirmed the IHC and ISH findings that skeletal muscles are highly
susceptible to infection. The exact pathogenic mechanisms involved in the skeletal
132
muscle infection and injury by EV-A71, and its role in retrograde axonal transport into
the CNS is currently unknown (section 5.1, page 114).
Similar to the skeletal muscle infection, EV-A71 could replicate extensively in
murine brown adipose tissues, which was also seen in coxsackieviruses,
cytomegalovirus and rabies (Aronson & Shwartzman, 1956; Botvinkin, Nikiforova, &
Sidorov, 1985; Bruggeman, Bruning, Grauls, van den Bogaard, & Bosman, 1987;
Roberts & Boyd, 1987). In the mouse model, both skeletal muscle and brown adipose
tissue infection are probably important primary replication sites contributing to
persistent high viraemia. Again, there is no information on viral replication in human
adipose tissues so far. If human brown adipose tissues could be readily infected by EV-
A71, it is conceivable that the young children who have higher amounts of brown
adipose tissues, could be predisposed to higher viraemia, and presumably more severe
infection.
In our mouse model, skin lesions were absent with no evidence of squamous
epithelial cell infection. A few researchers had made observations of skin lesions in
their animal models. However, to date, only 2 groups had found viral antigens/RNA in
skin epidermis in a hamster model (Phyu et al., 2016) and a Tg mouse model (Fujii et
al., 2013). Currently, there is no data on human epidermal squamous cell infection but
virus has been cultured in fluid from skin vesicles suggesting that human epidermis is
also susceptible to infection. Hence, the epidermis could be an important secondary
viral replication site contributing significantly to viraemia.
In our mouse model, other major organs, including oral mucosa, gastrointestinal
tissues, pancreas, liver, heart, lung, kidney, thymus, lymph nodes, Peyer’s patches and
spleen were all negative for viral antigens/RNA. These observations had been reported
in many different mouse models (Y. F. Wang & Yu, 2014). Interestingly, using the
133
same MAVS on a hamster model, Phyu et al. (2016), found widespread viral
antigens/RNA in the squamous epithelium of the oral cavity and tongue but not in any
large extent in gastrointestinal mucosa. Similarly, Fujii et al. (2013) also reported viral
antigens in oral mucosa of a Tg mouse model. These recent findings are consistent with
oropharyngeal lesions in HFMD and herpangina, and the fact that viruses could be
readily isolated from throat swabs. In fact, higher oral viral yields than rectal swabs
were often obtained (M. H. Ooi, Solomon, et al., 2007). Hence, it is probable that the
virus first infects and undergoes primary replication in the oral cavity, although viral
antigens within human oral mucosa has not been demonstrated before. Recently, Y. He
et al. (2014) had shown the presence of viral antigens/RNA in human tonsillar crypt
squamous epithelia, and suggested this as another important source of primary
replication and oral viral shedding. In addition, salivary and lacrimal gland acinar cells
in the hamster model can be infected suggesting that salivary and tear secretions could
contribute to virus shedding, respectively.
In our mouse and other animal models, myocarditis and/or viral antigens/RNA
were generally absent, or if present, usually very mild and focal, similar to human
findings. Lymphoid cells found in lymph nodes, spleen, and Peyer’s patches (small
intestine) may showed focal viral antigens/RNA and positive virus isolation in some of
the animal models (Khong et al., 2012; Y. F. Wang & Yu, 2014; Zhang et al., 2011),
including the Tg mouse model (Fujii et al., 2013) but so far there is no convincing
evidence for antigens/RNA localisation in human lymphoid tissues. Further studies are
needed to confirm if lymphoid tissues are significant replication sites as was assumed to
be the case in poliovirus infection.
In conclusion, despite the relatively restricted tissue tropism compared to the
hamster model and Tg mouse model, we believe our mouse model is useful to study
134
neuroinvasion and neuropathogenesis because the CNS findings were very similar to the
pathology of human EV-A71 encephalomyelitis.
5.5 Prevention and treatment of EV-A71 CNS infection
Fatal EV-A71 encephalomyelitis and AFP often occur suddenly and within a few days
of infection. Clinical observations suggested that some patients who are more likely to
develop severe or fatal complications can be identified (C. C. Huang et al., 1999). In
these patients, early preventive antiviral treatment could potentially reduce mortality
and serious sequelae (M. H. Ooi, Wong, Lewthwaite, Cardosa, & Solomon, 2010).
Since no licensed vaccines or effective antivirals are available, neutralising antibodies
and other treatment modalities may be useful for this purpose.
Several recent studies have demonstrated that treatment with specific polyclonal
antibodies and MAbs were able to confer partial or complete protection to
experimentally-infected mice, when given shortly after or before EV-A71 challenge
(Table 5.3) (Bek et al., 2011; G. H. Chang et al., 2010; H. W. Chang et al., 2013; Foo et
al., 2007; Y. X. Li et al., 2014; Z. Li et al., 2014; Liou et al., 2010; Ng et al., 2015; Tian
et al., 2012; Xu et al., 2014). However, none of these studies have evaluated the
effectiveness of treatment after encephalomyelitis has been established by CNS viral
culture and/or demonstration of viral antigens/RNA. Instead, previous studies evaluated
the effectiveness of treatment based solely on survival/health scores of murine models.
This may not be sufficient since myositis as well as CNS infection is often severe in
these models, and observed limb weakness/paralysis could be due to myositis and/or
CNS infection. Incidentally, human EV71-associated myositis has not been reported so
far, and encephalomyelitis is believed to be one of the major causes of death in EV71
infection (K. T. Wong et al., 2008).
135
Our results showed that polyclonal antibodies could improve the survival rate of
IM-infected mice with proven encephalomyelitis, by significantly reducing CNS viral
titres and viral antigens/RNA (Figure 4.31, page 98; Figure 4.32, page 99). Furthermore,
the distribution of viral antigens/RNA were more restricted compared to mock-treated
controls. In addition, when polyclonal antibodies were given before MAVS infection,
CNS infection was prevented (4 hr before infection). This was also shown in other
studies (Deng et al., 2015; Dong et al., 2011; Kiener et al., 2014; Ong et al., 2010; Tian
et al., 2012; Zhao et al., 2013). Polyclonal antibodies seem to be able to control and
ameliorate CNS infection in a dose- and time- dependent manner.
Polyclonal antibodies are subject to limited quantities, and poor reproducibility
due to batch-to-batch variability in neutralising properties. In addition, inappropriate use
of polyclonal antibodies could lead to allergic reactions, kidney failure and other serious
complications (Orbach, Katz, Sherer, & Shoenfeld, 2005). Hence, we produced a MAb
against EV-A71 to test on our IP-infected, 2-week-old mouse model, which consistently
developed CNS infection (as confirmed by viral titres and pathological analysis) as
early as 72 hpi and rapidly died at 120 hpi (Section 4.6.2, page 100).
All mice IP-treated at maximum doses of 120 µg of MAb before CNS infection
(treated at 24, 48 and 72 hpi) remained healthy throughout the experiment. Skeletal
muscle and brown adipose tissue infection were minimal, and CNS infection was
prevented (Figure 4.36, page 109). The absence of CNS viral titres and viral
antigens/RNA suggested that there was no significant CNS infection or retrograde
axonal viral transmission up peripheral motor nerves. Inhibition of viraemia and viral
replication by MAb were most probably responsible for this. Other previous studies in
which pre-infection antibody treatments were given also prevented limb paralysis with
no reported mortality (Deng et al., 2015; Dong et al., 2011; Kiener et al., 2014; Ng et al.,
2015; Ong et al., 2010; Tian et al., 2012; Zhao et al., 2013).
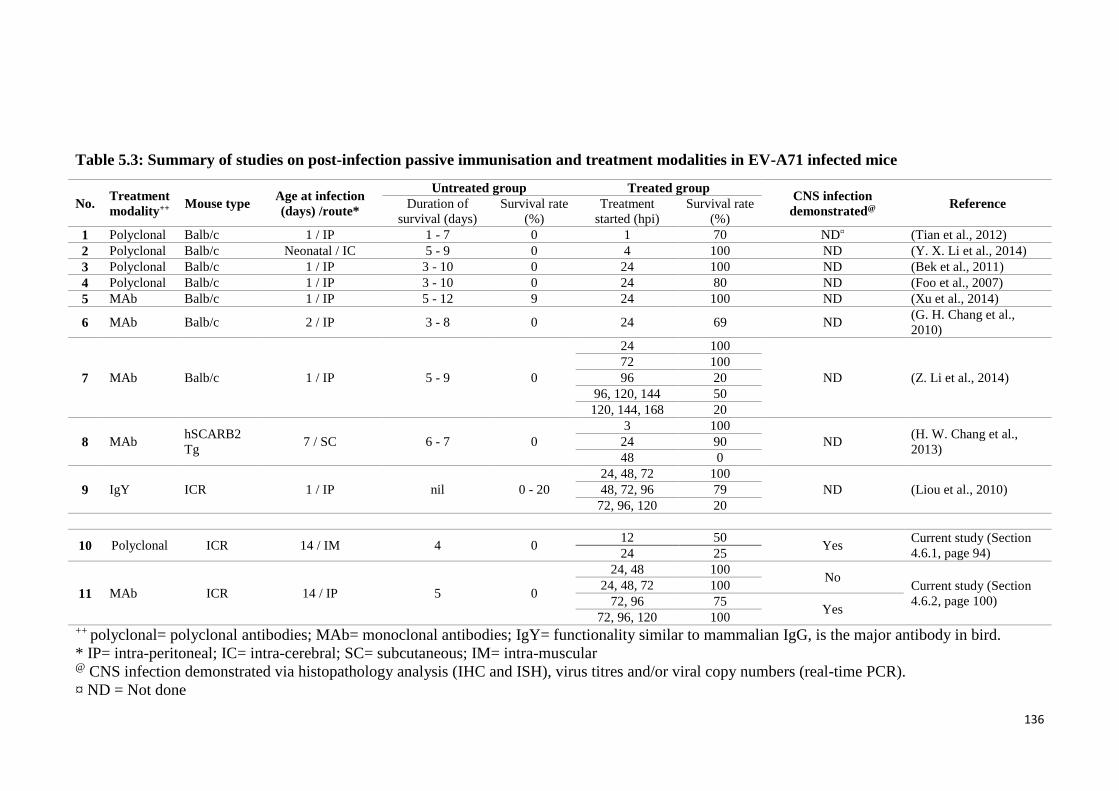
136
Table 5.3: Summary of studies on post-infection passive immunisation and treatment modalities in EV-A71 infected mice
No. Treatment
modality++ Mouse type
Age at infection
(days) /route*
Untreated group Treated group CNS infection
demonstrated@ Reference Duration of
survival (days)
Survival rate
(%)
Treatment
started (hpi)
Survival rate
(%)
1 Polyclonal Balb/c 1 / IP 1 - 7 0 1 70 ND¤ (Tian et al., 2012)
2 Polyclonal Balb/c Neonatal / IC 5 - 9 0 4 100 ND (Y. X. Li et al., 2014)
3 Polyclonal Balb/c 1 / IP 3 - 10 0 24 100 ND (Bek et al., 2011)
4 Polyclonal Balb/c 1 / IP 3 - 10 0 24 80 ND (Foo et al., 2007)
5 MAb Balb/c 1 / IP 5 - 12 9 24 100 ND (Xu et al., 2014)
6 MAb Balb/c 2 / IP 3 - 8 0 24 69 ND (G. H. Chang et al.,
2010)
7 MAb Balb/c 1 / IP 5 - 9 0
24 100
ND (Z. Li et al., 2014)
72 100
96 20
96, 120, 144 50
120, 144, 168 20
8 MAb hSCARB2
Tg 7 / SC 6 - 7 0
3 100
ND (H. W. Chang et al.,
2013) 24 90
48 0
9 IgY ICR 1 / IP nil 0 - 20
24, 48, 72 100
ND (Liou et al., 2010) 48, 72, 96 79
72, 96, 120 20
10 Polyclonal ICR 14 / IM 4 0 12 50
Yes Current study (Section
4.6.1, page 94) 24 25
11 MAb ICR 14 / IP 5 0
24, 48 100 No
Current study (Section
4.6.2, page 100)
24, 48, 72 100
72, 96 75 Yes
72, 96, 120 100 ++ polyclonal= polyclonal antibodies; MAb= monoclonal antibodies; IgY= functionality similar to mammalian IgG, is the major antibody in bird.
* IP= intra-peritoneal; IC= intra-cerebral; SC= subcutaneous; IM= intra-muscular @ CNS infection demonstrated via histopathology analysis (IHC and ISH), virus titres and/or viral copy numbers (real-time PCR).
¤ ND = Not done
137
We found that optimal MAb treatment was still useful to ameliorate disease
even after CNS infection was established at 72 hpi. Mice given the 3-dose regime (at 72,
96 and 120 hpi) (Table 5.3) showed lower clinical scores compared to mock-treated
control mice (all mice were moribund and sacrificed at 96 hpi) (Figure 4.34, page 105).
Even at 144 hpi (a day after the treatment was completed), viral titres/RNA and antigens
from sacrificed animals were significantly lower in all tissues examined compared to
mock-treated animals sacrificed at 96 hpi (Figure 4.37 (page 111), 4.38, (page 111),
4.39, (page 112)). Moreover, viral antigens/RNA were restricted to smaller areas of the
brainstem and hypothalamus (Figure 4.35, page 108). In the 4 animals from the same
experiment which were not sacrificed at 144 hpi but followed up for 21 dpi, only a
single mouse showed minor weakness on both hindlimbs, while the others recovered
completely from limb paralysis. As expected, mice treated earlier at 24, 48 and 72 hpi,
presented better clinical scores and no evidence of CNS infection (Table 5.3).
Although not directly comparable to our studies, most other studies showed a
similar dose- and time-dependent response to treatment (Table 5.3). Z. Li et al. (2014)
tested a 3-dose treatment protocol on infected mice, in a study whose design is similar
to ours although their untreated mice survived infection longer, from 5 to 9 dpi. An
increase in treatment dose and frequency, had increased the survival rate from 20% to
50%. Surviving mice were either healthy throughout the experiment or showed only
minor paralysis/reduced body weight, followed by complete recovery at 21 dpi.
Unfortunately, no information on CNS infection was available.
Although the mechanism of virus elimination from the CNS is uncertain,
theoretically, the antibodies could i) reduce neuronal infection, by reducing retrograde
axonal transport into the CNS; ii) by eliminating viruses in infected neurons; and iii) by
preventing viral spread from infected to uninfected neurons. Whether these antibodies
were involved in virus elimination from infected neurons or prevention of virus spread
138
in the CNS parenchyma is uncertain, as it is generally assumed that IgM is too large to
cross the healthy BBB into the CNS. However, alteration of BBB permeability as a
result of pro-inflammatory cytokines such as TNF, IL-1β and IL-6, could allow
antibodies to enter the CNS parenchyma (de Vries, Kuiper, de Boer, Van Berkel, &
Breimer, 1997). Alternatively, as shown in, previous studies the rat BBB is not fully
developed until four weeks postnatal (Schulze & Firth, 1992). The immature BBB in 2-
week-old mice may facilitate movement of antibodies into the parenchyma (Saunders,
Liddelow, & Dziegielewska, 2012). Whether some or all these factors could impact on
future successful development of antibody therapy using the same approach in patients
needs to be further investigated.
In conclusion, our results highlight the potential use of MAbs as an effective
treatment for EV-A71 before and after CNS infection in our mouse model. Further
investigations are needed to determine the usefulness of a humanised monoclonal IgG
as a prophylactic and/or therapeutic agent against EV-A71 encephalomyelitis.
139
6.0 Conclusion
EV-A71 could cause rapid and direct brainstem infection, most likely via retrograde
axonal transport in the motor components of cranial nerves in our EV-A71
encephalomyelitis mouse model. Surprisingly, direct inoculation of virus into the CNS
parenchyma, including the brainstem, did not result in efficient neuron-to-neuron
centrifugal spread from the needle tract. Moreover, there appears to be no clear
correlation between mSCARB2 and EV-A71 antigen distribution suggesting possible
involvement of other unknown viral entry receptors and/or co-receptors. EV-A71
provocation AFP, if any, could not be demonstrated in our mouse model as there was no
significant increased viral infection of the spinal cord following muscle traumatic injury.
CNS infection by EV-A71 can be prevented and established CNS infection ameliorated
by neutralising MAb. All treated mice with CNS infection survived with better clinical
scores and less pathological changes and evidence of virus infection.
7.0 Limitation and future studies
1. Experimentally infected mice may not be able to model human infection completely.
Since pulmonary oedema and skin lesions were not observed in our mouse model.
However neuronotropism in the CNS shared many features with human
encephalomyelitis. Hence, our mouse model remains valid and useful for gaining
further insights into EV-A71 neuropathogenesis. Nonetheless, our findings should
be confirmed in more recently described transgenic mouse model (Fujii et al., 2013)
or orally-infected hamster model (Phyu et al., 2016).
2. The mechanisms of retrograde axonal transport in EV-A71 CNS infection,viral
transport across neuromuscular junction and transsynaptic transmission need to be
investigated.
140
3. The relatively low infectivity of motor neuron cell bodies should be further
investigated.
4. EV-A71 provocation AFP was not shown in our mouse model could be due to early
and extensive infection in non-traumatised muscle. The experiment could be
repeated with transgenic mouse model which demonstrated lesser muscle infection
(Fujii et al., 2013).
5. Mouse MAb was not fully characterised and its mechanism of action is not clear.
Further investigations are needed to determine the usefulness of a humanised MAb
as a therapeutic agent against human EV-A71 encephalomyelitis.
141
References
Adams, M. J., King, A. M., & Carstens, E. B. (2013). Ratification vote on taxonomic
proposals to the International Committee on Taxonomy of Viruses (2013). Arch
Virol, 158(9), 2023-2030.
Arita, M., Ami, Y., Wakita, T., & Shimizu, H. (2008). Cooperative effect of the
attenuation determinants derived from poliovirus sabin 1 strain is essential for
attenuation of enterovirus 71 in the NOD/SCID mouse infection model. J Virol,
82(4), 1787-1797.
Arita, M., Nagata, N., Iwata, N., Ami, Y., Suzaki, Y., Mizuta, K., . . . Shimizu, H.
(2007). An attenuated strain of enterovirus 71 belonging to genotype a showed a
broad spectrum of antigenicity with attenuated neurovirulence in cynomolgus
monkeys. J Virol, 81(17), 9386-9395.
Arita, M., Shimizu, H., Nagata, N., Ami, Y., Suzaki, Y., Sata, T., . . . Miyamura, T.
(2005). Temperature-sensitive mutants of enterovirus 71 show attenuation in
cynomolgus monkeys. J Gen Virol, 86(5), 1391-1401.
Aronson, S. M., & Shwartzman, G. (1956). The histopathology of brown fat in
experimental poliomyelitis. Am J Pathol, 32(2), 315-333.
Baker, A. B. (1957). Poliomyelitis. 16. A study of pulmonary edema. Neurology, 7(11),
743-751.
Bedard, K. M., & Semler, B. L. (2004). Regulation of picornavirus gene expression.
Microbes Infect, 6(7), 702-713.
Bek, E. J., Hussain, K. M., Phuektes, P., Kok, C. C., Gao, Q., Cai, F., . . . McMinn, P. C.
(2011). Formalin-inactivated vaccine provokes cross-protective immunity in a
mouse model of human enterovirus 71 infection. Vaccine, 29(29-30), 4829-4838.
Botvinkin, A. D., Nikiforova, T. A., & Sidorov, G. N. (1985). Experimental rabies in
hibernator rodents. Acta Virol, 29(1), 44-50.
Brown, B. A., Oberste, M. S., Alexander, J. P., Jr., Kennett, M. L., & Pallansch, M. A.
(1999). Molecular epidemiology and evolution of enterovirus 71 strains isolated
from 1970 to 1998. J Virol, 73(12), 9969-9975.
Bruggeman, C. A., Bruning, J. H., Grauls, G., van den Bogaard, A. E., & Bosman, F.
(1987). Presence of cytomegalovirus in brown fat. Study in a rat model.
Intervirology, 27(1), 32-37.
Caine, E. A., Partidos, C. D., Santangelo, J. D., & Osorio, J. E. (2013). Adaptation of
enterovirus 71 to adult interferon deficient mice. PLoS One, 8(3), e59501.
Cao, R., Han, J., Deng, Y., Yu, M., Qin, E., & Qin, C. (2010). Presence of high-titer
neutralizing antibodies against enterovirus 71 in intravenous immunoglobulin
manufactured from Chinese donors. Clin Infect Dis, 50(1), 125-126.
142
Cao, R., Han, J., Qin, E., & Qin, C. (2011). [Mechanism of intravenous
immunoglobulin therapy for severe hand-foot-mouth disease: a review]. Sheng
Wu Gong Cheng Xue Bao, 27(5), 712-716.
Cao, R. Y., Dong, D. Y., Liu, R. J., Han, J. F., Wang, G. C., Zhao, H., . . . Qin, C. F.
(2013). Human IgG subclasses against enterovirus Type 71: neutralization
versus antibody dependent enhancement of infection. PLoS One, 8(5), e64024.
Cardosa, M. J., Perera, D., Brown, B. A., Cheon, D., Chan, H. M., Chan, K. P., . . .
McMinn, P. (2003). Molecular epidemiology of human enterovirus 71 strains
and recent outbreaks in the Asia-Pacific region: comparative analysis of the VP1
and VP4 genes. Emerg Infect Dis, 9(4), 461-468.
Chang, G. H., Luo, Y. J., Wu, X. Y., Si, B. Y., Lin, L., & Zhu, Q. Y. (2010).
Monoclonal antibody induced with inactived EV71-Hn2 virus protects mice
against lethal EV71-Hn2 virus infection. Virol J, 7, 106.
Chang, H. W., Lin, Y. W., Ho, H. M., Lin, M. H., Liu, C. C., Shao, H. Y., . . . Chow, Y.
H. (2013). Protective efficacy of VP1-specific neutralizing antibody associated
with a reduction of viral load and pro-inflammatory cytokines in human
SCARB2-transgenic mice. PLoS One, 8(7), e69858.
Chang, S. C., Lin, J. Y., Lo, L. Y., Li, M. L., & Shih, S. R. (2004). Diverse apoptotic
pathways in enterovirus 71-infected cells. J Neurovirol, 10(6), 338-349.
Chen, C. S., Yao, Y. C., Lin, S. C., Lee, Y. P., Wang, Y. F., Wang, J. R., . . . Yu, C. K.
(2007). Retrograde axonal transport: a major transmission route of enterovirus
71 in mice. J Virol, 81(17), 8996-9003.
Chen, F., Li, J. J., Liu, T., Wen, G. Q., & Xiang, W. (2013). Clinical and neuroimaging
features of enterovirus71 related acute flaccid paralysis in patients with hand-
foot-mouth disease. Asian Pac J Trop Med, 6(1), 68-72.
Chen, H., Zhang, Y., Yang, E., Liu, L., Che, Y., Wang, J., . . . Li, Q. (2012). The effect
of enterovirus 71 immunization on neuropathogenesis and protein expression
profiles in the thalamus of infected rhesus neonates. Virology, 432(2), 417-426.
Chen, N., & Reis, C. S. (2002). Distinct roles of eicosanoids in the immune response to
viral encephalitis: or why you should take NSAIDS. Viral Immunol, 15(1), 133-
146.
Chen, P., Song, Z., Qi, Y., Feng, X., Xu, N., Sun, Y., . . . Li, W. (2012). Molecular
determinants of enterovirus 71 viral entry: cleft around GLN-172 on VP1
protein interacts with variable region on scavenge receptor B 2. J Biol Chem,
287(9), 6406-6420.
Chen, Y. C., Yu, C. K., Wang, Y. F., Liu, C. C., Su, I. J., & Lei, H. Y. (2004). A murine
oral enterovirus 71 infection model with central nervous system involvement. J
Gen Virol, 85(1), 69-77.
143
Chu, W. M., Ostertag, D., Li, Z. W., Chang, L., Chen, Y., Hu, Y., . . . Karin, M. (1999).
JNK2 and IKKbeta are required for activating the innate response to viral
infection. Immunity, 11(6), 721-731.
Chua, B. H., Phuektes, P., Sanders, S. A., Nicholls, P. K., & McMinn, P. C. (2008). The
molecular basis of mouse adaptation by human enterovirus 71. J Gen Virol,
89(7), 1622-1632.
Chua, K. B., Chua, B. H., Lee, C. S., Chem, Y. K., Ismail, N., Kiyu, A., & Kumarasamy,
V. (2007). Genetic diversity of enterovirus 71 isolated from cases of hand, foot
and mouth disease in the 1997, 2000 and 2005 outbreaks, Peninsular Malaysia.
Malays J Pathol, 29(2), 69-78.
Chung, C. Y., Chen, C. Y., Lin, S. Y., Chung, Y. C., Chiu, H. Y., Chi, W. K., . . . Hu, Y.
C. (2010). Enterovirus 71 virus-like particle vaccine: improved production
conditions for enhanced yield. Vaccine, 28(43), 6951-6957.
Collins, F. M. (1974). Vaccines and cell-mediated immunity. Bacteriol Rev, 38(4), 371-
402.
Conn, P. Michael, & SpringerLink. (2008). Neuroscience in medicine (3rd ed.). Totowa,
NJ: Humana Press.
de Vries, H. E., Kuiper, J., de Boer, A. G., Van Berkel, T. J., & Breimer, D. D. (1997).
The blood-brain barrier in neuroinflammatory diseases. Pharmacol Rev, 49(2),
143-155.
Deng, Y. Q., Ma, J., Xu, L. J., Li, Y. X., Zhao, H., Han, J. F., . . . Qin, C. F. (2015).
Generation and characterization of a protective mouse monoclonal antibody
against human enterovirus 71. Appl Microbiol Biotechnol, 99(18), 7663-7671.
Dong, C., Liu, L., Zhao, H., Wang, J., Liao, Y., Zhang, X., . . . Li, Q. (2011).
Immunoprotection elicited by an enterovirus type 71 experimental inactivated
vaccine in mice and rhesus monkeys. Vaccine, 29(37), 6269-6275.
Dotzauer, A., & Kraemer, L. (2012). Innate and adaptive immune responses against
picornaviruses and their counteractions: An overview. World J Virol, 1(3), 91-
107.
Elgert, K.D. (2009). Immunology: Understanding The Immune System. New York:
Wiley.
Fan, P., Li, X., Sun, S., Su, W., An, D., Gao, F., . . . Jiang, C. (2015). Identification of a
common epitope between enterovirus 71 and human MED25 proteins which
may explain virus-associated neurological disease. Viruses, 7(4), 1558-1577.
Fields, B.N., Knipe, D.M., & Howley, P.M. (2013). Fields Virology (6th ed.): United
kingdon: Wolters Kluwer Health.
Foo, D. G., Alonso, S., Chow, V. T., & Poh, C. L. (2007). Passive protection against
lethal enterovirus 71 infection in newborn mice by neutralizing antibodies
elicited by a synthetic peptide. Microbes Infect, 9(11), 1299-1306.
144
Fu, Y. C., Chi, C. S., Chiu, Y. T., Hsu, S. L., Hwang, B., Jan, S. L., . . . Chang, Y.
(2004). Cardiac complications of enterovirus rhombencephalitis. Arch Dis Child,
89(4), 368-373.
Fu, Y. C., Chi, C. S., Lin, N. N., Cheng, C. C., Jan, S. L., Hwang, B., . . . Chiu, Y. T.
(2006). Comparison of heart failure in children with enterovirus 71
rhombencephalitis and cats with norepinephrine cardiotoxicity. Pediatr Cardiol,
27(5), 577-584.
Fujii, K., Nagata, N., Sato, Y., Ong, K. C., Wong, K. T., Yamayoshi, S., . . . Koike, S.
(2013). Transgenic mouse model for the study of enterovirus 71
neuropathogenesis. Proc Natl Acad Sci U S A, 110(36), 14753-14758.
Gitlin, L., Barchet, W., Gilfillan, S., Cella, M., Beutler, B., Flavell, R. A., . . . Colonna,
M. (2006). Essential role of mda-5 in type I IFN responses to
polyriboinosinic:polyribocytidylic acid and encephalomyocarditis picornavirus.
Proc Natl Acad Sci U S A, 103(22), 8459-8464.
Gong, X., Zhou, J., Zhu, W., Liu, N., Li, J., Li, L., . . . Duan, Z. (2012). Excessive
proinflammatory cytokine and chemokine responses of human monocyte-
derived macrophages to enterovirus 71 infection. BMC Infect Dis, 12, 224.
Gorson, K. C., & Ropper, A. H. (2001). Nonpoliovirus poliomyelitis simulating
Guillain-Barre syndrome. Arch Neurol, 58(9), 1460-1464.
Gromeier, M., & Wimmer, E. (1998). Mechanism of injury-provoked poliomyelitis. J
Virol, 72(6), 5056-5060.
Han, J. F., Cao, R. Y., Deng, Y. Q., Tian, X., Jiang, T., Qin, E. D., & Qin, C. F. (2011).
Antibody dependent enhancement infection of enterovirus 71 in vitro and in
vivo. Virol J, 8, 106.
He, D. L., Xia, N. S., Xu, F. H., Cheng, T., Weng, Z. X., Ge, S. X., . . . Chen, Z. M. .
(2012). Enterovirus 71 neutralized epitope polypeptide and application thereof:
Google Patents.
He, Y., Ong, K. C., Gao, Z., Zhao, X., Anderson, V. M., McNutt, M. A., . . . Lu, M.
(2014). Tonsillar crypt epithelium is an important extra-central nervous system
site for viral replication in EV71 encephalomyelitis. Am J Pathol, 184(3), 714-
720.
Heimer, Lennart. (1995). The human brain and spinal cord : functional neuroanatomy
and dissection guide (2nd ed.). New York ; London: Springer.
Hemming, V. G. (2001). Use of intravenous immunoglobulins for prophylaxis or
treatment of infectious diseases. Clin Diagn Lab Immunol, 8(5), 859-863.
Hinson, V. K., & Tyor, W. R. (2001). Update on viral encephalitis. Curr Opin Neurol,
14(3), 369-374.
Ho, M. (2000). Enterovirus 71: the virus, its infections and outbreaks. J Microbiol
Immunol Infect, 33(4), 205-216.
145
Hoff, J. T., Nishimura, M., Garcia-Uria, J., & Miranda, S. (1981). Experimental
neurogenic pulmonary edema. Part 1: The role of systemic hypertension. J
Neurosurg, 54(5), 627-631.
Huang, C. C. (2001). Neurologic complications of enterovirus 71 infection in children:
lessons from this Taiwan epidemic. Acta Paediatr Taiwan, 42(1), 5-7.
Huang, C. C., Liu, C. C., Chang, Y. C., Chen, C. Y., Wang, S. T., & Yeh, T. F. (1999).
Neurologic complications in children with enterovirus 71 infection. N Engl J
Med, 341(13), 936-942.
Huang, H. I., Lin, J. Y., Chen, H. H., Yeh, S. B., Kuo, R. L., Weng, K. F., & Shih, S. R.
(2014). Enterovirus 71 infects brain-derived neural progenitor cells. Virology,
468-470, 592-600.
Jackson, Alan C. (2013). Viral infections of the human nervous system Birkhäuser
advances in infectious diseases (pp. 1 online resource). Retrieved from
http://eproxy.lib.hku.hk/login?url=http://link.springer.com/openurl?genre=book
&isbn=978-3-0348-0424-0
Jarvis, D. L. (2009). Baculovirus-insect cell expression systems. Methods Enzymol, 463,
191-222.
Jiao, X. Y., Guo, L., Huang, D. Y., Chang, X. L., & Qiu, Q. C. (2014). Distribution of
EV71 receptors SCARB2 and PSGL-1 in human tissues. Virus Res, 190, 40-52.
John, T. J., & Vashishtha, V. M. (2013). Eradicating poliomyelitis: India's journey from
hyperendemic to polio-free status. Indian J Med Res, 137(5), 881-894.
Jolles, S., Sewell, W. A., & Misbah, S. A. (2005). Clinical uses of intravenous
immunoglobulin. Clin Exp Immunol, 142(1), 1-11.
Kao, S. J., Yang, F. L., Hsu, Y. H., & Chen, H. I. (2004). Mechanism of fulminant
pulmonary edema caused by enterovirus 71. Clin Infect Dis, 38(12), 1784-1788.
Kapitein, L. C., & Hoogenraad, C. C. (2011). Which way to go? Cytoskeletal
organization and polarized transport in neurons. Mol Cell Neurosci, 46(1), 9-20.
Kato, H., Takeuchi, O., Sato, S., Yoneyama, M., Yamamoto, M., Matsui, K., . . . Akira,
S. (2006). Differential roles of MDA5 and RIG-I helicases in the recognition of
RNA viruses. Nature, 441(7089), 101-105.
Kemball, C. C., Alirezaei, M., & Whitton, J. L. (2010). Type B coxsackieviruses and
their interactions with the innate and adaptive immune systems. Future
Microbiol, 5(9), 1329-1347.
Khong, W. X., Yan, B., Yeo, H., Tan, E. L., Lee, J. J., Ng, J. K., . . . Alonso, S. (2012).
A non-mouse-adapted enterovirus 71 (EV71) strain exhibits neurotropism,
causing neurological manifestations in a novel mouse model of EV71 infection.
J Virol, 86(4), 2121-2131.
146
Kiener, T. K., Jia, Q., Meng, T., Chow, V. T., & Kwang, J. (2014). A novel universal
neutralizing monoclonal antibody against enterovirus 71 that targets the highly
conserved "knob" region of VP3 protein. PLoS Negl Trop Dis, 8(5), e2895.
Kim, Y. I., Song, J. H., Kwon, B. E., Kim, H. N., Seo, M. D., Park, K., . . . Chang, S. Y.
(2015). Pros and cons of VP1-specific maternal IgG for the protection of
Enterovirus 71 infection. Vaccine, 33(48), 6604-6610.
Koyuncu, O. O., Hogue, I. B., & Enquist, L. W. (2013). Virus infections in the nervous
system. Cell Host Microbe, 13(4), 379-393.
Ku, Z., Ye, X., Huang, X., Cai, Y., Liu, Q., Li, Y., . . . Huang, Z. (2013). Neutralizing
antibodies induced by recombinant virus-like particles of enterovirus 71
genotype C4 inhibit infection at pre- and post-attachment steps. PLoS One, 8(2),
e57601.
Lancaster, K. Z., & Pfeiffer, J. K. (2010). Limited trafficking of a neurotropic virus
through inefficient retrograde axonal transport and the type I interferon response.
PLoS Pathog, 6(3), e1000791.
Lee, H., Cifuente, J. O., Ashley, R. E., Conway, J. F., Makhov, A. M., Tano, Y., . . .
Hafenstein, S. (2013). A strain-specific epitope of enterovirus 71 identified by
cryo-electron microscopy of the complex with fab from neutralizing antibody. J
Virol, 87(21), 11363-11370.
Lein, E. S., Hawrylycz, M. J., Ao, N., Ayres, M., Bensinger, A., Bernard, A., . . . Jones,
A. R. (2007). Genome-wide atlas of gene expression in the adult mouse brain.
Allen Mouse Brain Atlas. Retrieved from http://mouse.brain-
map.org/experiment/show/72081482
Leong, W. F., & Chow, V. T. (2006). Transcriptomic and proteomic analyses of
rhabdomyosarcoma cells reveal differential cellular gene expression in response
to enterovirus 71 infection. Cell Microbiol, 8(4), 565-580.
Levinson, W., & Jawetz, E. (1992). Medical Microbiology & Immunology: Examination
and Board Review. Boston: Appleton & Lange.
Li, M. L., Hsu, T. A., Chen, T. C., Chang, S. C., Lee, J. C., Chen, C. C., . . . Shih, S. R.
(2002). The 3C protease activity of enterovirus 71 induces human neural cell
apoptosis. Virology, 293(2), 386-395.
Li, Y. X., Zhao, H., Cao, R. Y., Deng, Y. Q., Han, J. F., Zhu, S. Y., . . . Qin, C. F.
(2014). Recombinant tandem multi-linear neutralizing epitopes of human
enterovirus 71 elicited protective immunity in mice. Virol J, 11, 79.
Li, Z., Xu, L., He, D., Yang, L., Liu, C., Chen, Y., . . . Xia, N. (2014). In Vivo Time-
Related Evaluation of a Therapeutic Neutralization Monoclonal Antibody
against Lethal Enterovirus 71 Infection in a Mouse Model. PLoS One, 9(10),
e109391.
147
Liang, C. C., Sun, M. J., Lei, H. Y., Chen, S. H., Yu, C. K., Liu, C. C., . . . Yeh, T. M.
(2004). Human endothelial cell activation and apoptosis induced by enterovirus
71 infection. J Med Virol, 74(4), 597-603.
Liang, Z., & Wang, J. (2014). EV71 vaccine, an invaluable gift for children. Clin Transl
Immunology, 3(10), e28.
Lim, X. F., Jia, Q., Khong, W. X., Yan, B., Premanand, B., Alonso, S., . . . Kwang, J.
(2012). Characterization of an isotype-dependent monoclonal antibody against
linear neutralizing epitope effective for prophylaxis of enterovirus 71 infection.
PLoS One, 7(1), e29751.
Lin, S. Y., Yeh, C. T., Li, W. H., Yu, C. P., Lin, W. C., Yang, J. Y., . . . Hu, Y. C.
(2015). Enhanced enterovirus 71 virus-like particle yield from a new baculovirus
design. Biotechnol Bioeng, 112(10), 2005-2015.
Lin, T. Y., Chang, L. Y., Hsia, S. H., Huang, Y. C., Chiu, C. H., Hsueh, C., . . . Wu, M.
H. (2002). The 1998 enterovirus 71 outbreak in Taiwan: pathogenesis and
management. Clin Infect Dis, 34 Suppl 2, S52-57.
Lin, T. Y., Chang, L. Y., Huang, Y. C., Hsu, K. H., Chiu, C. H., & Yang, K. D. (2002).
Different proinflammatory reactions in fatal and non-fatal enterovirus 71
infections: implications for early recognition and therapy. Acta Paediatr, 91(6),
632-635.
Lin, T. Y., Hsia, S. H., Huang, Y. C., Wu, C. T., & Chang, L. Y. (2003).
Proinflammatory cytokine reactions in enterovirus 71 infections of the central
nervous system. Clin Infect Dis, 36(3), 269-274.
Lin, Y. W., Wang, S. W., Tung, Y. Y., & Chen, S. H. (2009). Enterovirus 71 infection
of human dendritic cells. Exp Biol Med (Maywood), 234(10), 1166-1173.
Lin, Y. W., Yu, S. L., Shao, H. Y., Lin, H. Y., Liu, C. C., Hsiao, K. N., . . . Chow, Y. H.
(2013). Human SCARB2 transgenic mice as an infectious animal model for
enterovirus 71. PLoS One, 8(2), e57591.
Liou, J. F., Chang, C. W., Tailiu, J. J., Yu, C. K., Lei, H. Y., Chen, L. R., & Tai, C.
(2010). Passive protection effect of chicken egg yolk immunoglobulins on
enterovirus 71 infected mice. Vaccine, 28(51), 8189-8196.
Liu, C. C., Chou, A. H., Lien, S. P., Lin, H. Y., Liu, S. J., Chang, J. Y., . . . Chong, P.
(2011). Identification and characterization of a cross-neutralization epitope of
Enterovirus 71. Vaccine, 29(26), 4362-4372.
Liu, J., Dong, W., Quan, X., Ma, C., Qin, C., & Zhang, L. (2012). Transgenic
expression of human P-selectin glycoprotein ligand-1 is not sufficient for
enterovirus 71 infection in mice. Arch Virol, 157(3), 539-543.
Liu, L., Mo, Z., Liang, Z., Zhang, Y., Li, R., Ong, K. C., . . . Li, Q. (2015). Immunity
and clinical efficacy of an inactivated enterovirus 71 vaccine in healthy Chinese
children: a report of further observations. BMC Med, 13(1), 226.
148
Lu, M., Meng, G., He, Y. X., Zheng, J., Liao, S. L., Zhong, Y. F., . . . Gao, Z. F. (2009).
[Pathology of enterovirus 71 infection: an autopsy study of 5 cases]. Zhonghua
Bing Li Xue Za Zhi, 38(2), 81-85.
Lum, L. C., Wong, K. T., Lam, S. K., Chua, K. B., & Goh, A. Y. (1998). Neurogenic
pulmonary oedema and enterovirus 71 encephalomyelitis. Lancet, 352(9137),
1391.
Luo, S. T., Chiang, P. S., Chao, A. S., Liou, G. Y., Lin, R., Lin, T. Y., & Lee, M. S.
(2009). Enterovirus 71 maternal antibodies in infants, Taiwan. Emerg Infect Dis,
15(4), 581-584.
Mao, Q. Y., Wang, Y., Bian, L., Xu, M., & Liang, Z. (2016). EV71 vaccine, a new tool
to control outbreaks of hand, foot and mouth disease (HFMD). Expert Rev
Vaccines, 15(5), 599-606.
Mawdsley, S. E. (2014). Polio provocation: solving a mystery with the help of history.
Lancet, 384(9940), 300-301.
McMinn, P. C. (2002). An overview of the evolution of enterovirus 71 and its clinical
and public health significance. FEMS Microbiol Rev, 26(1), 91-107.
McMinn, P., Stratov, I., Nagarajan, L., & Davis, S. (2001). Neurological manifestations
of enterovirus 71 infection in children during an outbreak of hand, foot, and
mouth disease in Western Australia. Clin Infect Dis, 32(2), 236-242.
Meng, T., Kolpe, A. B., Kiener, T. K., Chow, V. T., & Kwang, J. (2011). Display of
VP1 on the surface of baculovirus and its immunogenicity against heterologous
human enterovirus 71 strains in mice. PLoS One, 6(7), e21757.
Nathanson, N., & Langmuir, A. D. (1995). The Cutter incident. Poliomyelitis following
formaldehyde-inactivated poliovirus vaccination in the United States during the
Spring of 1955. II. Relationship of poliomyelitis to Cutter vaccine. 1963. Am J
Epidemiol, 142(2), 109-140.
Ng, Q., He, F., & Kwang, J. (2015). Recent Progress towards Novel EV71 Anti-
Therapeutics and Vaccines. Viruses, 7(12), 6441-6457.
Offit, P. A. (2005). The Cutter incident, 50 years later. N Engl J Med, 352(14), 1411-
1412.
Ohka, S., Matsuda, N., Tohyama, K., Oda, T., Morikawa, M., Kuge, S., & Nomoto, A.
(2004). Receptor (CD155)-dependent endocytosis of poliovirus and retrograde
axonal transport of the endosome. J Virol, 78(13), 7186-7198.
Ohka, S., Sakai, M., Bohnert, S., Igarashi, H., Deinhardt, K., Schiavo, G., & Nomoto, A.
(2009). Receptor-dependent and -independent axonal retrograde transport of
poliovirus in motor neurons. J Virol, 83(10), 4995-5004.
Ohka, S., Yang, W. X., Terada, E., Iwasaki, K., & Nomoto, A. (1998). Retrograde
transport of intact poliovirus through the axon via the fast transport system.
Virology, 250(1), 67-75.
149
Ong, K. C., Badmanathan, M., Devi, S., Leong, K. L., Cardosa, M. J., & Wong, K. T.
(2008). Pathologic characterization of a murine model of human enterovirus 71
encephalomyelitis. J Neuropathol Exp Neurol, 67(6), 532-542.
Ong, K. C., Devi, S., Cardosa, M. J., & Wong, K. T. (2010). Formaldehyde-inactivated
whole-virus vaccine protects a murine model of enterovirus 71
encephalomyelitis against disease. J Virol, 84(1), 661-665.
Ong, K. C., & Wong, K. T. (2015). Understanding Enterovirus 71 neuropathogenesis
and its impact on other neurotropic Enteroviruses. Brain Pathol, 25(5), 614-624.
Ooi, E. E., Phoon, M. C., Ishak, B., & Chan, S. H. (2002). Seroepidemiology of human
enterovirus 71, Singapore. Emerg Infect Dis, 8(9), 995-997.
Ooi, M. H., Solomon, T., Podin, Y., Mohan, A., Akin, W., Yusuf, M. A., . . . Cardosa, J.
(2007). Evaluation of different clinical sample types in diagnosis of human
enterovirus 71-associated hand-foot-and-mouth disease. J Clin Microbiol, 45(6),
1858-1866.
Ooi, M. H., Wong, S. C., Lewthwaite, P., Cardosa, M. J., & Solomon, T. (2010).
Clinical features, diagnosis, and management of enterovirus 71. Lancet Neurol,
9(11), 1097-1105.
Ooi, M. H., Wong, S. C., Mohan, A., Podin, Y., Perera, D., Clear, D., . . . Solomon, T.
(2009). Identification and validation of clinical predictors for the risk of
neurological involvement in children with hand, foot, and mouth disease in
Sarawak. BMC Infect Dis, 9, 3.
Ooi, M. H., Wong, S. C., Podin, Y., Akin, W., del Sel, S., Mohan, A., . . . Solomon, T.
(2007). Human enterovirus 71 disease in Sarawak, Malaysia: a prospective
clinical, virological, and molecular epidemiological study. Clin Infect Dis, 44(5),
646-656.
Orbach, H., Katz, U., Sherer, Y., & Shoenfeld, Y. (2005). Intravenous immunoglobulin:
adverse effects and safe administration. Clin Rev Allergy Immunol, 29(3), 173-
184.
Oshiumi, H., Okamoto, M., Fujii, K., Kawanishi, T., Matsumoto, M., Koike, S., & Seya,
T. (2011). The TLR3/TICAM-1 pathway is mandatory for innate immune
responses to poliovirus infection. J Immunol, 187(10), 5320-5327.
Pathinayake, P. S., Hsu, A. C., & Wark, P. A. (2015). Innate immunity and immune
evasion by Enterovirus 71. Viruses, 7(12), 6613-6630.
Paust, S., Senman, B., & von Andrian, U. H. (2010). Adaptive immune responses
mediated by natural killer cells. Immunol Rev, 235(1), 286-296.
Phyu, W. K., Ong, K. C., & Wong, K. T. (2016). A Consistent Orally-infected hamster
model for Enterovirus A71 encephalomyelitis demonstrates squamous lesions in
the paws, skin and oral cavity reminiscent of hand-foot-and-mouth disease.
PLoS One, 11(1), e0147463.
150
Plevka, P., Perera, R., Cardosa, J., Kuhn, R. J., & Rossmann, M. G. (2012). Crystal
structure of human enterovirus 71. Science, 336(6086), 1274.
Premanand, B., Kiener, T. K., Meng, T., Tan, Y. R., Jia, Q., Chow, V. T., & Kwang, J.
(2012). Induction of protective immune responses against EV71 in mice by
baculovirus encoding a novel expression cassette for capsid protein VP1.
Antiviral Res, 95(3), 311-315.
Roberts, G. B., & Boyd, J. F. (1987). The histopathology of enterovirus infections of
new-born mice. J Infect, 15(1), 45-56.
Saunders, N. R., Liddelow, S. A., & Dziegielewska, K. M. (2012). Barrier mechanisms
in the developing brain. Front Pharmacol, 3, 46.
Schmidt, N. J., Lennette, E. H., & Ho, H. H. (1974). An apparently new enterovirus
isolated from patients with disease of the central nervous system. J Infect Dis,
129(3), 304-309.
Schulze, C., & Firth, J. A. (1992). Interendothelial junctions during blood-brain barrier
development in the rat: morphological changes at the level of individual tight
junctional contacts. Brain Res Dev Brain Res, 69(1), 85-95.
Seder, R. A., & Hill, A. V. (2000). Vaccines against intracellular infections requiring
cellular immunity. Nature, 406(6797), 793-798.
Solomon, T., Lewthwaite, P., Perera, D., Cardosa, M. J., McMinn, P., & Ooi, M. H.
(2010). Virology, epidemiology, pathogenesis, and control of enterovirus 71.
Lancet Infect Dis, 10(11), 778-790.
Strebel, P. M., Ion-Nedelcu, N., Baughman, A. L., Sutter, R. W., & Cochi, S. L. (1995).
Intramuscular injections within 30 days of immunization with oral poliovirus
vaccine--a risk factor for vaccine-associated paralytic poliomyelitis. N Engl J
Med, 332(8), 500-506.
Takeuchi, O., & Akira, S. (2008). MDA5/RIG-I and virus recognition. Curr Opin
Immunol, 20(1), 17-22.
Tan, S. H., Ong, K. C., & Wong, K. T. (2014). Enterovirus 71 can directly infect the
brainstem via cranial nerves and infection can be ameliorated by passive
immunization. J Neuropathol Exp Neurol, 73(11), 999-1008.
Tian, X., Su, X., Li, X., Li, H., Li, T., Zhou, Z., . . . Zhou, R. (2012). Protection against
enterovirus 71 with neutralizing epitope incorporation within adenovirus type 3
hexon. PLoS One, 7(7), e41381.
Tirado, S. M., & Yoon, K. J. (2003). Antibody-dependent enhancement of virus
infection and disease. Viral Immunol, 16(1), 69-86.
Tung, W. H., Sun, C. C., Hsieh, H. L., Wang, S. W., Horng, J. T., & Yang, C. M.
(2007). EV71 induces VCAM-1 expression via PDGF receptor, PI3-K/Akt, p38
MAPK, JNK and NF-kappaB in vascular smooth muscle cells. Cell Signal,
19(10), 2127-2137.
151
Tyler, K. L. (2009). Emerging viral infections of the central nervous system: Part 1.
Archives of Neurology, 66(8), 939-948.
Volle, R., Archimbaud, C., Couraud, P. O., Romero, I. A., Weksler, B., Mirand, A., . . .
Bailly, J. L. (2015). Differential permissivity of human cerebrovascular
endothelial cells to enterovirus infection and specificities of serotype EV-A71 in
crossing an in vitro model of the human blood-brain barrier. J Gen Virol, 96(7),
1682-1695.
Wang, S. M., Chen, I. C., Su, L. Y., Huang, K. J., Lei, H. Y., & Liu, C. C. (2010).
Enterovirus 71 infection of monocytes with antibody-dependent enhancement.
Clin Vaccine Immunol, 17(10), 1517-1523.
Wang, S. M., Lei, H. Y., Huang, K. J., Wu, J. M., Wang, J. R., Yu, C. K., . . . Liu, C. C.
(2003). Pathogenesis of enterovirus 71 brainstem encephalitis in pediatric
patients: roles of cytokines and cellular immune activation in patients with
pulmonary edema. J Infect Dis, 188(4), 564-570.
Wang, S. M., Lei, H. Y., Huang, M. C., Su, L. Y., Lin, H. C., Yu, C. K., . . . Liu, C. C.
(2006). Modulation of cytokine production by intravenous immunoglobulin in
patients with enterovirus 71-associated brainstem encephalitis. J Clin Virol,
37(1), 47-52.
Wang, S. M., Lei, H. Y., & Liu, C. C. (2012). Cytokine immunopathogenesis of
enterovirus 71 brain stem encephalitis. Clin Dev Immunol, 2012, 876241.
Wang, S. M., Liu, C. C., Tseng, H. W., Wang, J. R., Huang, C. C., Chen, Y. J., . . . Yeh,
T. F. (1999). Clinical spectrum of enterovirus 71 infection in children in
southern Taiwan, with an emphasis on neurological complications. Clin Infect
Dis, 29(1), 184-190.
Wang, W., Duo, J., Liu, J., Ma, C., Zhang, L., Wei, Q., & Qin, C. (2011). A mouse
muscle-adapted enterovirus 71 strain with increased virulence in mice. Microbes
Infect, 13(10), 862-870.
Wang, Y. F., Chou, C. T., Lei, H. Y., Liu, C. C., Wang, S. M., Yan, J. J., . . . Yu, C. K.
(2004). A mouse-adapted enterovirus 71 strain causes neurological disease in
mice after oral infection. J Virol, 78(15), 7916-7924.
Wang, Y. F., & Yu, C. K. (2014). Animal models of enterovirus 71 infection:
applications and limitations. J Biomed Sci, 21(1), 31.
Warren, H. S., & Smyth, M. J. (1999). NK cells and apoptosis. Immunol Cell Biol, 77(1),
64-75.
Wei, D., Li, K. X., & Chen, E. (2010). [Autopsy report of two cases with enterovirus
type 71 infection brainstem encephalitis and literature review]. Zhonghua Er Ke
Za Zhi, 48(3), 220-223.
Weng, K. F., Chen, L. L., Huang, P. N., & Shih, S. R. (2010). Neural pathogenesis of
enterovirus 71 infection. Microbes Infect, 12(7), 505-510.
152
Weng, K. F., Li, M. L., Hung, C. T., & Shih, S. R. (2009). Enterovirus 71 3C protease
cleaves a novel target CstF-64 and inhibits cellular polyadenylation. PLoS
Pathog, 5(9), e1000593.
Wilson-Pauwels, L., Akesson, E.J., & Stewart, P.A. (2002). Cranial nerves : in health
and disease (2nd ed.). Hamilton, Ont. London: BC Decker.
Wilton, T., Dunn, G., Eastwood, D., Minor, P. D., & Martin, J. (2014). Effect of
formaldehyde inactivation on poliovirus. J Virol, 88(20), 11955-11964.
Wong, K. T., Munisamy, B., Ong, K. C., Kojima, H., Noriyo, N., Chua, K. B., . . .
Nagashima, K. (2008). The distribution of inflammation and virus in human
enterovirus 71 encephalomyelitis suggests possible viral spread by neural
pathways. J Neuropathol Exp Neurol, 67(2), 162-169.
Wong, K. T., Ng, K. Y., Ong, K. C., Ng, W. F., Shankar, S. K., Mahadevan, A., . . .
Takasaki, T. (2012). Enterovirus 71 encephalomyelitis and Japanese encephalitis
can be distinguished by topographic distribution of inflammation and specific
intraneuronal detection of viral antigen and RNA. Neuropathol Appl Neurobiol,
38(5), 443-453.
Wong, S. S., Yip, C. C., Lau, S. K., & Yuen, K. Y. (2010). Human enterovirus 71 and
hand, foot and mouth disease. Epidemiol Infect, 138(8), 1071-1089.
World Health Organization. (2011). A guide to clinical management and public health
response for hand, foot and mouth disease (HFMD). Retrieved from
http://www.wpro.who.int/emerging_diseases/documents/HFMDGuidance/en/
Xu, L., He, D., Li, Z., Zheng, J., Yang, L., Yu, M., . . . Xia, N. (2014). Protection
against lethal enterovirus 71 challenge in mice by a recombinant vaccine
candidate containing a broadly cross-neutralizing epitope within the VP2 EF
loop. Theranostics, 4(5), 498-513.
Yamamoto, K. R., Alberts, B. M., Benzinger, R., Lawhorne, L., & Treiber, G. (1970).
Rapid bacteriophage sedimentation in the presence of polyethylene glycol and
its application to large-scale virus purification. Virology, 40(3), 734-744.
Yamayoshi, S., Fujii, K., & Koike, S. (2014). Receptors for enterovirus 71. Emerg
Microbes Infect, 3(7), e53.
Yamayoshi, S., Yamashita, Y., Li, J., Hanagata, N., Minowa, T., Takemura, T., &
Koike, S. (2009). Scavenger receptor B2 is a cellular receptor for enterovirus 71.
Nat Med, 15(7), 798-801.
Yan, J. J., Wang, J. R., Liu, C. C., Yang, H. B., & Su, I. J. (2000). An outbreak of
enterovirus 71 infection in Taiwan 1998: a comprehensive pathological,
virological, and molecular study on a case of fulminant encephalitis. J Clin Virol,
17(1), 13-22.
153
Yang, Y., Wang, H., Gong, E., Du, J., Zhao, X., McNutt, M. A., . . . Zheng, J. (2009).
Neuropathology in 2 cases of fatal enterovirus type 71 infection from a recent
epidemic in the People's Republic of China: a histopathologic,
immunohistochemical, and reverse transcription polymerase chain reaction
study. Hum Pathol, 40(9), 1288-1295.
Yao, P. P., Qian, L., Xia, Y., Xu, F., Yang, Z. N., Xie, R. H., . . . Zhu, H. P. (2012).
Enterovirus 71-induced neurological disorders in young gerbils, Meriones
unguiculatus: development and application of a neurological disease model.
PLoS One, 7(12), e51996.
Yap, M. S., Tang, Y. Q., Yeo, Y., Lim, W. L., Lim, L. W., Tan, K. O., . . . Heng, B. C.
(2016). Pluripotent human embryonic stem cell derived neural lineages for in
vitro modelling of enterovirus 71 infection and therapy. Virol J, 13(1), 5.
Yu, P., Gao, Z., Zong, Y., Bao, L., Xu, L., Deng, W., . . . Qin, C. (2014).
Histopathological features and distribution of EV71 antigens and SCARB2 in
human fatal cases and a mouse model of enterovirus 71 infection. Virus Res, 189,
121-132.
Zeng, H., Wen, F., Gan, Y., & Huang, W. (2012). MRI and associated clinical
characteristics of EV71-induced brainstem encephalitis in children with hand-
foot-mouth disease. Neuroradiology, 54(6), 623-630.
Zhang, Y., Cui, W., Liu, L., Wang, J., Zhao, H., Liao, Y., . . . Li, Q. (2011).
Pathogenesis study of enterovirus 71 infection in rhesus monkeys. Lab Invest,
91(9), 1337-1350.
Zhao, M., Bai, Y., Liu, W., Xiao, X., Huang, Y., Cen, S., . . . Zeng, Y. (2013).
Immunization of N terminus of enterovirus 71 VP4 elicits cross-protective
antibody responses. BMC Microbiol, 13, 287.
Zhu, F. C., Meng, F. Y., Li, J. X., Li, X. L., Mao, Q. Y., Tao, H., . . . Shen, X. L. (2013).
Efficacy, safety, and immunology of an inactivated alum-adjuvant enterovirus
71 vaccine in children in China: a multicentre, randomised, double-blind,
placebo-controlled, phase 3 trial. Lancet, 381(9882), 2024-2032.
Zhu, Fengcai, Xu, Wenbo, Xia, Jielai, Liang, Zhenglun, Liu, Yan, Zhang, Xuefeng, . . .
Wang, Nan. (2014). Efficacy, Safety, and Immunogenicity of an Enterovirus 71
Vaccine in China. N Engl J Med, 370(9), 818-828.
154
List of publications and papers presented
1. Tan, S. H., Ong, K. C., & Wong, K. T. (2014). Enterovirus 71 Can Directly
Infect the Brainstem via Cranial Nerves and Infection Can Be Ameliorated by
Passive Immunization. J Neuropathol Exp Neurol, 73(11), 999-1008.
2. Liu, L., Mo, Z., Liang, Z., Zhang, Y., Li, R., Ong, K. C., . . . Li, Q. (2015).
Immunity and clinical efficacy of an inactivated enterovirus 71 vaccine in
healthy Chinese children: a report of further observations. BMC Med, 13(1), 226.
3. Tan, S. H., Ong, K. C., David, P., & Wong, K. T. (2016). A monoclonal
antibody to ameliorate central nervous system infection and improve survival in
a murine model of human Enterovirus-A71 encephalomyelitis. Antivir Res. In
press.
155
Appendix A
Solution for IHC
1. Citrate buffer (pH 6.0)
Sodium citrate 1.26 g
Citric acid 0.252 g
Distilled water (dH2O) 900 ml
Sodium citrate and citrate acid were dissolved in 900 ml of dH2O and pH was
adjusted to 6.0 by adding hydrochloric acid (HCl) or Sodium hydroxide (NaOH)
before topped up with dH2O to 1 litre.
2. Tris-buffered Saline (TBS), pH 7.6
Tris base 6.05 g
Sodium chloride (NaCl) 80.00 g
1 N HCl 38.00 ml
dH2O 9.00 litres
Tris base and NaCl were dissolved in 9 litres of dH2O and 38 ml of HCl. pH was
adjusted to 7.6 by adding HCl before topped up with dH2O to 10 litres.
3. Hydrogen peroxidase (3%)
30% hydrogen peroxide 5 ml
Methanol 45 ml
3% of hydrogen peroxide was prepared fresh for each staining procedure.
156
Appendix B
Solution for ISH
1 Stock solutions
1.1 NaCl, 5M
NaCl 146.1 g
dH2O to a final volume of 500 ml
NaCl was dissolved in dH2O and sterilised via autoclaving.
1.2 Disodium Ethylenediaminetetra acetate (EDTA) solution, 0.5M (pH 8.0)
EDTA 18.61 g
dH2O 90.00 ml
EDTA was dissolved in dH2O and pH was adjusted to 8.0 by adding NaOH. The
volume was topped up to 100 ml with dH2O and sterilised via autoclaving.
1.3 Saline sodium citrate (SSC), 20x
NaCl 175.3 g
Sodium citrate 88.2 g
dH2O 900.0 ml
NaCl and sodium citrate were dissolved in dH2O and pH was adjusted to 7.0 by
adding NaOH. The volume was topped up to 1 litre with dH2O and sterilised via
autoclaving.
157
1.4 Glysine, 10%
Glysine 0.5 g
dH2O to a final volume of 5.0 ml
1.5 Sodium dodecylsulfate (SDS), 10%
SDS 10 g
dH2O 90 ml
SDS was dissolved in 90 ml of dH2O by heating and stirring at 68°C. pH was
adjusted to 7.2 by adding HCl and topped up to a final volume of 100 ml with
dH2O.
1.6 Tris, 1M (pH 7.5)
Tris base 121.1 g
dH2O 900.0 ml
Tris base was dissolved in 900 ml of dH2O and pH was adjusted to 7.5 by adding
HCl. The solution was topped up to a final volume of 1 litre with dH2O and
sterilised via autoclaving.
1.7 Tris, 1M (pH 9.5)
Tris base 121.1 g
dH2O 900.0 ml
Tris base was dissolved in 900 ml of dH2O and pH was adjusted to 9.5 by adding
HCl. The solution was topped up to a final volume of 1 litre with dH2O and
sterilised via autoclaving.
158
1.8 HCl, 10 M
Concentrated HCl 82.8 ml
dH2O 17.2 ml
Both solutions were mixed inside fume hood and allowed to cool to room
temperature before used.
1.9 Dextran sulphate 10%
Dextran sulphate 0.5 g
Formamide to a final volume of 5.0 ml
Dextran sulphate was dissolved by gentle stirring and stored at -20°C.
1.10 Dendhart solution, 50x
Ficoll 0.1 g
Polyvinylpyrolidone 0.1 g
dH2O to a final volume of 10.0 ml
Solution was store at -20°C.
1.11 Blocking solution 10%
Blocking reagent 2 g
Tris/NaCl buffer to a final volume of 20 ml
Blocking reagent was dissolved in Tris/NaCl buffer (pH 7.5) by stirring and
heating. The solution was stored at 4°C.
159
2 Working solutions
2.1 Phosphate buffered saline (PBS)
NaCl 8.00 g
KCl 0.20 g
KH2PO4 0.24 g
Na2HPO4 1.44 g
dH2O 900.00 ml
All chemicals were dissolved in 900 ml of dH2O and pH was adjusted to 7.4 by
adding HCl. The solution was topped up to a final volume of 1 litre with dH2O
and sterilised via autoclaving.
2.2 HCl, 0.2 N
HCl 10N 4 ml
dH2O 96 ml
Both solutions were mixed inside fume hood and allowed to cool to room
temperature before used.
2.3 Glycine, 0.2%
10% Glycine 1 ml
PBS 49 ml
160
2.4 Digestion buffer
Tris, 1M 0.1 ml
EDTA, 0.5 M 0.1 ml
dH2O 90.0 ml
All solutions were mixed with 90 ml of dH2O and pH was adjusted to 7.8 by
adding HCl and/or NaOH. 500 µL of 10% SDS was added and topped up to a
final volume of 100 ml with dH2O.
2.5 Digestion buffer with 100 µg/ml proteinase K
Digestion buffer (pH 7.8) 1.99 ml
Proteinase K, 20 mg/ml 0.10 ml
2.6 Tris-HCl / EDTA buffer
Tris, 1M (pH 9.5) 10 ml
EDTA 5 ml
dH2O 400 ml
The mixture was adjusted to pH 9.5 by adding HCl and topped up to a final
volume of 500 ml with dH2O. Solution was sterilised with autoclaving.
161
2.7 Tris-HCl / NaCl buffer
Tris, 1M (pH 7.5) 100 ml
NaCl 30 ml
dH2O 900 ml
The mixture was adjusted to pH 7.5 by adding HCl and topped up to a final
volume of 1 liter with dH2O. Solution was sterilised with autoclaving.
2.8 Hybridisation solution
20 x SSC 0.30 ml
50 x Denhardts solution 0.10 ml
Denatured Salmon sperm DNA 0.01 ml
dH2O 0.09 ml
10% Dextran sulphate 0.50 ml
The solutions were mixed well before DIG-labelled DNA probe was added to a
final concentration of 2 µg/ml.
2.9 Tris-HCl / NaCl / MgCl buffer
Tris, 1 M (pH 9.5) 50.0 ml
NaCl, 5 M 10.0 ml
MgCl, 1M 2.5 ml
dH2O 400 ml
The mixture was adjusted to pH 9.5 by adding HCl or NaOH. The solution was
topped up to a final volume of 500 ml with dH2O and sterilised via autoclaving.
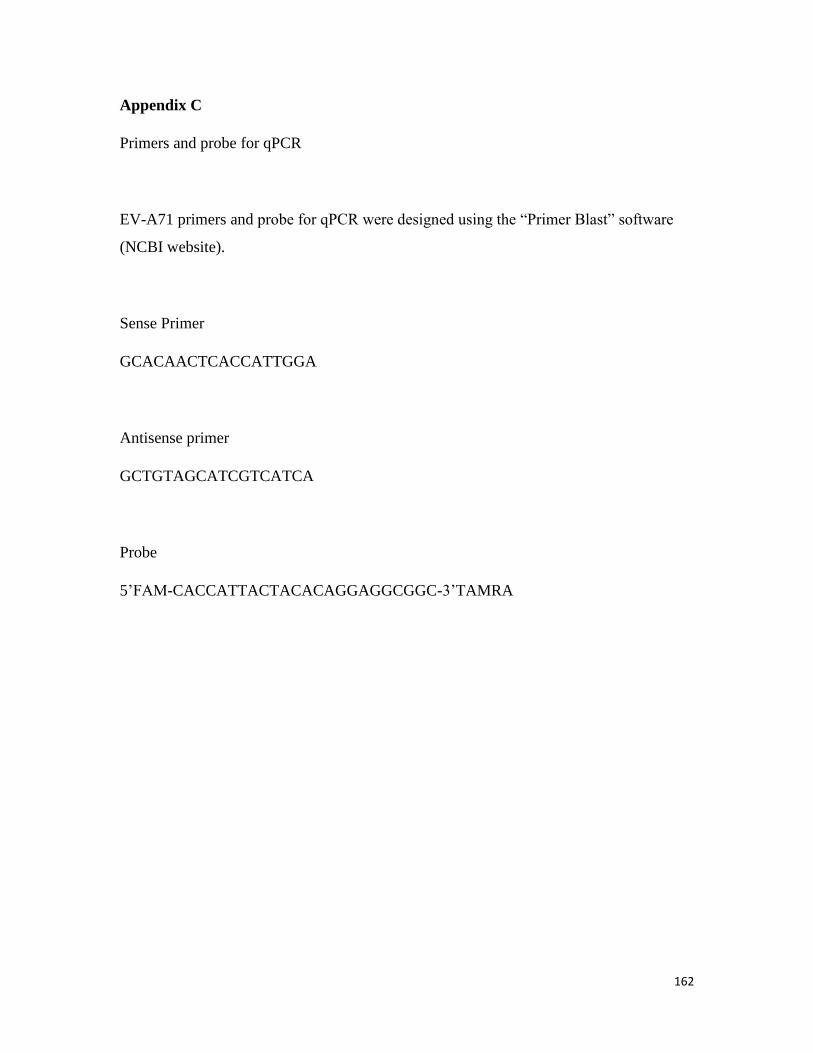
162
Appendix C
Primers and probe for qPCR
EV-A71 primers and probe for qPCR were designed using the “Primer Blast” software
(NCBI website).
Sense Primer
GCACAACTCACCATTGGA
Antisense primer
GCTGTAGCATCGTCATCA
Probe
5’FAM-CACCATTACTACACAGGAGGCGGC-3’TAMRA