Embed Size (px)
Citation preview

Virgin Money UK PLC Full Year 2020 Financial Results Announcement
BASIS OF PRESENTATION
Virgin Money UK PLC (‘Virgin Money’, ‘VMUK’ or ‘the Company’), formerly known as CYBG PLC (‘CYBG’) (the Company was renamed on 30 October
2019), together with its subsidiary undertakings (which together comprise ‘the Group’), operate under the Clydesdale Bank, Yorkshire Bank, B and Virgin
Money brands. This results announcement covers the results of the Group for the year ended 30 September 2020. The term ‘Virgin Money’ is used
throughout this results announcement either in reference to the Group, or when referring to the acquired business of Virgin Money Holdings (UK) PLC or
subsequent integration of the acquired business, within the newly combined Group.
Statutory basis
Statutory information is set out on page 16 and within the financial statements.
Pro forma results: On 15 October 2018, the Company acquired all the voting rights in Virgin Money Holdings (UK) PLC by means of a scheme of
arrangement under Part 26 of the UK Companies Act 2006, with the transaction being accounted for as an acquisition of Virgin Money Holdings (UK) PLC.
We believe that it is helpful to provide additional information which is more readily comparable with the current year result s of the combined businesses.
Therefore we have prepared pro forma comparative results for the Group as if Virgin Money UK PLC and Virgin Money Holdings (UK) PLC had always
been a combined group, in order to assist in explaining trends in financial performance. A reconciliation between the results on a comparative pro forma
basis and a statutory basis is included on page 17. The pro forma comparative results are also presented on an underlying basis as there were a number of
factors which had a significant effect on the comparability of the Group’s financial posit ion and results. Any reference to pro forma results relates to the prior
period only as the pro forma basis is not applicable in the current period due to the combined group being in operation for the entire 12 months to 30
September 2020.
Underlying basis
The results are adjusted to remove certain items that do not promote an understanding of historical or future trends of earnings or cash flows, and therefore
allows a more meaningful comparison of the Group’s underlying performance. A reconciliation from the underlying results to the statutory basis is shown on
page 17 and management’s rationale for the adjustments is shown on page 129.
Alternative performance measures (APMs)
The financial key performance indicators (KPIs) used by management in monitoring the Group’s performance and reflected throughout this results
announcement are determined on a combination of bases (including statutory, regulatory and alternative performanc e measures), as detailed at ‘Measuring
financial performance – glossary’ on pages 127 to 128. APMs are closely scrutinised to ensure that they provide genuine insights into the Group’s progress;
however statutory measures are the key determinant of dividend paying capability.
Certain figures contained in this document, including financial information, may have been subject to rounding adjustments and foreign exchange
conversions. Accordingly, in certain instances, the sum or percentage change of the numbers contained in this document may not conform exactly to the
total figure given.
FORWARD LOOKING STATEMENTS
The information in this document may include forward-looking statements, which are based on assumptions, expectations, valuations, targets, estimat es, forecasts and
projections about future events. These can be identified by the use of words such as ‘expects’, ‘aims’, ‘targets’, ‘seeks’, ‘anticipates’, ‘plans’, ‘intends’, ‘prospects’,
‘outlooks’, ‘projects’, ‘forecasts’, ‘believes’, ‘estimates’, ‘potential’, ‘possible’, and similar words or phrases. These forward-looking statements, as well as those included
in any other material discussed at any presentation, are subject to risks, uncertainties and assumptions about the Group and its securities, investments and the
environment in which it operates, including, among other things, the development of its business and strategy, any acquisitions, combinations, disposals or other
corporate activity undertaken by the Group (including but not limited to the integration of the business of Virgin Money Holdings (UK) PLC and its subsidiaries into the
Group), trends in its operating industry, changes to customer behaviours and covenant, macroeconomic and/or geo-political factors, the repercussions of the outbreak
of coronaviruses (including but not limited to the COVID-19 outbreak), changes to its Board and/or employee composition, exposures to terrorist activity, IT system
failures, cybercrime, fraud and pension scheme liabilities, changes to law and/or the policies and practices of the Bank of England, the Financial Conduct Authority
and/or other regulatory and governmental bodies, inflation, deflation, interest rates, exchange rates, changes in the liquidi ty, capital, funding and/or asset position
and/or credit ratings of the Group, future capital expenditures and acquisitions, the repercussions of the UK’s referendum vote to leave the European Union, the UK’s
exit from the EU (including any change to the UK’s currency), Eurozone instability, and any referendum on Scottish independence.
In light of these risks, uncertainties and assumptions, the events in the forward-looking statements may not occur. Forward-looking statements involve inherent risks
and uncertainties. Other events not taken into account may occur and may significantly affect the analysis of the forward-looking statements. No member of the Group
or their respective directors, officers, employees, agents, advisers or affiliates gives any assurance that any such projections or estimates will be realised or that actual
returns or other results will not be materially lower than those set out in this document and/or discussed at any presentation. All forward-looking statements should be
viewed as hypothetical. No representation or warranty is made that any forward-looking statement will come to pass. No member of the Group or their respective
directors, officers, employees, agents, advisers or affiliates undertakes any obligation to update or revise any such forward-looking statement following the publication
of this document nor accepts any responsibility, liability or duty of care whatsoever for (whether in contract, tort or otherwise) or makes any representation or warranty,
express or implied, as to the truth, fullness, fairness, merchantability, accuracy, sufficiency or completeness of, the information in this document.
The information, statements and opinions contained in this document do not constitute or form part of, and should not be cons trued as, any public offer under any
applicable legislation or an offer to sell or solicitation of any offer to buy any securities or financial instruments or any advice or recommendation with respect to such
securities or other financial instruments.

Contents
Highlights 1
Contact details 2
Business and financial review 3
Risk management 18
Directors’ responsibility statement in respect of the Annual Report & Accounts 69
Group financial statements 70
Additional information 127
1
Virgin Money UK PLC 2020 Full Year Results Highlights
David Duffy, Chief Executive Officer:
“It has been an extraordinary year of disruption for all of us. Our priority has been to support our customers and colleagues through this
period, and we will continue to do so during the challenging economic environment ahead. I’m proud of the way we’ve adapted how we
work this year to continue serving our customers, while looking after our colleagues and protecting the bank for the future.
“While we are yet to see any material impacts of the pandemic on the credit quality of our loan book, our results reflect a cautious and
conservative approach to the coming period as we refine our assessment of the uncertain economic outlook and the impact of th e second
lockdown. Although the vaccine news is a strong cause of hope for the future, the economic benefits are still some way off when
considering the immediate reality of current restrictions and so have not yet been factored into our near-term forecasts.
“Looking into 2021, we are well underway in rolling out our full suite of Virgin Money products and serv ices across personal and business,
underpinned by our unique brand proposition and leading digital capabilities. This progress, as well as the steps we have alr eady taken
to transform and simplify our business, mean we are well positioned to emerge from the pandemic as an agile, innovative and disruptive
force in UK banking.”
Supporting our customers, colleagues & communities
• Virgin Money has continued to provide customers with valuable support at this difficult time:
o c.67k Mortgage payment holidays granted to date (c.20% of balances); c.4% of balances currently on an active
payment holiday with 98% of customers who have matured from their holiday period having returned to payment
o c.58k Personal payment holidays granted to date (c.6% of balan ces); c.1% of balances currently on an active payment
holiday with 93% of customers who have matured from their holiday period having returned to payment
o Supported c.30k businesses with lending support including c.£1.2bn of Government-backed loans disbursed
• c.6k of our c.9k colleagues enabled to work from home; enhanced safety and wellbeing support for those in offices/branches
• c.£900k distributed to local charities supporting the COVID-19 effort by the Virgin Money Foundation; our not-for-profit Virgin
Money Giving platform continues to support fundraising efforts across the UK and helped over 20k charities raise >£100m
FY20 financial highlights
• Balance sheet reflects COVID-19 impacts; lending contraction of 0.7% to £72.5bn and deposit growth of 5.8% to £67.5bn:
o Business lending growth of 13.6% to £8.9bn due to £1.2bn of Government-backed lending (BBLS/CBILS/CLBILS)
o Personal lending growth of 3.9% to £5.2bn with the strong H1 growth tempered by lower demand in H2
o Mortgage lending declined 3.0% to £58.3bn with disciplined pricing in H1 and UK lockdown market impacts in H2
o Relationship deposits grew 20.3% to £25.7bn as consumer savings increased significantly under lockdown and
businesses generally deposited the proceeds from Government-guaranteed lending into short-term cash accounts
• Underlying pre-provision operating profit of £625m is 10% lower YoY primarily due to NIM compression and base rate cuts:
o FY NIM of 1.56% within guidance; Q4 NIM of 1.52% up vs. Q3 of 1.47% reflecting deposit repricing actions
o Non-interest income of £191m primarily reflects lower H2 activity based fees partially offset by a £16m H1 gilts gain
o Operating costs of £917m down 3% YoY with net cost reductions of £30m despite incurring c.£14m of COVID costs
• Credit impairment charge of £501m (68bps cost of risk) reflecting a cautious approach to an uncertain economic environment
o The Group has deliberately adopted an updated and more conservative set of economic scenarios and weightings
reflecting the uncertain economic outlook and heightened risks ahead ; a 5% weighting was applied to the Upside
scenario, 50% to Base and 45% to Downside; this resulted in a weighted-average GDP decline assumption of 15% in
2020, average unemployment of 8.6% in 2021 with a peak of 10% and a peak-to-trough HPI decline of 22%
o The IFRS 9 models have also been supplemented with post-model adjustments in relation to the Group’s expected
payment holiday outcomes and economic dynamics that may not be fully captured in inputs or models
o The Group now has considerable on -balance sheet provisions of £735m; total coverage ratio of 102bps includes 23bps
for Mortgages, 537bps for Credit Cards, 824bps for Personal Loans & Overdrafts, and 391bps for Business
o No deterioration in asset quality to date with lower arrears across most portfolios reflecting Government support and
forbearance: Mortgage arrears of 0.4%, Credit Cards of 0.8%, Personal Loans of 0.4% and Business of 0.3%
• Underlying profit before tax of £124m is down 77% YoY primarily due to the significant impairment charge recognised
• Statutory loss after tax of £141m is inclusive of £292m of exceptional items, including £139m of integration & transformation
costs, £113m of acquisition accounting unwind and £26m of cond uct charges (non-PPI related)
Well positioned for an uncertain outlook
• Resilient capital base: transitional CET1 ratio of 13.4% with c.£950m of management buffer in excess of the MDA of 9.5%;
• Strong liquidity & funding position: LCR of 140% and 107% loan-to-deposit ratio
• Strengthened our sustainability strategy: unveiled clear principles and 2030 aspirations as we seek to ‘be a force for good’
Outlook and guidance
• Given the unprecedented nature of COVID-19, the exact economic outlook for the UK is clearly evolving and remains hard to
predict with any high degree of certainty at present; it is therefore not appropriate at this stage to give firm medium-term guidance
and so the Group’s previous FY22 targets are withdrawn pending more certainty in the economic environment.
• FY21 guidance: NIM broadly flat on FY20 levels and non-interest income to remain subdued; underlying operating costs of
<£875m inclusive of c.£10-15m of COVID costs; cost of risk lower than FY20 assuming no further deterioration in outlook
• Medium-term outlook: The Board continues to believe that Virgin Money has a clear path to delivering a double digit statutory
RoTE over time and this will support future capital returns to shareholders; the improvement in returns will be driven by:
normalisation of impairments and exceptional costs; ensuring we continue to reduce our cost base to reflect the future operating
environment; optimising our balance sheet mix; and delivering a more efficient capital base over time.

2
Contact details For further information, please contact:
Investors and Analysts Andrew Downey Head of Investor Relations
+44 7823 443150 [email protected]
Richard Smith Senior Manager, Investor Relations
+44 7483 399 303 [email protected]
Media (UK) Matt Magee +44 7411 299477 Head of Media Relations [email protected]
Christina Kelly +44 7484 905 358 Senior Media Relations Manager [email protected]
Simon Hall +44 7855 257 081 Senior Media Relations Manager [email protected]
Press Office +44 800 066 5998 [email protected]
Powerscourt Victoria Palmer-Moore +44 7725 565 545 Andy Smith +44 7872 604 889
Media (Australia) Citadel Magnus James Strong Peter Brookes
+61 448 881 174 +61 407 911 389
Virgin Money UK PLC will today be hosting a presentation for analysts and investors covering the 2020 full year f inancial results starting at 08:30 GMT (19:30 AEDT) and this will be webcast live and is available at: https://webcast.openbriefing.com/virginmoney-fy/ A recording of the webcast will be made available on our website shortly after the meeting at: https://www.virginmoneyukplc.com/investor-relations/results-and-reporting/financial-results/
3
Business and financial review
Financial Performance - underlying basis
Summary income statement – underlying basis
Pro forma
2020 2019 Change
£m £m %
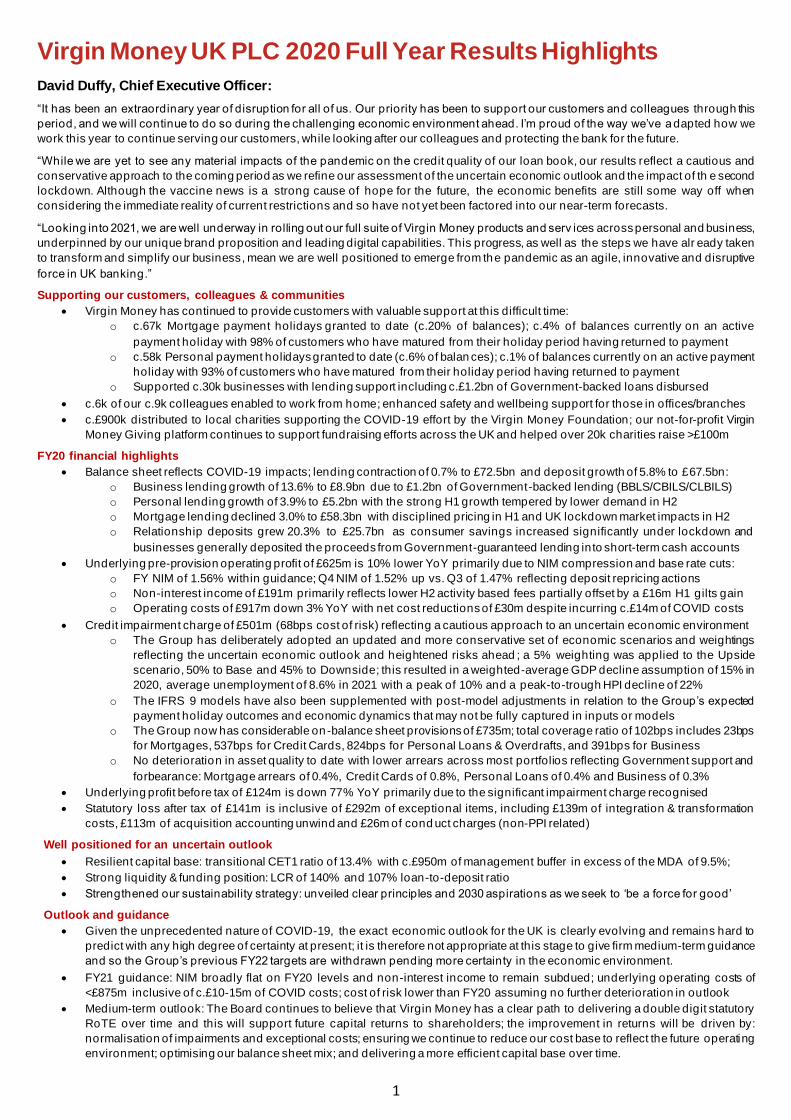
Underlying net interest income 1,351 1,433 (6)
Underlying non-interest income 191 206 (7)
Total underlying operating income 1,542 1,639 (6)
Underlying operating and administrative expenses (917) (947) (3)
Underlying operating profit before impairment losses 625 692 (10)
Total impairment losses on credit exposures (501) (153) 227
Underlying profit on ordinary activities before tax 124 539 (77)
- Integration and transformation costs (139) (156) (11)
- Acquisition accounting unwinds (113) (87) 30
- Legacy conduct costs (26) (433) (94)
- Other items (14) (128) (89)
Statutory/pro forma loss on ordinary activities before tax (168) (265) (37)
Tax credit 27 58 (53)
Statutory/pro forma loss after tax (141) (207) (32)
Key performance indicators (1)
Pro forma
2020 2019 Change
Profitability: Net interest margin 1.56% 1.66% (10)bps
Underlying return on tangible equity (RoTE) 0.6% 10.8% (10.2)%pts
Underlying cost to income ratio (CIR) 59% 57% 2%pts
Underlying return on assets 0.09% 0.54% (45)bps
Underlying earnings per share (EPS) 1.4p 28.1p (26.7)p
(1) For a definition of each of the KPIs, refer to ‘Measuring financial performance – glossary’ on pages 127 to 128. The KPIs include statutory, regulatory and alternative performance measures.
4
Business and financial review
Financial Performance - underlying basis
Key performance indicators (continued)
As at: 2020 2019 Change
Asset quality
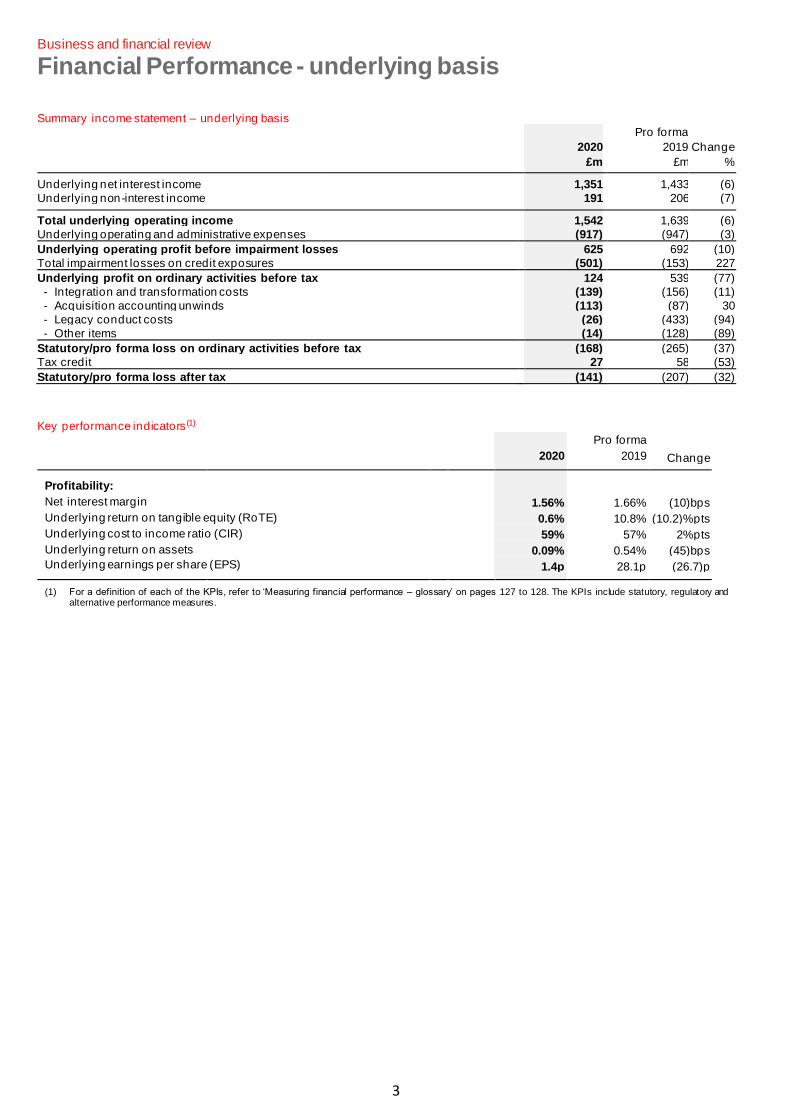
Cost of risk 0.68% 0.21% 47bps
Total provision to customer loans 1.02% 0.50% 52bps
Indexed loan to value ratio (LTV) of mortgage portfolio (1) 57.3% 57.2% 0.1%pts
Regulatory Capital:
Common equity tier 1 (CET1) ratio (IFRS 9 transitional) 13.4% 13.3% 0.1%pts
CET1 ratio (IFRS 9 fully loaded) 12.2% 12.9% (0.7)%pts
Total capital ratio 20.2% 20.1% 0.1%pts
Minimum requirement for own funds and eligible liabilities (MREL) ratio 28.4% 26.6% 1.8%pts
Capital Requirement Directive IV (CRD IV) leverage ratio 4.8% 4.3% 0.5%pts
UK leverage ratio 4.9% 4.9% -%pts
Tangible net asset value (TNAV) per share 244.2p 249.2p (5.0)p
Funding and Liquidity:
Loan to deposit ratio (LDR) 107% 114% (7)%pts
Liquidity coverage ratio (LCR) 140% 152% (12)%pts
Net stable funding ratio (NSFR) 131% 128% 3%pts
(1) LTV of the mortgage portfolio is defined as mortgage portfolio weighted by balance. The Clydesdale Bank PLC portfolio is indexed using the MIAC Acadametrics
indices at a given date, while the Virgin Money portfolio is indexed using the Markit indices.
Summary balance sheet As at
2020 2019 Change
£m £m %
Customer loans 72,457 72,979 (0.7)
of which Mortgages 58,290 60,079 (3.0)
of which Personal 5,219 5,024 3.9 of which Business 8,948 7,876 13.6
Other financial assets 15,608 16,391 (4.8)
Other non-financial assets 2,194 1,629 34.7
Total assets 90,259 90,999 (0.8)
Customer deposits 67,511 63,787 5.8
of which relationship deposits(1) 25,675 21,347 20.3
of which non-linked savings 20,729 20,197 2.6
of which term deposits 21,107 22,243 (5.1)
Wholesale funding 14,227 18,506 (23.1)
Other liabilities 3,589 3,685 (2.6)
Total liabilities 85,327 85,978 (0.8)
Ordinary shareholders' equity 4,017 4,106 (2.2)
Additional Tier 1 (AT1) equity 915 915 -
Equity 4,932 5,021 (1.8)
Total liabilities and equity 90,259 90,999 (0.8)
Risk Weighted Assets (RWAs) 24,399 24,046 1.5 (1) Current account and linked savings balances.
5
Business and financial review
Chief Executive Officer’s review
Supporting our stakeholders Our primary focus has been to provide the very best support to our customers, colleagues and communities, but we have also continued to make strategic
progress in a uniquely challenging environment
“I am extremely proud of the Purpose-led support we have provided to our customers, colleagues and
communities throughout this year” David Duffy, CEO
Dear stakeholder,
Without doubt, 2020 has been a uniquely challenging year for all of us. My priority from the outset has been to make sure tha t Virgin Money responds to
the crisis in a way that reflects our Purpose and our Virgin Values. That means offering our customers t he right support to navigate through the challenges
the pandemic has brought about, protecting the health and well-being of our colleagues, while at the same time safeguarding our business for the future.
We are committed to providing support for all of our customers during these difficult and uncertain times.
I am proud of how my colleagues have responded to these challenges and confident that we are building an organisation that re flects our Purpose of
‘Making you happier about money’.
Supporting our customers, colleagues and communities
In Mortgages, we have granted c.67k payment holidays while in Personal, we have granted c.58k payment holidays, with >90% of these customers who
have matured from their payment holiday having now returned to regular payments. In Business, our relationship managers have been proactively
supporting customers with advice and financing solutions, while our participation in the various government -guaranteed lending schemes has seen us lend
c.£1.2bn to provide much needed liquidity to businesses. You can find out more about our divisional customer support on pages 28 -33 in our Annual
Report & Accounts.
Our colleagues are critical in how we have been able to support our customers and their safety has been our first priority th roughout. We took a decision
early in the crisis not to furlough any colleagues, and we continue to work hard to make sure those critical colleagues who n eed to be in our branches or
offices receive the best support possible. We have more details on our colleagues on page 11 in our Annual Report & Accounts.
Our strong heritage of community support also stepped up during the pandemic, with the Virgin Money Foundation making c.£900k of funding available for
local charities responding to COVID-19. Virgin Money Giving (VMG) was an official fundraising partner of the 2.6 Challenge (which took place in lieu of the
postponed Virgin Money London Marathon), helping support more than 3,000 charities to raise more than £10m, and our not -for-profit VMG platform
continued to support fundraising efforts across the UK.
Pre-provision operating performance impacted by UK lockdowns
We reported a resilient first half pre-provision operating performance, but the second half has been impacted by the unprecedented deterioration in the
economic environment.
Our balance sheet reflects this in different ways across the portfolios with a c.3% year-on-year contraction in our Mortgage book due to disciplined pricing
in the first half in a competitive (pre-COVID-19) environment and the impact of lockdown on demand in the second half. In Business, our total book has
grown by c.14%, but this is solely due to the government-guaranteed lending schemes where we have lent c.£1.2bn, with our underlying non-government-
guaranteed lending down slightly across the year. In Personal, our c.4% lending growth reflects a strong first half and the resilience of our balance tran sfer
credit card portfolio in the second half. In deposits, similar to most other banks, we have seen a significant increase in th e year, up c.6%, with our
relationship deposits increasing 20% as consumer spending slowed dramatically and a lot of businesses simply deposited govern ment-guaranteed lending
proceeds as cash.
As a consequence, the Group’s total income reduced 6% year-on-year reflecting lower lending volumes, lower activity based fees and the margin impact
of the base rate cut as well as excess liquidity costs. While we continued to reduce our underlying cost base, down 3%, with c.£30m of net reductions after
absorbing £14m of additional COVID-19 costs, pre-provision operating profit reduced by 10%.
Significant impairment provision drives a statutory loss
While it is clear that the near-term economic outlook is challenging, we have not yet seen significant specific provisions or credit losses in relation to the
pandemic. However, the Board has chosen to apply conservative economic scenarios and weightings, supplemented by expert judgement credit risk
overlays, in assessing its expected credit loss provisioning. In total, the Group has taken a substantial £501m provision charge during the year to
significantly increase the Group’s on-balance sheet credit provision to £735m, providing robust levels of coverage across all of our portfolios. This sizeable
provision charge has led to a significantly reduced underlying profit before tax of £124m, down 77% year-on-year. Together with £292m of exceptional
costs that primarily relate to our restructuring programmes and acquisition accounting unwind, the Group has reported a £141m statutory loss after tax for
the year.
Robust balance sheet for an uncertain environment
Importantly our balance sheet remains robust as we enter a period of economic stress with an expected increase in credit losses. We have a defensive
lending portfolio comprising 81% of prime, high-quality Mortgages, 12% of well diversified relationship-driven business lending and 7% of high-quality
Personal lending. We also retain a resilient capital base with a transitional CET1 ratio of 13.4% and c.£950m of CET1 management buffer, which is in
addition to our £735m of credit provisions. We continue to maintain a strong liquidity position with a Liquidity Coverage Rat io (LCR) of 140% and are
prudently funded with a 107% loan-to-deposit ratio (LDR). You can find out more about our financial performance and balance sheet strength in the CFO
Review on pages 7 to 17.
6
Business and financial review
Chief Executive Officer’s review
Strategic progress during the year
During the year, we have continued to enhance our digital propositions through several major new releases to our online platforms which has enabled new
features and capability, while our new API connectivity to a key mortgage intermediary sourcing system improves efficiency for our broker partners and us.
Although we did pause our rebrand activity planned for earlier in the year due to the UK lockdown, we have sought to strategically leverage our brand
where possible through our extremely successful partne rship that delivered the UK’s first socially-distanced music festival in Newcastle over the summer
and our ‘Money on Your Mind’ campaign. Both activities attracted widespread coverage across traditional media and social media creating great brand
awareness.
In Mortgages, we launched our innovative Home Buying Coach app which supports first -time buyers through a mix of tools, calculators and content to help
make buying a new home a happier experience. The app has been well received with over 10k downloads already and we expect it to be a great customer
engagement tool over time.
In Personal, we launched the first-ever digital Virgin Money Current Account which is gaining good traction with customers and was rated as “Outstanding”
by Moneyfacts with a perfect five-star score. More recently, we launched our market-leading basic bank account, the ‘M Account’, which forms a vital part
of our financial inclusion strategy, and we also launched the Virgin Money Personal Loan product as another important step in our integration journey.
In Business, we were delighted to be awarded a £35 million grant from the BCR’s Capability and Innovation Fund (CIF), which we will match-fund, and
invest into enhancing our proposition to support us in becoming a true disruptor in the SME banking market and to offer a credible alternative to the
incumbent banks under the Virgin brand.
In recognition of the progress we are making, our teams won several customer service awards this year. This includes ‘Best Credit Card provider’ for a
third year in a row by the British Banking Award, the ‘Mortgage Service Award’ in the Simples Awards from Compare the Market and several awards at the
UK Customer Experience Awards including a superb Gold in the ‘Use of insight and feedback’ category in recog nition of our innovative ‘Money on Your
Mind’ initiative.
You can find out more about our strategic progress on pages 8-13 in our Annual Report & Accounts.
Enhancing our ESG approach
The events of 2020 have underscored the moral and commercial imperative for creating a sustainable business. As society continues to adjust to these
new challenges, I believe we have an opportunity – and an obligation – to play a strong role in helping customers and communities navigate the road
ahead. From transitioning to a greener economy and reimagining customer’s business models, to developing more inclusive products and supporting
fundraising in a digital age – we are working hard to be a force for good in society.
Our sustainability agenda is an integral part of delive ring our Purpose of ‘Making you happier about money’ and is being embedded in everything we do.
We are all on a journey to learn how best to do that, and I believe our refreshed ESG strategy provides a framework to accelerate the difference we are
able to make to the global issues facing our planet and the local issues facing our communities. You can find out more on our sustainability approach on
pages 16-21 in our Annual Report & Accounts.
Outlook
While the outlook remains very uncertain and the range of potential outcomes is wide, Virgin Money enters this period from a position of strength. Over the
coming months, we anticipate an increase in specific credit losses as unemployment starts to rise and as the government stimulus reduces, and we
expect limited customer demand for lending. We recognise the very recent news of potential vaccines, but believe it is too early to incorporate this into our
near-term forecasts at present. Our primary focus will remain on supporting all of our stakeholders, while pro gressing our strategic delivery through the
completion of our transformation and rebrand activity, as well as the launch of exciting new propositions such as our new Virgin Money Business Current
Account (BCA), our cashback and loyalty programmes, and a host of innovative new partnerships.
In the medium term, the Board believes that, assuming no significant further deterioration in expectations for the economic o utlook or change in interest
rates, Virgin Money has a clear path to delivering a double digit statutory RoTE over time, supporting future capital returns to investors. The improvement
in returns will be built on: the normalisation of impairments and exceptional costs; ensuring we continue to reduce our cost base to reflect the future
operating environment; optimising our balance sheet mix; and delivering a more efficient capital base over time, and we aim to come back wi th more
specific guidance once the medium-term outlook has stabilised.
Finally, I have been inspired by the lengths our colleagues have gone to in supporting our customers and communities in difficult circumstances this year
and want to thank them for their immense efforts, personal resilience and dedication. 2021 will no doubt require a similar le vel of commitment from us all to
continue providing the right support and to deliver on our strategic ambitions. I also want to take the opportunity to extend my very best wishes to all of our
customers, colleagues and investors in remaining safe and well.
David Duffy
Chief Executive Officer
24 November 2020
7
Business and financial review
Chief Financial Officer’s review
Cautious approach in an unprecedented environment
2020 has been a challenging year and our financial results reflect the cautious approach we have taken in assessing the economic outlook and future credit losses
“2020 has been unprecedented in the challenges it has created for the banking industry and this is reflected in our financial performance for the year.” Enda Johnson, Interim Group CFO
CFO review contents
Analysis of:
Income 9
Costs 10
Impairments 11
Exceptional items and statutory loss 12
Balance sheet 13
Capital 14
Outlook and guidance 15
Overview of Group results – statutory basis 16
Financial Highlights
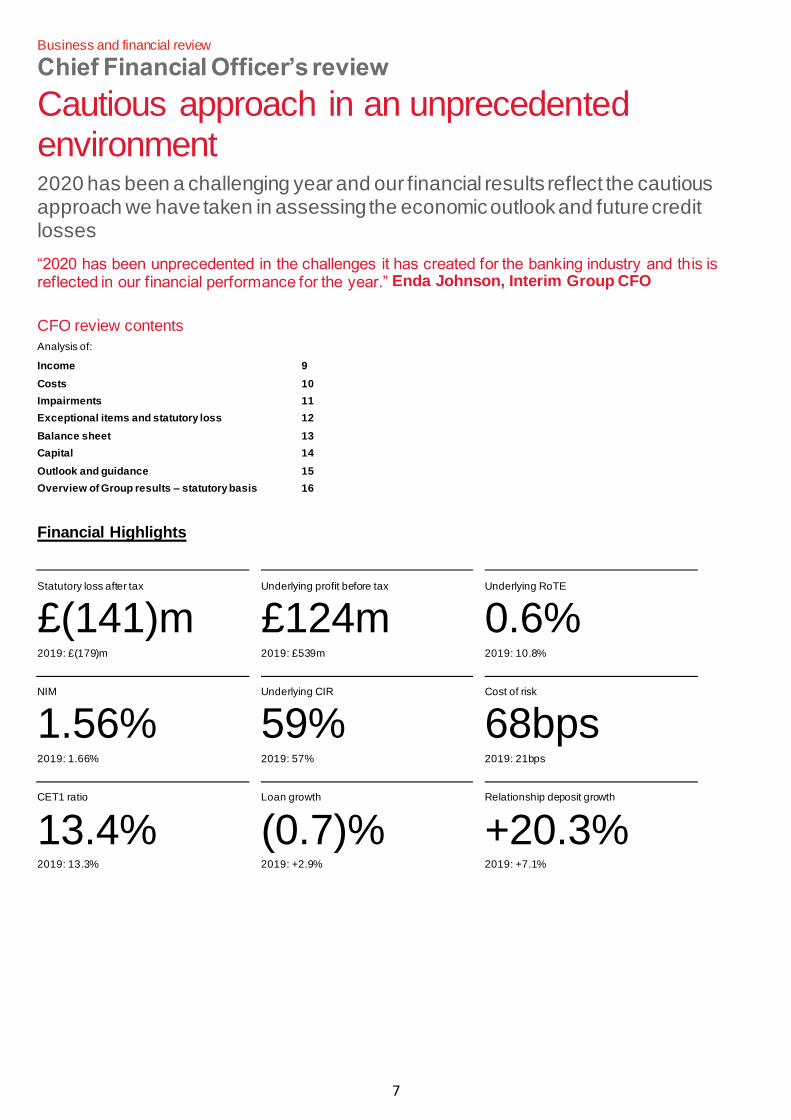
Statutory loss after tax
£(141)m 2019: £(179)m
Underlying profit before tax
£124m 2019: £539m
Underlying RoTE
0.6% 2019: 10.8%
NIM
1.56% 2019: 1.66%
Underlying CIR
59% 2019: 57%
Cost of risk
68bps 2019: 21bps
CET1 ratio
13.4% 2019: 13.3%
Loan growth
(0.7)% 2019: +2.9%
Relationship deposit growth
+20.3% 2019: +7.1%

8
Business and financial review
Chief Financial Officer’s review
Review of the year
2020 has been a uniquely challenging year for the banking industry and our business, and this is reflected in our financial performance for t he year. We
have been primarily focused on supporting our customers, colleagues and communities, while at the same time ensuring th e stability of the bank. Despite
the challenges, we did continue to execute on some key integration milestones, while delaying delivery of some of our strategic, transformation activity.
Importantly, we have also taken a cautious approach to our credit impairment provisioning for what is likely to be a severe economic shock with an
expected rise in specific credit losses in the period to come.
Balance sheet impacted by the pandemic
The COVID-19 pandemic has had very different impacts across our various lending segments, demonstrating the value of a diverse portfolio. Total
customer lending was down 0.7% in the year to £72.5bn primarily due to a reduction in the mortgage book as we maintained our discipline in a competitive
market in the first half, with demand in the second half reducing substantially owing to the pandemic restrictions. This was partly offset by increased
balances in Business with £1.2bn of incremental lending primarily under the government-guaranteed BBLS and CBILS lending schemes, and growth in
Personal from a strong first half performance and resilience of the balance transfer credit card portfolio in the second half . Total customer deposits
increased 5.8% to £67.5bn reflecting both consumer savings behaviour under lockdown and businesses depositing government-guaranteed lending
proceeds for liquidity.
Pre-provision operating profit impacted by income headwinds
Our Net Interest Margin (NIM) of 1.56% (FY19: 1.66%) was delivered within our guidance range as it stabilised towards the end of the year following the
base rate reductions, but which nonetheless reduced Net Interest Income (NII) 6% year-on-year. Non-interest income was also down 7% in the period
largely due to lower activity-based fees and the impact of the ‘high cost of credit review’ in our Personal division. Total income was therefore down 6% on
FY19 at £1,542m. Operating costs of £917m were 3% lower on the prior year, despite absorbing £14m of COVID-19 related costs. The challenging
income environment led to an increase in our cost:income ratio to 59% and resulted in a 10% year-on-year reduction in pre-provision profit.
Significant impairment provisions drive a statutory loss
The Group took a cautious approach to assessing its IFRS 9 impairment provisions by applying deliberately conservative economic assumptions and
scenario weightings, coupled with expert judgement credit risk overlays, to increase the Group’s on -balance sheet provisions to £735m and a total
coverage ratio of 102bps. This has led to the Group recognising £501m o f impairment charges (68bps cost of risk) inclusive of write-offs in the period. This
sizeable provision charge primarily explains the 77% year-on-year reduction in underlying profit to £124m compared to FY19 (£539m), with an underlying
RoTE of 0.6% (FY19: 10.8%)
After exceptional costs of £292m, including £139m of integration and transformation costs and £113m of acquisition accounting unwind, the Group
recorded a statutory loss after tax of £141m.
Robust capital, liquidity and funding position
Importantly though, the Group’s balance sheet remains robust as we enter a period of economic stress with a transitional CET1 ratio of 13.4%. The Group
therefore retains a significant CET1 management buffer in excess of its Capital Requirements Directive IV (CRD IV) minimum CET1 requirement of 9.5%,
equating to c.£950m, in addition to the Group’s £735m of on -balance sheet credit provisions. The Group also maintains a strong liquidity position with an
LCR of 140% and a stable funding position with a loan-to-deposit ratio of 107%.
Conclusion
2020 has been a difficult year for all, but I am happy with the way our colleagues have risen to the challenge of supporting our customers and
communities, while ensuring the stability of the bank. Our conservative provisioning assumptions mean we have robust coverage levels going into a period
of economic stress.
In the medium term, the Group believes that, assuming no significant further deterioration in expectations for the economic outlook or change in interest
rates, Virgin Money has a clear path to delivering double digit statutory returns on tangible equity over time. The improveme nt in returns will be built on:
the normalisation of impairments and exceptional costs; ensuring we continue to reduce our cost base to reflect the future operating environment;
optimising our balance sheet mix; and delivering a more efficient capital base over time.
Basis of preparation note
Statutory basis: The statutory results are set out at the end of this section on page 16.
Underlying basis: The results are adjusted to remove certain items that do not promote an understanding of historical or future trends of earnings or
cash flows, and therefore allows a more meaningful comparison of the Group’s underlying performance. A reconciliation from the underlying results to
the statutory basis is shown on page 17 and management’s rationale for the adjustments is shown on page 129.
Pro forma comparative results: We have prepared pro forma comparative results for the Group as if Virgin Money UK PLC and Virgin Money Holdings
(UK) PLC had always been a combined group, in order to assist in explaining trends in financial performance. A reconciliation between the results on a
comparative pro forma basis and a statutory basis is included on page 17. The pro forma comparative results are also presented on an underlying
basis as there were a number of factors which had a significant effect on the comparab ility of the Group’s financial position and results. Any reference
to pro forma results relates to the prior period only as the pro forma basis is not applicable in the current period due to the combined group being in
operation for the entire year.
9
Business and financial review
Chief Financial Officer’s review
Income
Summary for the year ended 30 September 2020
£m 2019
£m Change
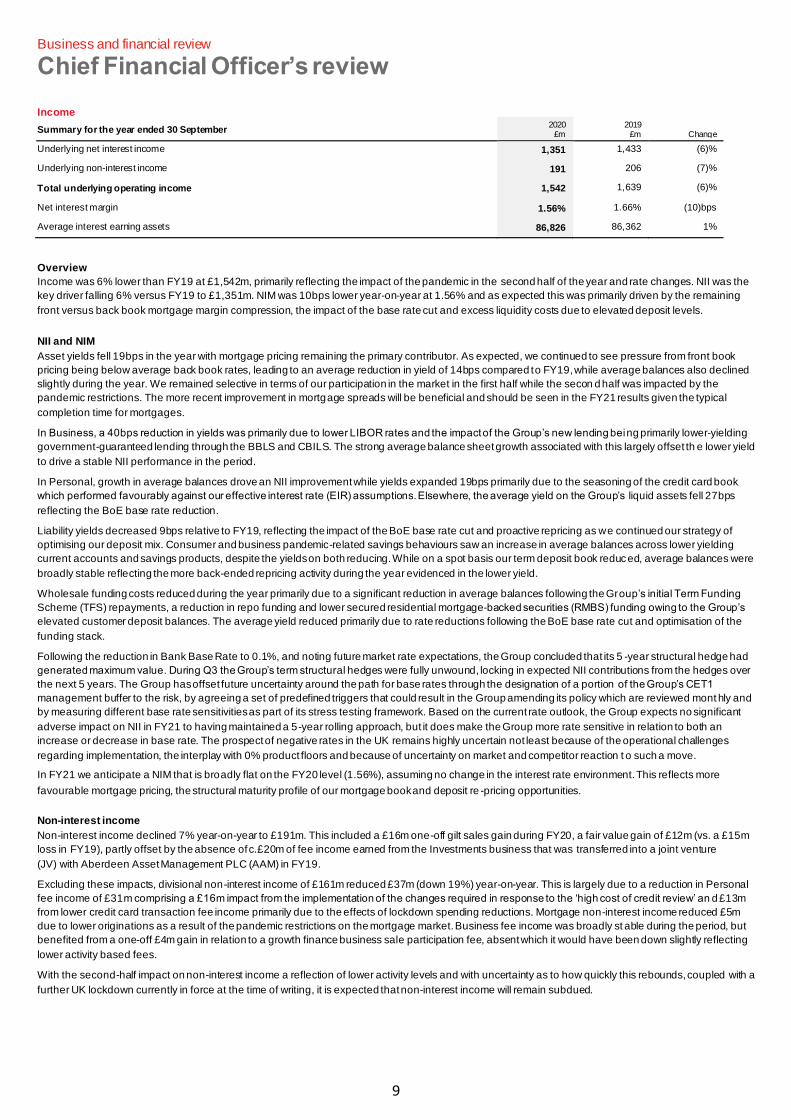
Underlying net interest income 1,351 1,433 (6)%
Underlying non-interest income 191 206 (7)%
Total underlying operating income 1,542 1,639 (6)%
Net interest margin 1.56% 1.66% (10)bps
Average interest earning assets 86,826 86,362 1%
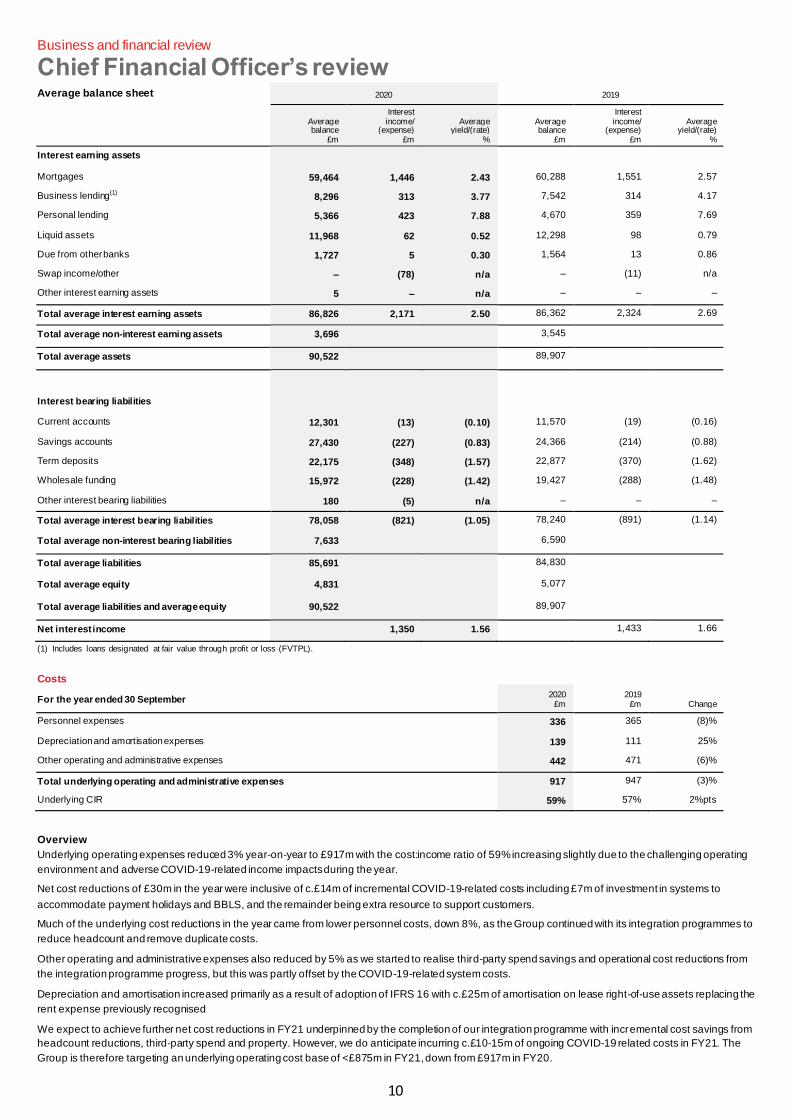
Overview
Income was 6% lower than FY19 at £1,542m, primarily reflecting the impact of the pandemic in the second half of the year and rate changes. NII was the
key driver falling 6% versus FY19 to £1,351m. NIM was 10bps lower year-on-year at 1.56% and as expected this was primarily driven by the remaining
front versus back book mortgage margin compression, the impact of the base rate cut and excess liquidity costs due to elevated deposit levels.
NII and NIM
Asset yields fell 19bps in the year with mortgage pricing remaining the primary contributor. As expected, we continued to see pressure from front book
pricing being below average back book rates, leading to an average reduction in yield of 14bps compared to FY19, while average balances also declined
slightly during the year. We remained selective in terms of our participation in the market in the first half while the secon d half was impacted by the
pandemic restrictions. The more recent improvement in mortgage spreads will be beneficial and should be seen in the FY21 results given the typical
completion time for mortgages.
In Business, a 40bps reduction in yields was primarily due to lower LIBOR rates and the impact of the Group’s new lending being primarily lower-yielding
government-guaranteed lending through the BBLS and CBILS. The strong average balance sheet growth associated with this largely offset th e lower yield
to drive a stable NII performance in the period.
In Personal, growth in average balances drove an NII improvement while yields expanded 19bps primarily due to the seasoning of the credit card book
which performed favourably against our effective interest rate (EIR) assumptions. Elsewhere, the average yield on the Group’s liquid assets fell 27bps
reflecting the BoE base rate reduction.
Liability yields decreased 9bps relative to FY19, reflecting the impact of the BoE base rate cut and proactive repricing as we continued our strategy of
optimising our deposit mix. Consumer and business pandemic-related savings behaviours saw an increase in average balances across lower yielding
current accounts and savings products, despite the yields on both reducing. While on a spot basis our term deposit book reduced, average balances were
broadly stable reflecting the more back-ended repricing activity during the year evidenced in the lower yield.
Wholesale funding costs reduced during the year primarily due to a significant reduction in average balances following the Group’s initial Term Funding
Scheme (TFS) repayments, a reduction in repo funding and lower secured residential mortgage-backed securities (RMBS) funding owing to the Group’s
elevated customer deposit balances. The average yield reduced primarily due to rate reductions following the BoE base rate cut and optimisation of the
funding stack.
Following the reduction in Bank Base Rate to 0.1%, and noting future market rate expectations, the Group concluded that its 5 -year structural hedge had
generated maximum value. During Q3 the Group’s term structural hedges were fully unwound, locking in expected NII contributions from the hedges over
the next 5 years. The Group has offset future uncertainty around the path for base rates through the designation of a portion of the Group’s CET1
management buffer to the risk, by agreeing a set of predefined triggers that could result in the Group amending its policy which are reviewed mont hly and
by measuring different base rate sensitivities as part of its stress testing framework. Based on the current rate outlook, the Group expects no significant
adverse impact on NII in FY21 to having maintained a 5-year rolling approach, but it does make the Group more rate sensitive in relation to both an
increase or decrease in base rate. The prospect of negative rates in the UK remains highly uncertain not least because of the operational challenges
regarding implementation, the interplay with 0% product floors and because of uncertainty on market and competitor reaction t o such a move.
In FY21 we anticipate a NIM that is broadly flat on the FY20 level (1.56%), assuming no change in the interest rate environment. This reflects more
favourable mortgage pricing, the structural maturity profile of our mortgage book and deposit re -pricing opportunities.
Non-interest income
Non-interest income declined 7% year-on-year to £191m. This included a £16m one-off gilt sales gain during FY20, a fair value gain of £12m (vs. a £15m
loss in FY19), partly offset by the absence of c.£20m of fee income earned from the Investments business that was transferred into a joint venture
(JV) with Aberdeen Asset Management PLC (AAM) in FY19.
Excluding these impacts, divisional non-interest income of £161m reduced £37m (down 19%) year-on-year. This is largely due to a reduction in Personal
fee income of £31m comprising a £16m impact from the implementation of the changes required in response to the ‘high cost of credit review’ an d £13m
from lower credit card transaction fee income primarily due to the effects of lockdown spending reductions. Mortgage non-interest income reduced £5m
due to lower originations as a result of the pandemic restrictions on the mortgage market. Business fee income was broadly st able during the period, but
benefited from a one-off £4m gain in relation to a growth finance business sale participation fee, absent which it would have been down slightly reflecting
lower activity based fees.
With the second-half impact on non-interest income a reflection of lower activity levels and with uncertainty as to how quickly this rebounds, coupled with a
further UK lockdown currently in force at the time of writing, it is expected that non-interest income will remain subdued.
10
Business and financial review
Chief Financial Officer’s review Average balance sheet
2020 2019
Average balance
£m
Interest income/
(expense) £m
Average yield/(rate)
%
Average balance
£m
Interest income/
(expense) £m
Average yield/(rate)
%
Interest earning assets Mortgages 59,464 1,446 2.43 60,288 1,551 2.57
Business lending(1) 8,296 313 3.77 7,542 314 4.17
Personal lending 5,366 423 7.88 4,670 359 7.69
Liquid assets 11,968 62 0.52 12,298 98 0.79
Due from other banks 1,727 5 0.30 1,564 13 0.86
Swap income/other – (78) n/a – (11) n/a
Other interest earning assets 5 – n/a – – –
Total average interest earning assets 86,826 2,171 2.50 86,362 2,324 2.69
Total average non-interest earning assets 3,696 3,545 Total average assets 90,522 89,907
Interest bearing liabilities Current accounts 12,301 (13) (0.10) 11,570 (19) (0.16)
Savings accounts 27,430 (227) (0.83) 24,366 (214) (0.88)
Term deposits 22,175 (348) (1.57) 22,877 (370) (1.62)
Wholesale funding 15,972 (228) (1.42) 19,427 (288) (1.48)
Other interest bearing liabilities 180 (5) n/a – – –
Total average interest bearing liabilities 78,058 (821) (1.05) 78,240 (891) (1.14)
Total average non-interest bearing liabilities 7,633 6,590 Total average liabilities 85,691 84,830 Total average equity 4,831 5,077 Total average liabilities and average equity 90,522 89,907 Net interest income 1,350 1.56 1,433 1.66
(1) Includes loans designated at fair value through profit or loss (FVTPL).
Costs
For the year ended 30 September 2020
£m 2019
£m Change
Personnel expenses 336 365 (8)%
Depreciation and amortisation expenses 139 111 25%
Other operating and administrative expenses 442 471 (6)%
Total underlying operating and administrative expenses 917 947 (3)%
Underlying CIR 59% 57% 2%pts
Overview
Underlying operating expenses reduced 3% year-on-year to £917m with the cost:income ratio of 59% increasing slightly due to the challenging operating
environment and adverse COVID-19-related income impacts during the year.
Net cost reductions of £30m in the year were inclusive of c.£14m of incremental COVID-19-related costs including £7m of investment in systems to
accommodate payment holidays and BBLS, and the remainder being extra resource to support customers.
Much of the underlying cost reductions in the year came from lower personnel costs, down 8%, as the Group continued with its integration programmes to
reduce headcount and remove duplicate costs.
Other operating and administrative expenses also reduced by 5% as we started to realise third-party spend savings and operational cost reductions from
the integration programme progress, but this was partly offset by the COVID-19-related system costs.
Depreciation and amortisation increased primarily as a result of adoption of IFRS 16 with c.£25m of amortisation on lease right-of-use assets replacing the
rent expense previously recognised
We expect to achieve further net cost reductions in FY21 underpinned by the completion of our integration programme with incremental cost savings from
headcount reductions, third-party spend and property. However, we do anticipate incurring c.£10-15m of ongoing COVID-19 related costs in FY21. The
Group is therefore targeting an underlying operating cost base of <£875m in FY21, down from £917m in FY20.
11
Business and financial review
Chief Financial Officer’s review
Impairments
Credit provisions at
30 September 2019
£m
Credit provisions at
30 September 2020
£m
Gross lending at 30 September
2020 £bn
Coverage ratio
2020 bps
Net cost of risk 2020 bps
% of loans in Stage 2 at
30 September 2020
% of loans in Stage 3 at
30 September 2020
Mortgages 40 131 58.6 23 16 14% 0.9%
Personal 175 301 5.6 591 423 15% 1.2%
Of which credit cards 145 222 4.5 537 355 12% 1.2%
Of which personal loans and
overdrafts 30 79 1.1 824 721 28% 1.4%
Business 147 303 8.7 391 (1) 212 44% 3.2%
Total 362 735 72.9 102 68 18% 1.2%
Of which Stage 2 168 465 12.8 366
Of which Stage 3 115 134 0.9 1,574 (1) Government-guaranteed loan balances excluded for purposes of calculating the Business division coverage ratio.
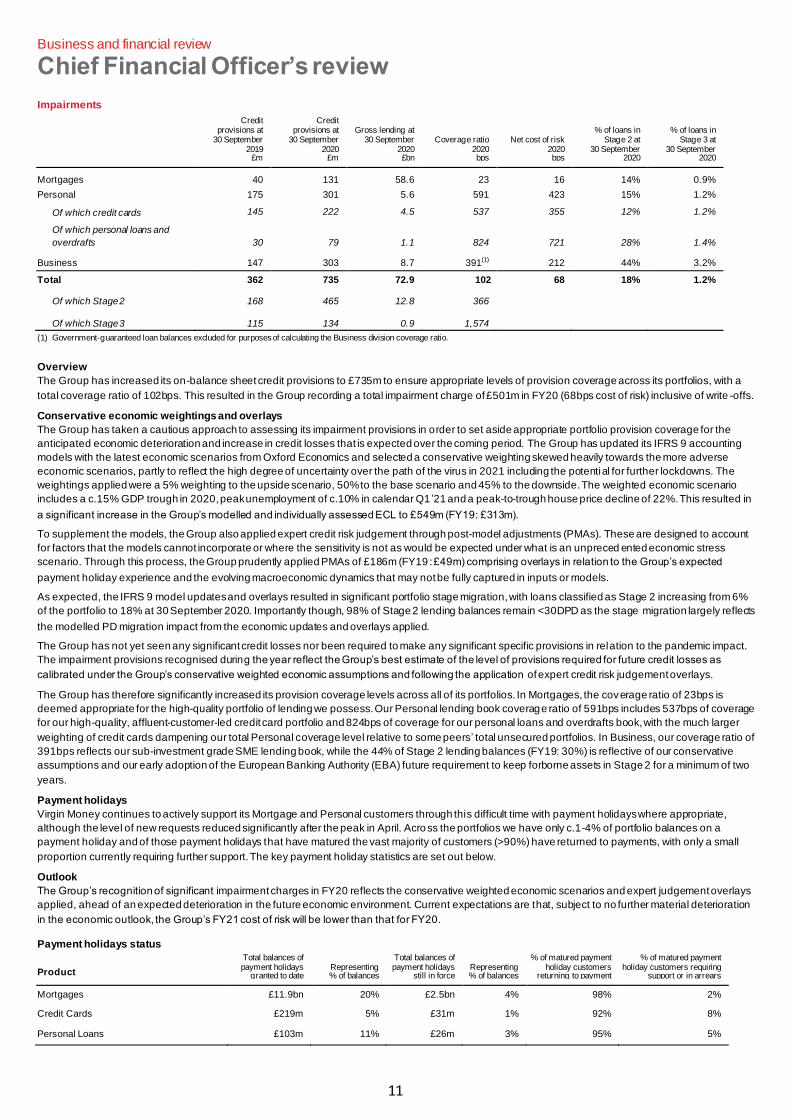
Overview
The Group has increased its on-balance sheet credit provisions to £735m to ensure appropriate levels of provision coverage across its portfolios, with a
total coverage ratio of 102bps. This resulted in the Group recording a total impairment charge of £501m in FY20 (68bps cost of risk) inclusive of write -offs.
Conservative economic weightings and overlays
The Group has taken a cautious approach to assessing its impairment provisions in order to set aside appropriate portfolio provision coverage for the
anticipated economic deterioration and increase in credit losses that is expected over the coming period. The Group has updated its IFRS 9 accounting
models with the latest economic scenarios from Oxford Economics and selected a conservative weighting skewed heavily towards the more adverse
economic scenarios, partly to reflect the high degree of uncertainty over the path of the virus in 2021 including the potential for further lockdowns. The
weightings applied were a 5% weighting to the upside scenario, 50% to the base scenario and 45% to the downside. The weighted economic scenario
includes a c.15% GDP trough in 2020, peak unemployment of c.10% in calendar Q1 ’21 and a peak-to-trough house price decline of 22%. This resulted in
a significant increase in the Group’s modelled and individually assessed ECL to £549m (FY19: £313m).
To supplement the models, the Group also applied expert credit risk judgement through post-model adjustments (PMAs). These are designed to account
for factors that the models cannot incorporate or where the sensitivity is not as would be expected under what is an unpreced ented economic stress
scenario. Through this process, the Group prudently applied PMAs of £186m (FY19 : £49m) comprising overlays in relation to the Group’s expected
payment holiday experience and the evolving macroeconomic dynamics that may not be fully captured in inputs or models.
As expected, the IFRS 9 model updates and overlays resulted in significant portfolio stage migration, with loans classified as Stage 2 increasing from 6%
of the portfolio to 18% at 30 September 2020. Importantly though, 98% of Stage 2 lending balances remain <30DPD as the stage migration largely reflects
the modelled PD migration impact from the economic updates and overlays applied.
The Group has not yet seen any significant credit losses nor been required to make any significant specific provisions in relation to the pandemic impact.
The impairment provisions recognised during the year reflect the Group’s best estimate of the level of provisions required for future credit losses as
calibrated under the Group’s conservative weighted economic assumptions and following the application of expert credit risk judgement overlays.
The Group has therefore significantly increased its provision coverage levels across all of its portfolios. In Mortgages, the coverage ratio of 23bps is
deemed appropriate for the high-quality portfolio of lending we possess. Our Personal lending book coverage ratio of 591bps includes 537bps of coverage
for our high-quality, affluent-customer-led credit card portfolio and 824bps of coverage for our personal loans and overdrafts book, with the much larger
weighting of credit cards dampening our total Personal coverage level relative to some peers’ total unsecured portfolios. In Business, our coverage ratio of
391bps reflects our sub-investment grade SME lending book, while the 44% of Stage 2 lending balances (FY19: 30%) is reflective of our conservative
assumptions and our early adoption of the European Banking Authority (EBA) future requirement to keep forborne assets in Stage 2 for a minimum of two
years.
Payment holidays
Virgin Money continues to actively support its Mortgage and Personal customers through this difficult time with payment holidays where appropriate,
although the level of new requests reduced significantly after the peak in April. Across the portfolios we have only c.1-4% of portfolio balances on a
payment holiday and of those payment holidays that have matured the vast majority of customers (>90%) have returned to payments, with only a small
proportion currently requiring further support. The key payment holiday statistics are set out below.
Outlook
The Group’s recognition of significant impairment charges in FY20 reflects the conservative weighted economic scenarios and expert judgement overlays
applied, ahead of an expected deterioration in the future economic environment. Current expectations are that, subject to no further material deterioration
in the economic outlook, the Group’s FY21 cost of risk will be lower than that for FY20.
Payment holidays status
Product
Total balances of payment holidays
granted to date Representing % of balances
Total balances of payment holidays
still in force Representing % of balances
% of matured payment holiday customers
returning to payment
% of matured payment holiday customers requiring
support or in arrears
Mortgages £11.9bn 20% £2.5bn 4% 98% 2%
Credit Cards £219m 5% £31m 1% 92% 8%
Personal Loans £103m 11% £26m 3% 95% 5%
12
Business and financial review
Chief Financial Officer’s review Exceptional items and statutory loss
2020 £m
2019 £m
Underlying profit on ordinary activities before tax 124 539
Exceptional items
– Integration and transformation costs (139) (156)
– Acquisition accounting unwinds (113) (87)
– Legacy conduct costs (26) (433)
– Other items (14) (128)
Loss on ordinary activities before tax (168) (265)
Add Virgin Money Holdings (UK) PLC pre-acquisition loss(1) – 33
Statutory loss on ordinary activities before tax (168) (232)
Tax credit 27 53
Statutory loss for the year (141) (179)
Underlying RoTE 0.6% 10.8%
Statutory RoTE (6.2)% (6.8)%
Tangible Net Asset Value (TNAV) per share 244.2p 249.2p
(1) In order to reconcile the 2019 pro forma loss to the statutory loss, the pre-acquisition results of Virgin Money Holdings (UK) PLC are removed.
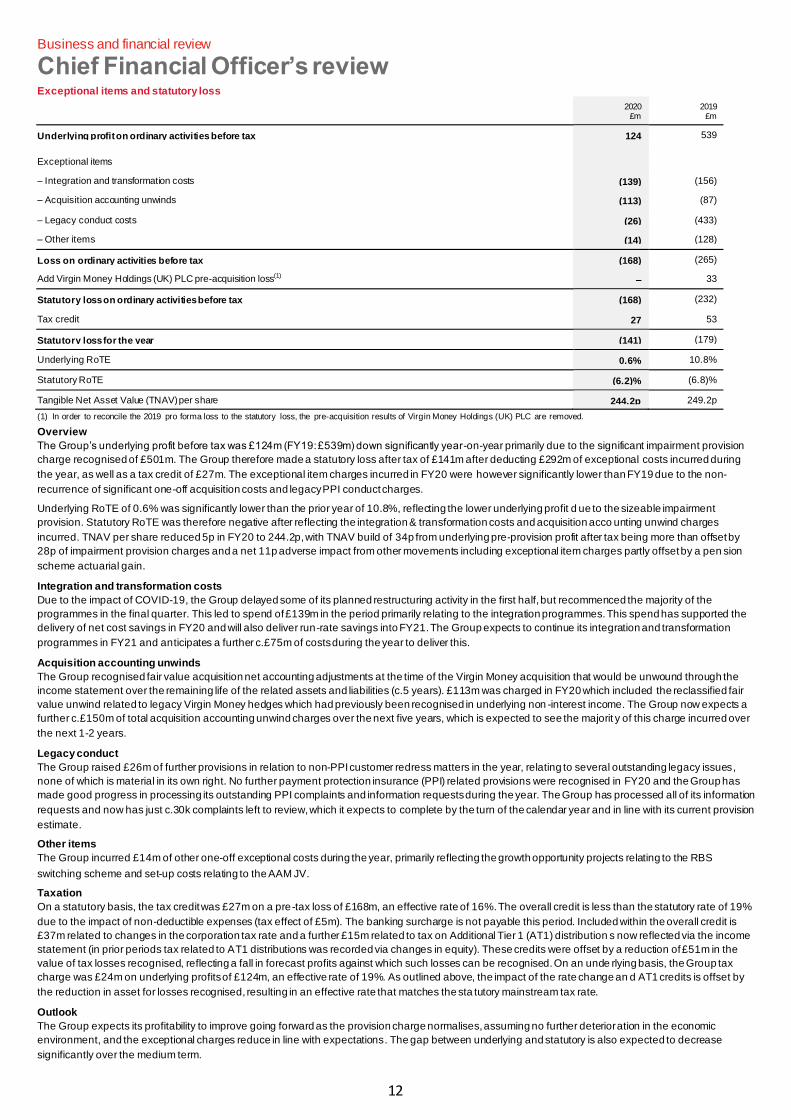
Overview
The Group’s underlying profit before tax was £124m (FY19: £539m) down significantly year-on-year primarily due to the significant impairment provision
charge recognised of £501m. The Group therefore made a statutory loss after tax of £141m after deducting £292m of exceptional costs incurred during
the year, as well as a tax credit of £27m. The exceptional item charges incurred in FY20 were however significantly lower than FY19 due to the non-
recurrence of significant one-off acquisition costs and legacy PPI conduct charges.
Underlying RoTE of 0.6% was significantly lower than the prior year of 10.8%, reflecting the lower underlying profit d ue to the sizeable impairment
provision. Statutory RoTE was therefore negative after reflecting the integration & transformation costs and acquisition acco unting unwind charges
incurred. TNAV per share reduced 5p in FY20 to 244.2p, with TNAV build of 34p from underlying pre-provision profit after tax being more than offset by
28p of impairment provision charges and a net 11p adverse impact from other movements including exceptional item charges partly offset by a pen sion
scheme actuarial gain.
Integration and transformation costs
Due to the impact of COVID-19, the Group delayed some of its planned restructuring activity in the first half, but recommenced the majority of the
programmes in the final quarter. This led to spend of £139m in the period primarily relating to the integration programmes. This spend has supported the
delivery of net cost savings in FY20 and will also deliver run-rate savings into FY21. The Group expects to continue its integration and transformation
programmes in FY21 and anticipates a further c.£75m of costs during the year to deliver this.
Acquisition accounting unwinds
The Group recognised fair value acquisition net accounting adjustments at the time of the Virgin Money acquisition that would be unwound through the
income statement over the remaining life of the related assets and liabilities (c.5 years). £113m was charged in FY20 which included the reclassified fair
value unwind related to legacy Virgin Money hedges which had previously been recognised in underlying non -interest income. The Group now expects a
further c.£150m of total acquisition accounting unwind charges over the next five years, which is expected to see the majorit y of this charge incurred over
the next 1-2 years.
Legacy conduct
The Group raised £26m of further provisions in relation to non-PPI customer redress matters in the year, relating to several outstanding legacy issues,
none of which is material in its own right. No further payment protection insurance (PPI) related provisions were recognised in FY20 and the Group has
made good progress in processing its outstanding PPI complaints and information requests during the year. The Group has processed all of its information
requests and now has just c.30k complaints left to review, which it expects to complete by the turn of the calendar year and in line with its current provision
estimate.
Other items
The Group incurred £14m of other one-off exceptional costs during the year, primarily reflecting the growth opportunity projects relating to the RBS
switching scheme and set-up costs relating to the AAM JV.
Taxation
On a statutory basis, the tax credit was £27m on a pre-tax loss of £168m, an effective rate of 16%. The overall credit is less than the statutory rate of 19%
due to the impact of non-deductible expenses (tax effect of £5m). The banking surcharge is not payable this period. Included within the overall credit is
£37m related to changes in the corporation tax rate and a further £15m related to tax on Additional Tier 1 (AT1) distribution s now reflected via the income
statement (in prior periods tax related to AT1 distributions was recorded via changes in equity). These credits were offset by a reduction of £51m in the
value of tax losses recognised, reflecting a fall in forecast profits against which such losses can be recognised. On an unde rlying basis, the Group tax
charge was £24m on underlying profits of £124m, an effective rate of 19%. As outlined above, the impact of the rate change an d AT1 credits is offset by
the reduction in asset for losses recognised, resulting in an effective rate that matches the sta tutory mainstream tax rate.
Outlook
The Group expects its profitability to improve going forward as the provision charge normalises, assuming no further deterioration in the economic
environment, and the exceptional charges reduce in line with expectations. The gap between underlying and statutory is also expected to decrease
significantly over the medium term.
13
Business and financial review
Chief Financial Officer’s review
Balance sheet
As at 30 September 2020 2019 Change
Mortgages 58,290 60,079 (3.0)%
Personal 5,219 5,024 3.9%
Business 8,948 7,876 13.6%
of which BBLS 809 – n/a
of which CBILS 334 – n/a
Total customer lending 72,457 72,979 (0.7)%
Relationship deposits(1) 25,675 21,347 20.3%
Non-linked savings 20,729 20,197 2.6%
Term deposits 21,107 22,243 (5.1)%
Total customer deposits 67,511 63,787 5.8%
Wholesale funding 14,227 18,506 (23.1)%
of which TFS 4,108 7,342 (44.0)%
of which TFSME 1,300 – n/a
LDR 107% 114% (7)%pts
LCR 140% 152% (12)%pts
(1) Current account and linked savings balances.
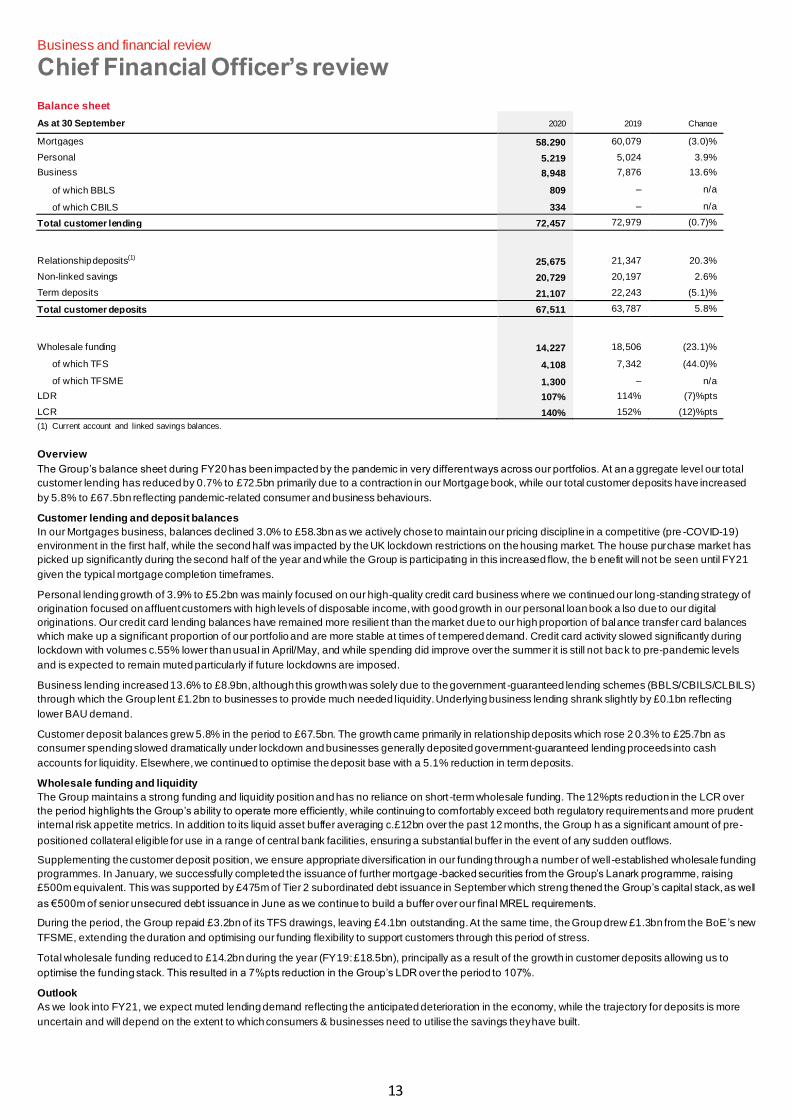
Overview
The Group’s balance sheet during FY20 has been impacted by the pandemic in very different ways across our portfolios. At an a ggregate level our total
customer lending has reduced by 0.7% to £72.5bn primarily due to a contraction in our Mortgage book, while our total customer deposits have increased
by 5.8% to £67.5bn reflecting pandemic-related consumer and business behaviours.
Customer lending and deposit balances
In our Mortgages business, balances declined 3.0% to £58.3bn as we actively chose to maintain our pricing discipline in a competitive (pre -COVID-19)
environment in the first half, while the second half was impacted by the UK lockdown restrictions on the housing market. The house purchase market has
picked up significantly during the second half of the year and while the Group is participating in this increased flow, the b enefit will not be seen until FY21
given the typical mortgage completion timeframes.
Personal lending growth of 3.9% to £5.2bn was mainly focused on our high-quality credit card business where we continued our long-standing strategy of
origination focused on affluent customers with high levels of disposable income, with good growth in our personal loan book a lso due to our digital
originations. Our credit card lending balances have remained more resilient than the market due to our high proportion of balance transfer card balances
which make up a significant proportion of our portfolio and are more stable at times of tempered demand. Credit card activity slowed significantly during
lockdown with volumes c.55% lower than usual in April/May, and while spending did improve over the summer it is still not back to pre-pandemic levels
and is expected to remain muted particularly if future lockdowns are imposed.
Business lending increased 13.6% to £8.9bn, although this growth was solely due to the government -guaranteed lending schemes (BBLS/CBILS/CLBILS)
through which the Group lent £1.2bn to businesses to provide much needed liquidity. Underlying business lending shrank slightly by £0.1bn reflecting
lower BAU demand.
Customer deposit balances grew 5.8% in the period to £67.5bn. The growth came primarily in relationship deposits which rose 2 0.3% to £25.7bn as
consumer spending slowed dramatically under lockdown and businesses generally deposited government-guaranteed lending proceeds into cash
accounts for liquidity. Elsewhere, we continued to optimise the deposit base with a 5.1% reduction in term deposits.
Wholesale funding and liquidity
The Group maintains a strong funding and liquidity position and has no reliance on short -term wholesale funding. The 12%pts reduction in the LCR over
the period highlights the Group’s ability to operate more efficiently, while continuing to comfortably exceed both regulatory requirements and more prudent
internal risk appetite metrics. In addition to its liquid asset buffer averaging c.£12bn over the past 12 months, the Group h as a significant amount of pre-
positioned collateral eligible for use in a range of central bank facilities, ensuring a substantial buffer in the event of any sudden outflows.
Supplementing the customer deposit position, we ensure appropriate diversification in our funding through a number of well -established wholesale funding
programmes. In January, we successfully completed the issuance of further mortgage -backed securities from the Group’s Lanark programme, raising
£500m equivalent. This was supported by £475m of Tier 2 subordinated debt issuance in September which streng thened the Group’s capital stack, as well
as €500m of senior unsecured debt issuance in June as we continue to build a buffer over our final MREL requirements.
During the period, the Group repaid £3.2bn of its TFS drawings, leaving £4.1bn outstanding. At the same time, the Group drew £1.3bn from the BoE ’s new
TFSME, extending the duration and optimising our funding flexibility to support customers through this period of stress.
Total wholesale funding reduced to £14.2bn during the year (FY19: £18.5bn), principally as a result of the growth in customer deposits allowing us to
optimise the funding stack. This resulted in a 7%pts reduction in the Group’s LDR over the period to 107%.
Outlook
As we look into FY21, we expect muted lending demand reflecting the anticipated deterioration in the economy, while the trajectory for deposits is more
uncertain and will depend on the extent to which consumers & businesses need to utilise the savings they have built.
14
Business and financial review
Chief Financial Officer’s review
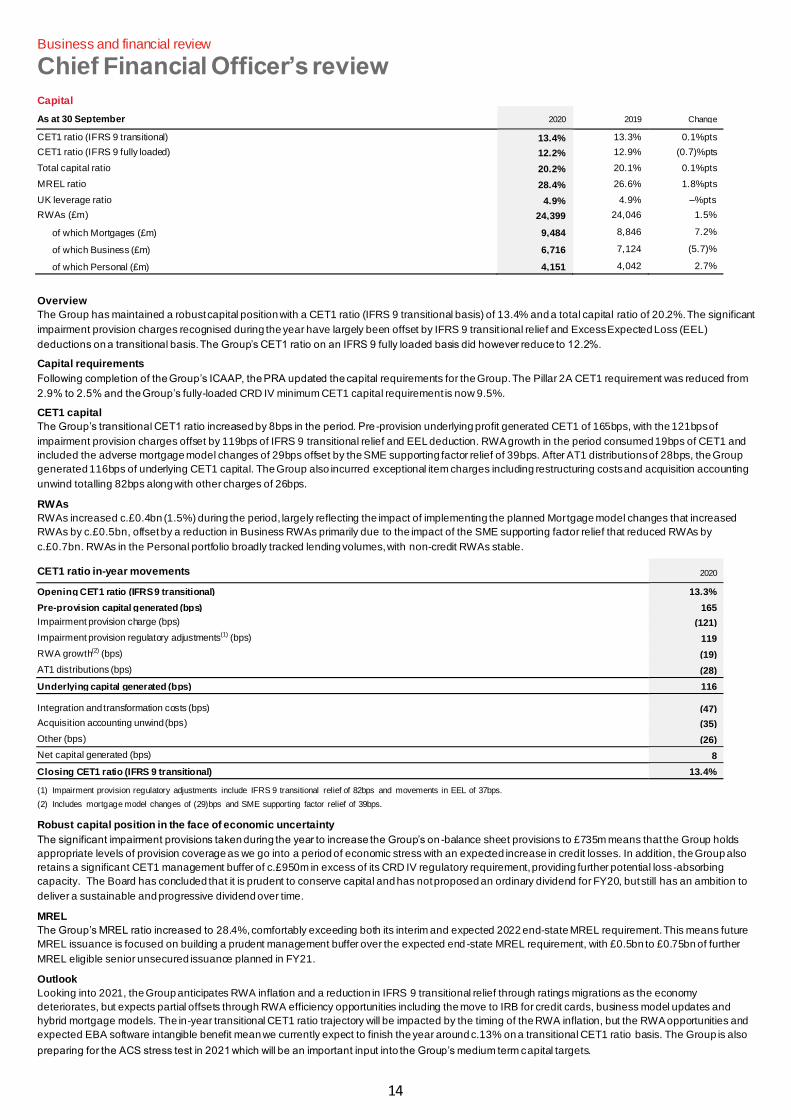
Capital
As at 30 September 2020 2019 Change
CET1 ratio (IFRS 9 transitional) 13.4% 13.3% 0.1%pts
CET1 ratio (IFRS 9 fully loaded) 12.2% 12.9% (0.7)%pts
Total capital ratio 20.2% 20.1% 0.1%pts
MREL ratio 28.4% 26.6% 1.8%pts
UK leverage ratio 4.9% 4.9% –%pts
RWAs (£m) 24,399 24,046 1.5%
of which Mortgages (£m) 9,484 8,846 7.2%
of which Business (£m) 6,716 7,124 (5.7)%
of which Personal (£m) 4,151 4,042 2.7%
Overview
The Group has maintained a robust capital position with a CET1 ratio (IFRS 9 transitional basis) of 13.4% and a total capital ratio of 20.2%. The significant
impairment provision charges recognised during the year have largely been offset by IFRS 9 transit ional relief and Excess Expected Loss (EEL)
deductions on a transitional basis. The Group’s CET1 ratio on an IFRS 9 fully loaded basis did however reduce to 12.2%.
Capital requirements
Following completion of the Group’s ICAAP, the PRA updated the capital requirements for the Group. The Pillar 2A CET1 requirement was reduced from
2.9% to 2.5% and the Group’s fully-loaded CRD IV minimum CET1 capital requirement is now 9.5%.
CET1 capital
The Group’s transitional CET1 ratio increased by 8bps in the period. Pre -provision underlying profit generated CET1 of 165bps, with the 121bps of
impairment provision charges offset by 119bps of IFRS 9 transitional relief and EEL deduction. RWA growth in the period consumed 19bps of CET1 and
included the adverse mortgage model changes of 29bps offset by the SME supporting factor relief of 39bps. After AT1 distributions of 28bps, the Group
generated 116bps of underlying CET1 capital. The Group also incurred exceptional item charges including restructuring costs and acquisition accounting
unwind totalling 82bps along with other charges of 26bps.
RWAs
RWAs increased c.£0.4bn (1.5%) during the period, largely reflecting the impact of implementing the planned Mortgage model changes that increased
RWAs by c.£0.5bn, offset by a reduction in Business RWAs primarily due to the impact of the SME supporting factor relief that reduced RWAs by
c.£0.7bn. RWAs in the Personal portfolio broadly tracked lending volumes, with non-credit RWAs stable.
CET1 ratio in-year movements 2020
Opening CET1 ratio (IFRS 9 transitional) 13.3%
Pre-provision capital generated (bps) 165
Impairment provision charge (bps) (121)
Impairment provision regulatory adjustments(1) (bps) 119
RWA growth(2) (bps) (19)
AT1 distributions (bps) (28)
Underlying capital generated (bps) 116
Integration and transformation costs (bps) (47)
Acquisition accounting unwind (bps) (35)
Other (bps) (26)
Net capital generated (bps) 8
Closing CET1 ratio (IFRS 9 transitional) 13.4%
(1) Impairment provision regulatory adjustments include IFRS 9 transitional relief of 82bps and movements in EEL of 37bps.
(2) Includes mortgage model changes of (29)bps and SME supporting factor relief of 39bps.
Robust capital position in the face of economic uncertainty
The significant impairment provisions taken during the year to increase the Group’s on -balance sheet provisions to £735m means that the Group holds
appropriate levels of provision coverage as we go into a period of economic stress with an expected increase in credit losses. In addition, the Group also
retains a significant CET1 management buffer of c.£950m in excess of its CRD IV regulatory requirement, providing further potential loss-absorbing
capacity.The Board has concluded that it is prudent to conserve capital and has not proposed an ordinary dividend for FY20, but still has an ambition to
deliver a sustainable and progressive dividend over time.
MREL
The Group’s MREL ratio increased to 28.4%, comfortably exceeding both its interim and expected 2022 end-state MREL requirement. This means future
MREL issuance is focused on building a prudent management buffer over the expected end -state MREL requirement, with £0.5bn to £0.75bn of further
MREL eligible senior unsecured issuance planned in FY21.
Outlook
Looking into 2021, the Group anticipates RWA inflation and a reduction in IFRS 9 transitional relief through ratings migrations as the economy
deteriorates, but expects partial offsets through RWA efficiency opportunities including the move to IRB for credit cards, business model updates and
hybrid mortgage models. The in-year transitional CET1 ratio trajectory will be impacted by the timing of the RWA inflation, but the RWA opportunities and
expected EBA software intangible benefit mean we currently expect to finish the year around c.13% on a transitional CET1 ratio basis. The Group is also
preparing for the ACS stress test in 2021 which will be an important input into the Group’s medium term capital targets.
15
Business and financial review
Chief Financial Officer’s review
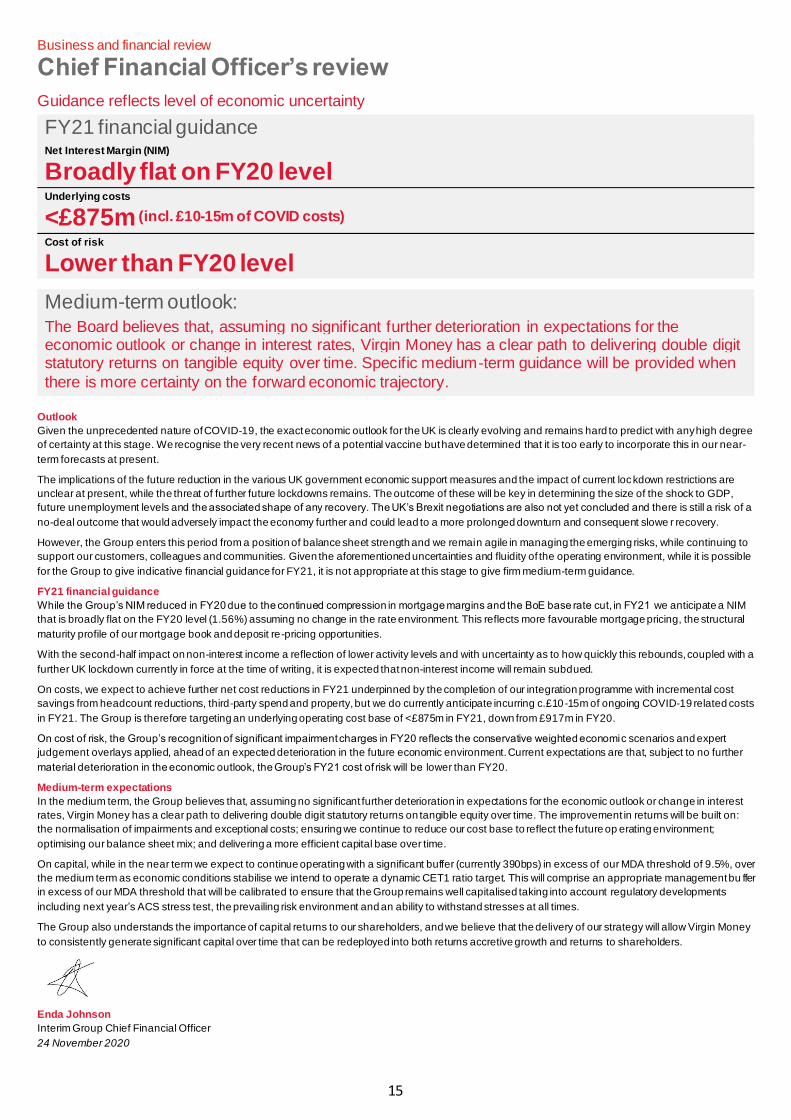
Guidance reflects level of economic uncertainty
FY21 financial guidance Net Interest Margin (NIM)
Broadly flat on FY20 level Underlying costs
<£875m (incl. £10-15m of COVID costs)
Cost of risk
Lower than FY20 level
Medium-term outlook: The Board believes that, assuming no significant further deterioration in expectations for the economic outlook or change in interest rates, Virgin Money has a clear path to delivering double digit statutory returns on tangible equity over time. Specific medium-term guidance will be provided when
there is more certainty on the forward economic trajectory.
Outlook
Given the unprecedented nature of COVID-19, the exact economic outlook for the UK is clearly evolving and remains hard to predict with any high degree
of certainty at this stage. We recognise the very recent news of a potential vaccine but have determined that it is too early to incorporate this in our near-
term forecasts at present.
The implications of the future reduction in the various UK government economic support measures and the impact of current lockdown restrictions are
unclear at present, while the threat of further future lockdowns remains. The outcome of these will be key in determining the size of the shock to GDP,
future unemployment levels and the associated shape of any recovery. The UK’s Brexit negotiations are also not yet concluded and there is still a risk of a
no-deal outcome that would adversely impact the economy further and could lead to a more prolonged downturn and consequent slowe r recovery.
However, the Group enters this period from a position of balance sheet strength and we remain agile in managing the emerging risks, while continuing to
support our customers, colleagues and communities. Given the aforementioned uncertainties and fluidity of the operating environment, while it is possible
for the Group to give indicative financial guidance for FY21, it is not appropriate at this stage to give firm medium-term guidance.
FY21 financial guidance
While the Group’s NIM reduced in FY20 due to the continued compression in mortgage margins and the BoE base rate cut, in FY21 we anticipate a NIM
that is broadly flat on the FY20 level (1.56%) assuming no change in the rate environment. This reflects more favourable mortgage pricing, the structural
maturity profile of our mortgage book and deposit re-pricing opportunities.
With the second-half impact on non-interest income a reflection of lower activity levels and with uncertainty as to how quickly this rebounds, coupled with a
further UK lockdown currently in force at the time of writing, it is expected that non-interest income will remain subdued.
On costs, we expect to achieve further net cost reductions in FY21 underpinned by the completion of our integration programme with incremental cost
savings from headcount reductions, third-party spend and property, but we do currently anticipate incurring c.£10-15m of ongoing COVID-19 related costs
in FY21. The Group is therefore targeting an underlying operating cost base of <£875m in FY21, down from £917m in FY20.
On cost of risk, the Group’s recognition of significant impairment charges in FY20 reflects the conservative weighted economic scenarios and expert
judgement overlays applied, ahead of an expected deterioration in the future economic environment. Current expectations are that, subject to no further
material deterioration in the economic outlook, the Group’s FY21 cost of risk will be lower than FY20.
Medium-term expectations
In the medium term, the Group believes that, assuming no significant further deterioration in expectations for the economic outlook or change in interest
rates, Virgin Money has a clear path to delivering double digit statutory returns on tangible equity over time. The improvement in returns will be built on:
the normalisation of impairments and exceptional costs; ensuring we continue to reduce our cost base to reflect the future op erating environment;
optimising our balance sheet mix; and delivering a more efficient capital base over time.
On capital, while in the near term we expect to continue operating with a significant buffer (currently 390bps) in excess of our MDA threshold of 9.5%, over
the medium term as economic conditions stabilise we intend to operate a dynamic CET1 ratio target. This will comprise an appropriate management bu ffer
in excess of our MDA threshold that will be calibrated to ensure that the Group remains well capitalised taking into account regulatory developments
including next year’s ACS stress test, the prevailing risk environment and an ability to withstand stresses at all times.
The Group also understands the importance of capital returns to our shareholders, and we believe that the delivery of our strategy will allow Virgin Money
to consistently generate significant capital over time that can be redeployed into both returns accretive growth and returns to shareholders.
Enda Johnson
Interim Group Chief Financial Officer
24 November 2020
16
Business and financial review
Chief Financial Officer’s review
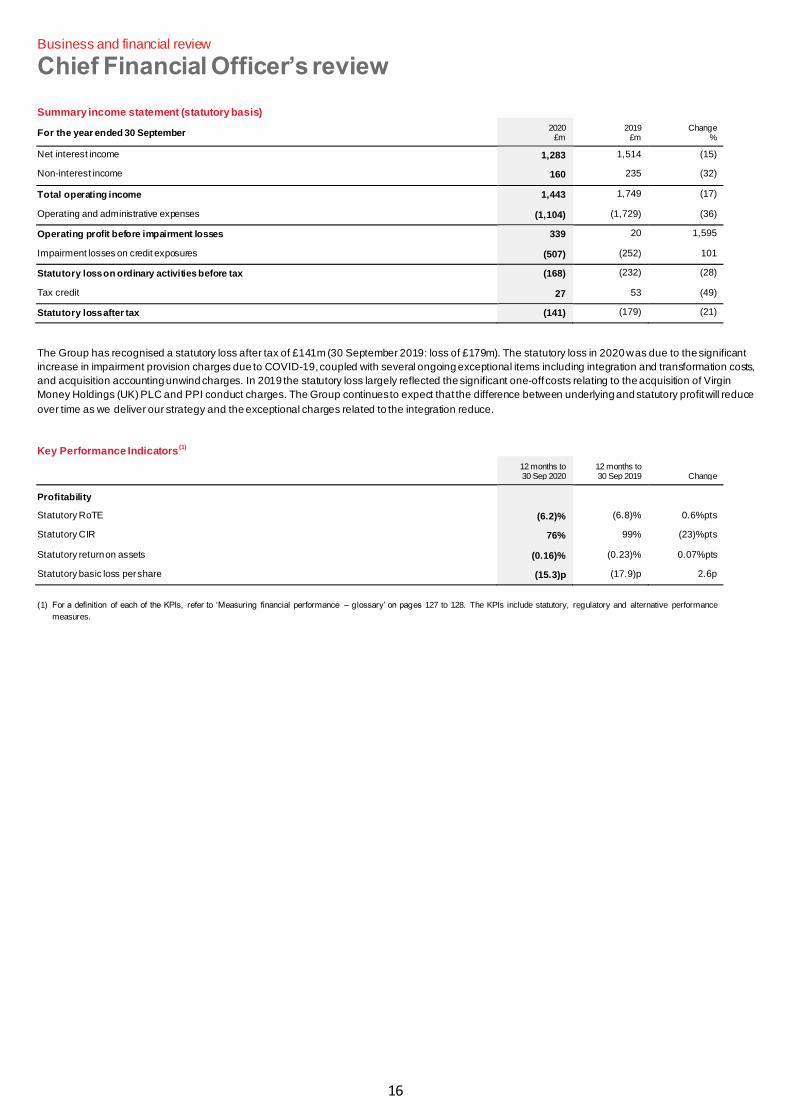
Summary income statement (statutory basis)
For the year ended 30 September 2020
£m 2019
£m Change
%
Net interest income 1,283 1,514 (15)
Non-interest income 160 235 (32)
Total operating income 1,443 1,749 (17)
Operating and administrative expenses (1,104) (1,729) (36)
Operating profit before impairment losses 339 20 1,595
Impairment losses on credit exposures (507) (252) 101
Statutory loss on ordinary activities before tax (168) (232) (28)
Tax credit 27 53 (49)
Statutory loss after tax (141) (179) (21)
The Group has recognised a statutory loss after tax of £141m (30 September 2019: loss of £179m). The statutory loss in 2020 was due to the significant
increase in impairment provision charges due to COVID-19, coupled with several ongoing exceptional items including integration and transformation costs,
and acquisition accounting unwind charges. In 2019 the statutory loss largely reflected the significant one-off costs relating to the acquisition of Virgin
Money Holdings (UK) PLC and PPI conduct charges. The Group continues to expect that the difference between underlying and statutory profit will reduce
over time as we deliver our strategy and the exceptional charges related to the integration reduce.
Key Performance Indicators(1)
12 months to 30 Sep 2020
12 months to 30 Sep 2019 Change
Profitability Statutory RoTE (6.2)% (6.8)% 0.6%pts
Statutory CIR 76% 99% (23)%pts
Statutory return on assets (0.16)% (0.23)% 0.07%pts
Statutory basic loss per share (15.3)p (17.9)p 2.6p
(1) For a definition of each of the KPIs, refer to ‘Measuring financial performance – glossary’ on pages 127 to 128. The KPIs include statutory, regulatory and alternative performance
measures.
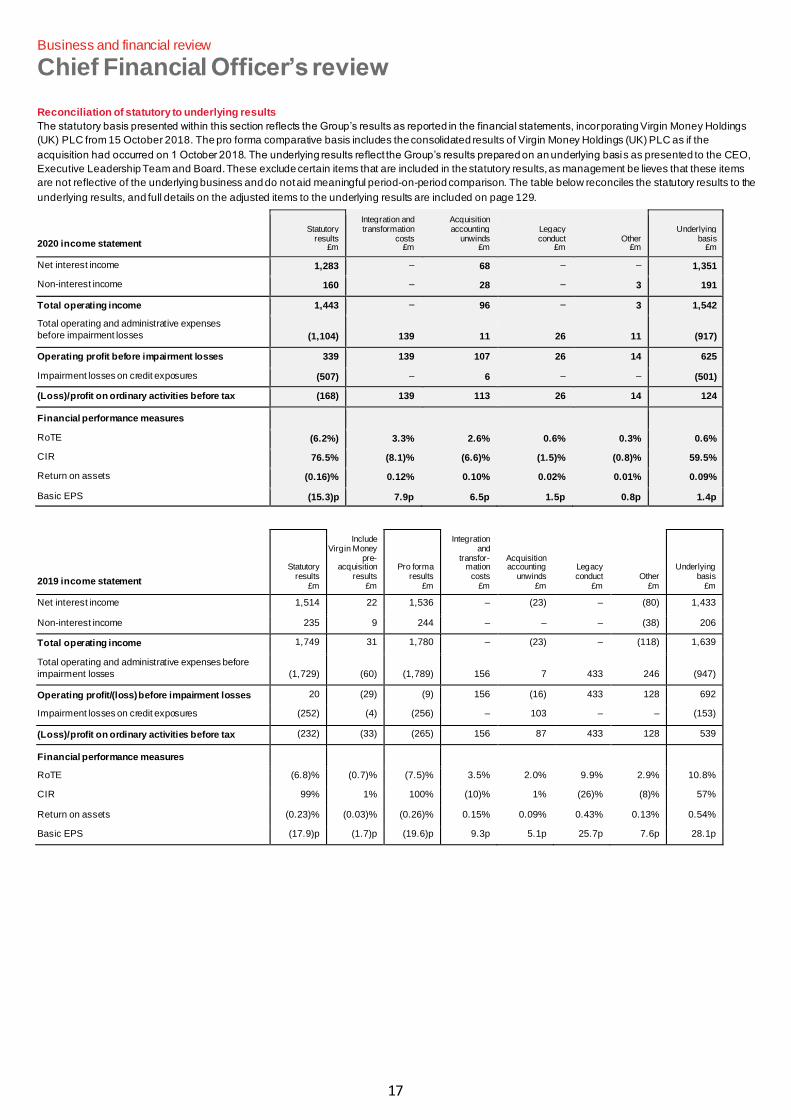
17
Business and financial review
Chief Financial Officer’s review
Reconciliation of statutory to underlying results
The statutory basis presented within this section reflects the Group’s results as reported in the financial statements, incorporating Virgin Money Holdings
(UK) PLC from 15 October 2018. The pro forma comparative basis includes the consolidated results of Virgin Money Holdings (UK) PLC as if the
acquisition had occurred on 1 October 2018. The underlying results reflect the Group’s results prepared on an underlying basis as presented to the CEO,
Executive Leadership Team and Board. These exclude certain items that are included in the statutory results, as management be lieves that these items
are not reflective of the underlying business and do not aid meaningful period-on-period comparison. The table below reconciles the statutory results to the
underlying results, and full details on the adjusted items to the underlying results are included on page 129.
2020 income statement
Statutory results
£m
Integration and transformation
costs £m
Acquisition accounting
unwinds £m
Legacy conduct
£m Other
£m
Underlying basis
£m
Net interest income 1,283 – 68 – – 1,351
Non-interest income 160 – 28 – 3 191
Total operating income 1,443 – 96 – 3 1,542
Total operating and administrative expenses
before impairment losses (1,104) 139 11 26 11 (917)
Operating profit before impairment losses 339 139 107 26 14 625
Impairment losses on credit exposures (507) – 6 – – (501)
(Loss)/profit on ordinary activities before tax (168) 139 113 26 14 124
Financial performance measures RoTE (6.2%) 3.3% 2.6% 0.6% 0.3% 0.6%
CIR 76.5% (8.1)% (6.6)% (1.5)% (0.8)% 59.5%
Return on assets (0.16)% 0.12% 0.10% 0.02% 0.01% 0.09%
Basic EPS (15.3)p 7.9p 6.5p 1.5p 0.8p 1.4p
2019 income statement
Statutory results
£m
Include Virgin Money
pre- acquisition
results £m
Pro forma results
£m
Integration and
transfor- mation
costs £m
Acquisition accounting
unwinds £m
Legacy conduct
£m Other
£m
Underlying basis
£m
Net interest income 1,514 22 1,536 – (23) – (80) 1,433
Non-interest income 235 9 244 – – – (38) 206
Total operating income 1,749 31 1,780 – (23) – (118) 1,639
Total operating and administrative expenses before
impairment losses (1,729) (60) (1,789) 156 7 433 246 (947)
Operating profit/(loss) before impairment losses 20 (29) (9) 156 (16) 433 128 692
Impairment losses on credit exposures (252) (4) (256) – 103 – – (153)
(Loss)/profit on ordinary activities before tax (232) (33) (265) 156 87 433 128 539
Financial performance measures RoTE (6.8)% (0.7)% (7.5)% 3.5% 2.0% 9.9% 2.9% 10.8%
CIR 99% 1% 100% (10)% 1% (26)% (8)% 57%
Return on assets (0.23)% (0.03)% (0.26)% 0.15% 0.09% 0.43% 0.13% 0.54%
Basic EPS (17.9)p (1.7)p (19.6)p 9.3p 5.1p 25.7p 7.6p 28.1p

18
Risk Management
Introduction
Effective risk management is critical to realising the Group’s strategic priorities of pioneering growth, with delighted customers and colleagues, while
operating with super straightforward efficiency, discipline and sustainability. The safety and soundness of the Group is alig ned to Our Purpose and is a
fundamental requirement to enable our customers and stakeholders to be ‘happier about money’.
The Group’s approach to and management of risk is defined in the Group’s Risk Management Framework (RMF). Integral to the RMF is the identification
of principal risks, the process by which the Group sets its risk appetite which is the nature and extent of risk it is willing to assume to achieve its strategic
objectives. The framework identifies ten principal risks: operational risk; people risk; financial risk; model risk; credit r isk; technology risk; regulatory and
compliance risk; conduct risk; financial crime risk; and strategic and enterprise risk. Climate risk is recognised as a cross-cutting risk type that manifests
through other principal risks.
Risk appetite is defined as the level and types of risk the Group is willing to assume within the boundaries of its risk capacity, to achieve its strategic
objectives. The Risk Appetite Statement (RAS) articulates the Group’s risk appetite to stakeholders and provides a view on th e risk-taking activities the
Board is comfortable with, guiding decision-makers in their strategic and business decisions.
COVID-19 is impacting individuals, businesses and communities and has increased the Group’s risk profile. The measures introduced t o support the
economy create new operational, conduct, enforceability and financial risks for the Group. These risks are being managed and will be monitored over time.
Further detail on the Group’s risks and how they are managed is available in the 2020 Annual Report & Accounts.
19
Risk Management
Credit risk
At a time of unprecedented challenge for the UK economy, our lending portfolios
remain well positioned.
While 2020 has undoubtedly been a difficult year, the shape and credit quality of our lending portfolio meant we were well po sitioned to face the economic
challenges brought about by COVID-19. We started the year with a well-diversified portfolio, with 82% of our lending portfolio from a low LTV mortgage
book, 11% from a business lending portfolio in solidly performing sectors, and the remaining 7% from a high quality personal lending portfolio, and this mix
remained largely constant through the year. We adhered to our principles of managing our lending portfolio with a controlled risk appetite and prudent
approach to underwriting with additional changes to our underwriting criteria introduced in response to the economic events.
The emergence of COVID-19 towards the end of the first half of the year and the resulting lockdown inevitably put pressure on all businesses and
individuals, however the additional support available in the form of government backed lending and payment holidays has undoubtedly eased the
immediate pressures. Nevertheless, our assessment of the economic environment is cautious given the risks to the downside which remain and we have
applied prudent macroeconomic forecasts and conservative weightings to those forecasts which has caused us to reassess the likelihood of future loss in
our lending portfolio and resulted in us increasing our provision for future expected credit losses, both at the half year and year end. Accordingly, we have
recorded an underlying impairment charge of £501m in the year to 30 September 2020, an increase of £348m from the prior year charge of £153m. We
have kept this position under close watch throughout the year and updated our view on a quarterly basis.
A key indicator of the underlying quality of the lending portfolio is the movement in staging over time and the levels of arrears in the portfolios. Arrears
levels have remained largely stable across all portfolios as government interventions and payment holiday support has been deployed. Whist we have
seen a deterioration in staging with 81% of the Group’s lending portfolio now in stage 1 at 30 September 2020 (2019: 93%), th is is principally due to
probability of default (PD) migration rather than arrears, with the level of the portfolio < 30 DPD remaining stable at 98.5% (2019: 98.6%). Stage 3
balances have similarly remained stable. In summary, whilst an element of migrations to stage 2 reflect a level of financial difficulty for certain customers,
stage migrations in the year have generally been reflective of more negative macroeconomic forecasts rather than a deteriorat ion in the underlying quality
of our book. Furthermore, a significant proportion of customers who have taken advantage of the COVID-19 payment holidays available have already
resumed their normal payment patterns and we will continue to closely monitor these customers going forward.
In setting our provision for expected future credit losses at the year end, we have adopted prudent macroeconomic forecasts and weightings and
deployed these within our credit models. Where it has not been possible to fully quantify new or emerging risks in modelled o utcomes, or we have
assessed limitations in our models, expert judgement has been applied to determine an appropriate level of additional post -model adjustments (PMAs);
the level of PMAs is inevitably higher this year at £186m (2019: £49m) due largely to the impact of COVID-19 variables which, given the unprecedented
nature of the economic shock, could not be fully incorporated into the latest models. In combination, these factors ensure th e Group has suitably provided
against expected future losses, with a provision of £735m at 30 September 2020 (2019: £362m). This increased level of provision results in overall
coverage of 1.02% (2019: 0.50%), which we consider to be balanced and appropriate for our portfolio at the present time.
Notwithstanding the level of prudence we have exercised in measuring ECLs this year, and the recent announcement regarding positive progress in the
development of a COVID-19 vaccine, the economic outlook remains challenging. We will continue to monitor and assess the quality of our credit portfo lios
as we navigate through these difficult times.
The Credit risk report which now follows has been structured into the sections below in order to further explain our considerations:
• Managing risk within our portfolios: addresses the various frameworks, policies, approaches and mitigations deployed to manage and oversee
credit risk;
• Measuring credit risk within our portfolios: covers the Group’s approach to ECL methodologies and calculations as well as the approach to credit
estimates and judgements, including PMAs;
• Portfolio performance: summarises the key credit performance measures and influencing factors set out at Group level, supported by commentary on
each of the three divisions: Mortgages, Personal, and Business, and
• Supporting our customers in times of need: informs the various support mechanisms the Group has deployed to support customers.
A range of technical tables and analysis is also included.
Group credit highlights
30 Sep 2020
(audited) £m
30 Sep 2019 (audited)
£m
Underlying impairment charge on credit exposures 501 153
Impairment provisions: Modelled 496 266
PMA 186 49
Individually assessed 53 47
Impairment provisions held on credit exposures 735 362
20
Risk Management
Credit risk
Managing risk within our credit portfolios
Risk appetite
The Group controls its levels of credit risk by placing limits on the amount of risk it is willing to take in order to achieve its strategic objectives. This involves
a defined set of qualitative and quantitative limits in relation to its credit risk concentrations to one borrower, or group of borrowers, and to geographical,
product and industry segments. The management of credit risk within the Group is achieved through ongoing approval and monitoring of individual
transactions, regular asset quality reviews and the independent oversight of credit decisions and portfolios.
The COVID-19 pandemic continues to present significant risks to the Group’s credit portfolios. However, the Group remains focused on supporting
customers and colleagues through the exceptional challenges that have crystallised over the past few months. The FY2021 RAS will continue to consider
the impact of COVID-19, remaining agile, focused and responsive, to ensure we are addressing new and developing risks in a safe and controlled
manner.
Measurement
The Group uses a range of statistical models, supported by both internal and external data, to measure credit risk exposures. These models underpin the
IRB approval for the mortgage and business portfolios and the standardised approach for the personal portfolios. Further information on the measurement
and calculation of ECL and the Group’s approach to the impairment of financial assets can be found on page 22.
The Group’s portfolios are subject to regular stress testing. Stress test scenarios are regularly prepared to assess the adequacy of the Group’s
impairment provision and the impact on RWAs and capital. Management will consider how each stress scenario may impact on diff erent components of
the credit portfolio. The primary method applied uses migration matrices, modelling the impact of PD rating migrations and changes in portfolio def ault
rates to changes in macroeconomic factors to obtain a stressed position for the credit portfolios. Loss given default (LGD) is stressed based on a range of
factors, including property price movements.
Mitigation
The Group maintains a dynamic approach to credit management and takes necessary steps if individual issues are identified or if credit performance has,
or is expected to, deteriorate due to borrower, economic or sector-specific weaknesses.
The mitigation of credit risk within the Group is achieved through approval and monitoring of individual transactions and asset quality, analysis of the
performance of the various credit risk portfolios, and independent oversight of credit portfolios across the Group. Portfolio monitoring techniques cover
such areas as product, industry or geographic concentrations and delinquency trends.
There is regular analysis of the borrower’s ability to meet their interest and capital repayment obligations with early support and mitigation steps taken
where required. Credit risk mitigation is also supported, in part, by obtaining collateral and corporate and personal guarant ees where appropriate.
Other mitigating measures are described below.
Credit assessment and mitigation
Credit risk is managed in accordance with lending policies, the Group’s risk appetite and the RMF. Lending policies and performance against risk appetite
are reviewed regularly.
The Group uses a variety of lending criteria when assessing applications for mortgage and personal customers. The approval process uses credit
scorecards, as well as manual underwriting, and involves a review of an applicant’s previous credit history using information held by credit reference
agencies.
The Group also assesses the affordability of the borrower under stressed scenarios including increased interest rates. In addition, the Group has in place
quantitative thresholds, such as maximum limits on the level of borrowing to income and the ratio of borrowing to collateral. Some of these limits relate to
internal approval levels and others are hard limits above which the Group will reject the application.
For residential mortgages, the Group’s policy is to accept only standard applications with a LTV less than 95%. The Group has maximum percentage LTV
limits which depend upon the loan size. Product types such as BTL and residential interest -only mortgages are controlled by transactional limits covering
both LTV and value.
For business customers, credit risk is further mitigated by focusing on business sectors where the Group has specific expertise and through limiting
exposures on higher value loans and to certain sectors. When making credit decisions for business customers the Group will routinely assess the primary
source of repayment, most typically the cash generated by the customer through its normal trading cycle. Secondary sources of repayment are also
considered and while not the focus of the lending decision, collateral will be taken when appropriate. The Group seeks to obtain security cover and, where
relevant, guarantees from borrowers.
Specialist expertise
Credit quality is managed and monitored by skilled teams including, where required, specialists who provide dedicated support for customers experiencing
financial difficulty. Credit decisions utilise credit scoring techniques and manual underwriting, as appropriate. These tasks are performed by skilled and
competent specialists acting within agreed delegated authority levels set in accordance with their experience and capabilities.
Credit strategy and policy
Credit risks associated with lending are managed through the application of detailed lending policies and standards which outline the approach to lending,
underwriting criteria, credit mandates, concentration limits and product terms.
Significant credit risk strategies and policies are reviewed and approved annually by the Credit Risk Committee. For complex credit products and services,
the Chief Credit Officer and Credit Risk Committee provide a policy framework which identifies, quantifies and mitigates risks including, but not limited to,
those that have arisen as a result of the impacts of COVID-19. These policies and frameworks are delegated to, and disseminated under, the guidance
and control of the Board and senior management, with appropriate oversight through governance committees.
Specialist teams oversee credit portfolio performance as well as adherence to credit risk policies and standards. Activities include targeted risk-based
reviews, providing an assessment of the effectiveness of internal controls and risk management practices. Bespoke assignments are also undertaken in
response to emerging risks and regulatory requirements. Independent assurance reviews are regularly undertaken by Internal Audit.
21
Risk Management
Credit risk
Portfolio oversight
The Group’s credit portfolios, and the key benchmarks, behaviours and characteristics by which those portfolios are managed, are regularly reviewed. This
entails the production and analysis of regular portfolio monitoring reports for review by senior manag ement.
Controls over rating systems
The Group has a Model Risk Oversight team that sets common minimum standards. The standards are designed to ensure risk models and associated rating
systems are developed consistently and are of sufficient quality to support business decisions and meet regulatory requirements. The Group performs an
annual self-assessment of its ratings systems to ensure ongoing CRR compliance supported by all three lines of defence.
The Group also utilises other instruments and techniques across its wider balance sheet. These are summarised below:
Derivatives
The Group maintains control limits on net open derivative positions. At any one time, the amount subject to credit risk is limited to the current fair value of
instruments that are favourable to the Group (i.e. assets where their fair value is positive) which, in relation to derivatives, may only be a sma ll fraction of
the contract, or notional values used to express the volume of instruments outstanding. This credit risk is managed as part of the customer’s overall
exposure together with potential exposures from market movements.
Master netting agreements
The Group further restricts its exposure to credit losses by entering into master netting arrangements with counterparties wi th whom it undertakes a
significant volume of transactions. Master netting arrangements do not generally result in an offset of balance sheet assets and liabilities, as transactions
are usually settled on a gross basis. However, credit risk associated with the favourable contracts is reduced by a master netting arrangement to the
extent that, if any counterparty failed to meet its obligations in accordance with the agreed terms, all amounts with the cou nterparty are terminated and
settled on a net basis. Derivative financial instrument contracts are typically subject to the International Swaps and Derivatives Association (ISDA) maste r
netting agreements, as well as Credit Support Annexes, where relevant, around collateral arrangements attached to those ISDA agreements. Derivative
exchange or clearing counterparty agreements exist where contracts are settled via an exchange or clearing house.
Collateral
Collateral held as security and other credit enhancements can be summarised as follows:
Residential mortgages
Residential property is the Group’s main source of collateral on mortgage lending and means of mitigating loss in the event o f the default risk inherent in
its residential mortgage portfolios. All lending activities are supported by an appropriate form of valuation using either professional or indexed (subject to
policy rules and confidence levels) valuations.
Commercial property
Commercial property is the Group’s main source of collateral on business lending and means of mitigating loss in the event of default. Collateral for the
majority of commercial loans comprises first legal charges over freehold or long leasehold property (including formal Companies House registration where
appropriate). All commercial property collateral is subject to an independent, professional valuation when taken and thereafter subject to periodic review in
accordance with policy requirements.
Non-property related collateral
In addition to residential and commercial property based security, the Group also takes other forms of collateral when lending. This can involve obtaining
security against the underlying loan through the use of cash collateral and/or netting agreements, both of which reduce the o riginal exposure by the
amount of collateral held, subject to volatility and maturity adjustments where applicable.
The Group provides asset-backed lending in the form of asset and receivables finance. Security for these exposures is held in the form of direct recou rse
to the underlying asset financed.
Further detail on collateral can be found on pages 32-33.
Monitoring
Credit policies and procedures, which are subject to ongoing review, are documented and disseminated in a form that supports the credit operations of the
Group.
Credit Risk Committee: The Credit Risk Committee ensures that the credit RMF and associated policies remain effective. The Committee has oversight of
the quality, composition and concentrations of the credit risk portfolio and considers strategies to adjust the portfolio to react to changes in market
conditions.
RAS measures: Measures are monitored monthly and reviewed bi-annually, at a minimum, or where specific action is merited, for example RAS was
amended at pace in response to COVID-19. Regular review ensures that the measures accurately reflect the Group’s risk appetite, strategy and concerns
relative to the wider macro environment. All measures are subject to extensive engagement with the Executive Leadership Team and the Board and are
subject to endorsement from executive governance committees prior to Board approval. Regulatory engagement is also scheduled as appropriate.
Risk concentration: Concentration of risk is managed by counterparty, product, geographical region and industry sector. In addition, single name exposure
limits exist to control exposures to a single counterparty. Concentrations are also considered through the RAS process, focusing particularly on comparing
the portfolio against market benchmarks.
Single large exposure excesses: All excesses are reported to the Transactional Credit Committee and the Chief Credit Officer. Any exposure which
continues, or is expected to continue, beyond 30 days will also be submitted to the Transactional Credit Committee with propo sals to correct the exposure
within an agreed period, not to exceed 12 months.
22
Risk Management
Credit risk
Forbearance
Forbearance is considered to take place when the Group grants concessions to assist customers who are experiencing, or who are about to experience,
difficulties in meeting their financial commitments to the Group. The Group’s forbearance policies and definitions comply with the guidance established by
the EBA for financial reporting. Forbearance concessions include the granting of more favourable terms and conditions than th ose provided either at
drawdown of the facility, or which would not ordinarily be available to other customers with a similar risk profile. Forbeara nce parameters are regularly
reviewed and refined as necessary to ensure they are consistent with the latest industry guidance and prevailing practice, as well as ensuring that they
adequately capture and reflect the most recent customer behaviours and market conditions.
Measuring risk within our credit portfolios
The Group adopts two approaches to the measurement of credit risk:
Individually assessed approach
A charge is taken to the consolidated income statement when an individually assessed provision has been recognised or a direc t write-off has been
applied to an asset balance.
Collectively assessed approach
The Group uses a combination of strategies and statistical models that utilise internal and external data to measure the exposure to credi t risk within the
portfolios and to calculate the level of ECL. This is supplemented by management judgement in the form of PMAs wh ere necessary.
At each reporting date, the Group assesses financial assets measured at amortised cost, as well as loan commitments and finan cial guarantees not
measured at fair value through profit or loss, for impairment. The impairment loss allowance is calculated using an ECL methodology and reflects: (i) an
unbiased and probability weighted amount; (ii) the time value of money which discounts the impairment loss; and (iii) reasona ble and supportable
information that is available without undue cost or effort about past events, current conditions and forecasts of future economic conditions.
The calculated ECL is determined using the following classifications:
Classification ECL calculation period Description
Stage 1 12 months A loan that is not credit-impaired on initial recognition and has not experienced a significant increase in credit risk (SICR).
Stage 2 Lifetime If a significant increase in credit risk has occurred since initial recognition, the loan is moved to stage 2 but is not yet deemed
to be credit-impaired.
Stage 3 Lifetime If the loan is credit-impaired it is moved to stage 3.
In addition to the above stages, purchased or originated credit-impaired (POCI) financial assets are those which are assessed as being credit-impaired
upon initial recognition. Once a financial asset is classified as POCI, it remains there until derecognition irrespective of its credit quality. POCI financial
assets are included within those financial assets in Stage 3 with corresponding values disclosed by way of footnote to the relevant tables. The Group
regards the date of acquisition as the origination date for purchased portfolios.
A Stage 2 ECL is required where a SICR has been identified, such as a deterioration in PD since originat ion, subject to the 30 days past due (DPD)
backstop, with Stage 3 required where there is credit impairment subject to the 90 DPD backstop.
ECL methodology is based upon the combination of PD, LGD and exposure at default (EAD) estimates that consider a ra nge of factors that impact on
credit risk and the level of impairment loss provisioning. The Group uses reasonable and supportable forecasts of future econ omic conditions in estimating
the ECL allowance. The methodology and assumptions used in the ECL calculation are reviewed regularly and updated as necessary.
ECLs under IFRS 9 use economic forecasts, models and judgement to provide a forward -looking assessment of the required provisions. PMAs have
been used to address known limitations in the Group’s models or data. Due to the current severe economic conditions, government and Group
interventions to support customers, and uncertainty arising from COVID-19, the Group has not relied upon modelled outcomes alone. Following detailed
analysis, expert credit judgement has been applied, resulting in additional PMAs to ensure the ECL calculation reflects the full set of plausible
circumstances including data limitations, customer support measures, rapidly changing customer behaviours and the emerging na ture of COVID-19 risks.
Further detail on the accounting policy applied to ECLs can be found in note 3.2 to the financial statements.
Portfolio performance
How our portfolios have performed
Credit risk exposures are classified into mortgage, personal and business portfolios. In terms of loans and advances, credit risk arises both from amounts
loaned and commitments to extend credit to customers. To ensure appropriate credit limits exist, especially for business lend ing, a single large exposure
policy is in place and forms part of the risk appetite measures that are monitored and reported on a monthly basis. The overall compositio n and quality of
the credit portfolio is monitored and regularly reported to the Board and, where required, to the relevant superv isory authorities.
Exposures are also managed in accordance with the large exposure reporting requirements of the CRR. Unless otherwise noted, t he amount that best
represents the maximum credit exposure at the reporting date is the carrying value of the financial asset.
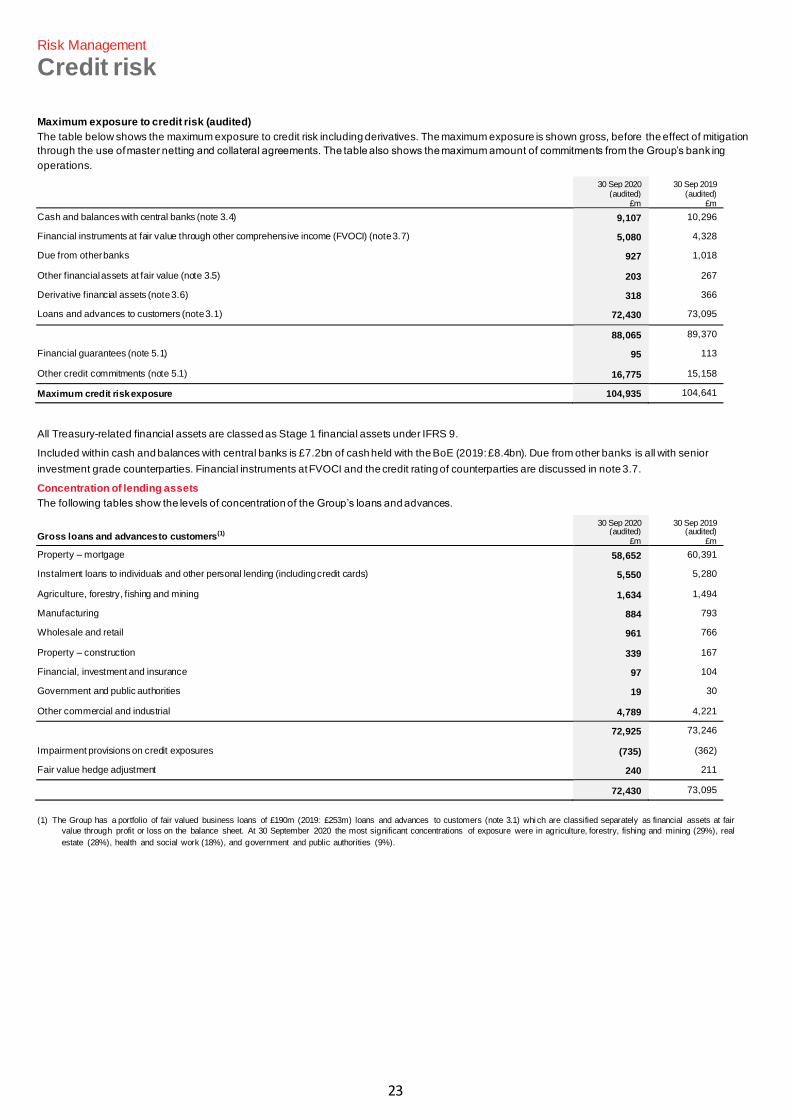
23
Risk Management
Credit risk
Maximum exposure to credit risk (audited)
The table below shows the maximum exposure to credit risk including derivatives. The maximum exposure is shown gross, before the effect of mitigation
through the use of master netting and collateral agreements. The table also shows the maximum amount of commitments from the Group’s bank ing
operations.
30 Sep 2020
(audited) £m
30 Sep 2019 (audited)
£m
Cash and balances with central banks (note 3.4) 9,107 10,296
Financial instruments at fair value through other comprehensive income (FVOCI) (note 3.7) 5,080 4,328
Due from other banks 927 1,018
Other financial assets at fair value (note 3.5) 203 267
Derivative financial assets (note 3.6) 318 366
Loans and advances to customers (note 3.1) 72,430 73,095
88,065 89,370
Financial guarantees (note 5.1) 95 113
Other credit commitments (note 5.1) 16,775 15,158
Maximum credit risk exposure 104,935 104,641
All Treasury-related financial assets are classed as Stage 1 financial assets under IFRS 9.
Included within cash and balances with central banks is £7.2bn of cash held with the BoE (2019: £8.4bn). Due from other banks is all with senior
investment grade counterparties. Financial instruments at FVOCI and the credit rating of counterparties are discussed in note 3.7.
Concentration of lending assets
The following tables show the levels of concentration of the Group’s loans and advances.
Gross loans and advances to customers(1)
30 Sep 2020 (audited)
£m
30 Sep 2019 (audited)
£m
Property – mortgage 58,652 60,391
Instalment loans to individuals and other personal lending (including credit cards) 5,550 5,280
Agriculture, forestry, fishing and mining 1,634 1,494
Manufacturing 884 793
Wholesale and retail 961 766
Property – construction 339 167
Financial, investment and insurance 97 104
Government and public authorities 19 30
Other commercial and industrial 4,789 4,221
72,925 73,246
Impairment provisions on credit exposures (735) (362)
Fair value hedge adjustment 240 211
72,430 73,095
(1) The Group has a portfolio of fair valued business loans of £190m (2019: £253m) loans and advances to customers (note 3.1) whi ch are classified separately as financial assets at fair
value through profit or loss on the balance sheet. At 30 September 2020 the most significant concentrations of exposure were in agriculture, forestry, fishing and mining (29%), real
estate (28%), health and social work (18%), and government and public authorities (9%).
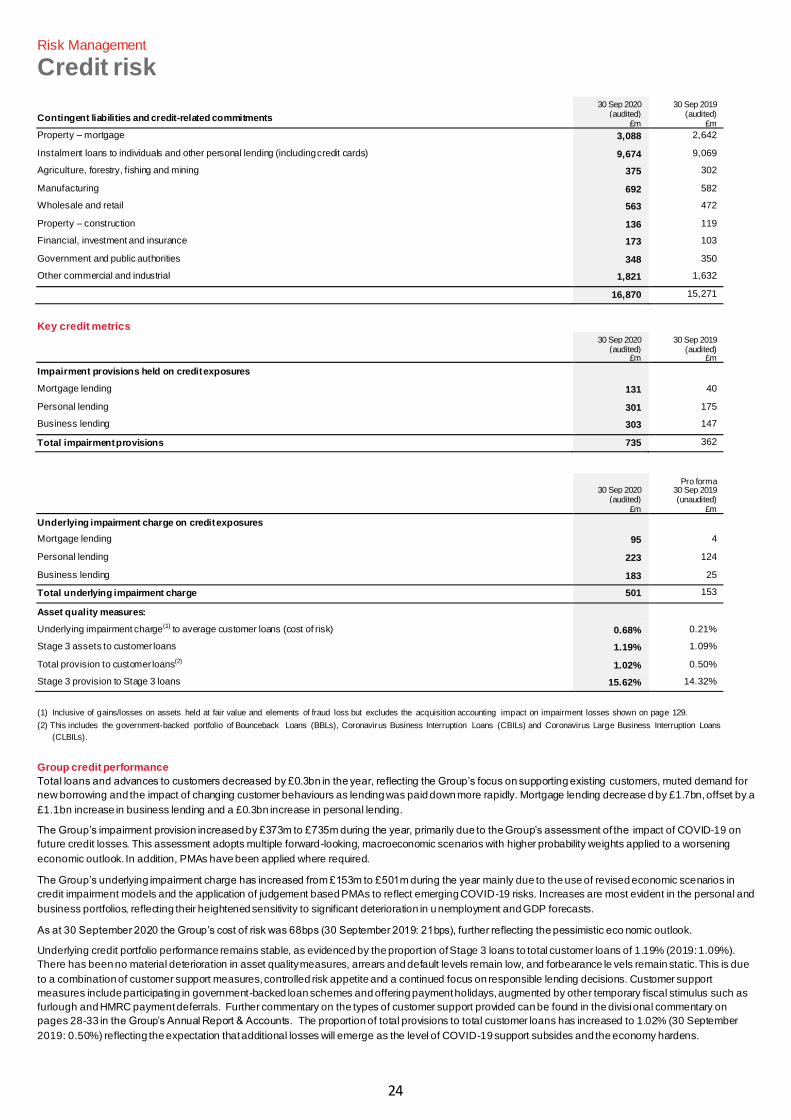
24
Risk Management
Credit risk
Contingent liabilities and credit-related commitments
30 Sep 2020 (audited)
£m
30 Sep 2019 (audited)
£m
Property – mortgage 3,088 2,642
Instalment loans to individuals and other personal lending (including credit cards) 9,674 9,069
Agriculture, forestry, fishing and mining 375 302
Manufacturing 692 582
Wholesale and retail 563 472
Property – construction 136 119
Financial, investment and insurance 173 103
Government and public authorities 348 350
Other commercial and industrial 1,821 1,632
16,870 15,271
Key credit metrics
30 Sep 2020
(audited) £m
30 Sep 2019 (audited)
£m
Impairment provisions held on credit exposures Mortgage lending 131 40
Personal lending 301 175
Business lending 303 147
Total impairment provisions 735 362
30 Sep 2020
(audited) £m
Pro forma
30 Sep 2019 (unaudited)
£m
Underlying impairment charge on credit exposures Mortgage lending 95 4
Personal lending 223 124
Business lending 183 25
Total underlying impairment charge 501 153
Asset quality measures: Underlying impairment charge(1) to average customer loans (cost of risk) 0.68% 0.21%
Stage 3 assets to customer loans 1.19% 1.09%
Total provision to customer loans(2) 1.02% 0.50%
Stage 3 provision to Stage 3 loans 15.62% 14.32%
(1) Inclusive of gains/losses on assets held at fair value and elements of fraud loss but excludes the acquisition accounting impact on impairment losses shown on page 129.
(2) This includes the government-backed portfolio of Bounceback Loans (BBLs), Coronavirus Business Interruption Loans (CBILs) and Coronavirus Large Business Interruption Loans
(CLBILs).
Group credit performance
Total loans and advances to customers decreased by £0.3bn in the year, reflecting the Group’s focus on supporting existing customers, muted demand for
new borrowing and the impact of changing customer behaviours as lending was paid down more rapidly. Mortgage lending decrease d by £1.7bn, offset by a
£1.1bn increase in business lending and a £0.3bn increase in personal lending.
The Group’s impairment provision increased by £373m to £735m during the year, primarily due to the Group’s assessment of the impact of COVID-19 on
future credit losses. This assessment adopts multiple forward-looking, macroeconomic scenarios with higher probability weights applied to a worsening
economic outlook. In addition, PMAs have been applied where required.
The Group’s underlying impairment charge has increased from £153m to £501m during the year mainly due to the use of revised economic scenarios in
credit impairment models and the application of judgement based PMAs to reflect emerging COVID-19 risks. Increases are most evident in the personal and
business portfolios, reflecting their heightened sensitivity to significant deterioration in unemployment and GDP forecasts.
As at 30 September 2020 the Group’s cost of risk was 68bps (30 September 2019: 21bps), further reflecting the pessimistic eco nomic outlook.
Underlying credit portfolio performance remains stable, as evidenced by the proport ion of Stage 3 loans to total customer loans of 1.19% (2019: 1.09%).
There has been no material deterioration in asset quality measures, arrears and default levels remain low, and forbearance le vels remain static. This is due
to a combination of customer support measures, controlled risk appetite and a continued focus on responsible lending decisions. Customer support
measures include participating in government-backed loan schemes and offering payment holidays, augmented by other temporary fiscal stimulus such as
furlough and HMRC payment deferrals. Further commentary on the types of customer support provided can be found in the divisional commentary on
pages 28-33 in the Group’s Annual Report & Accounts.The proportion of total provisions to total customer loans has increased to 1.02% (30 September
2019: 0.50%) reflecting the expectation that additional losses will emerge as the level of COVID-19 support subsides and the economy hardens.
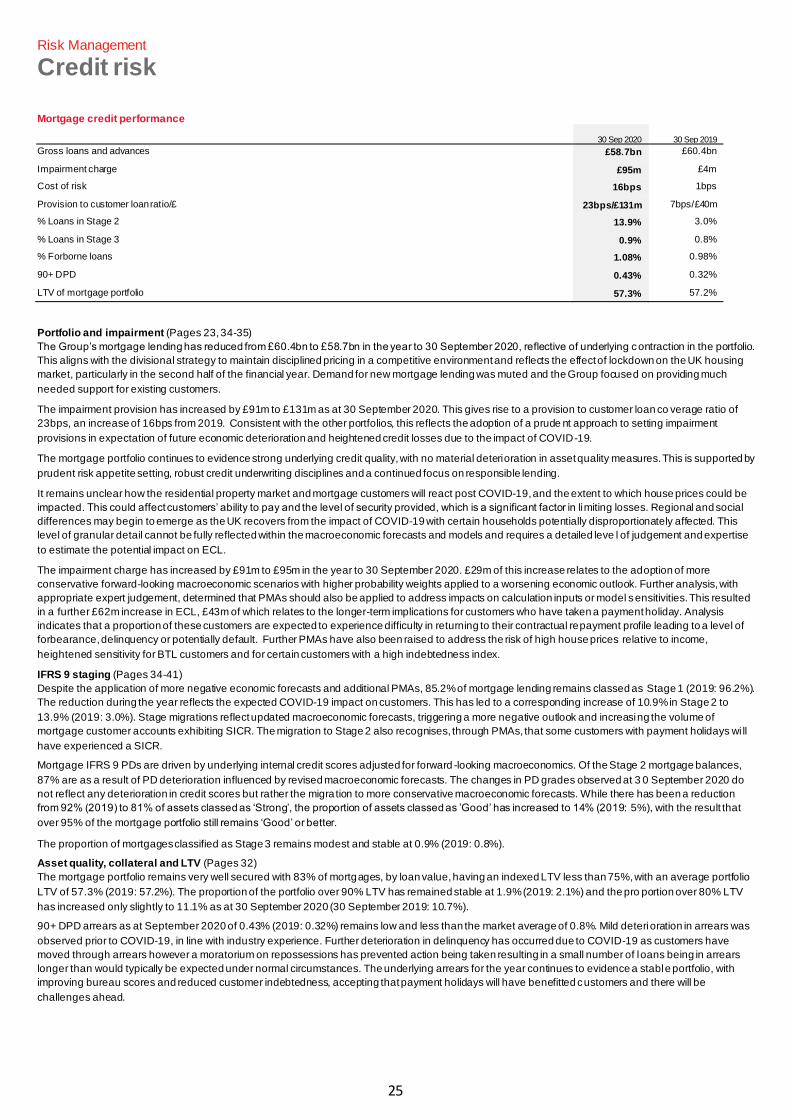
25
Risk Management
Credit risk
Mortgage credit performance
30 Sep 2020 30 Sep 2019
Gross loans and advances £58.7bn £60.4bn
Impairment charge £95m £4m
Cost of risk 16bps 1bps
Provision to customer loan ratio/£ 23bps/£131m 7bps/£40m
% Loans in Stage 2 13.9% 3.0%
% Loans in Stage 3 0.9% 0.8%
% Forborne loans 1.08% 0.98%
90+ DPD 0.43% 0.32%
LTV of mortgage portfolio 57.3% 57.2%
Portfolio and impairment (Pages 23, 34-35)
The Group’s mortgage lending has reduced from £60.4bn to £58.7bn in the year to 30 September 2020, reflective of underlying c ontraction in the portfolio.
This aligns with the divisional strategy to maintain disciplined pricing in a competitive environment and reflects the effect of lockdown on the UK housing
market, particularly in the second half of the financial year. Demand for new mortgage lending was muted and the Group focused on providing much
needed support for existing customers.
The impairment provision has increased by £91m to £131m as at 30 September 2020. This gives rise to a provision to customer loan co verage ratio of
23bps, an increase of 16bps from 2019. Consistent with the other portfolios, this reflects the adoption of a prude nt approach to setting impairment
provisions in expectation of future economic deterioration and heightened credit losses due to the impact of COVID-19.
The mortgage portfolio continues to evidence strong underlying credit quality, with no material deterioration in asset quality measures. This is supported by
prudent risk appetite setting, robust credit underwriting disciplines and a continued focus on responsible lending.
It remains unclear how the residential property market and mortgage customers will react post COVID-19, and the extent to which house prices could be
impacted. This could affect customers’ ability to pay and the level of security provided, which is a significant factor in limiting losses. Regional and social
differences may begin to emerge as the UK recovers from the impact of COVID-19 with certain households potentially disproportionately affected. This
level of granular detail cannot be fully reflected within the macroeconomic forecasts and models and requires a detailed leve l of judgement and expertise
to estimate the potential impact on ECL.
The impairment charge has increased by £91m to £95m in the year to 30 September 2020. £29m of this increase relates to the adoption of more
conservative forward-looking macroeconomic scenarios with higher probability weights applied to a worsening economic outlook. Further analysis, with
appropriate expert judgement, determined that PMAs should also be applied to address impacts on calculation inputs or model sensitivities. This resulted
in a further £62m increase in ECL, £43m of which relates to the longer-term implications for customers who have taken a payment holiday. Analysis
indicates that a proportion of these customers are expected to experience difficulty in returning to their contractual repayment profile leading to a level of
forbearance, delinquency or potentially default. Further PMAs have also been raised to address the risk of high house prices relative to income,
heightened sensitivity for BTL customers and for certain customers with a high indebtedness index.
IFRS 9 staging (Pages 34-41)
Despite the application of more negative economic forecasts and additional PMAs, 85.2% of mortgage lending remains classed as Stage 1 (2019: 96.2%).
The reduction during the year reflects the expected COVID-19 impact on customers. This has led to a corresponding increase of 10.9% in Stage 2 to
13.9% (2019: 3.0%). Stage migrations reflect updated macroeconomic forecasts, triggering a more negative outlook and increasing the volume of
mortgage customer accounts exhibiting SICR. The migration to Stage 2 also recognises, through PMAs, that some customers with payment holidays wi ll
have experienced a SICR.
Mortgage IFRS 9 PDs are driven by underlying internal credit scores adjusted for forward -looking macroeconomics. Of the Stage 2 mortgage balances,
87% are as a result of PD deterioration influenced by revised macroeconomic forecasts. The changes in PD grades observed at 3 0 September 2020 do
not reflect any deterioration in credit scores but rather the migra tion to more conservative macroeconomic forecasts. While there has been a reduction
from 92% (2019) to 81% of assets classed as ‘Strong’, the proportion of assets classed as ’Good’ has increased to 14% (2019: 5%), with the result that
over 95% of the mortgage portfolio still remains ‘Good’ or better.
The proportion of mortgages classified as Stage 3 remains modest and stable at 0.9% (2019: 0.8%).
Asset quality, collateral and LTV (Pages 32)
The mortgage portfolio remains very well secured with 83% of mortgages, by loan value, having an indexed LTV less than 75%, with an average portfolio
LTV of 57.3% (2019: 57.2%). The proportion of the portfolio over 90% LTV has remained stable at 1.9% (2019: 2.1%) and the pro portion over 80% LTV
has increased only slightly to 11.1% as at 30 September 2020 (30 September 2019: 10.7%).
90+ DPD arrears as at September 2020 of 0.43% (2019: 0.32%) remains low and less than the market average of 0.8%. Mild deterioration in arrears was
observed prior to COVID-19, in line with industry experience. Further deterioration in delinquency has occurred due to COVID-19 as customers have
moved through arrears however a moratorium on repossessions has prevented action being taken resulting in a small number of loans being in arrears
longer than would typically be expected under normal circumstances. The underlying arrears for the year continues to evidence a stable portfolio, with
improving bureau scores and reduced customer indebtedness, accepting that payment holidays will have benefitted customers and there will be
challenges ahead.
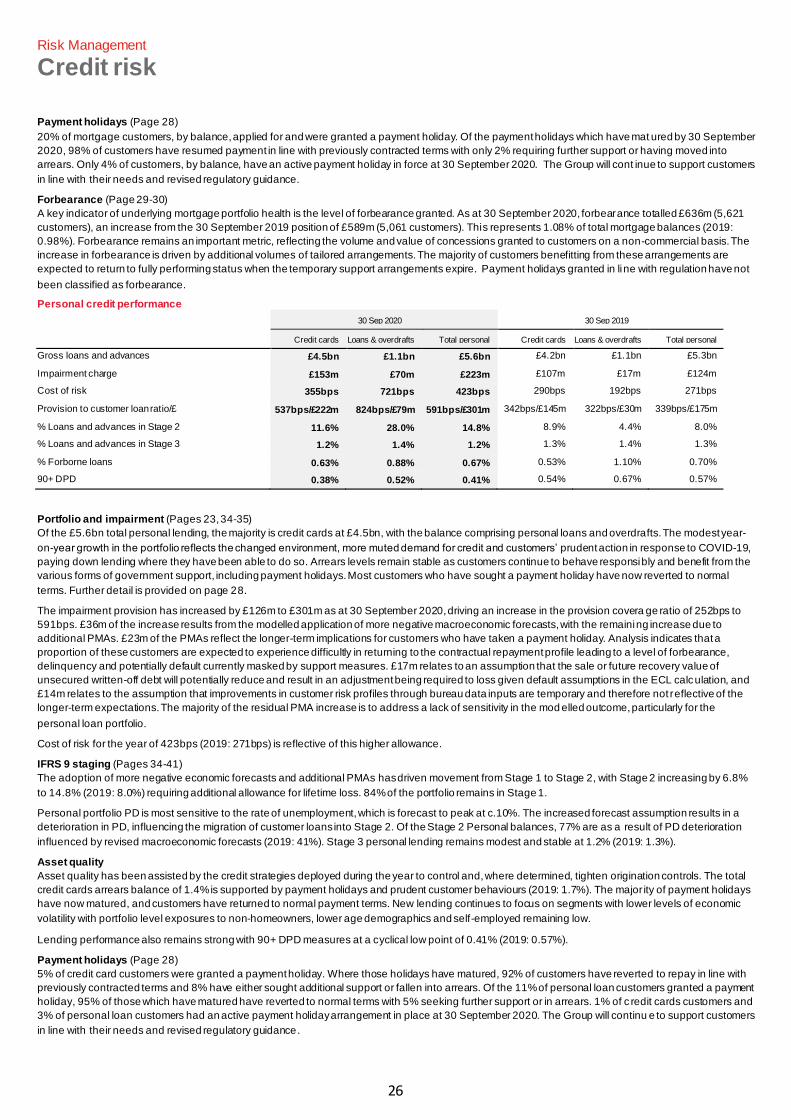
26
Risk Management
Credit risk
Payment holidays (Page 28)
20% of mortgage customers, by balance, applied for and were granted a payment holiday. Of the payment holidays which have mat ured by 30 September
2020, 98% of customers have resumed payment in line with previously contracted terms with only 2% requiring further support or having moved into
arrears. Only 4% of customers, by balance, have an active payment holiday in force at 30 September 2020. The Group will cont inue to support customers
in line with their needs and revised regulatory guidance.
Forbearance (Page 29-30)
A key indicator of underlying mortgage portfolio health is the level of forbearance granted. As at 30 September 2020, forbearance totalled £636m (5,621
customers), an increase from the 30 September 2019 position of £589m (5,061 customers). This represents 1.08% of total mortgage balances (2019:
0.98%). Forbearance remains an important metric, reflecting the volume and value of concessions granted to customers on a non-commercial basis. The
increase in forbearance is driven by additional volumes of tailored arrangements. The majority of customers benefitting from these arrangements are
expected to return to fully performing status when the temporary support arrangements expire. Payment holidays granted in line with regulation have not
been classified as forbearance.
Personal credit performance
30 Sep 2020 30 Sep 2019
Credit cards Loans & overdrafts Total personal Credit cards Loans & overdrafts Total personal
Gross loans and advances £4.5bn £1.1bn £5.6bn £4.2bn £1.1bn £5.3bn
Impairment charge £153m £70m £223m £107m £17m £124m
Cost of risk 355bps 721bps 423bps 290bps 192bps 271bps
Provision to customer loan ratio/£ 537bps/£222m 824bps/£79m 591bps/£301m 342bps/£145m 322bps/£30m 339bps/£175m
% Loans and advances in Stage 2 11.6% 28.0% 14.8% 8.9% 4.4% 8.0%
% Loans and advances in Stage 3 1.2% 1.4% 1.2% 1.3% 1.4% 1.3%
% Forborne loans 0.63% 0.88% 0.67% 0.53% 1.10% 0.70%
90+ DPD 0.38% 0.52% 0.41% 0.54% 0.67% 0.57%
Portfolio and impairment (Pages 23, 34-35)
Of the £5.6bn total personal lending, the majority is credit cards at £4.5bn, with the balance comprising personal loans and overdrafts. The modest year-
on-year growth in the portfolio reflects the changed environment, more muted demand for credit and customers’ prudent action in response to COVID-19,
paying down lending where they have been able to do so. Arrears levels remain stable as customers continue to behave responsibly and benefit from the
various forms of government support, including payment holidays. Most customers who have sought a payment holiday have now reverted to normal
terms. Further detail is provided on page 28.
The impairment provision has increased by £126m to £301m as at 30 September 2020, driving an increase in the provision covera ge ratio of 252bps to
591bps. £36m of the increase results from the modelled application of more negative macroeconomic forecasts, with the remaining increase due to
additional PMAs. £23m of the PMAs reflect the longer-term implications for customers who have taken a payment holiday. Analysis indicates that a
proportion of these customers are expected to experience difficultly in returning to the contractual repayment profile leading to a level of forbearance,
delinquency and potentially default currently masked by support measures. £17m relates to an assumption that the sale or future recovery value of
unsecured written-off debt will potentially reduce and result in an adjustment being required to loss given default assumptions in the ECL calculation, and
£14m relates to the assumption that improvements in customer risk profiles through bureau data inputs are temporary and therefore not reflective of the
longer-term expectations. The majority of the residual PMA increase is to address a lack of sensitivity in the mod elled outcome, particularly for the
personal loan portfolio.
Cost of risk for the year of 423bps (2019: 271bps) is reflective of this higher allowance.
IFRS 9 staging (Pages 34-41)
The adoption of more negative economic forecasts and additional PMAs has driven movement from Stage 1 to Stage 2, with Stage 2 increasing by 6.8%
to 14.8% (2019: 8.0%) requiring additional allowance for lifetime loss. 84% of the portfolio remains in Stage 1.
Personal portfolio PD is most sensitive to the rate of unemployment, which is forecast to peak at c.10%. The increased forecast assumption results in a
deterioration in PD, influencing the migration of customer loans into Stage 2. Of the Stage 2 Personal balances, 77% are as a result of PD deterioration
influenced by revised macroeconomic forecasts (2019: 41%). Stage 3 personal lending remains modest and stable at 1.2% (2019: 1.3%).
Asset quality
Asset quality has been assisted by the credit strategies deployed during the year to control and, where determined, tighten origination controls. The total
credit cards arrears balance of 1.4% is supported by payment holidays and prudent customer behaviours (2019: 1.7%). The major ity of payment holidays
have now matured, and customers have returned to normal payment terms. New lending continues to focus on segments with lower levels of economic
volatility with portfolio level exposures to non-homeowners, lower age demographics and self-employed remaining low.
Lending performance also remains strong with 90+ DPD measures at a cyclical low point of 0.41% (2019: 0.57%).
Payment holidays (Page 28)
5% of credit card customers were granted a payment holiday. Where those holidays have matured, 92% of customers have reverted to repay in line with
previously contracted terms and 8% have either sought additional support or fallen into arrears. Of the 11% of personal loan customers granted a payment
holiday, 95% of those which have matured have reverted to normal terms with 5% seeking further support or in arrears. 1% of c redit cards customers and
3% of personal loan customers had an active payment holiday arrangement in place at 30 September 2020. The Group will continu e to support customers
in line with their needs and revised regulatory guidance.
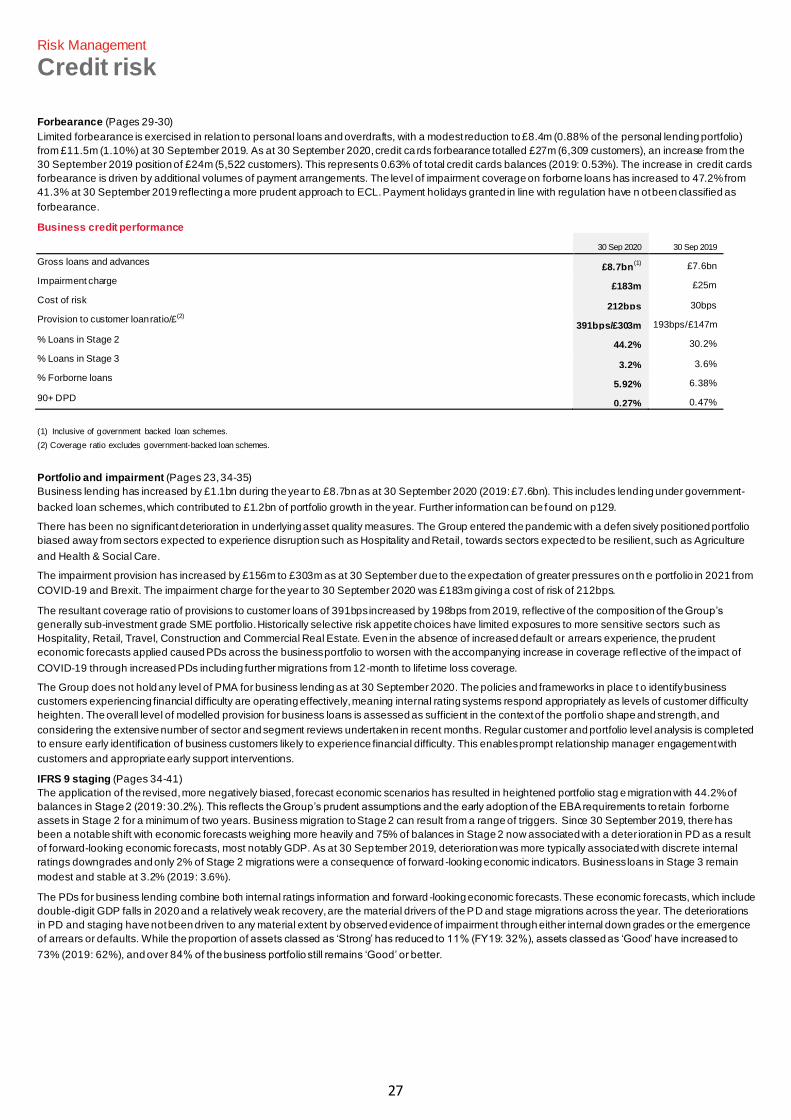
27
Risk Management
Credit risk
Forbearance (Pages 29-30)
Limited forbearance is exercised in relation to personal loans and overdrafts, with a modest reduction to £8.4m (0.88% of the personal lending portfolio)
from £11.5m (1.10%) at 30 September 2019. As at 30 September 2020, credit ca rds forbearance totalled £27m (6,309 customers), an increase from the
30 September 2019 position of £24m (5,522 customers). This represents 0.63% of total credit cards balances (2019: 0.53%). The increase in credit cards
forbearance is driven by additional volumes of payment arrangements. The level of impairment coverage on forborne loans has increased to 47.2% from
41.3% at 30 September 2019 reflecting a more prudent approach to ECL. Payment holidays granted in line with regulation have n ot been classified as
forbearance.
Business credit performance
30 Sep 2020 30 Sep 2019
Gross loans and advances £8.7bn
(1) £7.6bn
Impairment charge £183m £25m
Cost of risk 212bps 30bps
Provision to customer loan ratio/£(2) 391bps/£303m 193bps/£147m
% Loans in Stage 2 44.2% 30.2%
% Loans in Stage 3 3.2% 3.6%
% Forborne loans 5.92% 6.38%
90+ DPD 0.27% 0.47%
(1) Inclusive of government backed loan schemes.
(2) Coverage ratio excludes government-backed loan schemes.
Portfolio and impairment (Pages 23, 34-35)
Business lending has increased by £1.1bn during the year to £8.7bn as at 30 September 2020 (2019: £7.6bn). This includes lending under government-
backed loan schemes, which contributed to £1.2bn of portfolio growth in the year. Further information can be found on p129.
There has been no significant deterioration in underlying asset quality measures. The Group entered the pandemic with a defen sively positioned portfolio
biased away from sectors expected to experience disruption such as Hospitality and Retail, towards sectors expected to be resilient, such as Agriculture
and Health & Social Care.
The impairment provision has increased by £156m to £303m as at 30 September due to the expectation of greater pressures on th e portfolio in 2021 from
COVID-19 and Brexit. The impairment charge for the year to 30 September 2020 was £183m giving a cost of risk of 212bps.
The resultant coverage ratio of provisions to customer loans of 391bps increased by 198bps from 2019, reflective of the composition of the Group’s
generally sub-investment grade SME portfolio. Historically selective risk appetite choices have limited exposures to more sensitive sectors such as
Hospitality, Retail, Travel, Construction and Commercial Real Estate. Even in the absence of increased default or arrears experience, the prudent
economic forecasts applied caused PDs across the business portfolio to worsen with the accompanying increase in coverage reflective of the impact of
COVID-19 through increased PDs including further migrations from 12-month to lifetime loss coverage.
The Group does not hold any level of PMA for business lending as at 30 September 2020. The policies and frameworks in place t o identify business
customers experiencing financial difficulty are operating effectively, meaning internal rating systems respond appropriately as levels of customer difficulty
heighten. The overall level of modelled provision for business loans is assessed as sufficient in the context of the portfolio shape and strength, and
considering the extensive number of sector and segment reviews undertaken in recent months. Regular customer and portfolio level analysis is completed
to ensure early identification of business customers likely to experience financial difficulty. This enables prompt relationship manager engagement with
customers and appropriate early support interventions.
IFRS 9 staging (Pages 34-41)
The application of the revised, more negatively biased, forecast economic scenarios has resulted in heightened portfolio stag e migration with 44.2% of
balances in Stage 2 (2019: 30.2%). This reflects the Group’s prudent assumptions and the early adoption of the EBA requirements to retain forborne
assets in Stage 2 for a minimum of two years. Business migration to Stage 2 can result from a range of triggers. Since 30 September 2019, there has
been a notable shift with economic forecasts weighing more heavily and 75% of balances in Stage 2 now associated with a deter ioration in PD as a result
of forward-looking economic forecasts, most notably GDP. As at 30 September 2019, deterioration was more typically associated with discrete internal
ratings downgrades and only 2% of Stage 2 migrations were a consequence of forward -looking economic indicators. Business loans in Stage 3 remain
modest and stable at 3.2% (2019: 3.6%).
The PDs for business lending combine both internal ratings information and forward -looking economic forecasts. These economic forecasts, which include
double-digit GDP falls in 2020 and a relatively weak recovery, are the material drivers of the PD and stage migrations across the year. The deteriorations
in PD and staging have not been driven to any material extent by observed evidence of impairment through either internal down grades or the emergence
of arrears or defaults. While the proportion of assets classed as ‘Strong’ has reduced to 11% (FY19: 32%), assets classed as ‘Good’ have increased to
73% (2019: 62%), and over 84% of the business portfolio still remains ‘Good’ or better.
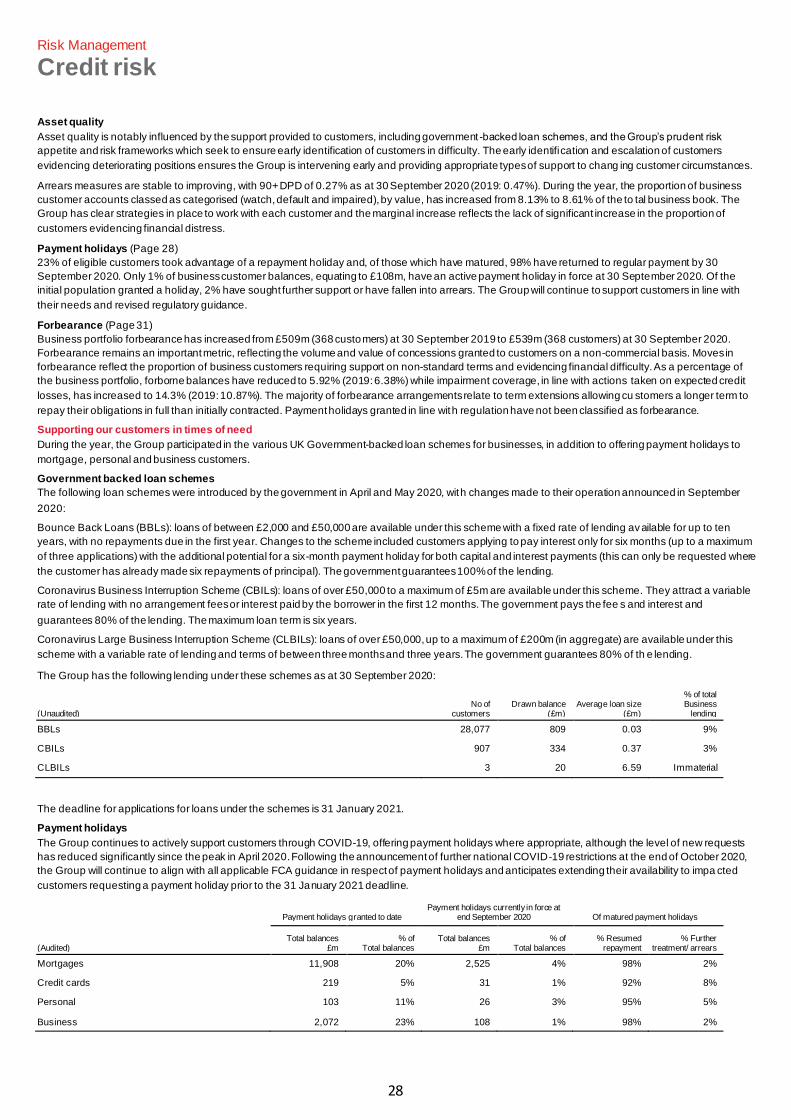
28
Risk Management
Credit risk
Asset quality
Asset quality is notably influenced by the support provided to customers, including government-backed loan schemes, and the Group’s prudent risk
appetite and risk frameworks which seek to ensure early identification of customers in difficulty. The early identification and escalation of customers
evidencing deteriorating positions ensures the Group is intervening early and providing appropriate types of support to chang ing customer circumstances.
Arrears measures are stable to improving, with 90+ DPD of 0.27% as at 30 September 2020 (2019: 0.47%). During the year, the proportion of business
customer accounts classed as categorised (watch, default and impaired), by value, has increased from 8.13% to 8.61% of the to tal business book. The
Group has clear strategies in place to work with each customer and the marginal increase reflects the lack of significant increase in the proportion of
customers evidencing financial distress.
Payment holidays (Page 28)
23% of eligible customers took advantage of a repayment holiday and, of those which have matured, 98% have returned to regular payment by 30
September 2020. Only 1% of business customer balances, equating to £108m, have an active payment holiday in force at 30 September 2020. Of the
initial population granted a holiday, 2% have sought further support or have fallen into arrears. The Group will continue to support customers in line with
their needs and revised regulatory guidance.
Forbearance (Page 31)
Business portfolio forbearance has increased from £509m (368 customers) at 30 September 2019 to £539m (368 customers) at 30 September 2020.
Forbearance remains an important metric, reflecting the volume and value of concessions granted to customers on a non-commercial basis. Moves in
forbearance reflect the proportion of business customers requiring support on non-standard terms and evidencing financial difficulty. As a percentage of
the business portfolio, forborne balances have reduced to 5.92% (2019: 6.38%) while impairment coverage, in line with actions taken on expected credit
losses, has increased to 14.3% (2019: 10.87%). The majority of forbearance arrangements relate to term extensions allowing cu stomers a longer term to
repay their obligations in full than initially contracted. Payment holidays granted in line with regulation have not been classified as forbearance.
Supporting our customers in times of need
During the year, the Group participated in the various UK Government-backed loan schemes for businesses, in addition to offering payment holidays to
mortgage, personal and business customers.
Government backed loan schemes
The following loan schemes were introduced by the government in April and May 2020, with changes made to their operation announced in September
2020:
Bounce Back Loans (BBLs): loans of between £2,000 and £50,000 are available under this scheme with a fixed rate of lending av ailable for up to ten
years, with no repayments due in the first year. Changes to the scheme included customers applying to pay interest only for six months (up to a maximum
of three applications) with the additional potential for a six-month payment holiday for both capital and interest payments (this can only be requested where
the customer has already made six repayments of principal). The government guarantees 100% of the lending.
Coronavirus Business Interruption Scheme (CBILs): loans of over £50,000 to a maximum of £5m are available under this scheme. They attract a variable
rate of lending with no arrangement fees or interest paid by the borrower in the first 12 months. The government pays the fee s and interest and
guarantees 80% of the lending. The maximum loan term is six years.
Coronavirus Large Business Interruption Scheme (CLBILs): loans of over £50,000, up to a maximum of £200m (in aggregate) are available under this
scheme with a variable rate of lending and terms of between three months and three years. The government guarantees 80% of th e lending.
The Group has the following lending under these schemes as at 30 September 2020:
(Unaudited) No of
customers Drawn balance
(£m) Average loan size
(£m)
% of total Business
lending
BBLs 28,077 809 0.03 9%
CBILs 907 334 0.37 3%
CLBILs 3 20 6.59 Immaterial
The deadline for applications for loans under the schemes is 31 January 2021.
Payment holidays
The Group continues to actively support customers through COVID-19, offering payment holidays where appropriate, although the level of new requests
has reduced significantly since the peak in April 2020. Following the announcement of further national COVID-19 restrictions at the end of October 2020,
the Group will continue to align with all applicable FCA guidance in respect of payment holidays and anticipates extending their availability to impa cted
customers requesting a payment holiday prior to the 31 January 2021 deadline.
(Audited)
Payment holidays granted to date Payment holidays currently in force at
end September 2020 Of matured payment holidays
Total balances £m
% of Total balances
Total balances £m
% of Total balances
% Resumed repayment
% Further treatment/ arrears
Mortgages 11,908 20% 2,525 4% 98% 2%
Credit cards 219 5% 31 1% 92% 8%
Personal 103 11% 26 3% 95% 5%
Business 2,072 23% 108 1% 98% 2%
29
Risk Management
Credit risk
Forbearance
The Group makes every effort to treat customers fairly and aligns its forbearance practices to that principle. While forbeara nce alone is not necessarily an
indicator of impaired status, it is a trigger for a review of the customer’s credit profile and forbearance is only granted when there is a realistic prospect of
the customer repaying all facilities in full. If there is any concern over future cash flows and the Group incurring a loss, then forborne loans will also be
classified as impaired in accordance with the Group’s impairment policy.
As a consequence of the Group’s decision to early adopt the EBA probationary rules relative to forbearance, exposures classif ied as forborne and
performing at the date forbearance is granted continue to be reported as subject to forbearance for a minimum period of two years from that date (the
probation period). Exposures classified as forborne, which are non-performing when customers were granted forbearance, cannot exit non-performing
status for a minimum of 12 months from the date forbearance was granted and cannot exit forbearance status for a further two years from the date of
returning to performing status (three years in total). Forbearance frameworks are reviewed on a regular basis to ensure the o perational processes remain
appropriate and, where required, system changes are made to enhance forbearance data capture.
The Group has identified a number of situations that in isolation are not considered to be forbearance:
• facilities that have been temporarily extended pending review and where no concession has been granted for reasons relating to the actual or
apparent financial stress of a customer;
• a reduction in asset quality to a level where actual, or apparent, financial stress is not evident;
• where changes are made to the terms of a borrower’s interest structure or repayment arrangement on a commercial basis; and
• late provision of financial information, in the absence of other indicators of financial difficulty, is not in all cases cons idered a non-commercial breach
of non-financial covenants.
Where the Group has made a demand for repayment, the customer’s facilities have been withdrawn or where a debt repayment process has been
initiated, the exposure is classified as forborne if the debt is subject to any of the mentioned forbearance concessions.
Customers who requested COVID-19 related support, including payment holidays, and who were not the subject of any wider SICR triggers, or who were
otherwise assessed as having the ability in the medium term to be viable and meet risk appetite criteria, were not considered to have been granted
forbearance.
Where the Group has identified customers who require remedial action to return them within risk appetite over the medium term, or who were showing
signs of financial stress before COVID-19, such customers are considered to have been granted forbearance with exposures categorised as Stage 2 and
subject to a lifetime ECL assessment.
Mortgage and Personal forbearance
The Group utilises various forbearance measures for mortgage and personal customers, specific to the individual customer and their circumstances.
Customers may potentially be subject to more than one forbearance strategy at any one time where this is considered to be the most appropriate course
of action.
Debt management for mortgage customers in financial difficulty
To support customers who are encountering financial difficulties, cases are managed on an individual basis, with the circumst ances of each customer
considered separately and the action taken judged as being affordable and sustainable for the customer. Operationally, the provision and review of such
assistance is controlled by various methods. These include the application of an appropriate policy framework, controls around the execution of policy,
regular review of the different treatments to confirm that they remain appropriate, monitoring of customers’ performance, including the level of payments
received, and management visibility of the nature and extent of assistance provided and the associated risk.
Help is provided through specialist teams, such as the Financial Care Team, where tailored repayment programmes can be agreed. Customers are
actively supported and referred to free money advice agencies when they have multiple credit facilities, including those at o ther lenders that require
restructuring.
One component of the Group’s approach is to contact customers showing signs of financial difficulty to discuss their circumstan ces and offer solutions to
prevent their accounts falling into arrears.
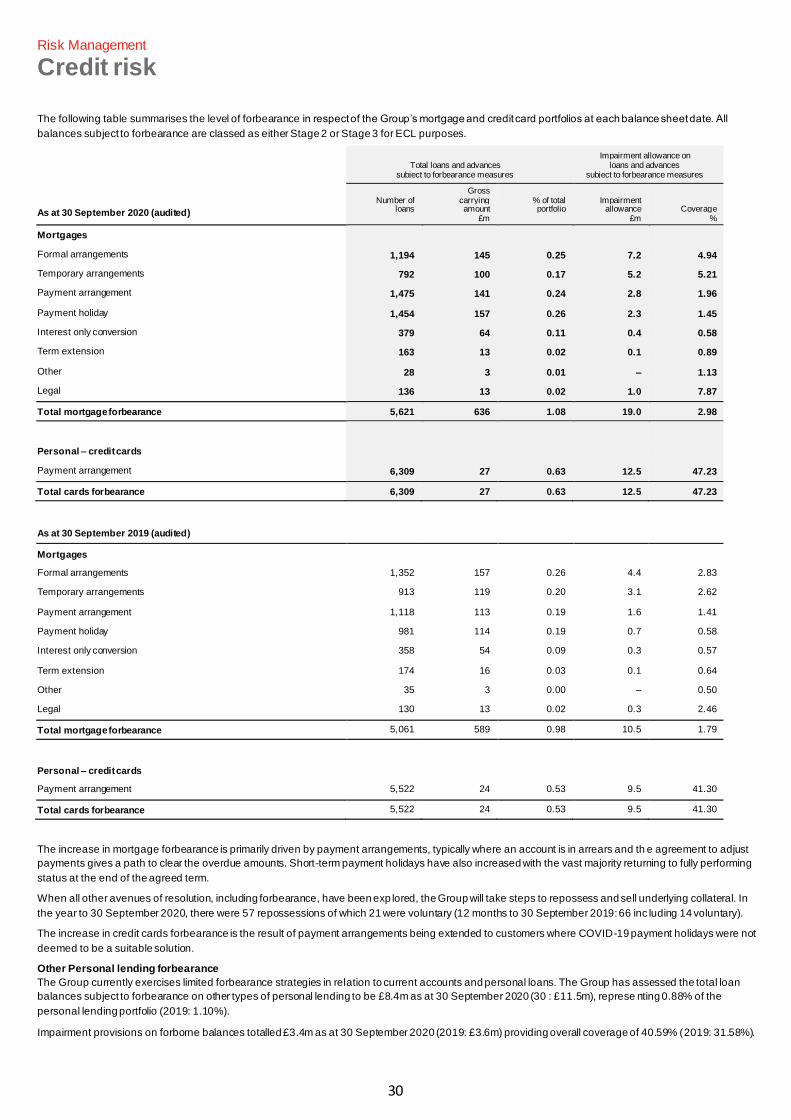
30
Risk Management
Credit risk
The following table summarises the level of forbearance in respect of the Group’s mortgage and credit card portfolios at each balance sheet date. All
balances subject to forbearance are classed as either Stage 2 or Stage 3 for ECL purposes.
As at 30 September 2020 (audited)
Total loans and advances subject to forbearance measures
Impairment allowance on loans and advances
subject to forbearance measures
Number of loans
Gross carrying amount
£m
% of total portfolio
Impairment allowance
£m Coverage
%
Mortgages Formal arrangements 1,194 145 0.25 7.2 4.94
Temporary arrangements 792 100 0.17 5.2 5.21
Payment arrangement 1,475 141 0.24 2.8 1.96
Payment holiday 1,454 157 0.26 2.3 1.45
Interest only conversion 379 64 0.11 0.4 0.58
Term extension 163 13 0.02 0.1 0.89
Other 28 3 0.01 – 1.13
Legal 136 13 0.02 1.0 7.87
Total mortgage forbearance 5,621 636 1.08 19.0 2.98
Personal – credit cards Payment arrangement 6,309 27 0.63 12.5 47.23
Total cards forbearance 6,309 27 0.63 12.5 47.23
As at 30 September 2019 (audited) Mortgages Formal arrangements 1,352 157 0.26 4.4 2.83
Temporary arrangements 913 119 0.20 3.1 2.62
Payment arrangement 1,118 113 0.19 1.6 1.41
Payment holiday 981 114 0.19 0.7 0.58
Interest only conversion 358 54 0.09 0.3 0.57
Term extension 174 16 0.03 0.1 0.64
Other 35 3 0.00 – 0.50
Legal 130 13 0.02 0.3 2.46
Total mortgage forbearance 5,061 589 0.98 10.5 1.79
Personal – credit cards Payment arrangement 5,522 24 0.53 9.5 41.30
Total cards forbearance 5,522 24 0.53 9.5 41.30
The increase in mortgage forbearance is primarily driven by payment arrangements, typically where an account is in arrears and th e agreement to adjust
payments gives a path to clear the overdue amounts. Short-term payment holidays have also increased with the vast majority returning to fully performing
status at the end of the agreed term.
When all other avenues of resolution, including forbearance, have been exp lored, the Group will take steps to repossess and sell underlying collateral. In
the year to 30 September 2020, there were 57 repossessions of which 21 were voluntary (12 months to 30 September 2019: 66 inc luding 14 voluntary).
The increase in credit cards forbearance is the result of payment arrangements being extended to customers where COVID-19 payment holidays were not
deemed to be a suitable solution.
Other Personal lending forbearance
The Group currently exercises limited forbearance strategies in relation to current accounts and personal loans. The Group has assessed the total loan
balances subject to forbearance on other types of personal lending to be £8.4m as at 30 September 2020 (30 : £11.5m), represe nting 0.88% of the
personal lending portfolio (2019: 1.10%).
Impairment provisions on forborne balances totalled £3.4m as at 30 September 2020 (2019: £3.6m) providing overall coverage of 40.59% (2019: 31.58%).
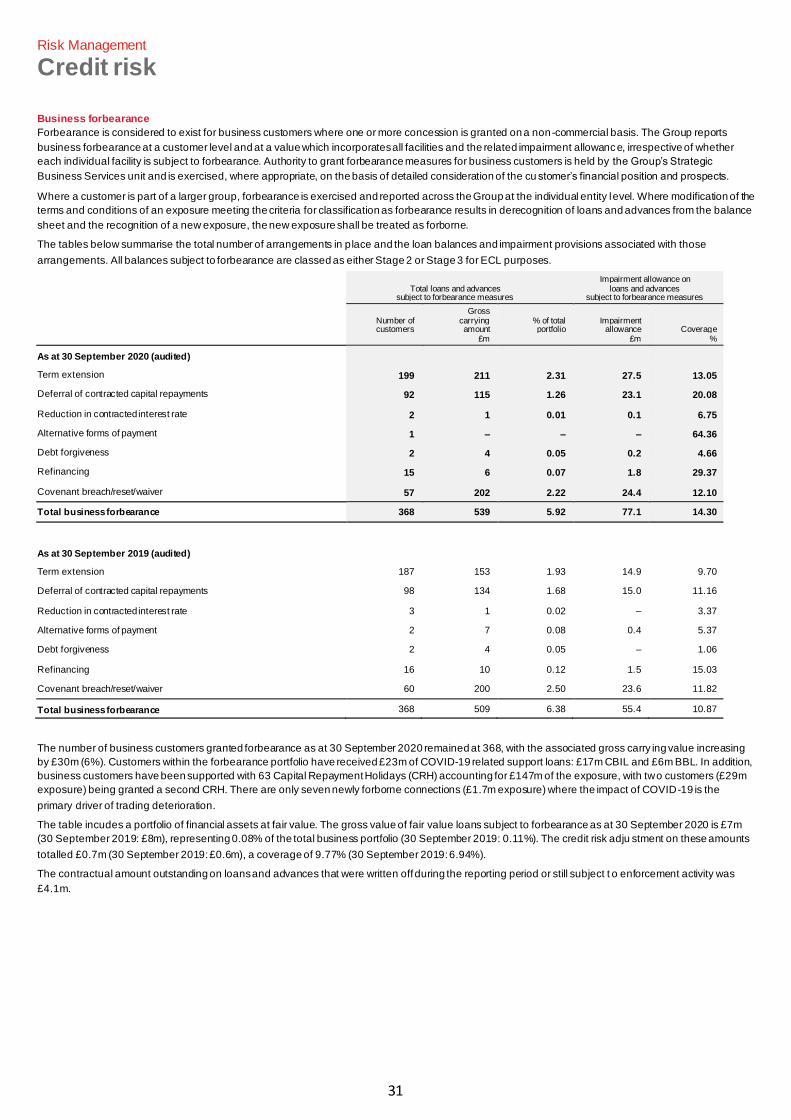
31
Risk Management
Credit risk
Business forbearance
Forbearance is considered to exist for business customers where one or more concession is granted on a non-commercial basis. The Group reports
business forbearance at a customer level and at a value which incorporates all facilities and the related impairment allowance, irrespective of whether
each individual facility is subject to forbearance. Authority to grant forbearance measures for business customers is held by the Group’s Strategic
Business Services unit and is exercised, where appropriate, on the basis of detailed consideration of the cu stomer’s financial position and prospects.
Where a customer is part of a larger group, forbearance is exercised and reported across the Group at the individual entity level. Where modification of the
terms and conditions of an exposure meeting the criteria for classification as forbearance results in derecognition of loans and advances from the balance
sheet and the recognition of a new exposure, the new exposure shall be treated as forborne.
The tables below summarise the total number of arrangements in place and the loan balances and impairment provisions associated with those
arrangements. All balances subject to forbearance are classed as either Stage 2 or Stage 3 for ECL purposes.
Total loans and advances subject to forbearance measures
Impairment allowance on loans and advances
subject to forbearance measures
Number of customers
Gross carrying amount
£m
% of total portfolio
Impairment allowance
£m Coverage
%
As at 30 September 2020 (audited) Term extension 199 211 2.31 27.5 13.05
Deferral of contracted capital repayments 92 115 1.26 23.1 20.08
Reduction in contracted interest rate 2 1 0.01 0.1 6.75
Alternative forms of payment 1 – – – 64.36
Debt forgiveness 2 4 0.05 0.2 4.66
Refinancing 15 6 0.07 1.8 29.37
Covenant breach/reset/waiver 57 202 2.22 24.4 12.10
Total business forbearance 368 539 5.92 77.1 14.30
As at 30 September 2019 (audited) Term extension 187 153 1.93 14.9 9.70
Deferral of contracted capital repayments 98 134 1.68 15.0 11.16
Reduction in contracted interest rate 3 1 0.02 – 3.37
Alternative forms of payment 2 7 0.08 0.4 5.37
Debt forgiveness 2 4 0.05 – 1.06
Refinancing 16 10 0.12 1.5 15.03
Covenant breach/reset/waiver 60 200 2.50 23.6 11.82
Total business forbearance 368 509 6.38 55.4 10.87
The number of business customers granted forbearance as at 30 September 2020 remained at 368, with the associated gross carry ing value increasing
by £30m (6%). Customers within the forbearance portfolio have received £23m of COVID-19 related support loans: £17m CBIL and £6m BBL. In addition,
business customers have been supported with 63 Capital Repayment Holidays (CRH) accounting for £147m of the exposure, with two customers (£29m
exposure) being granted a second CRH. There are only seven newly forborne connections (£1.7m exposure) where the impact of COVID-19 is the
primary driver of trading deterioration.
The table incudes a portfolio of financial assets at fair value. The gross value of fair value loans subject to forbearance as at 30 September 2020 is £7m
(30 September 2019: £8m), representing 0.08% of the total business portfolio (30 September 2019: 0.11%). The credit risk adju stment on these amounts
totalled £0.7m (30 September 2019: £0.6m), a coverage of 9.77% (30 September 2019: 6.94%).
The contractual amount outstanding on loans and advances that were written off during the reporting period or still subject t o enforcement activity was
£4.1m.
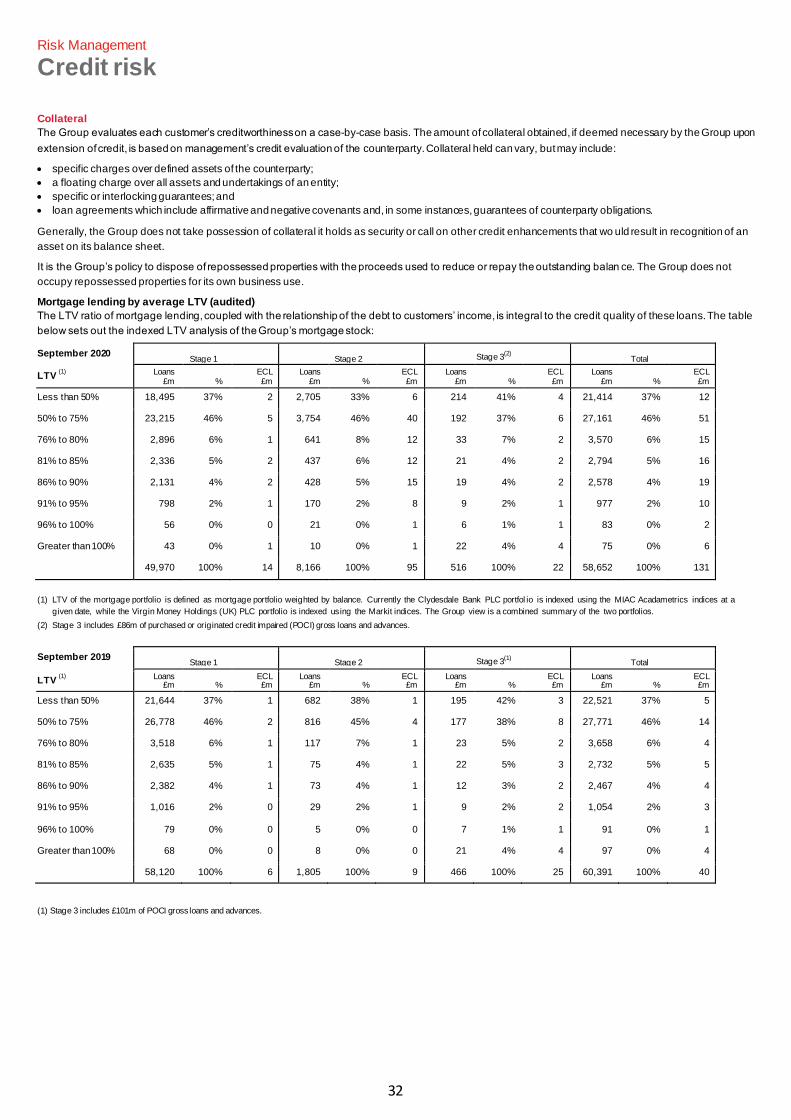
32
Risk Management
Credit risk
Collateral
The Group evaluates each customer’s creditworthiness on a case-by-case basis. The amount of collateral obtained, if deemed necessary by the Group upon
extension of credit, is based on management’s credit evaluation of the counterparty. Collateral held can vary, but may include:
• specific charges over defined assets of the counterparty;
• a floating charge over all assets and undertakings of an entity;
• specific or interlocking guarantees; and
• loan agreements which include affirmative and negative covenants and, in some instances, guarantees of counterparty obligations.
Generally, the Group does not take possession of collateral it holds as security or call on other credit enhancements that wo uld result in recognition of an
asset on its balance sheet.
It is the Group’s policy to dispose of repossessed properties with the proceeds used to reduce or repay the outstanding balan ce. The Group does not
occupy repossessed properties for its own business use.
Mortgage lending by average LTV (audited)
The LTV ratio of mortgage lending, coupled with the relationship of the debt to customers’ income, is integral to the credit quality of these loans. The table
below sets out the indexed LTV analysis of the Group’s mortgage stock:
September 2020 Stage 1 Stage 2 Stage 3
(2) Total
LTV (1)
Loans £m %
ECL £m
Loans £m %
ECL £m
Loans £m %
ECL £m
Loans £m %
ECL £m
Less than 50% 18,495 37% 2 2,705 33% 6 214 41% 4 21,414 37% 12
50% to 75% 23,215 46% 5 3,754 46% 40 192 37% 6 27,161 46% 51
76% to 80% 2,896 6% 1 641 8% 12 33 7% 2 3,570 6% 15
81% to 85% 2,336 5% 2 437 6% 12 21 4% 2 2,794 5% 16
86% to 90% 2,131 4% 2 428 5% 15 19 4% 2 2,578 4% 19
91% to 95% 798 2% 1 170 2% 8 9 2% 1 977 2% 10
96% to 100% 56 0% 0 21 0% 1 6 1% 1 83 0% 2
Greater than 100% 43 0% 1 10 0% 1 22 4% 4 75 0% 6
49,970 100% 14 8,166 100% 95 516 100% 22 58,652 100% 131
(1) LTV of the mortgage portfolio is defined as mortgage portfolio weighted by balance. Currently the Clydesdale Bank PLC portfol io is indexed using the MIAC Acadametrics indices at a
given date, while the Virgin Money Holdings (UK) PLC portfolio is indexed using the Markit indices. The Group view is a combined summary of the two portfolios.
(2) Stage 3 includes £86m of purchased or originated credit impaired (POCI) gross loans and advances.
September 2019 Stage 1 Stage 2 Stage 3
(1) Total
LTV (1)
Loans £m %
ECL £m
Loans £m %
ECL £m
Loans £m %
ECL £m
Loans £m %
ECL £m
Less than 50% 21,644 37% 1 682 38% 1 195 42% 3 22,521 37% 5
50% to 75% 26,778 46% 2 816 45% 4 177 38% 8 27,771 46% 14
76% to 80% 3,518 6% 1 117 7% 1 23 5% 2 3,658 6% 4
81% to 85% 2,635 5% 1 75 4% 1 22 5% 3 2,732 5% 5
86% to 90% 2,382 4% 1 73 4% 1 12 3% 2 2,467 4% 4
91% to 95% 1,016 2% 0 29 2% 1 9 2% 2 1,054 2% 3
96% to 100% 79 0% 0 5 0% 0 7 1% 1 91 0% 1
Greater than 100% 68 0% 0 8 0% 0 21 4% 4 97 0% 4
58,120 100% 6 1,805 100% 9 466 100% 25 60,391 100% 40
(1) Stage 3 includes £101m of POCI gross loans and advances.
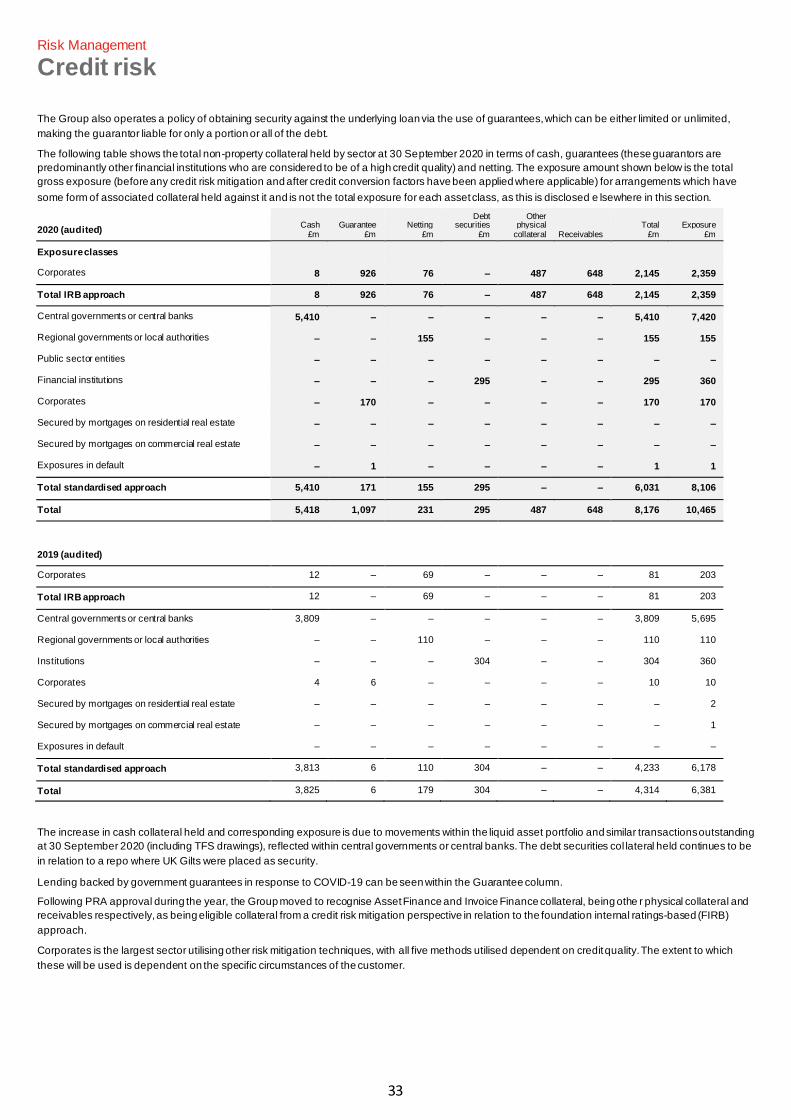
33
Risk Management
Credit risk
The Group also operates a policy of obtaining security against the underlying loan via the use of guarantees, which can be either limited or unlimited,
making the guarantor liable for only a portion or all of the debt.
The following table shows the total non-property collateral held by sector at 30 September 2020 in terms of cash, guarantees (these guarantors are
predominantly other financial institutions who are considered to be of a high credit quality) and netting. The exposure amount shown below is the total
gross exposure (before any credit risk mitigation and after credit conversion factors have been applied where applicable) for arrangements which have
some form of associated collateral held against it and is not the total exposure for each asset class, as this is disclosed e lsewhere in this section.
2020 (audited) Cash
£m Guarantee
£m Netting
£m
Debt securities
£m
Other physical
collateral Receivables Total
£m Exposure
£m
Exposure classes Corporates 8 926 76 – 487 648 2,145 2,359
Total IRB approach 8 926 76 – 487 648 2,145 2,359
Central governments or central banks 5,410 – – – – – 5,410 7,420
Regional governments or local authorities – – 155 – – – 155 155
Public sector entities – – – – – – – –
Financial institutions – – – 295 – – 295 360
Corporates – 170 – – – – 170 170
Secured by mortgages on residential real estate – – – – – – – –
Secured by mortgages on commercial real estate – – – – – – – –
Exposures in default – 1 – – – – 1 1
Total standardised approach 5,410 171 155 295 – – 6,031 8,106
Total 5,418 1,097 231 295 487 648 8,176 10,465
2019 (audited) Corporates 12 – 69 – – – 81 203
Total IRB approach 12 – 69 – – – 81 203
Central governments or central banks 3,809 – – – – – 3,809 5,695
Regional governments or local authorities – – 110 – – – 110 110
Institutions – – – 304 – – 304 360
Corporates 4 6 – – – – 10 10
Secured by mortgages on residential real estate – – – – – – – 2
Secured by mortgages on commercial real estate – – – – – – – 1
Exposures in default – – – – – – – –
Total standardised approach 3,813 6 110 304 – – 4,233 6,178
Total 3,825 6 179 304 – – 4,314 6,381
The increase in cash collateral held and corresponding exposure is due to movements within the liquid asset portfolio and similar transactions outstanding
at 30 September 2020 (including TFS drawings), reflected within central governments or central banks. The debt securities col lateral held continues to be
in relation to a repo where UK Gilts were placed as security.
Lending backed by government guarantees in response to COVID-19 can be seen within the Guarantee column.
Following PRA approval during the year, the Group moved to recognise Asset Finance and Invoice Finance collateral, being othe r physical collateral and
receivables respectively, as being eligible collateral from a credit risk mitigation perspective in relation to the foundation internal ratings-based (FIRB)
approach.
Corporates is the largest sector utilising other risk mitigation techniques, with all five methods utilised dependent on credit quality. The extent to which
these will be used is dependent on the specific circumstances of the customer.
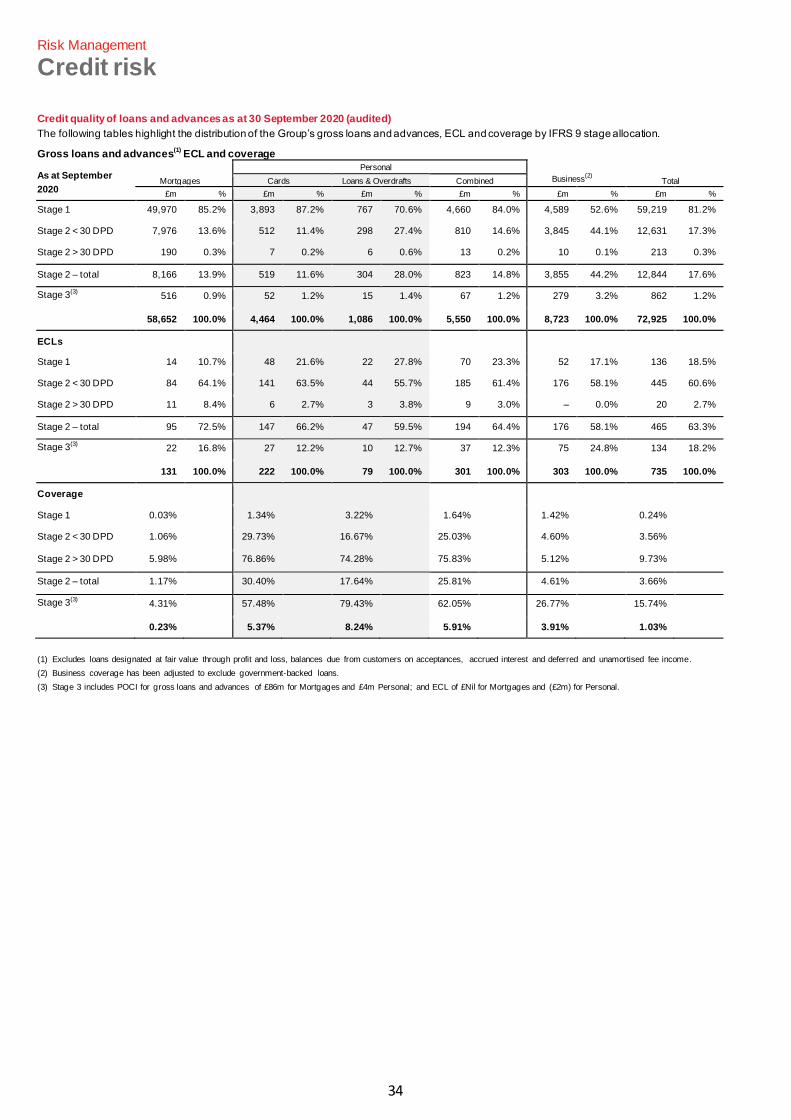
34
Risk Management
Credit risk
Credit quality of loans and advances as at 30 September 2020 (audited)
The following tables highlight the distribution of the Group’s gross loans and advances, ECL and coverage by IFRS 9 stage allocation.
Gross loans and advances(1)
ECL and coverage
As at September
2020 Mortgages
Personal
Business(2)
Total Cards Loans & Overdrafts Combined
£m % £m % £m % £m % £m % £m %
Stage 1 49,970 85.2% 3,893 87.2% 767 70.6% 4,660 84.0% 4,589 52.6% 59,219 81.2%
Stage 2 < 30 DPD 7,976 13.6% 512 11.4% 298 27.4% 810 14.6% 3,845 44.1% 12,631 17.3%
Stage 2 > 30 DPD 190 0.3% 7 0.2% 6 0.6% 13 0.2% 10 0.1% 213 0.3%
Stage 2 – total 8,166 13.9% 519 11.6% 304 28.0% 823 14.8% 3,855 44.2% 12,844 17.6%
Stage 3(3) 516 0.9% 52 1.2% 15 1.4% 67 1.2% 279 3.2% 862 1.2%
58,652 100.0% 4,464 100.0% 1,086 100.0% 5,550 100.0% 8,723 100.0% 72,925 100.0%
ECLs Stage 1 14 10.7% 48 21.6% 22 27.8% 70 23.3% 52 17.1% 136 18.5%
Stage 2 < 30 DPD 84 64.1% 141 63.5% 44 55.7% 185 61.4% 176 58.1% 445 60.6%
Stage 2 > 30 DPD 11 8.4% 6 2.7% 3 3.8% 9 3.0% – 0.0% 20 2.7%
Stage 2 – total 95 72.5% 147 66.2% 47 59.5% 194 64.4% 176 58.1% 465 63.3%
Stage 3(3) 22 16.8% 27 12.2% 10 12.7% 37 12.3% 75 24.8% 134 18.2%
131 100.0% 222 100.0% 79 100.0% 301 100.0% 303 100.0% 735 100.0%
Coverage
Stage 1 0.03% 1.34% 3.22% 1.64% 1.42% 0.24% Stage 2 < 30 DPD 1.06% 29.73% 16.67% 25.03% 4.60% 3.56%
Stage 2 > 30 DPD 5.98% 76.86% 74.28% 75.83% 5.12% 9.73%
Stage 2 – total 1.17% 30.40% 17.64% 25.81% 4.61% 3.66% Stage 3(3) 4.31% 57.48% 79.43% 62.05% 26.77% 15.74%
0.23% 5.37% 8.24% 5.91% 3.91% 1.03%
(1) Excludes loans designated at fair value through profit and loss, balances due from customers on acceptances, accrued interest and deferred and unamortised fee income.
(2) Business coverage has been adjusted to exclude government-backed loans.
(3) Stage 3 includes POCI for gross loans and advances of £86m for Mortgages and £4m Personal; and ECL of £Nil for Mortgages and (£2m) for Personal.
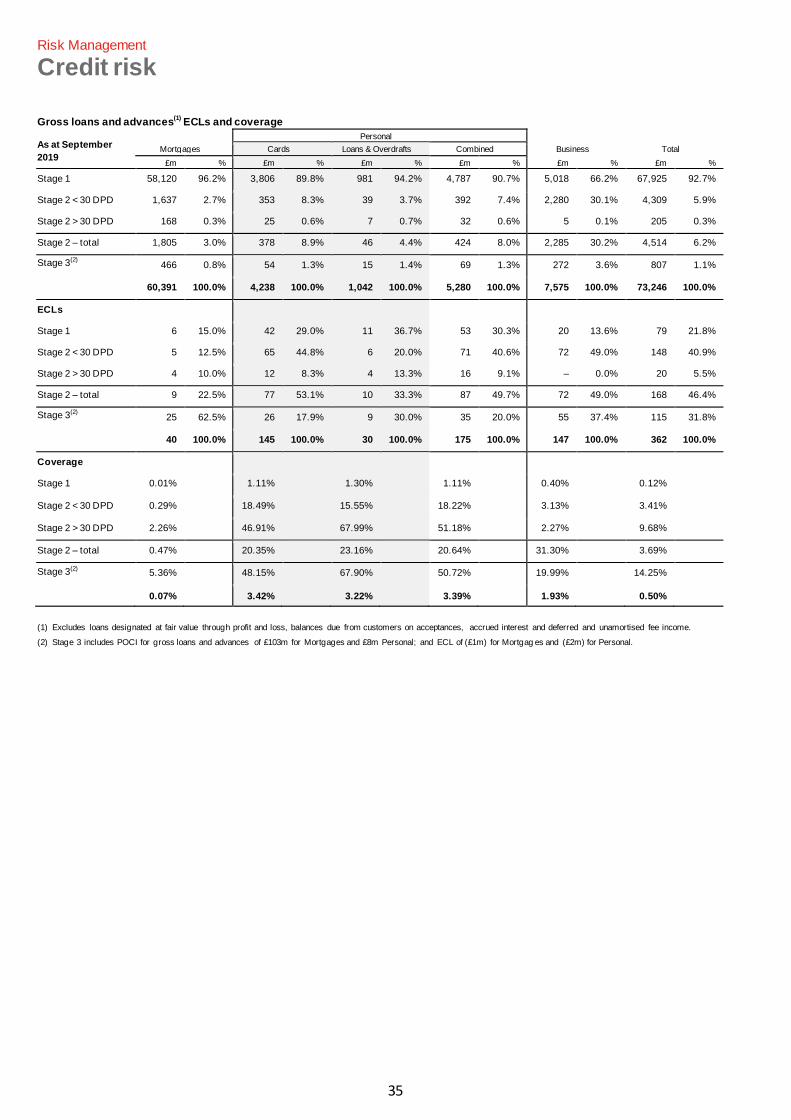
35
Risk Management
Credit risk
Gross loans and advances
(1) ECLs and coverage
As at September
2019 Mortgages
Personal
Business Total Cards Loans & Overdrafts Combined
£m % £m % £m % £m % £m % £m %
Stage 1 58,120 96.2% 3,806 89.8% 981 94.2% 4,787 90.7% 5,018 66.2% 67,925 92.7%
Stage 2 < 30 DPD 1,637 2.7% 353 8.3% 39 3.7% 392 7.4% 2,280 30.1% 4,309 5.9%
Stage 2 > 30 DPD 168 0.3% 25 0.6% 7 0.7% 32 0.6% 5 0.1% 205 0.3%
Stage 2 – total 1,805 3.0% 378 8.9% 46 4.4% 424 8.0% 2,285 30.2% 4,514 6.2%
Stage 3(2) 466 0.8% 54 1.3% 15 1.4% 69 1.3% 272 3.6% 807 1.1%
60,391 100.0% 4,238 100.0% 1,042 100.0% 5,280 100.0% 7,575 100.0% 73,246 100.0%
ECLs Stage 1 6 15.0% 42 29.0% 11 36.7% 53 30.3% 20 13.6% 79 21.8%
Stage 2 < 30 DPD 5 12.5% 65 44.8% 6 20.0% 71 40.6% 72 49.0% 148 40.9%
Stage 2 > 30 DPD 4 10.0% 12 8.3% 4 13.3% 16 9.1% – 0.0% 20 5.5%
Stage 2 – total 9 22.5% 77 53.1% 10 33.3% 87 49.7% 72 49.0% 168 46.4%
Stage 3(2) 25 62.5% 26 17.9% 9 30.0% 35 20.0% 55 37.4% 115 31.8%
40 100.0% 145 100.0% 30 100.0% 175 100.0% 147 100.0% 362 100.0%
Coverage Stage 1 0.01% 1.11% 1.30% 1.11% 0.40% 0.12% Stage 2 < 30 DPD 0.29% 18.49% 15.55% 18.22% 3.13% 3.41%
Stage 2 > 30 DPD 2.26% 46.91% 67.99% 51.18% 2.27% 9.68%
Stage 2 – total 0.47% 20.35% 23.16% 20.64% 31.30% 3.69% Stage 3(2) 5.36% 48.15% 67.90% 50.72% 19.99% 14.25%
0.07% 3.42% 3.22% 3.39% 1.93% 0.50%
(1) Excludes loans designated at fair value through profit and loss, balances due from customers on acceptances, accrued interest and deferred and unamortised fee income.
(2) Stage 3 includes POCI for gross loans and advances of £103m for Mortgages and £8m Personal; and ECL of (£1m) for Mortgag es and (£2m) for Personal.
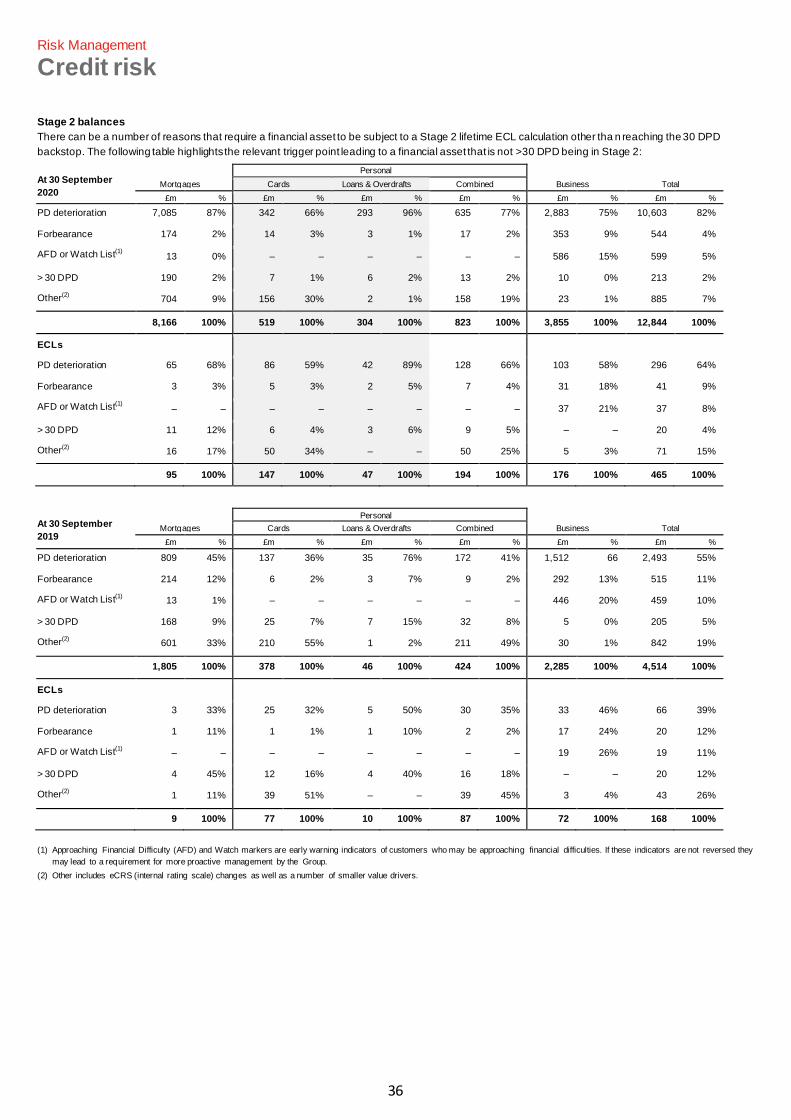
36
Risk Management
Credit risk
Stage 2 balances
There can be a number of reasons that require a financial asset to be subject to a Stage 2 lifetime ECL calculation other tha n reaching the 30 DPD
backstop. The following table highlights the relevant trigger point leading to a financial asset that is not >30 DPD being in Stage 2:
At 30 September
2020 Mortgages
Personal
Business Total Cards Loans & Overdrafts Combined
£m % £m % £m % £m % £m % £m %
PD deterioration 7,085 87% 342 66% 293 96% 635 77% 2,883 75% 10,603 82%
Forbearance 174 2% 14 3% 3 1% 17 2% 353 9% 544 4%
AFD or Watch List(1) 13 0% – – – – – – 586 15% 599 5%
> 30 DPD 190 2% 7 1% 6 2% 13 2% 10 0% 213 2%
Other(2) 704 9% 156 30% 2 1% 158 19% 23 1% 885 7%
8,166 100% 519 100% 304 100% 823 100% 3,855 100% 12,844 100%
ECLs PD deterioration 65 68% 86 59% 42 89% 128 66% 103 58% 296 64%
Forbearance 3 3% 5 3% 2 5% 7 4% 31 18% 41 9%
AFD or Watch List(1) – – – – – – – – 37 21% 37 8%
> 30 DPD 11 12% 6 4% 3 6% 9 5% – – 20 4%
Other(2) 16 17% 50 34% – – 50 25% 5 3% 71 15%
95 100% 147 100% 47 100% 194 100% 176 100% 465 100%
At 30 September
2019 Mortgages
Personal
Business Total Cards Loans & Overdrafts Combined
£m % £m % £m % £m % £m % £m %
PD deterioration 809 45% 137 36% 35 76% 172 41% 1,512 66 2,493 55%
Forbearance 214 12% 6 2% 3 7% 9 2% 292 13% 515 11%
AFD or Watch List(1) 13 1% – – – – – – 446 20% 459 10%
> 30 DPD 168 9% 25 7% 7 15% 32 8% 5 0% 205 5%
Other(2) 601 33% 210 55% 1 2% 211 49% 30 1% 842 19%
1,805 100% 378 100% 46 100% 424 100% 2,285 100% 4,514 100%
ECLs PD deterioration 3 33% 25 32% 5 50% 30 35% 33 46% 66 39%
Forbearance 1 11% 1 1% 1 10% 2 2% 17 24% 20 12%
AFD or Watch List(1) – – – – – – – – 19 26% 19 11%
> 30 DPD 4 45% 12 16% 4 40% 16 18% – – 20 12%
Other(2) 1 11% 39 51% – – 39 45% 3 4% 43 26%
9 100% 77 100% 10 100% 87 100% 72 100% 168 100%
(1) Approaching Financial Difficulty (AFD) and Watch markers are early warning indicators of customers who may be approaching financial difficulties. If these indicators are not reversed they
may lead to a requirement for more proactive management by the Group.
(2) Other includes eCRS (internal rating scale) changes as well as a number of smaller value drivers.
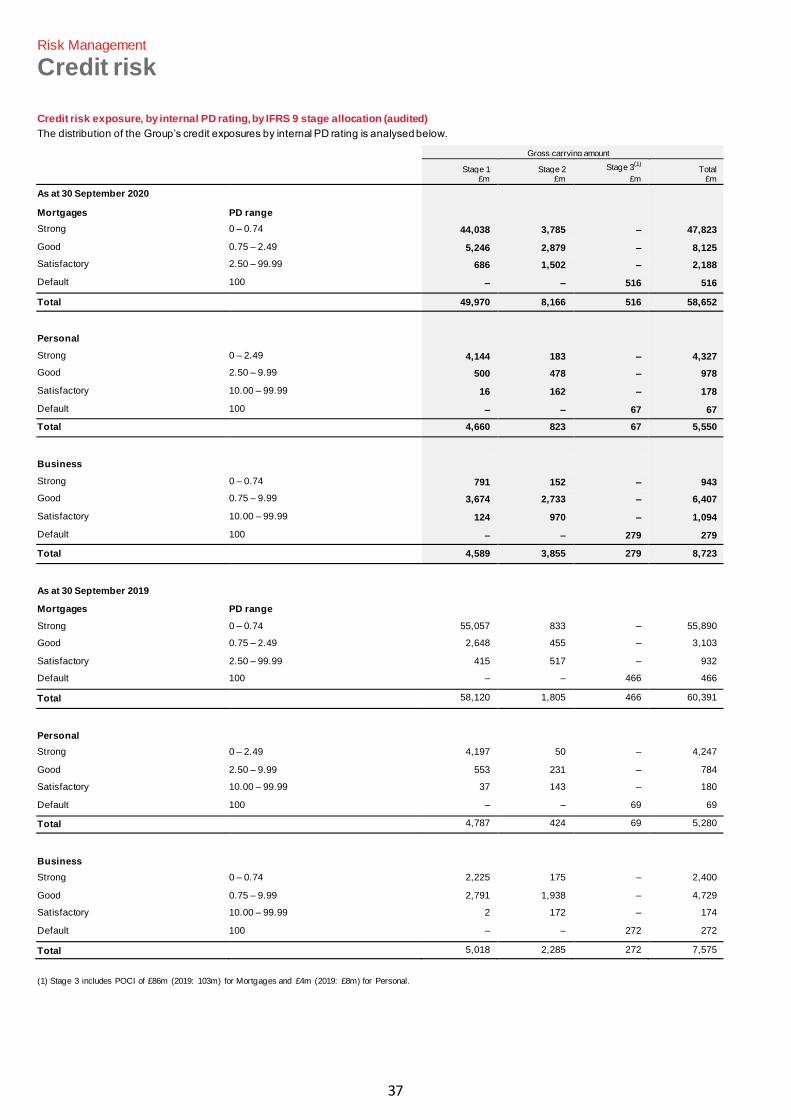
37
Risk Management
Credit risk
Credit risk exposure, by internal PD rating, by IFRS 9 stage allocation (audited)
The distribution of the Group’s credit exposures by internal PD rating is analysed below.
Gross carrying amount
Stage 1 £m
Stage 2 £m
Stage 3(1)
£m Total
£m
As at 30 September 2020 Mortgages PD range Strong 0 – 0.74 44,038 3,785 – 47,823
Good 0.75 – 2.49 5,246 2,879 – 8,125
Satisfactory 2.50 – 99.99 686 1,502 – 2,188
Default 100 – – 516 516
Total 49,970 8,166 516 58,652
Personal Strong 0 – 2.49 4,144 183 – 4,327
Good 2.50 – 9.99 500 478 – 978
Satisfactory 10.00 – 99.99 16 162 – 178
Default 100 – – 67 67
Total 4,660 823 67 5,550
Business Strong 0 – 0.74 791 152 – 943
Good 0.75 – 9.99 3,674 2,733 – 6,407
Satisfactory 10.00 – 99.99 124 970 – 1,094
Default 100 – – 279 279
Total 4,589 3,855 279 8,723
As at 30 September 2019 Mortgages PD range Strong 0 – 0.74 55,057 833 – 55,890
Good 0.75 – 2.49 2,648 455 – 3,103
Satisfactory 2.50 – 99.99 415 517 – 932
Default 100 – – 466 466
Total 58,120 1,805 466 60,391
Personal Strong 0 – 2.49 4,197 50 – 4,247
Good 2.50 – 9.99 553 231 – 784
Satisfactory 10.00 – 99.99 37 143 – 180
Default 100 – – 69 69
Total 4,787 424 69 5,280
Business Strong 0 – 0.74 2,225 175 – 2,400
Good 0.75 – 9.99 2,791 1,938 – 4,729
Satisfactory 10.00 – 99.99 2 172 – 174
Default 100 – – 272 272
Total 5,018 2,285 272 7,575
(1) Stage 3 includes POCI of £86m (2019: 103m) for Mortgages and £4m (2019: £8m) for Personal.
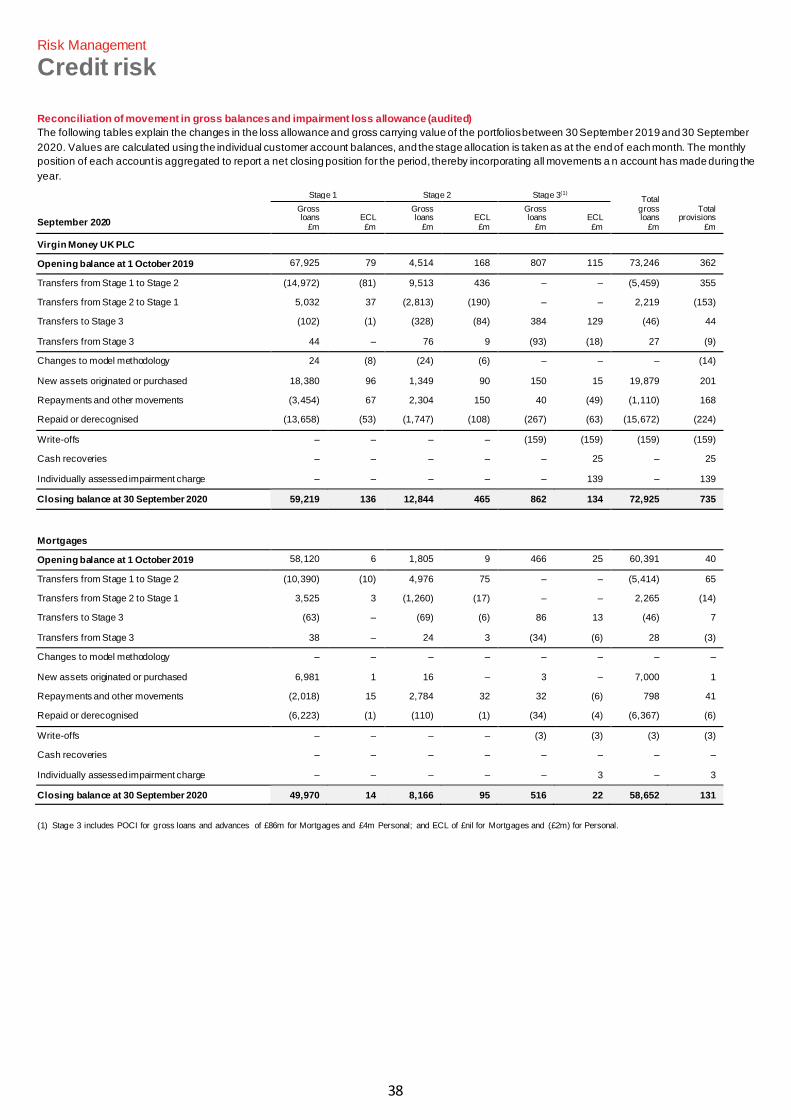
38
Risk Management
Credit risk
Reconciliation of movement in gross balances and impairment loss allowance (audited)
The following tables explain the changes in the loss allowance and gross carrying value of the portfolios between 30 September 2019 and 30 September
2020. Values are calculated using the individual customer account balances, and the stage allocation is taken as at the end of each month. The monthly
position of each account is aggregated to report a net closing position for the period, thereby incorporating all movements a n account has made during the
year.
September 2020
Stage 1 Stage 2 Stage 3(1) Total
gross loans
£m
Total provisions
£m
Gross loans
£m ECL £m
Gross loans
£m ECL £m
Gross loans
£m ECL £m
Virgin Money UK PLC Opening balance at 1 October 2019 67,925 79 4,514 168 807 115 73,246 362
Transfers from Stage 1 to Stage 2 (14,972) (81) 9,513 436 – – (5,459) 355
Transfers from Stage 2 to Stage 1 5,032 37 (2,813) (190) – – 2,219 (153)
Transfers to Stage 3 (102) (1) (328) (84) 384 129 (46) 44
Transfers from Stage 3 44 – 76 9 (93) (18) 27 (9)
Changes to model methodology 24 (8) (24) (6) – – – (14)
New assets originated or purchased 18,380 96 1,349 90 150 15 19,879 201
Repayments and other movements (3,454) 67 2,304 150 40 (49) (1,110) 168
Repaid or derecognised (13,658) (53) (1,747) (108) (267) (63) (15,672) (224)
Write-offs – – – – (159) (159) (159) (159)
Cash recoveries – – – – – 25 – 25
Individually assessed impairment charge – – – – – 139 – 139
Closing balance at 30 September 2020 59,219 136 12,844 465 862 134 72,925 735
Mortgages Opening balance at 1 October 2019 58,120 6 1,805 9 466 25 60,391 40
Transfers from Stage 1 to Stage 2 (10,390) (10) 4,976 75 – – (5,414) 65
Transfers from Stage 2 to Stage 1 3,525 3 (1,260) (17) – – 2,265 (14)
Transfers to Stage 3 (63) – (69) (6) 86 13 (46) 7
Transfers from Stage 3 38 – 24 3 (34) (6) 28 (3)
Changes to model methodology – – – – – – – –
New assets originated or purchased 6,981 1 16 – 3 – 7,000 1
Repayments and other movements (2,018) 15 2,784 32 32 (6) 798 41
Repaid or derecognised (6,223) (1) (110) (1) (34) (4) (6,367) (6)
Write-offs – – – – (3) (3) (3) (3)
Cash recoveries – – – – – – – –
Individually assessed impairment charge – – – – – 3 – 3
Closing balance at 30 September 2020 49,970 14 8,166 95 516 22 58,652 131
(1) Stage 3 includes POCI for gross loans and advances of £86m for Mortgages and £4m Personal; and ECL of £nil for Mortgages and (£2m) for Personal.
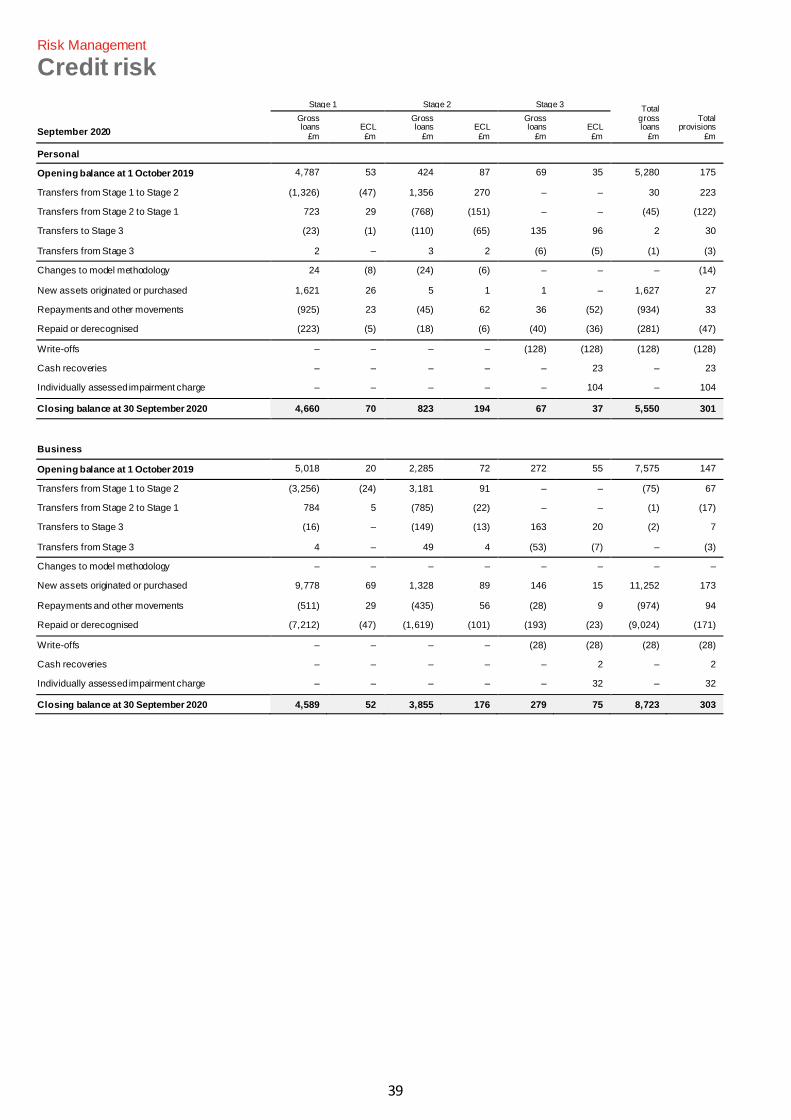
39
Risk Management
Credit risk
September 2020
Stage 1 Stage 2 Stage 3 Total
gross loans
£m
Total provisions
£m
Gross loans
£m ECL £m
Gross loans
£m ECL £m
Gross loans
£m ECL £m
Personal Opening balance at 1 October 2019 4,787 53 424 87 69 35 5,280 175
Transfers from Stage 1 to Stage 2 (1,326) (47) 1,356 270 – – 30 223
Transfers from Stage 2 to Stage 1 723 29 (768) (151) – – (45) (122)
Transfers to Stage 3 (23) (1) (110) (65) 135 96 2 30
Transfers from Stage 3 2 – 3 2 (6) (5) (1) (3)
Changes to model methodology 24 (8) (24) (6) – – – (14)
New assets originated or purchased 1,621 26 5 1 1 – 1,627 27
Repayments and other movements (925) 23 (45) 62 36 (52) (934) 33
Repaid or derecognised (223) (5) (18) (6) (40) (36) (281) (47)
Write-offs – – – – (128) (128) (128) (128)
Cash recoveries – – – – – 23 – 23
Individually assessed impairment charge – – – – – 104 – 104
Closing balance at 30 September 2020 4,660 70 823 194 67 37 5,550 301
Business Opening balance at 1 October 2019 5,018 20 2,285 72 272 55 7,575 147
Transfers from Stage 1 to Stage 2 (3,256) (24) 3,181 91 – – (75) 67
Transfers from Stage 2 to Stage 1 784 5 (785) (22) – – (1) (17)
Transfers to Stage 3 (16) – (149) (13) 163 20 (2) 7
Transfers from Stage 3 4 – 49 4 (53) (7) – (3)
Changes to model methodology – – – – – – – –
New assets originated or purchased 9,778 69 1,328 89 146 15 11,252 173
Repayments and other movements (511) 29 (435) 56 (28) 9 (974) 94
Repaid or derecognised (7,212) (47) (1,619) (101) (193) (23) (9,024) (171)
Write-offs – – – – (28) (28) (28) (28)
Cash recoveries – – – – – 2 – 2
Individually assessed impairment charge – – – – – 32 – 32
Closing balance at 30 September 2020 4,589 52 3,855 176 279 75 8,723 303
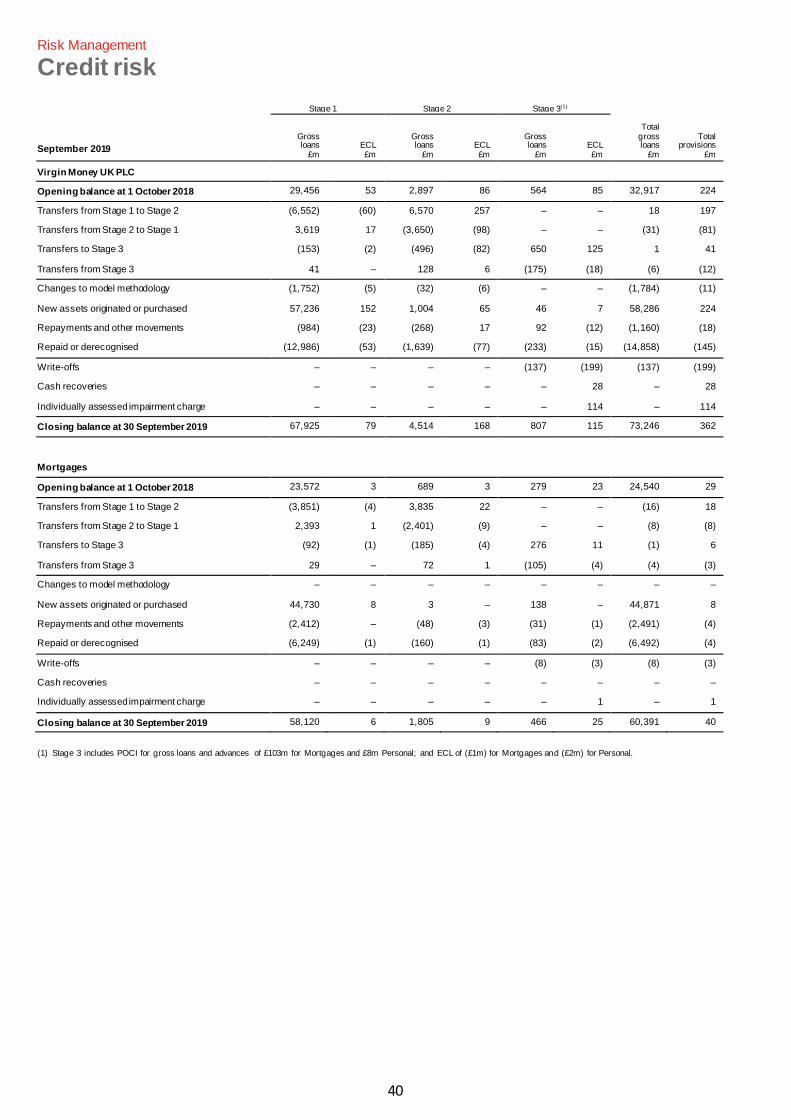
40
Risk Management
Credit risk
September 2019
Stage 1 Stage 2 Stage 3(1)
Total gross loans
£m
Total provisions
£m
Gross loans
£m ECL £m
Gross loans
£m ECL £m
Gross loans
£m ECL £m
Virgin Money UK PLC Opening balance at 1 October 2018 29,456 53 2,897 86 564 85 32,917 224
Transfers from Stage 1 to Stage 2 (6,552) (60) 6,570 257 – – 18 197
Transfers from Stage 2 to Stage 1 3,619 17 (3,650) (98) – – (31) (81)
Transfers to Stage 3 (153) (2) (496) (82) 650 125 1 41
Transfers from Stage 3 41 – 128 6 (175) (18) (6) (12)
Changes to model methodology (1,752) (5) (32) (6) – – (1,784) (11)
New assets originated or purchased 57,236 152 1,004 65 46 7 58,286 224
Repayments and other movements (984) (23) (268) 17 92 (12) (1,160) (18)
Repaid or derecognised (12,986) (53) (1,639) (77) (233) (15) (14,858) (145)
Write-offs – – – – (137) (199) (137) (199)
Cash recoveries – – – – – 28 – 28
Individually assessed impairment charge – – – – – 114 – 114
Closing balance at 30 September 2019 67,925 79 4,514 168 807 115 73,246 362
Mortgages Opening balance at 1 October 2018 23,572 3 689 3 279 23 24,540 29
Transfers from Stage 1 to Stage 2 (3,851) (4) 3,835 22 – – (16) 18
Transfers from Stage 2 to Stage 1 2,393 1 (2,401) (9) – – (8) (8)
Transfers to Stage 3 (92) (1) (185) (4) 276 11 (1) 6
Transfers from Stage 3 29 – 72 1 (105) (4) (4) (3)
Changes to model methodology – – – – – – – –
New assets originated or purchased 44,730 8 3 – 138 – 44,871 8
Repayments and other movements (2,412) – (48) (3) (31) (1) (2,491) (4)
Repaid or derecognised (6,249) (1) (160) (1) (83) (2) (6,492) (4)
Write-offs – – – – (8) (3) (8) (3)
Cash recoveries – – – – – – – –
Individually assessed impairment charge – – – – – 1 – 1
Closing balance at 30 September 2019 58,120 6 1,805 9 466 25 60,391 40
(1) Stage 3 includes POCI for gross loans and advances of £103m for Mortgages and £8m Personal; and ECL of (£1m) for Mortgages and (£2m) for Personal.
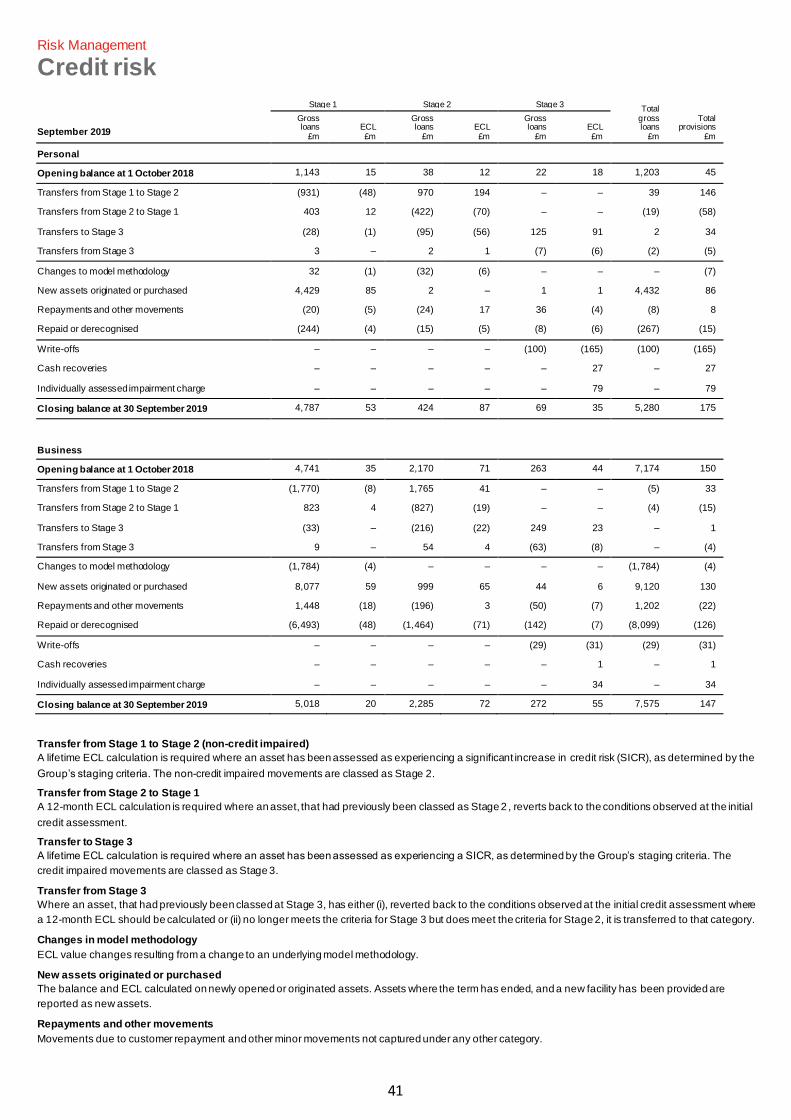
41
Risk Management
Credit risk
September 2019
Stage 1 Stage 2 Stage 3 Total
gross loans
£m
Total provisions
£m
Gross loans
£m ECL £m
Gross loans
£m ECL £m
Gross loans
£m ECL £m
Personal Opening balance at 1 October 2018 1,143 15 38 12 22 18 1,203 45
Transfers from Stage 1 to Stage 2 (931) (48) 970 194 – – 39 146
Transfers from Stage 2 to Stage 1 403 12 (422) (70) – – (19) (58)
Transfers to Stage 3 (28) (1) (95) (56) 125 91 2 34
Transfers from Stage 3 3 – 2 1 (7) (6) (2) (5)
Changes to model methodology 32 (1) (32) (6) – – – (7)
New assets originated or purchased 4,429 85 2 – 1 1 4,432 86
Repayments and other movements (20) (5) (24) 17 36 (4) (8) 8
Repaid or derecognised (244) (4) (15) (5) (8) (6) (267) (15)
Write-offs – – – – (100) (165) (100) (165)
Cash recoveries – – – – – 27 – 27
Individually assessed impairment charge – – – – – 79 – 79
Closing balance at 30 September 2019 4,787 53 424 87 69 35 5,280 175
Business Opening balance at 1 October 2018 4,741 35 2,170 71 263 44 7,174 150
Transfers from Stage 1 to Stage 2 (1,770) (8) 1,765 41 – – (5) 33
Transfers from Stage 2 to Stage 1 823 4 (827) (19) – – (4) (15)
Transfers to Stage 3 (33) – (216) (22) 249 23 – 1
Transfers from Stage 3 9 – 54 4 (63) (8) – (4)
Changes to model methodology (1,784) (4) – – – – (1,784) (4)
New assets originated or purchased 8,077 59 999 65 44 6 9,120 130
Repayments and other movements 1,448 (18) (196) 3 (50) (7) 1,202 (22)
Repaid or derecognised (6,493) (48) (1,464) (71) (142) (7) (8,099) (126)
Write-offs – – – – (29) (31) (29) (31)
Cash recoveries – – – – – 1 – 1
Individually assessed impairment charge – – – – – 34 – 34
Closing balance at 30 September 2019 5,018 20 2,285 72 272 55 7,575 147
Transfer from Stage 1 to Stage 2 (non-credit impaired)
A lifetime ECL calculation is required where an asset has been assessed as experiencing a significant increase in credit risk (SICR), as determined by the
Group’s staging criteria. The non-credit impaired movements are classed as Stage 2.
Transfer from Stage 2 to Stage 1
A 12-month ECL calculation is required where an asset, that had previously been classed as Stage 2 , reverts back to the conditions observed at the initial
credit assessment.
Transfer to Stage 3
A lifetime ECL calculation is required where an asset has been assessed as experiencing a SICR, as determined by the Group’s staging criteria. The
credit impaired movements are classed as Stage 3.
Transfer from Stage 3
Where an asset, that had previously been classed at Stage 3, has either (i), reverted back to the conditions observed at the initial credit assessment where
a 12-month ECL should be calculated or (ii) no longer meets the criteria for Stage 3 but does meet the criteria for Stage 2, it is transferred to that category.
Changes in model methodology
ECL value changes resulting from a change to an underlying model methodology.
New assets originated or purchased
The balance and ECL calculated on newly opened or originated assets. Assets where the term has ended, and a new facility has been provided are
reported as new assets.
Repayments and other movements
Movements due to customer repayment and other minor movements not captured under any other category.
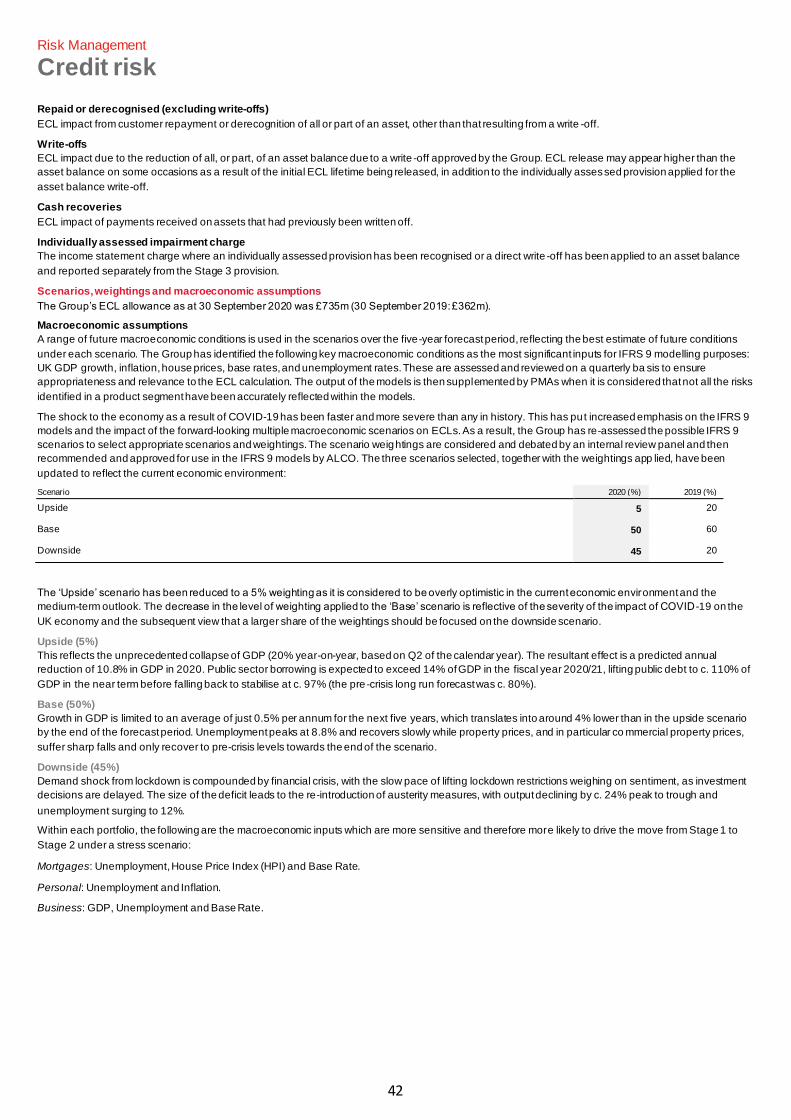
42
Risk Management
Credit risk
Repaid or derecognised (excluding write-offs)
ECL impact from customer repayment or derecognition of all or part of an asset, other than that resulting from a write -off.
Write-offs
ECL impact due to the reduction of all, or part, of an asset balance due to a write -off approved by the Group. ECL release may appear higher than the
asset balance on some occasions as a result of the initial ECL lifetime being released, in addition to the individually assessed provision applied for the
asset balance write-off.
Cash recoveries
ECL impact of payments received on assets that had previously been written off.
Individually assessed impairment charge
The income statement charge where an individually assessed provision has been recognised or a direct write -off has been applied to an asset balance
and reported separately from the Stage 3 provision.
Scenarios, weightings and macroeconomic assumptions
The Group’s ECL allowance as at 30 September 2020 was £735m (30 September 2019: £362m).
Macroeconomic assumptions
A range of future macroeconomic conditions is used in the scenarios over the five-year forecast period, reflecting the best estimate of future conditions
under each scenario. The Group has identified the following key macroeconomic conditions as the most significant inputs for IFRS 9 modelling purposes:
UK GDP growth, inflation, house prices, base rates, and unemployment rates. These are assessed and reviewed on a quarterly ba sis to ensure
appropriateness and relevance to the ECL calculation. The output of the models is then supplemented by PMAs when it is considered that not all the risks
identified in a product segment have been accurately reflected within the models.
The shock to the economy as a result of COVID-19 has been faster and more severe than any in history. This has put increased emphasis on the IFRS 9
models and the impact of the forward-looking multiple macroeconomic scenarios on ECLs. As a result, the Group has re-assessed the possible IFRS 9
scenarios to select appropriate scenarios and weightings. The scenario weightings are considered and debated by an internal review panel and then
recommended and approved for use in the IFRS 9 models by ALCO. The three scenarios selected, together with the weightings app lied, have been
updated to reflect the current economic environment:
Scenario 2020 (%) 2019 (%)
Upside 5 20
Base 50 60
Downside 45 20
The ‘Upside’ scenario has been reduced to a 5% weighting as it is considered to be overly optimistic in the current economic environment and the
medium-term outlook. The decrease in the level of weighting applied to the ‘Base’ scenario is reflective of the severity of the impact of COVID-19 on the
UK economy and the subsequent view that a larger share of the weightings should be focused on the downside scenario.
Upside (5%)
This reflects the unprecedented collapse of GDP (20% year-on-year, based on Q2 of the calendar year). The resultant effect is a predicted annual
reduction of 10.8% in GDP in 2020. Public sector borrowing is expected to exceed 14% of GDP in the fiscal year 2020/21, lifting public debt to c. 110% of
GDP in the near term before falling back to stabilise at c. 97% (the pre -crisis long run forecast was c. 80%).
Base (50%)
Growth in GDP is limited to an average of just 0.5% per annum for the next five years, which translates into around 4% lower than in the upside scenario
by the end of the forecast period. Unemployment peaks at 8.8% and recovers slowly while property prices, and in particular co mmercial property prices,
suffer sharp falls and only recover to pre-crisis levels towards the end of the scenario.
Downside (45%)
Demand shock from lockdown is compounded by financial crisis, with the slow pace of lifting lockdown restrictions weighing on sentiment, as investment
decisions are delayed. The size of the deficit leads to the re-introduction of austerity measures, with output declining by c. 24% peak to trough and
unemployment surging to 12%.
Within each portfolio, the following are the macroeconomic inputs which are more sensitive and therefore more likely to drive the move from Stage 1 to
Stage 2 under a stress scenario:
Mortgages: Unemployment, House Price Index (HPI) and Base Rate.
Personal: Unemployment and Inflation.
Business: GDP, Unemployment and Base Rate.
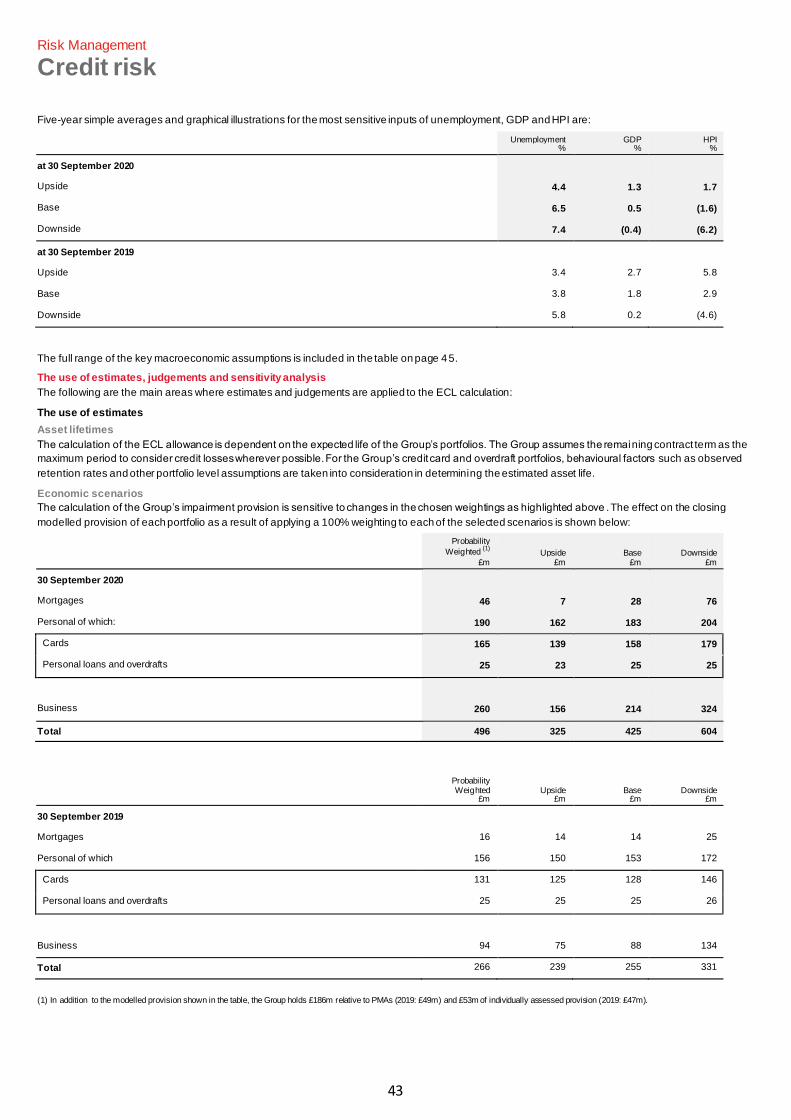
43
Risk Management
Credit risk
Five-year simple averages and graphical illustrations for the most sensitive inputs of unemployment, GDP and HPI are:
Unemployment %
GDP %
HPI %
at 30 September 2020 Upside 4.4 1.3 1.7
Base 6.5 0.5 (1.6)
Downside 7.4 (0.4) (6.2)
at 30 September 2019 Upside 3.4 2.7 5.8
Base 3.8 1.8 2.9
Downside 5.8 0.2 (4.6)
The full range of the key macroeconomic assumptions is included in the table on page 45.
The use of estimates, judgements and sensitivity analysis
The following are the main areas where estimates and judgements are applied to the ECL calculation:
The use of estimates
Asset lifetimes
The calculation of the ECL allowance is dependent on the expected life of the Group’s portfolios. The Group assumes the remaining contract term as the
maximum period to consider credit losses wherever possible. For the Group’s credit card and overdraft portfolios, behavioural factors such as observed
retention rates and other portfolio level assumptions are taken into consideration in determining the estimated asset life.
Economic scenarios
The calculation of the Group’s impairment provision is sensitive to changes in the chosen weightings as highlighted above . The effect on the closing
modelled provision of each portfolio as a result of applying a 100% weighting to each of the selected scenarios is shown below:
Probability
Weighted (1)
£m
Upside
£m
Base
£m
Downside
£m
30 September 2020 Mortgages 46 7 28 76
Personal of which: 190 162 183 204
Cards 165 139 158 179
Personal loans and overdrafts 25 23 25 25
Business 260 156 214 324
Total 496 325 425 604
Probability Weighted
£m
Upside
£m
Base
£m
Downside
£m
30 September 2019 Mortgages 16 14 14 25
Personal of which 156 150 153 172
Cards 131 125 128 146
Personal loans and overdrafts 25 25 25 26
Business 94 75 88 134
Total 266 239 255 331
(1) In addition to the modelled provision shown in the table, the Group holds £186m relative to PMAs (2019: £49m) and £53m of individually assessed provision (2019: £47m).
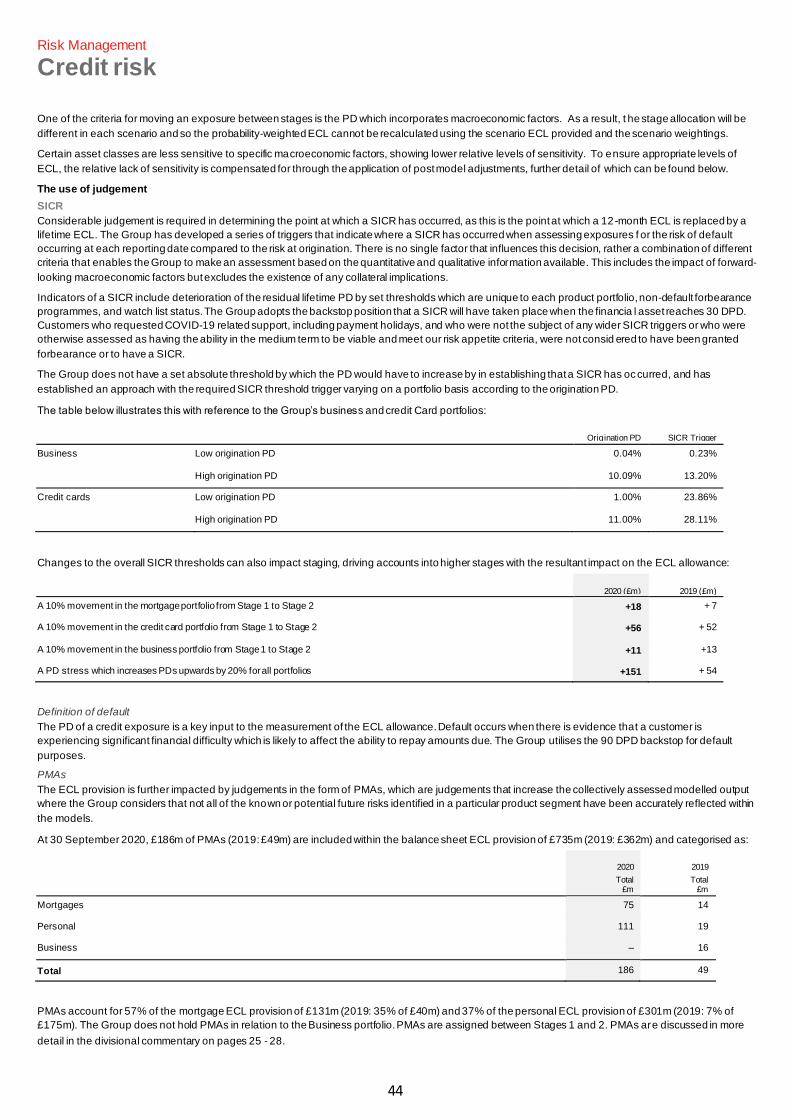
44
Risk Management
Credit risk
One of the criteria for moving an exposure between stages is the PD which incorporates macroeconomic factors. As a result, t he stage allocation will be
different in each scenario and so the probability-weighted ECL cannot be recalculated using the scenario ECL provided and the scenario weightings.
Certain asset classes are less sensitive to specific macroeconomic factors, showing lower relative levels of sensitivity. To ensure appropriate levels of
ECL, the relative lack of sensitivity is compensated for through the application of post model adjustments, further detail of which can be found below.
The use of judgement
SICR
Considerable judgement is required in determining the point at which a SICR has occurred, as this is the point at which a 12-month ECL is replaced by a
lifetime ECL. The Group has developed a series of triggers that indicate where a SICR has occurred when assessing exposures f or the risk of default
occurring at each reporting date compared to the risk at origination. There is no single factor that influences this decision, rather a combination of different
criteria that enables the Group to make an assessment based on the quantitative and qualitative information available. This includes the impact of forward-
looking macroeconomic factors but excludes the existence of any collateral implications.
Indicators of a SICR include deterioration of the residual lifetime PD by set thresholds which are unique to each product portfolio, non-default forbearance
programmes, and watch list status. The Group adopts the backstop position that a SICR will have taken place when the financia l asset reaches 30 DPD.
Customers who requested COVID-19 related support, including payment holidays, and who were not the subject of any wider SICR triggers or who were
otherwise assessed as having the ability in the medium term to be viable and meet our risk appetite criteria, were not consid ered to have been granted
forbearance or to have a SICR.
The Group does not have a set absolute threshold by which the PD would have to increase by in establishing that a SICR has occurred, and has
established an approach with the required SICR threshold trigger varying on a portfolio basis according to the origination PD.
The table below illustrates this with reference to the Group’s business and credit Card portfolios:
Origination PD SICR Trigger
Business Low origination PD 0.04% 0.23%
High origination PD 10.09% 13.20%
Credit cards Low origination PD 1.00% 23.86%
High origination PD 11.00% 28.11%
Changes to the overall SICR thresholds can also impact staging, driving accounts into higher stages with the resultant impact on the ECL allowance:
2020 (£m) 2019 (£m)
A 10% movement in the mortgage portfolio from Stage 1 to Stage 2 +18 + 7
A 10% movement in the credit card portfolio from Stage 1 to Stage 2 +56 + 52
A 10% movement in the business portfolio from Stage 1 to Stage 2 +11 +13
A PD stress which increases PDs upwards by 20% for all portfolios +151 + 54
Definition of default
The PD of a credit exposure is a key input to the measurement of the ECL allowance. Default occurs when there is evidence that a customer is
experiencing significant financial difficulty which is likely to affect the ability to repay amounts due. The Group utilises the 90 DPD backstop for default
purposes.
PMAs
The ECL provision is further impacted by judgements in the form of PMAs, which are judgements that increase the collectively assessed modelled output
where the Group considers that not all of the known or potential future risks identified in a particular product segment have been accurately reflected within
the models.
At 30 September 2020, £186m of PMAs (2019: £49m) are included within the balance sheet ECL provision of £735m (2019: £362m) and categorised as:
2020 2019
Total £m
Total £m
Mortgages 75 14
Personal 111 19
Business – 16
Total 186 49
PMAs account for 57% of the mortgage ECL provision of £131m (2019: 35% of £40m) and 37% of the personal ECL provision of £301m (2019: 7% of
£175m). The Group does not hold PMAs in relation to the Business portfolio. PMAs are assigned between Stages 1 and 2. PMAs are discussed in more
detail in the divisional commentary on pages 25 - 28.
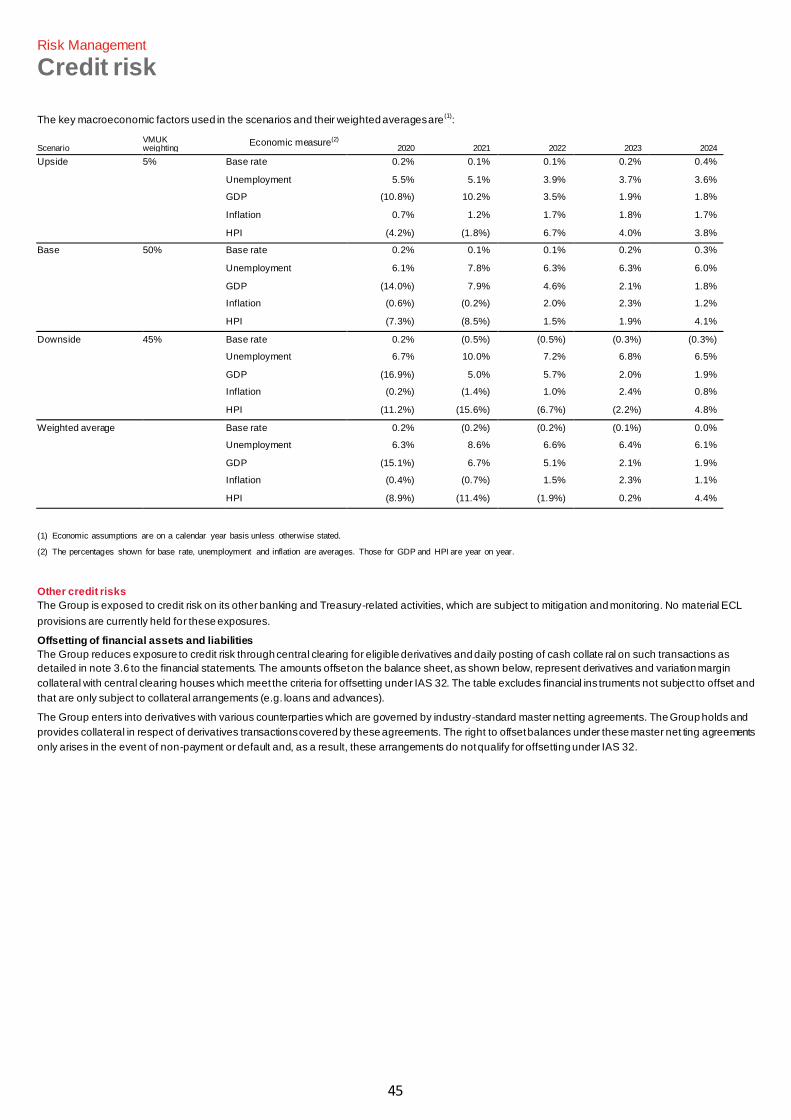
45
Risk Management
Credit risk
The key macroeconomic factors used in the scenarios and their weighted averages are
(1):
Scenario VMUK weighting
Economic measure(2) 2020 2021 2022 2023 2024
Upside 5% Base rate 0.2% 0.1% 0.1% 0.2% 0.4%
Unemployment 5.5% 5.1% 3.9% 3.7% 3.6%
GDP (10.8%) 10.2% 3.5% 1.9% 1.8%
Inflation 0.7% 1.2% 1.7% 1.8% 1.7%
HPI (4.2%) (1.8%) 6.7% 4.0% 3.8%
Base 50% Base rate 0.2% 0.1% 0.1% 0.2% 0.3%
Unemployment 6.1% 7.8% 6.3% 6.3% 6.0%
GDP (14.0%) 7.9% 4.6% 2.1% 1.8%
Inflation (0.6%) (0.2%) 2.0% 2.3% 1.2%
HPI (7.3%) (8.5%) 1.5% 1.9% 4.1%
Downside 45% Base rate 0.2% (0.5%) (0.5%) (0.3%) (0.3%)
Unemployment 6.7% 10.0% 7.2% 6.8% 6.5%
GDP (16.9%) 5.0% 5.7% 2.0% 1.9%
Inflation (0.2%) (1.4%) 1.0% 2.4% 0.8%
HPI (11.2%) (15.6%) (6.7%) (2.2%) 4.8%
Weighted average Base rate 0.2% (0.2%) (0.2%) (0.1%) 0.0%
Unemployment 6.3% 8.6% 6.6% 6.4% 6.1%
GDP (15.1%) 6.7% 5.1% 2.1% 1.9%
Inflation (0.4%) (0.7%) 1.5% 2.3% 1.1%
HPI (8.9%) (11.4%) (1.9%) 0.2% 4.4%
(1) Economic assumptions are on a calendar year basis unless otherwise stated.
(2) The percentages shown for base rate, unemployment and inflation are averages. Those for GDP and HPI are year on year.
Other credit risks
The Group is exposed to credit risk on its other banking and Treasury-related activities, which are subject to mitigation and monitoring. No material ECL
provisions are currently held for these exposures.
Offsetting of financial assets and liabilities
The Group reduces exposure to credit risk through central clearing for eligible derivatives and daily posting of cash collate ral on such transactions as
detailed in note 3.6 to the financial statements. The amounts offset on the balance sheet, as shown below, represent derivatives and variation margin
collateral with central clearing houses which meet the criteria for offsetting under IAS 32. The table excludes financial ins truments not subject to offset and
that are only subject to collateral arrangements (e.g. loans and advances).
The Group enters into derivatives with various counterparties which are governed by industry-standard master netting agreements. The Group holds and
provides collateral in respect of derivatives transactions covered by these agreements. The right to offset balances under these master net ting agreements
only arises in the event of non-payment or default and, as a result, these arrangements do not qualify for offsetting under IAS 32.
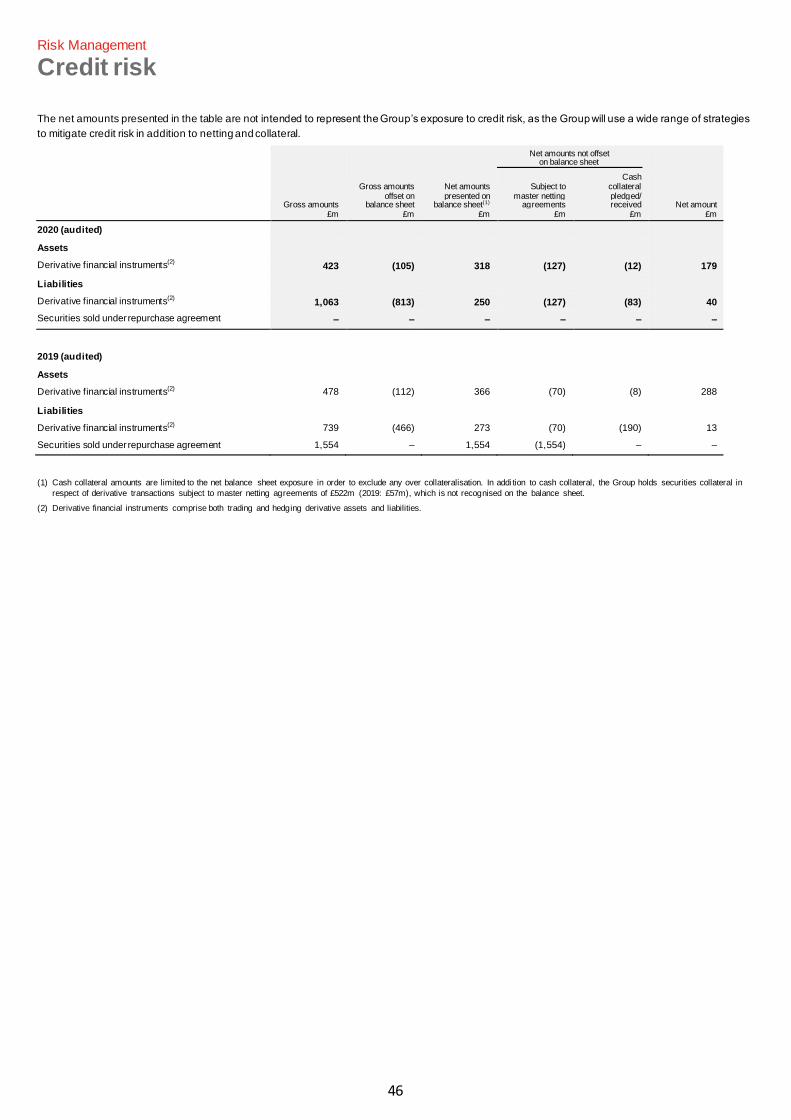
46
Risk Management
Credit risk
The net amounts presented in the table are not intended to represent the Group’s exposure to credit risk, as the Group will use a wide range of strategies
to mitigate credit risk in addition to netting and collateral.
Gross amounts £m
Gross amounts offset on
balance sheet £m
Net amounts presented on
balance sheet(1) £m
Net amounts not offset on balance sheet
Net amount £m
Subject to master netting
agreements £m
Cash collateral pledged/ received
£m
2020 (audited) Assets Derivative financial instruments(2) 423 (105) 318 (127) (12) 179
Liabilities Derivative financial instruments(2) 1,063 (813) 250 (127) (83) 40
Securities sold under repurchase agreement – – – – – –
2019 (audited) Assets Derivative financial instruments(2) 478 (112) 366 (70) (8) 288
Liabilities Derivative financial instruments(2) 739 (466) 273 (70) (190) 13
Securities sold under repurchase agreement 1,554 – 1,554 (1,554) – –
(1) Cash collateral amounts are limited to the net balance sheet exposure in order to exclude any over collateralisation. In addi tion to cash collateral, the Group holds securities collateral in
respect of derivative transactions subject to master netting agreements of £522m (2019: £57m), which is not recognised on the balance sheet.
(2) Derivative financial instruments comprise both trading and hedging derivative assets and liabilities.
47
Risk Management
Financial risk
Strong foundations supporting resilience and growth
The financial risk framework underpins the Group’s robust balance sheet, ensuring strategy is resilient and responsive to external pressures,
including the impact of COVID-19 and changing regulatory obligations.
Financial risk covers several categories of risk which impact the manner in which the Group can support its customers in a safe and sound manner. They
include capital risk, funding risk, liquidity risk, market risk, and pension risk. During the year, model risk was removed as a sub-category of financial risk
and promoted to principal risk status. Further information can be found on page 169 in the Group’s Annual Report & Accounts.
Risk appetite
The primary objective for the management of financial risks is to control the risk profile within approved risk limits, to maintain the confidence of the
Group’s customers and other stakeholders. Financial risks are also managed to protect current and future earnings from the impact of market volatility.
The Group applies a prudent approach to financial risks in order to safeguard the ongoing strength and resilience of the balance sheet. These activities
are all undertaken in a manner consistent with the Group’s obligations under ring -fencing legislation and prudential rules.
Financial risk appetite is approved by the Board, with authority delegated to ALCO for subsequent implementation and monitoring. The Board has
established a range of capital risk appetite measures including CET1, leverage and minimum holdings of capital. Measures for funding and liquidity risks
consider the structure of the balance sheet, the Group’s overall funding profile and compliance with the Overall Liquidity Ad equacy Rule (OLAR). Board-
approved risk appetite covers both regulatory and internal liquidity requirements and the need to maintain access to liquidity resources sufficient to
accommodate outflows of funds in a range of stress scenarios over a one-month and three-month period.
The Group’s participation in wholesale markets, along with its use of financial instruments, is to fund its banking activities and manage the liquidity and
interest rate risks arising from these activities. The Group establishes an appetite for these risks based on an overriding p rinciple that the Group will not
engage in proprietary risk taking.
The Group’s pension risk appetite is a component of the Group -wide RAS framework for the management of balance sheet risks and is considered in the
context of potential capital impacts as a result of volatility in the Scheme’s valuations.
Capital risk
Capital is held by the Group to protect its depositors, to cover inherent risks in a normal and stressed operating environmen t and to support the Group’s
strategy of pioneering growth. Capital risk is the risk that the Group has insufficient quant ity or quality of capital to support its operations.
Exposures
Capital risk exposures arise when the Group has insufficient capital resources to support its business activities or to meet regulatory capital requirements
under normal operating conditions or stressed scenarios.
Measurement
The Group manages capital in accordance with prudential rules issued by the PRA and the FCA, which are implemented through the CRD IV CRR
regulatory framework. Pillar 1 capital requirements for the year ended 30 September 2020 are calculated in respect of credit risk, operational risk, market
risk, counterparty credit risk and credit valuation adjustments. The capital requirements for retail mortgages are calculated using an advanced internal
ratings based (AIRB) approach while the business portfolios use a foundation internal ratings based (FIRB) approach. In March 2020, the Group rece ived
approval to move the specialised lending portfolio from the standardised approach to an IRB slotting basis. All other require ments are calculated using the
standardised approach.
The Group obtained IRB accreditation for certain portfolios in October 2018. The PRA has since released a final policy statement outlining its approach to
implementing definition of default per EBA guidelines. Further to this, there are recommended changes to both PD and LGD model components relating
directly to the calculation of risk-weighted capital requirements. In July 2020, the PRA announced their timeline to evaluate the approach of UK banks to
the change in the definition of default calculation. Implementation for residential mortgage portfolios is expected to be in 2021 and by 1 January 2022 for
all other exposure classes, subject to PRA approval.
A rigorous approach is taken to assessing risks that are not adequately covered by Pillar 1, including interest rate risk and pension risk. The Group also
undertakes analysis of a range of stress scenarios to test the impact on capital arising from severe yet plausible scenarios. These approaches to capital
are thoroughly documented in the Group’s ICAAP which is subject to review, challenge and approval by the Board.
The Group IRB framework looks at the customer and business PD along with loss severity (EAD and LGD). The outputs are used in the calculation of
RWA, EL and IFRS 9 ECL. The IRB parameters and rating assessments are actively embedded in the following day-to-day processes:
• Credit approval – IRB models and parameters are used to assess the customer risk and IRB outputs are used to inform cut -off models that drive the
lending decisions;
• Pricing – IRB outputs and estimates are used in the assessment of new products and portfolio pricing reviews;
• Risk appetite – IRB parameters are included in the assessment of models and are analysed to inform the Gro up’s risk capacity and appetite; and
• Asset quality – IRB parameters are monitored to understand the product and segment performance of the Group’s portfolios.
Regulatory capital developments
The regulatory landscape for capital is subject to a number of changes which leads to uncertainty on eventual outcomes.
Reconciling capital requirements and macroprudential buffers
On 6 July 2020, the PRA published Policy Statement 15/20, which updates the Pillar 2A capital framework for the additional resilience a ssociated with
higher macroprudential buffer requirements in a standard risk environment. The PRA will make changes to Pillar 2A, where appl icable, on or before 16
December 2020.
48
Risk Management
Financial risk
Capital Requirements Directive V (CRD V) and Capital Requirements Regulation II (CRR II)
On 16 July 2020, Her Majesty’s Treasury (HMT) issued a consultation on aspects of CRD V that must be implemented before the e nd of the transition
period for the UK leaving the EU. Items being consulted on include macro-prudential tools (O-SII buffer, Systemic Risk Buffer), holding companies and
equal pay framework and enforcement. On 15 October 2020, HMT published a summary of responses to the consultation and laid draft legislation in
Parliament.
On 31 July 2020, the PRA issued CP12/20 'CRD V' which set out proposed changes to the PRA's rules, supervisory statements and statements of policy
to meet the objectives of CRD V. This consultation was focused on Pillar 2, remuneration, intermediate parent undertakings, governance, and third -country
branch reporting.
On 20 October 2020, the PRA issued CP17/20 ‘CRD V: Further implementation’. This consultation is focused on: the approval and supervision of holding
companies; measures to enhance supervisory requirements for interest rate risk in the banking book (IRRBB); revisions to the capital buffers framework;
amendments to the definition of the maximum distributable amount that constrains a firm’s distributions when it uses its capital buffers; and clarifying the
quality of capital required to meet Pillar 2. It also covers CRR measures in respect of the process through which variable ca pital requirements may be
applied to firms’ real estate exposures, and the methods that may be used for prudential consolidation.
Based on the CRD V and CRR II requirements published in the EU Official Journal and the subsequent HMT/PRA releases, the Group does not anticipate
a material impact on capital ratios.
Basel III revisions
The Basel Committee published its final reforms to the Basel III framework in December 2017. The amendments include changes to the standardised
approaches to credit and operational risks and the introduction of a new RWA output floor. The reforms are subject to a tran sition period from 2023 to
2028.
IRB approach to UK mortgage risk weights
In September 2020, the PRA issued Consultation Paper 14/20 ‘Internal Ratings Based UK mortgage risk weights: Managing deficiencies in model risk
capture’. The proposals help address the PRA’s view of prudential risks from “inappropriately low” IRB UK mortgage risk weights with the aim of:
• reducing the difference in standardised approach and IRB mortgage risk weights for current UK mortgages;
• placing a limit on future divergence; and
• reducing the variability of mortgage risk weights between those firms on the IRB approach for given levels of mortgage LTVs.
Key proposals from this are the introduction of the following floors:
• an individual mortgage risk weight of at least 7%; and
• an exposure-weighted average risk weight of at least 10% for an IRB UK mortgage portfolio as a whole.
Following consultation, the PRA’s final policy is expected to take effect from 1 January 2022.
COVID-19 regulatory capital developments
There have been a number of regulatory capital developments in the UK and Europe in response to COVID-19. Key items relevant to the Group are set
out below.
Government backed loan schemes
During the year, the Group participated in the various government backed loan schemes for businesses, in addition to offering payment holidays to both
business and retail customers. Impacts to the Group's financial risk profile are discussed in this section and further details on loan schemes are provided
in the credit risk section.
Revised timelines
In order to provide operational capacity for banks to respond to the immediate financial stability priorities resulting from the impact of COVID-19, both the
PRA and Basel communicated revised timelines across key regulatory initiatives. The implementation of the Basel III revisions has been delayed by one
year to 1 January 2023, and includes revisions to: the standardised approach to credit risk; IRB approach; operational risk framework, market risk
framework; Pillar 3 disclosures and the introduction of output floors.
In addition, the PRA advised that the proposals in Consultation Paper 21/19 ‘Credit risk: PD and LGD estimation’ will be delayed by one year to 1 January
2022 and the hybrid IRB models will also be delayed until the same date.
On 26 March 2020, the PRA wrote to CEOs of UK banks setting out guidance in respect of:
• consistent and robust IFRS 9 accounting and the regulatory definition of default;
• the treatment of borrowers who breach covenants due to COVID-19; and
• the regulatory capital treatment of IFRS 9.
The PRA has subsequently provided a number of updates to banks in this regard as the COVID-19 situation evolves.
CRR ‘Quick Fix’ package
On 24 June 2020, the European Parliament adopted regulation to facilitate lending to households and businesses in the EU in light of COVID-19. This
package, known as the ‘CRR Quick Fix’, came into force on 27 June 2020 and made a number of beneficial amendments to the CRR that apply to the
Group, including changes to IFRS 9 transitional arrangements and SME supporting factors.
On 14 October 2020, the EBA published its final draft Regulatory Technical Standards (RTS) specifying the prudential treatmen t of software assets. The
RTS replaces the current upfront full deduction with a simple approach based on a prudential amortisation of software assets calibrated over a maximum
period of three years. The RTS will become effective on the day following its publication in the Official Journal of the European Union.
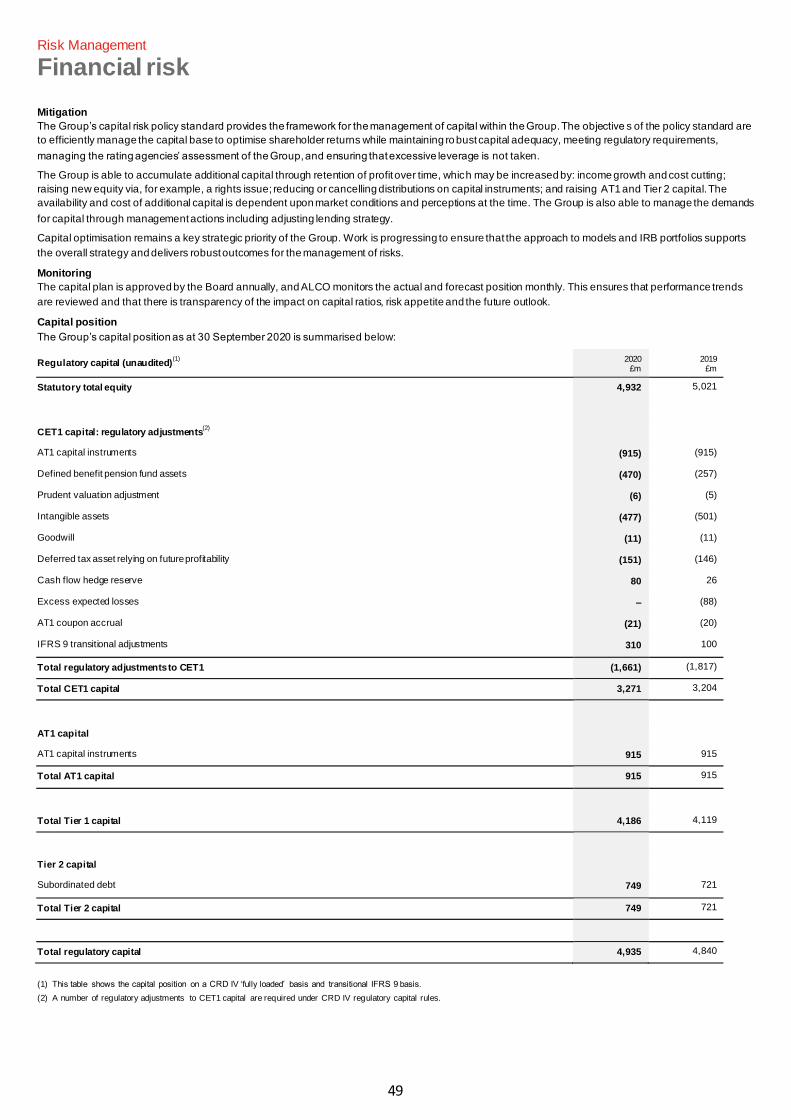
49
Risk Management
Financial risk
Mitigation
The Group’s capital risk policy standard provides the framework for the management of capital within the Group. The objective s of the policy standard are
to efficiently manage the capital base to optimise shareholder returns while maintaining robust capital adequacy, meeting regulatory requirements,
managing the rating agencies’ assessment of the Group, and ensuring that excessive leverage is not taken.
The Group is able to accumulate additional capital through retention of profit over time, which may be increased by: income growth and cost cutting;
raising new equity via, for example, a rights issue; reducing or cancelling distributions on capital instruments; and raising AT1 and Tier 2 capital. The
availability and cost of additional capital is dependent upon market conditions and perceptions at the time. The Group is also able to manage the demands
for capital through management actions including adjusting lending strategy.
Capital optimisation remains a key strategic priority of the Group. Work is progressing to ensure that the approach to models and IRB portfolios supports
the overall strategy and delivers robust outcomes for the management of risks.
Monitoring
The capital plan is approved by the Board annually, and ALCO monitors the actual and forecast position monthly. This ensures that performance trends
are reviewed and that there is transparency of the impact on capital ratios, risk appetite and the future outlook.
Capital position
The Group’s capital position as at 30 September 2020 is summarised below:
Regulatory capital (unaudited)(1)
2020 £m
2019 £m
Statutory total equity 4,932 5,021
CET1 capital: regulatory adjustments(2)
AT1 capital instruments (915) (915)
Defined benefit pension fund assets (470) (257)
Prudent valuation adjustment (6) (5)
Intangible assets (477) (501)
Goodwill (11) (11)
Deferred tax asset relying on future profitability (151) (146)
Cash flow hedge reserve 80 26
Excess expected losses – (88)
AT1 coupon accrual (21) (20)
IFRS 9 transitional adjustments 310 100
Total regulatory adjustments to CET1 (1,661) (1,817)
Total CET1 capital 3,271 3,204
AT1 capital AT1 capital instruments 915 915
Total AT1 capital 915 915
Total Tier 1 capital 4,186 4,119
Tier 2 capital Subordinated debt 749 721
Total Tier 2 capital 749 721
Total regulatory capital 4,935 4,840
(1) This table shows the capital position on a CRD IV ‘fully loaded’ basis and transitional IFRS 9 basis.
(2) A number of regulatory adjustments to CET1 capital are required under CRD IV regulatory capital rules.
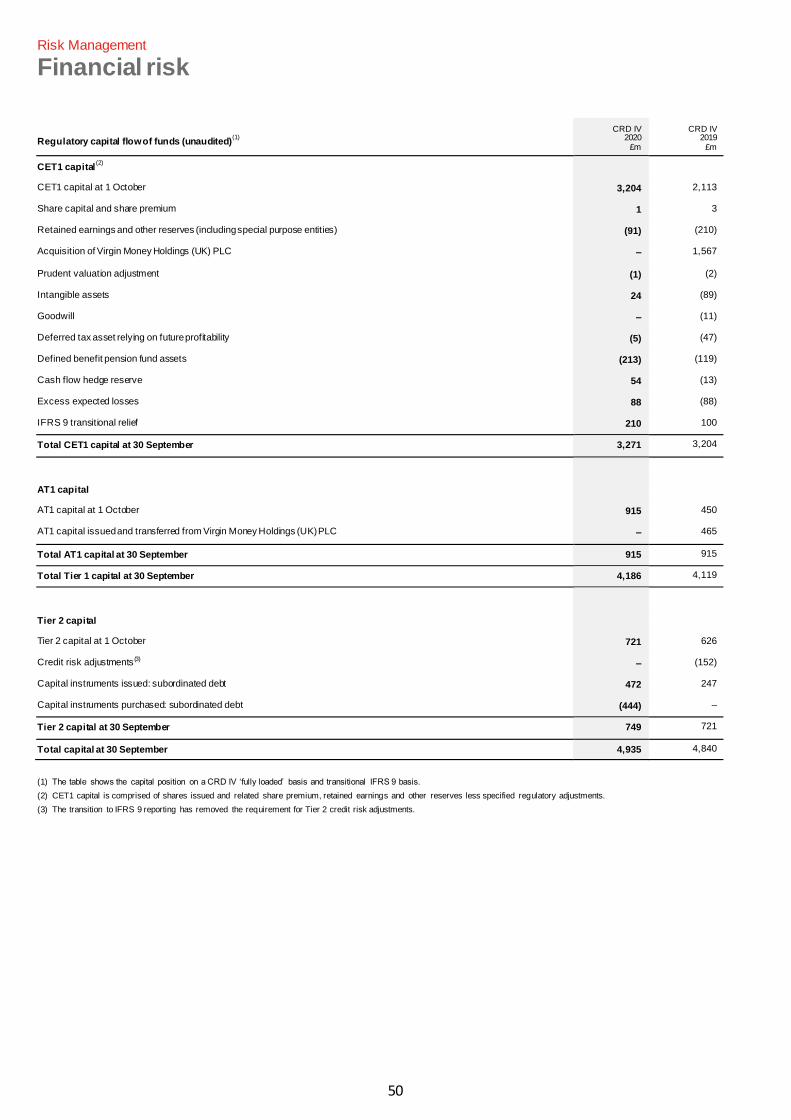
50
Risk Management
Financial risk
Regulatory capital flow of funds (unaudited)(1)
CRD IV 2020
£m
CRD IV 2019
£m
CET1 capital(2)
CET1 capital at 1 October 3,204 2,113
Share capital and share premium 1 3
Retained earnings and other reserves (including special purpose entities) (91) (210)
Acquisition of Virgin Money Holdings (UK) PLC – 1,567
Prudent valuation adjustment (1) (2)
Intangible assets 24 (89)
Goodwill – (11)
Deferred tax asset relying on future profitability (5) (47)
Defined benefit pension fund assets (213) (119)
Cash flow hedge reserve 54 (13)
Excess expected losses 88 (88)
IFRS 9 transitional relief 210 100
Total CET1 capital at 30 September 3,271 3,204
AT1 capital AT1 capital at 1 October 915 450
AT1 capital issued and transferred from Virgin Money Holdings (UK) PLC – 465
Total AT1 capital at 30 September 915 915
Total Tier 1 capital at 30 September 4,186 4,119
Tier 2 capital Tier 2 capital at 1 October 721 626
Credit risk adjustments (3) – (152)
Capital instruments issued: subordinated debt 472 247
Capital instruments purchased: subordinated debt (444) –
Tier 2 capital at 30 September 749 721
Total capital at 30 September 4,935 4,840
(1) The table shows the capital position on a CRD IV ‘fully loaded’ basis and transitional IFRS 9 basis.
(2) CET1 capital is comprised of shares issued and related share premium, retained earnings and other reserves less specified regulatory adjustments.
(3) The transition to IFRS 9 reporting has removed the requirement for Tier 2 credit risk adjustments.
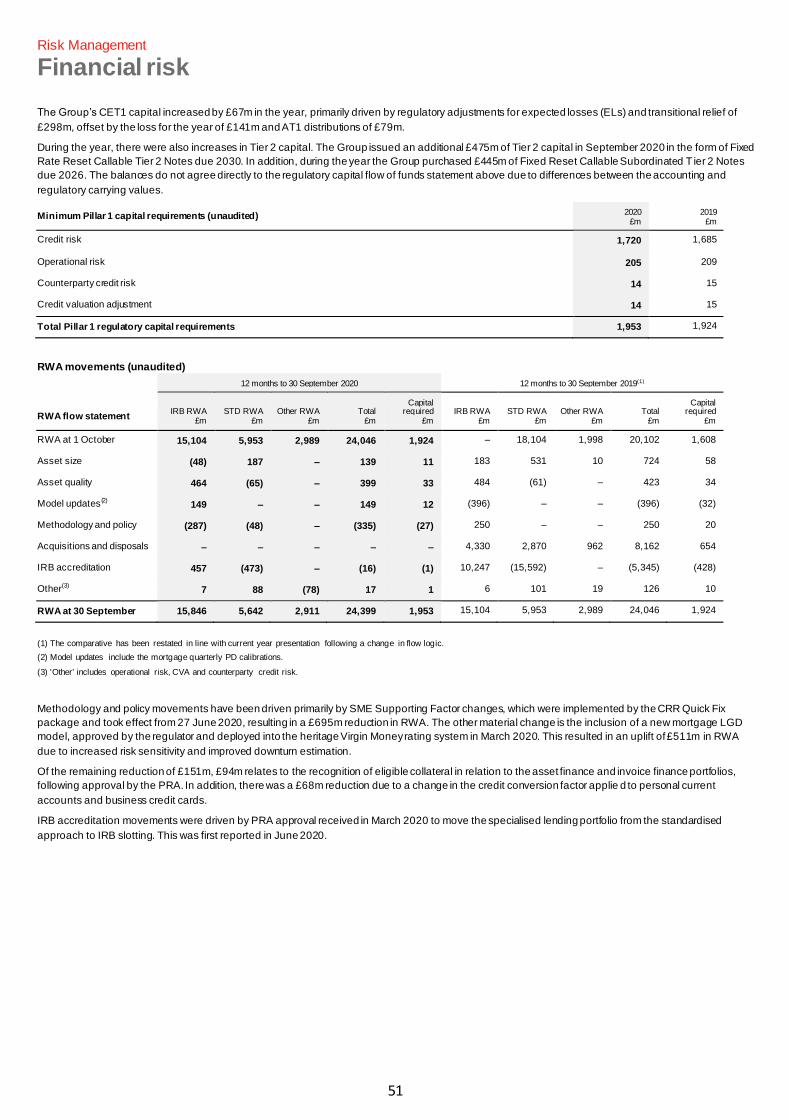
51
Risk Management
Financial risk
The Group’s CET1 capital increased by £67m in the year, primarily driven by regulatory adjustments for expected losses (ELs) and transitional relief of
£298m, offset by the loss for the year of £141m and AT1 distributions of £79m.
During the year, there were also increases in Tier 2 capital. The Group issued an additional £475m of Tier 2 capital in September 2020 in the form of Fixed
Rate Reset Callable Tier 2 Notes due 2030. In addition, during the year the Group purchased £445m of Fixed Reset Callable Subordinated T ier 2 Notes
due 2026. The balances do not agree directly to the regulatory capital flow of funds statement above due to differences between the accounting and
regulatory carrying values.
Minimum Pillar 1 capital requirements (unaudited) 2020 £m
2019 £m
Credit risk 1,720 1,685
Operational risk 205 209
Counterparty credit risk 14 15
Credit valuation adjustment 14 15
Total Pillar 1 regulatory capital requirements 1,953 1,924
RWA movements (unaudited)
RWA flow statement
12 months to 30 September 2020 12 months to 30 September 2019(1)
IRB RWA £m
STD RWA £m
Other RWA £m
Total £m
Capital required
£m IRB RWA
£m STD RWA
£m Other RWA
£m Total
£m
Capital required
£m
RWA at 1 October 15,104 5,953 2,989 24,046 1,924 – 18,104 1,998 20,102 1,608
Asset size (48) 187 – 139 11 183 531 10 724 58
Asset quality 464 (65) – 399 33 484 (61) – 423 34
Model updates (2) 149 – – 149 12 (396) – – (396) (32)
Methodology and policy (287) (48) – (335) (27) 250 – – 250 20
Acquisitions and disposals – – – – – 4,330 2,870 962 8,162 654
IRB accreditation 457 (473) – (16) (1) 10,247 (15,592) – (5,345) (428)
Other(3) 7 88 (78) 17 1 6 101 19 126 10
RWA at 30 September 15,846 5,642 2,911 24,399 1,953 15,104 5,953 2,989 24,046 1,924
(1) The comparative has been restated in line with current year presentation following a change in flow logic.
(2) Model updates include the mortgage quarterly PD calibrations.
(3) 'Other' includes operational risk, CVA and counterparty credit risk.
Methodology and policy movements have been driven primarily by SME Supporting Factor changes, which were implemented by the CRR Quick Fix
package and took effect from 27 June 2020, resulting in a £695m reduction in RWA. The other material change is the inclusion of a new mortgage LGD
model, approved by the regulator and deployed into the heritage Virgin Money rating system in March 2020. This resulted in an uplift of £511m in RWA
due to increased risk sensitivity and improved downturn estimation.
Of the remaining reduction of £151m, £94m relates to the recognition of eligible collateral in relation to the asset finance and invoice finance portfolios,
following approval by the PRA. In addition, there was a £68m reduction due to a change in the credit conversion factor applie d to personal current
accounts and business credit cards.
IRB accreditation movements were driven by PRA approval received in March 2020 to move the specialised lending portfolio from the standardised
approach to IRB slotting. This was first reported in June 2020.
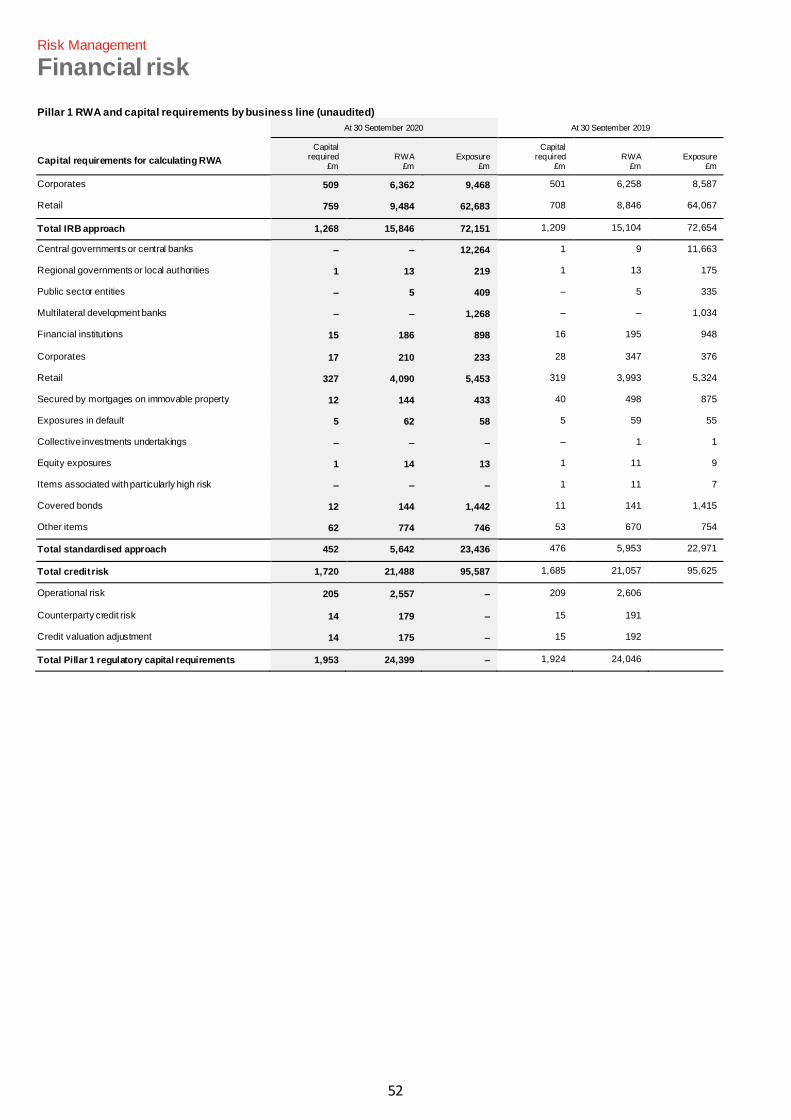
52
Risk Management
Financial risk
Pillar 1 RWA and capital requirements by business line (unaudited)
Capital requirements for calculating RWA
At 30 September 2020 At 30 September 2019
Capital required
£m RWA
£m Exposure
£m
Capital required
£m RWA
£m Exposure
£m
Corporates 509 6,362 9,468 501 6,258 8,587
Retail 759 9,484 62,683 708 8,846 64,067
Total IRB approach 1,268 15,846 72,151 1,209 15,104 72,654
Central governments or central banks – – 12,264 1 9 11,663
Regional governments or local authorities 1 13 219 1 13 175
Public sector entities – 5 409 – 5 335
Multilateral development banks – – 1,268 – – 1,034
Financial institutions 15 186 898 16 195 948
Corporates 17 210 233 28 347 376
Retail 327 4,090 5,453 319 3,993 5,324
Secured by mortgages on immovable property 12 144 433 40 498 875
Exposures in default 5 62 58 5 59 55
Collective investments undertakings – – – – 1 1
Equity exposures 1 14 13 1 11 9
Items associated with particularly high risk – – – 1 11 7
Covered bonds 12 144 1,442 11 141 1,415
Other items 62 774 746 53 670 754
Total standardised approach 452 5,642 23,436 476 5,953 22,971
Total credit risk 1,720 21,488 95,587 1,685 21,057 95,625
Operational risk 205 2,557 – 209 2,606
Counterparty credit risk 14 179 – 15 191 Credit valuation adjustment 14 175 – 15 192
Total Pillar 1 regulatory capital requirements 1,953 24,399 – 1,924 24,046
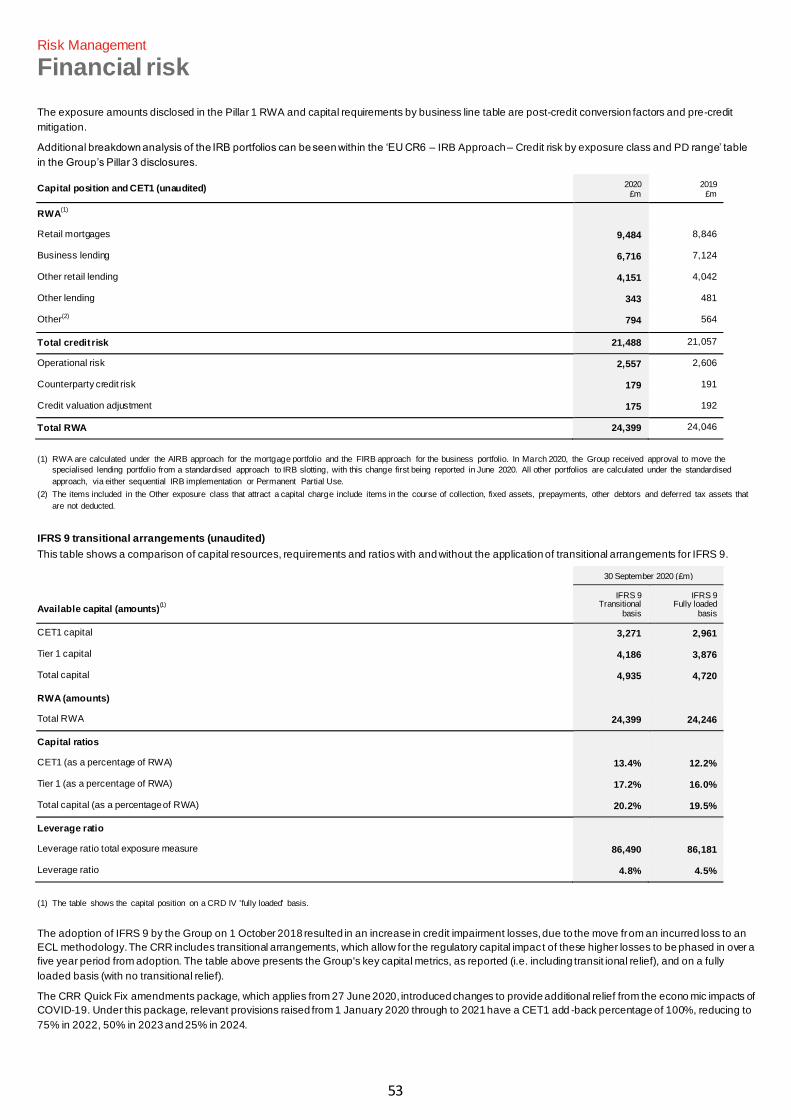
53
Risk Management
Financial risk
The exposure amounts disclosed in the Pillar 1 RWA and capital requirements by business line table are post-credit conversion factors and pre-credit
mitigation.
Additional breakdown analysis of the IRB portfolios can be seen within the ‘EU CR6 – IRB Approach – Credit risk by exposure class and PD range’ table
in the Group’s Pillar 3 disclosures.
Capital position and CET1 (unaudited) 2020 £m
2019 £m
RWA(1)
Retail mortgages 9,484 8,846
Business lending 6,716 7,124
Other retail lending 4,151 4,042
Other lending 343 481
Other(2) 794 564
Total credit risk 21,488 21,057
Operational risk 2,557 2,606
Counterparty credit risk 179 191
Credit valuation adjustment 175 192
Total RWA 24,399 24,046
(1) RWA are calculated under the AIRB approach for the mortgage portfolio and the FIRB approach for the business portfolio. In March 2020, the Group received approval to move the
specialised lending portfolio from a standardised approach to IRB slotting, with this change first being reported in June 2020. All other portfolios are calculated under the standardised
approach, via either sequential IRB implementation or Permanent Partial Use.
(2) The items included in the Other exposure class that attract a capital charge include items in the course of collection, fixed assets, prepayments, other debtors and deferred tax assets that
are not deducted.
IFRS 9 transitional arrangements (unaudited)
This table shows a comparison of capital resources, requirements and ratios with and without the application of transitional arrangements for IFRS 9.
Available capital (amounts)(1)
30 September 2020 (£m)
IFRS 9 Transitional
basis
IFRS 9 Fully loaded
basis
CET1 capital 3,271 2,961
Tier 1 capital 4,186 3,876
Total capital 4,935 4,720
RWA (amounts) Total RWA 24,399 24,246
Capital ratios CET1 (as a percentage of RWA) 13.4% 12.2%
Tier 1 (as a percentage of RWA) 17.2% 16.0%
Total capital (as a percentage of RWA) 20.2% 19.5%
Leverage ratio Leverage ratio total exposure measure 86,490 86,181
Leverage ratio 4.8% 4.5%
(1) The table shows the capital position on a CRD IV 'fully loaded' basis.
The adoption of IFRS 9 by the Group on 1 October 2018 resulted in an increase in credit impairment losses, due to the move from an incurred loss to an
ECL methodology. The CRR includes transitional arrangements, which allow for the regulatory capital impact of these higher losses to be phased in over a
five year period from adoption. The table above presents the Group's key capital metrics, as reported (i.e. including transit ional relief), and on a fully
loaded basis (with no transitional relief).
The CRR Quick Fix amendments package, which applies from 27 June 2020, introduced changes to provide additional relief from the econo mic impacts of
COVID-19. Under this package, relevant provisions raised from 1 January 2020 through to 2021 have a CET1 add -back percentage of 100%, reducing to
75% in 2022, 50% in 2023 and 25% in 2024.
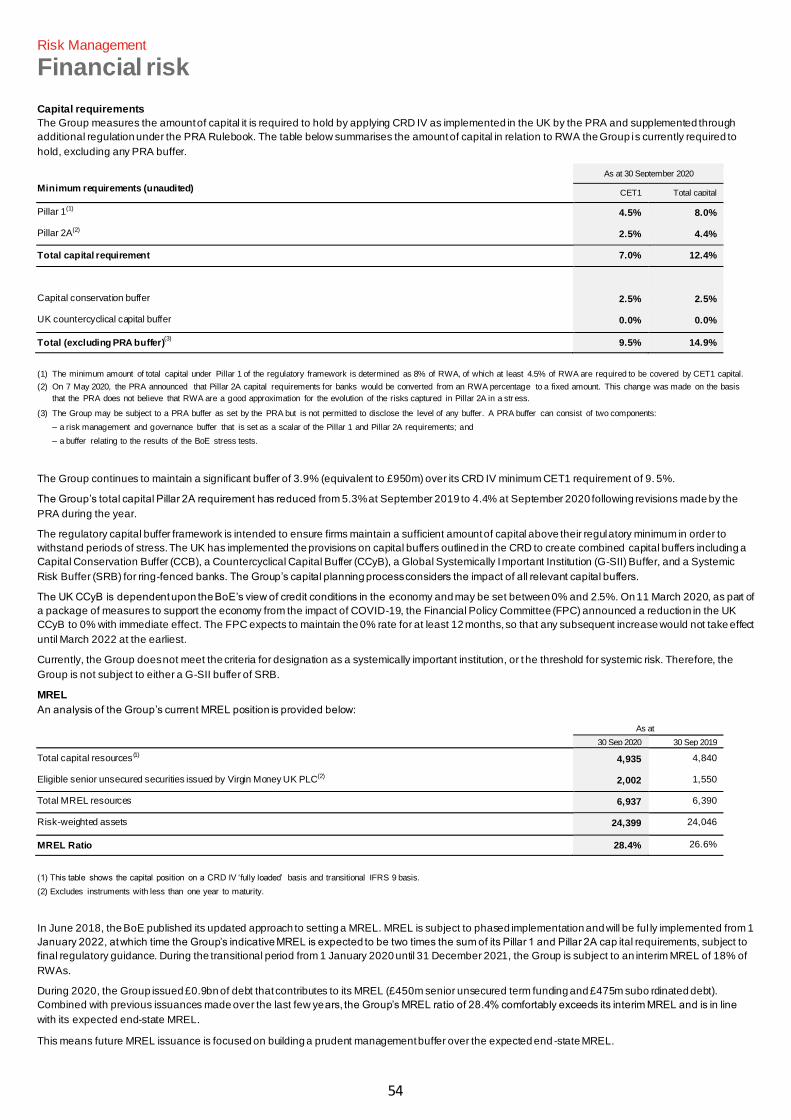
54
Risk Management
Financial risk
Capital requirements
The Group measures the amount of capital it is required to hold by applying CRD IV as implemented in the UK by the PRA and supplemented through
additional regulation under the PRA Rulebook. The table below summarises the amount of capital in relation to RWA the Group is currently required to
hold, excluding any PRA buffer.
Minimum requirements (unaudited)
As at 30 September 2020
CET1 Total capital
Pillar 1(1) 4.5% 8.0%
Pillar 2A(2) 2.5% 4.4%
Total capital requirement 7.0% 12.4%
Capital conservation buffer 2.5% 2.5%
UK countercyclical capital buffer 0.0% 0.0%
Total (excluding PRA buffer)(3)
9.5% 14.9%
(1) The minimum amount of total capital under Pillar 1 of the regulatory framework is determined as 8% of RWA, of which at least 4.5% of RWA are required to be covered by CET1 capital.
(2) On 7 May 2020, the PRA announced that Pillar 2A capital requirements for banks would be converted from an RWA percentage to a fixed amount. This change was made on the basis
that the PRA does not believe that RWA are a good approximation for the evolution of the risks captured in Pillar 2A in a str ess.
(3) The Group may be subject to a PRA buffer as set by the PRA but is not permitted to disclose the level of any buffer. A PRA buffer can consist of two components:
– a risk management and governance buffer that is set as a scalar of the Pillar 1 and Pillar 2A requirements; and
– a buffer relating to the results of the BoE stress tests.
The Group continues to maintain a significant buffer of 3.9% (equivalent to £950m) over its CRD IV minimum CET1 requirement of 9. 5%.
The Group’s total capital Pillar 2A requirement has reduced from 5.3% at September 2019 to 4.4% at September 2020 following revisions made by the
PRA during the year.
The regulatory capital buffer framework is intended to ensure firms maintain a sufficient amount of capital above their regulatory minimum in order to
withstand periods of stress. The UK has implemented the provisions on capital buffers outlined in the CRD to create combined capital buffers including a
Capital Conservation Buffer (CCB), a Countercyclical Capital Buffer (CCyB), a Global Systemically Important Institution (G-SII) Buffer, and a Systemic
Risk Buffer (SRB) for ring-fenced banks. The Group’s capital planning process considers the impact of all relevant capital buffers.
The UK CCyB is dependent upon the BoE’s view of credit conditions in the economy and may be set between 0% and 2.5%. On 11 March 2020, as part of
a package of measures to support the economy from the impact of COVID-19, the Financial Policy Committee (FPC) announced a reduction in the UK
CCyB to 0% with immediate effect. The FPC expects to maintain the 0% rate for at least 12 months, so that any subsequent increase would not take effect
until March 2022 at the earliest.
Currently, the Group does not meet the criteria for designation as a systemically important institution, or t he threshold for systemic risk. Therefore, the
Group is not subject to either a G-SII buffer of SRB.
MREL
An analysis of the Group’s current MREL position is provided below:
As at
30 Sep 2020 30 Sep 2019
Total capital resources (1) 4,935 4,840
Eligible senior unsecured securities issued by Virgin Money UK PLC(2) 2,002 1,550
Total MREL resources 6,937 6,390
Risk-weighted assets 24,399 24,046
MREL Ratio 28.4% 26.6%
(1) This table shows the capital position on a CRD IV ‘fully loaded’ basis and transitional IFRS 9 basis.
(2) Excludes instruments with less than one year to maturity.
In June 2018, the BoE published its updated approach to setting a MREL. MREL is subject to phased implementation and will be ful ly implemented from 1
January 2022, at which time the Group’s indicative MREL is expected to be two times the sum of its Pillar 1 and Pillar 2A cap ital requirements, subject to
final regulatory guidance. During the transitional period from 1 January 2020 until 31 December 2021, the Group is subject to an interim MREL of 18% of
RWAs.
During 2020, the Group issued £0.9bn of debt that contributes to its MREL (£450m senior unsecured term funding and £475m subo rdinated debt).
Combined with previous issuances made over the last few years, the Group’s MREL ratio of 28.4% comfortably exceeds its interim MREL and is in line
with its expected end-state MREL.
This means future MREL issuance is focused on building a prudent management buffer over the expected end -state MREL.
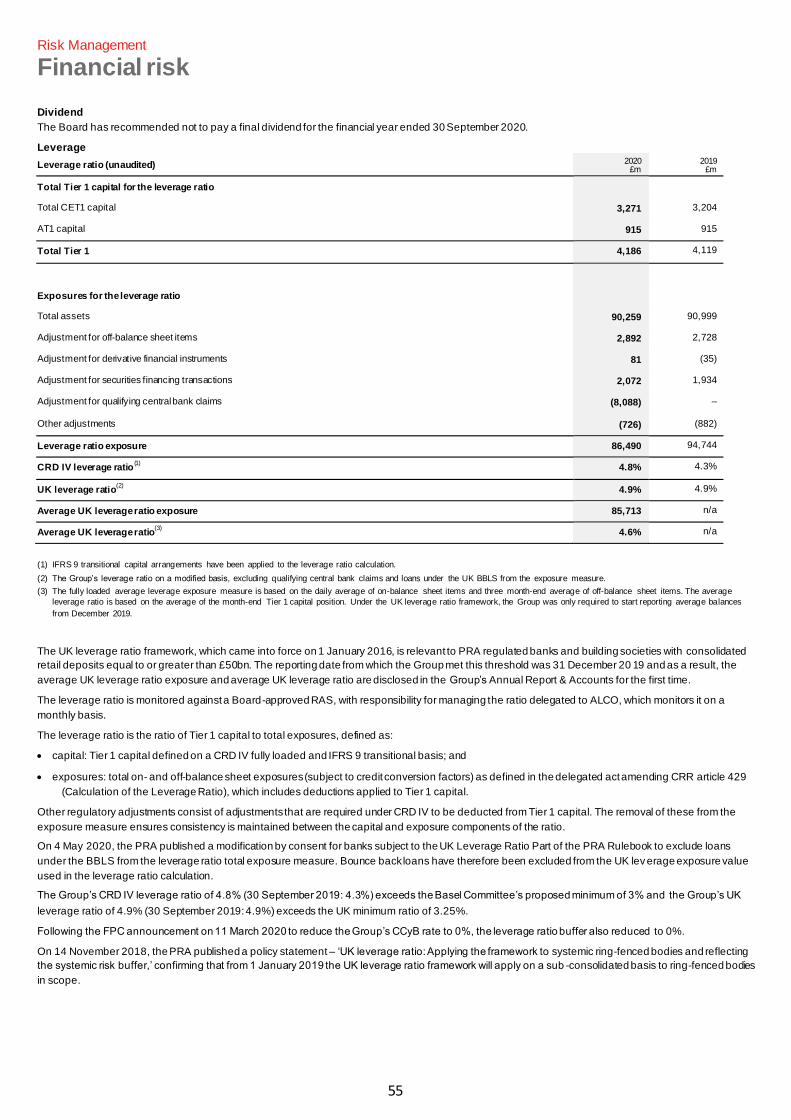
55
Risk Management
Financial risk
Dividend
The Board has recommended not to pay a final dividend for the financial year ended 30 September 2020.
Leverage
Leverage ratio (unaudited) 2020 £m
2019 £m
Total Tier 1 capital for the leverage ratio Total CET1 capital 3,271 3,204
AT1 capital 915 915
Total Tier 1 4,186 4,119
Exposures for the leverage ratio Total assets 90,259 90,999
Adjustment for off-balance sheet items 2,892 2,728
Adjustment for derivative financial instruments 81 (35)
Adjustment for securities financing transactions 2,072 1,934
Adjustment for qualifying central bank claims (8,088) –
Other adjustments (726) (882)
Leverage ratio exposure 86,490 94,744
CRD IV leverage ratio(1)
4.8% 4.3%
UK leverage ratio(2)
4.9% 4.9%
Average UK leverage ratio exposure 85,713 n/a
Average UK leverage ratio(3)
4.6% n/a
(1) IFRS 9 transitional capital arrangements have been applied to the leverage ratio calculation.
(2) The Group’s leverage ratio on a modified basis, excluding qualifying central bank claims and loans under the UK BBLS from the exposure measure.
(3) The fully loaded average leverage exposure measure is based on the daily average of on-balance sheet items and three month-end average of off-balance sheet items. The average
leverage ratio is based on the average of the month-end Tier 1 capital position. Under the UK leverage ratio framework, the Group was only required to start reporting average balances
from December 2019.
The UK leverage ratio framework, which came into force on 1 January 2016, is relevant to PRA regulated banks and building societies with consolidated
retail deposits equal to or greater than £50bn. The reporting date from which the Group met this threshold was 31 December 20 19 and as a result, the
average UK leverage ratio exposure and average UK leverage ratio are disclosed in the Group’s Annual Report & Accounts for the first time.
The leverage ratio is monitored against a Board-approved RAS, with responsibility for managing the ratio delegated to ALCO, which monitors it on a
monthly basis.
The leverage ratio is the ratio of Tier 1 capital to total exposures, defined as:
• capital: Tier 1 capital defined on a CRD IV fully loaded and IFRS 9 transitional basis; and
• exposures: total on- and off-balance sheet exposures (subject to credit conversion factors) as defined in the delegated act amending CRR article 429
(Calculation of the Leverage Ratio), which includes deductions applied to Tier 1 capital.
Other regulatory adjustments consist of adjustments that are required under CRD IV to be deducted from Tier 1 capital. The removal of these from the
exposure measure ensures consistency is maintained between the capital and exposure components of the ratio.
On 4 May 2020, the PRA published a modification by consent for banks subject to the UK Leverage Ratio Part of the PRA Rulebook to exclude loans
under the BBLS from the leverage ratio total exposure measure. Bounce back loans have therefore been excluded from the UK lev erage exposure value
used in the leverage ratio calculation.
The Group’s CRD IV leverage ratio of 4.8% (30 September 2019: 4.3%) exceeds the Basel Committee’s proposed minimum of 3% and the Group’s UK
leverage ratio of 4.9% (30 September 2019: 4.9%) exceeds the UK minimum ratio of 3.25%.
Following the FPC announcement on 11 March 2020 to reduce the Group’s CCyB rate to 0%, the leverage ratio buffer also reduced to 0%.
On 14 November 2018, the PRA published a policy statement – ‘UK leverage ratio: Applying the framework to systemic ring-fenced bodies and reflecting
the systemic risk buffer,’ confirming that from 1 January 2019 the UK leverage ratio framework will apply on a sub -consolidated basis to ring-fenced bodies
in scope.
56
Risk Management
Financial risk
Funding and liquidity risk
Funding risk occurs where the Group is unable to raise or maintain funds of sufficient quantity and quality to support the de livery of the business plan or
sustain lending commitments. Prudent funding risk management reduces the likelihood of liquidity risks occurring, increases the stability of funding
sources, minimises concentration risks and controls future balance sheet growth.
Liquidity risk occurs when the Group is unable to meet its current and future financial obligations as they fall due or at acceptable cost, or when the Group
reduces liquidity resources below internal or regulatory stress requirements.
Exposures
The Group is predominantly funded by personal and business customers. Customer funding is augmented by the Group’s ongoing wholesale funding
programmes, medium-term secured funding issuance (e.g. the Group’s securitisation programme), regulated covered bonds and unsecured medium-term
notes. The Group also has access to the BoE TFS.
Funding risk exposures arise from an unsustainable or undiversified funding base, for example, a reliance on short -term wholesale deposits. The risk may
result in deviation from funding strategy, requiring funding to be originated rapidly at excessive cost, or require a reduction in lending growth, which are
outcomes that may adversely affect customers or shareholders.
The Group’s primary liquidity risk exposure arises through the redemption of retail deposits where customers have the ability to withdraw funds with limited
or no notice. Exposure also arises from the refinancing of customer and wholesale funding at maturity and the ability to fund new an d existing committed
lending obligations including mortgage pipeline and credit card facilities.
Measurement
Funding and liquidity risks are subject to a range of measures contained within the Group’s RAS and a series of limits agreed by ALCO. These measures
provide a short-and long-term view of risks under both normal and stressed conditions. The measures focus on: cash outflows and inflows under stress;
concentration risks; refinancing risks; asset encumbrance; and readiness of mitigating actions.
The Group’s funding plan establishes an acceptable level of funding risk which is approved by the Board and is consistent wit h risk appetite and the
Group’s strategic objectives. The development of the Group’s funding plan is informed by the requirements of the Group’s fina ncial risk policy standards. A
series of metrics is used across the Group to measure risk exposures, including funding ratios, limits to concentration risk and maximum levels of
encumbrance.
Liquidity risk exposures are subject to assessment under both regulatory and internal requirements. The volume and quality of the Group’s liquid asset
portfolio is defined through a series of stress tests across a range of time horizons and stress conditions. The High -Quality Liquid Asset (HQLA)
requirement is quantified as the outflow of funds under a series of stress scenarios less the impact of inflows from assets. Stress cash outflow
assumptions have been established for individual liquidity risk drivers across idiosyncratic and market -wide stresses. Liquidity within the Group is
managed in accordance with the ILAAP, which is approved by the Board.
The Treasury function is responsible for the development and execution of strategy subject to oversight from the Risk function. In relation to funding and
liquidity risk, the primary management committee is the ALCO. The Group continues to maintain its strong funding and liquidit y position and seeks to
achieve an appropriate balance between profitability, liquidity risk and capital optimisation.
Monitoring
Liquidity is actively monitored by the Group, with reporting conducted through ALCO and the Executive Risk Committee. In a st ress situation or in adverse
conditions, the level of monitoring and reporting is increased commensurate with the nature of the stress event, as demonstrated in response to COVID-
19.
Monitoring and control processes are in place against internal and regulatory liquid ity requirements. The Group monitors a range of market and internal
early warning indicators on a routine basis for early signs of liquidity risk in the market or specific to the Group. These indicators cover a mixture of
quantitative and qualitative measures including daily variation of customer balances, measurement against stress requirements and monitoring of the
macroeconomic environment.
Mitigation
The Group holds a portfolio of HQLA that can be utilised to raise funding in times of stress. The size o f the HQLA portfolio is calibrated based on a view of
potential outflows under both systemic and idiosyncratic stress events. In addition, the Group can use the repo market to gen erate funds and can also
participate in BoE operations through the Sterling Monetary Framework (SMF). The Group has several sources of funding which are well-diversified in
terms of the type of instrument and product, counterparty, term structure and market. In addition to customer funding, wholesale funding is used to support
balance sheet growth, lengthen the contractual tenor of funding and diversify funding sources. These funding programmes are a sou rce of strength for the
Group and leverage the Group’s high-quality mortgage book as collateral for secured funding.
As a participant in the BoE SMF, the Group has access to funding via the TFS. Following its launch in April 2020, the Group has also been a ble to access
additional funding from TFSME, which was established to provide cost-effective funds to banks to support additional lending to the real economy and
incentivise lending to SMEs during a period of economic disruption caused by COVID-19.
The funding plan includes an assessment of the Group’s capacity for raising funds from its primary sources, thereby mitigatin g funding risk. Refinancing
risks are carefully managed and are subject to controls overseen by ALCO. The Group’s funding plan includes embedded TFS and TFSME repayment
profiles designed to manage refinancing risk.
The Group recovery plan has been established for management of an escalated liquidity requirement, if the Group experiences either restricted access to
wholesale funding or a significant increase in the withdrawal of funds. The plan identifies triggers for escalation, assesses capacity, details the action
required, allocates the key tasks to individuals, provides a timeframe and defines a management committee to manage the action p lan.
The Group operates a Funds Transfer Pricing system. A key purpose of Funds Transfer Pricing is to ensure that liquidity risk is a factor in the pricing
of loans and deposits
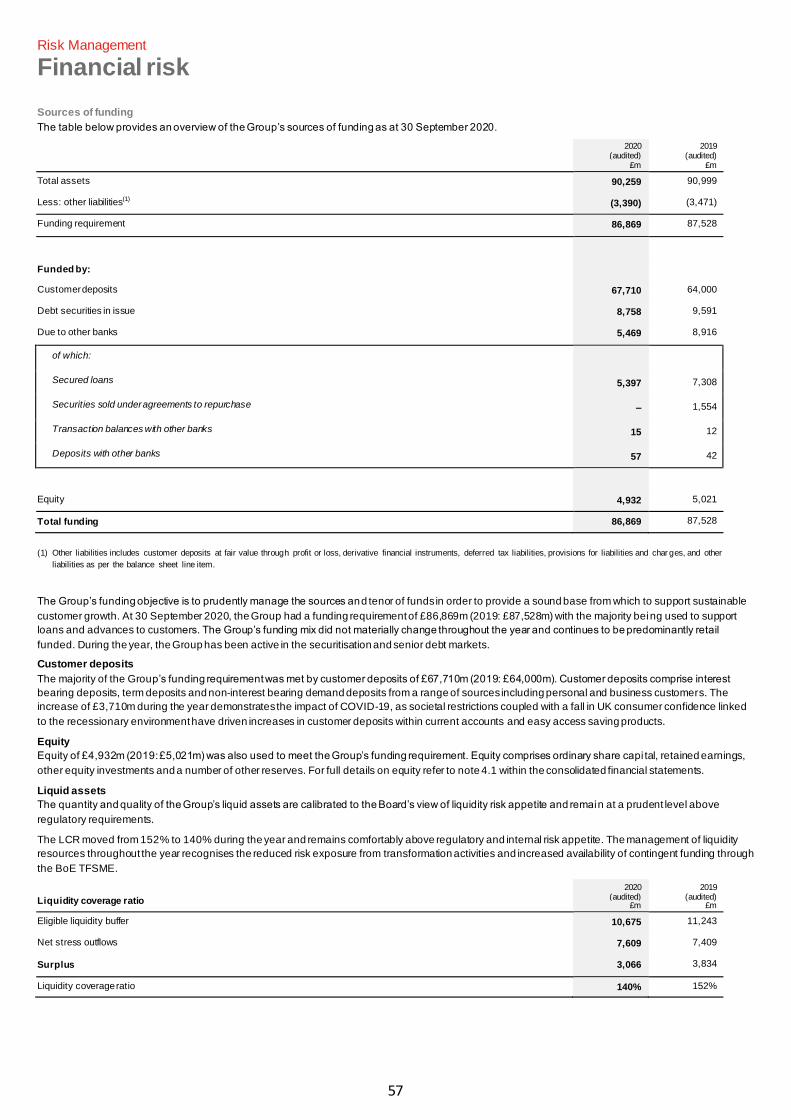
57
Risk Management
Financial risk
Sources of funding
The table below provides an overview of the Group’s sources of funding as at 30 September 2020.
2020
(audited) £m
2019 (audited)
£m
Total assets 90,259 90,999
Less: other liabilities(1) (3,390) (3,471)
Funding requirement 86,869 87,528
Funded by: Customer deposits 67,710 64,000
Debt securities in issue 8,758 9,591
Due to other banks 5,469 8,916
of which:
Secured loans 5,397 7,308
Securities sold under agreements to repurchase – 1,554
Transaction balances with other banks 15 12
Deposits with other banks 57 42
Equity 4,932 5,021
Total funding 86,869 87,528
(1) Other liabilities includes customer deposits at fair value through profit or loss, derivative financial instruments, deferred tax liabilities, provisions for liabilities and char ges, and other
liabilities as per the balance sheet line item.
The Group’s funding objective is to prudently manage the sources and tenor of funds in order to provide a sound base from which to support sustainable
customer growth. At 30 September 2020, the Group had a funding requirement of £86,869m (2019: £87,528m) with the majority being used to support
loans and advances to customers. The Group’s funding mix did not materially change throughout the year and continues to be predominantly retail
funded. During the year, the Group has been active in the securitisation and senior debt markets.
Customer deposits
The majority of the Group’s funding requirement was met by customer deposits of £67,710m (2019: £64,000m). Customer deposits comprise interest
bearing deposits, term deposits and non-interest bearing demand deposits from a range of sources including personal and business customers. The
increase of £3,710m during the year demonstrates the impact of COVID-19, as societal restrictions coupled with a fall in UK consumer confidence linked
to the recessionary environment have driven increases in customer deposits within current accounts and easy access saving products.
Equity
Equity of £4,932m (2019: £5,021m) was also used to meet the Group’s funding requirement. Equity comprises ordinary share capi tal, retained earnings,
other equity investments and a number of other reserves. For full details on equity refer to note 4.1 within the consolidated financial statements.
Liquid assets
The quantity and quality of the Group’s liquid assets are calibrated to the Board’s view of liquidity risk appetite and remain at a prudent level above
regulatory requirements.
The LCR moved from 152% to 140% during the year and remains comfortably above regulatory and internal risk appetite. The management of liquidity
resources throughout the year recognises the reduced risk exposure from transformation activities and increased availability of contingent funding through
the BoE TFSME.
Liquidity coverage ratio
2020 (audited)
£m
2019 (audited)
£m
Eligible liquidity buffer 10,675 11,243
Net stress outflows 7,609 7,409
Surplus 3,066 3,834
Liquidity coverage ratio 140% 152%
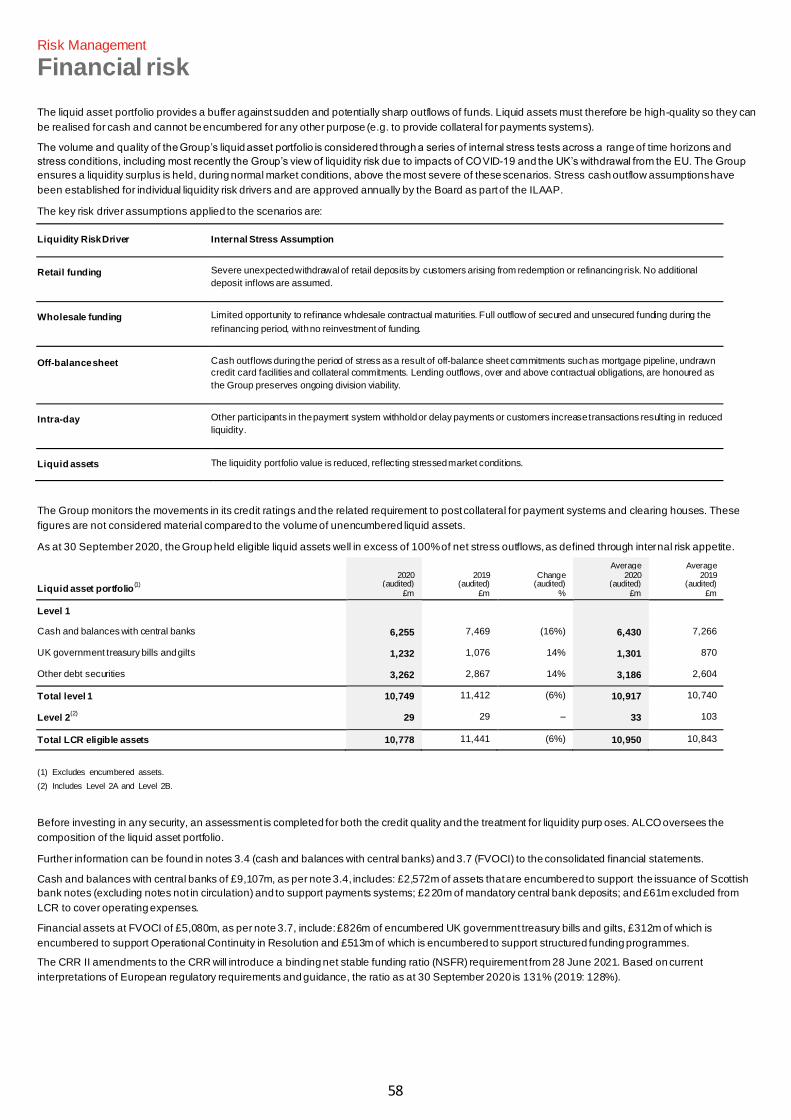
58
Risk Management
Financial risk
The liquid asset portfolio provides a buffer against sudden and potentially sharp outflows of funds. Liquid assets must therefore be high-quality so they can
be realised for cash and cannot be encumbered for any other purpose (e.g. to provide collateral for payments systems).
The volume and quality of the Group’s liquid asset portfolio is considered through a series of internal stress tests across a range of time horizons and
stress conditions, including most recently the Group’s view of liquidity risk due to impacts of COVID-19 and the UK’s withdrawal from the EU. The Group
ensures a liquidity surplus is held, during normal market conditions, above the most severe of these scenarios. Stress cash outflow assumptions have
been established for individual liquidity risk drivers and are approved annually by the Board as part of the ILAAP.
The key risk driver assumptions applied to the scenarios are:
Liquidity Risk Driver Internal Stress Assumption
Retail funding Severe unexpected withdrawal of retail deposits by customers arising from redemption or refinancing risk. No additional
deposit inflows are assumed.
Wholesale funding Limited opportunity to refinance wholesale contractual maturities. Full outflow of secured and unsecured funding during the
refinancing period, with no reinvestment of funding.
Off-balance sheet Cash outflows during the period of stress as a result of off-balance sheet commitments such as mortgage pipeline, undrawn
credit card facilities and collateral commitments. Lending outflows, over and above contractual obligations, are honoured as
the Group preserves ongoing division viability.
Intra-day Other participants in the payment system withhold or delay payments or customers increase transactions resulting in reduced
liquidity.
Liquid assets The liquidity portfolio value is reduced, reflecting stressed market conditions.
The Group monitors the movements in its credit ratings and the related requirement to post collateral for payment systems and clearing houses. These
figures are not considered material compared to the volume of unencumbered liquid assets.
As at 30 September 2020, the Group held eligible liquid assets well in excess of 100% of net stress outflows, as defined through internal risk appetite.
Liquid asset portfolio(1)
2020 (audited)
£m
2019 (audited)
£m
Change (audited)
%
Average 2020
(audited) £m
Average 2019
(audited) £m
Level 1 Cash and balances with central banks 6,255 7,469 (16%) 6,430 7,266
UK government treasury bills and gilts 1,232 1,076 14% 1,301 870
Other debt securities 3,262 2,867 14% 3,186 2,604
Total level 1 10,749 11,412 (6%) 10,917 10,740
Level 2(2)
29 29 – 33 103
Total LCR eligible assets 10,778 11,441 (6%) 10,950 10,843
(1) Excludes encumbered assets.
(2) Includes Level 2A and Level 2B.
Before investing in any security, an assessment is completed for both the credit quality and the treatment for liquidity purp oses. ALCO oversees the
composition of the liquid asset portfolio.
Further information can be found in notes 3.4 (cash and balances with central banks) and 3.7 (FVOCI) to the consolidated financial statements.
Cash and balances with central banks of £9,107m, as per note 3.4, includes: £2,572m of assets that are encumbered to support the issuance of Scottish
bank notes (excluding notes not in circulation) and to support payments systems; £220m of mandatory central bank deposits; and £61m excluded from
LCR to cover operating expenses.
Financial assets at FVOCI of £5,080m, as per note 3.7, include: £826m of encumbered UK government treasury bills and gilts, £312m of which is
encumbered to support Operational Continuity in Resolution and £513m of which is encumbered to support structured funding programmes.
The CRR II amendments to the CRR will introduce a binding net stable funding ratio (NSFR) requirement from 28 June 2021. Based on current
interpretations of European regulatory requirements and guidance, the ratio as at 30 September 2020 is 131% (2019: 128%).
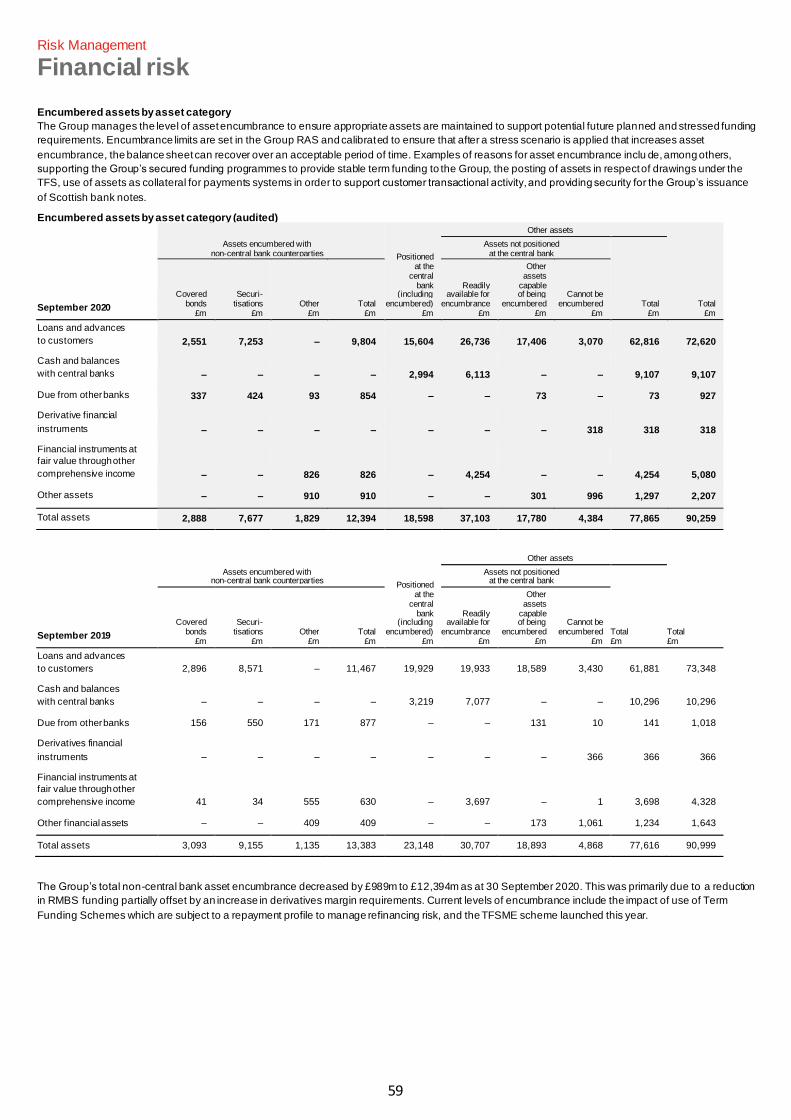
59
Risk Management
Financial risk
Encumbered assets by asset category
The Group manages the level of asset encumbrance to ensure appropriate assets are maintained to support potential future planned and stressed funding
requirements. Encumbrance limits are set in the Group RAS and calibrated to ensure that after a stress scenario is applied that increases asset
encumbrance, the balance sheet can recover over an acceptable period of time. Examples of reasons for asset encumbrance inclu de, among others,
supporting the Group’s secured funding programmes to provide stable term funding to the Group, the posting of assets in respect of drawings under the
TFS, use of assets as collateral for payments systems in order to support customer transactional activity, and providing security for the Group’s issuance
of Scottish bank notes.
Encumbered assets by asset category (audited)
September 2020
Assets encumbered with non-central bank counterparties Positioned
at the central
bank (including
encumbered) £m
Other assets
Total £m
Assets not positioned at the central bank
Total £m
Covered bonds
£m
Securi- tisations
£m Other
£m Total
£m
Readily available for
encumbrance £m
Other assets
capable of being
encumbered £m
Cannot be encumbered
£m
Loans and advances
to customers 2,551 7,253 – 9,804 15,604 26,736 17,406 3,070 62,816 72,620
Cash and balances
with central banks – – – – 2,994 6,113 – – 9,107 9,107
Due from other banks 337 424 93 854 – – 73 – 73 927
Derivative financial
instruments – – – – – – – 318 318 318
Financial instruments at
fair value through other
comprehensive income – – 826 826 – 4,254 – – 4,254 5,080
Other assets – – 910 910 – – 301 996 1,297 2,207
Total assets 2,888 7,677 1,829 12,394 18,598 37,103 17,780 4,384 77,865 90,259
September 2019
Assets encumbered with non-central bank counterparties
Positioned at the
central bank
(including encumbered)
£m
Other assets
Total £m
Assets not positioned at the central bank
Total £m
Covered bonds
£m
Securi- tisations
£m Other
£m Total
£m
Readily available for
encumbrance £m
Other assets
capable of being
encumbered £m
Cannot be encumbered
£m
Loans and advances
to customers 2,896 8,571 – 11,467 19,929 19,933 18,589 3,430 61,881 73,348
Cash and balances
with central banks – – – – 3,219 7,077 – – 10,296 10,296
Due from other banks 156 550 171 877 – – 131 10 141 1,018
Derivatives financial
instruments – – – – – – – 366 366 366
Financial instruments at
fair value through other
comprehensive income 41 34 555 630 – 3,697 – 1 3,698 4,328
Other financial assets – – 409 409 – – 173 1,061 1,234 1,643
Total assets 3,093 9,155 1,135 13,383 23,148 30,707 18,893 4,868 77,616 90,999
The Group’s total non-central bank asset encumbrance decreased by £989m to £12,394m as at 30 September 2020. This was primarily due to a reduction
in RMBS funding partially offset by an increase in derivatives margin requirements. Current levels of encumbrance include the impact of use of Term
Funding Schemes which are subject to a repayment profile to manage refinancing risk, and the TFSME scheme launched this year.
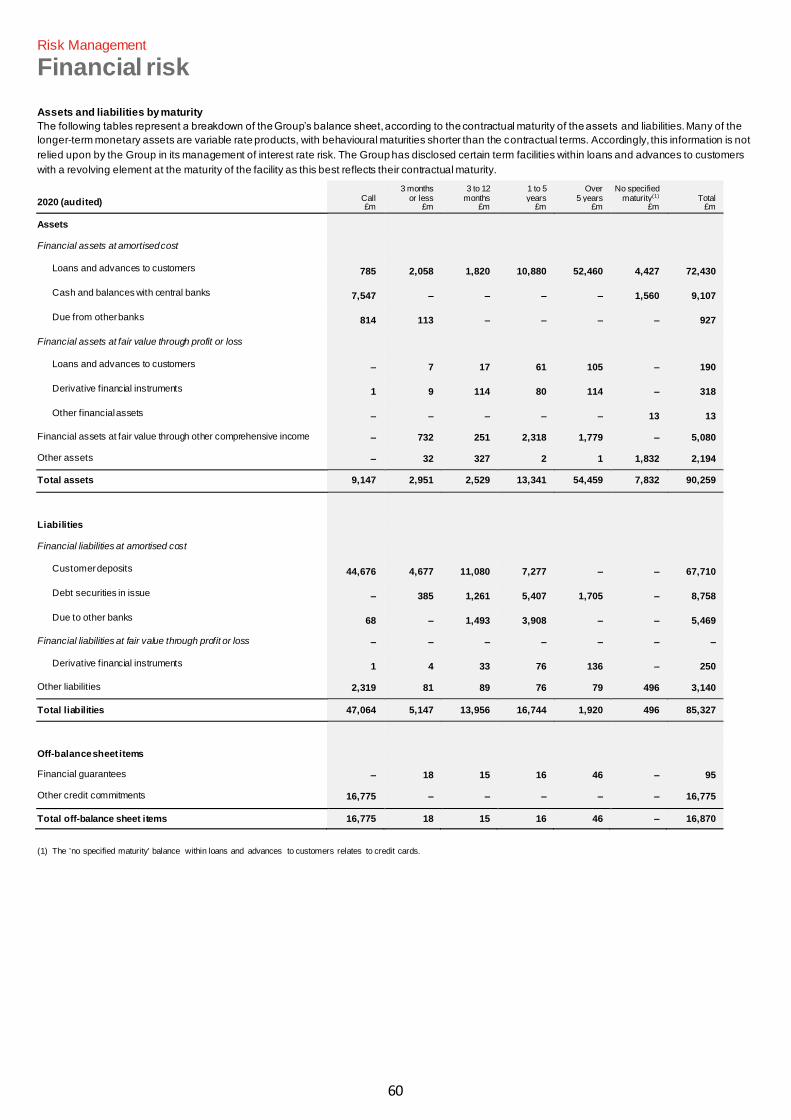
60
Risk Management
Financial risk
Assets and liabilities by maturity
The following tables represent a breakdown of the Group’s balance sheet, according to the contractual maturity of the assets and liabilities. Many of the
longer-term monetary assets are variable rate products, with behavioural maturities shorter than the contractual terms. Accordingly, this information is not
relied upon by the Group in its management of interest rate risk. The Group has disclosed certain term facilities within loans and advances to customers
with a revolving element at the maturity of the facility as this best reflects their contractual maturity.
2020 (audited) Call £m
3 months or less
£m
3 to 12 months
£m
1 to 5 years
£m
Over 5 years
£m
No specified maturity(1)
£m Total
£m
Assets
Financial assets at amortised cost
Loans and advances to customers 785 2,058 1,820 10,880 52,460 4,427 72,430
Cash and balances with central banks 7,547 – – – – 1,560 9,107
Due from other banks 814 113 – – – – 927
Financial assets at fair value through profit or loss
Loans and advances to customers – 7 17 61 105 – 190
Derivative financial instruments 1 9 114 80 114 – 318
Other financial assets – – – – – 13 13
Financial assets at fair value through other comprehensive income – 732 251 2,318 1,779 – 5,080
Other assets – 32 327 2 1 1,832 2,194
Total assets 9,147 2,951 2,529 13,341 54,459 7,832 90,259
Liabilities
Financial liabilities at amortised cost
Customer deposits 44,676 4,677 11,080 7,277 – – 67,710
Debt securities in issue – 385 1,261 5,407 1,705 – 8,758
Due to other banks 68 – 1,493 3,908 – – 5,469
Financial liabilities at fair value through profit or loss – – – – – – –
Derivative financial instruments 1 4 33 76 136 – 250
Other liabilities 2,319 81 89 76 79 496 3,140
Total liabilities 47,064 5,147 13,956 16,744 1,920 496 85,327
Off-balance sheet items Financial guarantees – 18 15 16 46 – 95
Other credit commitments 16,775 – – – – – 16,775
Total off-balance sheet items 16,775 18 15 16 46 – 16,870
(1) The 'no specified maturity' balance within loans and advances to customers relates to credit cards.
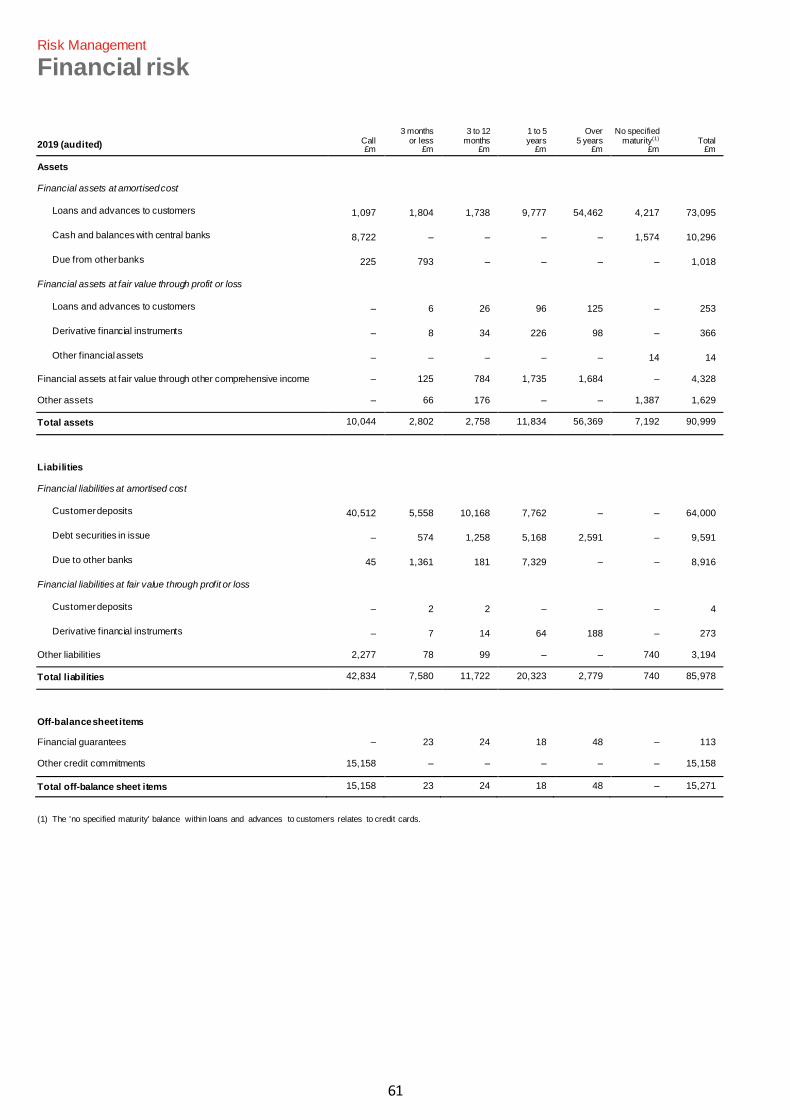
61
Risk Management
Financial risk
2019 (audited) Call £m
3 months or less
£m
3 to 12 months
£m
1 to 5 years
£m
Over 5 years
£m
No specified maturity(1)
£m Total
£m
Assets
Financial assets at amortised cost
Loans and advances to customers 1,097 1,804 1,738 9,777 54,462 4,217 73,095
Cash and balances with central banks 8,722 – – – – 1,574 10,296
Due from other banks 225 793 – – – – 1,018
Financial assets at fair value through profit or loss
Loans and advances to customers – 6 26 96 125 – 253
Derivative financial instruments – 8 34 226 98 – 366
Other financial assets – – – – – 14 14
Financial assets at fair value through other comprehensive income – 125 784 1,735 1,684 – 4,328
Other assets – 66 176 – – 1,387 1,629
Total assets 10,044 2,802 2,758 11,834 56,369 7,192 90,999
Liabilities
Financial liabilities at amortised cost
Customer deposits 40,512 5,558 10,168 7,762 – – 64,000
Debt securities in issue – 574 1,258 5,168 2,591 – 9,591
Due to other banks 45 1,361 181 7,329 – – 8,916
Financial liabilities at fair value through profit or loss
Customer deposits – 2 2 – – – 4
Derivative financial instruments – 7 14 64 188 – 273
Other liabilities 2,277 78 99 – – 740 3,194
Total liabilities 42,834 7,580 11,722 20,323 2,779 740 85,978
Off-balance sheet items Financial guarantees – 23 24 18 48 – 113
Other credit commitments 15,158 – – – – – 15,158
Total off-balance sheet items 15,158 23 24 18 48 – 15,271
(1) The 'no specified maturity' balance within loans and advances to customers relates to credit cards.
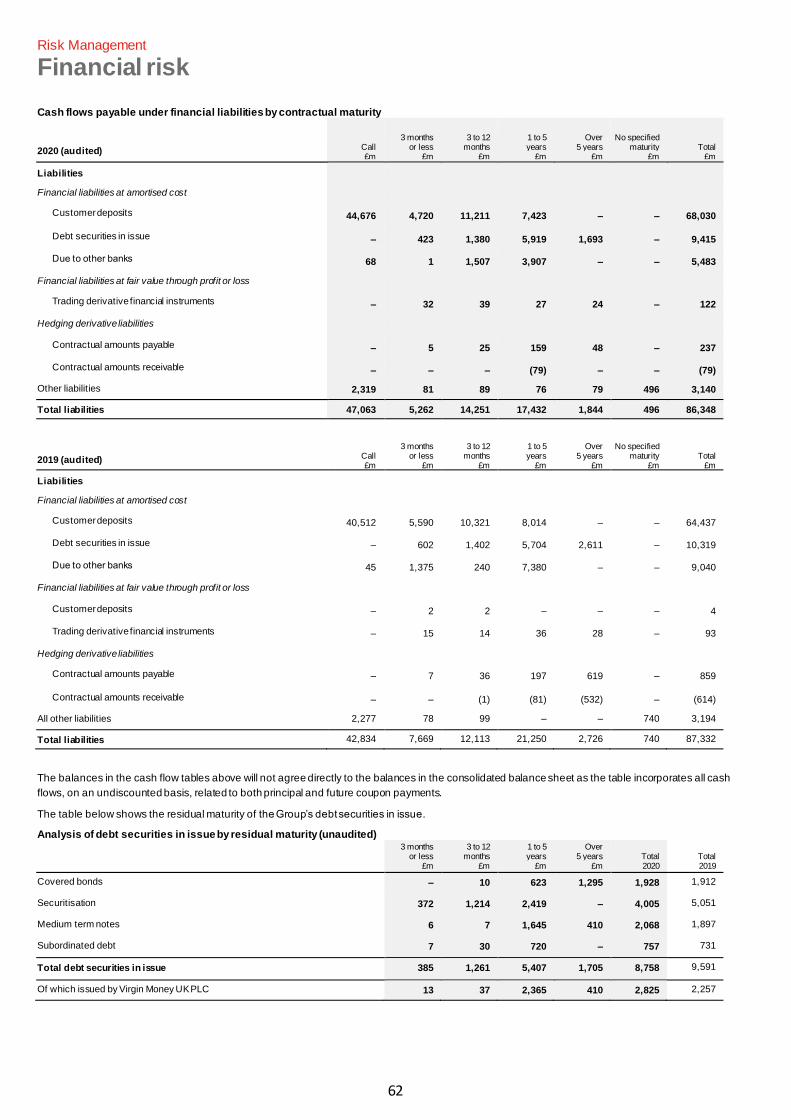
62
Risk Management
Financial risk
Cash flows payable under financial liabilities by contractual maturity
2020 (audited) Call £m
3 months or less
£m
3 to 12 months
£m
1 to 5 years
£m
Over 5 years
£m
No specified maturity
£m Total
£m
Liabilities Financial liabilities at amortised cost
Customer deposits 44,676 4,720 11,211 7,423 – – 68,030
Debt securities in issue – 423 1,380 5,919 1,693 – 9,415
Due to other banks 68 1 1,507 3,907 – – 5,483
Financial liabilities at fair value through profit or loss Trading derivative financial instruments – 32 39 27 24 – 122
Hedging derivative liabilities Contractual amounts payable – 5 25 159 48 – 237
Contractual amounts receivable – – – (79) – – (79)
Other liabilities 2,319 81 89 76 79 496 3,140
Total liabilities 47,063 5,262 14,251 17,432 1,844 496 86,348
2019 (audited) Call £m
3 months or less
£m
3 to 12 months
£m
1 to 5 years
£m
Over 5 years
£m
No specified maturity
£m Total
£m
Liabilities Financial liabilities at amortised cost
Customer deposits 40,512 5,590 10,321 8,014 – – 64,437
Debt securities in issue – 602 1,402 5,704 2,611 – 10,319
Due to other banks 45 1,375 240 7,380 – – 9,040
Financial liabilities at fair value through profit or loss Customer deposits – 2 2 – – – 4
Trading derivative financial instruments – 15 14 36 28 – 93
Hedging derivative liabilities Contractual amounts payable – 7 36 197 619 – 859
Contractual amounts receivable – – (1) (81) (532) – (614)
All other liabilities 2,277 78 99 – – 740 3,194
Total liabilities 42,834 7,669 12,113 21,250 2,726 740 87,332
The balances in the cash flow tables above will not agree directly to the balances in the consolidated balance sheet as the table incorporates all cash
flows, on an undiscounted basis, related to both principal and future coupon payments.
The table below shows the residual maturity of the Group’s debt securities in issue.
Analysis of debt securities in issue by residual maturity (unaudited)
3 months
or less £m
3 to 12 months
£m
1 to 5 years
£m
Over 5 years
£m Total 2020
Total 2019
Covered bonds – 10 623 1,295 1,928 1,912
Securitisation 372 1,214 2,419 – 4,005 5,051
Medium term notes 6 7 1,645 410 2,068 1,897
Subordinated debt 7 30 720 – 757 731
Total debt securities in issue 385 1,261 5,407 1,705 8,758 9,591
Of which issued by Virgin Money UK PLC 13 37 2,365 410 2,825 2,257
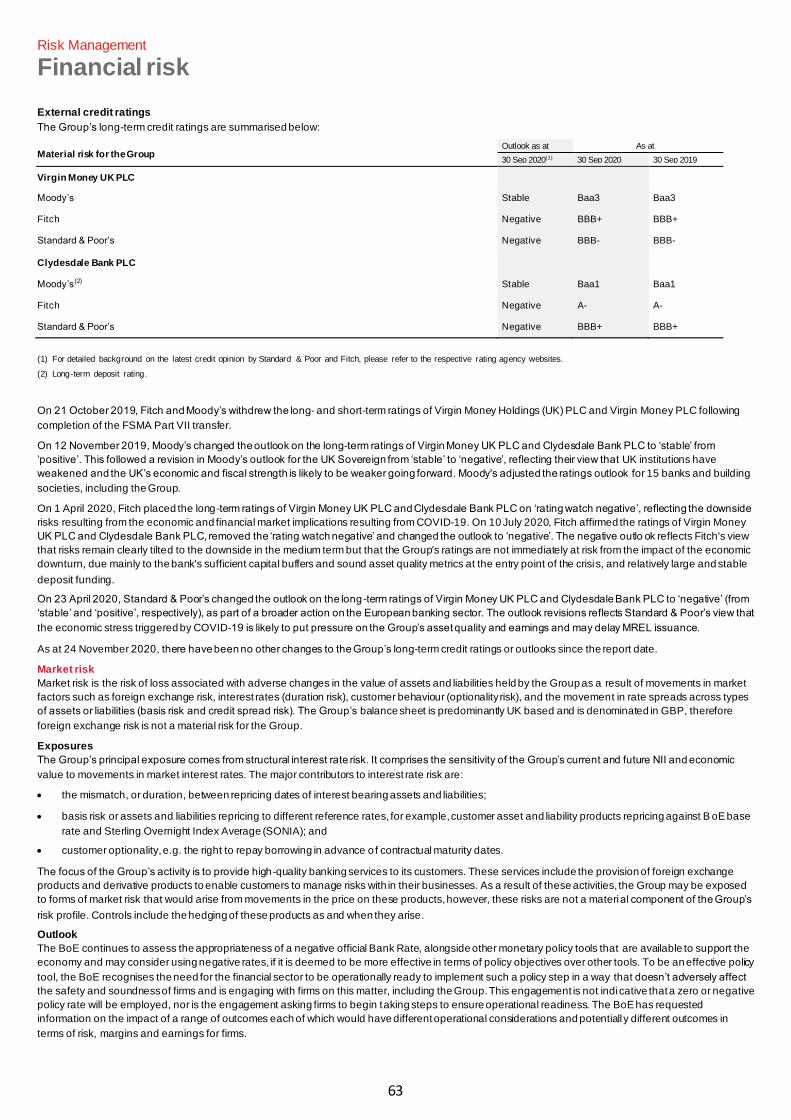
63
Risk Management
Financial risk
External credit ratings
The Group’s long-term credit ratings are summarised below:
Material risk for the Group Outlook as at As at
30 Sep 2020(1) 30 Sep 2020 30 Sep 2019
Virgin Money UK PLC Moody’s Stable Baa3 Baa3
Fitch Negative BBB+ BBB+
Standard & Poor’s Negative BBB- BBB-
Clydesdale Bank PLC Moody’s(2) Stable Baa1 Baa1
Fitch Negative A- A-
Standard & Poor’s Negative BBB+ BBB+
(1) For detailed background on the latest credit opinion by Standard & Poor and Fitch, please refer to the respective rating agency websites.
(2) Long-term deposit rating.
On 21 October 2019, Fitch and Moody’s withdrew the long- and short-term ratings of Virgin Money Holdings (UK) PLC and Virgin Money PLC following
completion of the FSMA Part VII transfer.
On 12 November 2019, Moody’s changed the outlook on the long-term ratings of Virgin Money UK PLC and Clydesdale Bank PLC to ‘stable’ from
‘positive’. This followed a revision in Moody’s outlook for the UK Sovereign from ‘stable’ to ‘negative’, reflecting their view that UK institutions have
weakened and the UK’s economic and fiscal strength is likely to be weaker going forward. Moody's adjusted the ratings outlook for 15 banks and building
societies, including the Group.
On 1 April 2020, Fitch placed the long-term ratings of Virgin Money UK PLC and Clydesdale Bank PLC on ‘rating watch negative’, reflecting the downside
risks resulting from the economic and financial market implications resulting from COVID-19. On 10 July 2020, Fitch affirmed the ratings of Virgin Money
UK PLC and Clydesdale Bank PLC, removed the ‘rating watch negative’ and changed the outlook to ‘negative’. The negative outlo ok reflects Fitch's view
that risks remain clearly tilted to the downside in the medium term but that the Group's ratings are not immediately at risk from the impact of the economic
downturn, due mainly to the bank's sufficient capital buffers and sound asset quality metrics at the entry point of the crisis, and relatively large and stable
deposit funding.
On 23 April 2020, Standard & Poor’s changed the outlook on the long -term ratings of Virgin Money UK PLC and Clydesdale Bank PLC to ‘negative’ (from
‘stable’ and ‘positive’, respectively), as part of a broader action on the European banking sector. The outlook revisions reflects Standard & Poor’s view that
the economic stress triggered by COVID-19 is likely to put pressure on the Group’s asset quality and earnings and may delay MREL issuance.
As at 24 November 2020, there have been no other changes to the Group’s long-term credit ratings or outlooks since the report date.
Market risk
Market risk is the risk of loss associated with adverse changes in the value of assets and liabilities held by the Group as a result of movements in market
factors such as foreign exchange risk, interest rates (duration risk), customer behaviour (optionality risk), and the movement in rate spreads across types
of assets or liabilities (basis risk and credit spread risk). The Group’s balance sheet is predominantly UK based and is denominated in GBP, therefore
foreign exchange risk is not a material risk for the Group.
Exposures
The Group’s principal exposure comes from structural interest rate risk. It comprises the sensitivity of the Group’s current and future NII and economic
value to movements in market interest rates. The major contributors to interest rate risk are:
• the mismatch, or duration, between repricing dates of interest bearing assets and liabilities;
• basis risk or assets and liabilities repricing to different reference rates, for example, customer asset and liability products repricing against B oE base
rate and Sterling Overnight Index Average (SONIA); and
• customer optionality, e.g. the right to repay borrowing in advance o f contractual maturity dates.
The focus of the Group’s activity is to provide high-quality banking services to its customers. These services include the provision of foreign exchange
products and derivative products to enable customers to manage risks with in their businesses. As a result of these activities, the Group may be exposed
to forms of market risk that would arise from movements in the price on these products, however, these risks are not a material component of the Group’s
risk profile. Controls include the hedging of these products as and when they arise.
Outlook
The BoE continues to assess the appropriateness of a negative official Bank Rate, alongside other monetary policy tools that are available to support the
economy and may consider using negative rates, if it is deemed to be more effective in terms of policy objectives over other tools. To be an effective policy
tool, the BoE recognises the need for the financial sector to be operationally ready to implement such a policy step in a way that doesn’t adversely affect
the safety and soundness of firms and is engaging with firms on this matter, including the Group. This engagement is not indicative that a zero or negative
policy rate will be employed, nor is the engagement asking firms to begin taking steps to ensure operational readiness. The BoE has requested
information on the impact of a range of outcomes each of which would have different operational considerations and potentially different outcomes in
terms of risk, margins and earnings for firms.
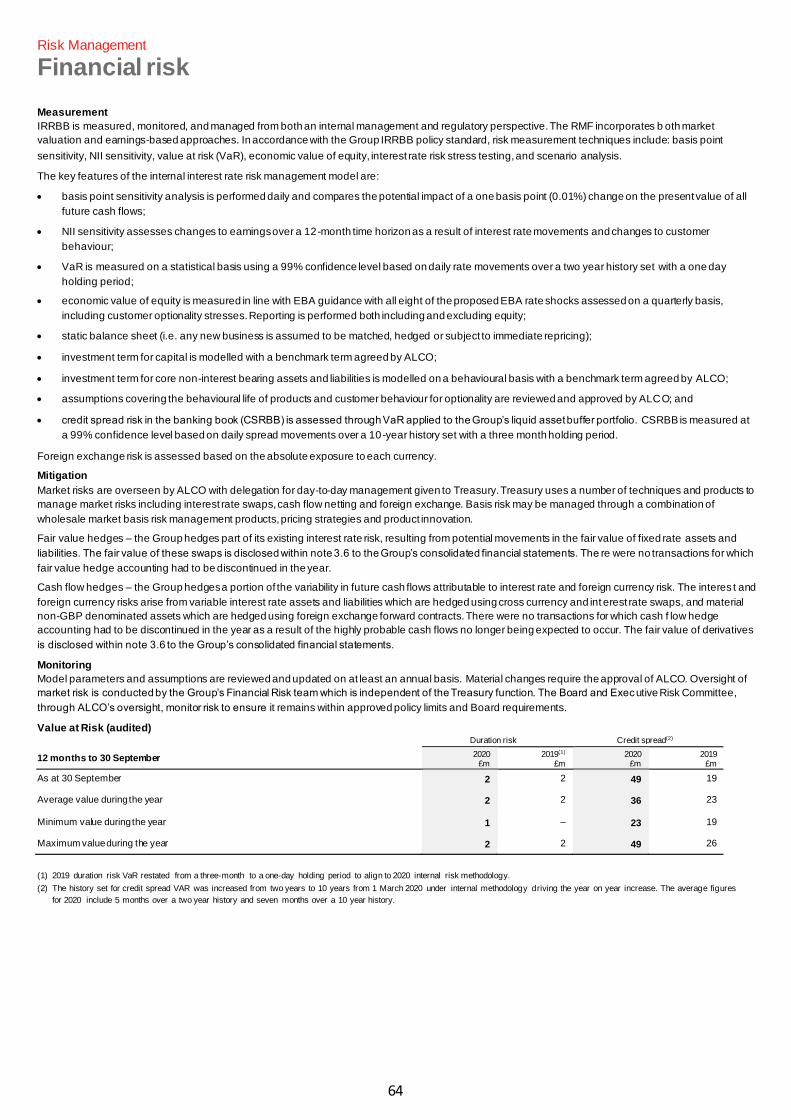
64
Risk Management
Financial risk
Measurement
IRRBB is measured, monitored, and managed from both an internal management and regulatory perspective. The RMF incorporates b oth market
valuation and earnings-based approaches. In accordance with the Group IRRBB policy standard, risk measurement techniques include: basis point
sensitivity, NII sensitivity, value at risk (VaR), economic value of equity, interest rate risk stress testing, and scenario analysis.
The key features of the internal interest rate risk management model are:
• basis point sensitivity analysis is performed daily and compares the potential impact of a one basis point (0.01%) change on the present value of all
future cash flows;
• NII sensitivity assesses changes to earnings over a 12-month time horizon as a result of interest rate movements and changes to customer
behaviour;
• VaR is measured on a statistical basis using a 99% confidence level based on daily rate movements over a two year history set with a one day
holding period;
• economic value of equity is measured in line with EBA guidance with all eight of the proposed EBA rate shocks assessed on a quarterly basis,
including customer optionality stresses. Reporting is performed both including and excluding equity;
• static balance sheet (i.e. any new business is assumed to be matched, hedged or subject to immediate repricing);
• investment term for capital is modelled with a benchmark term agreed by ALCO;
• investment term for core non-interest bearing assets and liabilities is modelled on a behavioural basis with a benchmark term agreed by ALCO;
• assumptions covering the behavioural life of products and customer behaviour for optionality are reviewed and approved by ALCO; and
• credit spread risk in the banking book (CSRBB) is assessed through VaR applied to the Group’s liquid asset buffer portfolio. CSRBB is measured at
a 99% confidence level based on daily spread movements over a 10-year history set with a three month holding period.
Foreign exchange risk is assessed based on the absolute exposure to each currency.
Mitigation
Market risks are overseen by ALCO with delegation for day-to-day management given to Treasury. Treasury uses a number of techniques and products to
manage market risks including interest rate swaps, cash flow netting and foreign exchange. Basis risk may be managed through a combination of
wholesale market basis risk management products, pricing strategies and product innovation.
Fair value hedges – the Group hedges part of its existing interest rate risk, resulting from potential movements in the fair value of fixed rate assets and
liabilities. The fair value of these swaps is disclosed within note 3.6 to the Group’s consolidated financial statements. The re were no transactions for which
fair value hedge accounting had to be discontinued in the year.
Cash flow hedges – the Group hedges a portion of the variability in future cash flows attributable to interest rate and foreign currency risk. The interes t and
foreign currency risks arise from variable interest rate assets and liabilities which are hedged using cross currency and int erest rate swaps, and material
non-GBP denominated assets which are hedged using foreign exchange forward contracts. There were no transactions for which cash f low hedge
accounting had to be discontinued in the year as a result of the highly probable cash flows no longer being expected to occur. The fair value of derivatives
is disclosed within note 3.6 to the Group’s consolidated financial statements.
Monitoring
Model parameters and assumptions are reviewed and updated on at least an annual basis. Material changes require the approval of ALCO. Oversight of
market risk is conducted by the Group’s Financial Risk team which is independent of the Treasury function. The Board and Executive Risk Committee,
through ALCO’s oversight, monitor risk to ensure it remains within approved policy limits and Board requirements.
Value at Risk (audited)
12 months to 30 September
Duration risk Credit spread(2)
2020 £m
2019(1) £m
2020 £m
2019 £m
As at 30 September 2 2 49 19
Average value during the year 2 2 36 23
Minimum value during the year 1 – 23 19
Maximum value during the year 2 2 49 26
(1) 2019 duration risk VaR restated from a three-month to a one-day holding period to align to 2020 internal risk methodology.
(2) The history set for credit spread VAR was increased from two years to 10 years from 1 March 2020 under internal methodology driving the year on year increase. The average figures
for 2020 include 5 months over a two year history and seven months over a 10 year history.
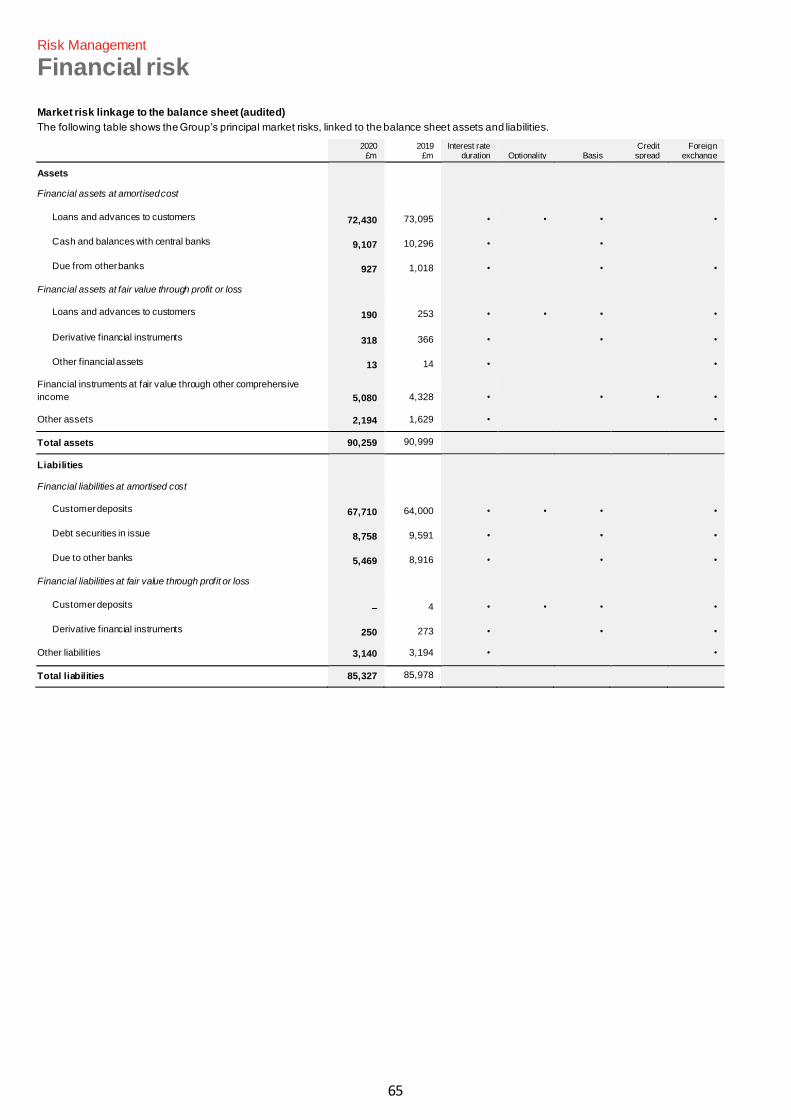
65
Risk Management
Financial risk
Market risk linkage to the balance sheet (audited)
The following table shows the Group’s principal market risks, linked to the balance sheet assets and liabilities.
2020 £m
2019 £m
Interest rate duration Optionality Basis
Credit spread
Foreign exchange
Assets Financial assets at amortised cost
Loans and advances to customers 72,430 73,095 • • • •
Cash and balances with central banks 9,107 10,296 • •
Due from other banks 927 1,018 • • •
Financial assets at fair value through profit or loss Loans and advances to customers 190 253 • • • •
Derivative financial instruments 318 366 • • •
Other financial assets 13 14 • •
Financial instruments at fair value through other comprehensive
income 5,080 4,328 • • • •
Other assets 2,194 1,629 • •
Total assets 90,259 90,999
Liabilities
Financial liabilities at amortised cost
Customer deposits 67,710 64,000 • • • •
Debt securities in issue 8,758 9,591 • • •
Due to other banks 5,469 8,916 • • •
Financial liabilities at fair value through profit or loss
Customer deposits – 4 • • • •
Derivative financial instruments 250 273 • • •
Other liabilities 3,140 3,194 • •
Total liabilities 85,327 85,978
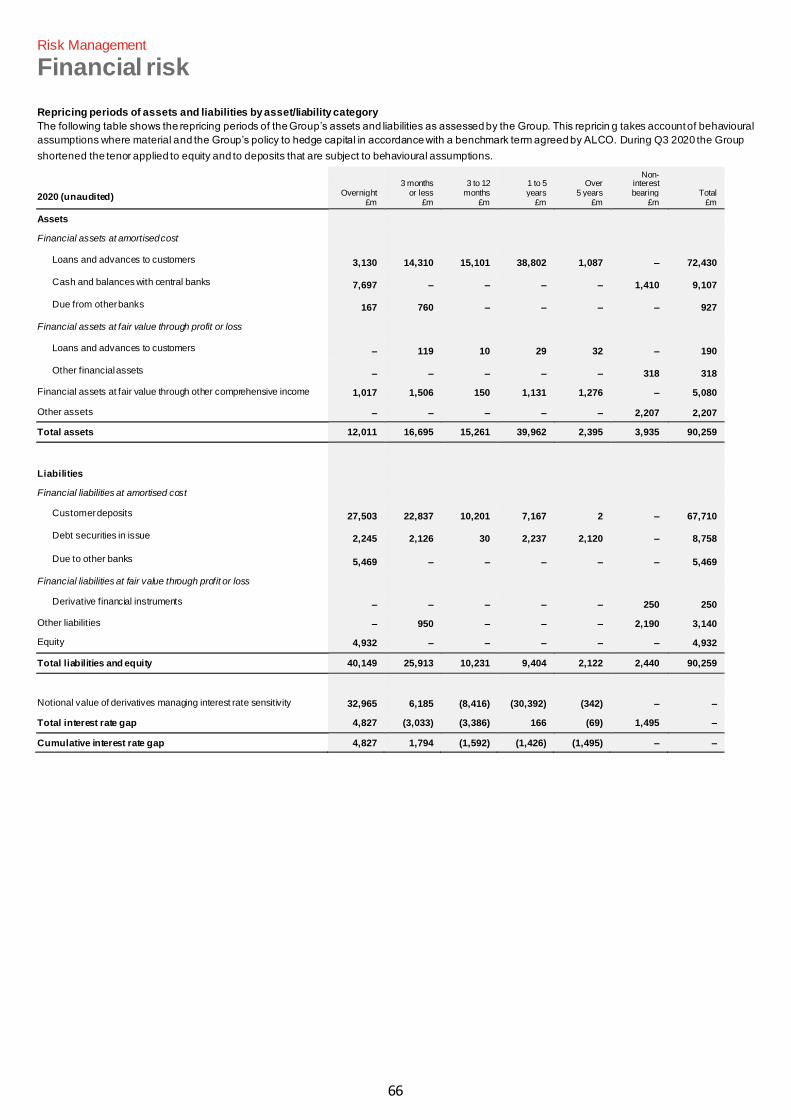
66
Risk Management
Financial risk
Repricing periods of assets and liabilities by asset/liability category
The following table shows the repricing periods of the Group’s assets and liabilities as assessed by the Group. This repricin g takes account of behavioural
assumptions where material and the Group’s policy to hedge capital in accordance with a benchmark term agreed by ALCO. During Q3 2020 the Group
shortened the tenor applied to equity and to deposits that are subject to behavioural assumptions.
2020 (unaudited) Overnight £m
3 months or less
£m
3 to 12 months
£m
1 to 5 years
£m
Over 5 years
£m
Non- interest bearing
£m Total
£m
Assets Financial assets at amortised cost
Loans and advances to customers 3,130 14,310 15,101 38,802 1,087 – 72,430
Cash and balances with central banks 7,697 – – – – 1,410 9,107
Due from other banks 167 760 – – – – 927
Financial assets at fair value through profit or loss Loans and advances to customers – 119 10 29 32 – 190
Other financial assets – – – – – 318 318
Financial assets at fair value through other comprehensive income 1,017 1,506 150 1,131 1,276 – 5,080
Other assets – – – – – 2,207 2,207
Total assets 12,011 16,695 15,261 39,962 2,395 3,935 90,259
Liabilities Financial liabilities at amortised cost
Customer deposits 27,503 22,837 10,201 7,167 2 – 67,710
Debt securities in issue 2,245 2,126 30 2,237 2,120 – 8,758
Due to other banks 5,469 – – – – – 5,469
Financial liabilities at fair value through profit or loss Derivative financial instruments – – – – – 250 250
Other liabilities – 950 – – – 2,190 3,140
Equity 4,932 – – – – – 4,932
Total liabilities and equity 40,149 25,913 10,231 9,404 2,122 2,440 90,259
Notional value of derivatives managing interest rate sensitivity 32,965 6,185 (8,416) (30,392) (342) – –
Total interest rate gap 4,827 (3,033) (3,386) 166 (69) 1,495 –
Cumulative interest rate gap 4,827 1,794 (1,592) (1,426) (1,495) – –
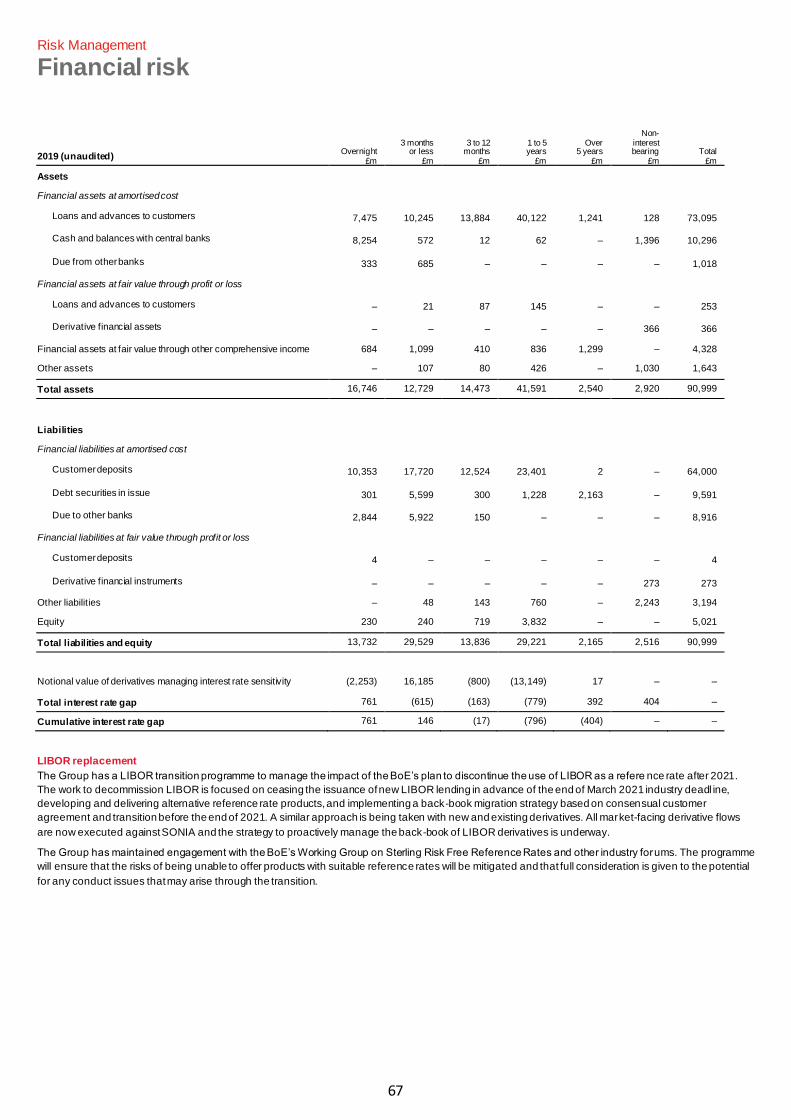
67
Risk Management
Financial risk
2019 (unaudited) Overnight
£m
3 months or less
£m
3 to 12 months
£m
1 to 5 years
£m
Over 5 years
£m
Non- interest bearing
£m Total
£m
Assets Financial assets at amortised cost
Loans and advances to customers 7,475 10,245 13,884 40,122 1,241 128 73,095
Cash and balances with central banks 8,254 572 12 62 – 1,396 10,296
Due from other banks 333 685 – – – – 1,018
Financial assets at fair value through profit or loss Loans and advances to customers – 21 87 145 – – 253
Derivative financial assets – – – – – 366 366
Financial assets at fair value through other comprehensive income 684 1,099 410 836 1,299 – 4,328
Other assets – 107 80 426 – 1,030 1,643
Total assets 16,746 12,729 14,473 41,591 2,540 2,920 90,999
Liabilities Financial liabilities at amortised cost
Customer deposits 10,353 17,720 12,524 23,401 2 – 64,000
Debt securities in issue 301 5,599 300 1,228 2,163 – 9,591
Due to other banks 2,844 5,922 150 – – – 8,916
Financial liabilities at fair value through profit or loss Customer deposits 4 – – – – – 4
Derivative financial instruments – – – – – 273 273
Other liabilities – 48 143 760 – 2,243 3,194
Equity 230 240 719 3,832 – – 5,021
Total liabilities and equity 13,732 29,529 13,836 29,221 2,165 2,516 90,999
Notional value of derivatives managing interest rate sensitivity (2,253) 16,185 (800) (13,149) 17 – –
Total interest rate gap 761 (615) (163) (779) 392 404 –
Cumulative interest rate gap 761 146 (17) (796) (404) – –
LIBOR replacement
The Group has a LIBOR transition programme to manage the impact of the BoE’s plan to discontinue the use of LIBOR as a refere nce rate after 2021.
The work to decommission LIBOR is focused on ceasing the issuance of new LIBOR lending in advance of the end of March 2021 industry deadl ine,
developing and delivering alternative reference rate products, and implementing a back-book migration strategy based on consensual customer
agreement and transition before the end of 2021. A similar approach is being taken with new and existing derivatives. All market-facing derivative flows
are now executed against SONIA and the strategy to proactively manage the back-book of LIBOR derivatives is underway.
The Group has maintained engagement with the BoE’s Working Group on Sterling Risk Free Reference Rates and other industry forums. The programme
will ensure that the risks of being unable to offer products with suitable reference rates will be mitigated and that full consideration is given to the potential
for any conduct issues that may arise through the transition.
68
Risk Management
Financial risk
Pension risk
The Group operates a defined benefit pension scheme, the Yorkshire and Clydesdale Bank Pension Scheme (the Scheme). Clydesdale Bank PLC (the
Bank) is the Scheme’s principal employer and there are no other participating employers. The Scheme was closed to future accrual on 1 August 2017 for
most members. A small number of members remain on a defined benefit accruals basis subject to certain conditions.
Defined benefit pension schemes provide a promise to pay members a pre -determined level of income at retirement which is independent of the
contributions, investments and returns (the scheme assets) used to fund these benefit promises (the scheme liabilities). The operation of a pension
scheme gives rise to several risks, for example, movements in equity valuations, changes in bond yields, life expectancy of scheme members, movements
in interest and inflation rates and changes in legislation. The Group also supports a defined contribution scheme, however th e nature of this type of
scheme places the investment and liability risk on the member rather than the Group.
Pension risk is the risk that, at any point in time, the value of the scheme assets is not enough to meet the current or expecte d future value of the scheme
liabilities. This risk will continue to exist until the scheme is formally wound up, either if all the liabilities are transferred to a third party (for example an insurer)
or once all individual member benefits have been honoured.
Risk appetite
The Group’s pension risk appetite is a component of the Group ‑wide RAS framework for the management of balance sheet risks and is considered in the
context of potential capital impacts as a result of volatility in the Scheme’s valuations.
Assets
The Trustee governs investments according to a Statement of Investment Principles. This is reviewed and agreed by the Trustee Board on a regular
basis, with the Bank consulted on any proposed changes. The Statement of Investment Principles is drafted in accordance with the requirements of
Section 35 of the Pensions Act 1995 (as amended by the Pensions Act 2004 and regulations made under it). This sets out the Scheme objectives and the
journey plan to meet these objectives.
This results in an appropriate mix of return seeking assets as well as liability matching assets to better match future pension obligations. The split of
Scheme assets is shown within note 3.10 to the Group’s consolidated financial statements. The fair value of the assets was £4.7bn as at 30 September
2020 (2019: £4.7bn).
Liabilities
The retirement benefit obligations are a series of future cash outflows with relatively long duration and are responsive to movements on many of the inputs
including interest rates. On an IAS 19 basis these cash flows are primarily sensitive to changes in the expected long-term price inflation rates (RPI/CPI),
the life expectancy of members and the discount rate (linked to yields on AA corporate bonds):
• an increase in long-term expected inflation corresponds to an increase in liabilities;
• an increase in life expectancy corresponds to an increase in liabilities; and
• a decrease in the discount rate corresponds to an increase in liabilities.
Exposure
The Group’s defined benefit pension scheme affects its regulatory capital in two ways:
• CET1 capital – while an IAS 19 surplus will increase the Group’s balance sheet assets and reserves, any such amount is not recognised for the
purposes of determining CET1 capital. However, an IAS 19 deficit, which increases balance sheet liabilities and reduces reserves, is recognised for
regulatory capital purposes, and so will decrease CET1 capital.
• Pillar 2A capital – the Group is also required to determine the level of capital required to be held under Pillar 2A for pension obligation risk as part of
the annual ICAAP process. This requirement forms part of the Group’s regulatory Total Capital Requirement.
Within the Scheme itself, risk arises because the assets (e.g. equities, bonds/gilts, property) are exposed to market valuation movements, within and
between asset classes, while the liabilities are more sensitive to interest rate and inflation rate changes, and changes in other actuarial assumptions which
may not be borne out in experience, for example life expectancy.
Mitigation
The Trustee and Group have a common view of the Scheme’s long-term strategic aims, encapsulated by an agreed de-risking journey plan. Within the
journey plan, several core principles have been established, including a long-term self-sufficiency funding target (i.e. the point in time when the Scheme
would no longer need to call on the Bank for additional funding) with assumptions as to how this target is expected to be managed, monitored and met.
Potential actions to address deviations in the actual funding level relative to the journey plan have also been considered.
Several other activities have been implemented by the Group and Trustee with the specific aim of reducing risk in the Scheme, including equity options
which reduce the downside risk of a fall in equity values, increasing the levels of inflation, interest rate hedging and several member benefit reforms,
culminating in closure to future accrual for most members.
In addition, the Group has signed a contingent security arrangement to give the Trustee a degree of protection against the risk of the Group defaulting on
its obligations under the Recovery Plan and to provide an additional amount to partially mitigate adverse changes impacting the Scheme’s assets o r
liabilities. Further information is shown within note 3.10 to the Group’s consolidated financial statements.
The Bank and the Trustee continue to explore other cost-effective options to further reduce risk within the Scheme.
Monitoring
Information on the Scheme’s current valuations, asset holdings and discount and inflation rate assumptions are presented monthly to ALCO. The impact
of the Scheme on the Group is also subject to risk oversight from the Risk function. In addition, semi-annual pension risk updates are provided to the
Executive and Board Risk Committees.
Performance of the Scheme’s asset portfolio against the various risk metrics is independently monitored by the Scheme investment adviser, Willis Towers
Watson, and reported to the Investment Sub Committee (ISC), which includes Group representation, and Trustee Board on a quart erly basis.

69
Directors’ responsibility statement in respect of the Annual Report & Accounts The responsibility statement below has been prepared in connection with the Company’s full Annual Report & Accounts for the year ending 30 September
2020. Certain parts thereof are not included within this announcement.
The Directors confirm that to the best of their knowledge:
• the financial statements, prepared in accordance with the applicable set of accounting standards, give a true and fair view o f the assets, liabilities,
financial position and profit or loss of the Company and the Group and the undertakings included in the consolidation taken as a whole; and
• the Strategic report includes a fair review of the development and performance of the business and the position of the Company and the Group,
together with a description of the principal risks and uncertainties that they face.
The Directors consider the Annual Report & Accounts, taken as a whole, is fair, balanced and understandable and provides the information necessary for
shareholders to assess the Company’s and Group’s position and performance, business model and strategy.
David Duffy
Chief Executive Officer
24 November 2020
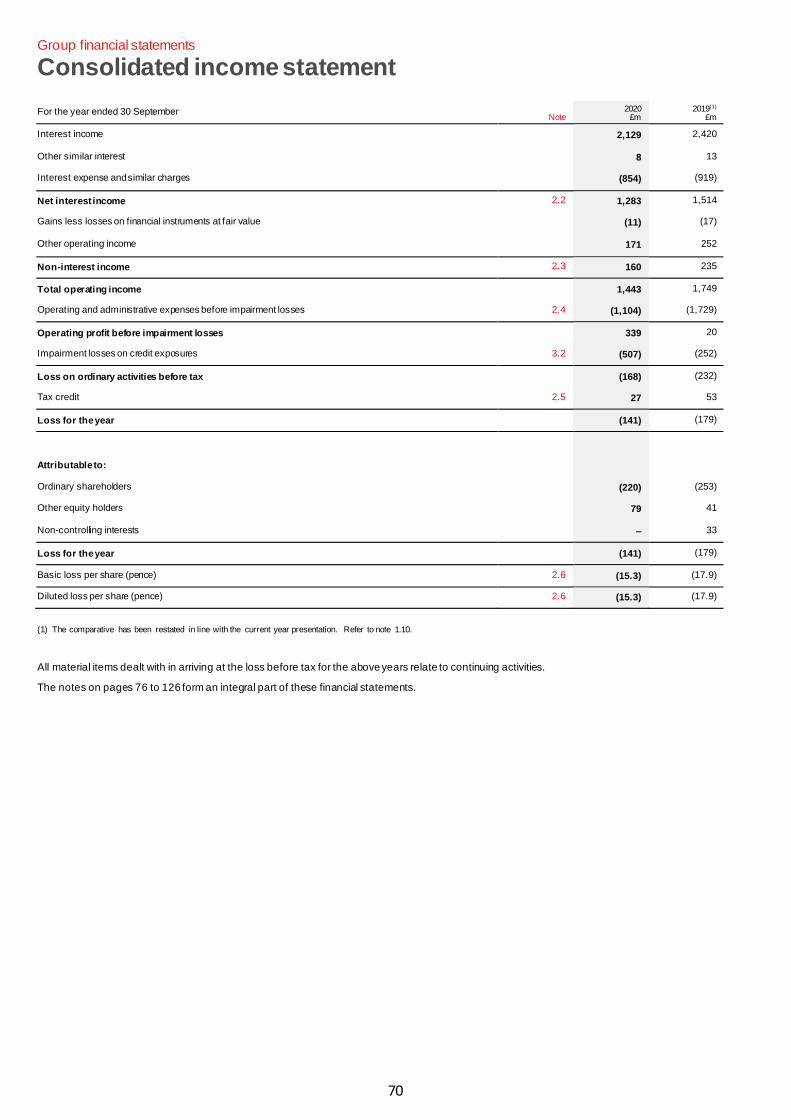
70
Group financial statements
Consolidated income statement
For the year ended 30 September Note
2020 £m
2019(1) £m
Interest income 2,129 2,420
Other similar interest 8 13
Interest expense and similar charges (854) (919)
Net interest income 2.2 1,283 1,514
Gains less losses on financial instruments at fair value (11) (17)
Other operating income 171 252
Non-interest income 2.3 160 235
Total operating income 1,443 1,749
Operating and administrative expenses before impairment losses 2.4 (1,104) (1,729)
Operating profit before impairment losses 339 20
Impairment losses on credit exposures 3.2 (507) (252)
Loss on ordinary activities before tax (168) (232)
Tax credit 2.5 27 53
Loss for the year (141) (179)
Attributable to:
Ordinary shareholders (220) (253)
Other equity holders 79 41
Non-controlling interests – 33
Loss for the year (141) (179)
Basic loss per share (pence) 2.6 (15.3) (17.9)
Diluted loss per share (pence) 2.6 (15.3) (17.9)
(1) The comparative has been restated in line with the current year presentation. Refer to note 1.10.
All material items dealt with in arriving at the loss before tax for the above years relate to continuing activities.
The notes on pages 76 to 126 form an integral part of these financial statements.
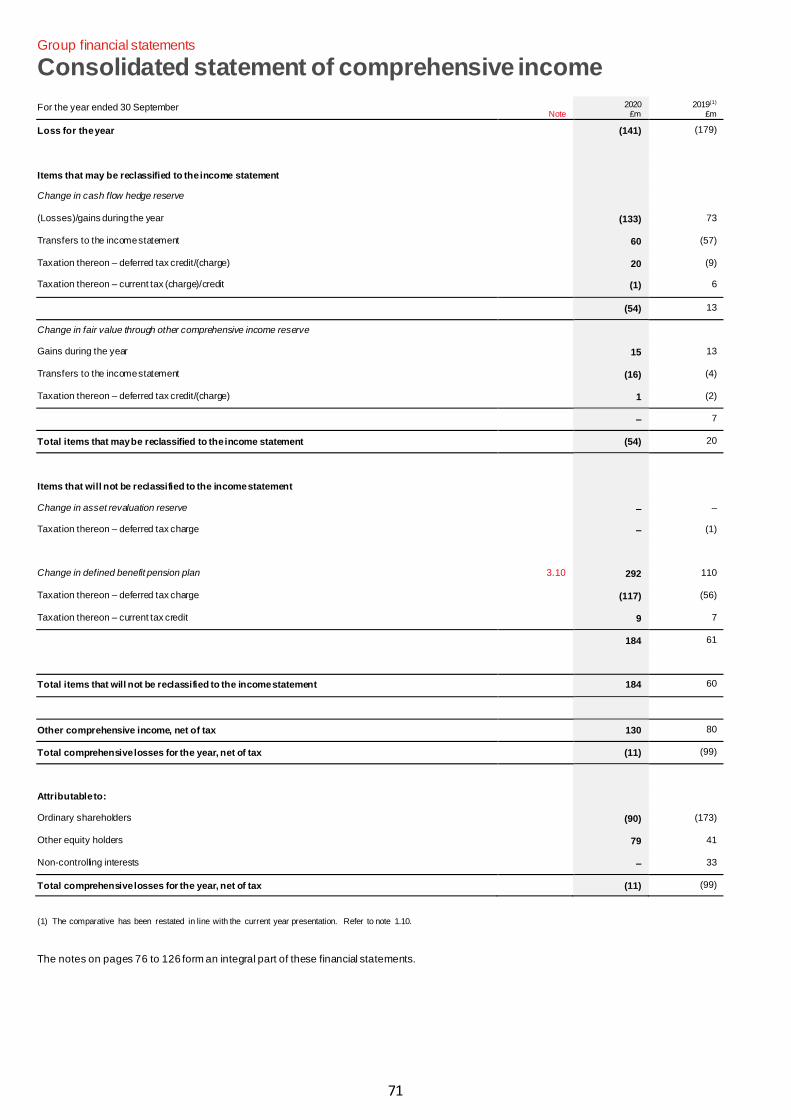
71
Group financial statements
Consolidated statement of comprehensive income
For the year ended 30 September Note
2020 £m
2019(1) £m
Loss for the year (141) (179)
Items that may be reclassified to the income statement Change in cash flow hedge reserve (Losses)/gains during the year (133) 73
Transfers to the income statement 60 (57)
Taxation thereon – deferred tax credit/(charge) 20 (9)
Taxation thereon – current tax (charge)/credit (1) 6
(54) 13
Change in fair value through other comprehensive income reserve Gains during the year 15 13
Transfers to the income statement (16) (4)
Taxation thereon – deferred tax credit/(charge) 1 (2)
– 7
Total items that may be reclassified to the income statement (54) 20
Items that will not be reclassified to the income statement
Change in asset revaluation reserve – –
Taxation thereon – deferred tax charge – (1)
Change in defined benefit pension plan 3.10 292 110
Taxation thereon – deferred tax charge (117) (56)
Taxation thereon – current tax credit 9 7
184 61
Total items that will not be reclassified to the income statement 184 60
Other comprehensive income, net of tax 130 80
Total comprehensive losses for the year, net of tax (11) (99)
Attributable to: Ordinary shareholders (90) (173)
Other equity holders 79 41
Non-controlling interests – 33
Total comprehensive losses for the year, net of tax (11) (99)
(1) The comparative has been restated in line with the current year presentation. Refer to note 1.10.
The notes on pages 76 to 126 form an integral part of these financial statements.
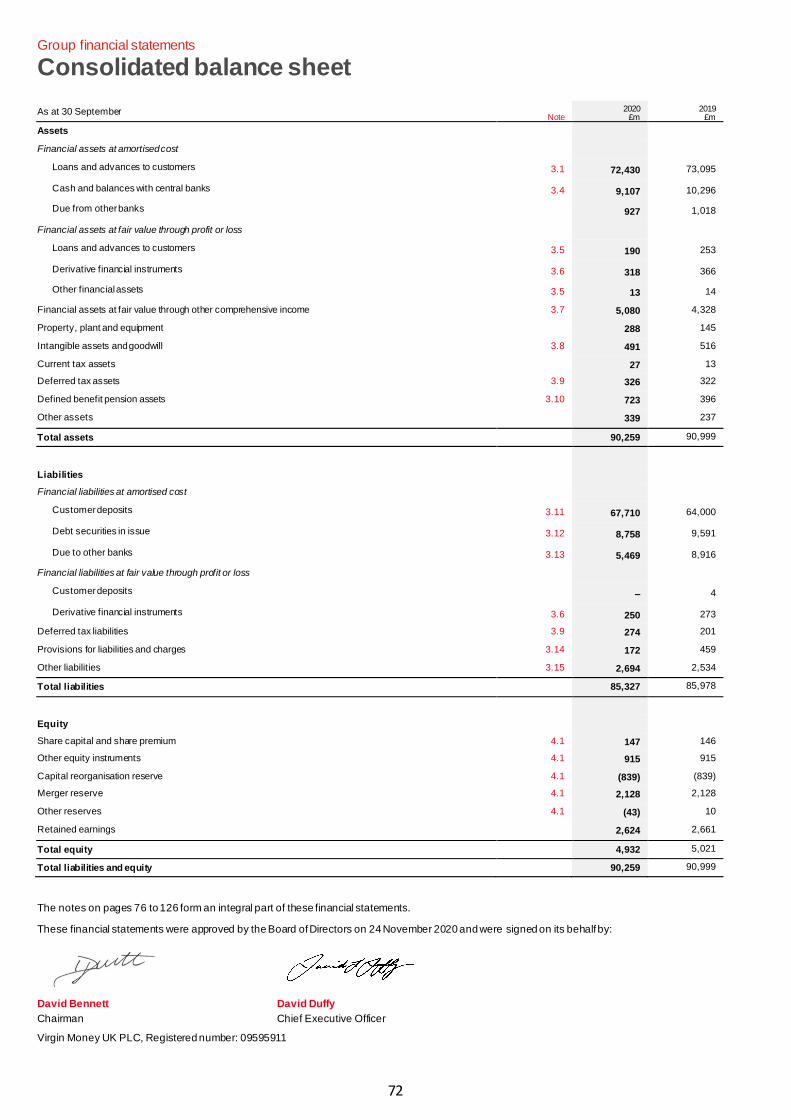
72
Group financial statements
Consolidated balance sheet
As at 30 September Note
2020 £m
2019 £m
Assets Financial assets at amortised cost
Loans and advances to customers 3.1 72,430 73,095
Cash and balances with central banks 3.4 9,107 10,296
Due from other banks 927 1,018
Financial assets at fair value through profit or loss Loans and advances to customers 3.5 190 253
Derivative financial instruments 3.6 318 366
Other financial assets 3.5 13 14
Financial assets at fair value through other comprehensive income 3.7 5,080 4,328
Property, plant and equipment 288 145
Intangible assets and goodwill 3.8 491 516
Current tax assets 27 13
Deferred tax assets 3.9 326 322
Defined benefit pension assets 3.10 723 396
Other assets 339 237
Total assets 90,259 90,999
Liabilities Financial liabilities at amortised cost
Customer deposits 3.11 67,710 64,000
Debt securities in issue 3.12 8,758 9,591
Due to other banks 3.13 5,469 8,916
Financial liabilities at fair value through profit or loss Customer deposits – 4
Derivative financial instruments 3.6 250 273
Deferred tax liabilities 3.9 274 201
Provisions for liabilities and charges 3.14 172 459
Other liabilities 3.15 2,694 2,534
Total liabilities 85,327 85,978
Equity Share capital and share premium 4.1 147 146
Other equity instruments 4.1 915 915
Capital reorganisation reserve 4.1 (839) (839)
Merger reserve 4.1 2,128 2,128
Other reserves 4.1 (43) 10
Retained earnings 2,624 2,661
Total equity 4,932 5,021
Total liabilities and equity 90,259 90,999
The notes on pages 76 to 126 form an integral part of these financial statements.
These financial statements were approved by the Board of Directors on 24 November 2020 and were signed on its behalf by:
David Bennett David Duffy
Chairman Chief Executive Officer
Virgin Money UK PLC, Registered number: 09595911
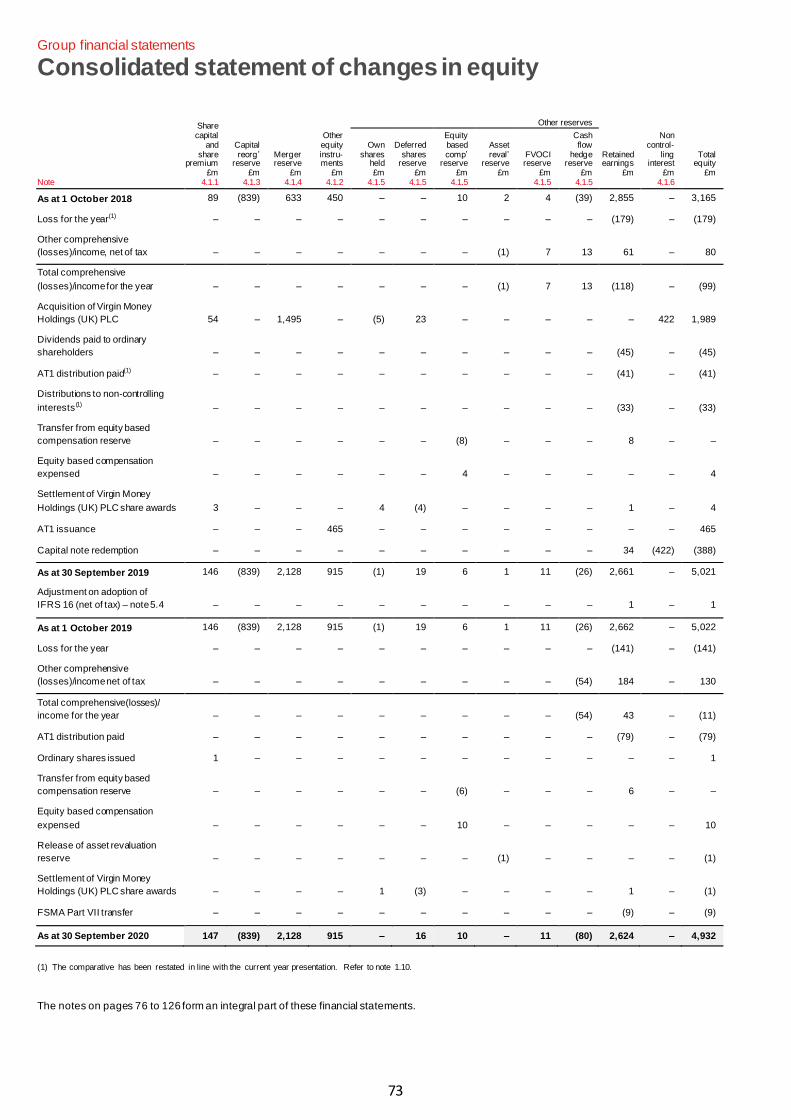
73
Group financial statements
Consolidated statement of changes in equity
Note
Share capital
and share
premium £m
4.1.1
Capital reorg’
reserve £m
4.1.3
Merger reserve
£m 4.1.4
Other equity instru- ments
£m 4.1.2
Other reserves
Retained earnings
£m
Non control-
ling interest
£m 4.1.6
Total equity
£m
Own shares
held £m
4.1.5
Deferred shares
reserve £m
4.1.5
Equity based comp’
reserve £m
4.1.5
Asset reval’
reserve £m
FVOCI reserve
£m 4.1.5
Cash flow
hedge reserve
£m 4.1.5
As at 1 October 2018 89 (839) 633 450 – – 10 2 4 (39) 2,855 – 3,165
Loss for the year(1) – – – – – – – – – – (179) – (179)
Other comprehensive
(losses)/income, net of tax – – – – – – – (1) 7 13 61 – 80
Total comprehensive
(losses)/income for the year – – – – – – – (1) 7 13 (118) – (99)
Acquisition of Virgin Money
Holdings (UK) PLC 54 – 1,495 – (5) 23 – – – – – 422 1,989
Dividends paid to ordinary
shareholders – – – – – – – – – – (45) – (45)
AT1 distribution paid(1) – – – – – – – – – – (41) – (41)
Distributions to non-controlling
interests(1) – – – – – – – – – – (33) – (33)
Transfer from equity based
compensation reserve – – – – – – (8) – – – 8 – –
Equity based compensation
expensed – – – – – – 4 – – – – – 4
Settlement of Virgin Money
Holdings (UK) PLC share awards 3 – – – 4 (4) – – – – 1 – 4
AT1 issuance – – – 465 – – – – – – – – 465
Capital note redemption – – – – – – – – – – 34 (422) (388)
As at 30 September 2019 146 (839) 2,128 915 (1) 19 6 1 11 (26) 2,661 – 5,021
Adjustment on adoption of
IFRS 16 (net of tax) – note 5.4 – – – – – – – – – – 1 – 1
As at 1 October 2019 146 (839) 2,128 915 (1) 19 6 1 11 (26) 2,662 – 5,022
Loss for the year – – – – – – – – – – (141) – (141)
Other comprehensive
(losses)/income net of tax – – – – – – – – – (54) 184 – 130
Total comprehensive(losses)/
income for the year – – – – – – – – – (54) 43 – (11)
AT1 distribution paid – – – – – – – – – – (79) – (79)
Ordinary shares issued 1 – – – – – – – – – – – 1
Transfer from equity based
compensation reserve – – – – – – (6) – – – 6 – –
Equity based compensation
expensed – – – – – – 10 – – – – – 10
Release of asset revaluation
reserve – – – – – – – (1) – – – – (1)
Settlement of Virgin Money
Holdings (UK) PLC share awards – – – – 1 (3) – – – – 1 – (1)
FSMA Part VII transfer – – – – – – – – – – (9) – (9)
As at 30 September 2020 147 (839) 2,128 915 – 16 10 – 11 (80) 2,624 – 4,932
(1) The comparative has been restated in line with the current year presentation. Refer to note 1.10.
The notes on pages 76 to 126 form an integral part of these financial statements.
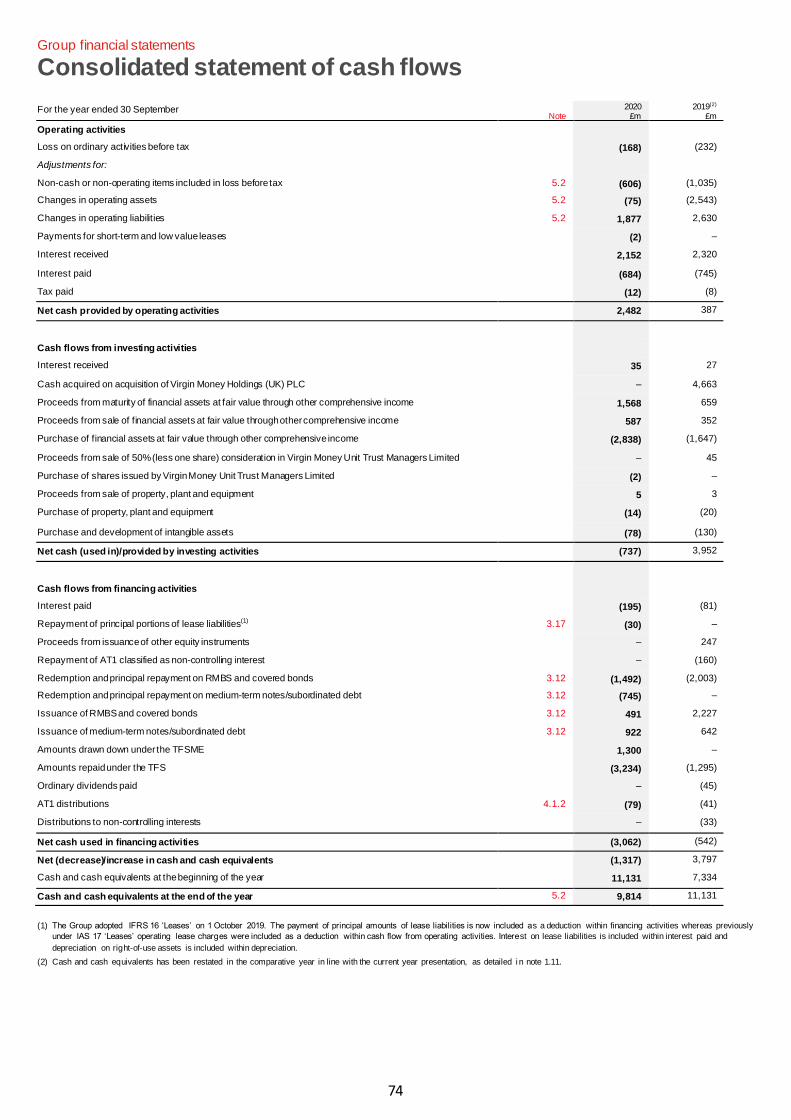
74
Group financial statements
Consolidated statement of cash flows
For the year ended 30 September Note
2020 £m
2019(2) £m
Operating activities Loss on ordinary activities before tax (168) (232)
Adjustments for: Non-cash or non-operating items included in loss before tax 5.2 (606) (1,035)
Changes in operating assets 5.2 (75) (2,543)
Changes in operating liabilities 5.2 1,877 2,630
Payments for short-term and low value leases (2) –
Interest received 2,152 2,320
Interest paid (684) (745)
Tax paid (12) (8)
Net cash provided by operating activities 2,482 387
Cash flows from investing activities Interest received 35 27
Cash acquired on acquisition of Virgin Money Holdings (UK) PLC – 4,663
Proceeds from maturity of financial assets at fair value through other comprehensive income 1,568 659
Proceeds from sale of financial assets at fair value through other comprehensive income 587 352
Purchase of financial assets at fair value through other comprehensive income (2,838) (1,647)
Proceeds from sale of 50% (less one share) consideration in Virgin Money Unit Trust Managers Limited – 45
Purchase of shares issued by Virgin Money Unit Trust Managers Limited (2) –
Proceeds from sale of property, plant and equipment 5 3
Purchase of property, plant and equipment (14) (20)
Purchase and development of intangible assets (78) (130)
Net cash (used in)/provided by investing activities (737) 3,952
Cash flows from financing activities Interest paid (195) (81)
Repayment of principal portions of lease liabilities(1) 3.17 (30) –
Proceeds from issuance of other equity instruments – 247
Repayment of AT1 classified as non-controlling interest – (160)
Redemption and principal repayment on RMBS and covered bonds 3.12 (1,492) (2,003)
Redemption and principal repayment on medium-term notes/subordinated debt 3.12 (745) –
Issuance of RMBS and covered bonds 3.12 491 2,227
Issuance of medium-term notes/subordinated debt 3.12 922 642
Amounts drawn down under the TFSME 1,300 –
Amounts repaid under the TFS (3,234) (1,295)
Ordinary dividends paid – (45)
AT1 distributions 4.1.2 (79) (41)
Distributions to non-controlling interests – (33)
Net cash used in financing activities (3,062) (542)
Net (decrease)/increase in cash and cash equivalents (1,317) 3,797
Cash and cash equivalents at the beginning of the year 11,131 7,334
Cash and cash equivalents at the end of the year 5.2 9,814 11,131
(1) The Group adopted IFRS 16 ‘Leases’ on 1 October 2019. The payment of principal amounts of lease liabilities is now included as a deduction within financing activities whereas previously
under IAS 17 ‘Leases’ operating lease charges were included as a deduction within cash flow from operating activities. Interest on lease liabilities is included within interest paid and
depreciation on right-of-use assets is included within depreciation.
(2) Cash and cash equivalents has been restated in the comparative year in line with the current year presentation, as detailed i n note 1.11.
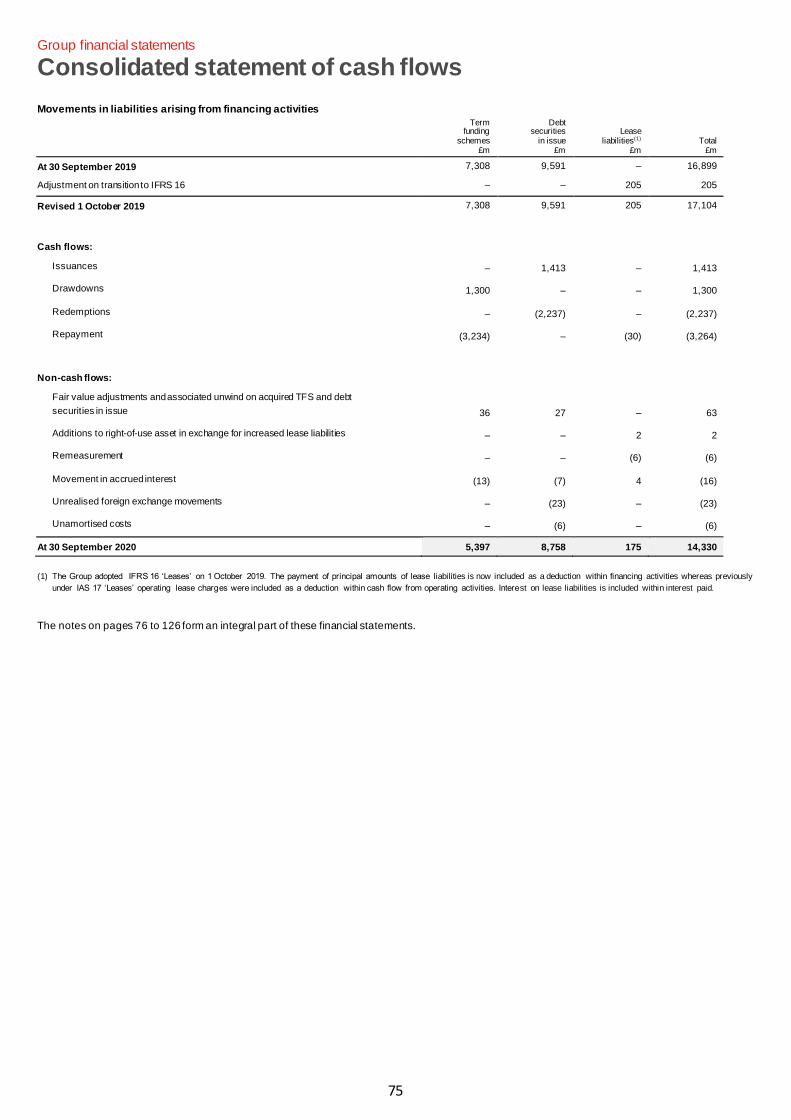
75
Group financial statements
Consolidated statement of cash flows
Movements in liabilities arising from financing activities
Term funding
schemes £m
Debt securities
in issue £m
Lease liabilities(1)
£m Total
£m
At 30 September 2019 7,308 9,591 – 16,899
Adjustment on transition to IFRS 16 – – 205 205
Revised 1 October 2019 7,308 9,591 205 17,104
Cash flows:
Issuances – 1,413 – 1,413
Drawdowns 1,300 – – 1,300
Redemptions – (2,237) – (2,237)
Repayment (3,234) – (30) (3,264)
Non-cash flows:
Fair value adjustments and associated unwind on acquired TFS and debt
securities in issue 36 27 – 63
Additions to right-of-use asset in exchange for increased lease liabilities – – 2 2
Remeasurement – – (6) (6)
Movement in accrued interest (13) (7) 4 (16)
Unrealised foreign exchange movements – (23) – (23)
Unamortised costs – (6) – (6)
At 30 September 2020 5,397 8,758 175 14,330
(1) The Group adopted IFRS 16 ‘Leases’ on 1 October 2019. The payment of principal amounts of lease liabilities is now included as a deduction within financing activities whereas previously
under IAS 17 ‘Leases’ operating lease charges were included as a deduction within cash flow from operating activities. Interest on lease liabilities is included within interest paid.
The notes on pages 76 to 126 form an integral part of these financial statements.
76
Group financial statements
Notes to the consolidated financial statements Section 1: Basis of preparation
Overview
This section sets out the Group’s accounting policies that relate to the consolidated financial statements as a whole. Where an accounting policy
is specific to one note, the policy is described in the note to which it relates. This section also shows new accounting stan dards, amendments
and interpretations which are relevant to the Group, and whether they are effective in 2020 or later years. We explain how th ese changes are
expected to impact the financial position and performance of the Group.
The Group has adopted the UK Finance Code for Financial Reporting Disclosure and has prepared the 2020 Annual Report & Accounts in
compliance with the Code.
1.1 General information
The Company is a public company limited by shares, incorporated in the United Kingdom under the Companies Act and registered in England and Wales.
The consolidated financial statements comprise those of the Company and its controlled entities, together the ‘Group’.
1.2 Basis of accounting
The consolidated financial statements have been prepared in accordance with IFRS as adopted by the EU and in accordance with the provisions of the
Companies Act 2006.
The financial information has been prepared under the historical cost convention, as modified by the revaluation of certain f inancial assets and liabilities at
fair value through profit or loss and other comprehensive income. Fair value is defined as the price that would be received to sell an asset or paid to
transfer a liability in an orderly transaction between market participants at the measurement date.
1.3 Presentation of risk, offsetting and maturity disclosures
Certain disclosures required under IFRS 7 ‘Financial instruments: disclosures’ and IAS 1 ‘Presentation of financial statements’ have been included within
the audited sections of the Risk report. Where information is marked as audited, it is incorporated into these financial statements by this cross reference
and it is covered by the Independent auditor’s report.
1.4 Going concern
The Group’s business activities, together with the factors likely to affect its future development, performance and position, are set out in the Strategic
report contained in the Group's Annual Report & Accounts. In addition, the Risk report includes the Group’s risk management objectives and the Group’s
objectives, policies and processes for managing its capital.
In assessing the Group’s going concern position as at 30 September 2020, the Directors have considered a number of factors, including the current
balance sheet position, the Group’s strategic and financial plan, taking account of possible changes in trading performance and funding retention, and
stress testing and scenario analysis. The assessment concluded that, for the foreseeable future, the Group has sufficient capital and liquidity for the next
12 months. The Group’s capital ratios and its total capital resources are comfortably in excess of PRA requirements and internal stress test ing indicates
the Group can withstand severe economic and competitive stresses. The Group’s MREL ratio at 30 September 2020 comfor tably exceeds its interim
MREL requirements and is in line with its expected end-state MREL requirements. This means future MREL issuance is focused on building a prudent
management buffer over the expected end-state MREL minimum requirement.
As a result of the assessment, the Directors have a reasonable expectation that the Company and the Group have adequate resources to continue in
operational existence for the foreseeable future and therefore believe that the Group is well placed to manage its business risks successfully. Accordingly,
they continue to adopt the going concern basis in preparing the consolidated financial statements.
1.5 Basis of consolidation
Controlled entities are all entities (including structured entities) to which the Company is expo sed, or has rights, to variable returns from its involvement
with the entity and has the ability to affect those returns through its power over the entity. An assessment of control is pe rformed on an ongoing basis.
Controlled entities are consolidated from the date on which control is established by the Group until the date that control ceases. The acquisition method of
accounting is used to account for business combinations other than those under common control. A non‑controlling interest is recognised by the Group in
respect of any portion of the total assets less total liabilities of an acquired entity or entities that is not owned by the Group. Balances and transactions
between entities within the Group and any unrealised gains and losses arising from those transactions are eliminated in full upon consolidation.
The Group’s interests in JV entities are accounted for using the equity method and then assessed for impairment in the relevant holding companies’
financial statements.
The consolidated financial statements have been prepared using uniform accounting policies.
77
Group financial statements
Notes to the consolidated financial statements Section 1: Basis of preparation
1.6 Foreign currency
Functional and presentation currency
Items included in the financial statements of each of the Group’s entities are measured using the currency of the primary economic environment in which
the entity operates, the ‘functional currency’. The consolidated financial statements are presented in pounds sterling (GBP), which is also the Group’s
presentation currency, rounded to the nearest million pounds sterling (£m) unless otherwise stated.
Transactions and balances
The Group records an asset, liability, expense or revenue arising from a transaction using the closing e xchange rate between the functional and foreign
currency on the transaction date. At each subsequent reporting date, the Group translates foreign currency monetary items at the closing rate. Foreign
exchange differences arising on translation or settlement of monetary items are recognised in the income statement during the year in which the gains or
losses arise.
Foreign currency non-monetary items measured at historical cost are translated at the date of the transaction, with those measured at fair value t ranslated
at the date when the fair value is determined. Foreign exchange differences are recognised directly in equity for non-monetary items where any
component of associated gains or losses is recognised directly in equity. Foreign exchange differences arising from non-monetary items, whereby the
associated gains or losses are recognised in the income statement, are also recognised in the income statement.
1.7 Financial assets and liabilities
Recognition and derecognition
A financial asset or a financial liability is recognised on the balance sheet when the Group becomes party to the contractual provisions of the instrument.
Purchases and sales of financial assets classified within FVTPL or FVOCI are recognised on trade date.
The Group derecognises a financial asset when the contractual cash flows from the asset expire or it transfers the right to receive contractual cash flows
on the financial asset in a transaction in which substantially all the risks and rewards of ownership are transferred. Financial liabilities are derecognised
when the Group has discharged its obligation to the contract, or the contract is cancelled or expires.
Classification and measurement
The Group measures a financial asset or liability on initial recognition at its fair value, plus or minus transaction costs that are directly attributable to the
acquisition or issue of the financial asset or the financial liability (with the exception of financial assets or liabilities at FVTPL, where transaction costs are
recognised directly in the income statement as they are incurred).
Financial assets
Subsequent accounting for a financial asset is determined by the classification of the asset depending on the underlying business model and contractual
cash flow characteristics. This results in classification within one of the following categories: i) amortised cost; ii) FVTPL; or iii) FVOCI.
A financial asset is measured at amortised cost when: (1) the asset is held within a business model whose objective is achieved by collecting contractual
cash flows; and (2) the contractual terms give rise to cash flows on specified dates which are solely payments of principal a nd interest on the principal
amount outstanding. The amortised cost classification applies to the Group’s loans and advances to customers (note 3.1), cash and balances from central
banks (note 3.4) and balances due from other banks. Financial assets classified at amortised cost are subject to ECL requirements as detailed in note 3.2.
The accounting policies for financial assets at FVTPL and FVOCI are detailed in notes 3.5 and 3.7 respectively.
Financial liabilities
All financial liabilities are measured at amortised cost, except for financial liabilities at FVTPL. Such liabilities include derivatives (other than derivatives
that are financial guarantee contracts or are designated and effective hedging instruments) and liabilities designated at FVTPL on initial recognition.
Offsetting
This can only occur, and the net amount be presented on the balance sheet, when the Group current ly has a legally enforceable right to offset the
recognised amounts and intends either to settle on a net basis, or to realise the asset and settle the liability simultaneous ly.
1.8 Property, plant and equipment
The Group’s property, plant and equipment is carried at cost, less accumulated depreciation and impairment losses. Cost includes expenditure that is
directly attributable to acquisition of the asset. Impairment is assessed whenever events or changes in circumstances indicat e that the carrying amount
may not be recoverable.
All items of property, plant and equipment are depreciated or amortised using the straight line method, at rates appropriate to their estimated useful life to
the Group. The annual rates of depreciation or amortisation are:
Buildings 50 years
Leases (leasehold improvements) the lower of the expected lease term or the asset’s remaining useful life
Fixtures and equipment 3–10 years
Residual values and useful lives of assets are reviewed at each reporting date. Depreciation is recognised within operating expenses in the income
statement.
The Group previously held freehold and long-term leasehold land and buildings at fair value as highlighted in note 1.11.
78
Group financial statements
Notes to the consolidated financial statements Section 1: Basis of preparation
1.9 Critical accounting estimates and judgements
The preparation of financial statements requires the use of certain critical accounting estimates and judgements that affect the reported amounts of assets,
liabilities, revenues and expenses and the disclosed amount of contingent liabilities. Actual results may differ from those o n which management’s
estimates are based. Estimates and assumptions are continually evaluated and are based on historical e xperience and other factors, including
expectations of future events that are believed to be reasonable. Estimates which are based on future economic conditions, and sensitive to changes in
those conditions, have been impacted by COVID-19. This estimation impact has primarily been in the measurement of ECL, EIR and assessing the
recoverability of deferred tax balances. Actual results may differ materially from these estimates.
The Group considers the most significant use of accounting estimates and judgemen ts relate to the following areas:
• impairment provisions on credit exposures (note 3.2);
• EIR (note 2.2);
• deferred tax (note 3.9);
• PPI redress provision and other conduct related matters (note 3.14); and
• retirement benefit obligations (note 3.10).
1.10 New accounting standards and interpretations
The Group has adopted a number of International Accounting Standards Board (IASB) pronouncements in the current financial yea r.
IFRS 16 ‘Leases’
IFRS 16 ‘Leases’ is effective for financial periods beginning on or after 1 January 2019 and replaces IAS 17 ‘Leases’, IFRIC 4 ‘Determining whether an
Arrangement contains a Lease,’ SIC-15 ‘Operating Leases ‑ Incentives’ and SIC-27 ‘Evaluating the Substance of Transactions Involving the Legal Form of
a Lease.’
IFRS 16 sets out the principles for the recognition, measurement, presentation and disclosure of leases. The Group’s accounting as a lessor
is substantially unchanged from the previous approach under IAS 17; however, IFRS 16 resulted in most leases where the Group is a lessee being
brought on to the balance sheet under a single lease model, removing the distinction between finance and operating leases. IFRS 16 requires a lessee to
recognise a ‘right‑of‑use’ asset and a corresponding lease liability at the date on which the leased asset is available for use. Assets and liabilities arising
from a lease are initially measured on a present value basis. The accounting policy for leases (note 3.17) has been revised.
As permitted by the new standard, the Group has implemented IFRS 16 using the ‘modified retrospective’ approach and recognised the cumulative impact
of transition as an adjustment through retained earnings. Therefore, the comparative information has not been restated and is presented, as previously
reported, under IAS 17 and related interpretations. Adoption of the new standard has had a material impact on the Group’s financial statements , with right-
of-use assets of £194m recognised on transition together with lease liabilities of £205m. As at 30 September 2020 the right-of-use assets and lease
liabilities were £162m and £175m respectively. The right-of-use assets are presented in property, plant and equipment and the liabilities are presented in
other liabilities. Further detail on the transitional impact of IFRS 16 can be found in note 5.4.
Interest Rate Benchmark Reform (Amendments to IFRS 9, IAS 39 and IFRS 7)
Amendments to IFRS 9, IAS 39 and IFRS 7 were issued in September 2019. The amendments are effective for financial years beginning on or after 1
January 2020 (with early adoption permitted) and were endorsed for use in the EU in January 2020. The amendments provide temporary relie fs which
enable hedge accounting to continue during the period of uncertainty before the hedged items or hedging instruments affect ed by the current interest rate
benchmarks are amended as a result of the ongoing interest rate benchmark reforms.
The Group exercised the accounting policy choice to continue hedge accounting under IAS 39 on adoption of IFRS 9 in October 2 018. The Group has
also early adopted the amendments and related disclosure requirements relating to IAS 39 and IFRS 7 with effect from 1 Octobe r 2019. Adopting these
amendments allows the Group to continue hedge accounting during the period of uncertainty arising from interest rate benchmark reforms. Further detail
is provided in note 3.6.
79
Group financial statements
Notes to the consolidated financial statements Section 1: Basis of preparation
1.10 New accounting standards and interpretations continued
Other accounting standards and interpretations
Except where otherwise stated, the following IASB pronouncements did not have a material impact on the Group’s consolidated f inancial statements:
• IFRIC interpretation 23: ‘Uncertainty over Income Tax Treatments’ issued in June 2017 and effective for financial years beginning on or after 1
January 2019. The new interpretation applies to any situation in which there is uncertainty as to whether an income tax treat ment is acceptable under
tax law and is not limited to actual ongoing disputes;
• ‘Annual Improvements to IFRS Standards 2015-2017 Cycle’, issued December 2017 and effective for financial years beginning on or after 1 January
2019. The IASB has made amendments to the following standards: IFRS 3 ‘Business Combina tions’; IFRS 11 ‘Joint Arrangements’; IAS 12 ‘Income
Taxes’; and IAS 32 ‘Borrowing Costs’. The amendment to IAS 12 clarifies that the income tax consequences of distributions on financial instruments
classified as equity should be recognised alongside the past transactions or events that generated the distributable profits. This means that the
taxation impacts of distributions relating to AT1 securities and non-controlling interests are now recognised within tax expense in the income
statement as opposed to being recognised directly in retained earnings within equity. The amendment impacts only the presentation of the related
taxation and not the calculation, with no change to the Group’s net assets but an increase in profit attributable to equity o wners. Comparatives have
been restated. The adoption of this amendment has resulted in a reduction in tax expense and an increase in profit for the year of £15m (12 months
to 30 September 2019: £15m) for the Group and a reduction in tax expense and an increase in p rofit for the year of £15m (12 months to 30
September 2019: £8m) for the Company;
• amendment to IAS 19: ‘Plan amendment, curtailment or settlement’ issued in February 2018 and effective prospectively for fina ncial years beginning
on or after 1 January 2019. The amendments clarify that after a plan event companies should use these updated assumptions to measure current
service cost and net interest for the remainder of the reporting period; and
• amendment to IAS 28: ‘Long-term Interests in Associates and Joint Ventures’ issued in October 2017 and effective for financial years beginning on or
after 1 January 2019. The amendment clarifies that an entity applies IFRS 9 to long -term interests in an associate or JV to which the equity method is
not applied but that, in substance, form part of the net investment in the associate or JV (long-term interests).
New accounting standards and interpretations not yet adopted
Interest Rate Benchmark Reform – Phase 2 (Amendments to IFRS 9, IAS 39, IFRS 7, IFRS 4 and IFRS 16)
Following completion of the second part of the IASB’s two -phased project, amendments were issued in August 2020 and are effective for financial years
beginning on or after 1 January 2021. The amendments have not yet been endorsed for use by the EU and theref ore have not been adopted by the
Group.
The amendments address issues that might affect financial reporting as a result of the reform of an interest rate benchmark, including the effects of
changes to contractual cash flows or hedging relationships arising from the replacement of an interest rate benchmark with an alternative benchmark rate.
The amendments provide practical relief from certain requirements in IFRS 9, IAS 39, IFRS 7, IFRS 4 and IFRS 16 relating to:
•changes in the basis for determining contractual cash flows of financial assets, financial liabilities and lease liabilities; and
•hedge accounting.
On application of the amendments, the Group does not expect any impact on amounts reported for 2020 or prior years.
The IASB has issued a number of other minor amendments to IFRSs that are not mandatory for 30 September 2020 reporting years and have not been
early adopted by the Group. These amendments are not expected to have a material impact for the Group.
1.11 Other changes in the year
Freehold and long-term leasehold land and buildings – change in accounting policy
The Group changed its accounting policy with respect to freehold and long-term leasehold land and buildings. The Group now applies the cost model,
where these assets are carried at cost less accumulated depreciation and any accumulated impairment. Prior to this change in policy, freehold and long-
term leasehold land and buildings were recorded at their fair values. The Group concluded that the cost model provides a more reliable and more
meaningful presentation following the adoption of IFRS 16 which introduced a significant property related right -of-use asset, held at cost, on the balance
sheet in the year, and also removed the previous distinction between finance and operating leases. The application of the cost model is also standard
market practice across the UK banking sector. For these reasons the Group determined it should harmonise the measurement basis for all property
related assets to be at cost. This change in accounting policy has not had a material impact on the Group’s balance sheet as there has been no difference
of significance between the fair value and cost value on freehold and long-term leasehold land and buildings for a number of years. The £1m asset
revaluation reserve that existed at 30 September 2019 has been released. Due to the immaterial effect of this change, comparatives have not been
restated.
Cash and cash equivalents – change in definition
During the year, the Group has reassessed the individual elements that comprise ‘cash and cash equivalents’. This has resulted in a revision to the
definition that more closely aligns the Group’s internal use of the cash and cash equivalents definition and cash management practices, with the changes
resulting in an increase to the cash and cash equivalents balance primarily as a result of the inclusion of amounts due from other banks. The revised
definition can be found in the Glossary. Comparative years have been restated to reflect this change in definition, with the balance for the 12 months to 30
September 2019 increasing by £1,012m from £10,119m to £11,131m.
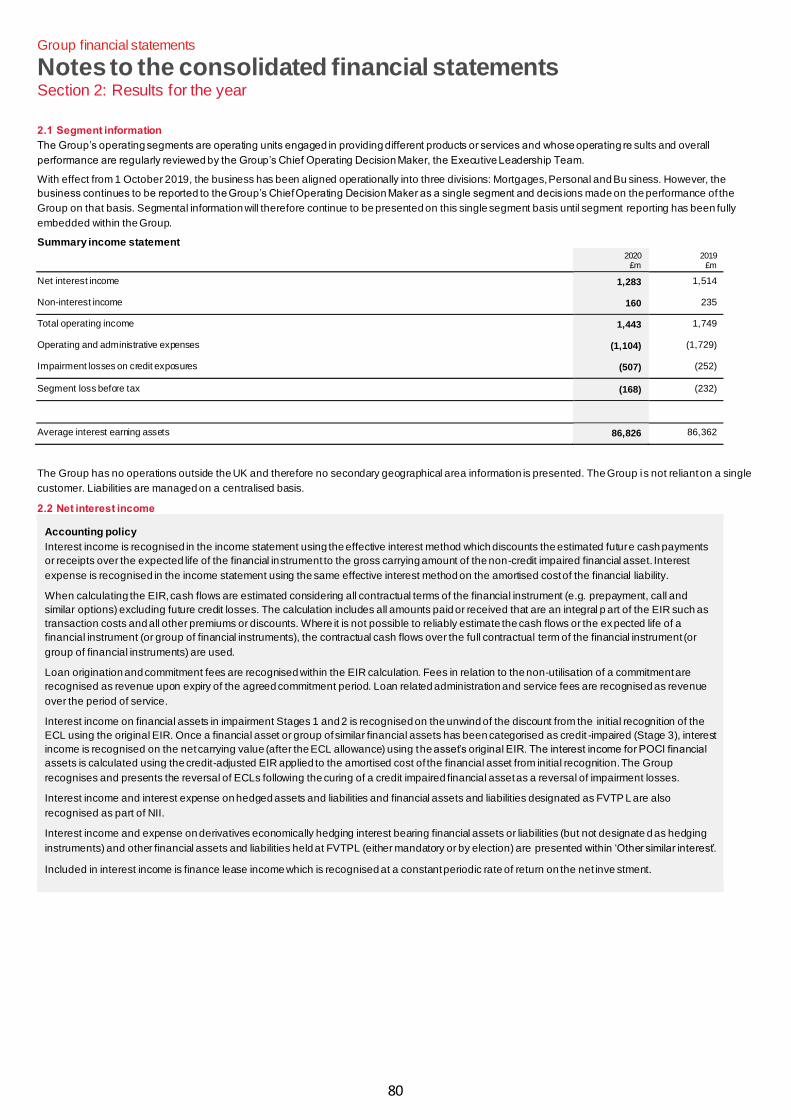
80
Group financial statements
Notes to the consolidated financial statements Section 2: Results for the year
2.1 Segment information
The Group’s operating segments are operating units engaged in providing different products or services and whose operating re sults and overall
performance are regularly reviewed by the Group’s Chief Operating Decision Maker, the Executive Leadership Team.
With effect from 1 October 2019, the business has been aligned operationally into three divisions: Mortgages, Personal and Bu siness. However, the
business continues to be reported to the Group’s Chief Operating Decision Maker as a single segment and decis ions made on the performance of the
Group on that basis. Segmental information will therefore continue to be presented on this single segment basis until segment reporting has been fully
embedded within the Group.
Summary income statement
2020
£m 2019
£m
Net interest income 1,283 1,514
Non-interest income 160 235
Total operating income 1,443 1,749
Operating and administrative expenses (1,104) (1,729)
Impairment losses on credit exposures (507) (252)
Segment loss before tax (168) (232)
Average interest earning assets 86,826 86,362
The Group has no operations outside the UK and therefore no secondary geographical area information is presented. The Group is not reliant on a single
customer. Liabilities are managed on a centralised basis.
2.2 Net interest income
Accounting policy
Interest income is recognised in the income statement using the effective interest method which discounts the estimated future cash payments
or receipts over the expected life of the financial instrument to the gross carrying amount of the non-credit impaired financial asset. Interest
expense is recognised in the income statement using the same effective interest method on the amortised cost of the financial liability.
When calculating the EIR, cash flows are estimated considering all contractual terms of the financial instrument (e.g. prepayment, call and
similar options) excluding future credit losses. The calculation includes all amounts paid or received that are an integral p art of the EIR such as
transaction costs and all other premiums or discounts. Where it is not possible to reliably estimate the cash flows or the expected life of a
financial instrument (or group of financial instruments), the contractual cash flows over the full contractual term of the financial instrument (or
group of financial instruments) are used.
Loan origination and commitment fees are recognised within the EIR calculation. Fees in relation to the non-utilisation of a commitment are
recognised as revenue upon expiry of the agreed commitment period. Loan related administration and service fees are recognised as revenue
over the period of service.
Interest income on financial assets in impairment Stages 1 and 2 is recognised on the unwind of the discount from the initial recognition of the
ECL using the original EIR. Once a financial asset or group of similar financial assets has been categorised as credit -impaired (Stage 3), interest
income is recognised on the net carrying value (after the ECL allowance) using the asset’s original EIR. The interest income for POCI financial
assets is calculated using the credit-adjusted EIR applied to the amortised cost of the financial asset from initial recognition. The Group
recognises and presents the reversal of ECLs following the curing of a credit impaired financial asset as a reversal of impairment losses.
Interest income and interest expense on hedged assets and liabilities and financial assets and liabilities designated as FVTP L are also
recognised as part of NII.
Interest income and expense on derivatives economically hedging interest bearing financial assets or liabilities (but not designate d as hedging
instruments) and other financial assets and liabilities held at FVTPL (either mandatory or by election) are presented within ‘Other similar interest’.
Included in interest income is finance lease income which is recognised at a constant periodic rate of return on the net inve stment.
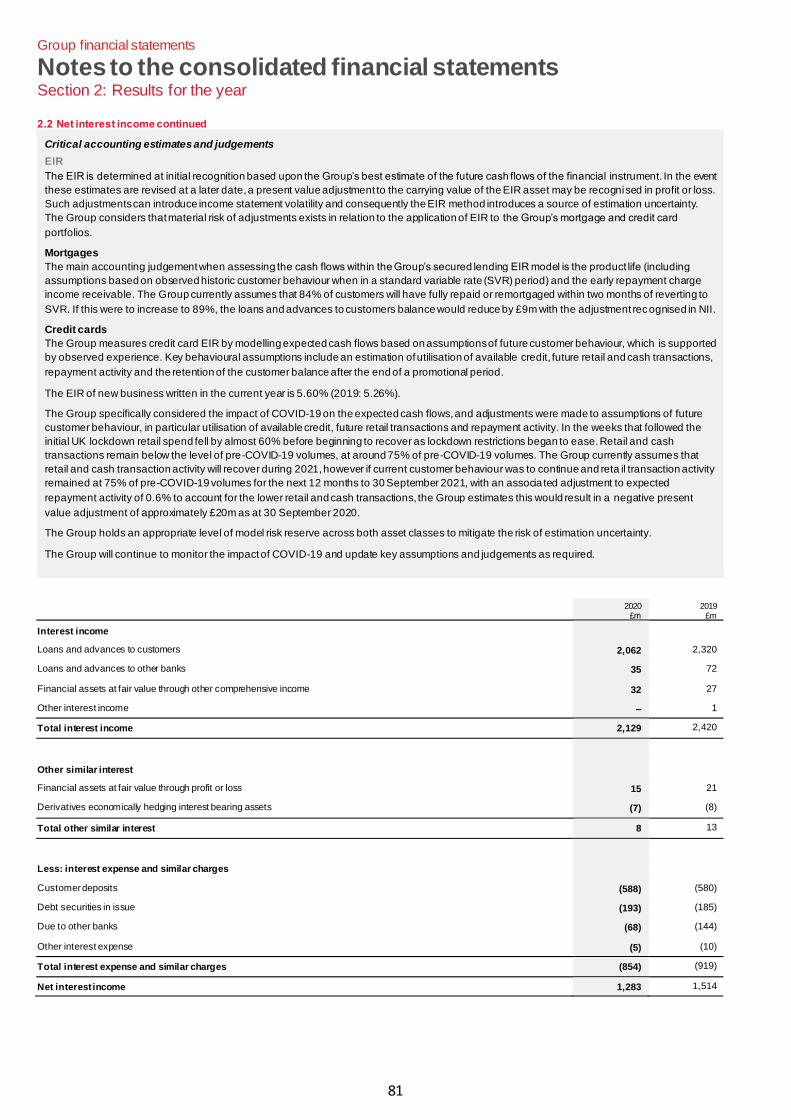
81
Group financial statements
Notes to the consolidated financial statements Section 2: Results for the year
2.2 Net interest income continued
Critical accounting estimates and judgements
EIR
The EIR is determined at initial recognition based upon the Group’s best estimate of the future cash flows of the financial instrument. In the event
these estimates are revised at a later date, a present value adjustment to the carrying value of the EIR asset may be recognised in profit or loss.
Such adjustments can introduce income statement volatility and consequently the EIR method introduces a source of estimation uncertainty.
The Group considers that material risk of adjustments exists in relation to the application of EIR to the Group’s mortgage and credit card
portfolios.
Mortgages
The main accounting judgement when assessing the cash flows within the Group’s secured lending EIR model is the product life (including
assumptions based on observed historic customer behaviour when in a standard variable rate (SVR) period) and the early repayment charge
income receivable. The Group currently assumes that 84% of customers will have fully repaid or remortgaged within two months of reverting to
SVR. If this were to increase to 89%, the loans and advances to customers balance would reduce by £9m with the adjustment recognised in NII.
Credit cards
The Group measures credit card EIR by modelling expected cash flows based on assumptions of future customer behaviour, which is supported
by observed experience. Key behavioural assumptions include an estimation of utilisation of available credit, future retail and cash transactions,
repayment activity and the retention of the customer balance after the end of a promotional period.
The EIR of new business written in the current year is 5.60% (2019: 5.26%).
The Group specifically considered the impact of COVID-19 on the expected cash flows, and adjustments were made to assumptions of future
customer behaviour, in particular utilisation of available credit, future retail transactions and repayment activity. In the weeks that followed the
initial UK lockdown retail spend fell by almost 60% before beginning to recover as lockdown restrictions began to ease. Retail and cash
transactions remain below the level of pre-COVID-19 volumes, at around 75% of pre-COVID-19 volumes. The Group currently assumes that
retail and cash transaction activity will recover during 2021, however if current customer behaviour was to continue and reta il transaction activity
remained at 75% of pre-COVID-19 volumes for the next 12 months to 30 September 2021, with an associa ted adjustment to expected
repayment activity of 0.6% to account for the lower retail and cash transactions, the Group estimates this would result in a negative present
value adjustment of approximately £20m as at 30 September 2020.
The Group holds an appropriate level of model risk reserve across both asset classes to mitigate the risk of estimation uncertainty.
The Group will continue to monitor the impact of COVID-19 and update key assumptions and judgements as required.
2020
£m 2019
£m
Interest income Loans and advances to customers 2,062 2,320
Loans and advances to other banks 35 72
Financial assets at fair value through other comprehensive income 32 27
Other interest income – 1
Total interest income 2,129 2,420
Other similar interest Financial assets at fair value through profit or loss 15 21
Derivatives economically hedging interest bearing assets (7) (8)
Total other similar interest 8 13
Less: interest expense and similar charges Customer deposits (588) (580)
Debt securities in issue (193) (185)
Due to other banks (68) (144)
Other interest expense (5) (10)
Total interest expense and similar charges (854) (919)
Net interest income 1,283 1,514
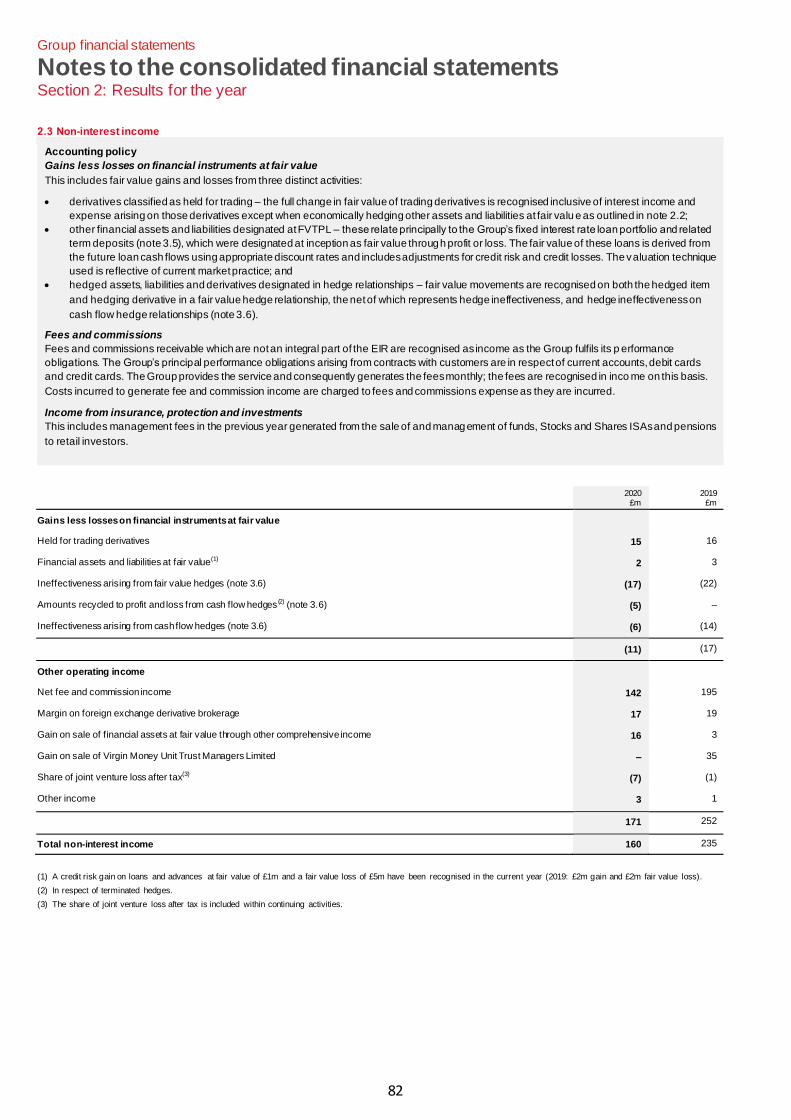
82
Group financial statements
Notes to the consolidated financial statements Section 2: Results for the year
2.3 Non-interest income
Accounting policy
Gains less losses on financial instruments at fair value
This includes fair value gains and losses from three distinct activities:
• derivatives classified as held for trading – the full change in fair value of trading derivatives is recognised inclusive of interest income and
expense arising on those derivatives except when economically hedging other assets and liabilities at fair valu e as outlined in note 2.2;
• other financial assets and liabilities designated at FVTPL – these relate principally to the Group’s fixed interest rate loan portfolio and related
term deposits (note 3.5), which were designated at inception as fair value through profit or loss. The fair value of these loans is derived from
the future loan cash flows using appropriate discount rates and includes adjustments for credit risk and credit losses. The valuation technique
used is reflective of current market practice; and
• hedged assets, liabilities and derivatives designated in hedge relationships – fair value movements are recognised on both the hedged item
and hedging derivative in a fair value hedge relationship, the net of which represents hedge ineffectiveness, and hedge ineffectiveness on
cash flow hedge relationships (note 3.6).
Fees and commissions
Fees and commissions receivable which are not an integral part of the EIR are recognised as income as the Group fulfils its p erformance
obligations. The Group’s principal performance obligations arising from contracts with customers are in respect of current accounts, debit cards
and credit cards. The Group provides the service and consequently generates the fees monthly; the fees are recognised in inco me on this basis.
Costs incurred to generate fee and commission income are charged to fees and commissions expense as they are incurred.
Income from insurance, protection and investments
This includes management fees in the previous year generated from the sale of and management of funds, Stocks and Shares ISAs and pensions
to retail investors.
2020 £m
2019 £m
Gains less losses on financial instruments at fair value Held for trading derivatives 15 16
Financial assets and liabilities at fair value(1) 2 3
Ineffectiveness arising from fair value hedges (note 3.6) (17) (22)
Amounts recycled to profit and loss from cash flow hedges (2) (note 3.6) (5) –
Ineffectiveness arising from cash flow hedges (note 3.6) (6) (14)
(11) (17)
Other operating income Net fee and commission income 142 195
Margin on foreign exchange derivative brokerage 17 19
Gain on sale of financial assets at fair value through other comprehensive income 16 3
Gain on sale of Virgin Money Unit Trust Managers Limited – 35
Share of joint venture loss after tax(3) (7) (1)
Other income 3 1
171 252
Total non-interest income 160 235
(1) A credit risk gain on loans and advances at fair value of £1m and a fair value loss of £5m have been recognised in the current year (2019: £2m gain and £2m fair value loss).
(2) In respect of terminated hedges.
(3) The share of joint venture loss after tax is included within continuing activities.
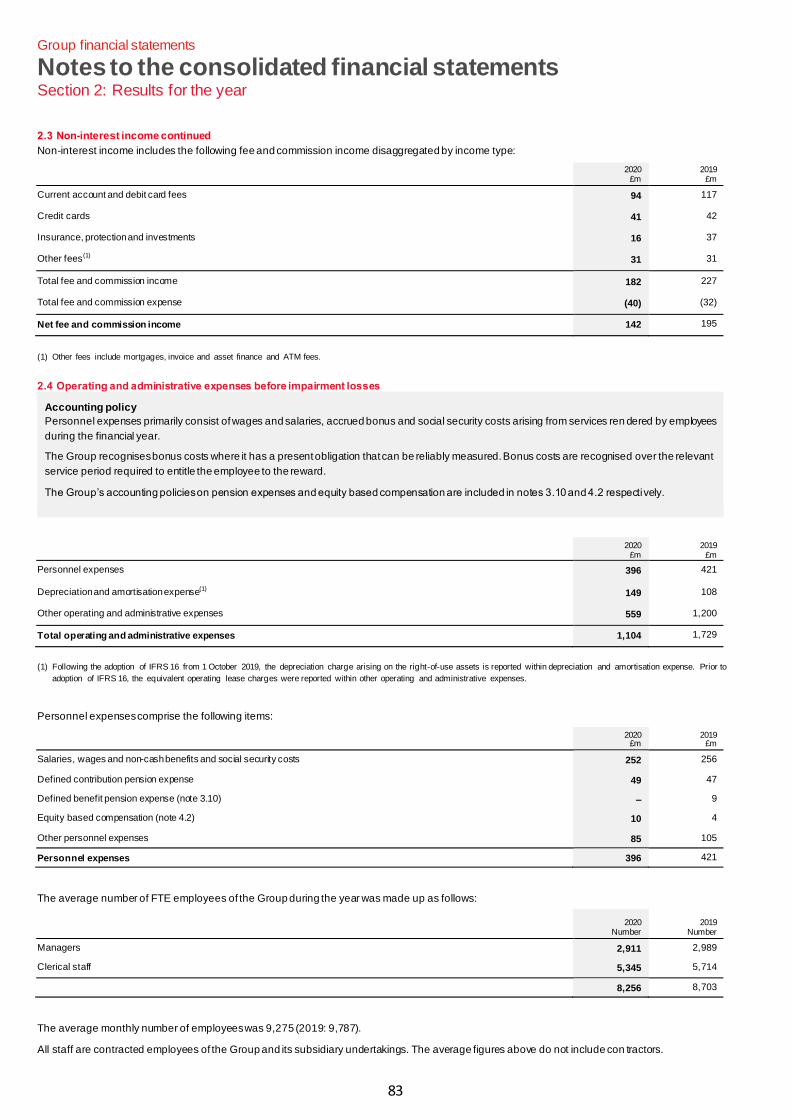
83
Group financial statements
Notes to the consolidated financial statements Section 2: Results for the year
2.3 Non-interest income continued Non-interest income includes the following fee and commission income disaggregated by income type:
2020 £m
2019 £m
Current account and debit card fees 94 117
Credit cards 41 42
Insurance, protection and investments 16 37
Other fees(1) 31 31
Total fee and commission income 182 227
Total fee and commission expense (40) (32)
Net fee and commission income 142 195
(1) Other fees include mortgages, invoice and asset finance and ATM fees.
2.4 Operating and administrative expenses before impairment losses
Accounting policy
Personnel expenses primarily consist of wages and salaries, accrued bonus and social security costs arising from services ren dered by employees
during the financial year.
The Group recognises bonus costs where it has a present obligation that can be reliably measured. Bonus costs are recognised over the relevant
service period required to entitle the employee to the reward.
The Group’s accounting policies on pension expenses and equity based compensation are included in notes 3.10 and 4.2 respectively.
2020 £m
2019 £m
Personnel expenses 396 421
Depreciation and amortisation expense(1) 149 108
Other operating and administrative expenses 559 1,200
Total operating and administrative expenses 1,104 1,729
(1) Following the adoption of IFRS 16 from 1 October 2019, the depreciation charge arising on the right-of-use assets is reported within depreciation and amortisation expense. Prior to
adoption of IFRS 16, the equivalent operating lease charges were reported within other operating and administrative expenses.
Personnel expenses comprise the following items:
2020 £m
2019 £m
Salaries, wages and non-cash benefits and social security costs 252 256
Defined contribution pension expense 49 47
Defined benefit pension expense (note 3.10) – 9
Equity based compensation (note 4.2) 10 4
Other personnel expenses 85 105
Personnel expenses 396 421
The average number of FTE employees of the Group during the year was made up as follows:
2020 Number
2019 Number
Managers 2,911 2,989
Clerical staff 5,345 5,714
8,256 8,703
The average monthly number of employees was 9,275 (2019: 9,787).
All staff are contracted employees of the Group and its subsidiary undertakings. The average figures above do not include con tractors.
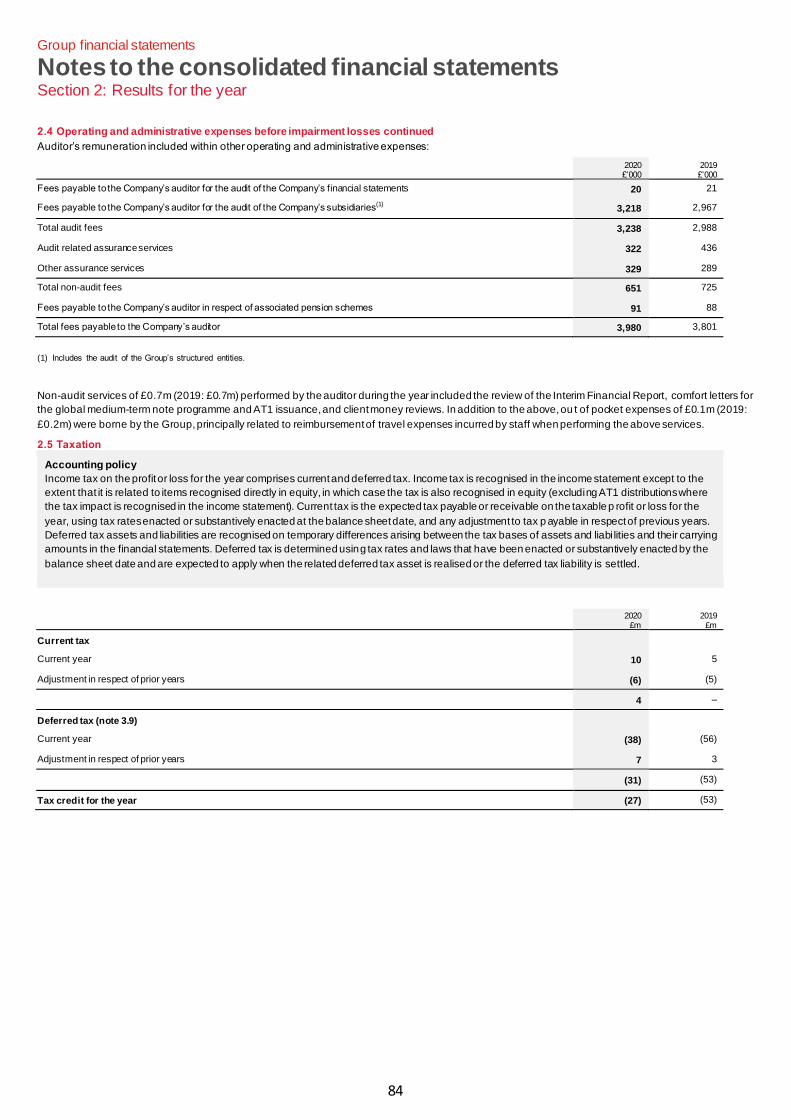
84
Group financial statements
Notes to the consolidated financial statements Section 2: Results for the year
2.4 Operating and administrative expenses before impairment losses continued
Auditor’s remuneration included within other operating and administrative expenses:
2020 £’000
2019 £’000
Fees payable to the Company’s auditor for the audit of the Company’s financial statements 20 21
Fees payable to the Company’s auditor for the audit of the Company’s subsidiaries(1) 3,218 2,967
Total audit fees 3,238 2,988
Audit related assurance services 322 436
Other assurance services 329 289
Total non-audit fees 651 725
Fees payable to the Company’s auditor in respect of associated pension schemes 91 88
Total fees payable to the Company’s auditor 3,980 3,801
(1) Includes the audit of the Group’s structured entities.
Non-audit services of £0.7m (2019: £0.7m) performed by the auditor during the year included the review of the Interim Financial Report, comfort letters for
the global medium-term note programme and AT1 issuance, and client money reviews. In addition to the above, ou t of pocket expenses of £0.1m (2019:
£0.2m) were borne by the Group, principally related to reimbursement of travel expenses incurred by staff when performing the above services.
2.5 Taxation
Accounting policy
Income tax on the profit or loss for the year comprises current and deferred tax. Income tax is recognised in the income statement except to the
extent that it is related to items recognised directly in equity, in which case the tax is also recognised in equity (excluding AT1 distributions where
the tax impact is recognised in the income statement). Current tax is the expected tax payable or receivable on the taxable p rofit or loss for the
year, using tax rates enacted or substantively enacted at the balance sheet date, and any adjustment to tax p ayable in respect of previous years.
Deferred tax assets and liabilities are recognised on temporary differences arising between the tax bases of assets and liabi lities and their carrying
amounts in the financial statements. Deferred tax is determined using tax rates and laws that have been enacted or substantively enacted by the
balance sheet date and are expected to apply when the related deferred tax asset is realised or the deferred tax liability is settled.
2020 £m
2019 £m
Current tax Current year 10 5
Adjustment in respect of prior years (6) (5)
4 –
Deferred tax (note 3.9) Current year (38) (56)
Adjustment in respect of prior years 7 3
(31) (53)
Tax credit for the year (27) (53)
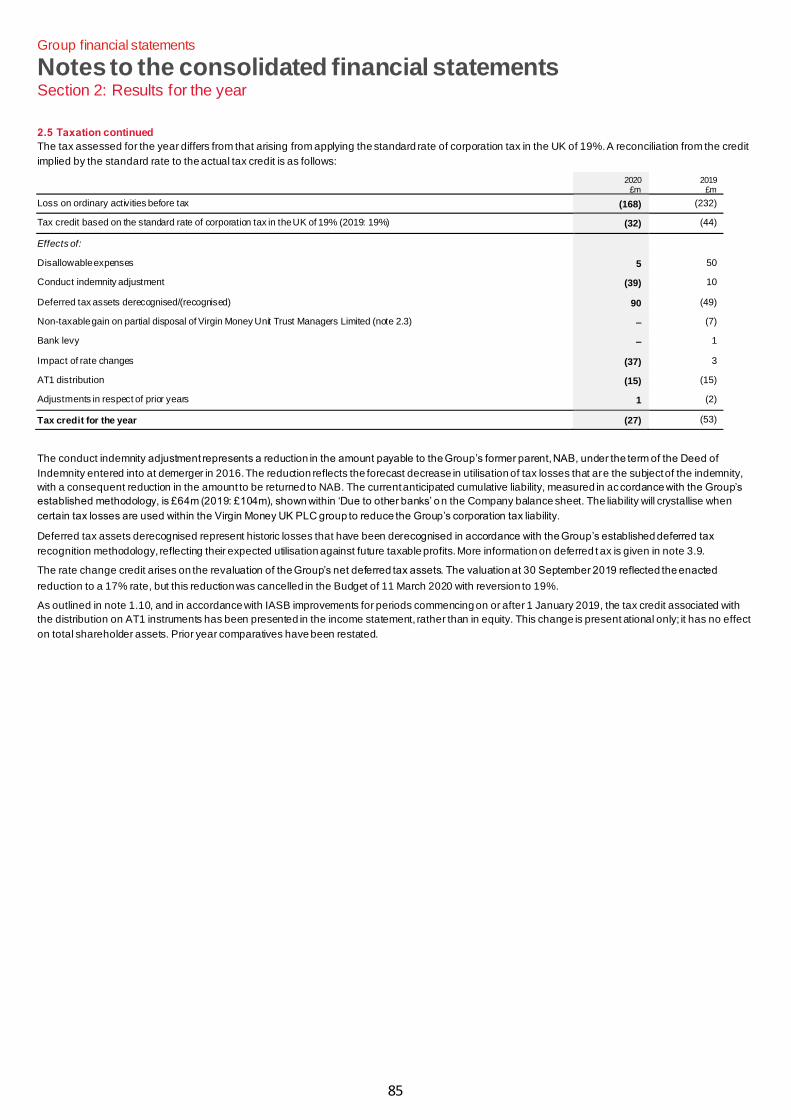
85
Group financial statements
Notes to the consolidated financial statements Section 2: Results for the year
2.5 Taxation continued
The tax assessed for the year differs from that arising from applying the standard rate of corporation tax in the UK of 19%. A reconciliation from the credit
implied by the standard rate to the actual tax credit is as follows:
2020 £m
2019 £m
Loss on ordinary activities before tax (168) (232)
Tax credit based on the standard rate of corporation tax in the UK of 19% (2019: 19%) (32) (44)
Effects of: Disallowable expenses 5 50
Conduct indemnity adjustment (39) 10
Deferred tax assets derecognised/(recognised) 90 (49)
Non-taxable gain on partial disposal of Virgin Money Unit Trust Managers Limited (note 2.3) – (7)
Bank levy – 1
Impact of rate changes (37) 3
AT1 distribution (15) (15)
Adjustments in respect of prior years 1 (2)
Tax credit for the year (27) (53)
The conduct indemnity adjustment represents a reduction in the amount payable to the Group’s former parent, NAB, under the term of the Deed of
Indemnity entered into at demerger in 2016. The reduction reflects the forecast decrease in utilisation of tax losses that are the subject of the indemnity,
with a consequent reduction in the amount to be returned to NAB. The current anticipated cumulative liability, measured in accordance with the Group’s
established methodology, is £64m (2019: £104m), shown within ‘Due to other banks’ on the Company balance sheet. The liability will crystallise when
certain tax losses are used within the Virgin Money UK PLC group to reduce the Group’s corporation tax liability.
Deferred tax assets derecognised represent historic losses that have been derecognised in accordance with the Group’s established deferred tax
recognition methodology, reflecting their expected utilisation against future taxable profits. More information on deferred t ax is given in note 3.9.
The rate change credit arises on the revaluation of the Group’s net deferred tax assets. The valuation at 30 September 2019 reflected the enacted
reduction to a 17% rate, but this reduction was cancelled in the Budget of 11 March 2020 with reversion to 19%.
As outlined in note 1.10, and in accordance with IASB improvements for periods commencing on or after 1 January 2019, the tax credit associated with
the distribution on AT1 instruments has been presented in the income statement, rather than in equity. This change is present ational only; it has no effect
on total shareholder assets. Prior year comparatives have been restated.
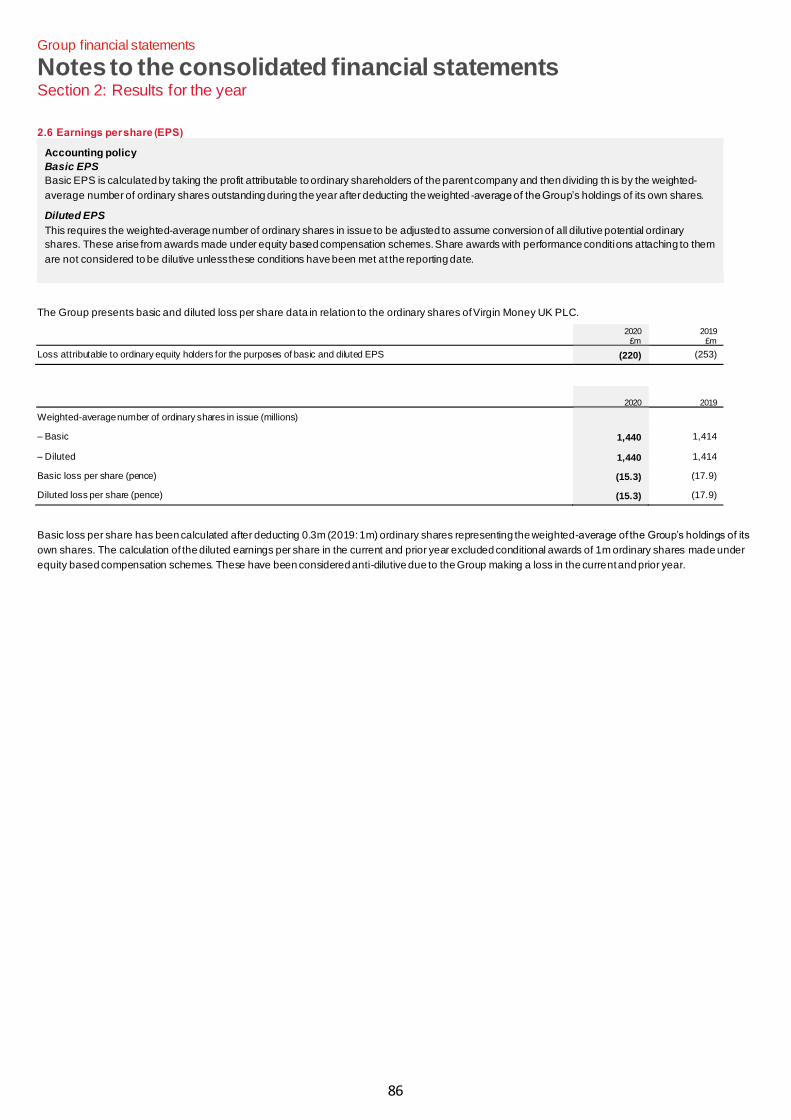
86
Group financial statements
Notes to the consolidated financial statements Section 2: Results for the year
2.6 Earnings per share (EPS)
Accounting policy
Basic EPS
Basic EPS is calculated by taking the profit attributable to ordinary shareholders of the parent company and then dividing th is by the weighted-
average number of ordinary shares outstanding during the year after deducting the weighted -average of the Group’s holdings of its own shares.
Diluted EPS
This requires the weighted-average number of ordinary shares in issue to be adjusted to assume conversion of all dilutive potential ordinary
shares. These arise from awards made under equity based compensation schemes. Share awards with performance conditions attaching to them
are not considered to be dilutive unless these conditions have been met at the reporting date.
The Group presents basic and diluted loss per share data in relation to the ordinary shares of Virgin Money UK PLC.
2020 £m
2019 £m
Loss attributable to ordinary equity holders for the purposes of basic and diluted EPS (220) (253)
2020 2019
Weighted-average number of ordinary shares in issue (millions) – Basic 1,440 1,414
– Diluted 1,440 1,414
Basic loss per share (pence) (15.3) (17.9)
Diluted loss per share (pence) (15.3) (17.9)
Basic loss per share has been calculated after deducting 0.3m (2019: 1m) ordinary shares representing the weighted-average of the Group’s holdings of its
own shares. The calculation of the diluted earnings per share in the current and prior year excluded conditional awards of 1m ordinary shares made under
equity based compensation schemes. These have been considered anti-dilutive due to the Group making a loss in the current and prior year.
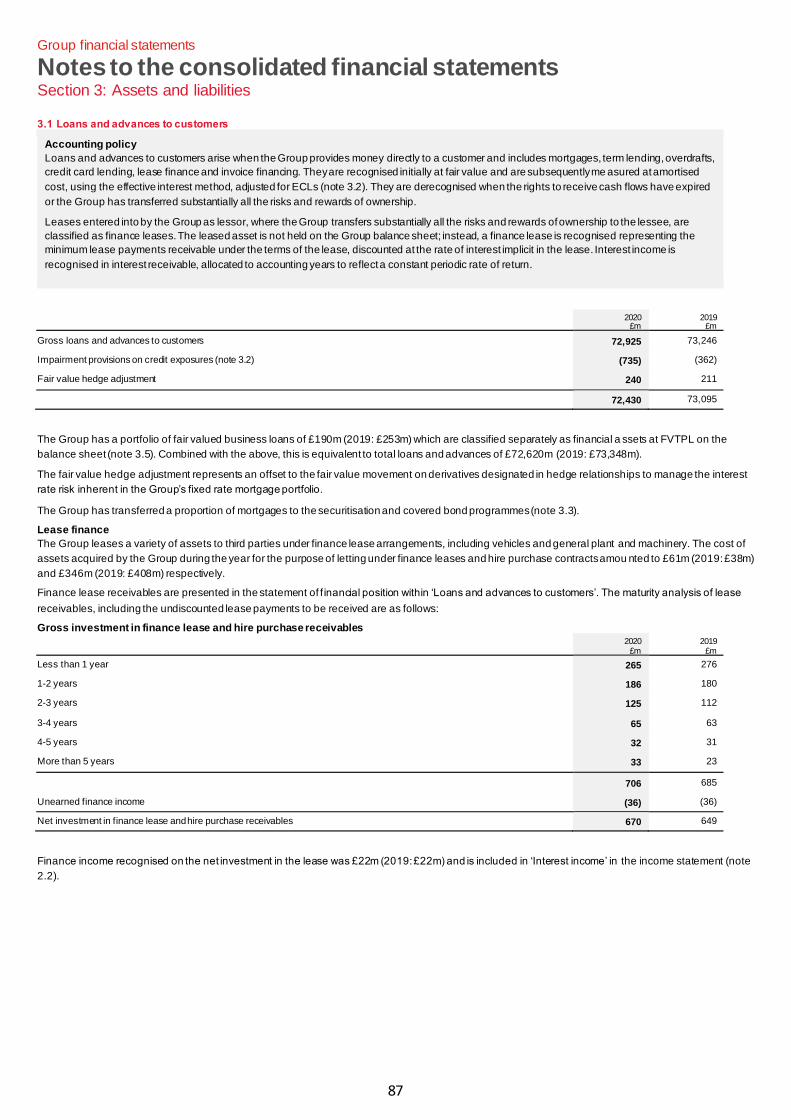
87
Group financial statements
Notes to the consolidated financial statements Section 3: Assets and liabilities
3.1 Loans and advances to customers
Accounting policy
Loans and advances to customers arise when the Group provides money directly to a customer and includes mortgages, term lending, overdrafts,
credit card lending, lease finance and invoice financing. They are recognised initially at fair value and are subsequently me asured at amortised
cost, using the effective interest method, adjusted for ECLs (note 3.2). They are derecognised when the rights to receive cash flows have expired
or the Group has transferred substantially all the risks and rewards of ownership.
Leases entered into by the Group as lessor, where the Group transfers substantially all the risks and rewards of ownership to the lessee, are
classified as finance leases. The leased asset is not held on the Group balance sheet; instead, a finance lease is recognised representing the
minimum lease payments receivable under the terms of the lease, discounted at the rate of interest implicit in the lease. Interest income is
recognised in interest receivable, allocated to accounting years to reflect a constant periodic rate of return.
2020 £m
2019 £m
Gross loans and advances to customers 72,925 73,246
Impairment provisions on credit exposures (note 3.2) (735) (362)
Fair value hedge adjustment 240 211
72,430 73,095
The Group has a portfolio of fair valued business loans of £190m (2019: £253m) which are classified separately as financial a ssets at FVTPL on the
balance sheet (note 3.5). Combined with the above, this is equivalent to total loans and advances of £72,620m (2019: £73,348m).
The fair value hedge adjustment represents an offset to the fair value movement on derivatives designated in hedge relationships to manage the interest
rate risk inherent in the Group’s fixed rate mortgage portfolio.
The Group has transferred a proportion of mortgages to the securitisation and covered bond programmes (note 3.3).
Lease finance
The Group leases a variety of assets to third parties under finance lease arrangements, including vehicles and general plant and machinery. The cost of
assets acquired by the Group during the year for the purpose of letting under finance leases and hire purchase contracts amou nted to £61m (2019: £38m)
and £346m (2019: £408m) respectively.
Finance lease receivables are presented in the statement of f inancial position within ‘Loans and advances to customers’. The maturity analysis of lease
receivables, including the undiscounted lease payments to be received are as follows:
Gross investment in finance lease and hire purchase receivables
2020 £m
2019 £m
Less than 1 year 265 276
1-2 years 186 180
2-3 years 125 112
3-4 years 65 63
4-5 years 32 31
More than 5 years 33 23
706 685
Unearned finance income (36) (36)
Net investment in finance lease and hire purchase receivables 670 649
Finance income recognised on the net investment in the lease was £22m (2019: £22m) and is included in ‘Interest income’ in the income statement (note
2.2).
88
Group financial statements
Notes to the consolidated financial statements Section 3: Assets and liabilities
3.2 Impairment provisions on credit exposures
Accounting policy
At each reporting date, the Group assesses financial assets measured at amortised cost, as well as loan commitments and finan cial guarantees
not measured at FVTPL, for impairment. The impairment loss allowance is calculated using an ECL methodology and reflects: (i) an unbiased and
probability weighted amount; (ii) the time value of money which discounts the impairment loss; and (iii) reasonable and supportable information
that is available without undue cost or effort at the reporting date about past events, current conditions and forecasts of future economic conditions.
ECL methodology is based upon the combination of PD, LGD and EAD estimates that consider a range of factors that impact on credit risk and
consequently the level of impairment loss provisioning. The Group uses reasonable and supportable forecasts of future economic conditions in
estimating the ECL allowance. The methodology and assumptions used in the ECL calculation are reviewed regularly and updated as necessary.
The ECL assessment is performed on either a collective or individual basis:
Collectively assessed: these assets are assessed and provided for on a group or a pooled basis due to the existence of shared risk characteristics
for as long as they retain those similar characteristics. Financial assets are considered to have shared risk characteristics when, at a given point in
time, they will tend to display a similar PD and credit risk profile.
Individually assessed: these assets are assessed and provided for at the financial instrument level, with the assessment (which is governed by the
Group’s Credit Policy) taking into consideration a range of likely potential outcomes relating to each customer and their associated financial assets.
Regardless of the calculation basis, the Group generates an allowance at the individual financial instrument level.
SICR assessment and staging
The ECL is calculated as either a 12-month (Stage 1) or lifetime ECL depending on whether the financial asset has suffered a SICR since
origination (Stage 2) or has otherwise become credit impaired (Stage 3) as at the reporting date. The Group uses a PD threshold curve (distinct for
each portfolio) to assess for a SICR and also utilises the 30 days past due and 90 days past due backstops for recognising Stage 2 and Stage 3
provisions respectively.
In addition to the above stages, POCI financial assets are those which are assessed as being credit impaired upon initial recognition. Once a
financial asset is classified as POCI, it remains there until derecognition irrespective of its credit quality. POCI financial assets are disclosed
separately from those financial assets in Stage 3. The Group regards the date of acquisition as the origination date for purchased portfolios.
Financial assets can move between stages when the relevant staging criteria are no longer satisfied. If the level of impairme nt loss reduces in a
subsequent year, the previously recognised impairment loss allowance is reversed and recognised in the income statement.
The Group has not made use of the low credit risk option under IFRS 9 for loans and advances at amortised cost.
Write-offs and recoveries
When there is no reasonable expectation of recovery for a loan, it is written off against the related provision. Such loans are written off after all the
necessary procedures have been completed and the amount of the loss has been determined. Subsequent recoveries of amounts pre viously
written off decrease the amount of the impairment charge in the income statement.
The Group’s impairment policy for debt instruments at FVOCI is included in note 3.7. The impact of the ECL methodology on the Group’s cash and
balances with central banks and due from other banks balances is immaterial.
Critical accounting estimates and judgements
The use of an ECL methodology under IFRS 9 requires the Group to apply estimates and exercise judgement when calculating an impairment
allowance for credit exposures.
Further detail on the scenarios, macroeconomic assumptions and weightings used in the ECL calculation together with sensitivity analysis is
detailed in the Risk report on pages 42 to 45.
89
Group financial statements
Notes to the consolidated financial statements Section 3: Assets and liabilities
3.2 Impairment provisions on credit exposures continued
Movement in impairment provisions on credit exposures 2020
£m 2019
£m
Opening balance 362 224
Charge for the year 507 252
Amounts written off (159) (142)
Recoveries of amounts written off in previous years 25 28
Closing balance 735 362
Individually assessed 53 47
Collectively modelled 682 315
735 362
The Group impairment provision is classified by stage allocation as follows:
2020 £m
2019 £m
Stage 1 136 79
Stage 2 465 168
Stage 3(1) 134 115
735 362
(1) Stage 3 includes £2m (2019: £3m) of POCI gross loans and advances.
3.3 Securitisation and covered bond programmes
Accounting policy
The Group sponsors the formation of structured entities, primarily for the purpose of facilitation of asset securitisation and covered bond
transactions, the full details of which can be found in note 6.2 to the Company financial statements. The Group has no shareh olding in these
entities, but is exposed, or has rights, to variable returns and has the ability to affect those returns. The entities are co nsolidated in the Group’s
financial statements in accordance with note 1.5.
Securitisation
The Group has securitised a portion of its retail mortgage loan portfolio under both master trust (Lanark and Lannraig) and standalone (Gosforth)
securitisation programmes. The securitised mortgage loans have been assigned at principal value to bankruptcy remote structured entities. The
securitised debt holders have no recourse to the Group other than the principal and interest (including fees) generated from the se curitised
mortgage loan portfolio.
The externally held securitised notes in issue are included within debt securities in issue (no te 3.12). There are a number of notes held internally
by the Group which are used as collateral for repurchases and similar transactions or for credit enhancement purposes.
Covered bond
A subset of the Group’s retail mortgage loan portfolio has been ring -fenced and assigned to bankruptcy remote limited liability partnerships,
Clydesdale Covered Bond No 2 LLP and Eagle Place LLP, to provide a guarantee for the obligations payable on the covered bonds issued by the
Group.
The covered bond partnerships are consolidated with the mortgage loans retained on the consolidated balance sheet and the covered bonds
issued included within debt securities in issue (note 3.12). The covered bond holders have dual recourse: firstly, to the bond issuer on an
unsecured basis; and secondly, to the appropriate LLP under the Covered Bond Guarantee secured against the mortgage loans.
Under both the securitisation and covered bond programmes, the mortgage loans do not qualify for balance sheet derecognition because the
Group remains exposed to the majority of the risks and rewards of the mortgage loan portfolio, principally the associated credit risk. Th e Group
continues to service the mortgage loans in return for an administration fee and is also entitled to any residual income after all payment obligations
due under the terms of the programmes and senior programme expenses have been met. In the mortgage originator a deemed loan l iability is
recognised for the proceeds of the funding transaction.
Significant restrictions
Where the Group uses its financial assets to raise finance through securitisations and the sale of securities subject to repurchase agre ements, the
assets become encumbered and are not available for transfer around the Group.
90
Group financial statements
Notes to the consolidated financial statements Section 3: Assets and liabilities
3.3 Securitisation and covered bond programmes continued
The assets and liabilities in relation to securitisation and covered bonds in issue at 30 September are as follows:
2020 2019
Loans and advances
securitised £m
Notes in issue
£m
Loans and advances
securitised £m
Notes in issue
£m
Securitisation programmes Lanark Master Issuer 5,686 4,757 5,009 4,597
Lannraig Master Issuer 860 765 1,032 838
Gosforth 2014-1 – – 372 385
Gosforth 2015-1 – – 707 630
Gosforth 2016-1 1,141 947 1,142 1,048
Gosforth 2016-2 – – 701 579
Gosforth 2017-1 910 709 934 852
Gosforth 2018-1 1,227 1,060 1,353 1,267
9,824 8,238 11,250 10,196
Less held by the Group (4,236) (5,154)
4,002 5,042
Covered bond programmes Clydesdale Bank PLC 905 781 1,253 776
Clydesdale Bank PLC (formerly Virgin Money PLC) 3,446 1,137 2,622 1,126
4,351 1,918 3,875 1,902
The fair values of financial assets and associated liabilities relating to the securitisation programmes where the counterparty to the liabilities has recourse
only to the financial assets were £9,807m and £3,988m respectively (2019: £11,329m and £5,085m).
There were no events during the year that resulted in any Group transferred financial assets being derecognised.
The Group has contractual and non-contractual arrangements which may require it to provide financial support as follows:
Securitisation programmes
The Group provides credit support to the structured entities via reserve funds, which are partly funded through subordinated debt arrangements and by
holding junior notes. Exposures are shown in the table below:
2020 £m
2019 £m
Beneficial interest held 1,795 1,467
Subordinated loans 46 100
Junior notes held 1,299 1,722
3,140 3,289
Looking forward through future reporting years there are a number of date-based options on the notes issued by the structured entities which could be
actioned by them as issuer. These could require the Group, as sponsor, to provide additional liquidity support.
Covered bond programmes
The nominal level of over-collateralisation was £520m (2019: £699m) in the Clydesdale Bank PLC programme and £2,314m (2019: £1,490m) in the
Clydesdale Bank PLC (formerly Virgin Money PLC) programme. From time to time the obligations of the Group to provide over‑collateralisation may
increase due to the formal requirements of the programme.
Under all programmes, the Group has an obligation to repurchase mortgage exposures if certain mortgage loans no longer meet the programme criteria.
91
Group financial statements
Notes to the consolidated financial statements Section 3: Assets and liabilities
3.4 Cash and balances with central banks
Accounting policy
Cash and balances with central banks are measured at amortised cost, using the effective interest method, adjusted for ECLs, and are
derecognised when the rights to receive cash flows have expired or the Group has transferred substantially all the risks and rewards of ownership.
These balances are generally of a short-term nature and repayable on demand or within a short timescale, generally three months.
2020 £m
2019 £m
Cash assets 1,560 1,574
Balances with central banks (including EU payment systems) 7,547 8,722
9,107 10,296
Less mandatory deposits with central banks(1) (220) (183)
Included in cash and cash equivalents (note 5.2) 8,887 10,113
(1) Mandatory deposits are not available for use in the Group’s day-to-day business and are non-interest bearing.
3.5 Financial assets and liabilities at fair value through profit or loss
Accounting policy
A financial asset is measured at FVTPL if it (i) does not fall into one of the business models for amortised cost (note 1.7) or FVOCI (note 3.7); (ii) is
specifically designated as FVTPL on initial recognition in order to eliminate or significantly reduce a measurement mismatch; or (iii) is classified as
held for trading.
Financial liabilities are measured at FVTPL where they are trading liabilities or where they are designated at FVTPL (e.g. an accounting mismatch)
or where the performance is evaluated on a fair value basis in accordance with risk management and investment strategies.
A financial instrument is classified as held for trading if it is acquired principally for the purpose of selling in the near term, forms part of a portfolio
of financial instruments that are managed together and for which there is evidence of short-term profit taking, or it is a derivative not in a qualifying
hedge relationship.
Associated gains and losses are recognised in the income statement as they arise (note 2.3).
2020 £m
2019 £m
Financial assets at fair value through profit or loss Loans and advances 190 253
Other financial assets 13 14
203 267
Loans and advances
Included in financial assets at FVTPL is a historical portfolio of loans (sales ceased in 2012). Interest rate risk associated with these loans is managed using
interest rate derivative contracts and the loans are recorded at fair value to avoid an accounting mismatch. The maximum cred it exposure of the loans is
£190m (2019: £253m) including accrued interest receivable of £1m (2019: £1m). The cumulat ive loss in the fair value of the loans attributable to changes
in credit risk amounts to £3m (2019: £4m) and the change for the current year is a decrease of £1m (2019: decrease of £4m), of which £1m (2019: £2m)
has been recognised in the income statement.
Other financial assets
Included in other financial assets are £12m (2019: £8m) of unlisted securities and £1m (2019: £6m) of debt instruments.
Refer to note 3.16 for further information on the valuation methodology applied to financial assets held at FVTPL and their classification within the fair
value hierarchy. Details of the credit quality of financial assets is provided in the Risk report.
92
Group financial statements
Notes to the consolidated financial statements Section 3: Assets and liabilities
3.6 Derivative financial instruments
Accounting policy
The Group uses derivative financial instruments to manage exposure to interest rate and foreign currency risk. Interest rate risk arises when there
is a mismatch between fixed interest rate and floating interest rates, and different repricing characteristics between assets and liabilities. Currency
risk arises when assets and liabilities are not denominated in the functional currency of the entity. Derivatives are recognised on the balance sheet
at fair value on trade date and are measured at fair value throughout the life of the contract. Derivatives are carried as assets when the fair value is
positive and as liabilities when the fair value is negative. The notional amount of a derivative contract is not recorded on the balance sheet but is
disclosed as part of this note.
Netting
Derivative assets and liabilities are offset against collateral received and paid respectively, and the net amount reported in ‘due to and from other
banks’ in the balance sheet only when there is a legally enforceable right to offset the recognised amounts, and there is an intention to settle on a
net basis. Amounts offset on the balance sheet represent the Group’s centrally cleared derivative financial instruments and collateral paid to/from
central clearing houses, which meet the criteria for offsetting under IAS 32.
Hedge accounting
The Group elects to apply hedge accounting for the majority of its risk management activity that uses derivatives. This results in greater alignment
in the timing of recognition of gains and losses on hedged items and hedging instruments and therefore reduces income statement volatility. The
Group does not have a trading book, however derivatives that do not meet the hedging criteria, or for which hedge accounting is not applied, are
classified as held for trading.
The Group has elected, as a policy choice permitted under IFRS 9, to continue to apply hedge accounting in accordance with IA S 39. The method
of recognising the fair value gain or loss on a derivative depends on whether it is designated as a hedging instrument and the nature of the item
being hedged. Certain derivatives are designated as either hedges of highly probable future cash flows attributable to a recognised asset or
liability, or a highly probable forecast transaction (a cash flow hedge); or hedges of the fair value of recognised assets or liabilities or firm
commitments (a fair value hedge).
As highlighted in note 1.10, the Group has early adopted the ‘Amendments to IAS 39 and IFRS 7 Interest Rate Benchmark Reform’ issued
in September 2019. In accordance with the transition provisions, the amendments have been adopted retrospectively in respect of hedging
relationships that existed at the start of the reporting year or were designated thereafter, and to the amount accumulated in the cash flow hedge
reserve at that date.
The amendments provide temporary relief from applying specific hedge accounting requirements to hedging relationships directly affected by
IBOR (Interbank Offered Rates) reform. The reliefs have the effect that IBOR reform should not generally cause hedge accounting to terminate.
However, any hedge ineffectiveness continues to be recorded in the income statement. Furthermore, the amendments set out triggers for when
the reliefs will end, which include the uncertainty arising from interest rate benchmark reform no longer being present.
In summary, the reliefs provided by the amendments that apply to the Group are:
• When considering the ‘highly probable’ requirement, the Group has assumed that the IBOR interest rates upon which the hedged items are
based do not change as a result of IBOR reform;
• In assessing whether the hedge is expected to be highly effective on a prospective basis the Group has assumed that the IBOR interest rates
upon which the cash flows of the hedged items and the hedging instruments that hedge them are based are not altered by IBOR reform;
• The Group will not discontinue hedge accounting should the retrospective assessment of hedge effectiveness fall outside the 80‑125 per
cent range and the hedging relationship be subject to interest rate benchmark reforms. For those hedging relationships that a re not subject to
the interest rate benchmark reforms the Group will continue to cease hedge accounting if retrospective effectiveness is outside the 80‑125
per cent range;
• The Group has retained the cumulative gain or loss in the cash flow hedge reserve for designated cash flow hedges that are su bject
to interest rate benchmark reforms even though there is uncertainty arising from the interest rate benchmark reform with respect to the timing
and amount of the cash flows of the hedged items. Should the Group consider the hedged future cash flows are no longer expected to occur
due to reasons other than interest rate benchmark reform, the cumulative gain or loss will be immediately reclassified to pro fit or loss; and
• The Group has assessed whether the hedged IBOR risk component is a separately identifiable risk only when it first designates a hedged
item in a fair value hedge and not on an ongoing basis.
93
Group financial statements
Notes to the consolidated financial statements Section 3: Assets and liabilities
3.6 Derivative financial instruments continued
Accounting policy continued
Cash flow hedge
The effective portion of changes in the fair value of derivatives that are designated and qualify as cash flow hedges is reco gnised in equity.
Specifically, the separate component of equity (note 4.1) is adjusted to the lesser of the cumulative gain or loss on the hedging instrument and the
cumulative change in fair value of the expected future cash flows on the hedged item from the inception of the hedge. Any remaining gain or loss
on the hedging instrument is recognised in the income statement. The carrying value of the hedged item is not adjusted. Amounts accumulated in
equity are transferred to the income statement in the year in which the hedged item affects profit or loss.
When a hedging instrument expires or is sold, or when a hedge no longer meets the criteria for hedge accounting, any cumulative gain or loss
remains in equity and is recognised when the forecast transaction is ultimately recognised in the income statement. When a fo recast transaction is
no longer expected to occur, the cumulative gain or loss that was reported in equity is immediately transferred to the income statement.
Fair value hedge
The carrying value of the hedged item on initial designation is adjusted for the fair value attributable to the hedged risk. Subsequently, changes in
the fair value of derivatives that are designated and qualify as fair value hedges are recorded in the income statement, toge ther with any changes
in the fair value of the hedged asset or liability that are attributable to the hedged risk. This movement in the fair value of the hedged item is made
as an adjustment to the carrying value of the hedged asset or liability.
Where the hedged item is derecognised from the balance sheet, the adjustment to the carrying amount of the asset or liability is immediately
transferred to the income statement. When a hedging instrument expires or is sold, or when a hedge no longer meets the criteria for hedge
accounting, the adjustment to the carrying amount of a hedged item is amortised to the income statement over the remaining life of the asset or
liability.
Derivatives held for trading
Changes in value of held for trading derivatives are immediately recognised in the income statement (note 2.3).
The tables below analyse derivatives between those designated as hedging instruments and those classified as held for trading:
2020
£m 2019
£m
Fair value of derivative financial assets Designated as hedging instruments 198 315
Designated as held for trading 120 51
318 366
Fair value of derivative financial liabilities Designated as hedging instruments 158 191
Designated as held for trading 92 82
250 273
In respect of derivatives with other banks, cash collateral totalling £53m (2019: £55m) has been pledged and £93m has been received (2019: £149m).
These amounts are included within due from and due to other banks respectively. Collateral placed with clearing houses, which did not meet offsetting
criteria, totalled £202m (2019: £55m) and is included within other assets.
The derivative financial instruments held by the Group are further analysed below. The notional contract amount is the amount from which the cash flows
are derived and does not represent the principal amounts at risk relating to these contracts.
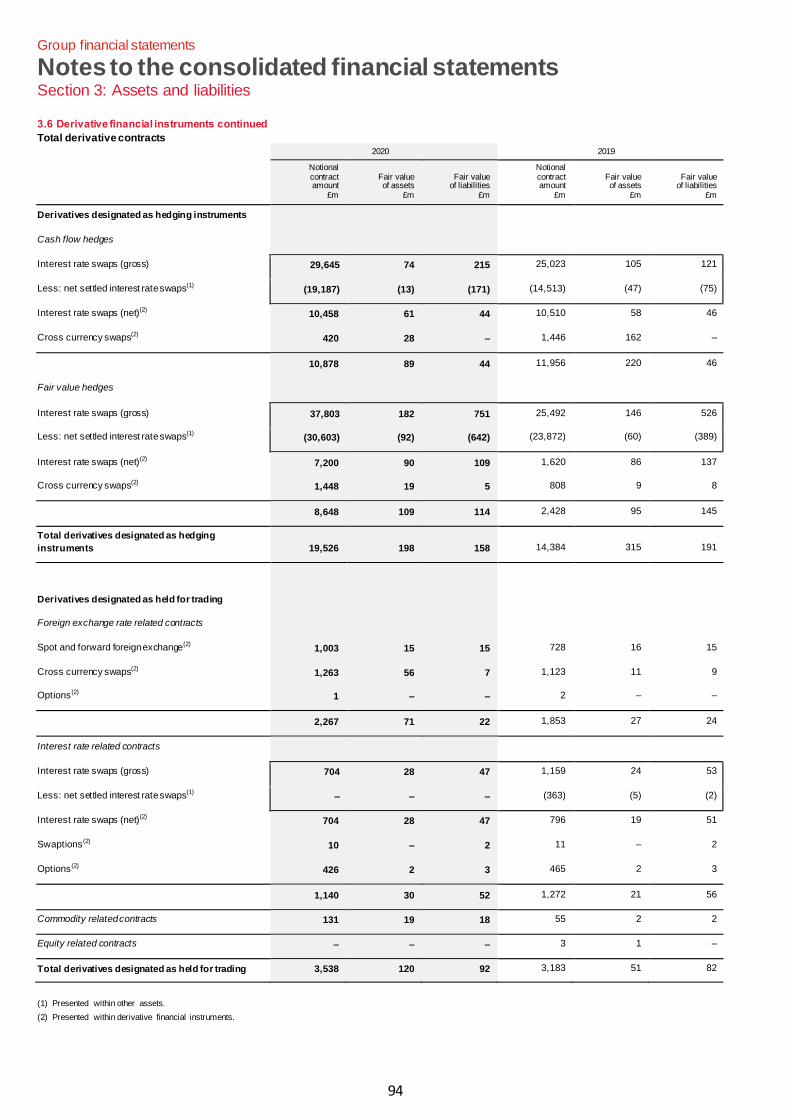
94
Group financial statements
Notes to the consolidated financial statements Section 3: Assets and liabilities
3.6 Derivative financial instruments continued
Total derivative contracts
2020 2019
Notional contract amount
£m
Fair value of assets
£m
Fair value of liabilities
£m
Notional contract amount
£m
Fair value of assets
£m
Fair value of liabilities
£m
Derivatives designated as hedging instruments
Cash flow hedges
Interest rate swaps (gross) 29,645 74 215 25,023 105 121
Less: net settled interest rate swaps(1) (19,187) (13) (171) (14,513) (47) (75)
Interest rate swaps (net)(2) 10,458 61 44 10,510 58 46
Cross currency swaps(2) 420 28 – 1,446 162 –
10,878 89 44 11,956 220 46
Fair value hedges
Interest rate swaps (gross) 37,803 182 751 25,492 146 526
Less: net settled interest rate swaps(1) (30,603) (92) (642) (23,872) (60) (389)
Interest rate swaps (net)(2) 7,200 90 109 1,620 86 137
Cross currency swaps(2) 1,448 19 5 808 9 8
8,648 109 114 2,428 95 145
Total derivatives designated as hedging
instruments 19,526 198 158 14,384 315 191
Derivatives designated as held for trading
Foreign exchange rate related contracts
Spot and forward foreign exchange(2) 1,003 15 15 728 16 15
Cross currency swaps(2) 1,263 56 7 1,123 11 9
Options(2) 1 – – 2 – –
2,267 71 22 1,853 27 24
Interest rate related contracts
Interest rate swaps (gross) 704 28 47 1,159 24 53
Less: net settled interest rate swaps(1) – – – (363) (5) (2)
Interest rate swaps (net)(2) 704 28 47 796 19 51
Swaptions(2) 10 – 2 11 – 2
Options(2) 426 2 3 465 2 3
1,140 30 52 1,272 21 56
Commodity related contracts 131 19 18 55 2 2
Equity related contracts – – – 3 1 –
Total derivatives designated as held for trading 3,538 120 92 3,183 51 82
(1) Presented within other assets.
(2) Presented within derivative financial instruments.

95
Group financial statements
Notes to the consolidated financial statements Section 3: Assets and liabilities
3.6 Derivative financial instruments continued
Hedge accounting
The hedging strategy of the Group is divided into micro hedges, where the hedged item is a distinctly identifiable asset or l iability, and portfolio hedges,
where the hedged item is a homogenous portfolio of assets and liabilities.
In some hedge accounting relationships, the Group designates risk components of hedged items as follows:
• benchmark interest rate risk as a component of interest rate risk, such as the SONIA component;
• exchange rate risk for foreign currency financial assets and financial liabilities; and
• components of cash flows of hedged items, for example certain interest payments for part of the life of an instrument.
Other risks such as credit risk and liquidity risk are managed by the Group but are not included in the hedge accounting rela tionship. Changes in the
designated risk component usually account for the largest portion of the overall change in fair value or cash flows of the hedged item.
Portfolio cash flow hedges
The Group applies macro cash flow hedge accounting to a portion of its floating rate financial assets and liabilities. The hedged cash flows are a group of
forecast transactions that result in cash flow variability from resetting of interest rates, reinvestment of financial assets , or refinancing and rollovers of
financial liabilities. This cash flow variability can arise on recognised assets or liabilities or highly probable forecast transactions . The hedged items are
designated as the gross asset or liability positions allocated to time buckets based on projected repricing and interest profiles. The Group aims to maintain
a position where the principal amount of the hedged items is greater than or equal to the notional amount of the corresponding interest rate swaps used as
the hedging instruments. The hedge accounting relationship is reassessed on a monthly basis with the composition of hedging instruments and hedged
items changing frequently in line with the underlying risk exposures. If necessary, the hedge relationships are de -designated and redesignated based on
the effectiveness test results.
Micro cash flow hedges
Floating rate issuances that are denominated in currencies other than the functional currency of the Group are designated in cash flow hedges with cross
currency swaps.
Portfolio fair value hedges
The Group applies macro fair value hedging to its fixed rate mortgages. During the year fair value hedging of fixed rate deposits was d iscontinued. The
Group determines hedged items by identifying portfolios of homogeneous loans or deposits based on their contractua l maturity and other risk
characteristics. Loans or deposits within the identified portfolios are allocated to repricing time buckets based on expected, rather than contractual,
repricing dates. The hedging instruments are designated to those repricing time buckets. Hedge effectiveness is measured on a monthly basis, by
comparing fair value movements of the designated proportion of the bucketed loans due to the hedged risk against the fair value movements of the
derivatives.
The aggregated fair value changes in the hedged loans and deposits are recognised on the Group’s balance sheet as an asset and liability respectively.
At the end of every month, in order to minimise the ineffectiveness from early repayments and accommodate new exposures, the Group volunt arily de-
designates the hedge relationships and redesignates them as new hedges.
Micro fair value hedges
The Group uses this hedging strategy on GBP and foreign currency denominated fixed rate assets held at FVOCI and GBP and foreign currency
denominated fixed rate debt issuances by the Group.
Hedge ineffectiveness
Hedge ineffectiveness can arise from:
• mismatches between the contractual terms of the hedged item and hedging instrument, including basis differences;
• differences in timing of cash flows of hedged items and hedging instruments;
• changes in expected timings and amounts of forecast future cash flows; and
• derivatives used as hedging instruments having a non-zero fair value at the time of designation.
Additionally, for portfolio fair value hedges of the Group’s fixed rate mortgage portfolio, ineffectiveness also arises from the difference between forecast
and actual repayments (e.g. prepayment risk and impact of short-term payment holidays granted to customers in response to COVID-19).
Interest Rate Benchmark Reform
The Group has cash flow and fair value hedge accounting relationships that are exposed to different IBORs, predominantly GBP LIBOR but also Euro
Interbank Offer Rate (EURIBOR), which are subject to IBOR reform.
As at 30 September 2020, the principal of the hedged items designated into cash flow hedge relationships that is directly affected by the interest rate
benchmark reform is £611m. The principal of the hedged items designated in fair value hedge relationships that is directly af fected by the interest rate
benchmark reform is £780m, of which £78m relates to EURIBOR. These fair value hedges principally relate to GBP and foreign currency denominated
fixed rate assets, and GBP fixed rate debt.
At 30 September 2020, the principal amount of the hedging instruments in hedge relationships to which these amendments apply was £908m, of which
£778m relates to fair value hedges and £130m relates to cash flow hedges.
Page 67 of the Risk report describes how the Group is managing the transition to new benchmark interest rates.

96
Group financial statements
Notes to the consolidated financial statements Section 3: Assets and liabilities
3.6 Derivative financial instruments continued
The Group will continue to apply the amendments to IAS 39 until the uncertainty arising from IBOR reform, with respect to the timing and the amount of
the underlying cash flows that the Group is exposed to, ends. The Group has assumed that this uncertainty will not end until the Group’s contracts that
reference IBORs are amended to specify the date on which the interest rate benchmark will be replaced, the cash flows of the alternative benchmark rate
and the relevant spread adjustment.
The table below discloses the impact derivatives held in micro hedging relationships are expected to have on the timing and uncertainty of future cash flows.
All notional principal amounts and carrying values are presented gross, prior to any netting permitted for balance sheet presentation as this reflects the
derivative position used for risk management and the impact on future cash flows.
3 months or less 3 to 12 months 1 to 5 years Total
2020 Cash flow hedges Foreign exchange risk Cross currency swap
Notional principal (£m) 185 235 – 420
Average GBP/EUR rate 1.4149 1.4149 – n/a
Average GBP/USD rate 1.3023 1.2984 – n/a
2019 Cash flow hedges Foreign exchange risk Cross currency swap
Notional principal (£m) 107 445 894 1,446
Average GBP/EUR rate 1.3459 1.3423 1.3680 n/a
Average GBP/USD rate 1.3263 1.3228 1.3089 n/a
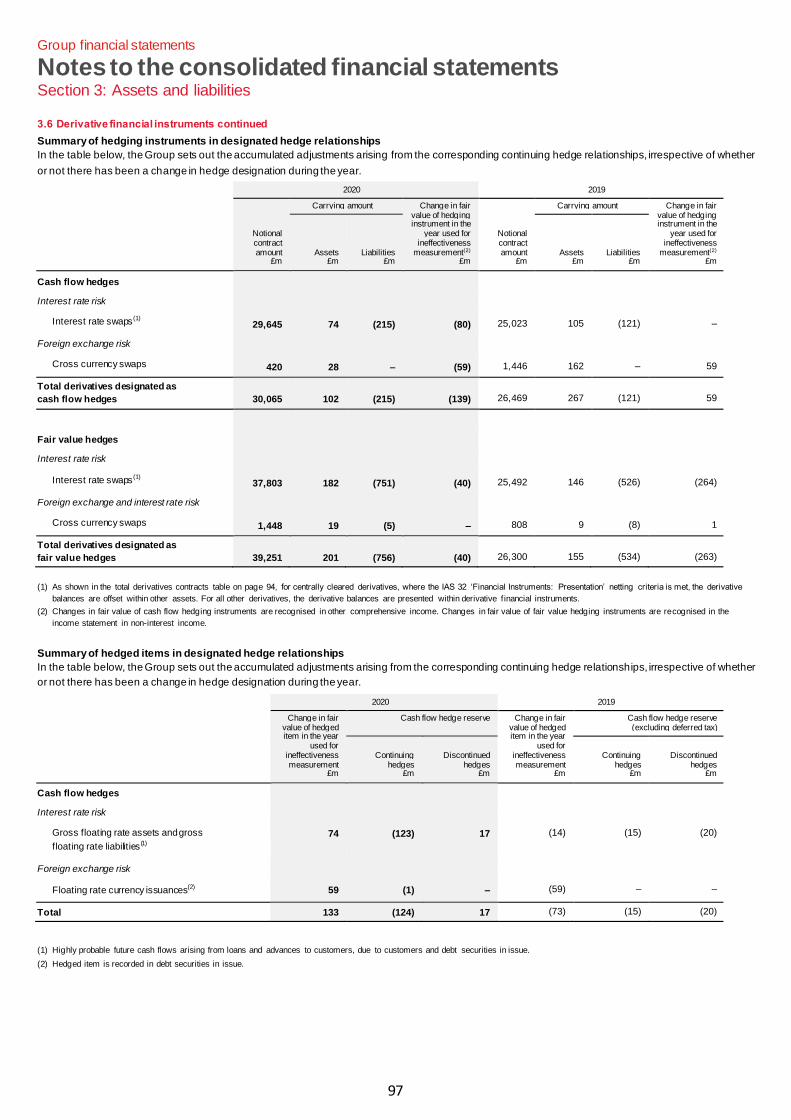
97
Group financial statements
Notes to the consolidated financial statements Section 3: Assets and liabilities
3.6 Derivative financial instruments continued
Summary of hedging instruments in designated hedge relationships
In the table below, the Group sets out the accumulated adjustments arising from the corresponding continuing hedge relationships, irrespective of whether
or not there has been a change in hedge designation during the year.
2020 2019
Notional contract amount
£m
Carrying amount Change in fair value of hedging instrument in the
year used for ineffectiveness
measurement(2) £m
Notional contract amount
£m
Carrying amount Change in fair value of hedging instrument in the
year used for ineffectiveness
measurement(2) £m
Assets £m
Liabilities £m
Assets £m
Liabilities £m
Cash flow hedges Interest rate risk
Interest rate swaps (1) 29,645 74 (215) (80) 25,023 105 (121) –
Foreign exchange risk Cross currency swaps 420 28 – (59) 1,446 162 – 59
Total derivatives designated as
cash flow hedges 30,065 102 (215) (139) 26,469 267 (121) 59
Fair value hedges Interest rate risk
Interest rate swaps (1) 37,803 182 (751) (40) 25,492 146 (526) (264)
Foreign exchange and interest rate risk Cross currency swaps 1,448 19 (5) – 808 9 (8) 1
Total derivatives designated as
fair value hedges 39,251 201 (756) (40) 26,300 155 (534) (263)
(1) As shown in the total derivatives contracts table on page 94, for centrally cleared derivatives, where the IAS 32 ‘Financial Instruments: Presentation’ netting criteria is met, the derivative
balances are offset within other assets. For all other derivatives, the derivative balances are presented within derivative financial instruments.
(2) Changes in fair value of cash flow hedging instruments are recognised in other comprehensive income. Changes in fair value of fair value hedging instruments are recognised in the
income statement in non-interest income.
Summary of hedged items in designated hedge relationships
In the table below, the Group sets out the accumulated adjustments arising from the corresponding continuing hedge relationships, irrespective of whether
or not there has been a change in hedge designation during the year.
2020 2019
Change in fair value of hedged item in the year
used for ineffectiveness measurement
£m
Cash flow hedge reserve Change in fair value of hedged item in the year
used for ineffectiveness measurement
£m
Cash flow hedge reserve (excluding deferred tax)
Continuing hedges
£m
Discontinued hedges
£m
Continuing hedges
£m
Discontinued hedges
£m
Cash flow hedges Interest rate risk
Gross floating rate assets and gross
floating rate liabilities (1)
74 (123) 17 (14) (15) (20)
Foreign exchange risk Floating rate currency issuances(2) 59 (1) – (59) – –
Total 133 (124) 17 (73) (15) (20)
(1) Highly probable future cash flows arising from loans and advances to customers, due to customers and debt securities in issue.
(2) Hedged item is recorded in debt securities in issue.
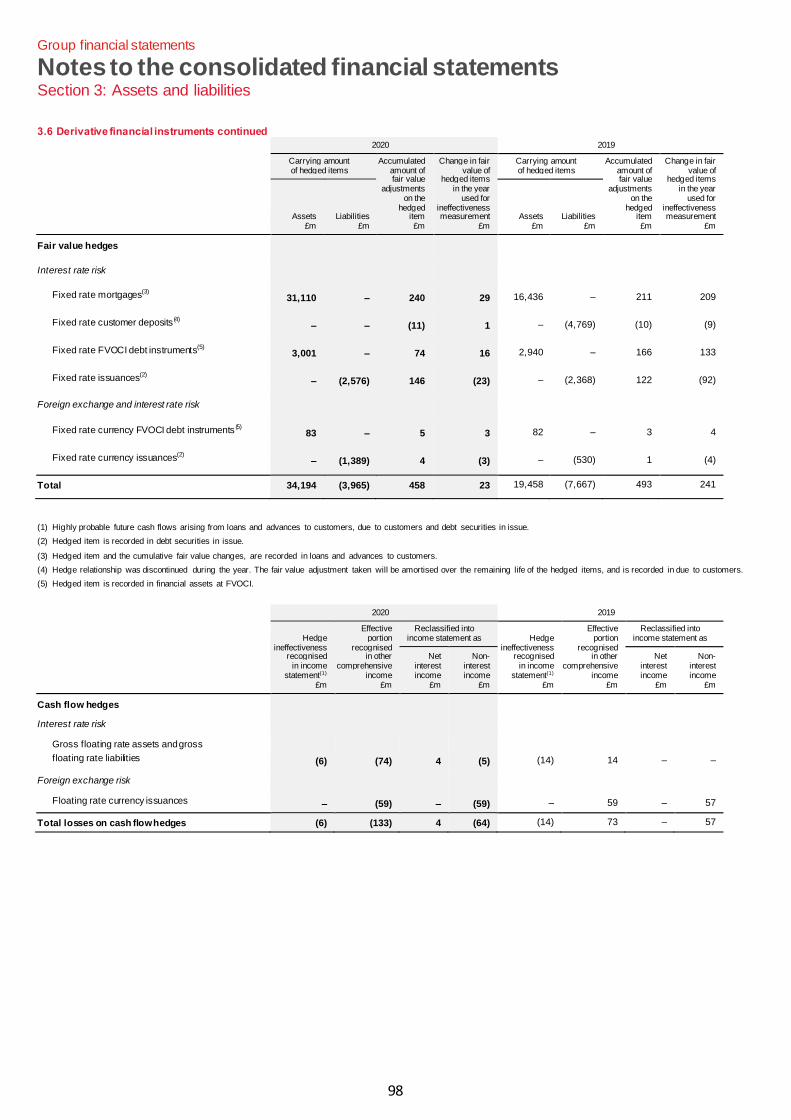
98
Group financial statements
Notes to the consolidated financial statements Section 3: Assets and liabilities
3.6 Derivative financial instruments continued
2020 2019
Carrying amount of hedged items
Accumulated amount of fair value
adjustments on the
hedged item
£m
Change in fair value of
hedged items in the year
used for ineffectiveness measurement
£m
Carrying amount of hedged items
Accumulated amount of fair value
adjustments on the
hedged item
£m
Change in fair value of
hedged items in the year
used for ineffectiveness measurement
£m Assets
£m Liabilities
£m Assets
£m
Liabilities
£m
Fair value hedges
Interest rate risk
Fixed rate mortgages(3) 31,110 – 240 29 16,436 – 211 209
Fixed rate customer deposits (4) – – (11) 1 – (4,769) (10) (9)
Fixed rate FVOCI debt instruments(5) 3,001 – 74 16 2,940 – 166 133
Fixed rate issuances(2) – (2,576) 146 (23) – (2,368) 122 (92)
Foreign exchange and interest rate risk
Fixed rate currency FVOCI debt instruments (5) 83 – 5 3 82 – 3 4
Fixed rate currency issuances(2) – (1,389) 4 (3) – (530) 1 (4)
Total 34,194 (3,965) 458 23 19,458 (7,667) 493 241
(1) Highly probable future cash flows arising from loans and advances to customers, due to customers and debt securities in issue.
(2) Hedged item is recorded in debt securities in issue.
(3) Hedged item and the cumulative fair value changes, are recorded in loans and advances to customers.
(4) Hedge relationship was discontinued during the year. The fair value adjustment taken will be amortised over the remaining life of the hedged items, and is recorded in due to customers.
(5) Hedged item is recorded in financial assets at FVOCI.
2020 2019
Hedge ineffectiveness
recognised in income
statement(1) £m
Effective portion
recognised in other
comprehensive income
£m
Reclassified into income statement as Hedge
ineffectiveness recognised
in income statement(1)
£m
Effective portion
recognised in other
comprehensive income
£m
Reclassified into income statement as
Net interest income
£m
Non- interest income
£m
Net interest income
£m
Non- interest income
£m
Cash flow hedges Interest rate risk
Gross floating rate assets and gross
floating rate liabilities (6) (74) 4 (5) (14) 14 – –
Foreign exchange risk Floating rate currency issuances – (59) – (59) – 59 – 57
Total losses on cash flow hedges (6) (133) 4 (64) (14) 73 – 57
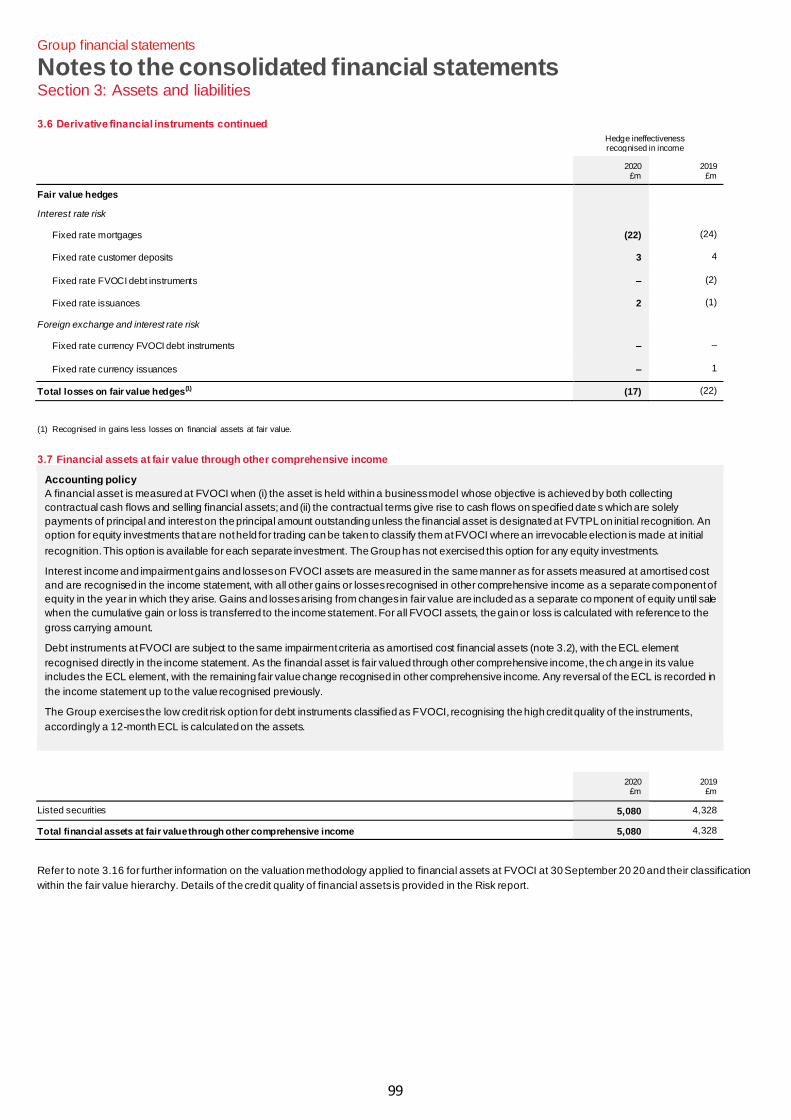
99
Group financial statements
Notes to the consolidated financial statements Section 3: Assets and liabilities
3.6 Derivative financial instruments continued
Hedge ineffectiveness recognised in income
2020 £m
2019 £m
Fair value hedges Interest rate risk
Fixed rate mortgages (22) (24)
Fixed rate customer deposits 3 4
Fixed rate FVOCI debt instruments – (2)
Fixed rate issuances 2 (1)
Foreign exchange and interest rate risk Fixed rate currency FVOCI debt instruments – –
Fixed rate currency issuances – 1
Total losses on fair value hedges(1) (17) (22)
(1) Recognised in gains less losses on financial assets at fair value.
3.7 Financial assets at fair value through other comprehensive income
Accounting policy
A financial asset is measured at FVOCI when (i) the asset is held within a business model whose objective is achieved by both collecting
contractual cash flows and selling financial assets; and (ii) the contractual terms give rise to cash flows on specified date s which are solely
payments of principal and interest on the principal amount outstanding unless the financial asset is designated at FVTPL on initial recognition. An
option for equity investments that are not held for trading can be taken to classify them at FVOCI where an irrevocable election is made at initial
recognition. This option is available for each separate investment. The Group has not exercised this option for any equity investments.
Interest income and impairment gains and losses on FVOCI assets are measured in the same manner as for assets measured at amortised cost
and are recognised in the income statement, with all other gains or losses recognised in other comprehensive income as a separate component of
equity in the year in which they arise. Gains and losses arising from changes in fair value are included as a separate co mponent of equity until sale
when the cumulative gain or loss is transferred to the income statement. For all FVOCI assets, the gain or loss is calculated with reference to the
gross carrying amount.
Debt instruments at FVOCI are subject to the same impairment criteria as amortised cost financial assets (note 3.2), with the ECL element
recognised directly in the income statement. As the financial asset is fair valued through other comprehensive income, the ch ange in its value
includes the ECL element, with the remaining fair value change recognised in other comprehensive income. Any reversal of the ECL is recorded in
the income statement up to the value recognised previously.
The Group exercises the low credit risk option for debt instruments classified as FVOCI, recognising the high credit quality of the instruments,
accordingly a 12-month ECL is calculated on the assets.
2020 £m
2019 £m
Listed securities 5,080 4,328
Total financial assets at fair value through other comprehensive income 5,080 4,328
Refer to note 3.16 for further information on the valuation methodology applied to financial assets at FVOCI at 30 September 20 20 and their classification
within the fair value hierarchy. Details of the credit quality of financial assets is provided in the Risk report.
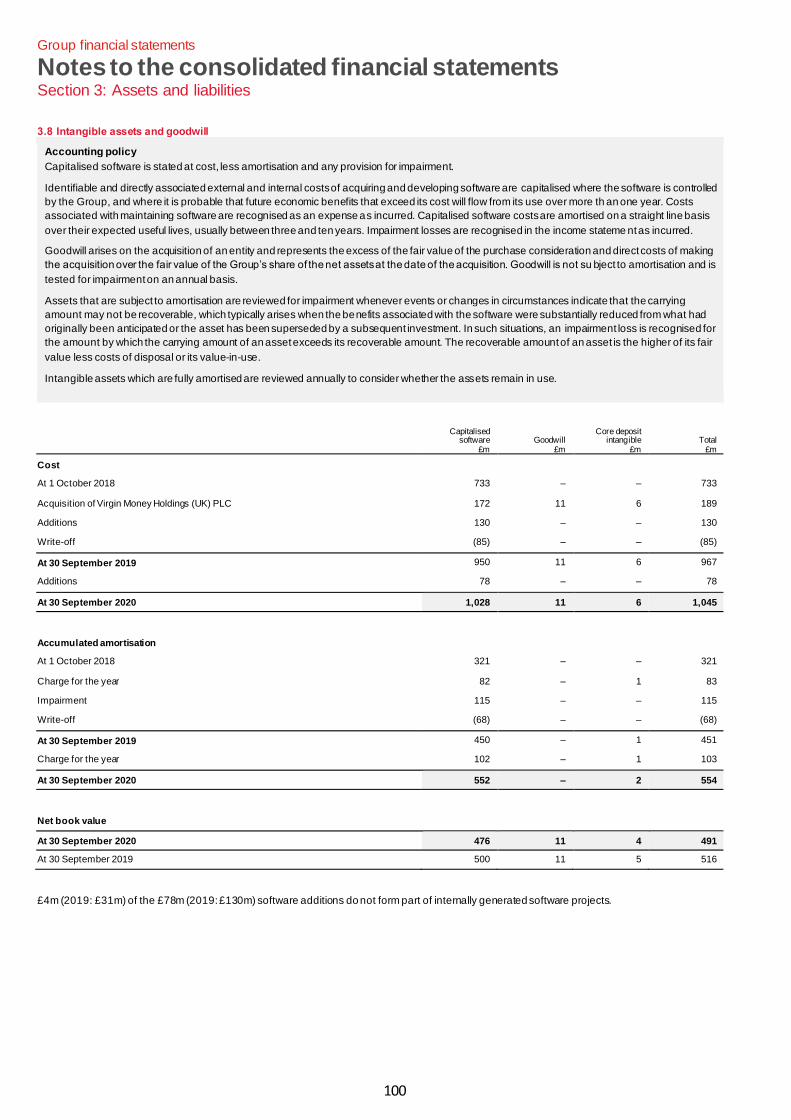
100
Group financial statements
Notes to the consolidated financial statements Section 3: Assets and liabilities
3.8 Intangible assets and goodwill
Accounting policy
Capitalised software is stated at cost, less amortisation and any provision for impairment.
Identifiable and directly associated external and internal costs of acquiring and developing software are capitalised where the software is controlled
by the Group, and where it is probable that future economic benefits that exceed its cost will flow from its use over more th an one year. Costs
associated with maintaining software are recognised as an expense as incurred. Capitalised software costs are amortised on a straight line basis
over their expected useful lives, usually between three and ten years. Impairment losses are recognised in the income stateme nt as incurred.
Goodwill arises on the acquisition of an entity and represents the excess of the fair value of the purchase consideration and direct costs of making
the acquisition over the fair value of the Group’s share of the net assets at the date of the acquisition. Goodwill is not su bject to amortisation and is
tested for impairment on an annual basis.
Assets that are subject to amortisation are reviewed for impairment whenever events or changes in circumstances indicate that the carrying
amount may not be recoverable, which typically arises when the benefits associated with the software were substantially reduced from what had
originally been anticipated or the asset has been superseded by a subsequent investment. In such situations, an impairment loss is recognised for
the amount by which the carrying amount of an asset exceeds its recoverable amount. The recoverable amount of an asset is the higher of its fair
value less costs of disposal or its value-in-use.
Intangible assets which are fully amortised are reviewed annually to consider whether the assets remain in use.
Capitalised
software £m
Goodwill £m
Core deposit intangible
£m Total
£m
Cost At 1 October 2018 733 – – 733
Acquisition of Virgin Money Holdings (UK) PLC 172 11 6 189
Additions 130 – – 130
Write-off (85) – – (85)
At 30 September 2019 950 11 6 967
Additions 78 – – 78
At 30 September 2020 1,028 11 6 1,045
Accumulated amortisation At 1 October 2018 321 – – 321
Charge for the year 82 – 1 83
Impairment 115 – – 115
Write-off (68) – – (68)
At 30 September 2019 450 – 1 451
Charge for the year 102 – 1 103
At 30 September 2020 552 – 2 554
Net book value At 30 September 2020 476 11 4 491
At 30 September 2019 500 11 5 516
£4m (2019: £31m) of the £78m (2019: £130m) software additions do not form part of internally generated software projects.
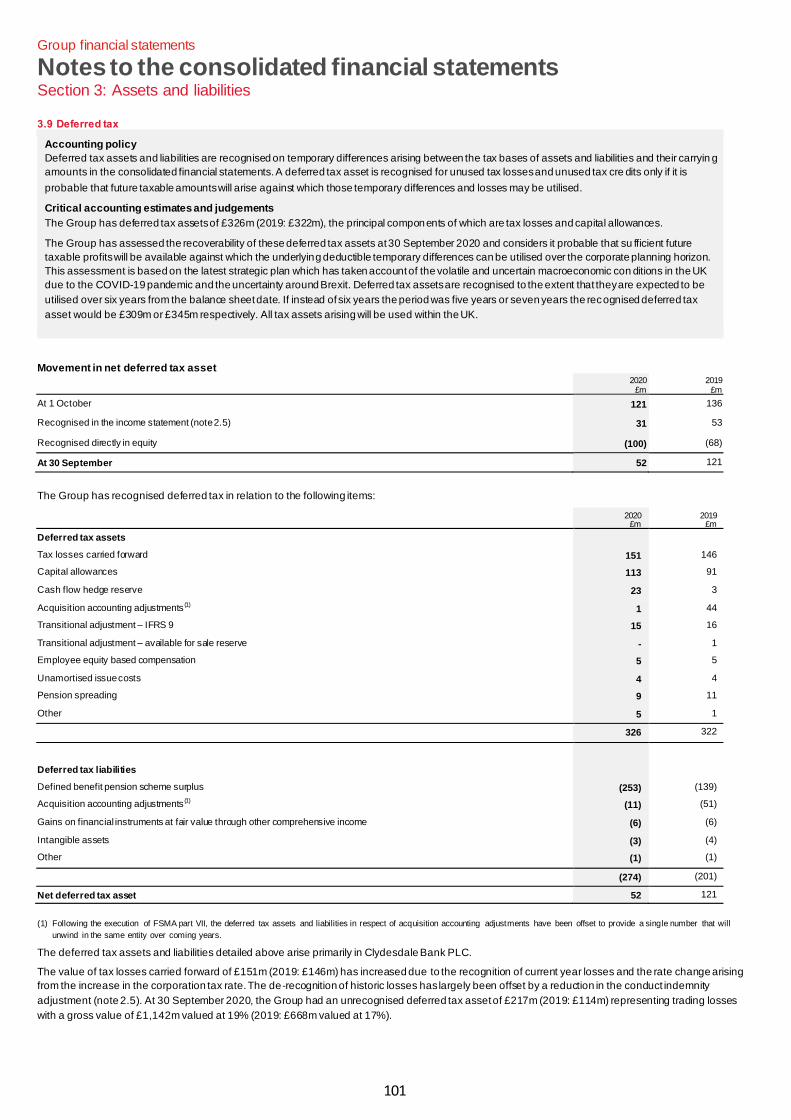
101
Group financial statements
Notes to the consolidated financial statements Section 3: Assets and liabilities
3.9 Deferred tax
Accounting policy
Deferred tax assets and liabilities are recognised on temporary differences arising between the tax bases of assets and liabilities and their carryin g
amounts in the consolidated financial statements. A deferred tax asset is recognised for unused tax losses and unused tax cre dits only if it is
probable that future taxable amounts will arise against which those temporary differences and losses may be utilised.
Critical accounting estimates and judgements
The Group has deferred tax assets of £326m (2019: £322m), the principal components of which are tax losses and capital allowances.
The Group has assessed the recoverability of these deferred tax assets at 30 September 2020 and considers it probable that su fficient future
taxable profits will be available against which the underlying deductible temporary differences can be utilised over the corporate planning horizon.
This assessment is based on the latest strategic plan which has taken account of the volatile and uncertain macroeconomic con ditions in the UK
due to the COVID-19 pandemic and the uncertainty around Brexit. Deferred tax assets are recognised to the extent that they are expected to be
utilised over six years from the balance sheet date. If instead of six years the period was five years or seven years the recognised deferred tax
asset would be £309m or £345m respectively. All tax assets arising will be used within the UK.
Movement in net deferred tax asset
2020 £m
2019 £m
At 1 October 121 136
Recognised in the income statement (note 2.5) 31 53
Recognised directly in equity (100) (68)
At 30 September 52 121
The Group has recognised deferred tax in relation to the following items:
2020 £m
2019 £m
Deferred tax assets Tax losses carried forward 151 146
Capital allowances 113 91
Cash flow hedge reserve 23 3
Acquisition accounting adjustments (1) 1 44
Transitional adjustment – IFRS 9 15 16
Transitional adjustment – available for sale reserve - 1
Employee equity based compensation 5 5
Unamortised issue costs 4 4
Pension spreading 9 11
Other 5 1
326 322
Deferred tax liabilities Defined benefit pension scheme surplus (253) (139)
Acquisition accounting adjustments (1) (11) (51)
Gains on financial instruments at fair value through other comprehensive income (6) (6)
Intangible assets (3) (4)
Other (1) (1)
(274) (201)
Net deferred tax asset 52 121
(1) Following the execution of FSMA part VII, the deferred tax assets and liabilities in respect of acquisition accounting adjustments have been offset to provide a single number that will
unwind in the same entity over coming years.
The deferred tax assets and liabilities detailed above arise primarily in Clydesdale Bank PLC.
The value of tax losses carried forward of £151m (2019: £146m) has increased due to the recognition of current year losses and the rate change arising
from the increase in the corporation tax rate. The de-recognition of historic losses has largely been offset by a reduction in the conduct indemnity
adjustment (note 2.5). At 30 September 2020, the Group had an unrecognised deferred tax asset of £217m (2019: £114m) representing trading losses
with a gross value of £1,142m valued at 19% (2019: £668m valued at 17%).
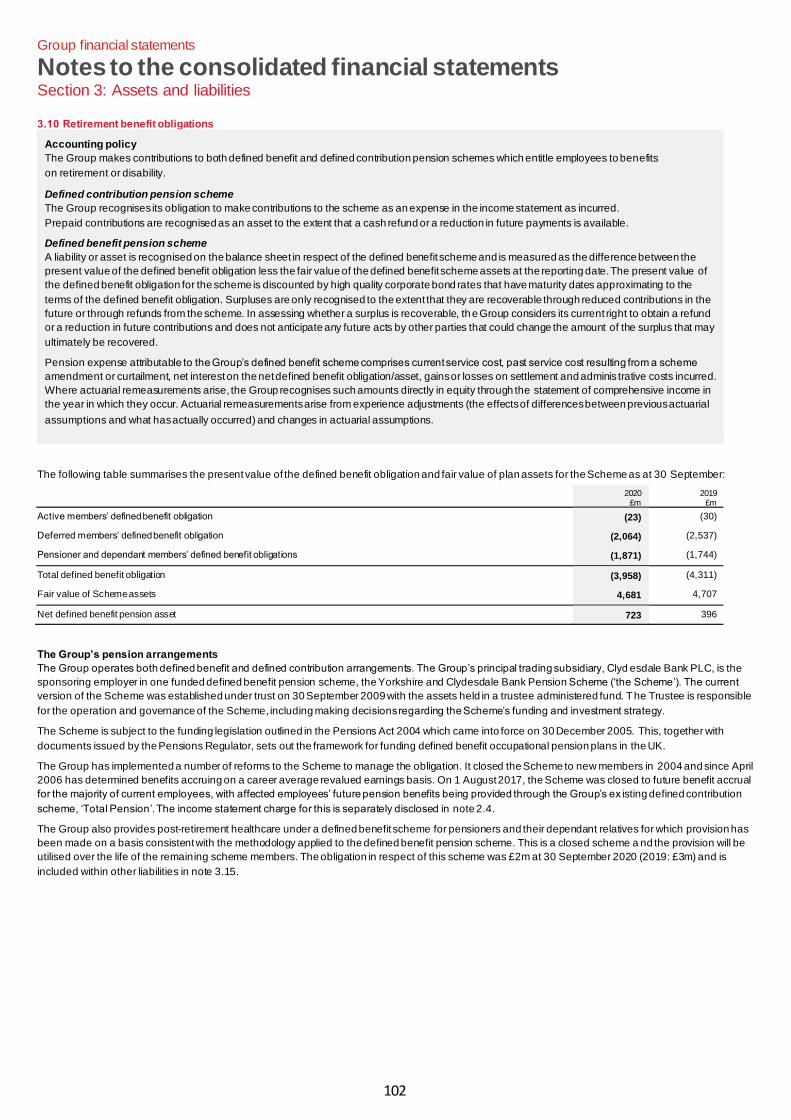
102
Group financial statements
Notes to the consolidated financial statements Section 3: Assets and liabilities
3.10 Retirement benefit obligations
Accounting policy
The Group makes contributions to both defined benefit and defined contribution pension schemes which entitle employees to benefits
on retirement or disability.
Defined contribution pension scheme
The Group recognises its obligation to make contributions to the scheme as an expense in the income statement as incurred.
Prepaid contributions are recognised as an asset to the extent that a cash refund or a reduction in future payments is available.
Defined benefit pension scheme
A liability or asset is recognised on the balance sheet in respect of the defined benefit scheme and is measured as the difference between the
present value of the defined benefit obligation less the fair value of the defined benefit scheme assets at the reporting date. The present value of
the defined benefit obligation for the scheme is discounted by high quality corporate bond rates that have maturity dates approximating to the
terms of the defined benefit obligation. Surpluses are only recognised to the extent that they are recoverable through reduced contributions in the
future or through refunds from the scheme. In assessing whether a surplus is recoverable, the Group considers its current right to obtain a refund
or a reduction in future contributions and does not anticipate any future acts by other parties that could change the amount of the surplus that may
ultimately be recovered.
Pension expense attributable to the Group’s defined benefit scheme comprises current service cost, past service cost resulting from a scheme
amendment or curtailment, net interest on the net defined benefit obligation/asset, gains or losses on settlement and adminis trative costs incurred.
Where actuarial remeasurements arise, the Group recognises such amounts directly in equity through the statement of comprehensive income in
the year in which they occur. Actuarial remeasurements arise from experience adjustments (the effects of differences between previous actuarial
assumptions and what has actually occurred) and changes in actuarial assumptions.
The following table summarises the present value of the defined benefit obligation and fair value of plan assets for the Scheme as at 30 September:
2020 £m
2019 £m
Active members’ defined benefit obligation (23) (30)
Deferred members’ defined benefit obligation (2,064) (2,537)
Pensioner and dependant members’ defined benefit obligations (1,871) (1,744)
Total defined benefit obligation (3,958) (4,311)
Fair value of Scheme assets 4,681 4,707
Net defined benefit pension asset 723 396
The Group’s pension arrangements
The Group operates both defined benefit and defined contribution arrangements. The Group’s principal trading subsidiary, Clyd esdale Bank PLC, is the
sponsoring employer in one funded defined benefit pension scheme, the Yorkshire and Clydesdale Bank Pension Scheme (‘the Scheme’). The current
version of the Scheme was established under trust on 30 September 2009 with the assets held in a trustee administered fund. The Trustee is responsible
for the operation and governance of the Scheme, including making decisions regarding the Scheme’s funding and investment strategy.
The Scheme is subject to the funding legislation outlined in the Pensions Act 2004 which came into force on 30 December 2005. This, together with
documents issued by the Pensions Regulator, sets out the framework for funding defined benefit occupational pension plans in the UK.
The Group has implemented a number of reforms to the Scheme to manage the obligation. It closed the Scheme to new members in 2004 and since April
2006 has determined benefits accruing on a career average revalued earnings basis. On 1 August 2017, the Scheme was closed to future benefit accrual
for the majority of current employees, with affected employees’ future pension benefits being provided through the Group’s ex isting defined contribution
scheme, ‘Total Pension’. The income statement charge for this is separately disclosed in note 2.4.
The Group also provides post-retirement healthcare under a defined benefit scheme for pensioners and their dependant relatives for which provision has
been made on a basis consistent with the methodology applied to the defined benefit pension scheme. This is a closed scheme a nd the provision will be
utilised over the life of the remaining scheme members. The obligation in respect of this scheme was £2m at 30 September 2020 (2019: £3m) and is
included within other liabilities in note 3.15.

103
Group financial statements
Notes to the consolidated financial statements Section 3: Assets and liabilities
3.10 Retirement benefit obligations continued
Scheme valuations
There are a number of means of measuring liabilities in the defined benefit schemes, with the ultimate aim of the Trustee being that the Scheme is 100%
funded on an agreed self-sufficiency basis (which is where the Scheme is essentially self-funded and does not need to call on the Group for any additional
funding). The two bases used by the Group to value its obligations are: (i) an IAS 19 accounting basis; and (ii) a Trustee’s Technical Provision basis.
(i) IAS 19 accounting basis
The valuations of the Scheme assets and obligations are calculated on an accounting basis in accordance with the applicable a ccounting standard IAS 19
which provides the basis for the accounting framework and methodology for entries in the income statement, balance sheet and capital reporting. The
principal purpose of this valuation is to allow comparison of pension obligations between companies. The obligation under an accounting valuation can be
higher or lower than those under a Trustee’s Technical Provision valuation.
The rate used to discount the obligation on an IAS 19 basis is a key driver of any potential volatility and is based on yields on AA rated high-quality corporate
bonds, regardless of how the Trustee of the Scheme invests the assets. The accounting valuation under IAS 19 can therefore move adversely because of
low rates and narrowing credit spreads which are not fully matched by the Scheme assets. Inflation is another key source of volatility and arises as a result
of member benefits having an element of index linking, which causes the obligation to increase in line with rises in long-term inflation assumptions. In
practice however, over the long term, the relationship between interest and inflation rates tends to be negatively correlated resulting in a degree of risk offset.
(ii) Trustee’s Technical Provision basis
This valuation basis reflects how much money the Trustee considers is required now in order to provide for th e promised benefits as they come up for
payment in the future. The Trustee is responsible for ensuring that the calculation is conducted prudently on an actuarial ba sis, taking into account factors
including the Scheme’s investment strategy and the relative financial strength of the sponsoring employer.
A key aspect of this valuation is the investment strategy the Trustee proposes to follow as part of the policy for meeting th e Scheme’s obligations. Because
there are no guarantees about investment returns over long periods, legislation requires the Trustee to consider carefully how much of their expected future
investment returns it would be prudent for them to account for in advance.
During the current year the Trustee concluded the latest triennial valuation for the Scheme, which was conducted in accordance with Scheme data and
market conditions as at 30 September 2019. The valuation resulted in an improvement in the Scheme’s funding position, with a reported surplus of £144m
(previously a deficit of £290m) and a Technical provisions funding level of 103% (previously 94%). As the 2019 valuation outcome was a funding surplus,
future payments to the Scheme are limited solely to those relating to a payment holiday agreed between the Group and Scheme Trustee in respect of
contributions due under the prior 2016 valuation. These total £52m and will be paid at the rate of £2m per month over the per iod January 2021 to April 2023.
Scheme assets are not subject to the same valuation differences as Scheme obligations and are consistently valued at current market value.
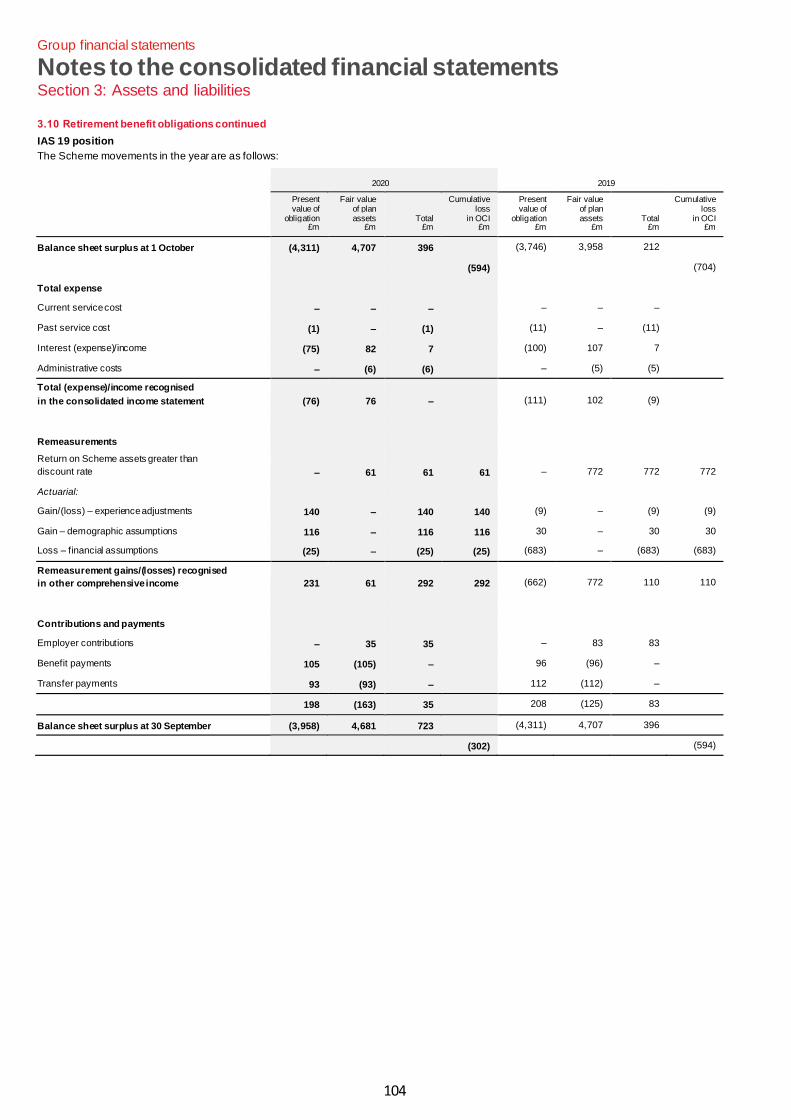
104
Group financial statements
Notes to the consolidated financial statements Section 3: Assets and liabilities
3.10 Retirement benefit obligations continued
IAS 19 position
The Scheme movements in the year are as follows:
2020 2019
Present value of
obligation £m
Fair value of plan assets
£m Total
£m
Cumulative loss
in OCI £m
Present value of
obligation £m
Fair value of plan assets
£m Total
£m
Cumulative loss
in OCI £m
Balance sheet surplus at 1 October (4,311) 4,707 396 (3,746) 3,958 212
(594) (704)
Total expense Current service cost – – – – – – Past service cost (1) – (1) (11) – (11) Interest (expense)/income (75) 82 7 (100) 107 7 Administrative costs – (6) (6) – (5) (5) Total (expense)/income recognised
in the consolidated income statement (76) 76 – (111) 102 (9)
Remeasurements Return on Scheme assets greater than
discount rate – 61 61 61 – 772 772 772
Actuarial: Gain/(loss) – experience adjustments 140 – 140 140 (9) – (9) (9)
Gain – demographic assumptions 116 – 116 116 30 – 30 30
Loss – financial assumptions (25) – (25) (25) (683) – (683) (683)
Remeasurement gains/(losses) recognised
in other comprehensive income 231 61 292 292 (662) 772 110 110
Contributions and payments Employer contributions – 35 35 – 83 83 Benefit payments 105 (105) – 96 (96) – Transfer payments 93 (93) – 112 (112) –
198 (163) 35 208 (125) 83 Balance sheet surplus at 30 September (3,958) 4,681 723 (4,311) 4,707 396
(302) (594)

105
Group financial statements
Notes to the consolidated financial statements Section 3: Assets and liabilities
3.10 Retirement benefit obligations continued
The expected contributions and expected benefit payments for the year ending 30 September 2021 are £39m (2020: £56m) and £108m (2020: £108m)
respectively.
The Group and Trustee have entered into a contingent security arrangement (the ‘Security Arrangement’) (note 5.3).
Maturity of Scheme liabilities
The estimated maturity period of Scheme obligations on an IAS 19 accounting basis is provided within the Group Annual Report & Accounts.
The discounted mean term of the defined benefit obligation at 30 September 2020 is 19 years (2019: 20 years).
Scheme assets
In order to meet the obligations of the Scheme, the Trustee invests in a diverse portfolio of assets, with the level and volatility of asset returns being a key
factor in the overall investment strategy. The investment portfolio is subject also to a range of risks typical of the types of assets held, such as: equity risk;
credit risk on bonds; currency risk; interest rate and inflation risk; and exposure to the property market. The Trustee’s investment strategy (including
physical assets and derivatives) seeks to reduce the Scheme’s exposure to these risks. In managing interest rate and inflation risks, the investment
strategy seeks to hold portfolios of matching assets (including derivatives) that enable the Scheme’s assets to better match movements in the value of
liabilities due to changes in interest rates and inflation.
As at 30 September 2020, the interest rate and inflation rate hedge ratios were around 97% and 84% respectively (2019: 85% and 75%) of the obligation
when measured on a self-sufficiency basis. This strategy reflects the Scheme’s obligation profile and the Trustee’s and the Group’s attitude to risk. The
Trustee monitors the investment objectives and asset allocation policy on a regular basis.
The Trustee’s investment strategy involves two main categories of investments:
• matching assets – a range of investments that provide a match to changes in obligation values; and
• return seeking assets – a range of investments designed to provide specific, planned and consistent returns.
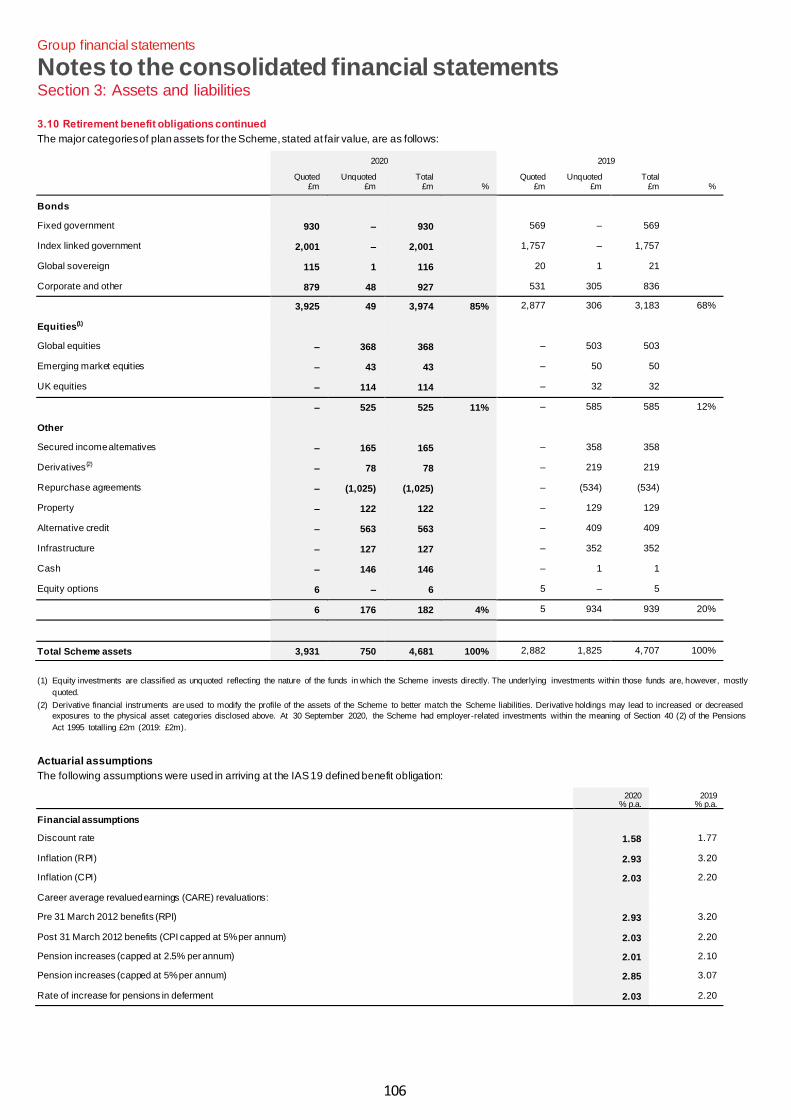
106
Group financial statements
Notes to the consolidated financial statements Section 3: Assets and liabilities
3.10 Retirement benefit obligations continued
The major categories of plan assets for the Scheme, stated at fair value, are as follows:
2020 2019
Quoted £m
Unquoted £m
Total £m %
Quoted
£m Unquoted
£m Total
£m %
Bonds Fixed government 930 – 930 569 – 569 Index linked government 2,001 – 2,001 1,757 – 1,757 Global sovereign 115 1 116 20 1 21 Corporate and other 879 48 927 531 305 836
3,925 49 3,974 85% 2,877 306 3,183 68%
Equities(1) Global equities – 368 368 – 503 503 Emerging market equities – 43 43 – 50 50 UK equities – 114 114 – 32 32
– 525 525 11% – 585 585 12%
Other Secured income alternatives – 165 165 – 358 358 Derivatives(2) – 78 78 – 219 219 Repurchase agreements – (1,025) (1,025) – (534) (534) Property – 122 122 – 129 129 Alternative credit – 563 563 – 409 409 Infrastructure – 127 127 – 352 352 Cash – 146 146 – 1 1 Equity options 6 – 6 5 – 5
6 176 182 4% 5 934 939 20%
Total Scheme assets 3,931 750 4,681 100% 2,882 1,825 4,707 100%
(1) Equity investments are classified as unquoted reflecting the nature of the funds in which the Scheme invests directly. The underlying investments within those funds are, however, mostly
quoted.
(2) Derivative financial instruments are used to modify the profile of the assets of the Scheme to better match the Scheme liabilities. Derivative holdings may lead to increased or decreased
exposures to the physical asset categories disclosed above.At 30 September 2020, the Scheme had employer-related investments within the meaning of Section 40 (2) of the Pensions
Act 1995 totalling £2m (2019: £2m).
Actuarial assumptions
The following assumptions were used in arriving at the IAS 19 defined benefit obligation:
2020 % p.a.
2019 % p.a.
Financial assumptions Discount rate 1.58 1.77
Inflation (RPI) 2.93 3.20
Inflation (CPI) 2.03 2.20
Career average revalued earnings (CARE) revaluations: Pre 31 March 2012 benefits (RPI) 2.93 3.20
Post 31 March 2012 benefits (CPI capped at 5% per annum) 2.03 2.20
Pension increases (capped at 2.5% per annum) 2.01 2.10
Pension increases (capped at 5% per annum) 2.85 3.07
Rate of increase for pensions in deferment 2.03 2.20
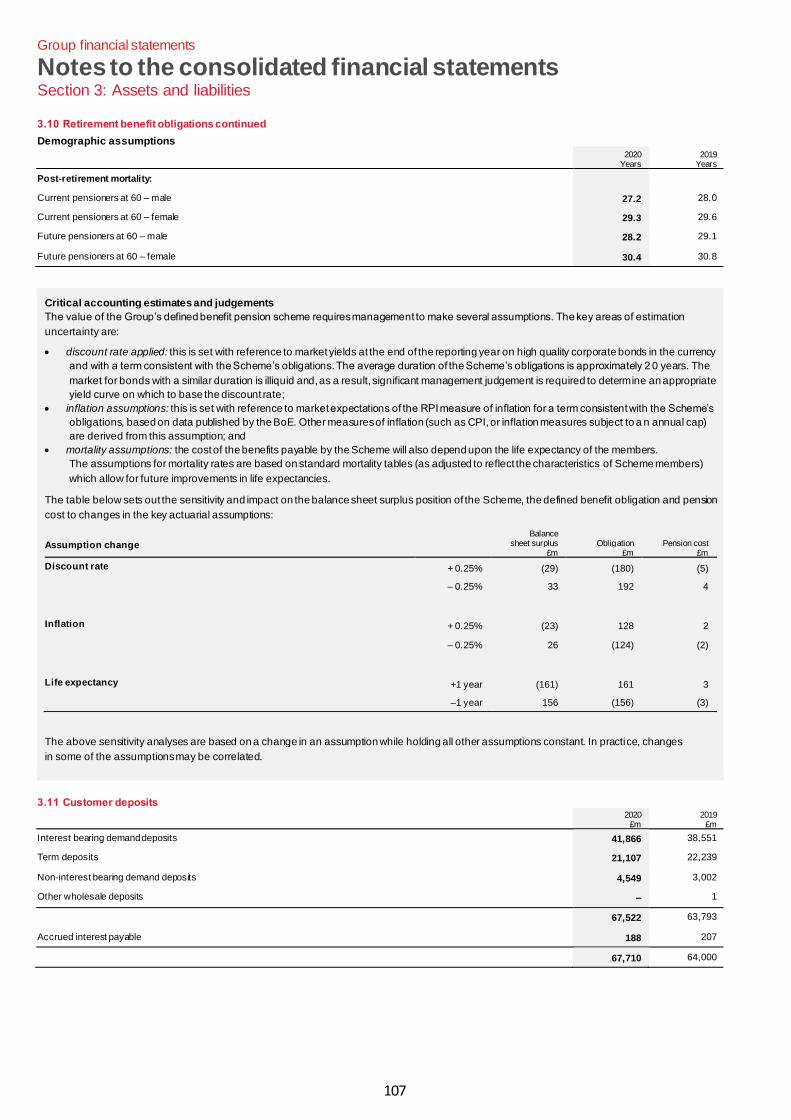
107
Group financial statements
Notes to the consolidated financial statements Section 3: Assets and liabilities
3.10 Retirement benefit obligations continued
Demographic assumptions
2020 Years
2019 Years
Post-retirement mortality: Current pensioners at 60 – male 27.2 28.0
Current pensioners at 60 – female 29.3 29.6
Future pensioners at 60 – male 28.2 29.1
Future pensioners at 60 – female 30.4 30.8
Critical accounting estimates and judgements
The value of the Group’s defined benefit pension scheme requires management to make several assumptions. The key areas of estimation
uncertainty are:
• discount rate applied: this is set with reference to market yields at the end of the reporting year on high quality corporate bonds in the currency
and with a term consistent with the Scheme’s obligations. The average duration of the Scheme’s obligations is approximately 2 0 years. The
market for bonds with a similar duration is illiquid and, as a result, significant management judgement is required to determine an appropriate
yield curve on which to base the discount rate;
• inflation assumptions: this is set with reference to market expectations of the RPI measure of inflation for a term consistent with the Scheme’s
obligations, based on data published by the BoE. Other measures of inflation (such as CPI, or inflation measures subject to a n annual cap)
are derived from this assumption; and
• mortality assumptions: the cost of the benefits payable by the Scheme will also depend upon the life expectancy of the members.
The assumptions for mortality rates are based on standard mortality tables (as adjusted to reflect the characteristics of Scheme members)
which allow for future improvements in life expectancies.
The table below sets out the sensitivity and impact on the balance sheet surplus position of the Scheme, the defined benefit obligation and pension
cost to changes in the key actuarial assumptions:
Assumption change Balance
sheet surplus £m
Obligation £m
Pension cost £m
Discount rate + 0.25% (29) (180) (5)
– 0.25% 33 192 4
Inflation + 0.25% (23) 128 2
– 0.25% 26 (124) (2)
Life expectancy +1 year (161) 161 3
–1 year 156 (156) (3)
The above sensitivity analyses are based on a change in an assumption while holding all other assumptions constant. In practice, changes
in some of the assumptions may be correlated.
3.11 Customer deposits
2020
£m 2019
£m
Interest bearing demand deposits 41,866 38,551
Term deposits 21,107 22,239
Non-interest bearing demand deposits 4,549 3,002
Other wholesale deposits – 1
67,522 63,793
Accrued interest payable 188 207
67,710 64,000
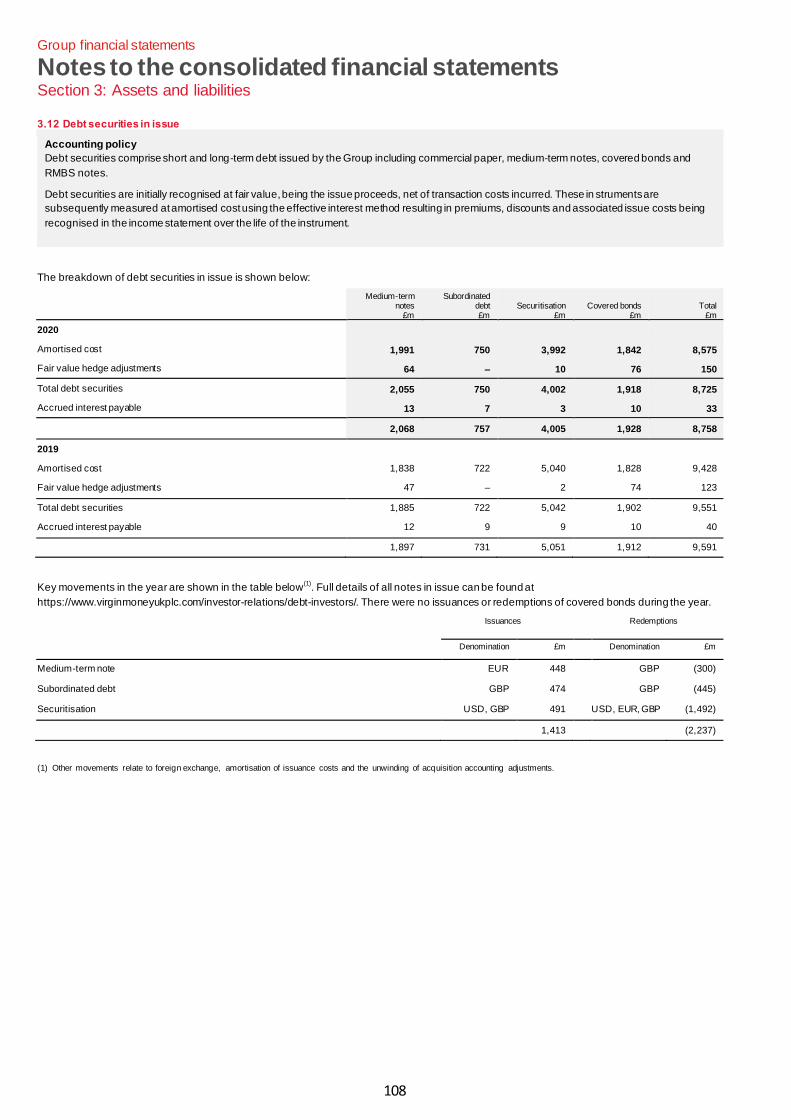
108
Group financial statements
Notes to the consolidated financial statements Section 3: Assets and liabilities
3.12 Debt securities in issue
Accounting policy
Debt securities comprise short and long-term debt issued by the Group including commercial paper, medium-term notes, covered bonds and
RMBS notes.
Debt securities are initially recognised at fair value, being the issue proceeds, net of transaction costs incurred. These in struments are
subsequently measured at amortised cost using the effective interest method resulting in premiums, discounts and associated issue costs being
recognised in the income statement over the life of the instrument.
The breakdown of debt securities in issue is shown below:
Medium-term
notes £m
Subordinated debt £m
Securitisation £m
Covered bonds £m
Total £m
2020 Amortised cost 1,991 750 3,992 1,842 8,575
Fair value hedge adjustments 64 – 10 76 150
Total debt securities 2,055 750 4,002 1,918 8,725
Accrued interest payable 13 7 3 10 33
2,068 757 4,005 1,928 8,758
2019 Amortised cost 1,838 722 5,040 1,828 9,428
Fair value hedge adjustments 47 – 2 74 123
Total debt securities 1,885 722 5,042 1,902 9,551
Accrued interest payable 12 9 9 10 40
1,897 731 5,051 1,912 9,591
Key movements in the year are shown in the table below(1)
. Full details of all notes in issue can be found at
https://www.virginmoneyukplc.com/investor-relations/debt-investors/. There were no issuances or redemptions of covered bonds during the year.
Issuances Redemptions
Denomination £m Denomination £m
Medium-term note EUR 448 GBP (300)
Subordinated debt GBP 474 GBP (445)
Securitisation USD, GBP 491 USD, EUR, GBP (1,492)
1,413 (2,237)
(1) Other movements relate to foreign exchange, amortisation of issuance costs and the unwinding of acquisition accounting adjustments.
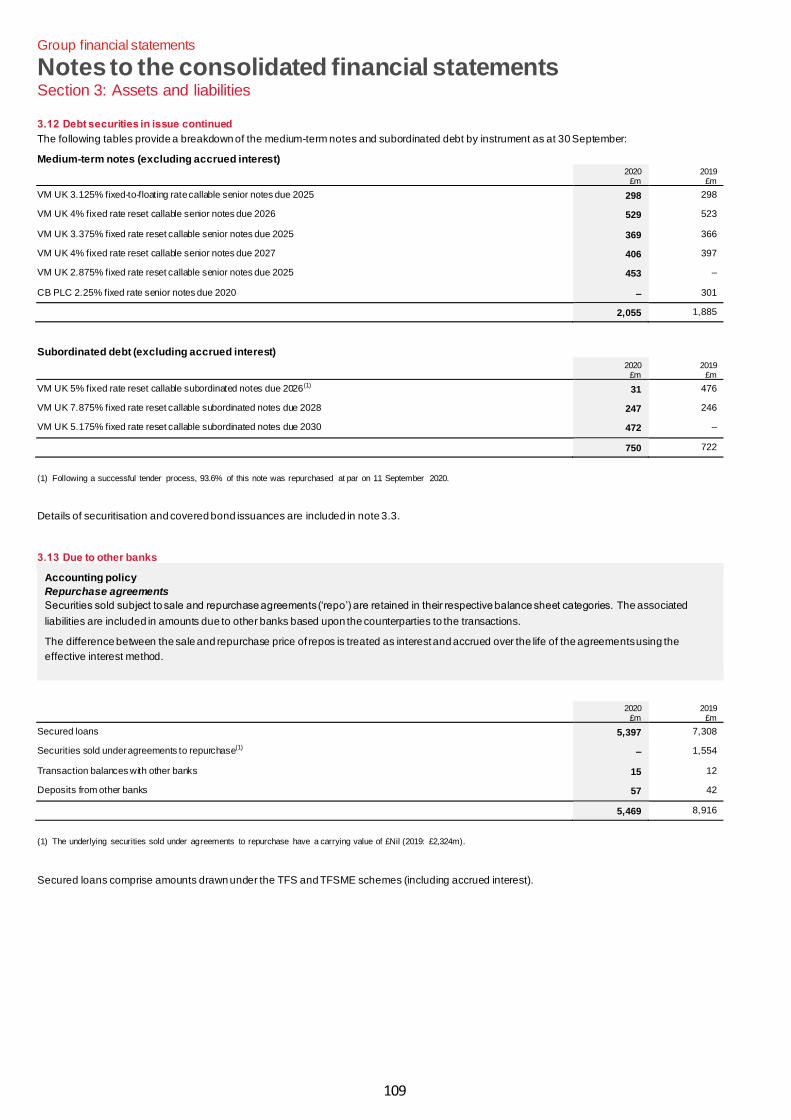
109
Group financial statements
Notes to the consolidated financial statements Section 3: Assets and liabilities
3.12 Debt securities in issue continued
The following tables provide a breakdown of the medium-term notes and subordinated debt by instrument as at 30 September:
Medium-term notes (excluding accrued interest)
2020 £m
2019 £m
VM UK 3.125% fixed-to-floating rate callable senior notes due 2025 298 298
VM UK 4% fixed rate reset callable senior notes due 2026 529 523
VM UK 3.375% fixed rate reset callable senior notes due 2025 369 366
VM UK 4% fixed rate reset callable senior notes due 2027 406 397
VM UK 2.875% fixed rate reset callable senior notes due 2025 453 –
CB PLC 2.25% fixed rate senior notes due 2020 – 301
2,055 1,885
Subordinated debt (excluding accrued interest)
2020 £m
2019 £m
VM UK 5% fixed rate reset callable subordinated notes due 2026(1) 31 476
VM UK 7.875% fixed rate reset callable subordinated notes due 2028 247 246
VM UK 5.175% fixed rate reset callable subordinated notes due 2030 472 –
750 722
(1) Following a successful tender process, 93.6% of this note was repurchased at par on 11 September 2020.
Details of securitisation and covered bond issuances are included in note 3.3.
3.13 Due to other banks
Accounting policy
Repurchase agreements
Securities sold subject to sale and repurchase agreements (‘repo’) are retained in their respective balance sheet categories. The associated
liabilities are included in amounts due to other banks based upon the counterparties to the transactions.
The difference between the sale and repurchase price of repos is treated as interest and accrued over the life of the agreements using the
effective interest method.
2020 £m
2019 £m
Secured loans 5,397 7,308
Securities sold under agreements to repurchase(1) – 1,554
Transaction balances with other banks 15 12
Deposits from other banks 57 42
5,469 8,916
(1) The underlying securities sold under agreements to repurchase have a carrying value of £Nil (2019: £2,324m).
Secured loans comprise amounts drawn under the TFS and TFSME schemes (including accrued interest).
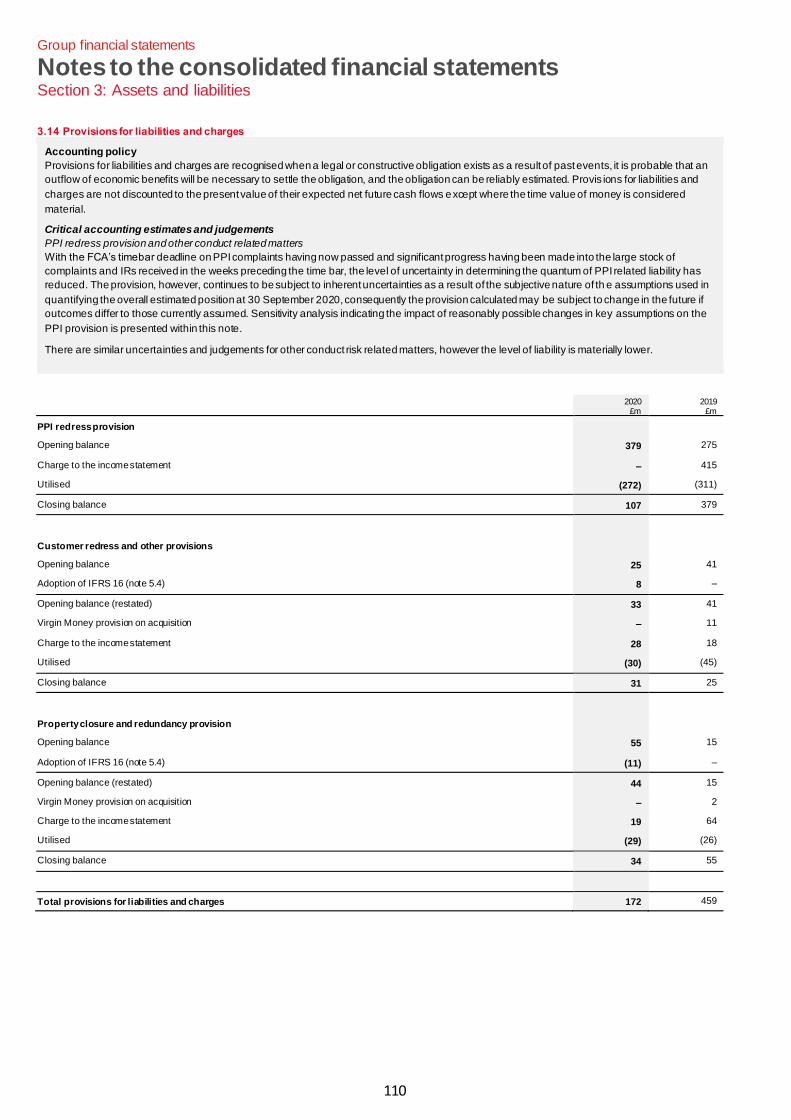
110
Group financial statements
Notes to the consolidated financial statements Section 3: Assets and liabilities
3.14 Provisions for liabilities and charges
Accounting policy
Provisions for liabilities and charges are recognised when a legal or constructive obligation exists as a result of past events, it is probable that an
outflow of economic benefits will be necessary to settle the obligation, and the obligation can be reliably estimated. Provis ions for liabilities and
charges are not discounted to the present value of their expected net future cash flows except where the time value of money is considered
material.
Critical accounting estimates and judgements
PPI redress provision and other conduct related matters
With the FCA’s timebar deadline on PPI complaints having now passed and significant progress having been made into the large stock of
complaints and IRs received in the weeks preceding the time bar, the level of uncertainty in determining the quantum of PPI related liability has
reduced. The provision, however, continues to be subject to inherent uncertainties as a result of the subjective nature of th e assumptions used in
quantifying the overall estimated position at 30 September 2020, consequently the provision calculated may be subject to change in the future if
outcomes differ to those currently assumed. Sensitivity analysis indicating the impact of reasonably possible changes in key assumptions on the
PPI provision is presented within this note.
There are similar uncertainties and judgements for other conduct risk related matters, however the level of liability is materially lower.
2020 £m
2019 £m
PPI redress provision Opening balance 379 275
Charge to the income statement – 415
Utilised (272) (311)
Closing balance 107 379
Customer redress and other provisions Opening balance 25 41
Adoption of IFRS 16 (note 5.4) 8 –
Opening balance (restated) 33 41
Virgin Money provision on acquisition – 11
Charge to the income statement 28 18
Utilised (30) (45)
Closing balance 31 25
Property closure and redundancy provision Opening balance 55 15
Adoption of IFRS 16 (note 5.4) (11) –
Opening balance (restated) 44 15
Virgin Money provision on acquisition – 2
Charge to the income statement 19 64
Utilised (29) (26)
Closing balance 34 55
Total provisions for liabilities and charges 172 459
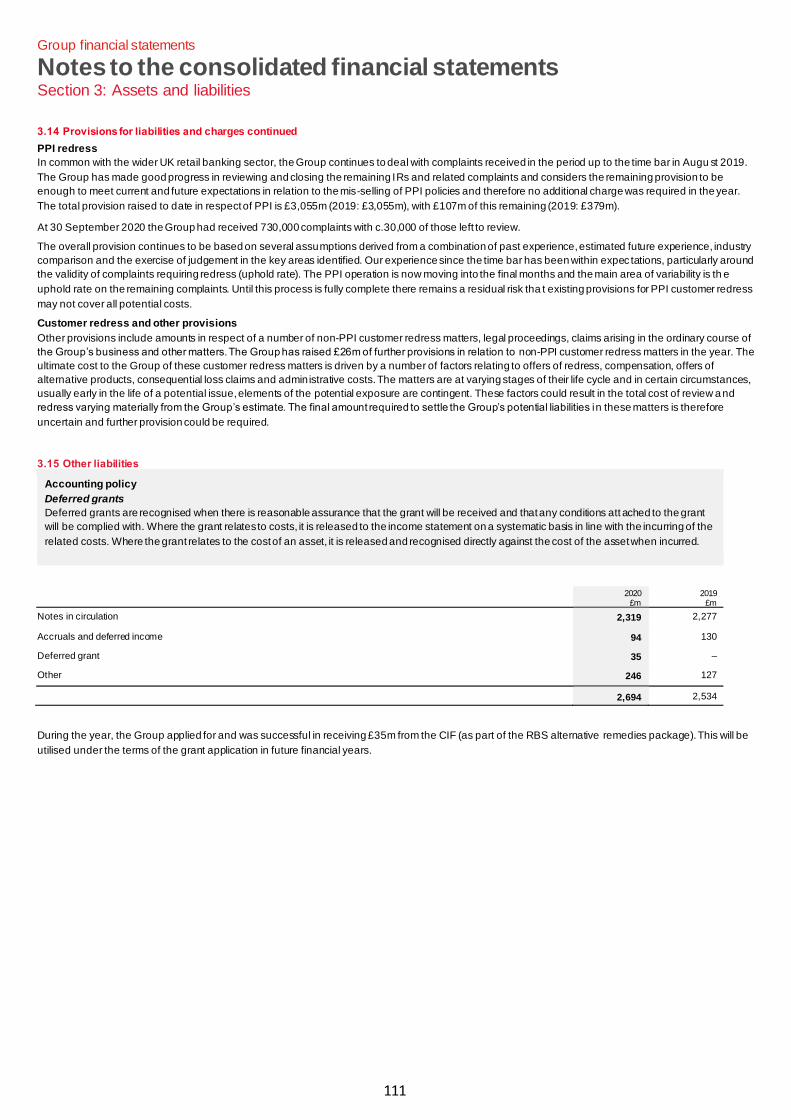
111
Group financial statements
Notes to the consolidated financial statements Section 3: Assets and liabilities
3.14 Provisions for liabilities and charges continued
PPI redress
In common with the wider UK retail banking sector, the Group continues to deal with complaints received in the period up to the time bar in Augu st 2019.
The Group has made good progress in reviewing and closing the remaining IRs and related complaints and considers the remaining provision to be
enough to meet current and future expectations in relation to the mis-selling of PPI policies and therefore no additional charge was required in the year.
The total provision raised to date in respect of PPI is £3,055m (2019: £3,055m), with £107m of this remaining (2019: £379m).
At 30 September 2020 the Group had received 730,000 complaints with c.30,000 of those left to review.
The overall provision continues to be based on several assumptions derived from a combination of past experience, estimated future experience, industry
comparison and the exercise of judgement in the key areas identified. Our experience since the time bar has been within expec tations, particularly around
the validity of complaints requiring redress (uphold rate). The PPI operation is now moving into the final months and the main area of variability is th e
uphold rate on the remaining complaints. Until this process is fully complete there remains a residual risk tha t existing provisions for PPI customer redress
may not cover all potential costs.
Customer redress and other provisions
Other provisions include amounts in respect of a number of non-PPI customer redress matters, legal proceedings, claims arising in the ordinary course of
the Group’s business and other matters. The Group has raised £26m of further provisions in relation to non-PPI customer redress matters in the year. The
ultimate cost to the Group of these customer redress matters is driven by a number of factors relating to offers of redress, compensation, offers of
alternative products, consequential loss claims and administrative costs. The matters are at varying stages of their life cycle and in certain circumstances,
usually early in the life of a potential issue, elements of the potential exposure are contingent. These factors could result in the total cost of review and
redress varying materially from the Group’s estimate. The final amount required to settle the Group’s potential liabilities in these matters is therefore
uncertain and further provision could be required.
3.15 Other liabilities
Accounting policy
Deferred grants
Deferred grants are recognised when there is reasonable assurance that the grant will be received and that any conditions att ached to the grant
will be complied with. Where the grant relates to costs, it is released to the income statement on a systematic basis in line with the incurring of the
related costs. Where the grant relates to the cost of an asset, it is released and recognised directly against the cost of the asset when incurred.
2020 £m
2019 £m
Notes in circulation 2,319 2,277
Accruals and deferred income 94 130
Deferred grant 35 –
Other 246 127
2,694 2,534
During the year, the Group applied for and was successful in receiving £35m from the CIF (as part of the RBS alternative remedies package). This will be
utilised under the terms of the grant application in future financial years.
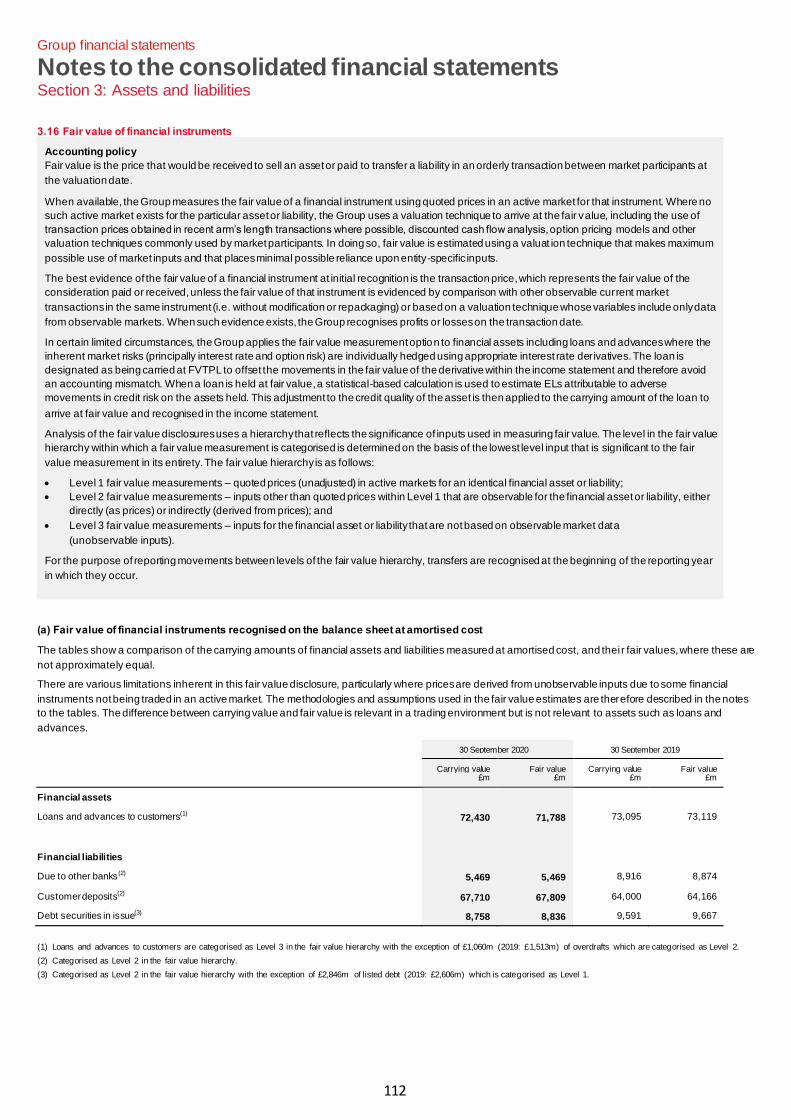
112
Group financial statements
Notes to the consolidated financial statements Section 3: Assets and liabilities
3.16 Fair value of financial instruments
Accounting policy
Fair value is the price that would be received to sell an asset or paid to transfer a liability in an orderly transaction between market participants at
the valuation date.
When available, the Group measures the fair value of a financial instrument using quoted prices in an active market for that instrument. Where no
such active market exists for the particular asset or liability, the Group uses a valuation technique to arrive at the fair value, including the use of
transaction prices obtained in recent arm’s length transactions where possible, discounted cash flow analysis, option pricing models and other
valuation techniques commonly used by market participants. In doing so, fair value is estimated using a valuat ion technique that makes maximum
possible use of market inputs and that places minimal possible reliance upon entity-specific inputs.
The best evidence of the fair value of a financial instrument at initial recognition is the transaction price, which represents the fair value of the
consideration paid or received, unless the fair value of that instrument is evidenced by comparison with other observable current market
transactions in the same instrument (i.e. without modification or repackaging) or based on a valuation technique whose variables include only data
from observable markets. When such evidence exists, the Group recognises profits or losses on the transaction date.
In certain limited circumstances, the Group applies the fair value measurement option to financial assets including loans and advances where the
inherent market risks (principally interest rate and option risk) are individually hedged using appropriate interest rate derivatives. The loan is
designated as being carried at FVTPL to offset the movements in the fair value of the derivative within the income statement and therefore avoid
an accounting mismatch. When a loan is held at fair value, a statistical-based calculation is used to estimate ELs attributable to adverse
movements in credit risk on the assets held. This adjustment to the credit quality of the asset is then applied to the carrying amount of the loan to
arrive at fair value and recognised in the income statement.
Analysis of the fair value disclosures uses a hierarchy that reflects the significance of inputs used in measuring fair value. The level in the fair value
hierarchy within which a fair value measurement is categorised is determined on the basis of the lowest level input that is significant to the fair
value measurement in its entirety. The fair value hierarchy is as follows:
• Level 1 fair value measurements – quoted prices (unadjusted) in active markets for an identical financial asset or liability;
• Level 2 fair value measurements – inputs other than quoted prices within Level 1 that are observable for the financial asset or liability, either
directly (as prices) or indirectly (derived from prices); and
• Level 3 fair value measurements – inputs for the financial asset or liability that are not based on observable market data
(unobservable inputs).
For the purpose of reporting movements between levels of the fair value hierarchy, transfers are recognised at the beginning of the reporting year
in which they occur.
(a) Fair value of financial instruments recognised on the balance sheet at amortised cost
The tables show a comparison of the carrying amounts of financial assets and liabilities measured at amortised cost, and thei r fair values, where these are
not approximately equal.
There are various limitations inherent in this fair value disclosure, particularly where prices are derived from unobservable inputs due to some financial
instruments not being traded in an active market. The methodologies and assumptions used in the fair value estimates are therefore described in the notes
to the tables. The difference between carrying value and fair value is relevant in a trading environment but is not relevant to assets such as loans and
advances.
30 September 2020 30 September 2019
Carrying value £m
Fair value £m
Carrying value £m
Fair value £m
Financial assets Loans and advances to customers(1) 72,430 71,788 73,095 73,119
Financial liabilities Due to other banks (2) 5,469 5,469 8,916 8,874
Customer deposits(2) 67,710 67,809 64,000 64,166
Debt securities in issue(3) 8,758 8,836 9,591 9,667
(1) Loans and advances to customers are categorised as Level 3 in the fair value hierarchy with the exception of £1,060m (2019: £1,513m) of overdrafts which are categorised as Level 2.
(2) Categorised as Level 2 in the fair value hierarchy.
(3) Categorised as Level 2 in the fair value hierarchy with the exception of £2,846m of listed debt (2019: £2,606m) which is categorised as Level 1.
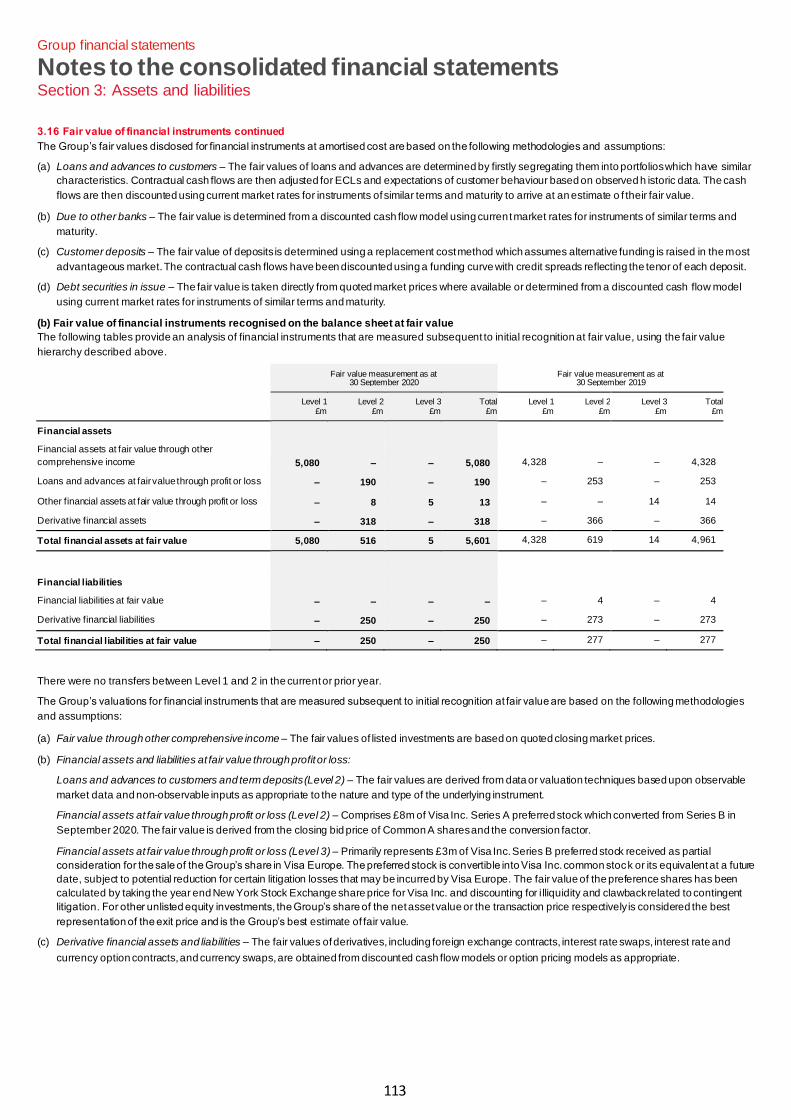
113
Group financial statements
Notes to the consolidated financial statements Section 3: Assets and liabilities
3.16 Fair value of financial instruments continued
The Group’s fair values disclosed for financial instruments at amortised cost are based on the following methodologies and assumptions:
(a) Loans and advances to customers – The fair values of loans and advances are determined by firstly segregating them into portfolios which have similar
characteristics. Contractual cash flows are then adjusted for ECLs and expectations of customer behaviour based on observed h istoric data. The cash
flows are then discounted using current market rates for instruments of similar terms and maturity to arrive at an estimate o f their fair value.
(b) Due to other banks – The fair value is determined from a discounted cash flow model using current market rates for instruments of similar terms and
maturity.
(c) Customer deposits – The fair value of deposits is determined using a replacement cost method which assumes alternative funding is raised in the most
advantageous market. The contractual cash flows have been discounted using a funding curve with credit spreads reflecting the tenor of each deposit.
(d) Debt securities in issue – The fair value is taken directly from quoted market prices where available or determined from a discounted cash flow model
using current market rates for instruments of similar terms and maturity.
(b) Fair value of financial instruments recognised on the balance sheet at fair value
The following tables provide an analysis of financial instruments that are measured subsequent to initial recognition at fair value, using the fair value
hierarchy described above.
Fair value measurement as at 30 September 2020
Fair value measurement as at 30 September 2019
Level 1 £m
Level 2 £m
Level 3 £m
Total £m
Level 1 £m
Level 2 £m
Level 3 £m
Total £m
Financial assets Financial assets at fair value through other
comprehensive income 5,080 – – 5,080 4,328 – – 4,328
Loans and advances at fair value through profit or loss – 190 – 190 – 253 – 253
Other financial assets at fair value through profit or loss – 8 5 13 – – 14 14
Derivative financial assets – 318 – 318 – 366 – 366
Total financial assets at fair value 5,080 516 5 5,601 4,328 619 14 4,961
Financial liabilities Financial liabilities at fair value – – – – – 4 – 4
Derivative financial liabilities – 250 – 250 – 273 – 273
Total financial liabilities at fair value – 250 – 250 – 277 – 277
There were no transfers between Level 1 and 2 in the current or prior year.
The Group’s valuations for financial instruments that are measured subsequent to initial recognition at fair value are based on the following methodologies
and assumptions:
(a) Fair value through other comprehensive income – The fair values of listed investments are based on quoted closing market prices.
(b) Financial assets and liabilities at fair value through profit or loss:
Loans and advances to customers and term deposits (Level 2) – The fair values are derived from data or valuation techniques based upon observable
market data and non-observable inputs as appropriate to the nature and type of the underlying instrument.
Financial assets at fair value through profit or loss (Level 2) – Comprises £8m of Visa Inc. Series A preferred stock which converted from Series B in
September 2020. The fair value is derived from the closing bid price of Common A shares and the conversion factor.
Financial assets at fair value through profit or loss (Level 3) – Primarily represents £3m of Visa Inc. Series B preferred stock received as partial
consideration for the sale of the Group’s share in Visa Europe. The preferred stock is convertible into Visa Inc. common stock or its equivalent at a future
date, subject to potential reduction for certain litigation losses that may be incurred by Visa Europe. The fair value of the preference shares has been
calculated by taking the year end New York Stock Exchange share price for Visa Inc. and discounting for i lliquidity and clawback related to contingent
litigation. For other unlisted equity investments, the Group’s share of the net asset value or the transaction price respectively is considered the best
representation of the exit price and is the Group’s best estimate of fair value.
(c) Derivative financial assets and liabilities – The fair values of derivatives, including foreign exchange contracts, interest rate swaps, interest rate and
currency option contracts, and currency swaps, are obtained from discounted cash flow models or option pricing models as appropriate.
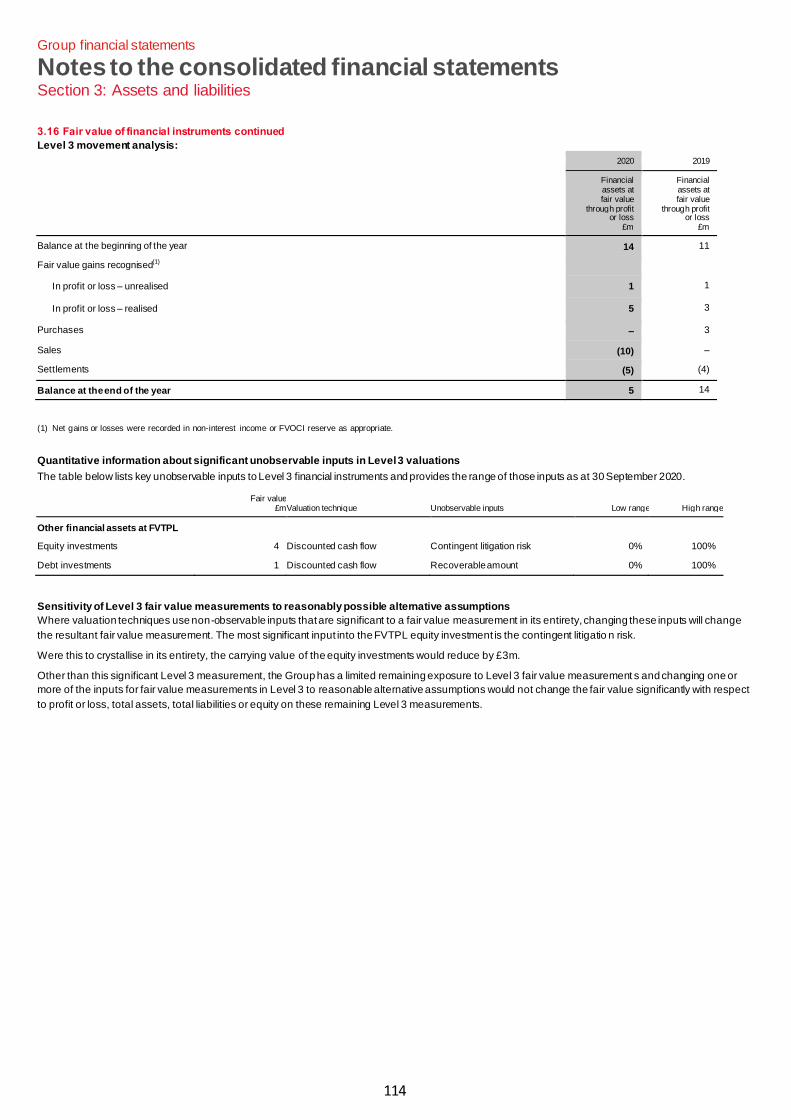
114
Group financial statements
Notes to the consolidated financial statements Section 3: Assets and liabilities
3.16 Fair value of financial instruments continued
Level 3 movement analysis:
2020 2019
Financial assets at fair value
through profit or loss
£m
Financial assets at fair value
through profit or loss
£m
Balance at the beginning of the year 14 11
Fair value gains recognised(1) In profit or loss – unrealised 1 1
In profit or loss – realised 5 3
Purchases – 3
Sales (10) –
Settlements (5) (4)
Balance at the end of the year 5 14
(1) Net gains or losses were recorded in non-interest income or FVOCI reserve as appropriate.
Quantitative information about significant unobservable inputs in Level 3 valuations
The table below lists key unobservable inputs to Level 3 financial instruments and provides the range of those inputs as at 30 September 2020.
Fair value £m Valuation technique Unobservable inputs Low range High range
Other financial assets at FVTPL Equity investments 4 Discounted cash flow Contingent litigation risk 0% 100%
Debt investments 1 Discounted cash flow Recoverable amount 0% 100%
Sensitivity of Level 3 fair value measurements to reasonably possible alternative assumptions
Where valuation techniques use non-observable inputs that are significant to a fair value measurement in its entirety, changing these inputs will change
the resultant fair value measurement. The most significant input into the FVTPL equity investment is the contingent litigatio n risk.
Were this to crystallise in its entirety, the carrying value of the equity investments would reduce by £3m.
Other than this significant Level 3 measurement, the Group has a limited remaining exposure to Level 3 fair value measurement s and changing one or
more of the inputs for fair value measurements in Level 3 to reasonable alternative assumptions would not change the fair value significantly with respect
to profit or loss, total assets, total liabilities or equity on these remaining Level 3 measurements.
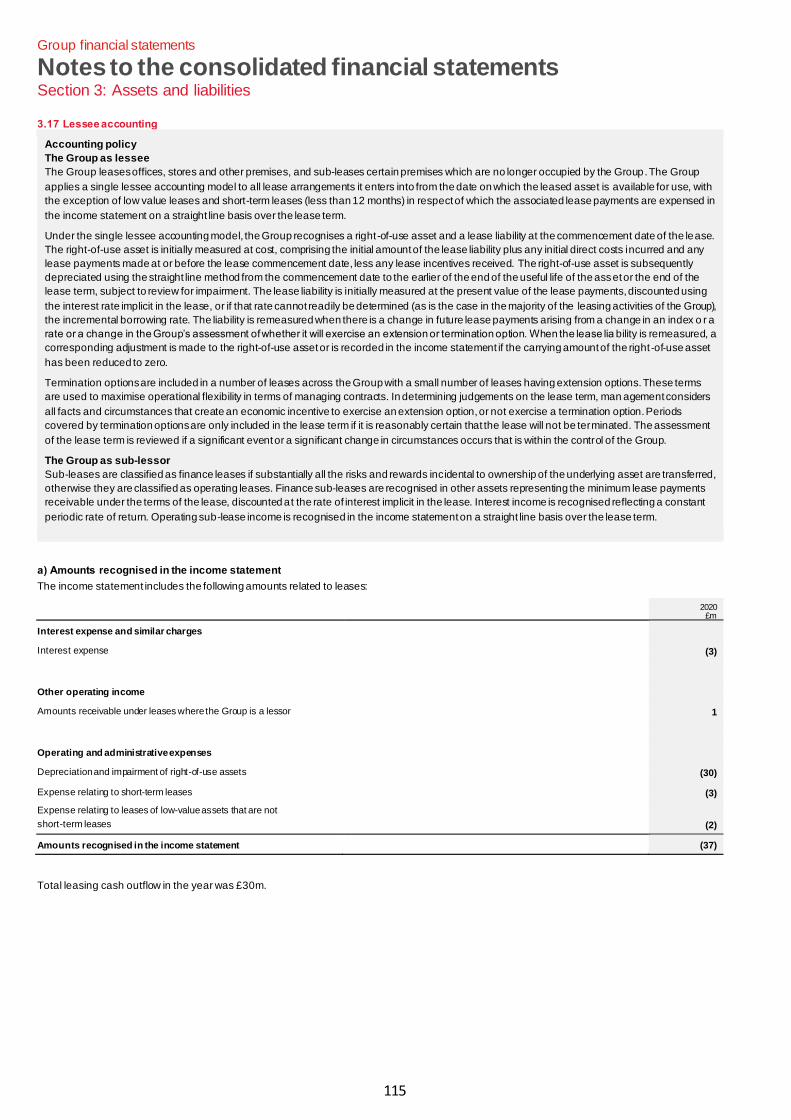
115
Group financial statements
Notes to the consolidated financial statements Section 3: Assets and liabilities
3.17 Lessee accounting
Accounting policy
The Group as lessee
The Group leases offices, stores and other premises, and sub-leases certain premises which are no longer occupied by the Group. The Group
applies a single lessee accounting model to all lease arrangements it enters into from the date on which the leased asset is available for use, with
the exception of low value leases and short-term leases (less than 12 months) in respect of which the associated lease payments are expensed in
the income statement on a straight line basis over the lease term.
Under the single lessee accounting model, the Group recognises a right-of-use asset and a lease liability at the commencement date of the lease.
The right-of-use asset is initially measured at cost, comprising the initial amount of the lease liability plus any initial direct costs incurred and any
lease payments made at or before the lease commencement date, less any lease incentives received. The right-of-use asset is subsequently
depreciated using the straight line method from the commencement date to the earlier of the end of the useful life of the asset or the end of the
lease term, subject to review for impairment. The lease liability is initially measured at the present value of the lease payments, discounted using
the interest rate implicit in the lease, or if that rate cannot readily be determined (as is the case in the majority of the leasing activities of the Group),
the incremental borrowing rate. The liability is remeasured when there is a change in future lease payments arising from a change in an index o r a
rate or a change in the Group’s assessment of whether it will exercise an extension or termination option. When the lease lia bility is remeasured, a
corresponding adjustment is made to the right-of-use asset or is recorded in the income statement if the carrying amount of the right ‑of‑use asset
has been reduced to zero.
Termination options are included in a number of leases across the Group with a small number of leases having extension options. These terms
are used to maximise operational flexibility in terms of managing contracts. In determining judgements on the lease term, man agement considers
all facts and circumstances that create an economic incentive to exercise an extension option, or not exercise a termination option. Periods
covered by termination options are only included in the lease term if it is reasonably certain that the lease will not be terminated. The assessment
of the lease term is reviewed if a significant event or a significant change in circumstances occurs that is within the control of the Group.
The Group as sub-lessor
Sub-leases are classified as finance leases if substantially all the risks and rewards incidental to ownership of the underlying asset are transferred,
otherwise they are classified as operating leases. Finance sub-leases are recognised in other assets representing the minimum lease payments
receivable under the terms of the lease, discounted at the rate of interest implicit in the lease. Interest income is recognised reflecting a constant
periodic rate of return. Operating sub-lease income is recognised in the income statement on a straight line basis over the lease term.
a) Amounts recognised in the income statement
The income statement includes the following amounts related to leases:
2020 £m
Interest expense and similar charges Interest expense (3)
Other operating income Amounts receivable under leases where the Group is a lessor 1
Operating and administrative expenses Depreciation and impairment of right-of-use assets (30)
Expense relating to short-term leases (3)
Expense relating to leases of low-value assets that are not
short-term leases (2)
Amounts recognised in the income statement (37)
Total leasing cash outflow in the year was £30m.

116
Group financial statements
Notes to the consolidated financial statements Section 3: Assets and liabilities
3.17 Lessee accounting continued
b) Amounts recognised on the balance sheet
Right-of-use assets
2020 £m
As at 30 September 2019 –
Adjustment on transition to IFRS 16 194
As at 1 October 2019 194
Additions 3
Remeasurements (6)
Depreciation and impairment (30)
As at 30 September 2020 161
All right-of-use assets relate to leases of land and buildings.
On 31 July 2020 the Group announced plans for the closure of 35 properties leased by the Group. The value of the right-of-use asset associated with
these properties at that time was £10m. Following the announcement, the recoverable amount of the right -of-use assets was assessed. Where it is
expected the Group can sub-lease the property, the value-in-use was determined on expected sub-lease income. Where the Group does not expect to be
able to generate any cash inflows beyond the closure date the value-in-use was determined to be £Nil. The discount rates used in the value-in-use
calculations ranged from 0.8%-1.6%. The total value-in-use was £4m resulting in an impairment charge of £6m, which has been recognised in other
operating and administration expenses. In addition to the impairment charge relating to the right-of-use assets, a provision has been recognised for other
costs associated with the closures (note 3.14).
On 30 September 2020 the Group also reviewed its existing surplus estate population for impairment. It was concluded that 27 properties should be
impaired following this assessment. The discount rates used in the value-in-use calculations ranged from 0.7%-1.7%. The total value-in-use was £4m
resulting in an impairment charge of £0.5m, which has been recognised in other operating and administrative expenses.
Sub-leases
Future undiscounted minimum payments receivable in respect of sub-leased assets at 30 September were as follows:
2020 £m
Operating leases 4
Finance leases 5
9
Lease liabilities
2020 £m
Lease liabilities(1) 175
(1) Lease liabilities are presented within other liabilities on the balance sheet.
Future undiscounted minimum payments under lease liabilities at 30 September 2020 were as follows:
Amounts falling due 2020 £m
Within 1 year 27
Between 1 and 5 years 84
Over 5 years 88
199
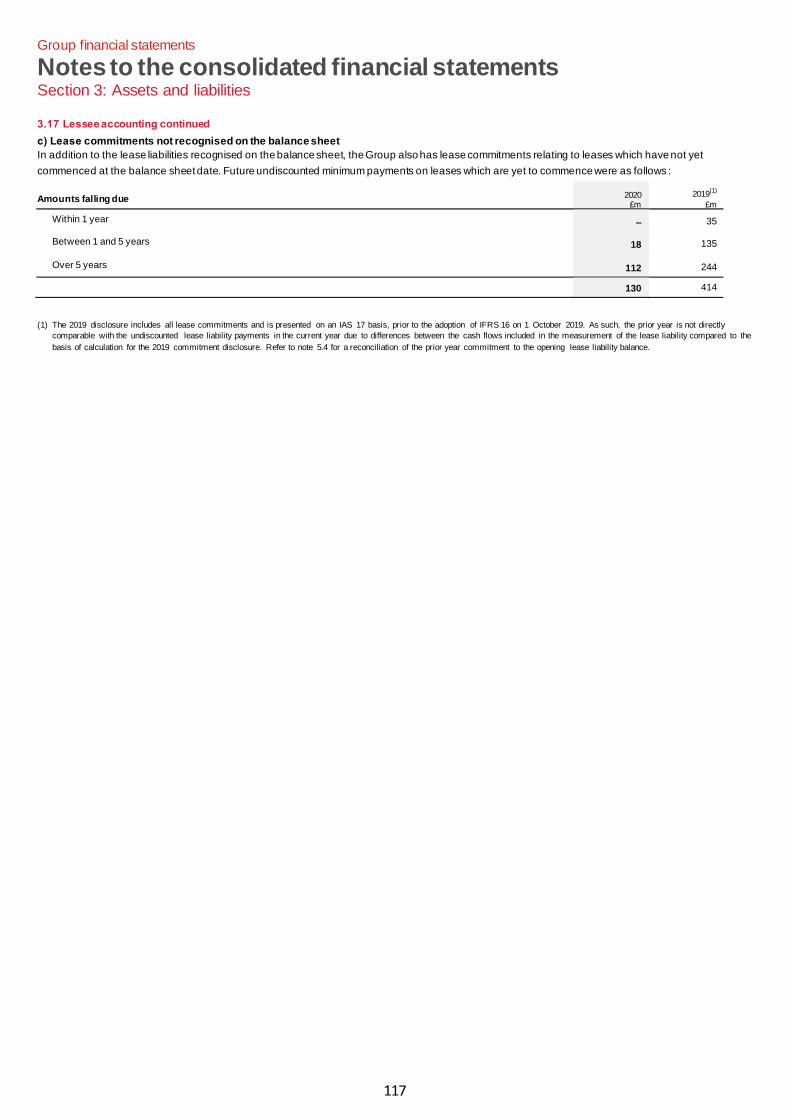
117
Group financial statements
Notes to the consolidated financial statements Section 3: Assets and liabilities
3.17 Lessee accounting continued
c) Lease commitments not recognised on the balance sheet
In addition to the lease liabilities recognised on the balance sheet, the Group also has lease commitments relating to leases which have not yet
commenced at the balance sheet date. Future undiscounted minimum payments on leases which are yet to commence were as follows :
Amounts falling due 2020 £m
2019(1)
£m
Within 1 year – 35
Between 1 and 5 years 18 135
Over 5 years 112 244
130 414
(1) The 2019 disclosure includes all lease commitments and is presented on an IAS 17 basis, prior to the adoption of IFRS 16 on 1 October 2019. As such, the prior year is not directly
comparable with the undiscounted lease liability payments in the current year due to differences between the cash flows included in the measurement of the lease liability compared to the
basis of calculation for the 2019 commitment disclosure. Refer to note 5.4 for a reconciliation of the prior year commitment to the opening lease liability balance.
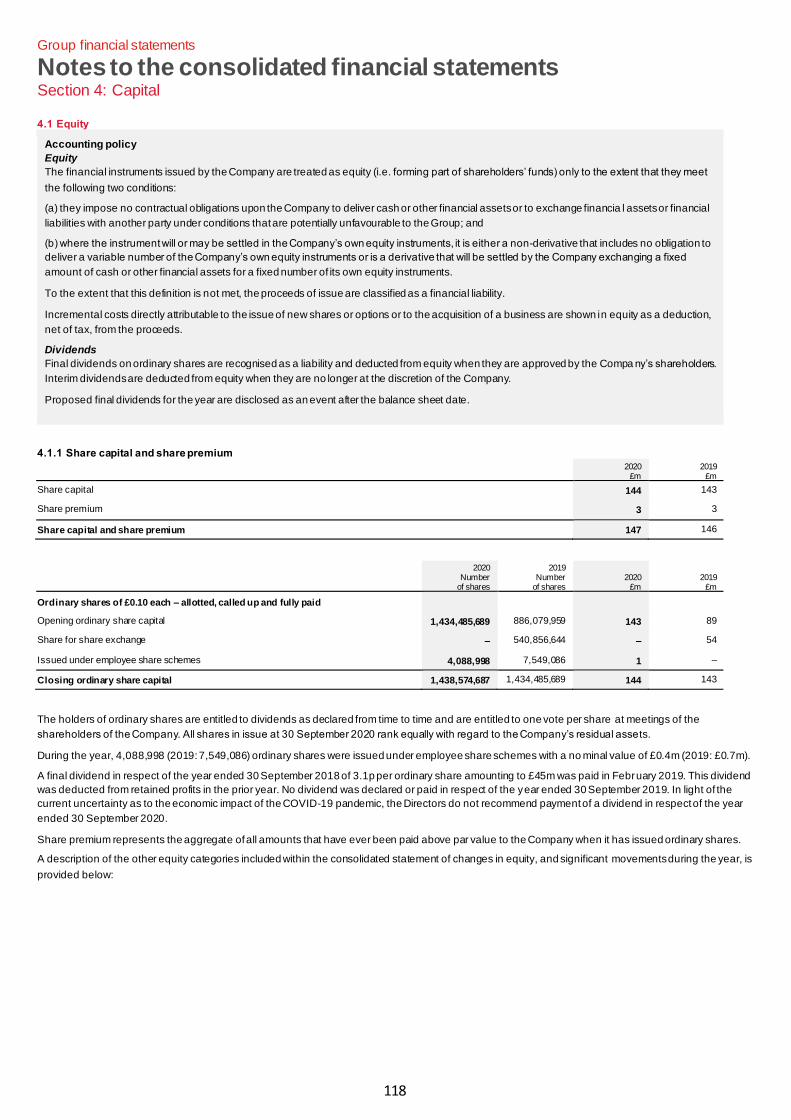
118
Group financial statements
Notes to the consolidated financial statements Section 4: Capital
4.1 Equity
Accounting policy
Equity
The financial instruments issued by the Company are treated as equity (i.e. forming part of shareholders’ funds) only to the extent that they meet
the following two conditions:
(a) they impose no contractual obligations upon the Company to deliver cash or other financial assets or to exchange financia l assets or financial
liabilities with another party under conditions that are potentially unfavourable to the Group; and
(b) where the instrument will or may be settled in the Company’s own equity instruments, it is either a non-derivative that includes no obligation to
deliver a variable number of the Company’s own equity instruments or is a derivative that will be settled by the Company exchanging a fixed
amount of cash or other financial assets for a fixed number of its own equity instruments.
To the extent that this definition is not met, the proceeds of issue are classified as a financial liability.
Incremental costs directly attributable to the issue of new shares or options or to the acquisition of a business are shown in equity as a deduction,
net of tax, from the proceeds.
Dividends
Final dividends on ordinary shares are recognised as a liability and deducted from equity when they are approved by the Compa ny’s shareholders.
Interim dividends are deducted from equity when they are no longer at the discretion of the Company.
Proposed final dividends for the year are disclosed as an event after the balance sheet date.
4.1.1 Share capital and share premium
2020
£m 2019
£m
Share capital 144 143
Share premium 3 3
Share capital and share premium 147 146
2020
Number of shares
2019 Number
of shares 2020
£m 2019
£m
Ordinary shares of £0.10 each – allotted, called up and fully paid Opening ordinary share capital 1,434,485,689 886,079,959 143 89
Share for share exchange – 540,856,644 – 54
Issued under employee share schemes 4,088,998 7,549,086 1 –
Closing ordinary share capital 1,438,574,687 1,434,485,689 144 143
The holders of ordinary shares are entitled to dividends as declared from time to time and are entitled to one vote per share at meetings of the
shareholders of the Company. All shares in issue at 30 September 2020 rank equally with regard to the Company’s residual assets.
During the year, 4,088,998 (2019: 7,549,086) ordinary shares were issued under employee share schemes with a no minal value of £0.4m (2019: £0.7m).
A final dividend in respect of the year ended 30 September 2018 of 3.1p per ordinary share amounting to £45m was paid in February 2019. This dividend
was deducted from retained profits in the prior year. No dividend was declared or paid in respect of the year ended 30 September 2019. In light of the
current uncertainty as to the economic impact of the COVID-19 pandemic, the Directors do not recommend payment of a dividend in respect of the year
ended 30 September 2020.
Share premium represents the aggregate of all amounts that have ever been paid above par value to the Company when it has issued ordinary shares.
A description of the other equity categories included within the consolidated statement of changes in equity, and significant movements during the year, is
provided below:
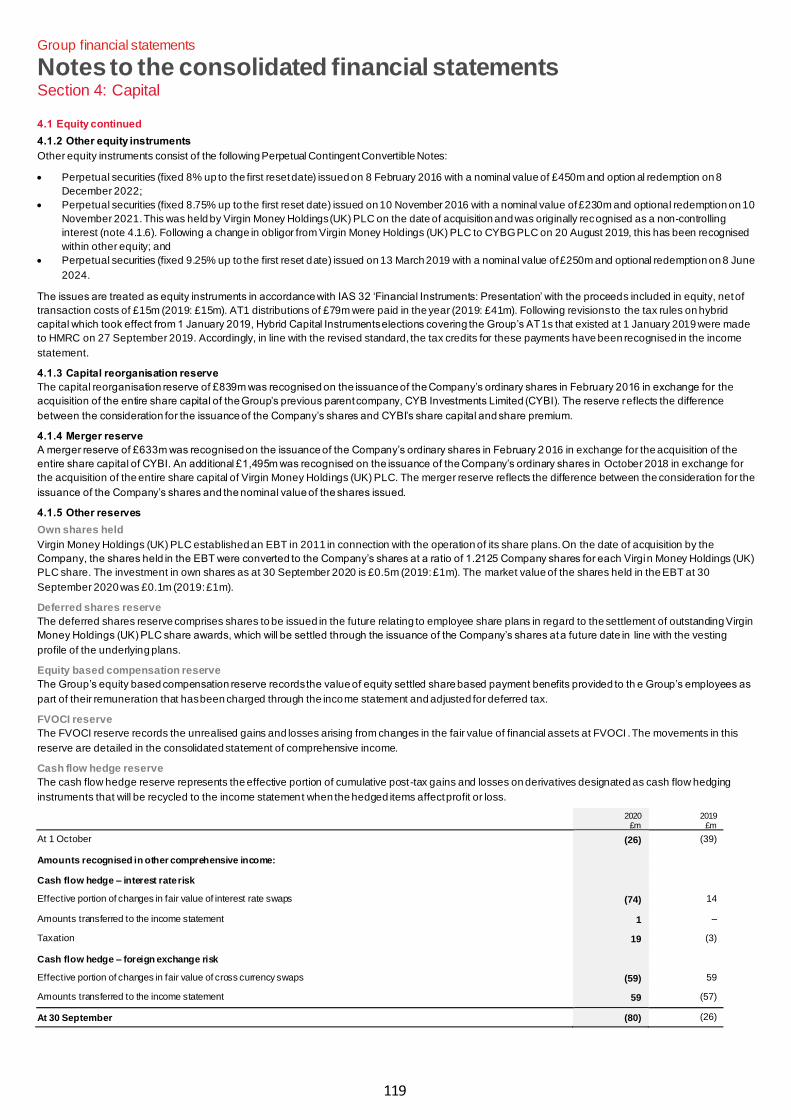
119
Group financial statements
Notes to the consolidated financial statements Section 4: Capital
4.1 Equity continued
4.1.2 Other equity instruments
Other equity instruments consist of the following Perpetual Contingent Convertible Notes:
• Perpetual securities (fixed 8% up to the first reset date) issued on 8 February 2016 with a nominal value of £450m and option al redemption on 8
December 2022;
• Perpetual securities (fixed 8.75% up to the first reset date) issued on 10 November 2016 with a nominal value of £230m and optional redemption on 10
November 2021. This was held by Virgin Money Holdings (UK) PLC on the date of acquisition and was originally recognised as a non-controlling
interest (note 4.1.6). Following a change in obligor from Virgin Money Holdings (UK) PLC to CYBG PLC on 20 August 2019, this has been recognised
within other equity; and
• Perpetual securities (fixed 9.25% up to the first reset date) issued on 13 March 2019 with a nominal value of £250m and optional redemption on 8 June
2024.
The issues are treated as equity instruments in accordance with IAS 32 ‘Financial Instruments: Presentation’ with the proceeds included in equity, net of
transaction costs of £15m (2019: £15m). AT1 distributions of £79m were paid in the year (2019: £41m). Following revisions to the tax rules on hybrid
capital which took effect from 1 January 2019, Hybrid Capital Instruments elections covering the Group’s AT1s that existed at 1 January 2019 were made
to HMRC on 27 September 2019. Accordingly, in line with the revised standard, the tax credits for these payments have been recognised in the income
statement.
4.1.3 Capital reorganisation reserve
The capital reorganisation reserve of £839m was recognised on the issuance of the Company’s ordinary shares in February 2016 in exchange for the
acquisition of the entire share capital of the Group’s previous parent company, CYB Investments Limited (CYBI). The reserve reflects the difference
between the consideration for the issuance of the Company’s shares and CYBI’s share capital and share premium.
4.1.4 Merger reserve
A merger reserve of £633m was recognised on the issuance of the Company’s ordinary shares in February 2 016 in exchange for the acquisition of the
entire share capital of CYBI. An additional £1,495m was recognised on the issuance of the Company’s ordinary shares in October 2018 in exchange for
the acquisition of the entire share capital of Virgin Money Holdings (UK) PLC. The merger reserve reflects the difference between the consideration for the
issuance of the Company’s shares and the nominal value of the shares issued.
4.1.5 Other reserves
Own shares held
Virgin Money Holdings (UK) PLC established an EBT in 2011 in connection with the operation of its share plans. On the date of acquisition by the
Company, the shares held in the EBT were converted to the Company’s shares at a ratio of 1.2125 Company shares for each Virgin Money Holdings (UK)
PLC share. The investment in own shares as at 30 September 2020 is £0.5m (2019: £1m). The market value of the shares held in the EBT at 30
September 2020 was £0.1m (2019: £1m).
Deferred shares reserve
The deferred shares reserve comprises shares to be issued in the future relating to employee share plans in regard to the settlement of outstanding Virgin
Money Holdings (UK) PLC share awards, which will be settled through the issuance of the Company’s shares at a future date in line with the vesting
profile of the underlying plans.
Equity based compensation reserve
The Group’s equity based compensation reserve records the value of equity settled share based payment benefits provided to th e Group’s employees as
part of their remuneration that has been charged through the income statement and adjusted for deferred tax.
FVOCI reserve
The FVOCI reserve records the unrealised gains and losses arising from changes in the fair value of financial assets at FVOCI . The movements in this
reserve are detailed in the consolidated statement of comprehensive income.
Cash flow hedge reserve
The cash flow hedge reserve represents the effective portion of cumulative post-tax gains and losses on derivatives designated as cash flow hedging
instruments that will be recycled to the income statement when the hedged items affect profit or loss.
2020
£m 2019
£m
At 1 October (26) (39)
Amounts recognised in other comprehensive income: Cash flow hedge – interest rate risk Effective portion of changes in fair value of interest rate swaps (74) 14
Amounts transferred to the income statement 1 –
Taxation 19 (3)
Cash flow hedge – foreign exchange risk Effective portion of changes in fair value of cross currency swaps (59) 59
Amounts transferred to the income statement 59 (57)
At 30 September (80) (26)
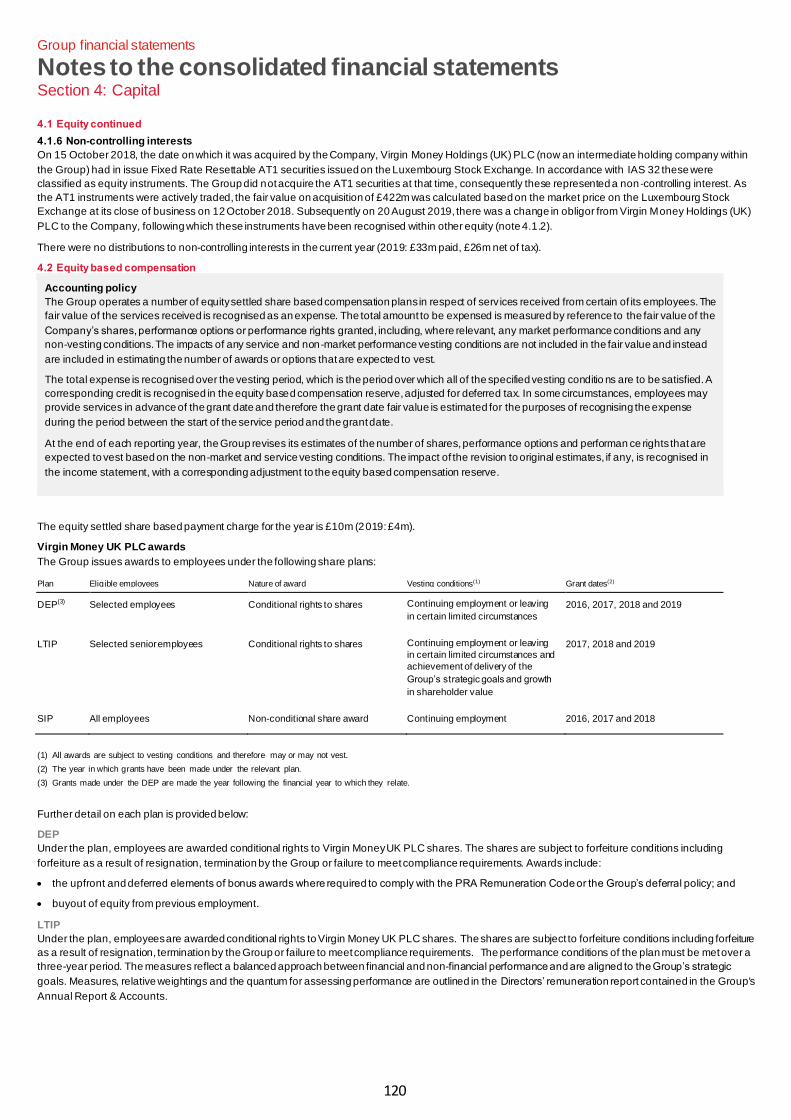
120
Group financial statements
Notes to the consolidated financial statements Section 4: Capital
4.1 Equity continued
4.1.6 Non-controlling interests
On 15 October 2018, the date on which it was acquired by the Company, Virgin Money Holdings (UK) PLC (now an intermediate holding company within
the Group) had in issue Fixed Rate Resettable AT1 securities issued on the Luxembourg Stock Exchange. In accordance with IAS 32 these were
classified as equity instruments. The Group did not acquire the AT1 securities at that time, consequently these represented a non-controlling interest. As
the AT1 instruments were actively traded, the fair value on acquisition of £422m was calculated based on the market price on the Luxembourg Stock
Exchange at its close of business on 12 October 2018. Subsequently on 20 August 2019, there was a change in obligor from Virgin Money Holdings (UK)
PLC to the Company, following which these instruments have been recognised within other equity (note 4.1.2).
There were no distributions to non-controlling interests in the current year (2019: £33m paid, £26m net of tax).
4.2 Equity based compensation
Accounting policy
The Group operates a number of equity settled share based compensation plans in respect of services received from certain of its employees. The
fair value of the services received is recognised as an expense. The total amount to be expensed is measured by reference to the fair value of the
Company’s shares, performance options or performance rights granted, including, where relevant, any market performance conditions and any
non-vesting conditions. The impacts of any service and non-market performance vesting conditions are not included in the fair value and instead
are included in estimating the number of awards or options that are expected to vest.
The total expense is recognised over the vesting period, which is the period over which all of the specified vesting conditio ns are to be satisfied. A
corresponding credit is recognised in the equity based compensation reserve, adjusted for deferred tax. In some circumstances, employees may
provide services in advance of the grant date and therefore the grant date fair value is estimated for the purposes of recognising the expense
during the period between the start of the service period and the grant date.
At the end of each reporting year, the Group revises its estimates of the number of shares, performance options and performan ce rights that are
expected to vest based on the non-market and service vesting conditions. The impact of the revision to original estimates, if any, is recognised in
the income statement, with a corresponding adjustment to the equity based compensation reserve.
The equity settled share based payment charge for the year is £10m (2019: £4m).
Virgin Money UK PLC awards
The Group issues awards to employees under the following share plans:
Plan Eligible employees Nature of award Vesting conditions(1) Grant dates(2)
DEP(3) Selected employees Conditional rights to shares Continuing employment or leaving
in certain limited circumstances
2016, 2017, 2018 and 2019
LTIP Selected senior employees Conditional rights to shares Continuing employment or leaving
in certain limited circumstances and
achievement of delivery of the
Group’s strategic goals and growth
in shareholder value
2017, 2018 and 2019
SIP All employees Non-conditional share award Continuing employment 2016, 2017 and 2018
(1) All awards are subject to vesting conditions and therefore may or may not vest.
(2) The year in which grants have been made under the relevant plan.
(3) Grants made under the DEP are made the year following the financial year to which they relate.
Further detail on each plan is provided below:
DEP
Under the plan, employees are awarded conditional rights to Virgin Money UK PLC shares. The shares are subject to forfeiture conditions including
forfeiture as a result of resignation, termination by the Group or failure to meet compliance requirements. Awards include:
• the upfront and deferred elements of bonus awards where required to comply with the PRA Remuneration Code or the Group’s deferral policy; and
• buyout of equity from previous employment.
LTIP
Under the plan, employees are awarded conditional rights to Virgin Money UK PLC shares. The shares are subject to forfeiture conditions including forfeiture
as a result of resignation, termination by the Group or failure to meet compliance requirements.The performance conditions of the plan must be met over a
three-year period. The measures reflect a balanced approach between financial and non-financial performance and are aligned to the Group’s strategic
goals. Measures, relative weightings and the quantum for assessing performance are outlined in the Directors’ remuneration report contained in the Group's
Annual Report & Accounts.
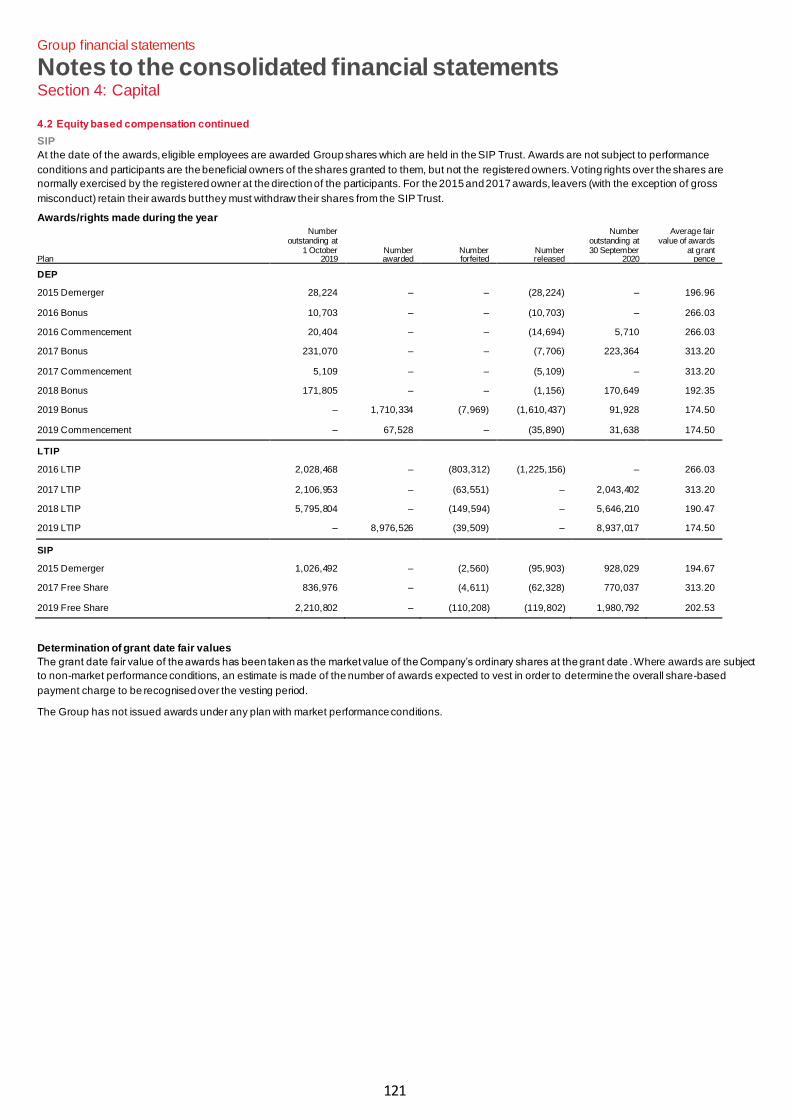
121
Group financial statements
Notes to the consolidated financial statements Section 4: Capital
4.2 Equity based compensation continued
SIP
At the date of the awards, eligible employees are awarded Group shares which are held in the SIP Trust. Awards are not subject to performance
conditions and participants are the beneficial owners of the shares granted to them, but not the registered owners. Voting rights over the shares are
normally exercised by the registered owner at the direction of the participants. For the 2015 and 2017 awards, leavers (with the exception of gross
misconduct) retain their awards but they must withdraw their shares from the SIP Trust.
Awards/rights made during the year
Plan
Number outstanding at
1 October 2019
Number awarded
Number forfeited
Number released
Number outstanding at 30 September
2020
Average fair value of awards
at grant pence
DEP 2015 Demerger 28,224 – – (28,224) – 196.96
2016 Bonus 10,703 – – (10,703) – 266.03
2016 Commencement 20,404 – – (14,694) 5,710 266.03
2017 Bonus 231,070 – – (7,706) 223,364 313.20
2017 Commencement 5,109 – – (5,109) – 313.20
2018 Bonus 171,805 – – (1,156) 170,649 192.35
2019 Bonus – 1,710,334 (7,969) (1,610,437) 91,928 174.50
2019 Commencement – 67,528 – (35,890) 31,638 174.50
LTIP 2016 LTIP 2,028,468 – (803,312) (1,225,156) – 266.03
2017 LTIP 2,106,953 – (63,551) – 2,043,402 313.20
2018 LTIP 5,795,804 – (149,594) – 5,646,210 190.47
2019 LTIP – 8,976,526 (39,509) – 8,937,017 174.50
SIP 2015 Demerger 1,026,492 – (2,560) (95,903) 928,029 194.67
2017 Free Share 836,976 – (4,611) (62,328) 770,037 313.20
2019 Free Share 2,210,802 – (110,208) (119,802) 1,980,792 202.53
Determination of grant date fair values
The grant date fair value of the awards has been taken as the market value of the Company’s ordinary shares at the grant date . Where awards are subject
to non-market performance conditions, an estimate is made of the number of awards expected to vest in order to determine the overall share-based
payment charge to be recognised over the vesting period.
The Group has not issued awards under any plan with market performance conditions.
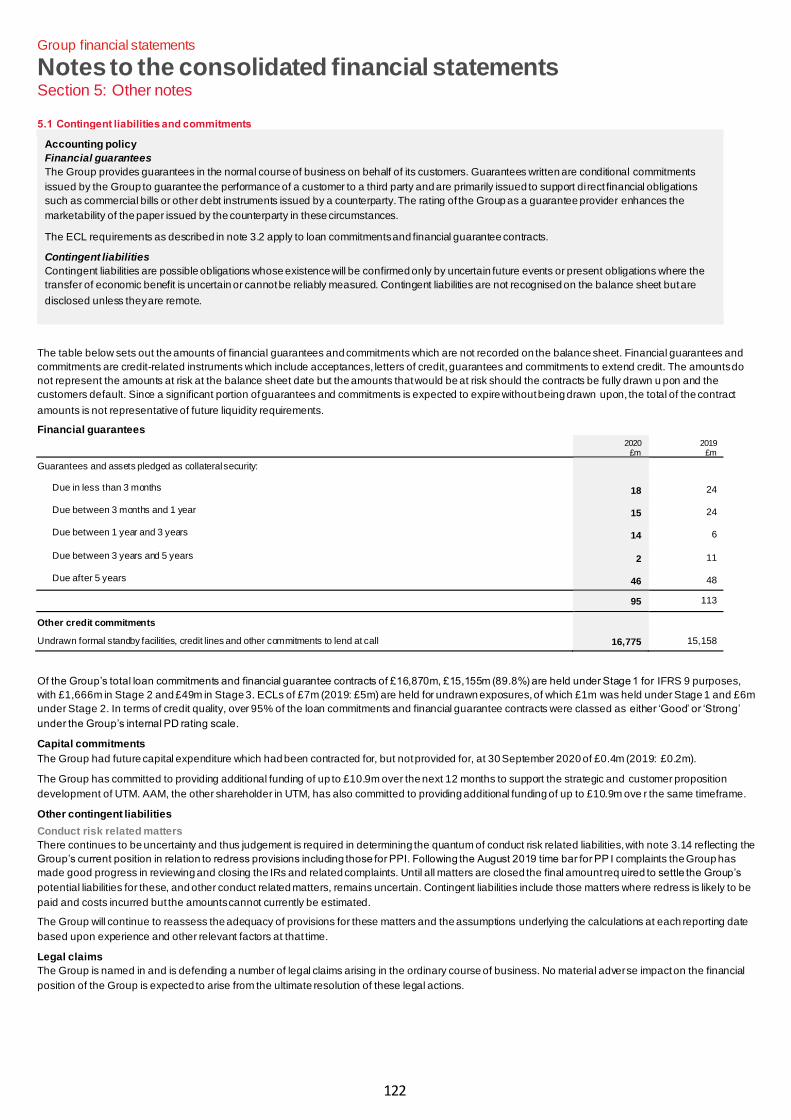
122
Group financial statements
Notes to the consolidated financial statements Section 5: Other notes
5.1 Contingent liabilities and commitments
Accounting policy
Financial guarantees
The Group provides guarantees in the normal course of business on behalf of its customers. Guarantees written are conditional commitments
issued by the Group to guarantee the performance of a customer to a third party and are primarily issued to support direct financial obligations
such as commercial bills or other debt instruments issued by a counterparty. The rating of the Group as a guarantee provider enhances the
marketability of the paper issued by the counterparty in these circumstances.
The ECL requirements as described in note 3.2 apply to loan commitments and financial guarantee contracts.
Contingent liabilities
Contingent liabilities are possible obligations whose existence will be confirmed only by uncertain future events or present obligations where the
transfer of economic benefit is uncertain or cannot be reliably measured. Contingent liabilities are not recognised on the balance sheet but are
disclosed unless they are remote.
The table below sets out the amounts of financial guarantees and commitments which are not recorded on the balance sheet. Financial guarantees and
commitments are credit-related instruments which include acceptances, letters of credit, guarantees and commitments to extend credit. The amounts do
not represent the amounts at risk at the balance sheet date but the amounts that would be at risk should the contracts be fully drawn u pon and the
customers default. Since a significant portion of guarantees and commitments is expected to expire without being drawn upon, the total of the contract
amounts is not representative of future liquidity requirements.
Financial guarantees
2020 £m
2019 £m
Guarantees and assets pledged as collateral security: Due in less than 3 months 18 24
Due between 3 months and 1 year 15 24
Due between 1 year and 3 years 14 6
Due between 3 years and 5 years 2 11
Due after 5 years 46 48
95 113
Other credit commitments Undrawn formal standby facilities, credit lines and other commitments to lend at call 16,775 15,158
Of the Group’s total loan commitments and financial guarantee contracts of £16,870m, £15,155m (89.8%) are held under Stage 1 for IFRS 9 purposes,
with £1,666m in Stage 2 and £49m in Stage 3. ECLs of £7m (2019: £5m) are held for undrawn exposures, of which £1m was held under Stage 1 and £6m
under Stage 2. In terms of credit quality, over 95% of the loan commitments and financial guarantee contracts were classed as either ‘Good’ or ‘Strong’
under the Group’s internal PD rating scale.
Capital commitments
The Group had future capital expenditure which had been contracted for, but not provided for, at 30 September 2020 of £0.4m (2019: £0.2m).
The Group has committed to providing additional funding of up to £10.9m over the next 12 months to support the strategic and customer proposition
development of UTM. AAM, the other shareholder in UTM, has also committed to providing additional funding of up to £10.9m ove r the same timeframe.
Other contingent liabilities
Conduct risk related matters
There continues to be uncertainty and thus judgement is required in determining the quantum of conduct risk related liabilities, with note 3.14 reflecting the
Group’s current position in relation to redress provisions including those for PPI. Following the August 2019 time bar for PP I complaints the Group has
made good progress in reviewing and closing the IRs and related complaints. Until all matters are closed the final amount req uired to settle the Group’s
potential liabilities for these, and other conduct related matters, remains uncertain. Contingent liabilities include those matters where redress is likely to be
paid and costs incurred but the amounts cannot currently be estimated.
The Group will continue to reassess the adequacy of provisions for these matters and the assumptions underlying the calculations at each reporting date
based upon experience and other relevant factors at that time.
Legal claims
The Group is named in and is defending a number of legal claims arising in the ordinary course of business. No material adverse impact on the financial
position of the Group is expected to arise from the ultimate resolution of these legal actions.
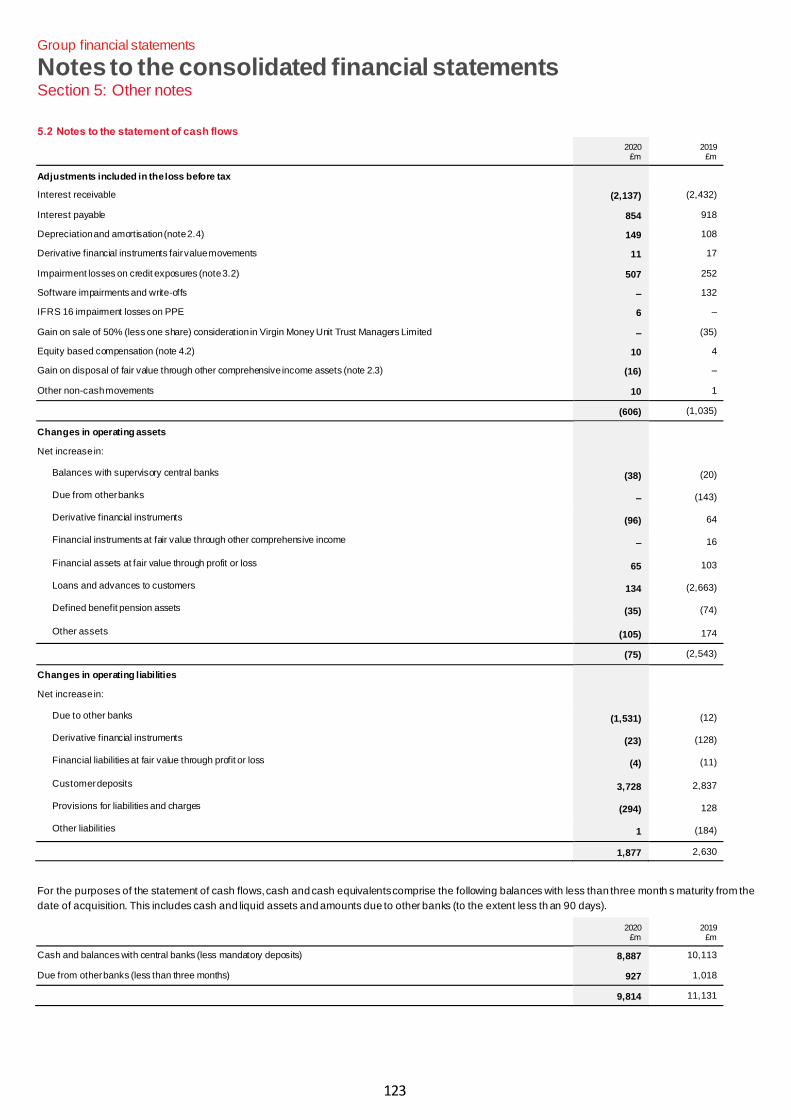
123
Group financial statements
Notes to the consolidated financial statements Section 5: Other notes
5.2 Notes to the statement of cash flows
2020 £m
2019 £m
Adjustments included in the loss before tax Interest receivable (2,137) (2,432)
Interest payable 854 918
Depreciation and amortisation (note 2.4) 149 108
Derivative financial instruments fair value movements 11 17
Impairment losses on credit exposures (note 3.2) 507 252
Software impairments and write-offs – 132
IFRS 16 impairment losses on PPE 6 –
Gain on sale of 50% (less one share) consideration in Virgin Money Unit Trust Managers Limited – (35)
Equity based compensation (note 4.2) 10 4
Gain on disposal of fair value through other comprehensive income assets (note 2.3) (16) –
Other non-cash movements 10 1
(606) (1,035)
Changes in operating assets Net increase in:
Balances with supervisory central banks (38) (20)
Due from other banks – (143)
Derivative financial instruments (96) 64
Financial instruments at fair value through other comprehensive income – 16
Financial assets at fair value through profit or loss 65 103
Loans and advances to customers 134 (2,663)
Defined benefit pension assets (35) (74)
Other assets (105) 174
(75) (2,543)
Changes in operating liabilities Net increase in:
Due to other banks (1,531) (12)
Derivative financial instruments (23) (128)
Financial liabilities at fair value through profit or loss (4) (11)
Customer deposits 3,728 2,837
Provisions for liabilities and charges (294) 128
Other liabilities 1 (184)
1,877 2,630
For the purposes of the statement of cash flows, cash and cash equivalents comprise the following balances with less than three month s maturity from the
date of acquisition. This includes cash and liquid assets and amounts due to other banks (to the extent less th an 90 days).
2020 £m
2019 £m
Cash and balances with central banks (less mandatory deposits) 8,887 10,113
Due from other banks (less than three months) 927 1,018
9,814 11,131
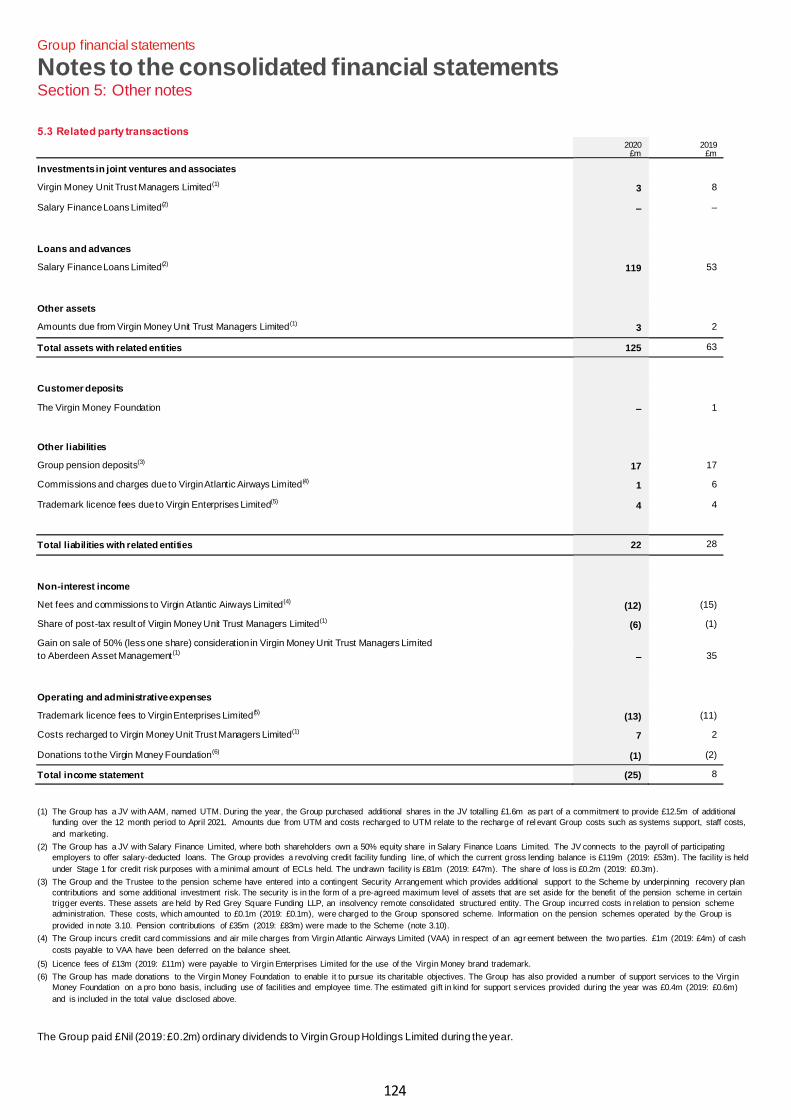
124
Group financial statements
Notes to the consolidated financial statements Section 5: Other notes
5.3 Related party transactions
2020 £m
2019 £m
Investments in joint ventures and associates Virgin Money Unit Trust Managers Limited(1) 3 8
Salary Finance Loans Limited(2) – –
Loans and advances Salary Finance Loans Limited(2) 119 53
Other assets Amounts due from Virgin Money Unit Trust Managers Limited(1) 3 2
Total assets with related entities 125 63
Customer deposits The Virgin Money Foundation – 1
Other liabilities Group pension deposits(3) 17 17
Commissions and charges due to Virgin Atlantic Airways Limited(4) 1 6
Trademark licence fees due to Virgin Enterprises Limited(5) 4 4
Total liabilities with related entities 22 28
Non-interest income Net fees and commissions to Virgin Atlantic Airways Limited(4) (12) (15)
Share of post-tax result of Virgin Money Unit Trust Managers Limited(1) (6) (1)
Gain on sale of 50% (less one share) consideration in Virgin Money Unit Trust Managers Limited
to Aberdeen Asset Management(1) – 35
Operating and administrative expenses Trademark licence fees to Virgin Enterprises Limited(5) (13) (11)
Costs recharged to Virgin Money Unit Trust Managers Limited(1) 7 2
Donations to the Virgin Money Foundation(6) (1) (2)
Total income statement (25) 8
(1) The Group has a JV with AAM, named UTM. During the year, the Group purchased additional shares in the JV totalling £1.6m as part of a commitment to provide £12.5m of additional
funding over the 12 month period to April 2021. Amounts due from UTM and costs recharged to UTM relate to the recharge of rel evant Group costs such as systems support, staff costs,
and marketing.
(2) The Group has a JV with Salary Finance Limited, where both shareholders own a 50% equity share in Salary Finance Loans Limited. The JV connects to the payroll of participating
employers to offer salary-deducted loans. The Group provides a revolving credit facility funding line, of which the current gross lending balance is £119m (2019: £53m). The facility is held
under Stage 1 for credit risk purposes with a minimal amount of ECLs held. The undrawn facility is £81m (2019: £47m). The share of loss is £0.2m (2019: £0.3m).
(3) The Group and the Trustee to the pension scheme have entered into a contingent Security Arrangement which provides additional support to the Scheme by underpinning recovery plan
contributions and some additional investment risk. The security is in the form of a pre-agreed maximum level of assets that are set aside for the benefit of the pension scheme in certain
trigger events. These assets are held by Red Grey Square Funding LLP, an insolvency remote consolidated structured entity. The Group incurred costs in relation to pension scheme
administration. These costs, which amounted to £0.1m (2019: £0.1m), were charged to the Group sponsored scheme. Information on the pension schemes operated by the Group is
provided in note 3.10. Pension contributions of £35m (2019: £83m) were made to the Scheme (note 3.10).
(4) The Group incurs credit card commissions and air mile charges from Virgin Atlantic Airways Limited (VAA) in respect of an agr eement between the two parties. £1m (2019: £4m) of cash
costs payable to VAA have been deferred on the balance sheet.
(5) Licence fees of £13m (2019: £11m) were payable to Virgin Enterprises Limited for the use of the Virgin Money brand trademark.
(6) The Group has made donations to the Virgin Money Foundation to enable it to pursue its charitable objectives. The Group has also provided a number of support services to the Virgin
Money Foundation on a pro bono basis, including use of facilities and employee time. The estimated gift in kind for support services provided during the year was £0.4m (2019: £0.6m)
and is included in the total value disclosed above.
The Group paid £Nil (2019: £0.2m) ordinary dividends to Virgin Group Holdings Limited during the year.
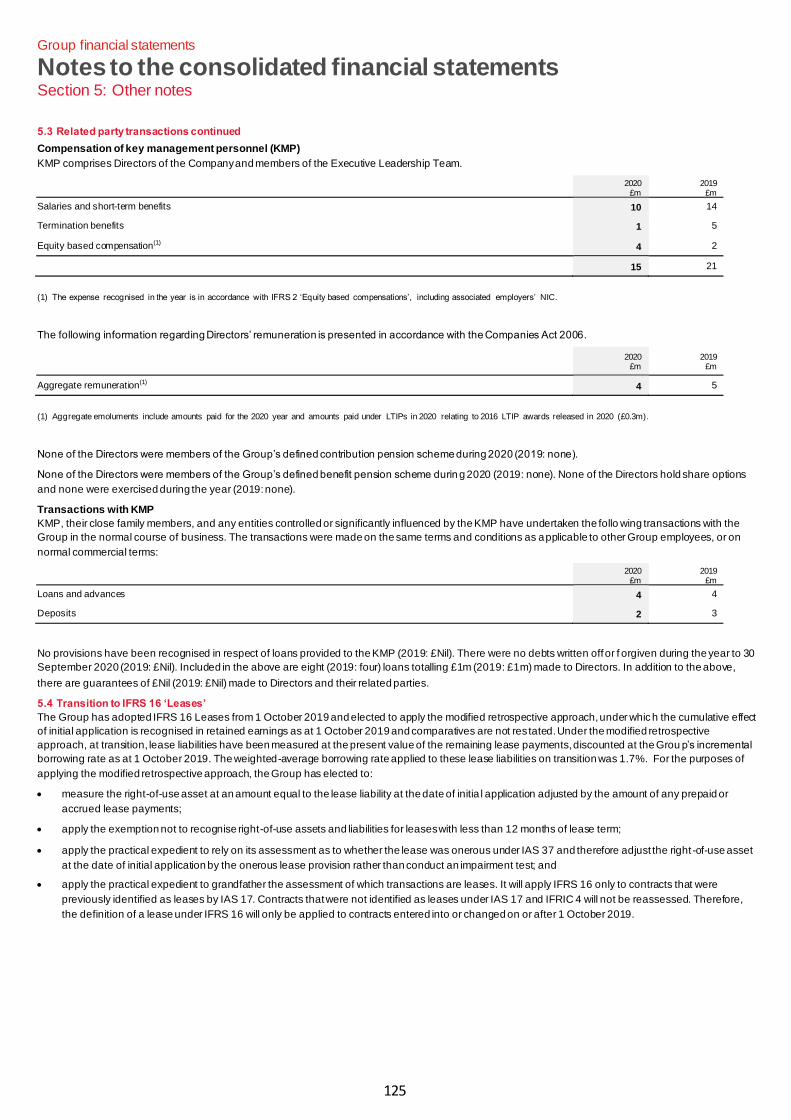
125
Group financial statements
Notes to the consolidated financial statements Section 5: Other notes
5.3 Related party transactions continued
Compensation of key management personnel (KMP)
KMP comprises Directors of the Company and members of the Executive Leadership Team.
2020
£m 2019
£m
Salaries and short-term benefits 10 14
Termination benefits 1 5
Equity based compensation(1) 4 2
15 21
(1) The expense recognised in the year is in accordance with IFRS 2 ‘Equity based compensations’, including associated employers’ NIC.
The following information regarding Directors’ remuneration is presented in accordance with the Companies Act 2006.
2020 £m
2019 £m
Aggregate remuneration(1) 4 5
(1) Aggregate emoluments include amounts paid for the 2020 year and amounts paid under LTIPs in 2020 relating to 2016 LTIP awards released in 2020 (£0.3m).
None of the Directors were members of the Group’s defined contribution pension scheme during 2020 (2019: none).
None of the Directors were members of the Group’s defined benefit pension scheme durin g 2020 (2019: none). None of the Directors hold share options
and none were exercised during the year (2019: none).
Transactions with KMP
KMP, their close family members, and any entities controlled or significantly influenced by the KMP have undertaken the follo wing transactions with the
Group in the normal course of business. The transactions were made on the same terms and conditions as applicable to other Group employees, or on
normal commercial terms:
2020 £m
2019 £m
Loans and advances 4 4
Deposits 2 3
No provisions have been recognised in respect of loans provided to the KMP (2019: £Nil). There were no debts written off or f orgiven during the year to 30
September 2020 (2019: £Nil). Included in the above are eight (2019: four) loans totalling £1m (2019: £1m) made to Directors. In addition to the above,
there are guarantees of £Nil (2019: £Nil) made to Directors and their related parties.
5.4 Transition to IFRS 16 ‘Leases’
The Group has adopted IFRS 16 Leases from 1 October 2019 and elected to apply the modified retrospective approach, under which the cumulative effect
of initial application is recognised in retained earnings as at 1 October 2019 and comparatives are not restated. Under the modified retrospective
approach, at transition, lease liabilities have been measured at the present value of the remaining lease payments, discounted at the Grou p’s incremental
borrowing rate as at 1 October 2019. The weighted-average borrowing rate applied to these lease liabilities on transition was 1.7%.For the purposes of
applying the modified retrospective approach, the Group has elected to:
• measure the right-of-use asset at an amount equal to the lease liability at the date of initia l application adjusted by the amount of any prepaid or
accrued lease payments;
• apply the exemption not to recognise right-of-use assets and liabilities for leases with less than 12 months of lease term;
• apply the practical expedient to rely on its assessment as to whether the lease was onerous under IAS 37 and therefore adjust the right -of-use asset
at the date of initial application by the onerous lease provision rather than conduct an impairment test; and
• apply the practical expedient to grandfather the assessment of which transactions are leases. It will apply IFRS 16 only to contracts that were
previously identified as leases by IAS 17. Contracts that were not identified as leases under IAS 17 and IFRIC 4 will not be reassessed. Therefore,
the definition of a lease under IFRS 16 will only be applied to contracts entered into or changed on or after 1 October 2019.
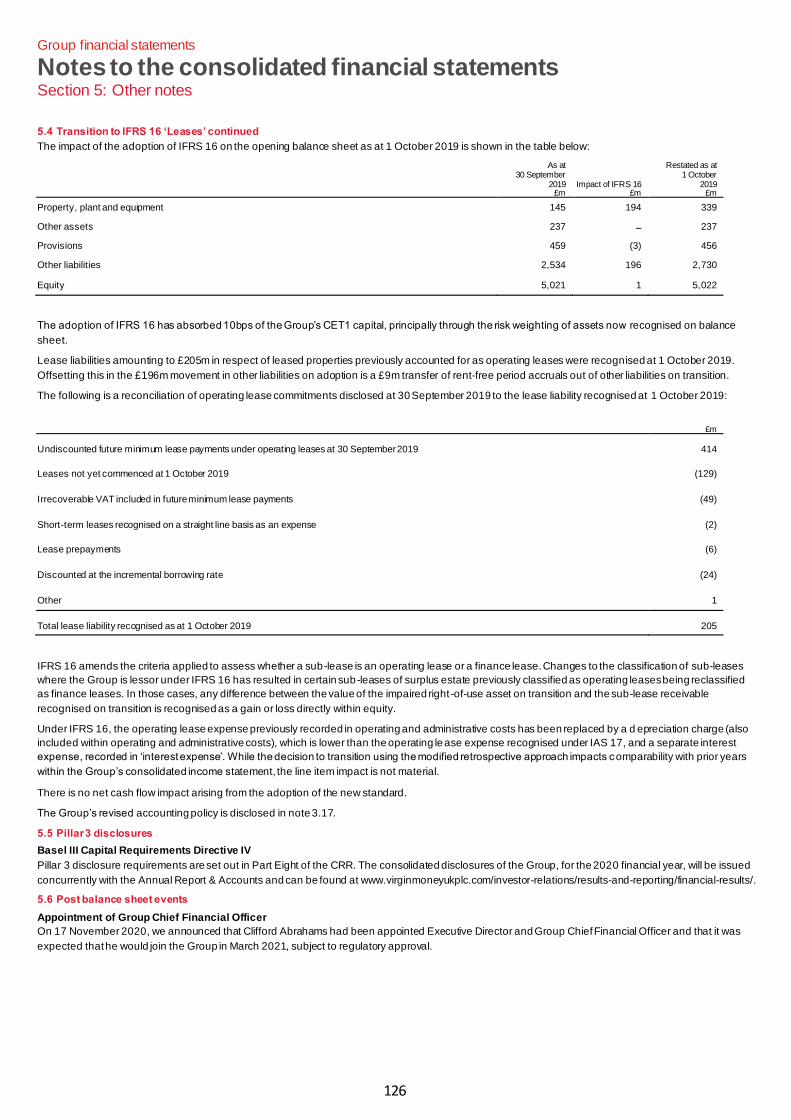
126
Group financial statements
Notes to the consolidated financial statements Section 5: Other notes
5.4 Transition to IFRS 16 ‘Leases’ continued
The impact of the adoption of IFRS 16 on the opening balance sheet as at 1 October 2019 is shown in the table below:
As at 30 September
2019 £m
Impact of IFRS 16 £m
Restated as at 1 October
2019 £m
Property, plant and equipment 145 194 339
Other assets 237 – 237
Provisions 459 (3) 456
Other liabilities 2,534 196 2,730
Equity 5,021 1 5,022
The adoption of IFRS 16 has absorbed 10bps of the Group’s CET1 capital, principally through the risk weighting of assets now recognised on balance
sheet.
Lease liabilities amounting to £205m in respect of leased properties previously accounted for as operating leases were recognised at 1 October 2019.
Offsetting this in the £196m movement in other liabilities on adoption is a £9m transfer of rent-free period accruals out of other liabilities on transition.
The following is a reconciliation of operating lease commitments disclosed at 30 September 2019 to the lease liability recognised at 1 October 2019:
£m
Undiscounted future minimum lease payments under operating leases at 30 September 2019 414
Leases not yet commenced at 1 October 2019 (129)
Irrecoverable VAT included in future minimum lease payments (49)
Short-term leases recognised on a straight line basis as an expense (2)
Lease prepayments (6)
Discounted at the incremental borrowing rate (24)
Other 1
Total lease liability recognised as at 1 October 2019 205
IFRS 16 amends the criteria applied to assess whether a sub-lease is an operating lease or a finance lease. Changes to the classification of sub-leases
where the Group is lessor under IFRS 16 has resulted in certain sub-leases of surplus estate previously classified as operating leases being reclassified
as finance leases. In those cases, any difference between the value of the impaired right -of-use asset on transition and the sub-lease receivable
recognised on transition is recognised as a gain or loss directly within equity.
Under IFRS 16, the operating lease expense previously recorded in operating and administrative costs has been replaced by a d epreciation charge (also
included within operating and administrative costs), which is lower than the operating lease expense recognised under IAS 17, and a separate interest
expense, recorded in ‘interest expense’. While the decision to transition using the modified retrospective approach impacts comparability with prior years
within the Group’s consolidated income statement, the line item impact is not material.
There is no net cash flow impact arising from the adoption of the new standard.
The Group’s revised accounting policy is disclosed in note 3.17.
5.5 Pillar 3 disclosures
Basel III Capital Requirements Directive IV
Pillar 3 disclosure requirements are set out in Part Eight of the CRR. The consolidated disclosures of the Group, for the 2020 financial year, will be issued
concurrently with the Annual Report & Accounts and can be found at www.virginmoneyukplc.com/investor-relations/results-and-reporting/financial-results/.
5.6 Post balance sheet events
Appointment of Group Chief Financial Officer
On 17 November 2020, we announced that Clifford Abrahams had been appointed Executive Director and Group Chief Financial Officer and that it was
expected that he would join the Group in March 2021, subject to regulatory approval.
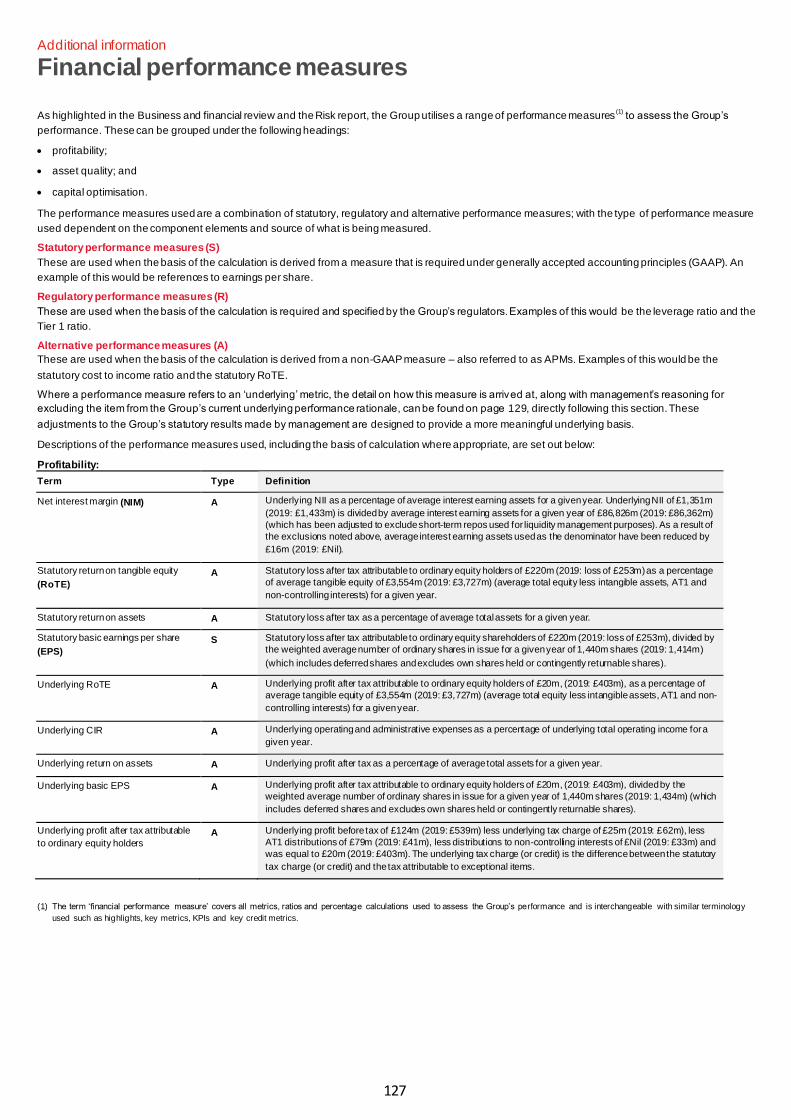
127
Additional information
Financial performance measures As highlighted in the Business and financial review and the Risk report, the Group utilises a range of performance measures
(1) to assess the Group’s
performance. These can be grouped under the following headings:
• profitability;
• asset quality; and
• capital optimisation.
The performance measures used are a combination of statutory, regulatory and alternative performance measures; with the type of performance measure
used dependent on the component elements and source of what is being measured.
Statutory performance measures (S)
These are used when the basis of the calculation is derived from a measure that is required under generally accepted accounting principles (GAAP). An
example of this would be references to earnings per share.
Regulatory performance measures (R)
These are used when the basis of the calculation is required and specified by the Group’s regulators. Examples of this would be the leverage ratio and the
Tier 1 ratio.
Alternative performance measures (A)
These are used when the basis of the calculation is derived from a non-GAAP measure – also referred to as APMs. Examples of this would be the
statutory cost to income ratio and the statutory RoTE.
Where a performance measure refers to an ‘underlying’ metric, the detail on how this measure is arrived at, along with management’s reasoning for
excluding the item from the Group’s current underlying performance rationale, can be found on page 129, directly following this section. These
adjustments to the Group’s statutory results made by management are designed to provide a more meaningful underlying basis.
Descriptions of the performance measures used, including the basis of calculation where appropriate, are set out below:
Profitability:
Term Type Definition
Net interest margin (NIM) A Underlying NII as a percentage of average interest earning assets for a given year. Underlying NII of £1,351m
(2019: £1,433m) is divided by average interest earning assets for a given year of £86,826m (2019: £86,362m)
(which has been adjusted to exclude short-term repos used for liquidity management purposes). As a result of
the exclusions noted above, average interest earning assets used as the denominator have been reduced by
£16m (2019: £Nil).
Statutory return on tangible equity
(RoTE) A Statutory loss after tax attributable to ordinary equity holders of £220m (2019: loss of £253m) as a percentage
of average tangible equity of £3,554m (2019: £3,727m) (average total equity less intangible assets, AT1 and
non-controlling interests) for a given year.
Statutory return on assets A Statutory loss after tax as a percentage of average total assets for a given year.
Statutory basic earnings per share
(EPS) S Statutory loss after tax attributable to ordinary equity shareholders of £220m (2019: loss of £253m), divided by
the weighted average number of ordinary shares in issue for a given year of 1,440m shares (2019: 1,414m)
(which includes deferred shares and excludes own shares held or contingently returnable shares).
Underlying RoTE A Underlying profit after tax attributable to ordinary equity holders of £20m, (2019: £403m), as a percentage of
average tangible equity of £3,554m (2019: £3,727m) (average total equity less intangible assets, AT1 and non-
controlling interests) for a given year.
Underlying CIR A Underlying operating and administrative expenses as a percentage of underlying total operating income for a
given year.
Underlying return on assets A Underlying profit after tax as a percentage of average total assets for a given year.
Underlying basic EPS A Underlying profit after tax attributable to ordinary equity holders of £20m, (2019: £403m), divided by the
weighted average number of ordinary shares in issue for a given year of 1,440m shares (2019: 1,434m) (which
includes deferred shares and excludes own shares held or contingently returnable shares).
Underlying profit after tax attributable
to ordinary equity holders A Underlying profit before tax of £124m (2019: £539m) less underlying tax charge of £25m (2019: £62m), less
AT1 distributions of £79m (2019: £41m), less distributions to non-controlling interests of £Nil (2019: £33m) and
was equal to £20m (2019: £403m). The underlying tax charge (or credit) is the difference between the statutory
tax charge (or credit) and the tax attributable to exceptional items.
(1) The term ‘financial performance measure’ covers all metrics, ratios and percentage calculations used to assess the Group’s performance and is interchangeable with similar terminology
used such as highlights, key metrics, KPIs and key credit metrics.
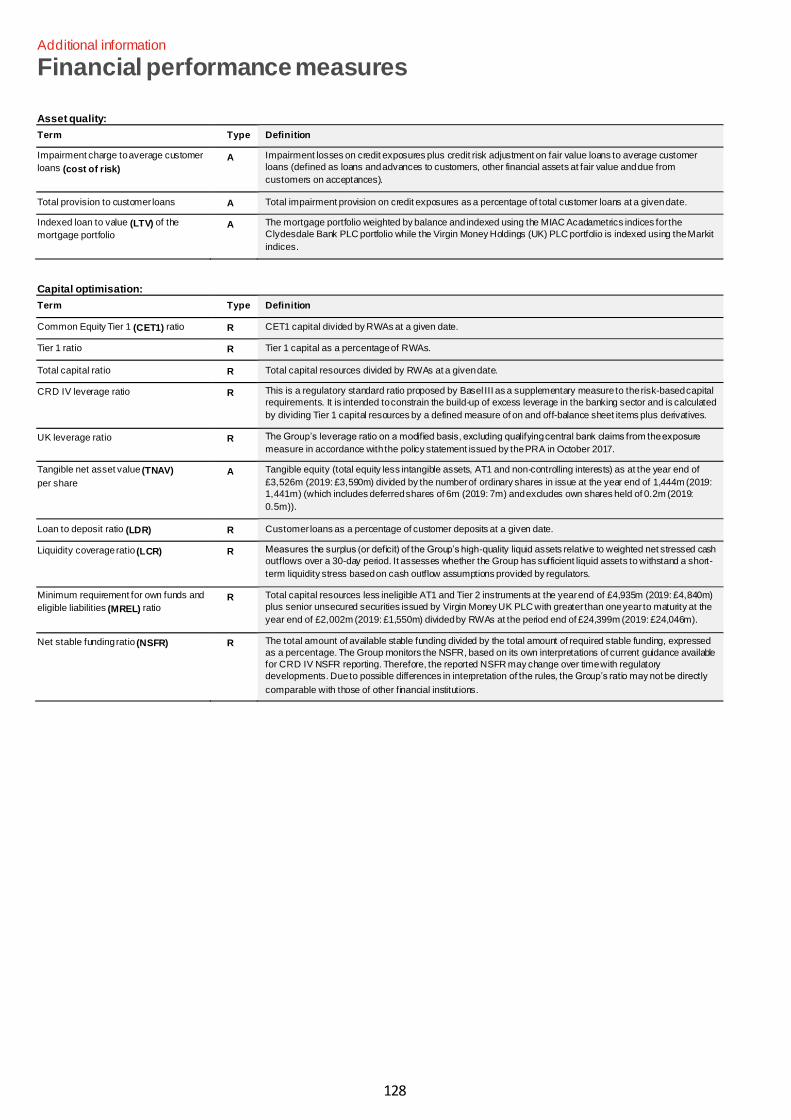
128
Additional information
Financial performance measures Asset quality:
Term Type Definition
Impairment charge to average customer
loans (cost of risk) A Impairment losses on credit exposures plus credit risk adjustment on fair value loans to average customer
loans (defined as loans and advances to customers, other financial assets at fair value and due from
customers on acceptances).
Total provision to customer loans A Total impairment provision on credit exposures as a percentage of total customer loans at a given date.
Indexed loan to value (LTV) of the
mortgage portfolio A The mortgage portfolio weighted by balance and indexed using the MIAC Acadametrics indices for the
Clydesdale Bank PLC portfolio while the Virgin Money Holdings (UK) PLC portfolio is indexed using the Markit
indices.
Capital optimisation:
Term Type Definition
Common Equity Tier 1 (CET1) ratio R CET1 capital divided by RWAs at a given date.
Tier 1 ratio R Tier 1 capital as a percentage of RWAs.
Total capital ratio R Total capital resources divided by RWAs at a given date.
CRD IV leverage ratio R This is a regulatory standard ratio proposed by Basel III as a supplementary measure to the risk-based capital
requirements. It is intended to constrain the build-up of excess leverage in the banking sector and is calculated
by dividing Tier 1 capital resources by a defined measure of on and off-balance sheet items plus derivatives.
UK leverage ratio R The Group’s leverage ratio on a modified basis, excluding qualifying central bank claims from the exposure
measure in accordance with the policy statement issued by the PRA in October 2017.
Tangible net asset value (TNAV)
per share
A Tangible equity (total equity less intangible assets, AT1 and non-controlling interests) as at the year end of
£3,526m (2019: £3,590m) divided by the number of ordinary shares in issue at the year end of 1,444m (2019:
1,441m) (which includes deferred shares of 6m (2019: 7m) and excludes own shares held of 0.2m (2019:
0.5m)).
Loan to deposit ratio (LDR) R Customer loans as a percentage of customer deposits at a given date.
Liquidity coverage ratio (LCR) R Measures the surplus (or deficit) of the Group’s high-quality liquid assets relative to weighted net stressed cash
outflows over a 30-day period. It assesses whether the Group has sufficient liquid assets to withstand a short-
term liquidity stress based on cash outflow assumptions provided by regulators.
Minimum requirement for own funds and
eligible liabilities (MREL) ratio R Total capital resources less ineligible AT1 and Tier 2 instruments at the year end of £4,935m (2019: £4,840m)
plus senior unsecured securities issued by Virgin Money UK PLC with greater than one year to maturity at the
year end of £2,002m (2019: £1,550m) divided by RWAs at the period end of £24,399m (2019: £24,046m).
Net stable funding ratio (NSFR) R The total amount of available stable funding divided by the total amount of required stable funding, expressed
as a percentage. The Group monitors the NSFR, based on its own interpretations of current guidance available
for CRD IV NSFR reporting. Therefore, the reported NSFR may change over time with regulatory
developments. Due to possible differences in interpretation of the rules, the Group’s ratio may not be directly
comparable with those of other financial institutions.
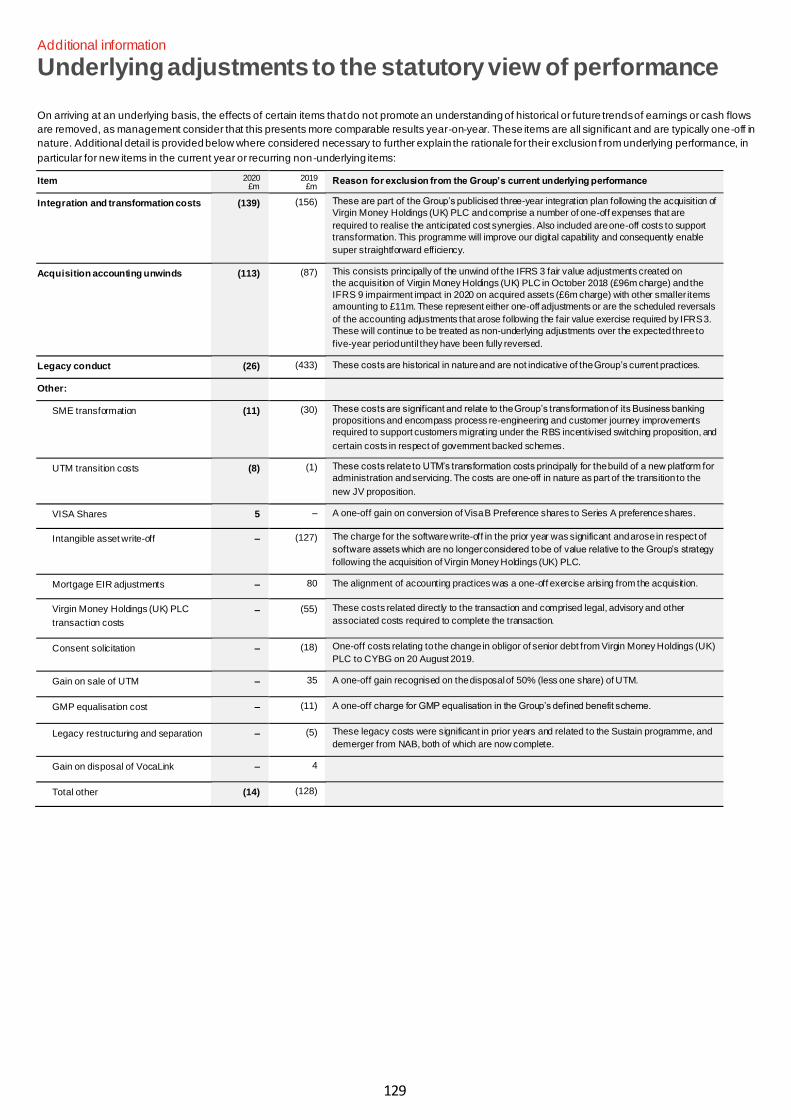
129
Additional information
Underlying adjustments to the statutory view of performance On arriving at an underlying basis, the effects of certain items that do not promote an understanding of historical or future trends of earnings or cash flows
are removed, as management consider that this presents more comparable results year-on-year. These items are all significant and are typically one-off in
nature. Additional detail is provided below where considered necessary to further explain the rationale for their exclusion f rom underlying performance, in
particular for new items in the current year or recurring non-underlying items:
Item 2020 £m
2019 £m
Reason for exclusion from the Group’s current underlying performance
Integration and transformation costs (139) (156) These are part of the Group’s publicised three-year integration plan following the acquisition of
Virgin Money Holdings (UK) PLC and comprise a number of one-off expenses that are
required to realise the anticipated cost synergies. Also included are one-off costs to support
transformation. This programme will improve our digital capability and consequently enable
super straightforward efficiency.
Acquisition accounting unwinds (113) (87) This consists principally of the unwind of the IFRS 3 fair value adjustments created on
the acquisition of Virgin Money Holdings (UK) PLC in October 2018 (£96m charge) and the
IFRS 9 impairment impact in 2020 on acquired assets (£6m charge) with other smaller items
amounting to £11m. These represent either one-off adjustments or are the scheduled reversals
of the accounting adjustments that arose following the fair value exercise required by IFRS 3.
These will continue to be treated as non-underlying adjustments over the expected three to
five-year period until they have been fully reversed.
Legacy conduct (26) (433) These costs are historical in nature and are not indicative of the Group’s current practices.
Other:
SME transformation (11) (30) These costs are significant and relate to the Group’s transformation of its Business banking
propositions and encompass process re-engineering and customer journey improvements
required to support customers migrating under the RBS incentivised switching proposition, and
certain costs in respect of government backed schemes.
UTM transition costs (8) (1) These costs relate to UTM’s transformation costs principally for the build of a new platform for
administration and servicing. The costs are one-off in nature as part of the transition to the
new JV proposition.
VISA Shares 5 – A one-off gain on conversion of Visa B Preference shares to Series A preference shares.
Intangible asset write-off – (127) The charge for the software write-off in the prior year was significant and arose in respect of
software assets which are no longer considered to be of value relative to the Group’s strategy
following the acquisition of Virgin Money Holdings (UK) PLC.
Mortgage EIR adjustments – 80 The alignment of accounting practices was a one-off exercise arising from the acquisition.
Virgin Money Holdings (UK) PLC
transaction costs
– (55) These costs related directly to the transaction and comprised legal, advisory and other
associated costs required to complete the transaction.
Consent solicitation – (18) One-off costs relating to the change in obligor of senior debt from Virgin Money Holdings (UK)
PLC to CYBG on 20 August 2019.
Gain on sale of UTM – 35 A one-off gain recognised on the disposal of 50% (less one share) of UTM.
GMP equalisation cost – (11) A one-off charge for GMP equalisation in the Group’s defined benefit scheme.
Legacy restructuring and separation – (5) These legacy costs were significant in prior years and related to the Sustain programme, and
demerger from NAB, both of which are now complete.
Gain on disposal of VocaLink – 4
Total other (14) (128)
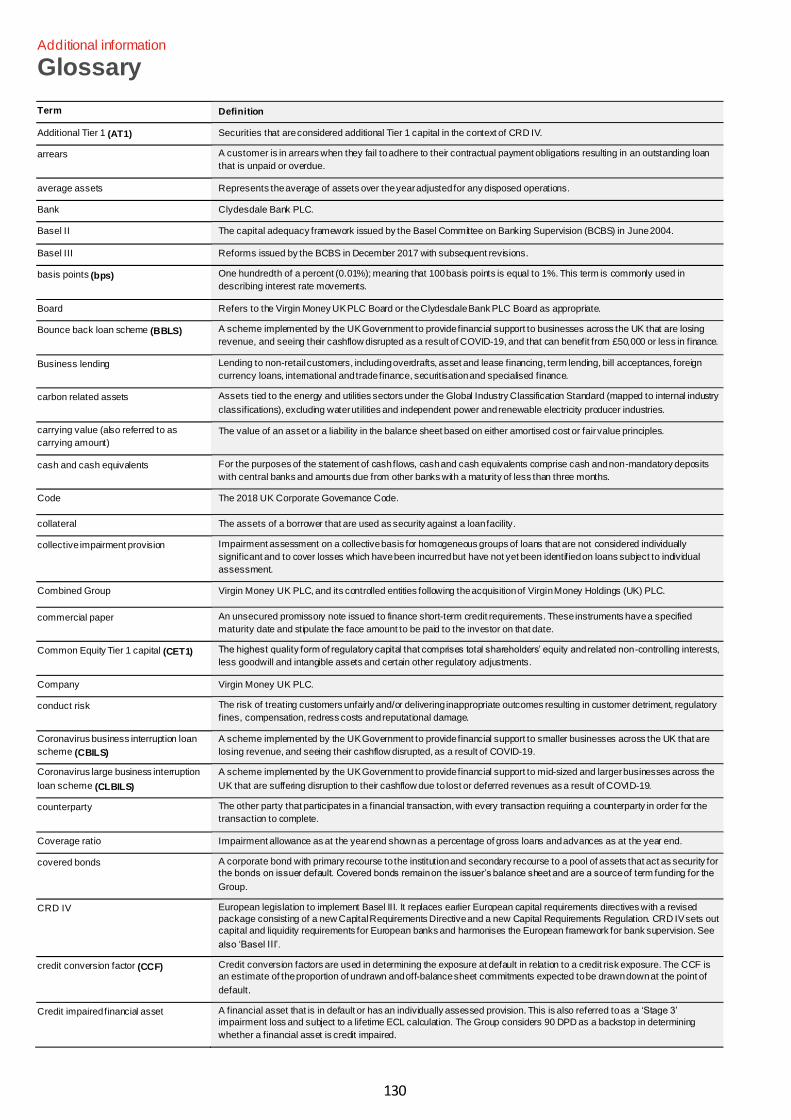
130
Additional information
Glossary
Term Definition
Additional Tier 1 (AT1) Securities that are considered additional Tier 1 capital in the context of CRD IV.
arrears A customer is in arrears when they fail to adhere to their contractual payment obligations resulting in an outstanding loan
that is unpaid or overdue.
average assets Represents the average of assets over the year adjusted for any disposed operations.
Bank Clydesdale Bank PLC.
Basel II The capital adequacy framework issued by the Basel Committee on Banking Supervision (BCBS) in June 2004.
Basel III Reforms issued by the BCBS in December 2017 with subsequent revisions.
basis points (bps) One hundredth of a percent (0.01%); meaning that 100 basis points is equal to 1%. This term is commonly used in
describing interest rate movements.
Board Refers to the Virgin Money UK PLC Board or the Clydesdale Bank PLC Board as appropriate.
Bounce back loan scheme (BBLS) A scheme implemented by the UK Government to provide financial support to businesses across the UK that are losing
revenue, and seeing their cashflow disrupted as a result of COVID-19, and that can benefit from £50,000 or less in finance.
Business lending Lending to non-retail customers, including overdrafts, asset and lease financing, term lending, bill acceptances, foreign
currency loans, international and trade finance, securitisation and specialised finance.
carbon related assets Assets tied to the energy and utilities sectors under the Global Industry Classification Standard (mapped to internal industry
classifications), excluding water utilities and independent power and renewable electricity producer industries.
carrying value (also referred to as
carrying amount)
The value of an asset or a liability in the balance sheet based on either amortised cost or fair value principles.
cash and cash equivalents For the purposes of the statement of cash flows, cash and cash equivalents comprise cash and non-mandatory deposits
with central banks and amounts due from other banks with a maturity of less than three months.
Code The 2018 UK Corporate Governance Code.
collateral The assets of a borrower that are used as security against a loan facility.
collective impairment provision Impairment assessment on a collective basis for homogeneous groups of loans that are not considered individually
significant and to cover losses which have been incurred but have not yet been identified on loans subject to individual
assessment.
Combined Group Virgin Money UK PLC, and its controlled entities following the acquisition of Virgin Money Holdings (UK) PLC.
commercial paper An unsecured promissory note issued to finance short-term credit requirements. These instruments have a specified
maturity date and stipulate the face amount to be paid to the investor on that date.
Common Equity Tier 1 capital (CET1) The highest quality form of regulatory capital that comprises total shareholders’ equity and related non-controlling interests,
less goodwill and intangible assets and certain other regulatory adjustments.
Company Virgin Money UK PLC.
conduct risk The risk of treating customers unfairly and/or delivering inappropriate outcomes resulting in customer detriment, regulatory
fines, compensation, redress costs and reputational damage.
Coronavirus business interruption loan
scheme (CBILS)
A scheme implemented by the UK Government to provide financial support to smaller businesses across the UK that are
losing revenue, and seeing their cashflow disrupted, as a result of COVID-19.
Coronavirus large business interruption
loan scheme (CLBILS)
A scheme implemented by the UK Government to provide financial support to mid-sized and larger businesses across the
UK that are suffering disruption to their cashflow due to lost or deferred revenues as a result of COVID-19.
counterparty The other party that participates in a financial transaction, with every transaction requiring a counterparty in order for the
transaction to complete.
Coverage ratio Impairment allowance as at the year end shown as a percentage of gross loans and advances as at the year end.
covered bonds A corporate bond with primary recourse to the institution and secondary recourse to a pool of assets that act as security for
the bonds on issuer default. Covered bonds remain on the issuer’s balance sheet and are a source of term funding for the
Group.
CRD IV European legislation to implement Basel III. It replaces earlier European capital requirements directives with a revised
package consisting of a new Capital Requirements Directive and a new Capital Requirements Regulation. CRD IV sets out
capital and liquidity requirements for European banks and harmonises the European framework for bank supervision. See
also ‘Basel III’.
credit conversion factor (CCF) Credit conversion factors are used in determining the exposure at default in relation to a credit risk exposure. The CCF is
an estimate of the proportion of undrawn and off-balance sheet commitments expected to be drawn down at the point of
default.
Credit impaired financial asset A financial asset that is in default or has an individually assessed provision. This is also referred to as a ‘Stage 3’
impairment loss and subject to a lifetime ECL calculation. The Group considers 90 DPD as a backstop in determining
whether a financial asset is credit impaired.
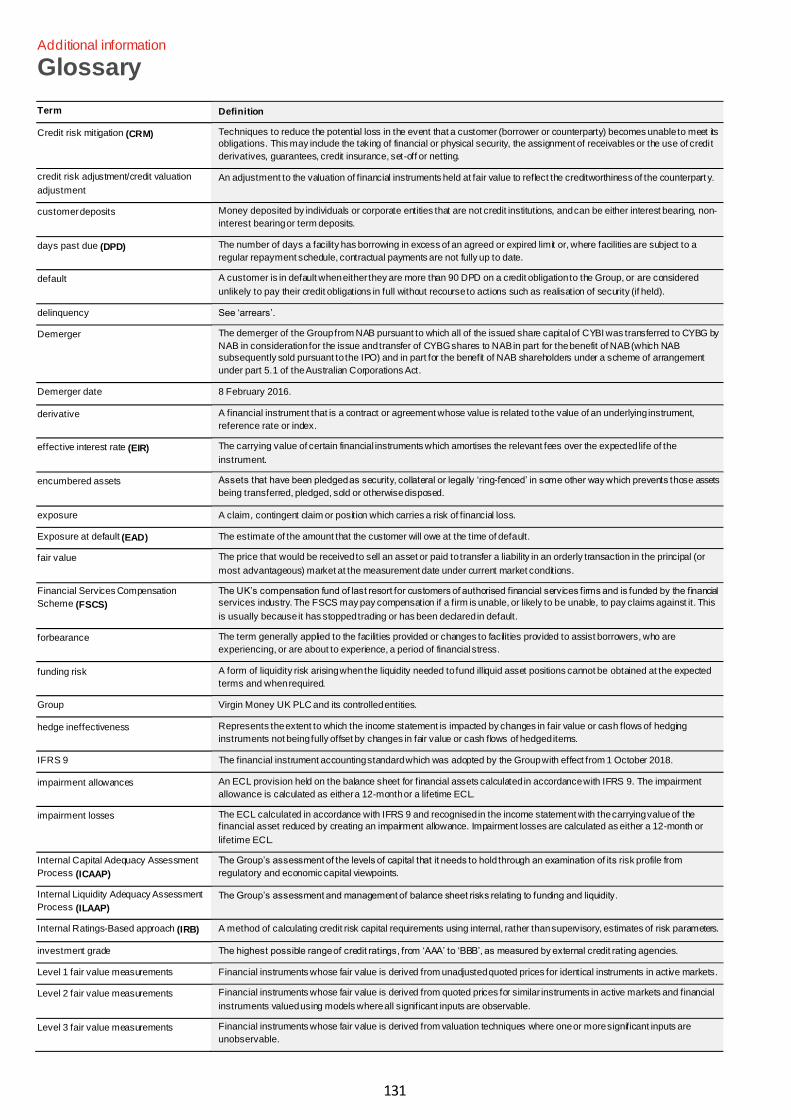
131
Additional information
Glossary
Term Definition
Credit risk mitigation (CRM) Techniques to reduce the potential loss in the event that a customer (borrower or counterparty) becomes unable to meet its
obligations. This may include the taking of financial or physical security, the assignment of receivables or the use of credit
derivatives, guarantees, credit insurance, set-off or netting.
credit risk adjustment/credit valuation
adjustment
An adjustment to the valuation of financial instruments held at fair value to reflect the creditworthiness of the counterpart y.
customer deposits Money deposited by individuals or corporate entities that are not credit institutions, and can be either interest bearing, non-
interest bearing or term deposits.
days past due (DPD) The number of days a facility has borrowing in excess of an agreed or expired limit or, where facilities are subject to a
regular repayment schedule, contractual payments are not fully up to date.
default A customer is in default when either they are more than 90 DPD on a credit obligation to the Group, or are considered
unlikely to pay their credit obligations in full without recourse to actions such as realisation of security (if held).
delinquency See ‘arrears’.
Demerger The demerger of the Group from NAB pursuant to which all of the issued share capital of CYBI was transferred to CYBG by
NAB in consideration for the issue and transfer of CYBG shares to NAB in part for the benefit of NAB (which NAB
subsequently sold pursuant to the IPO) and in part for the benefit of NAB shareholders under a scheme of arrangement
under part 5.1 of the Australian Corporations Act.
Demerger date 8 February 2016.
derivative A financial instrument that is a contract or agreement whose value is related to the value of an underlying instrument,
reference rate or index.
effective interest rate (EIR) The carrying value of certain financial instruments which amortises the relevant fees over the expected life of the
instrument.
encumbered assets Assets that have been pledged as security, collateral or legally ‘ring-fenced’ in some other way which prevents those assets
being transferred, pledged, sold or otherwise disposed.
exposure A claim, contingent claim or position which carries a risk of financial loss.
Exposure at default (EAD) The estimate of the amount that the customer will owe at the time of default.
fair value The price that would be received to sell an asset or paid to transfer a liability in an orderly transaction in the principal (or
most advantageous) market at the measurement date under current market conditions.
Financial Services Compensation
Scheme (FSCS)
The UK’s compensation fund of last resort for customers of authorised financial services firms and is funded by the financial
services industry. The FSCS may pay compensation if a firm is unable, or likely to be unable, to pay claims against it. This
is usually because it has stopped trading or has been declared in default.
forbearance The term generally applied to the facilities provided or changes to facilities provided to assist borrowers, who are
experiencing, or are about to experience, a period of financial stress.
funding risk A form of liquidity risk arising when the liquidity needed to fund illiquid asset positions cannot be obtained at the expected
terms and when required.
Group Virgin Money UK PLC and its controlled entities.
hedge ineffectiveness Represents the extent to which the income statement is impacted by changes in fair value or cash flows of hedging
instruments not being fully offset by changes in fair value or cash flows of hedged items.
IFRS 9 The financial instrument accounting standard which was adopted by the Group with effect from 1 October 2018.
impairment allowances An ECL provision held on the balance sheet for financial assets calculated in accordance with IFRS 9. The impairment
allowance is calculated as either a 12-month or a lifetime ECL.
impairment losses The ECL calculated in accordance with IFRS 9 and recognised in the income statement with the carrying value of the
financial asset reduced by creating an impairment allowance. Impairment losses are calculated as either a 12-month or
lifetime ECL.
Internal Capital Adequacy Assessment
Process (ICAAP)
The Group’s assessment of the levels of capital that it needs to hold through an examination of its risk profile from
regulatory and economic capital viewpoints.
Internal Liquidity Adequacy Assessment
Process (ILAAP)
The Group’s assessment and management of balance sheet risks relating to funding and liquidity.
Internal Ratings-Based approach (IRB) A method of calculating credit risk capital requirements using internal, rather than supervisory, estimates of risk parameters.
investment grade The highest possible range of credit ratings, from ‘AAA’ to ‘BBB’, as measured by external credit rating agencies.
Level 1 fair value measurements Financial instruments whose fair value is derived from unadjusted quoted prices for identical instruments in active markets.
Level 2 fair value measurements Financial instruments whose fair value is derived from quoted prices for similar instruments in active markets and financial
instruments valued using models where all significant inputs are observable.
Level 3 fair value measurements Financial instruments whose fair value is derived from valuation techniques where one or more significant inputs are
unobservable.
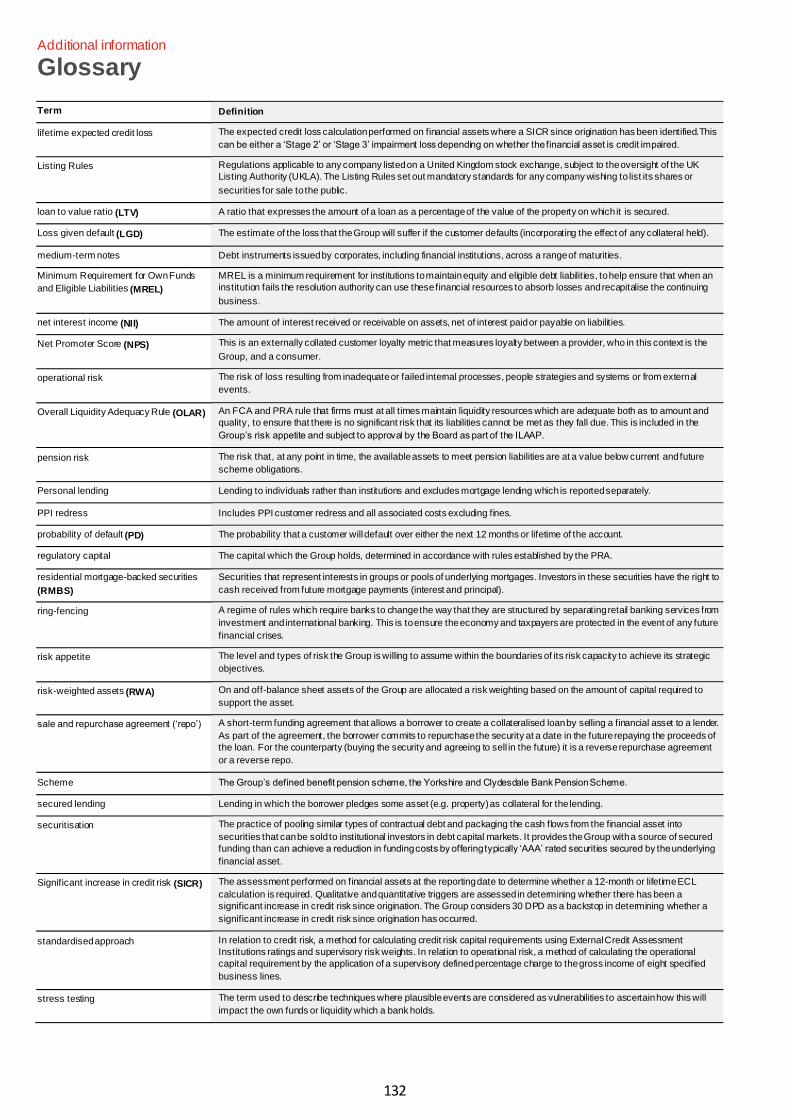
132
Additional information
Glossary
Term Definition
lifetime expected credit loss The expected credit loss calculation performed on financial assets where a SICR since origination has been identified.This
can be either a ‘Stage 2’ or ‘Stage 3’ impairment loss depending on whether the financial asset is credit impaired.
Listing Rules Regulations applicable to any company listed on a United Kingdom stock exchange, subject to the oversight of the UK
Listing Authority (UKLA). The Listing Rules set out mandatory standards for any company wishing to list its shares or
securities for sale to the public.
loan to value ratio (LTV) A ratio that expresses the amount of a loan as a percentage of the value of the property on which it is secured.
Loss given default (LGD) The estimate of the loss that the Group will suffer if the customer defaults (incorporating the effect of any collateral held).
medium-term notes Debt instruments issued by corporates, including financial institutions, across a range of maturities.
Minimum Requirement for Own Funds
and Eligible Liabilities (MREL)
MREL is a minimum requirement for institutions to maintain equity and eligible debt liabilities, to help ensure that when an
institution fails the resolution authority can use these financial resources to absorb losses and recapitalise the continuing
business.
net interest income (NII) The amount of interest received or receivable on assets, net of interest paid or payable on liabilities.
Net Promoter Score (NPS) This is an externally collated customer loyalty metric that measures loyalty between a provider, who in this context is the
Group, and a consumer.
operational risk The risk of loss resulting from inadequate or failed internal processes, people strategies and systems or from external
events.
Overall Liquidity Adequacy Rule (OLAR) An FCA and PRA rule that firms must at all times maintain liquidity resources which are adequate both as to amount and
quality, to ensure that there is no significant risk that its liabilities cannot be met as they fall due. This is included in the
Group’s risk appetite and subject to approval by the Board as part of the ILAAP.
pension risk The risk that, at any point in time, the available assets to meet pension liabilities are at a value below current and future
scheme obligations.
Personal lending Lending to individuals rather than institutions and excludes mortgage lending which is reported separately.
PPI redress Includes PPI customer redress and all associated costs excluding fines.
probability of default (PD) The probability that a customer will default over either the next 12 months or lifetime of the account.
regulatory capital The capital which the Group holds, determined in accordance with rules established by the PRA.
residential mortgage-backed securities
(RMBS)
Securities that represent interests in groups or pools of underlying mortgages. Investors in these securities have the right to
cash received from future mortgage payments (interest and principal).
ring-fencing A regime of rules which require banks to change the way that they are structured by separating retail banking services from
investment and international banking. This is to ensure the economy and taxpayers are protected in the event of any future
financial crises.
risk appetite The level and types of risk the Group is willing to assume within the boundaries of its risk capacity to achieve its strategic
objectives.
risk-weighted assets (RWA) On and off-balance sheet assets of the Group are allocated a risk weighting based on the amount of capital required to
support the asset.
sale and repurchase agreement (‘repo’) A short-term funding agreement that allows a borrower to create a collateralised loan by selling a financial asset to a lender.
As part of the agreement, the borrower commits to repurchase the security at a date in the future repaying the proceeds of
the loan. For the counterparty (buying the security and agreeing to sell in the future) it is a reverse repurchase agreement
or a reverse repo.
Scheme The Group’s defined benefit pension scheme, the Yorkshire and Clydesdale Bank Pension Scheme.
secured lending Lending in which the borrower pledges some asset (e.g. property) as collateral for the lending.
securitisation The practice of pooling similar types of contractual debt and packaging the cash flows from the financial asset into
securities that can be sold to institutional investors in debt capital markets. It provides the Group with a source of secured
funding than can achieve a reduction in funding costs by offering typically ‘AAA’ rated securities secured by the underlying
financial asset.
Significant increase in credit risk (SICR) The assessment performed on financial assets at the reporting date to determine whether a 12-month or lifetime ECL
calculation is required. Qualitative and quantitative triggers are assessed in determining whether there has been a
significant increase in credit risk since origination. The Group considers 30 DPD as a backstop in determining whether a
significant increase in credit risk since origination has occurred.
standardised approach In relation to credit risk, a method for calculating credit risk capital requirements using External Credit Assessment
Institutions ratings and supervisory risk weights. In relation to operational risk, a method of calculating the operational
capital requirement by the application of a supervisory defined percentage charge to the gross income of eight specified
business lines.
stress testing The term used to describe techniques where plausible events are considered as vulnerabilities to ascertain how this will
impact the own funds or liquidity which a bank holds.
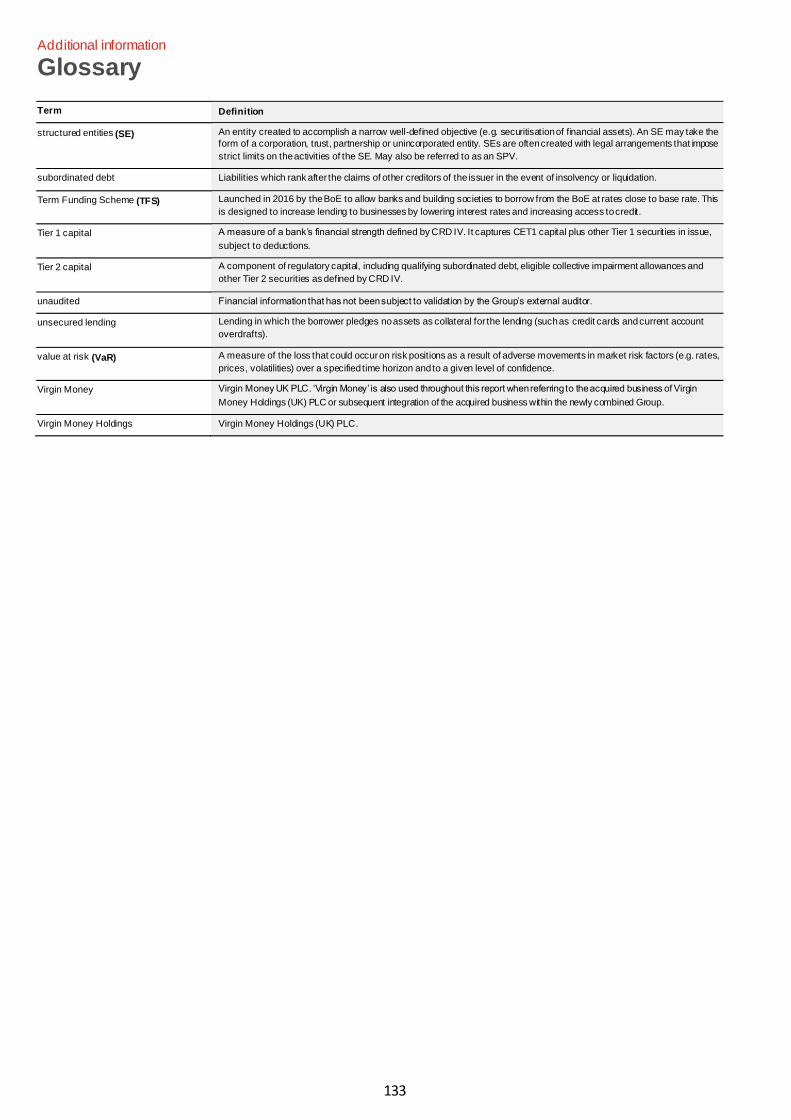
133
Additional information
Glossary
Term Definition
structured entities (SE) An entity created to accomplish a narrow well-defined objective (e.g. securitisation of financial assets). An SE may take the
form of a corporation, trust, partnership or unincorporated entity. SEs are often created with legal arrangements that impose
strict limits on the activities of the SE. May also be referred to as an SPV.
subordinated debt Liabilities which rank after the claims of other creditors of the issuer in the event of insolvency or liquidation.
Term Funding Scheme (TFS) Launched in 2016 by the BoE to allow banks and building societies to borrow from the BoE at rates close to base rate. This
is designed to increase lending to businesses by lowering interest rates and increasing access to credit.
Tier 1 capital A measure of a bank’s financial strength defined by CRD IV. It captures CET1 capital plus other Tier 1 securities in issue,
subject to deductions.
Tier 2 capital A component of regulatory capital, including qualifying subordinated debt, eligible collective impairment allowances and
other Tier 2 securities as defined by CRD IV.
unaudited Financial information that has not been subject to validation by the Group’s external auditor.
unsecured lending Lending in which the borrower pledges no assets as collateral for the lending (such as credit cards and current account
overdrafts).
value at risk (VaR) A measure of the loss that could occur on risk positions as a result of adverse movements in market risk factors (e.g. rates,
prices, volatilities) over a specified time horizon and to a given level of confidence.
Virgin Money Virgin Money UK PLC. ‘Virgin Money’ is also used throughout this report when referring to the acquired business of Virgin
Money Holdings (UK) PLC or subsequent integration of the acquired business within the newly combined Group.
Virgin Money Holdings Virgin Money Holdings (UK) PLC.
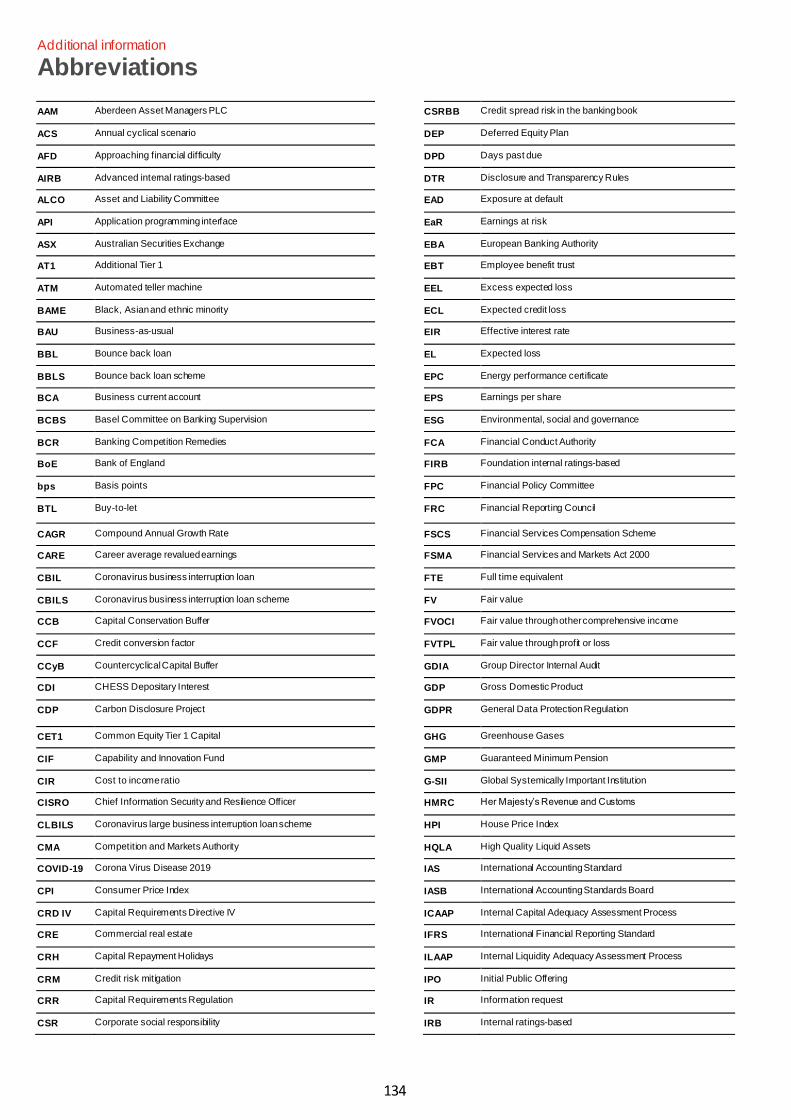
134
Additional information
Abbreviations
AAM Aberdeen Asset Managers PLC CSRBB Credit spread risk in the banking book
ACS Annual cyclical scenario DEP Deferred Equity Plan
AFD Approaching financial difficulty DPD Days past due
AIRB Advanced internal ratings-based DTR Disclosure and Transparency Rules
ALCO Asset and Liability Committee EAD Exposure at default
API Application programming interface EaR Earnings at risk
ASX Australian Securities Exchange EBA European Banking Authority
AT1 Additional Tier 1 EBT Employee benefit trust
ATM Automated teller machine EEL Excess expected loss
BAME Black, Asian and ethnic minority ECL Expected credit loss
BAU Business-as-usual EIR Effective interest rate
BBL Bounce back loan EL Expected loss
BBLS Bounce back loan scheme EPC Energy performance certificate
BCA Business current account EPS Earnings per share
BCBS Basel Committee on Banking Supervision ESG Environmental, social and governance
BCR Banking Competition Remedies FCA Financial Conduct Authority
BoE Bank of England FIRB Foundation internal ratings-based
bps Basis points FPC Financial Policy Committee
BTL Buy-to-let FRC Financial Reporting Council
CAGR Compound Annual Growth Rate FSCS Financial Services Compensation Scheme
CARE Career average revalued earnings FSMA Financial Services and Markets Act 2000
CBIL Coronavirus business interruption loan FTE Full time equivalent
CBILS Coronavirus business interruption loan scheme FV Fair value
CCB Capital Conservation Buffer FVOCI Fair value through other comprehensive income
CCF Credit conversion factor FVTPL Fair value through profit or loss
CCyB Countercyclical Capital Buffer GDIA Group Director Internal Audit
CDI CHESS Depositary Interest GDP Gross Domestic Product
CDP Carbon Disclosure Project GDPR General Data Protection Regulation
CET1 Common Equity Tier 1 Capital GHG Greenhouse Gases
CIF Capability and Innovation Fund GMP Guaranteed Minimum Pension
CIR Cost to income ratio G-SII Global Systemically Important Institution
CISRO Chief Information Security and Resilience Officer HMRC Her Majesty’s Revenue and Customs
CLBILS Coronavirus large business interruption loan scheme HPI House Price Index
CMA Competition and Markets Authority HQLA High Quality Liquid Assets
COVID-19 Corona Virus Disease 2019 IAS International Accounting Standard
CPI Consumer Price Index IASB International Accounting Standards Board
CRD IV Capital Requirements Directive IV ICAAP Internal Capital Adequacy Assessment Process
CRE Commercial real estate IFRS International Financial Reporting Standard
CRH Capital Repayment Holidays ILAAP Internal Liquidity Adequacy Assessment Process
CRM Credit risk mitigation IPO Initial Public Offering
CRR Capital Requirements Regulation IR Information request
CSR Corporate social responsibility IRB Internal ratings-based
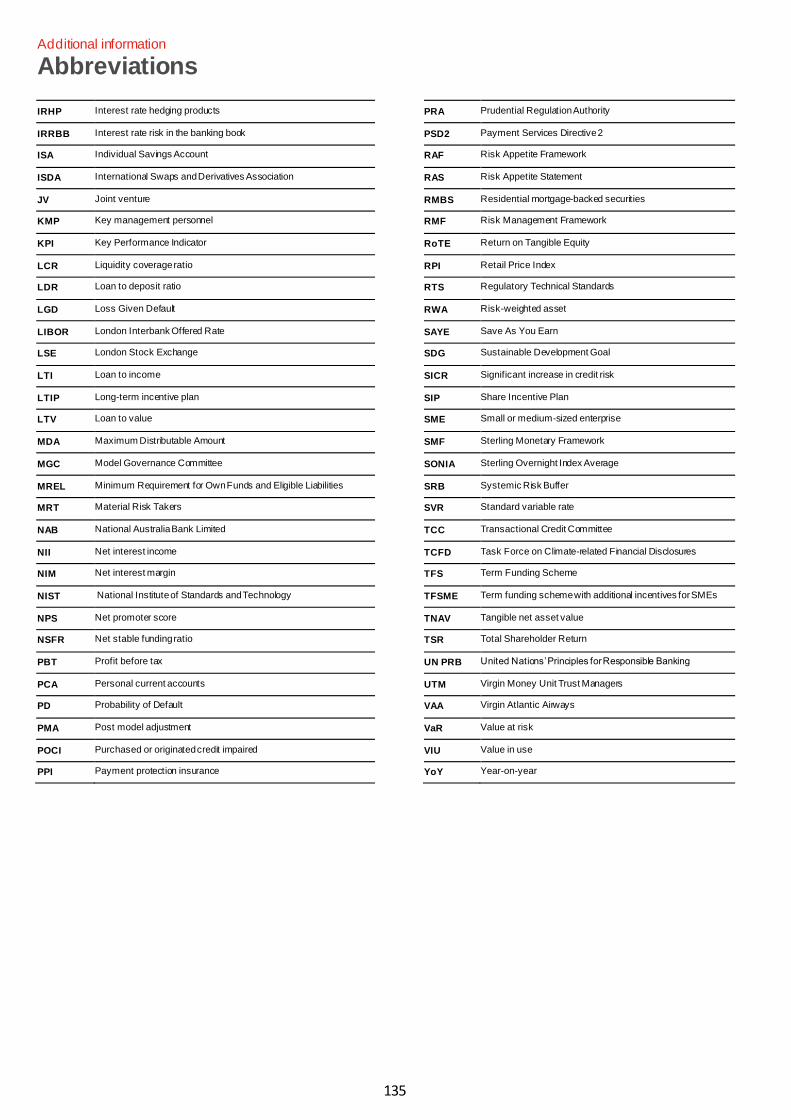
135
Additional information
Abbreviations
IRHP Interest rate hedging products PRA Prudential Regulation Authority
IRRBB Interest rate risk in the banking book PSD2 Payment Services Directive 2
ISA Individual Savings Account RAF Risk Appetite Framework
ISDA International Swaps and Derivatives Association RAS Risk Appetite Statement
JV Joint venture RMBS Residential mortgage-backed securities
KMP Key management personnel RMF Risk Management Framework
KPI Key Performance Indicator RoTE Return on Tangible Equity
LCR Liquidity coverage ratio RPI Retail Price Index
LDR Loan to deposit ratio RTS Regulatory Technical Standards
LGD Loss Given Default RWA Risk-weighted asset
LIBOR London Interbank Offered Rate SAYE Save As You Earn
LSE London Stock Exchange SDG Sustainable Development Goal
LTI Loan to income SICR Significant increase in credit risk
LTIP Long-term incentive plan SIP Share Incentive Plan
LTV Loan to value SME Small or medium-sized enterprise
MDA Maximum Distributable Amount SMF Sterling Monetary Framework
MGC Model Governance Committee SONIA Sterling Overnight Index Average
MREL Minimum Requirement for Own Funds and Eligible Liabilities SRB Systemic Risk Buffer
MRT Material Risk Takers SVR Standard variable rate
NAB National Australia Bank Limited TCC Transactional Credit Committee
NII Net interest income TCFD Task Force on Climate-related Financial Disclosures
NIM Net interest margin TFS Term Funding Scheme
NIST National Institute of Standards and Technology TFSME Term funding scheme with additional incentives for SMEs
NPS Net promoter score TNAV Tangible net asset value
NSFR Net stable funding ratio TSR Total Shareholder Return
PBT Profit before tax UN PRB United Nations’ Principles for Responsible Banking
PCA Personal current accounts UTM Virgin Money Unit Trust Managers
PD Probability of Default VAA Virgin Atlantic Airways
PMA Post model adjustment VaR Value at risk
POCI Purchased or originated credit impaired VIU Value in use
PPI Payment protection insurance YoY Year-on-year
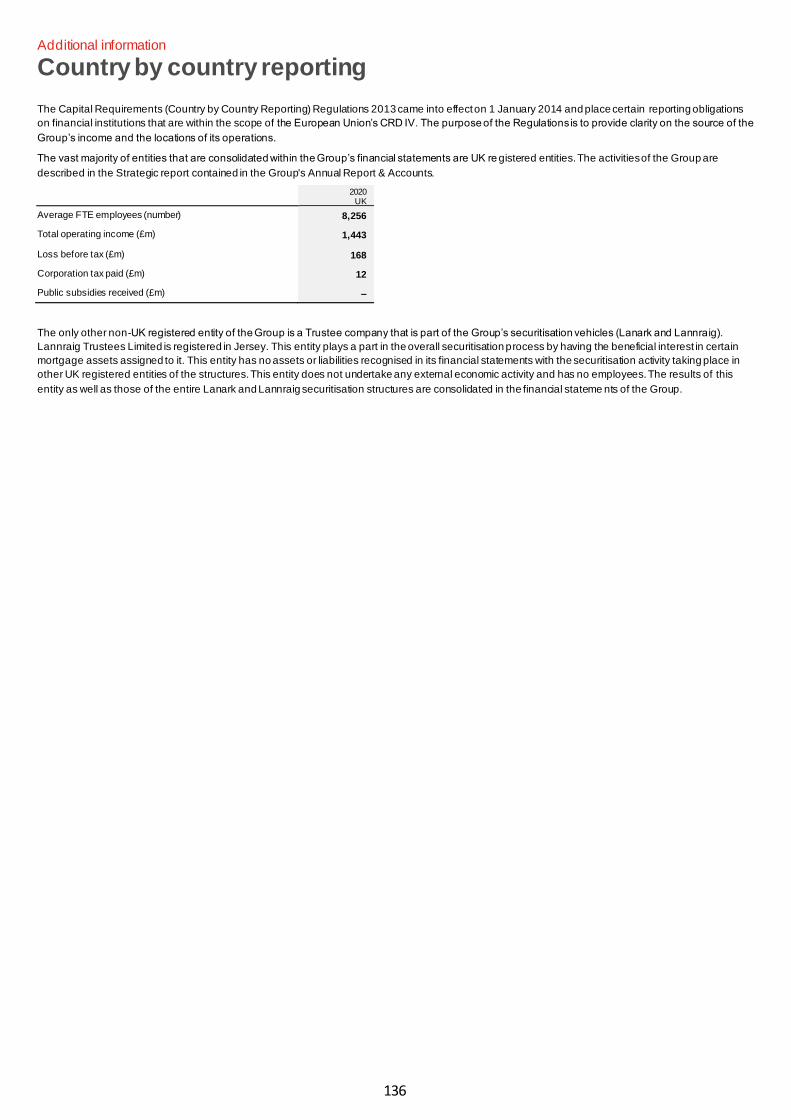
136
Additional information
Country by country reporting
The Capital Requirements (Country by Country Reporting) Regulations 2013 came into effect on 1 January 2014 and place certain reporting obligations
on financial institutions that are within the scope of the European Union’s CRD IV. The purpose of the Regulations is to provide clarity on the source of the
Group’s income and the locations of its operations.
The vast majority of entities that are consolidated within the Group’s financial statements are UK re gistered entities. The activities of the Group are
described in the Strategic report contained in the Group's Annual Report & Accounts.
2020 UK
Average FTE employees (number) 8,256
Total operating income (£m) 1,443
Loss before tax (£m) 168
Corporation tax paid (£m) 12
Public subsidies received (£m) –
The only other non-UK registered entity of the Group is a Trustee company that is part of the Group’s securitisation vehicles (Lanark and Lannra ig).
Lannraig Trustees Limited is registered in Jersey. This entity plays a part in the overall securitisation process by having the beneficial interest in certain
mortgage assets assigned to it. This entity has no assets or liabilities recognised in its financial statements with the securitisation activity taking place in
other UK registered entities of the structures. This entity does not undertake any external economic activity and has no employees. The results of this
entity as well as those of the entire Lanark and Lannraig securitisation structures are consolidated in the financial stateme nts of the Group.

137
Additional information
Other information
The financial information included in this results announcement does not constitute statutory accounts within the meaning of section 434 of the Companies
Act 2006. Statutory accounts for the year ended 30 September 2020 were approved by the directors on 24 November 2020 and will be delivered to the
Registrar of Companies following publication in December 2020. The auditor’s report on those accounts was unqualified and did not include a statement
under sections 498(2) (accounting records or returns inadequate or accounts not agreeing with records and returns) or 498(3) (failure to obtain n ecessary
information and explanations) of the Companies Act 2006.