Embed Size (px)
Citation preview
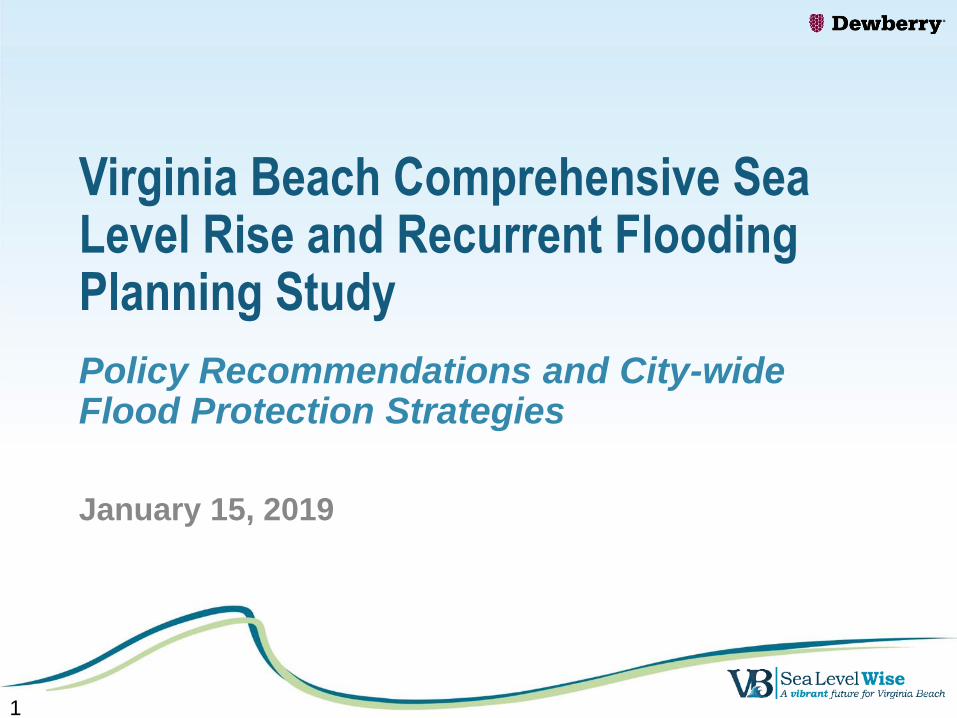
Virginia Beach Comprehensive Sea Level Rise and Recurrent Flooding Planning Study
Policy Recommendations and City-wide Flood Protection Strategies
January 15, 2019
1
Agenda
• Project Overview
• Hazards and Risk Recap
• Adaptation Strategy Approach
• Policy Document Overview
• City-wide Structural Alternatives
• Next Steps
2

Project Overview
3
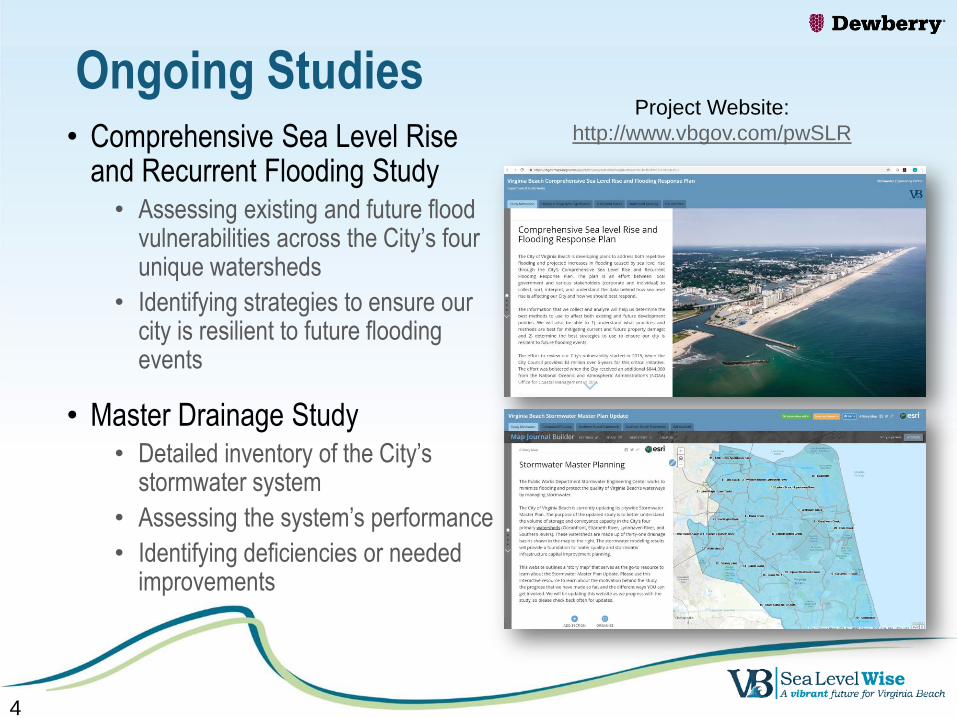
Ongoing Studies• Comprehensive Sea Level Rise
and Recurrent Flooding Study• Assessing existing and future flood
vulnerabilities across the City’s four unique watersheds
• Identifying strategies to ensure our city is resilient to future flooding events
• Master Drainage Study• Detailed inventory of the City’s
stormwater system
• Assessing the system’s performance
• Identifying deficiencies or needed improvements
4
Project Website:
http://www.vbgov.com/pwSLR
Virginia Beach SLR Study
Goal: Produce information and strategies that will enable Virginia Beach to establish long-term resilience to sea level rise and associated recurrent flooding
Objectives:
• Establish a full understanding of flood risk and anticipated changes over planning and infrastructure time horizons
• Develop risk-informed strategies, including engineered protection and policy to reduce short and long-term impacts
• Produce City-wide and watershed “action plans” for strategy implementation
• Engage in public outreach process to advance resilience initiatives
5
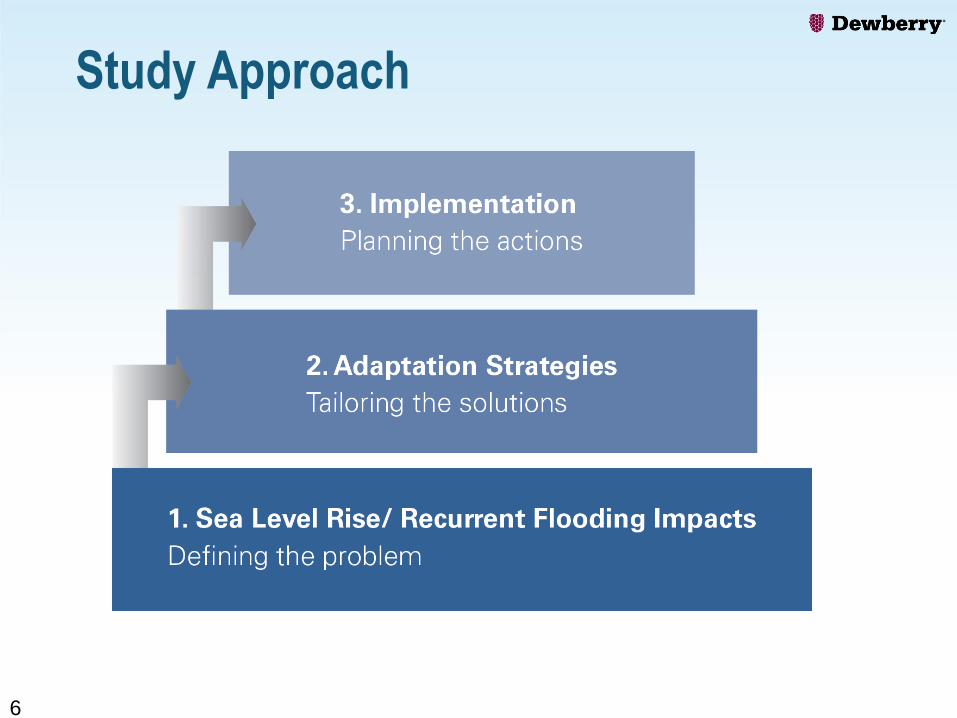
Study Approach
6
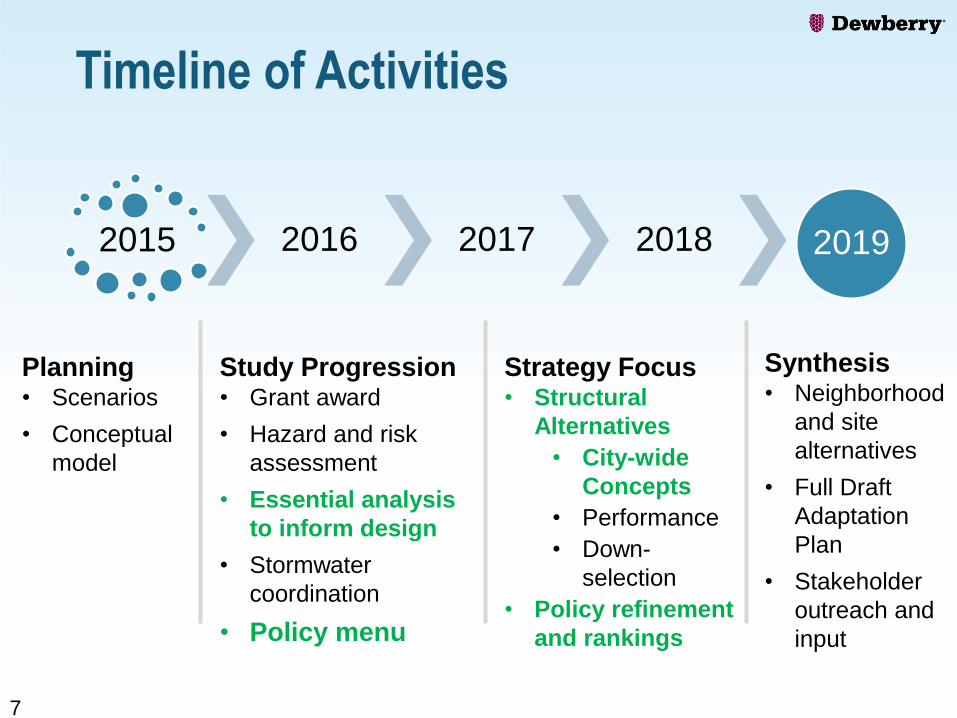
Timeline of Activities
2015 2016 2017 2018 2019
7
Planning• Scenarios
• Conceptual
model
Study Progression• Grant award
• Hazard and risk
assessment
• Essential analysis
to inform design
• Stormwater
coordination
• Policy menu
Strategy Focus• Structural
Alternatives
• City-wide
Concepts
• Performance
• Down-
selection
• Policy refinement
and rankings
Synthesis• Neighborhood
and site
alternatives
• Full Draft
Adaptation
Plan
• Stakeholder
outreach and
input
Hazards and Risk Recap
8
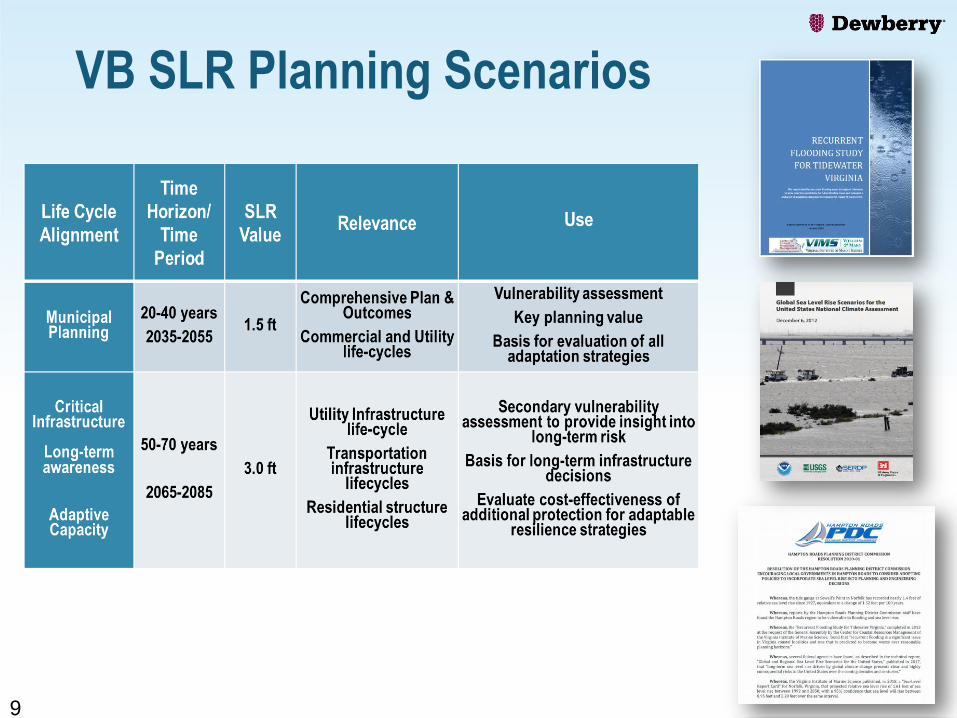
VB SLR Planning Scenarios
9
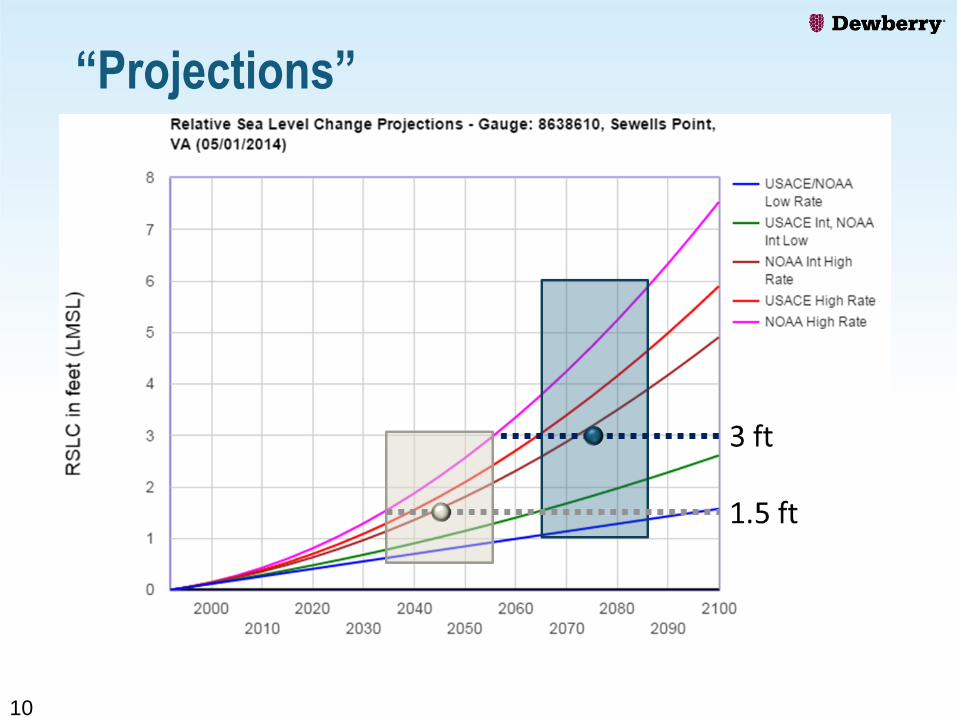
“Projections”
10
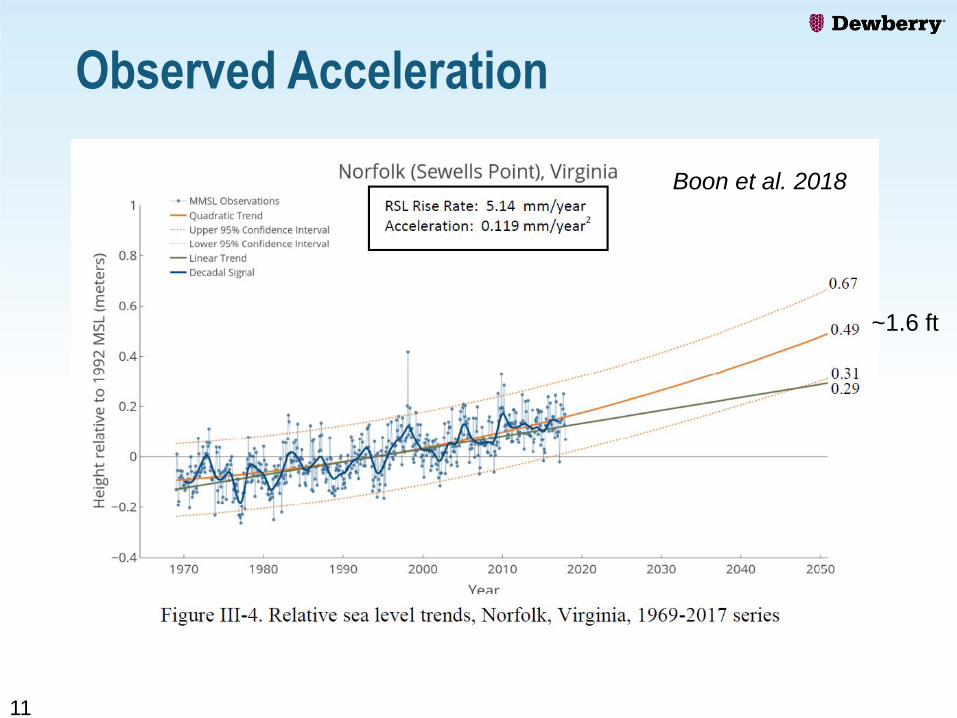
Observed Acceleration
11
Boon et al. 2018
~1.6 ft
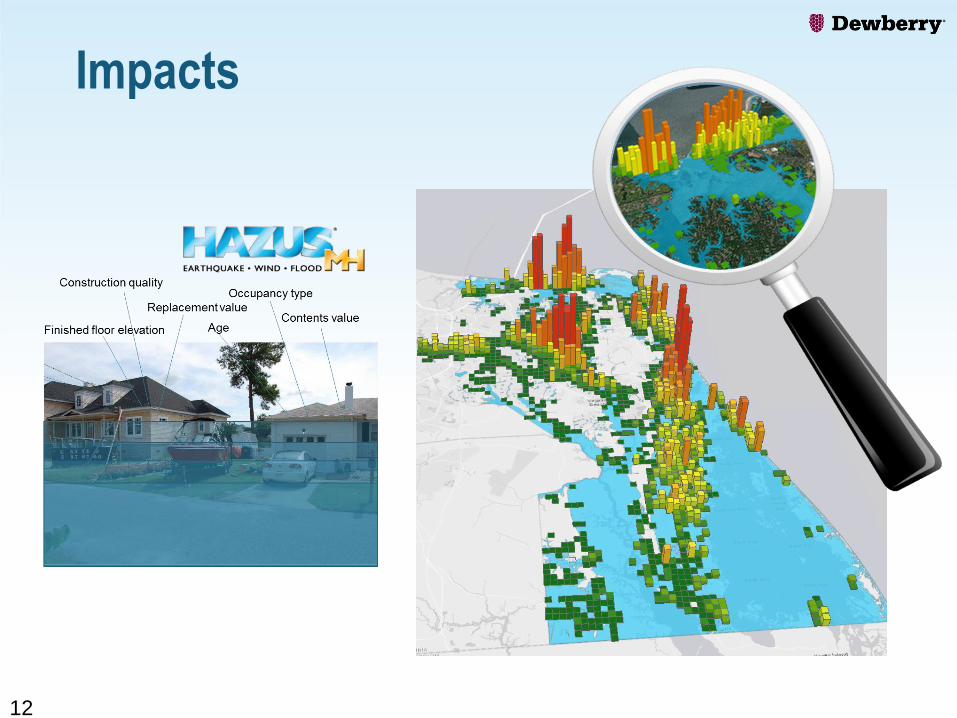
Impacts
12
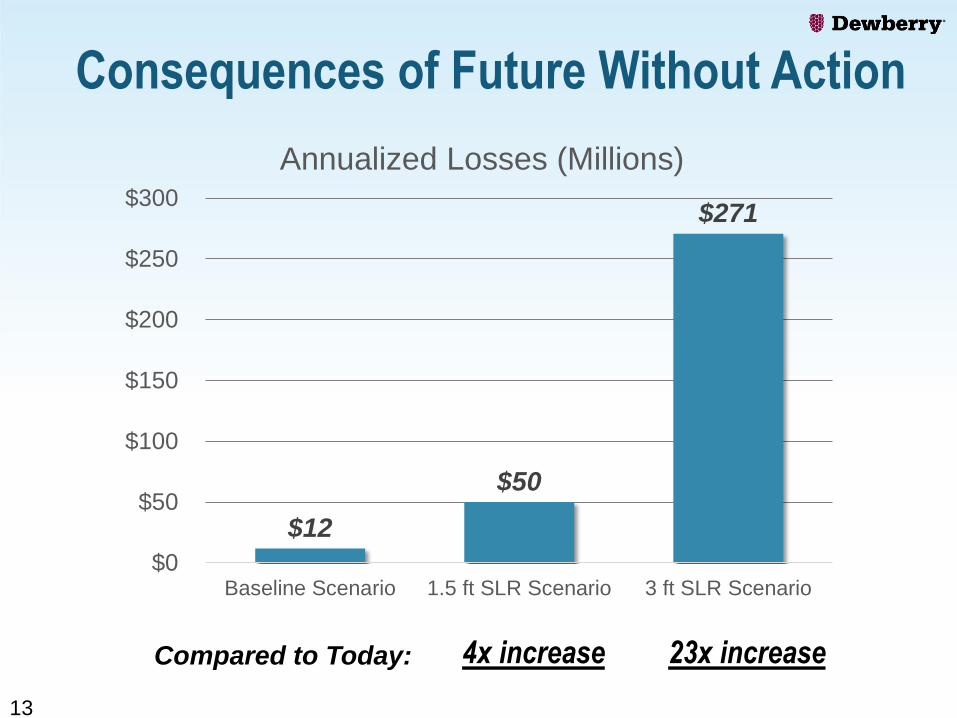
Consequences of Future Without Action
13
4x increase 23x increase
$12
$50
$271
$0
$50
$100
$150
$200
$250
$300
Baseline Scenario 1.5 ft SLR Scenario 3 ft SLR Scenario
Annualized Losses (Millions)
Compared to Today:
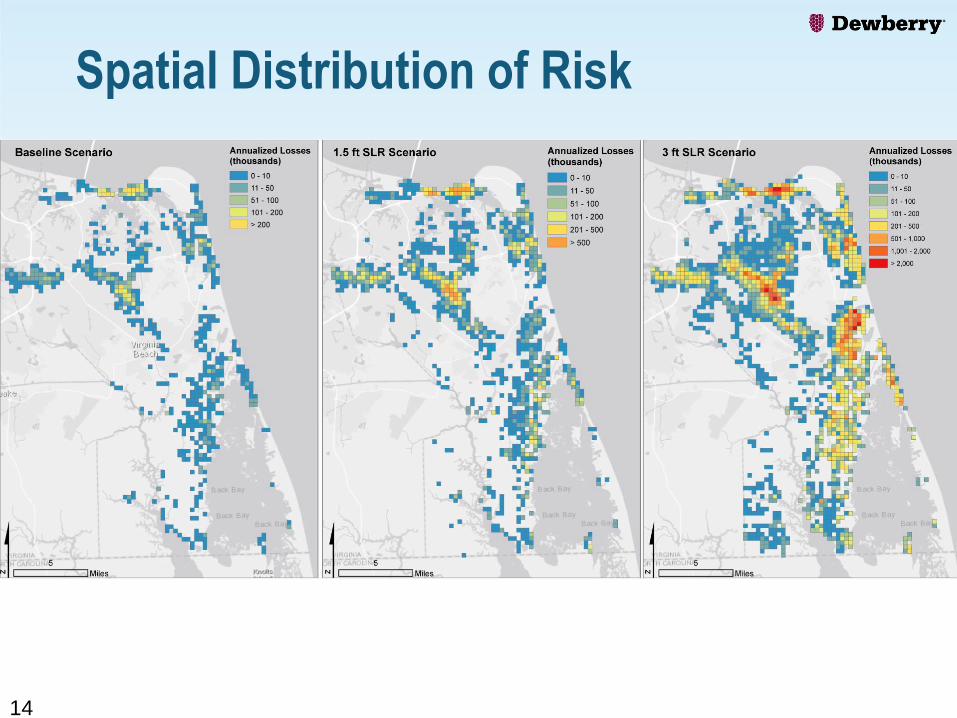
Spatial Distribution of Risk
14
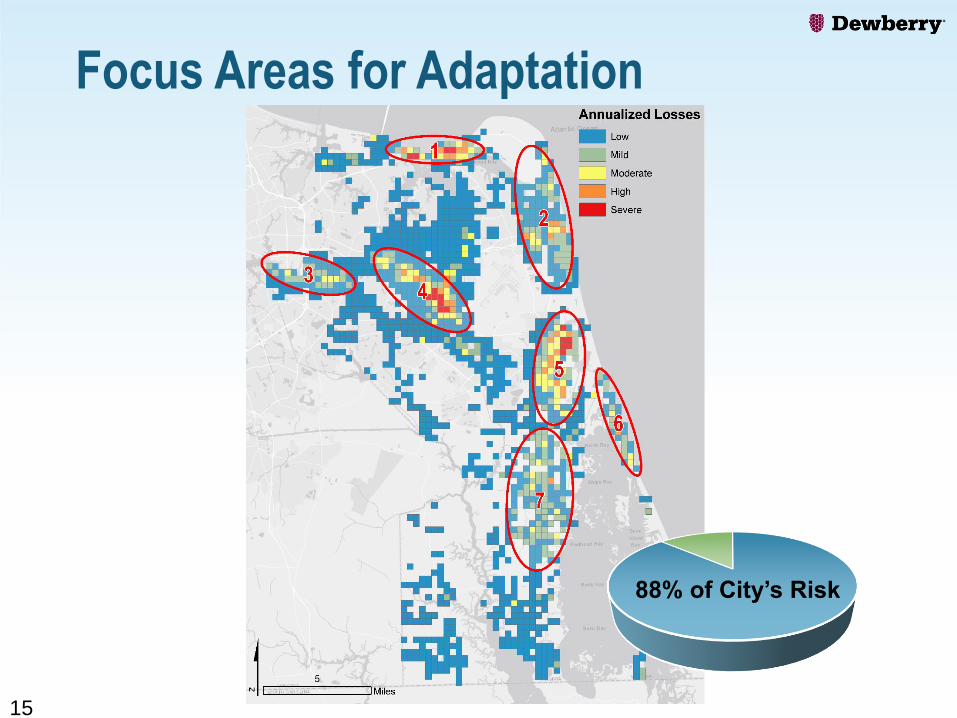
Focus Areas for Adaptation
15
88% of City’s Risk
Adaptation Strategies
16
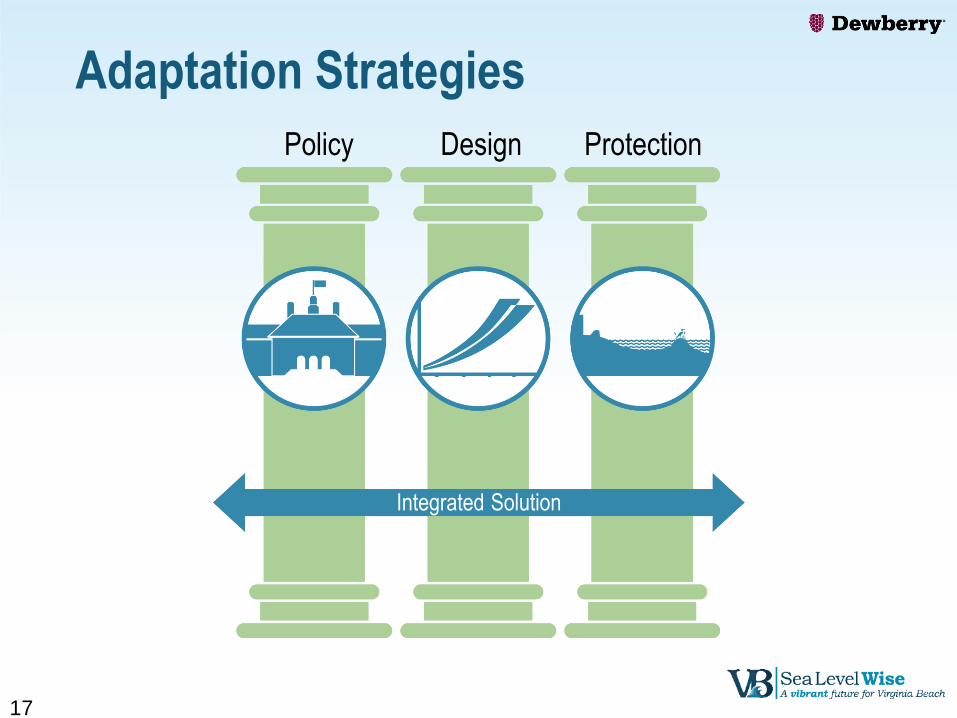
Adaptation Strategies
17
Policy Design Protection
Integrated Solution
Policy Document Overview
18
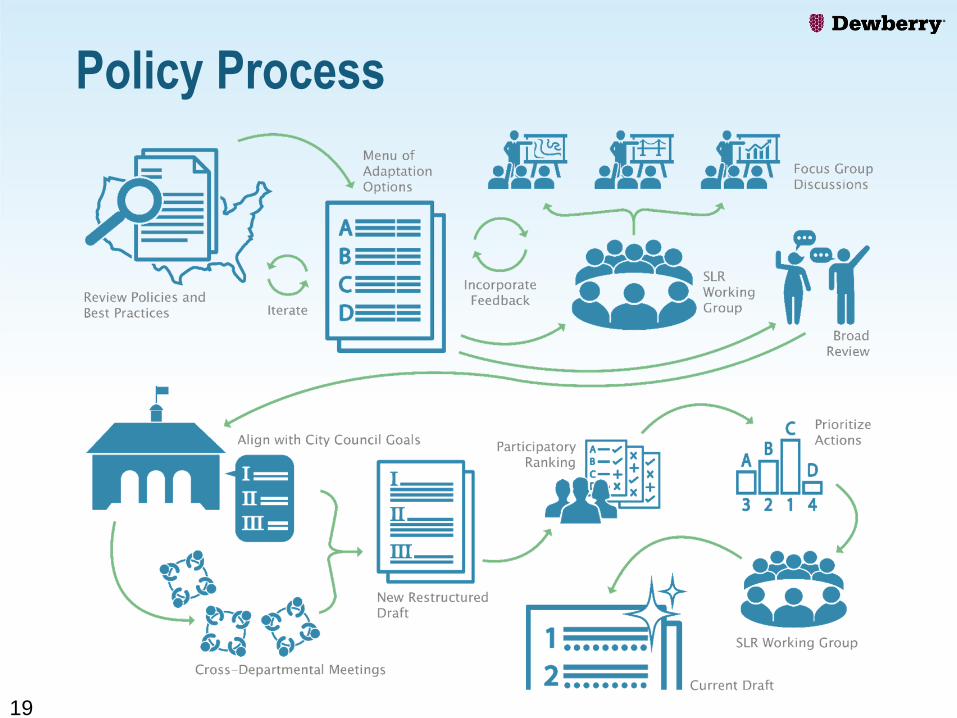
Policy Process
19

Policy Document
20
• What it represents:
• Guidelines for instilling best practices to reduce long-term flood risk
• Starting place for evaluation and implementation by City
• Unique reflection of City staff perspective and priorities
• Not a prescriptive document to be followed “to the letter”
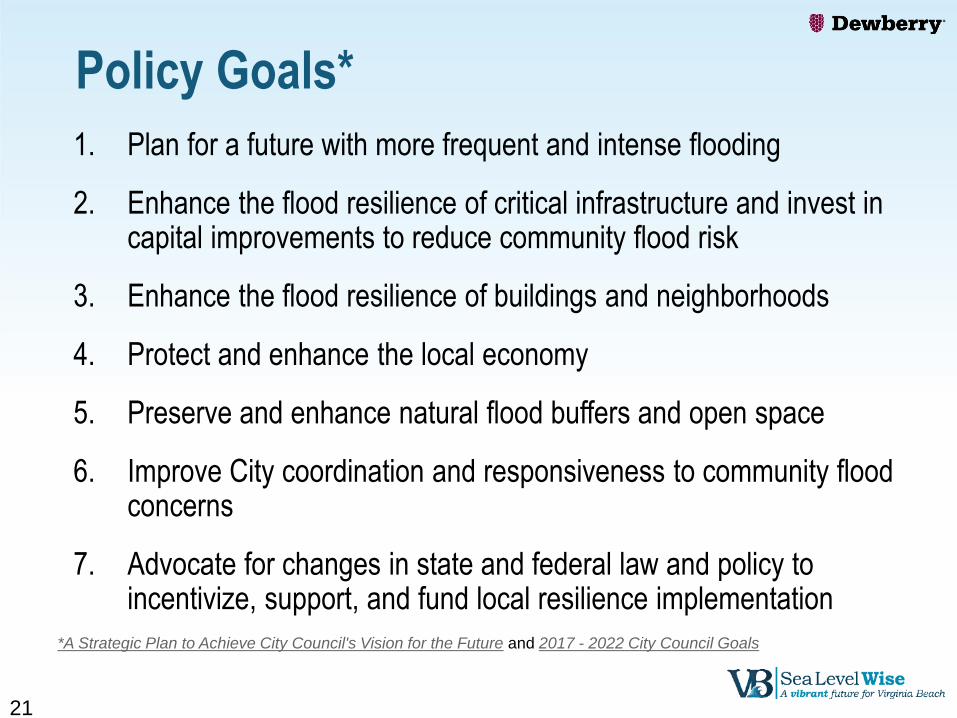
Policy Goals*
1. Plan for a future with more frequent and intense flooding
2. Enhance the flood resilience of critical infrastructure and invest in capital improvements to reduce community flood risk
3. Enhance the flood resilience of buildings and neighborhoods
4. Protect and enhance the local economy
5. Preserve and enhance natural flood buffers and open space
6. Improve City coordination and responsiveness to community flood concerns
7. Advocate for changes in state and federal law and policy to incentivize, support, and fund local resilience implementation
21
*A Strategic Plan to Achieve City Council's Vision for the Future and 2017 - 2022 City Council Goals
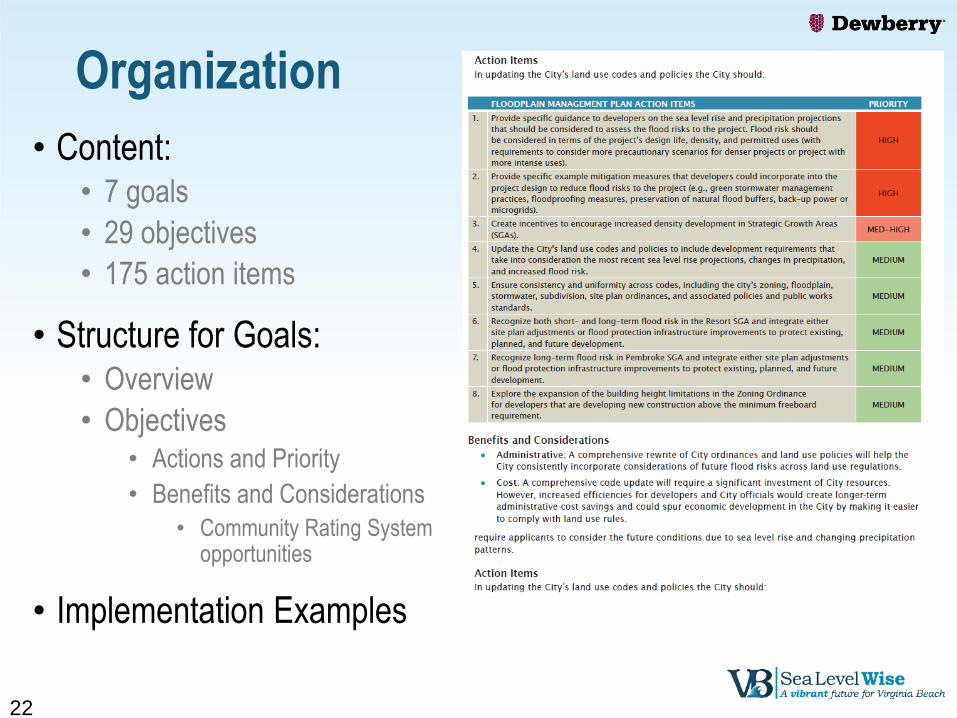
Organization
• Content: • 7 goals
• 29 objectives
• 175 action items
• Structure for Goals: • Overview
• Objectives• Actions and Priority
• Benefits and Considerations
• Community Rating System opportunities
• Implementation Examples
22
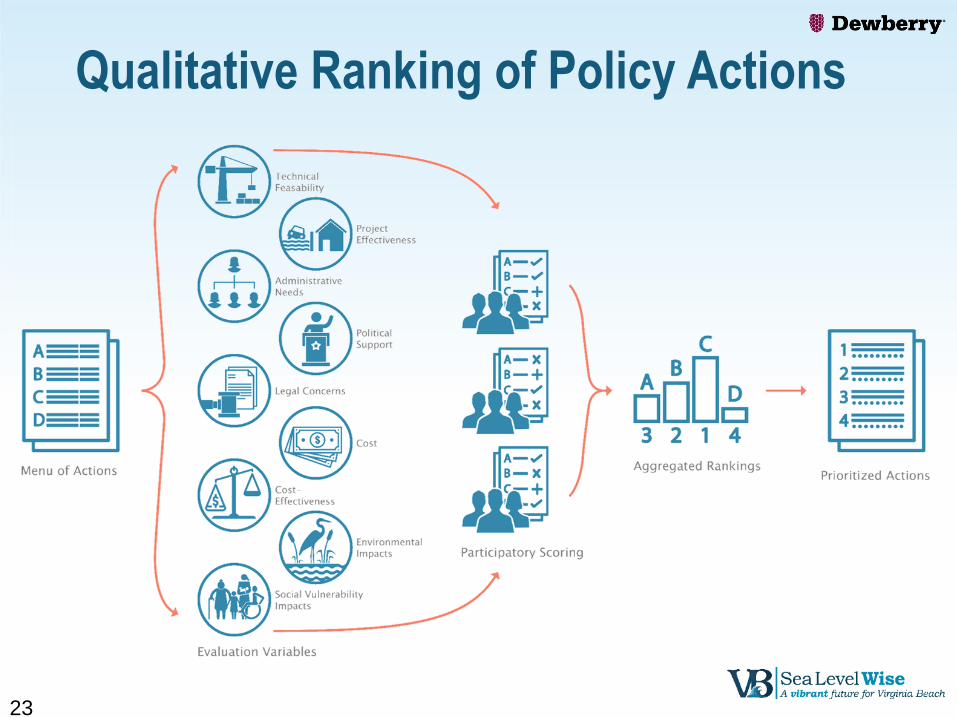
Qualitative Ranking of Policy Actions
23
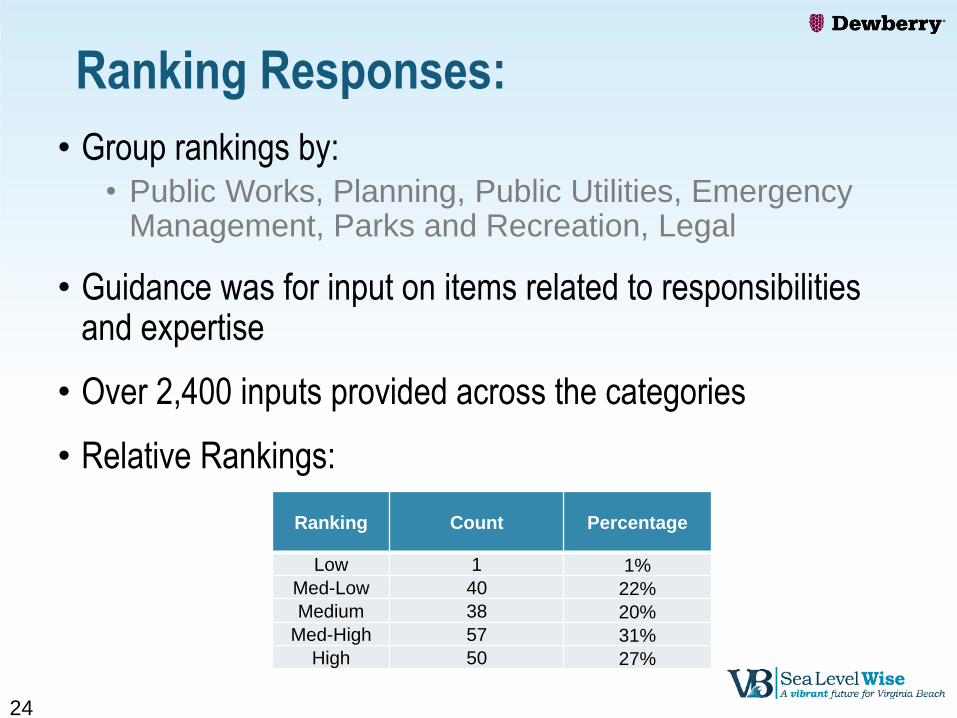
Ranking Responses:
• Group rankings by: • Public Works, Planning, Public Utilities, Emergency
Management, Parks and Recreation, Legal
• Guidance was for input on items related to responsibilities and expertise
• Over 2,400 inputs provided across the categories
• Relative Rankings:
24
Ranking Count Percentage
Low 1 1%
Med-Low 40 22%
Medium 38 20%
Med-High 57 31%
High 50 27%
Implementation Vision
• Administered and monitored by the Deputy City Manager SLR Working Group
• Responsibility will be assigned for action items to City departments/staff
• City staff will interpret and evaluate the action items and implement the action in general reflection of priorities
• Implementation will occur after public comment
25
Informing Design
26
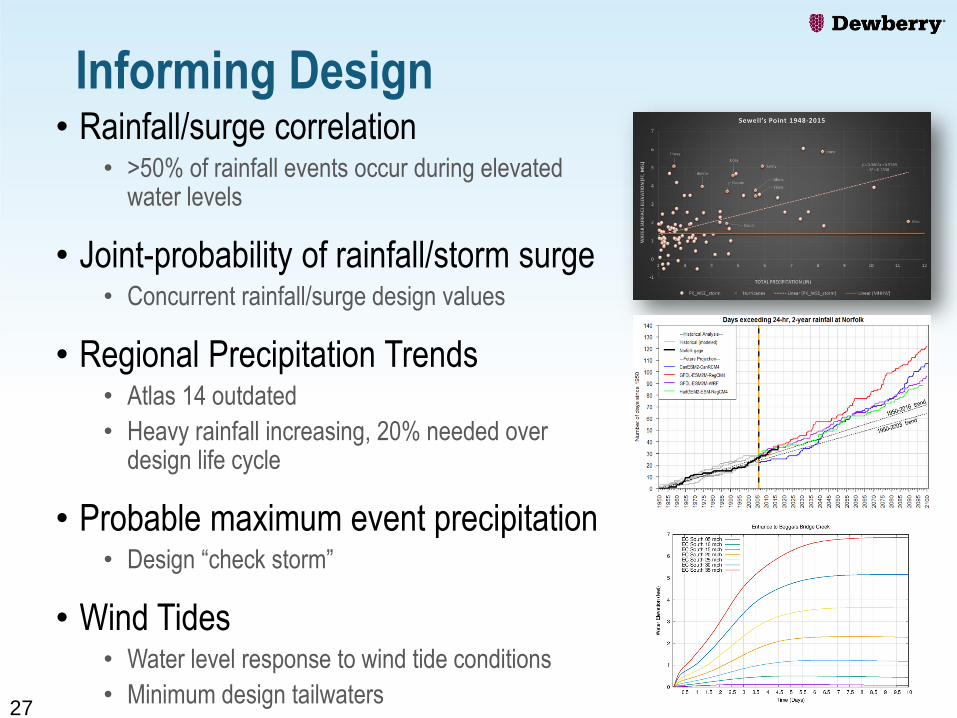
• Rainfall/surge correlation• >50% of rainfall events occur during elevated
water levels
• Joint-probability of rainfall/storm surge• Concurrent rainfall/surge design values
• Regional Precipitation Trends• Atlas 14 outdated
• Heavy rainfall increasing, 20% needed over design life cycle
• Probable maximum event precipitation• Design “check storm”
• Wind Tides • Water level response to wind tide conditions
• Minimum design tailwaters
Informing Design
27
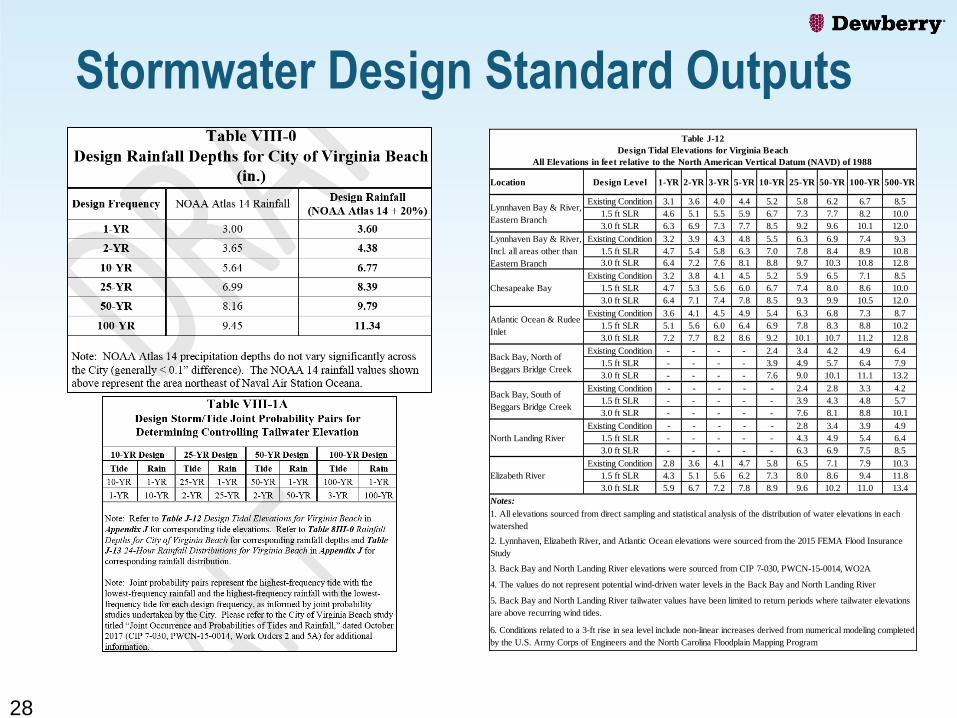
Stormwater Design Standard Outputs
28
Existing Condition 3.1 3.6 4.0 4.4 5.2 5.8 6.2 6.7 8.5
1.5 ft SLR 4.6 5.1 5.5 5.9 6.7 7.3 7.7 8.2 10.0
3.0 ft SLR 6.3 6.9 7.3 7.7 8.5 9.2 9.6 10.1 12.0
Existing Condition 3.2 3.9 4.3 4.8 5.5 6.3 6.9 7.4 9.3
1.5 ft SLR 4.7 5.4 5.8 6.3 7.0 7.8 8.4 8.9 10.8
3.0 ft SLR 6.4 7.2 7.6 8.1 8.8 9.7 10.3 10.8 12.8
Existing Condition 3.2 3.8 4.1 4.5 5.2 5.9 6.5 7.1 8.5
1.5 ft SLR 4.7 5.3 5.6 6.0 6.7 7.4 8.0 8.6 10.0
3.0 ft SLR 6.4 7.1 7.4 7.8 8.5 9.3 9.9 10.5 12.0
Existing Condition 3.6 4.1 4.5 4.9 5.4 6.3 6.8 7.3 8.7
1.5 ft SLR 5.1 5.6 6.0 6.4 6.9 7.8 8.3 8.8 10.2
3.0 ft SLR 7.2 7.7 8.2 8.6 9.2 10.1 10.7 11.2 12.8
Existing Condition - - - - 2.4 3.4 4.2 4.9 6.4
1.5 ft SLR - - - - 3.9 4.9 5.7 6.4 7.9
3.0 ft SLR - - - - 7.6 9.0 10.1 11.1 13.2
Existing Condition - - - - - 2.4 2.8 3.3 4.2
1.5 ft SLR - - - - - 3.9 4.3 4.8 5.7
3.0 ft SLR - - - - - 7.6 8.1 8.8 10.1
Existing Condition - - - - - 2.8 3.4 3.9 4.9
1.5 ft SLR - - - - - 4.3 4.9 5.4 6.4
3.0 ft SLR - - - - - 6.3 6.9 7.5 8.5
Existing Condition 2.8 3.6 4.1 4.7 5.8 6.5 7.1 7.9 10.3
1.5 ft SLR 4.3 5.1 5.6 6.2 7.3 8.0 8.6 9.4 11.8
3.0 ft SLR 5.9 6.7 7.2 7.8 8.9 9.6 10.2 11.0 13.4
2. Lynnhaven, Elizabeth River, and Atlantic Ocean elevations were sourced from the 2015 FEMA Flood Insurance
Study
3. Back Bay and North Landing River elevations were sourced from CIP 7-030, PWCN-15-0014, WO2A
4. The values do not represent potential wind-driven water levels in the Back Bay and North Landing River
5. Back Bay and North Landing River tailwater values have been limited to return periods where tailwater elevations
are above recurring wind tides.
6. Conditions related to a 3-ft rise in sea level include non-linear increases derived from numerical modeling completed
by the U.S. Army Corps of Engineers and the North Carolina Floodplain Mapping Program
1. All elevations sourced from direct sampling and statistical analysis of the distribution of water elevations in each
watershed
100-YR 500-YR
Lynnhaven Bay & River,
Eastern Branch
Lynnhaven Bay & River,
Incl. all areas other than
Eastern Branch
Chesapeake Bay
Atlantic Ocean & Rudee
Inlet
Back Bay, North of
Beggars Bridge Creek
Back Bay, South of
Beggars Bridge Creek
North Landing River
Elizabeth River
Notes:
Table J-12
Design Tidal Elevations for Virginia Beach
All Elevations in feet relative to the North American Vertical Datum (NAVD) of 1988
Location Design Level 1-YR 2-YR 3-YR 5-YR 10-YR 25-YR 50-YR
Structural Protection
29

Structural Flood Risk Reduction
Key Activities:
• Investigate coastal flood pathways
• Identify locations for flood risk reduction
• Develop flood risk reduction alternatives
• Assess feasibility and performance
• Provide recommendations
30
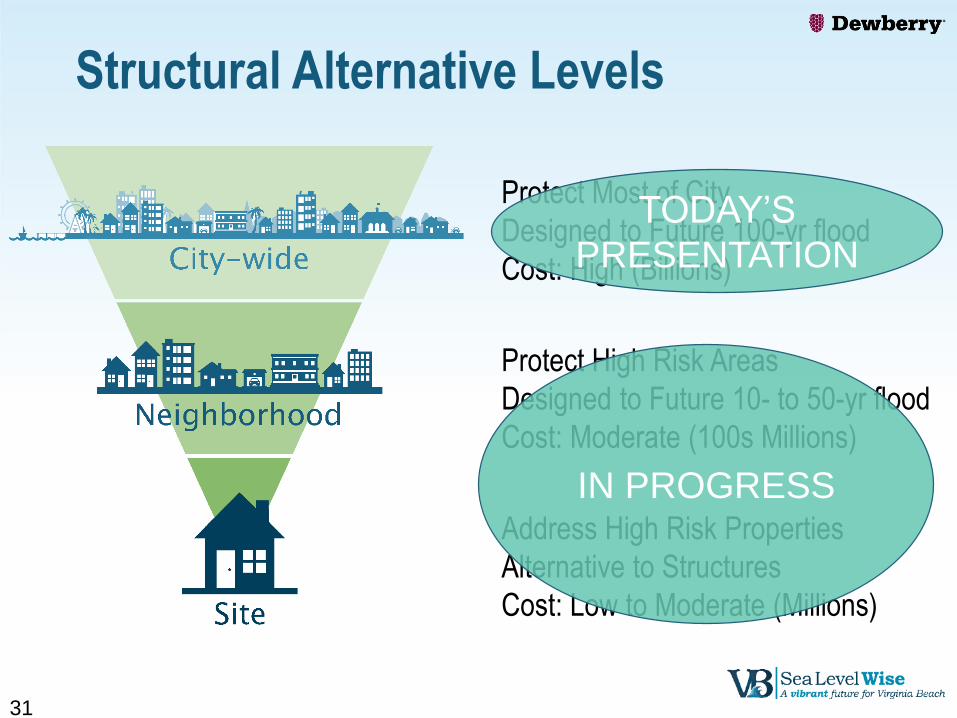
Structural Alternative Levels
31
Protect Most of City
Designed to Future 100-yr flood
Cost: High (Billions)
Protect High Risk Areas
Designed to Future 10- to 50-yr flood
Cost: Moderate (100s Millions)
Address High Risk Properties
Alternative to Structures
Cost: Low to Moderate (Millions)
TODAY’S
PRESENTATION
IN PROGRESS

City-wide Protection Alternatives
• Limitations:
• High-level concepts
• Alignments based on desktop analysis
• Each alignment will have major impacts and concerns which are not captured in detail
• Drainage, Environmental, Traffic and Circulation, Navigation, Real Estate, Costs, Constructability, etc…
• Initial results today – final results pending
32
33
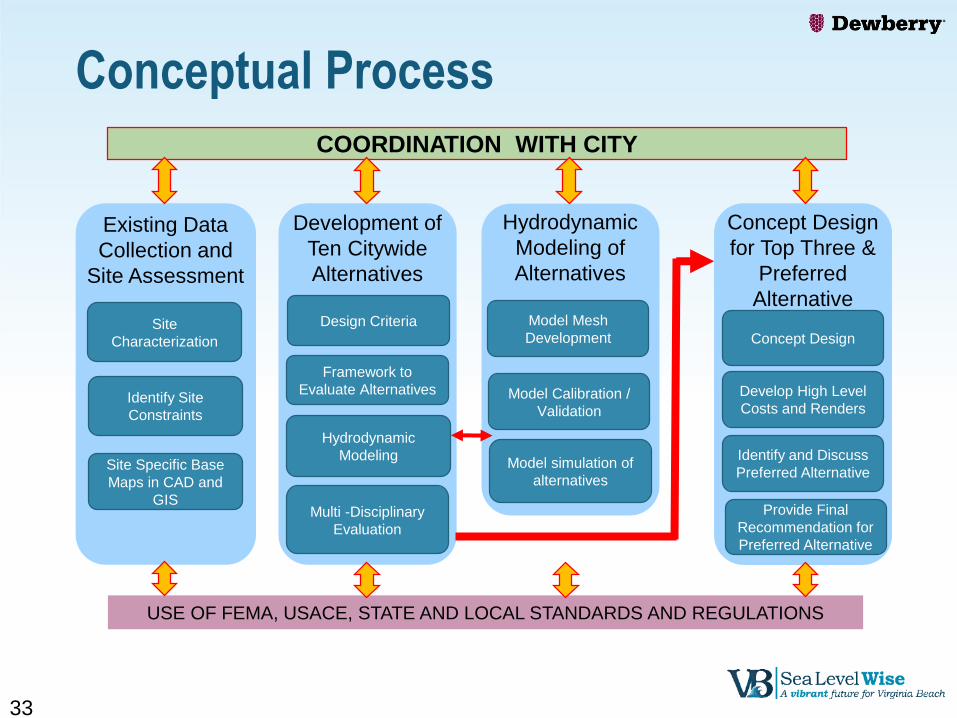
Conceptual Process
COORDINATION WITH CITY
Existing Data
Collection and
Site Assessment
Site
Characterization
Identify Site
Constraints
Site Specific Base
Maps in CAD and
GIS
Development of
Ten Citywide
Alternatives
Design Criteria
Multi -Disciplinary
Evaluation
Hydrodynamic
Modeling
Framework to
Evaluate Alternatives
Hydrodynamic
Modeling of
Alternatives
Model Mesh
Development
Model Calibration /
Validation
USE OF FEMA, USACE, STATE AND LOCAL STANDARDS AND REGULATIONS
Model simulation of
alternatives
Concept Design
for Top Three &
Preferred
Alternative
Concept Design
Develop High Level
Costs and Renders
Provide Final
Recommendation for
Preferred Alternative
Identify and Discuss
Preferred Alternative
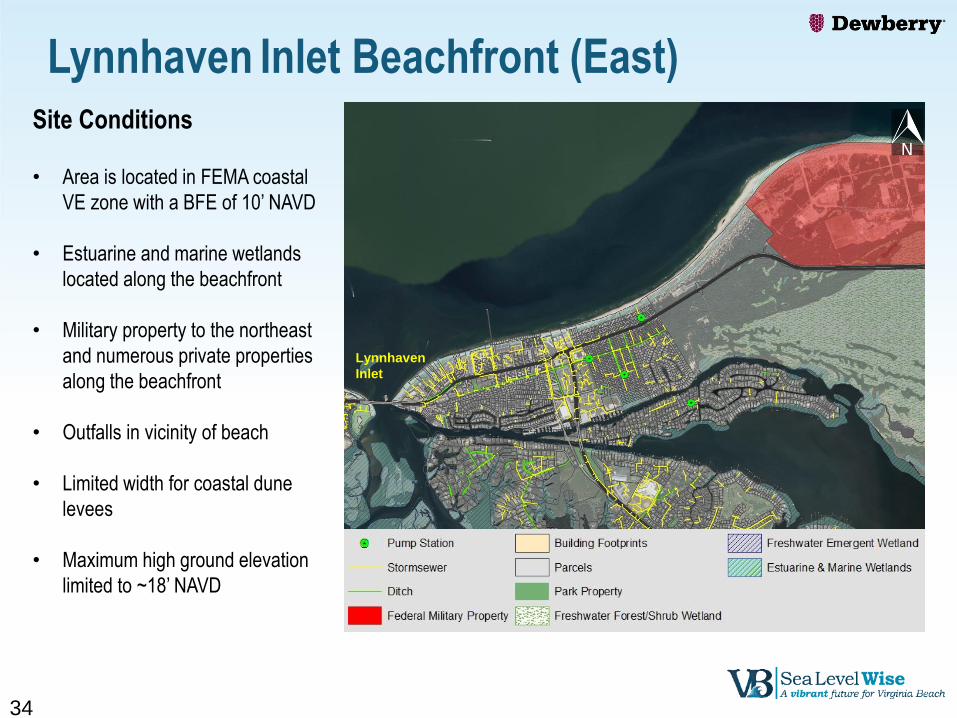
Site Conditions
• Area is located in FEMA coastal
VE zone with a BFE of 10’ NAVD
• Estuarine and marine wetlands
located along the beachfront
• Military property to the northeast
and numerous private properties
along the beachfront
• Outfalls in vicinity of beach
• Limited width for coastal dune
levees
• Maximum high ground elevation
limited to ~18’ NAVD
Lynnhaven Inlet Beachfront (East)
34
Lynnhaven
Inlet
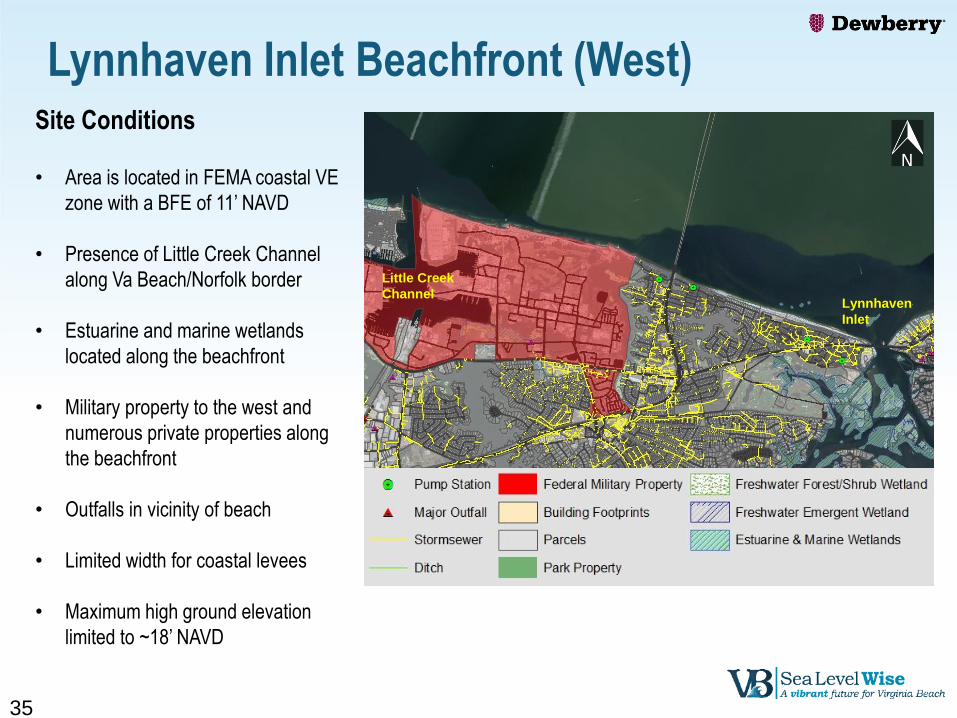
Site Conditions
• Area is located in FEMA coastal VE
zone with a BFE of 11’ NAVD
• Presence of Little Creek Channel
along Va Beach/Norfolk border
• Estuarine and marine wetlands
located along the beachfront
• Military property to the west and
numerous private properties along
the beachfront
• Outfalls in vicinity of beach
• Limited width for coastal levees
• Maximum high ground elevation
limited to ~18’ NAVD
35
Lynnhaven
Inlet
Little Creek
Channel
Lynnhaven Inlet Beachfront (West)
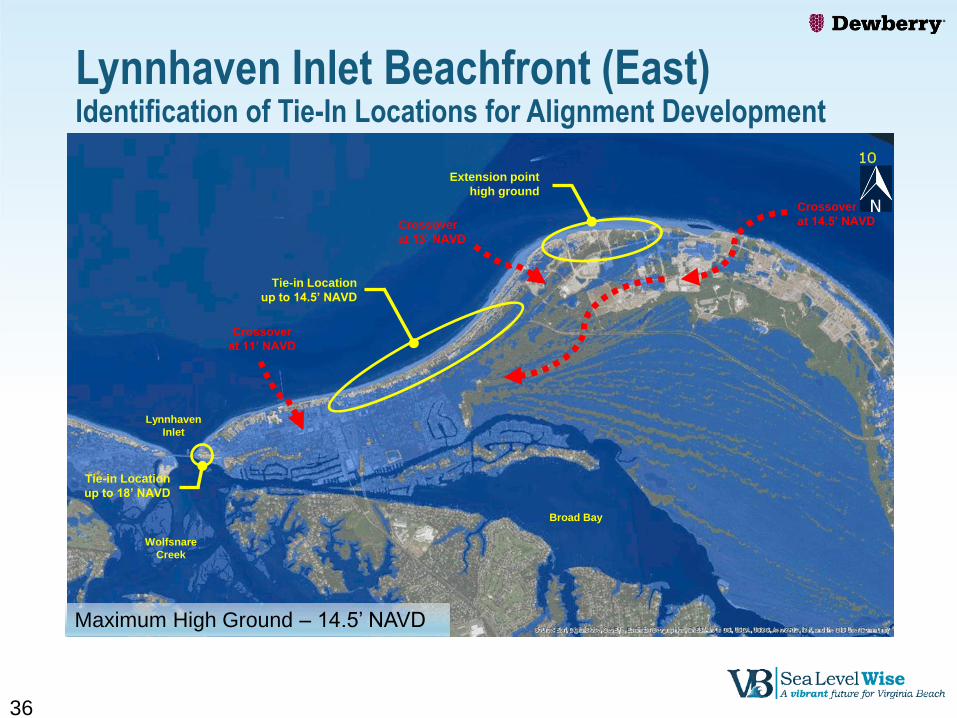
Lynnhaven Inlet Beachfront (East)Identification of Tie-In Locations for Alignment Development
36
Lynnhaven
Inlet
Broad Bay
Wolfsnare
Creek
Tie-in Location
up to 14.5’ NAVD
Extension point
high ground
Crossover
at 14.5’ NAVD
Crossover
at 11’ NAVD
Crossover
at 13’ NAVD
Tie-in Location
up to 18’ NAVD
Maximum High Ground – 14.5’ NAVD
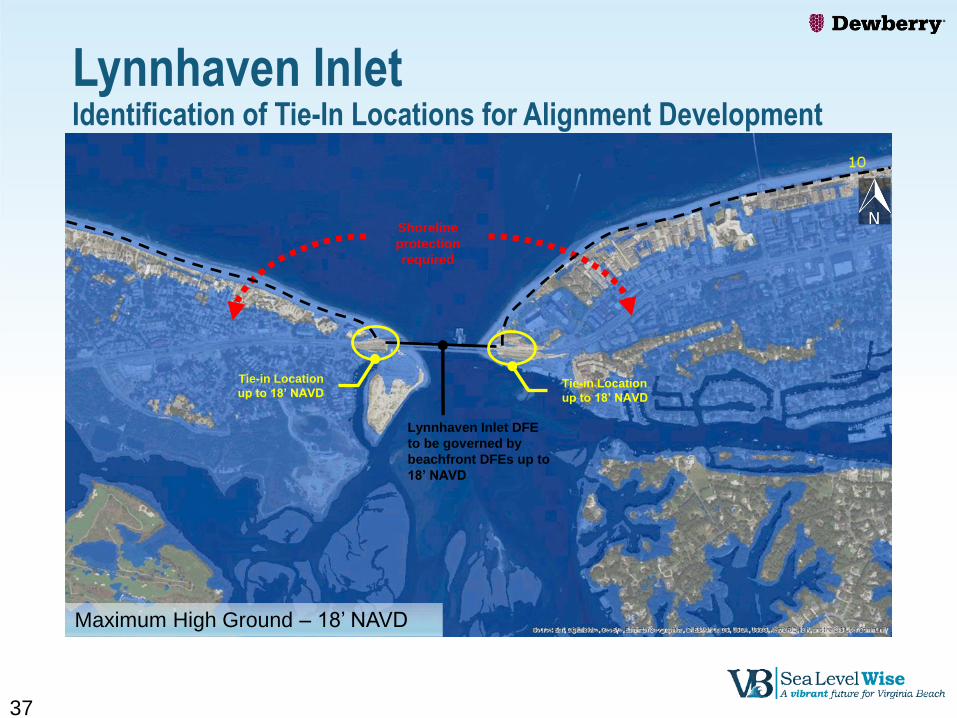
Lynnhaven Inlet Identification of Tie-In Locations for Alignment Development
37
Tie-in Location
up to 18’ NAVDTie-in Location
up to 18’ NAVD
Shoreline
protection
required
Lynnhaven Inlet DFE
to be governed by
beachfront DFEs up to
18’ NAVD
Maximum High Ground – 18’ NAVD
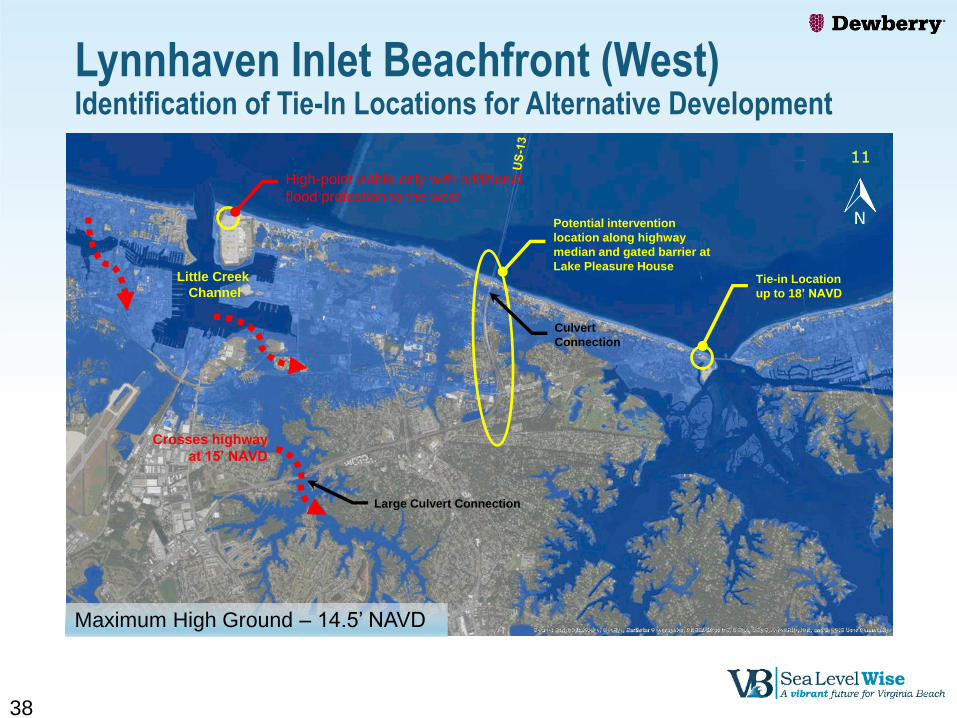
Lynnhaven Inlet Beachfront (West)Identification of Tie-In Locations for Alternative Development
38
High-point viable only with additional
flood protection to the west
Crosses highway
at 15’ NAVD
Tie-in Location
up to 18’ NAVD
Potential intervention
location along highway
median and gated barrier at
Lake Pleasure House
Large Culvert Connection
Maximum High Ground – 14.5’ NAVD
Little Creek
Channel
Culvert
Connection
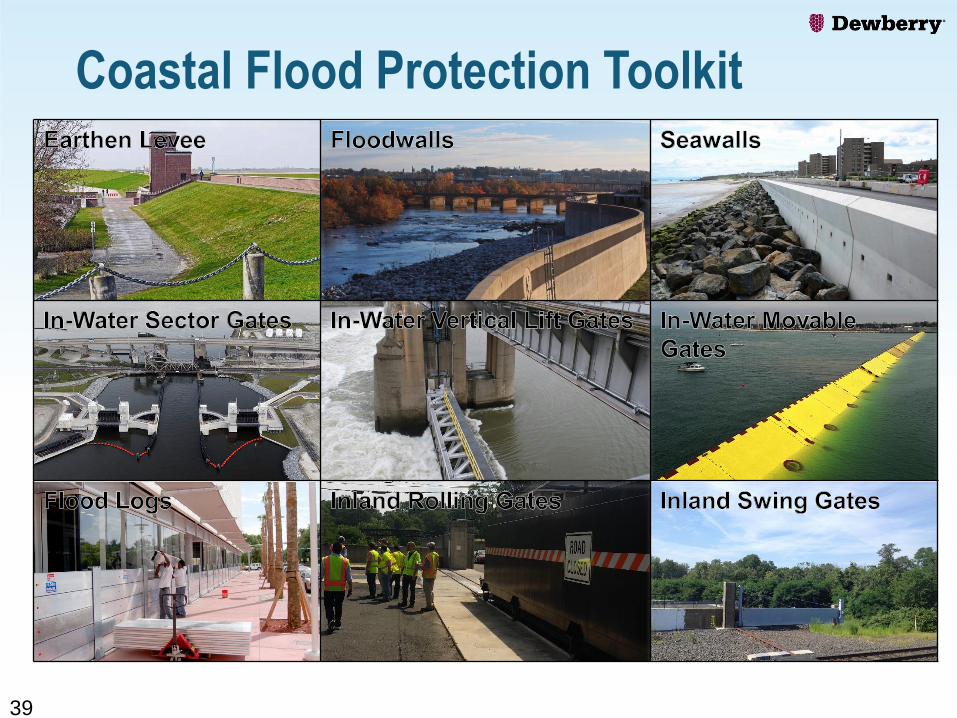
Coastal Flood Protection Toolkit
39
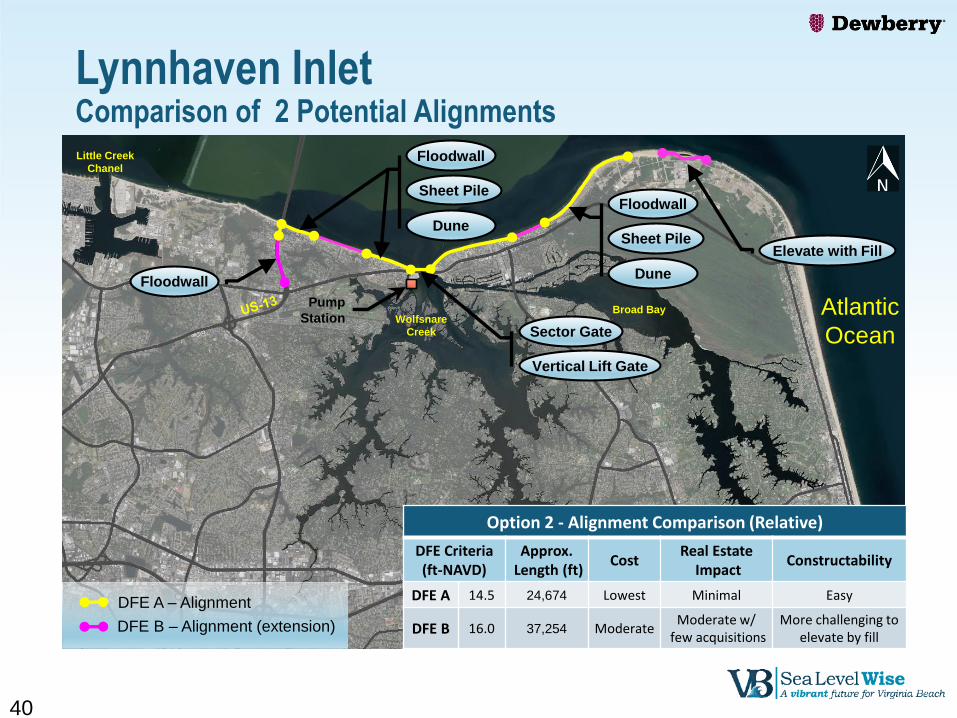
Lynnhaven InletComparison of 2 Potential Alignments
40
Atlantic
OceanWolfsnare
Creek
Floodwall
Floodwall
Sheet Pile
Dune
Broad Bay
Sector Gate
Vertical Lift Gate
Elevate with Fill
DFE A – Alignment
DFE B – Alignment (extension)
Floodwall
Sheet Pile
Dune
Pump
Station
Little Creek
Chanel
Option 2 - Alignment Comparison (Relative)
DFE Criteria(ft-NAVD)
Approx. Length (ft)
CostReal Estate
ImpactConstructability
DFE A 14.5 24,674 Lowest Minimal Easy
DFE B 16.0 37,254 ModerateModerate w/
few acquisitionsMore challenging to
elevate by fill
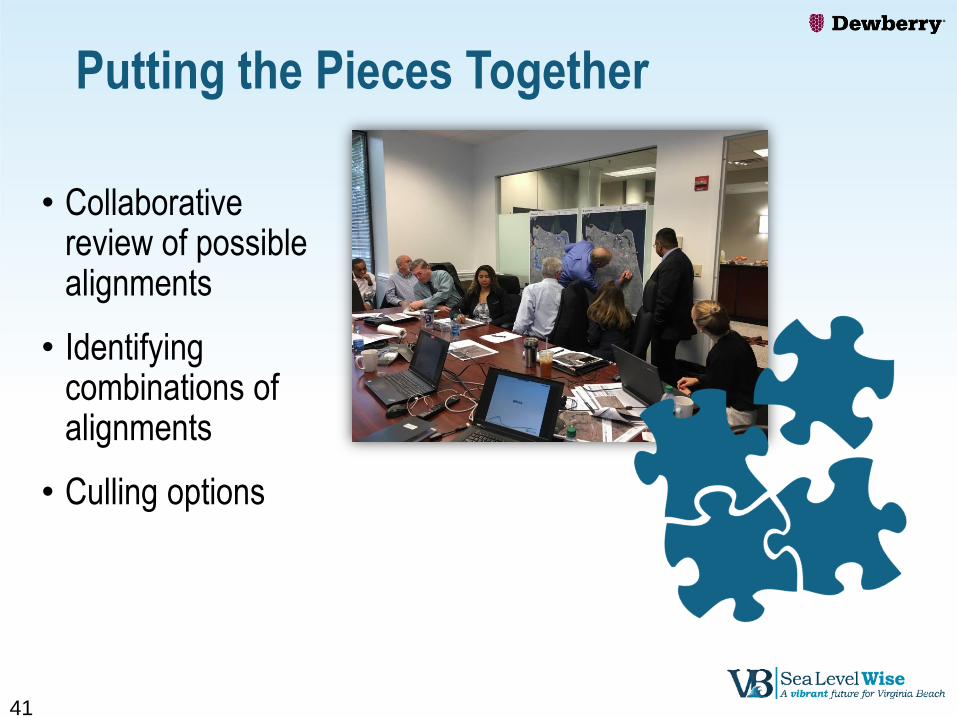
Putting the Pieces Together
• Collaborative review of possiblealignments
• Identifying combinations of alignments
• Culling options
41

Conceptualized Alignment Locations
42
1. Lynnhaven Inlet
2. Long Canal
3. Upper West Branch Lynnhaven
4. Lower West Branch Lynnhaven
5. Upper East Branch Lynnhaven
6. Lower East Branch Lynnhaven
7. Rudee Inlet
8. Elizabeth River
9. West Neck Creek Bridge
10. Knotts Island
11. Sandbridge Road
12. Muddy Creek Road
1
23
4
5
6 7
8
9
11
12
10

Combinations for Evaluation
43
Alternative 1 Alternative 2 Alternative 3 Alternative 4 Alternative 5
Alternative 6 Alternative 7 Alternative 8 Alternative 9 Alternative 10
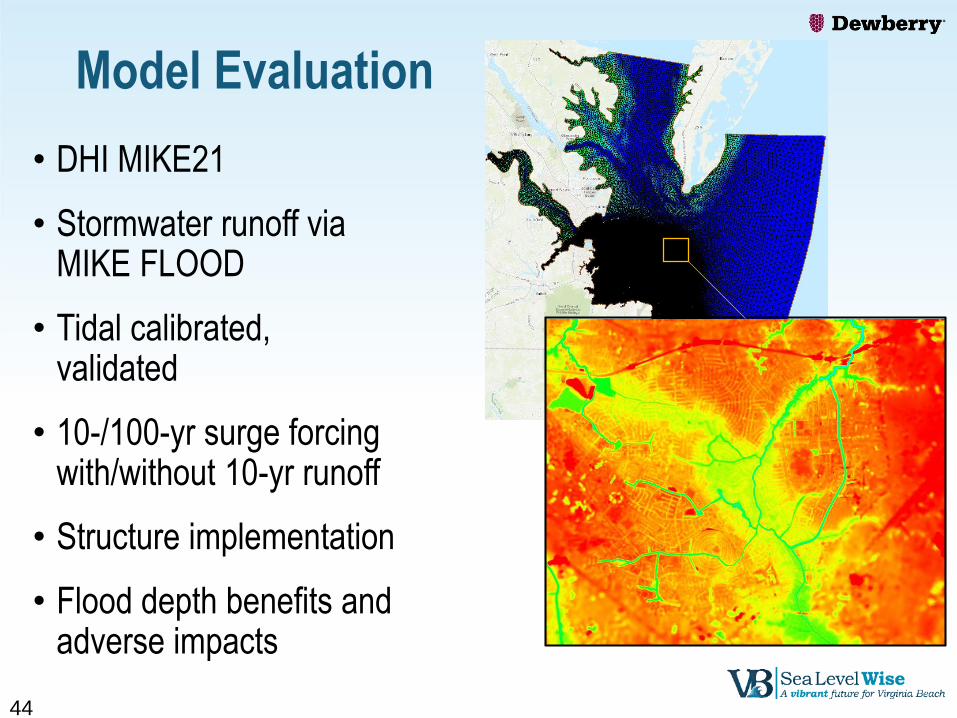
Model Evaluation
• DHI MIKE21
• Stormwater runoff viaMIKE FLOOD
• Tidal calibrated, validated
• 10-/100-yr surge forcingwith/without 10-yr runoff
• Structure implementation
• Flood depth benefits and adverse impacts
44

Model Evaluation of Flood Reduction
45
Areas where flooding completely
removed
Areas of flood reduction
(flood depth decreased)
FOR INFORMATIONAL PURPOSES
Initial values shown, currently under
refinement
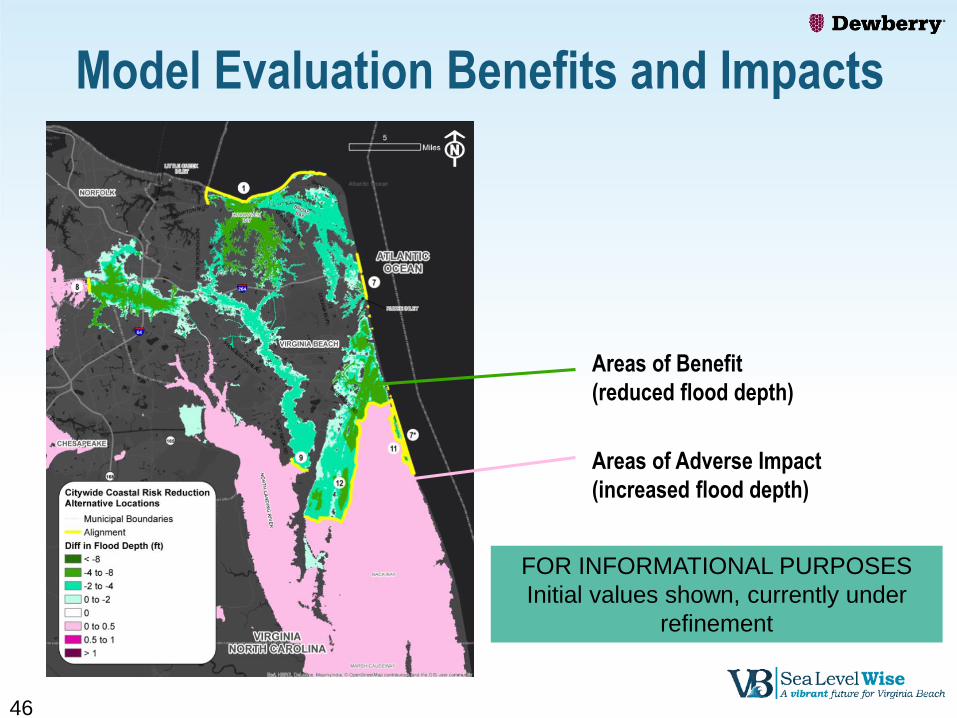
Model Evaluation Benefits and Impacts
46
Areas of Benefit
(reduced flood depth)
Areas of Adverse Impact
(increased flood depth)
FOR INFORMATIONAL PURPOSES
Initial values shown, currently under
refinement
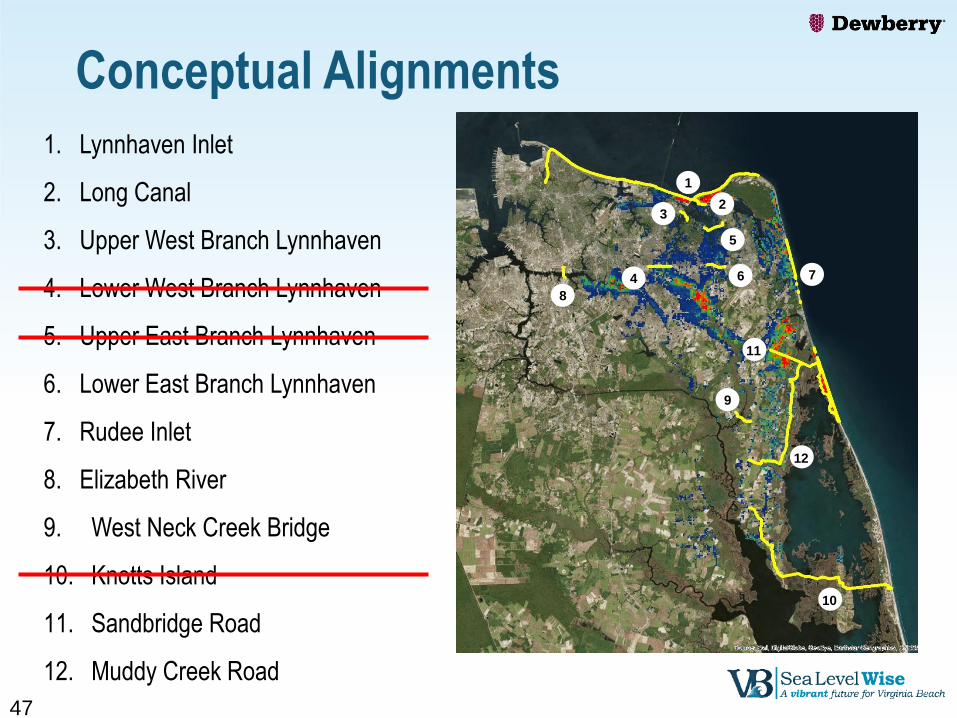
Conceptual Alignments
47
1. Lynnhaven Inlet
2. Long Canal
3. Upper West Branch Lynnhaven
4. Lower West Branch Lynnhaven
5. Upper East Branch Lynnhaven
6. Lower East Branch Lynnhaven
7. Rudee Inlet
8. Elizabeth River
9. West Neck Creek Bridge
10. Knotts Island
11. Sandbridge Road
12. Muddy Creek Road
1
23
4
5
6 7
8
9
11
12
10

Down-selection of Alternatives
48
Alternative 1 Alternative 2 Alternative 3 Alternative 4 Alternative 5
Alternative 6 Alternative 7 Alternative 8 Alternative 9 Alternative 10
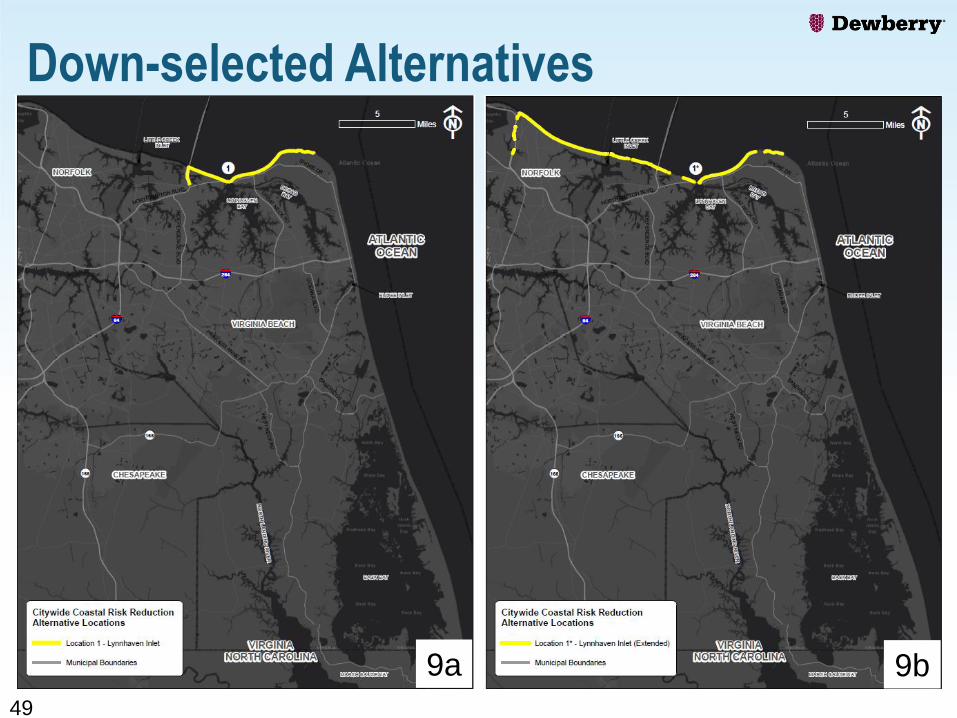
Down-selected Alternatives
49
9a 9b
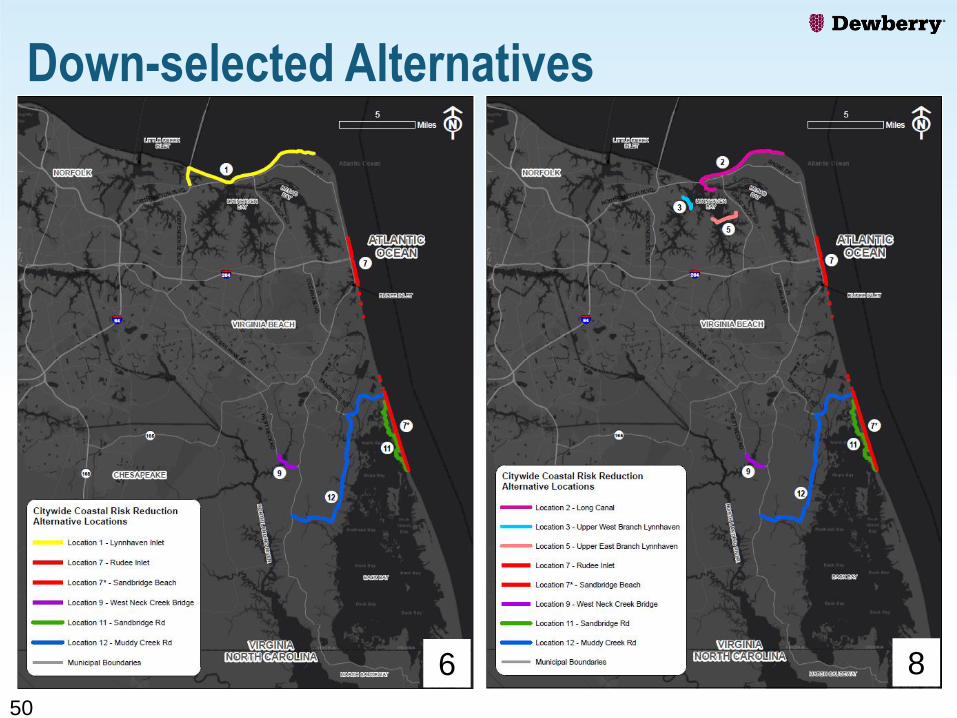
Down-selected Alternatives
50
6 8
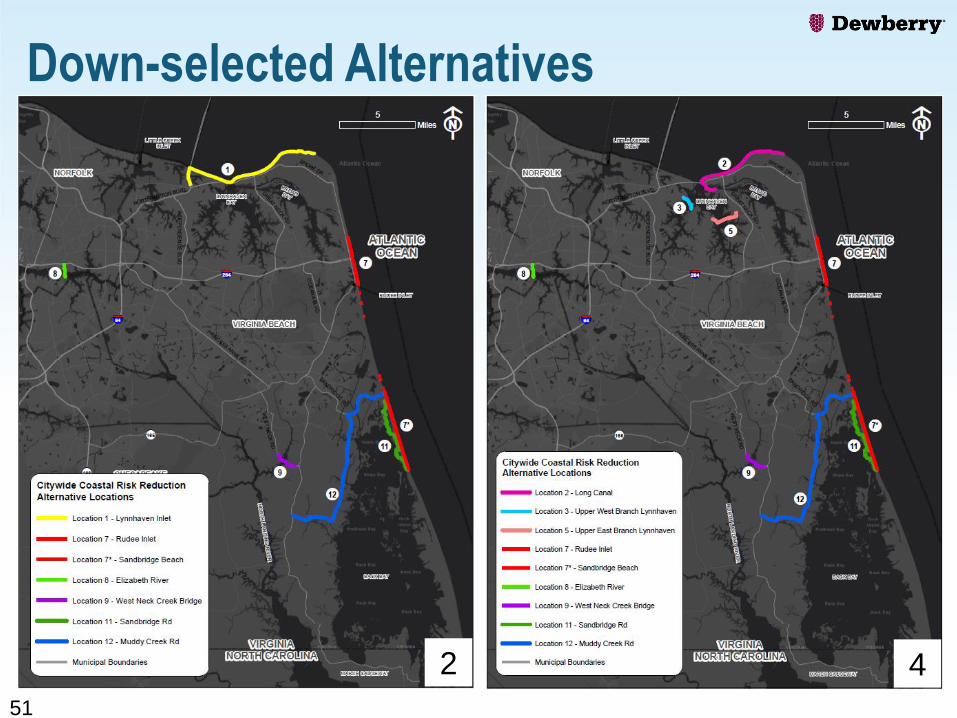
Down-selected Alternatives
51
2 4
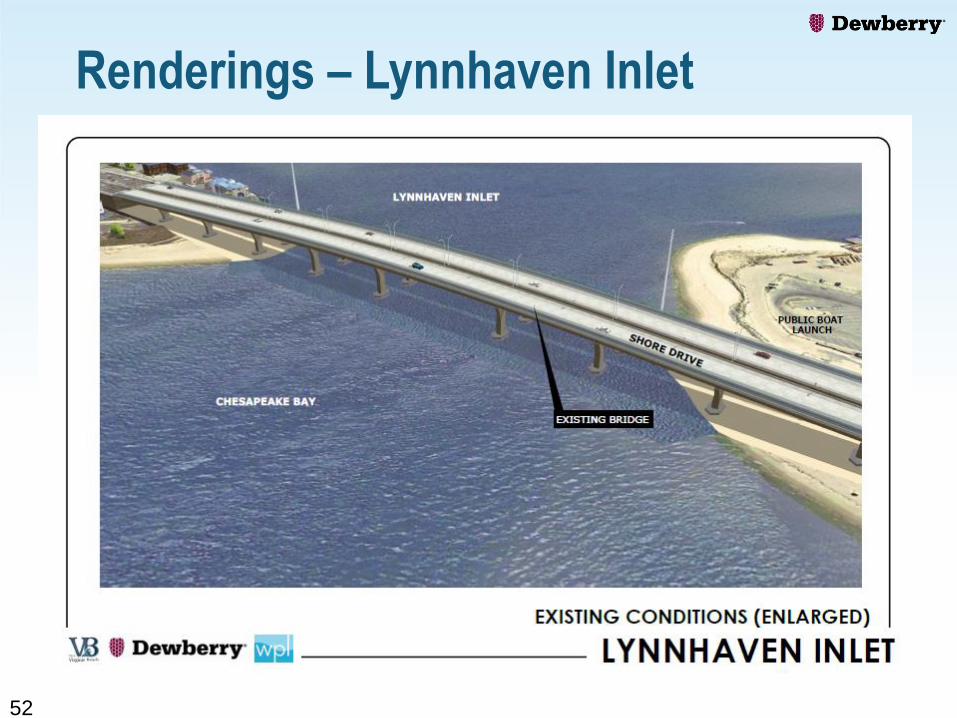
Renderings – Lynnhaven Inlet
52
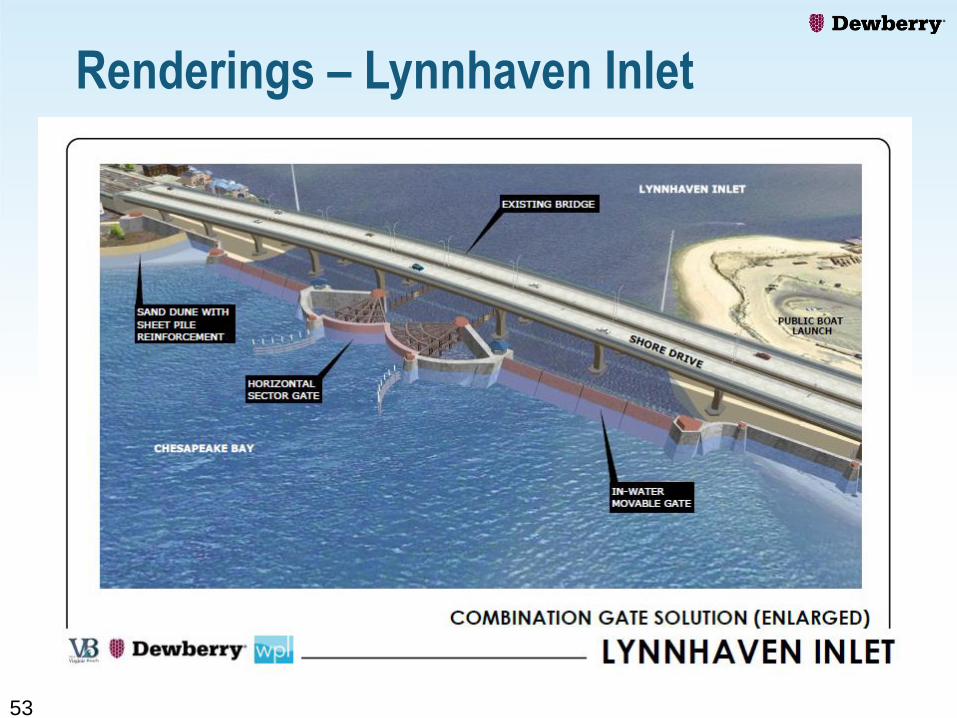
Renderings – Lynnhaven Inlet
53

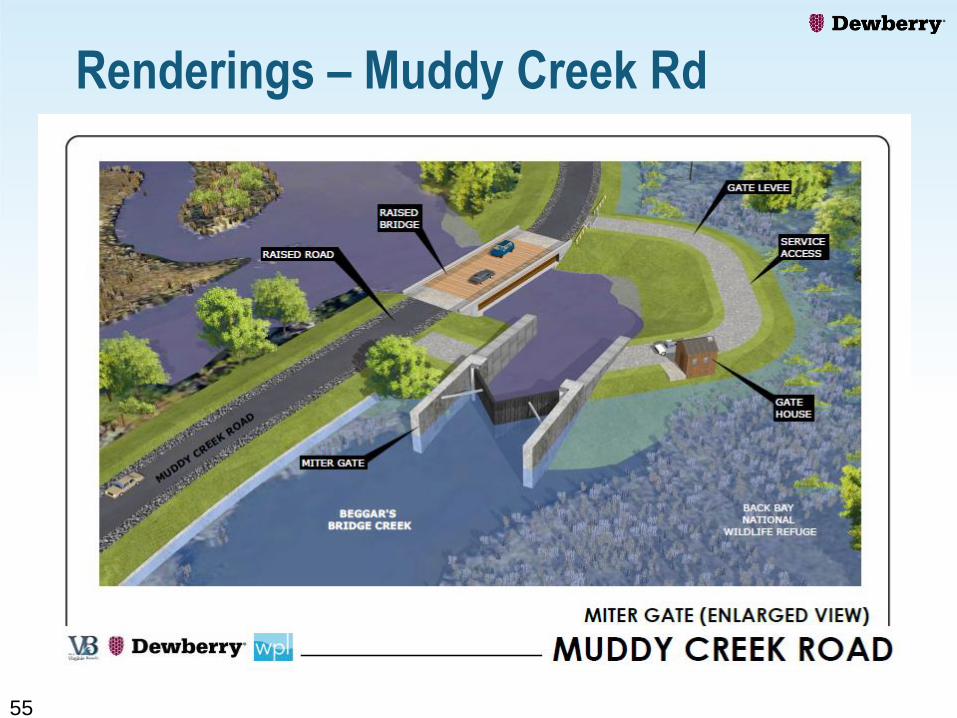
Renderings – Muddy Creek Rd
54
Renderings – Muddy Creek Rd
55
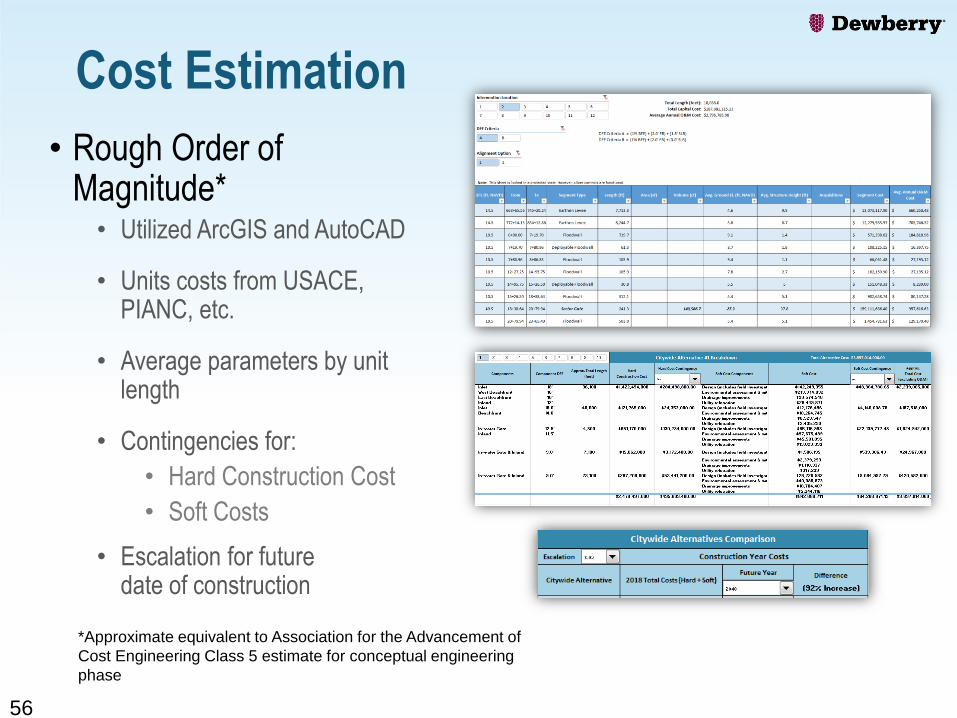
Cost Estimation
• Rough Order of Magnitude*
• Utilized ArcGIS and AutoCAD
• Units costs from USACE, PIANC, etc.
• Average parameters by unit length
• Contingencies for:
• Hard Construction Cost
• Soft Costs
• Escalation for futuredate of construction
56
*Approximate equivalent to Association for the Advancement of
Cost Engineering Class 5 estimate for conceptual engineering
phase
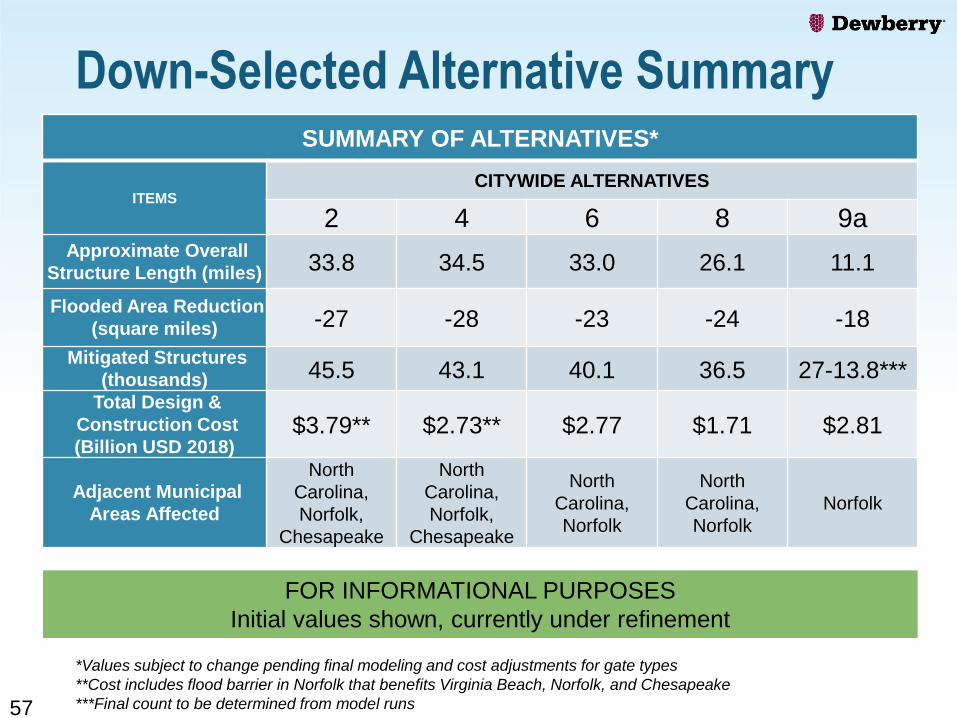
Down-Selected Alternative Summary
57
*Values subject to change pending final modeling and cost adjustments for gate types
**Cost includes flood barrier in Norfolk that benefits Virginia Beach, Norfolk, and Chesapeake
***Final count to be determined from model runs
FOR INFORMATIONAL PURPOSES
Initial values shown, currently under refinement
SUMMARY OF ALTERNATIVES*
ITEMSCITYWIDE ALTERNATIVES
2 4 6 8 9aApproximate Overall
Structure Length (miles) 33.8 34.5 33.0 26.1 11.1
Flooded Area Reduction
(square miles) -27 -28 -23 -24 -18
Mitigated Structures
(thousands) 45.5 43.1 40.1 36.5 27-13.8***
Total Design &
Construction Cost
(Billion USD 2018)$3.79** $2.73** $2.77 $1.71 $2.81
Adjacent Municipal
Areas Affected
North
Carolina,
Norfolk,
Chesapeake
North
Carolina,
Norfolk,
Chesapeake
North
Carolina,
Norfolk
North
Carolina,
Norfolk
Norfolk
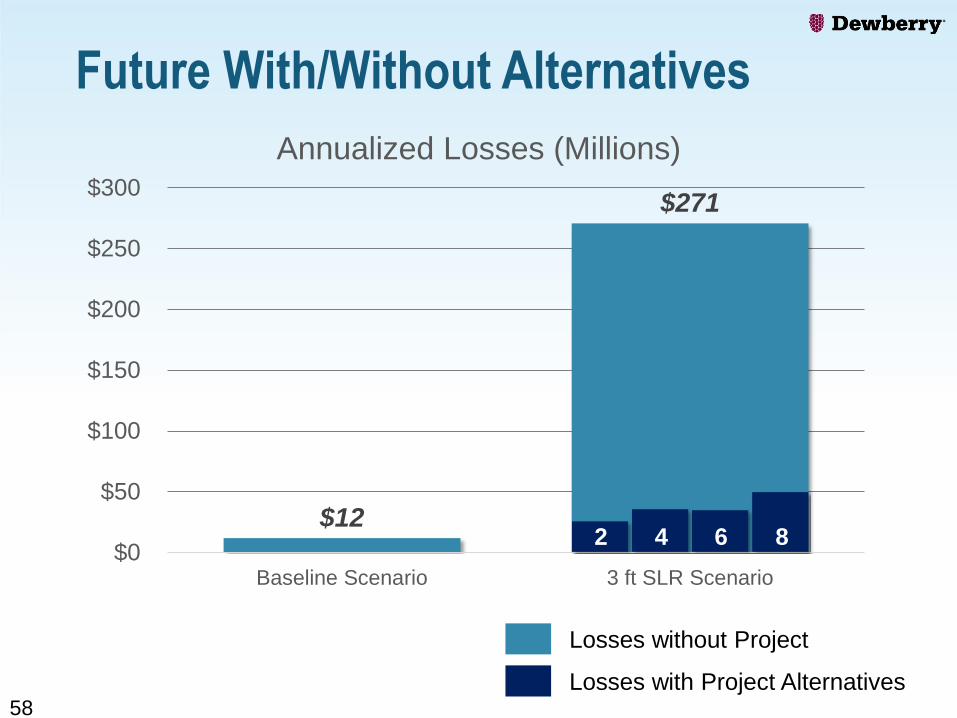
$12
$271
$0
$50
$100
$150
$200
$250
$300
Baseline Scenario 3 ft SLR Scenario
Annualized Losses (Millions)
Future With/Without Alternatives
58
Losses without Project
Losses with Project Alternatives
2 4 6 8
USACE Engagement
59
• Goal: Federal cost share
• How will work to date help? • Catalyst and justification
• Allow deeper, broader study
• Federal feasibility and environmental impact study needed• Debriefed alignment options to USACE in December
• Formal request letter for study start provided January 11, 2019
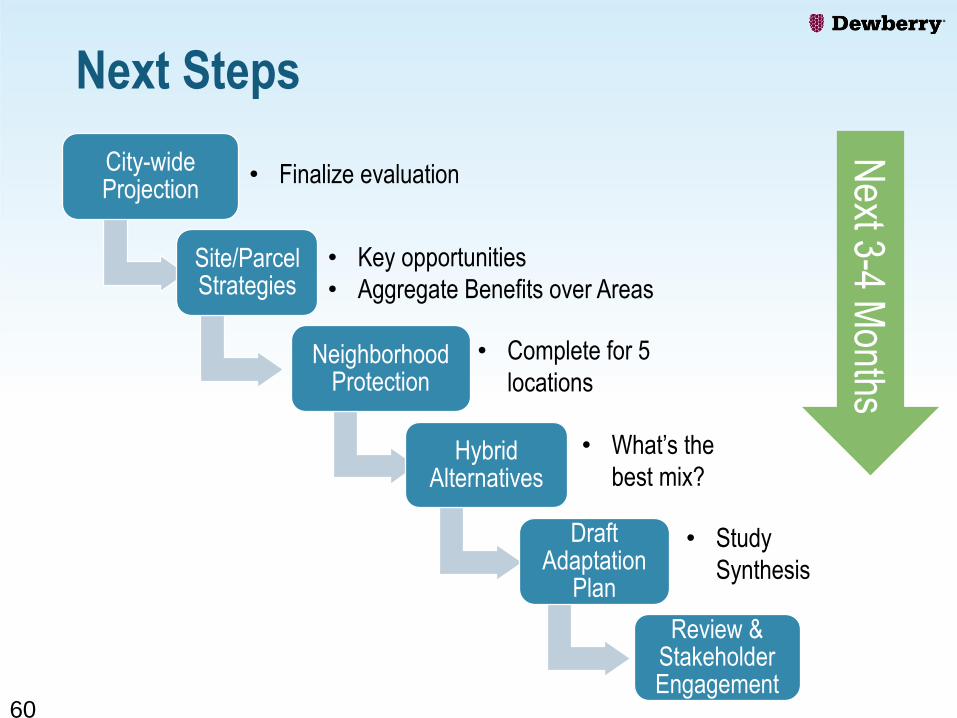
Next Steps
60
City-wide Projection
Site/Parcel Strategies
Neighborhood Protection
Hybrid Alternatives
Draft Adaptation
Plan
Review &Stakeholder Engagement
• Finalize evaluation
• Complete for 5
locations
• Key opportunities
• Aggregate Benefits over Areas
• What’s the
best mix?
• Study
Synthesis
Next 3-4 M
onths
Questions
61