Embed Size (px)
Citation preview

VIRGINIA COMMUNITY COLLEGE SYSTEM
AUDITED FINANCIAL REPORT FOR THE YEAR ENDED JUNE 30, 2010
Prepared by: Office of Fiscal Services
Virginia Community College System 101 North 14th Street
Richmond, Virginia 23219

VCCS Financial Report 2009-2010
STATE BOARD MEMBERS
Gary C. Hancock, Chair
Nathaniel Xavier Marshall, Vice Chair
CHANCELLOR
Glenn DuBois Secretary, State Board
OFFICER REPORTING
David S. Mair Controller
Hank W. Chao Chris A. Lumsden Idalia P. Fernandez Jeffery K. Mitchell Mark R. Graham R. Michael Mohler Dorcas Helfant-Browning Robert W. Shinn Danny Hunley William H. Talley, III Barbara A. Johnsen Alan G. Toxopeus Adele Johnson

VCCS Financial Report 2009-2010
TABLE OF CONTENTS
M, D & A 1 Financial Statements: Statement of Net Assets 10 Statement of Revenue, Expenses and Changes in Net Assets 11 Statement of Cash Flows 12 Notes to the Financial Statements 15-32 Independent Auditor’s Report 33-34

1
VIRGINIA COMMUNITY COLLEGE SYSTEM
Management’s Discussion and Analysis
The Virginia Community College System (VCCS) was established as an institution of higher education in 1965. The System includes the State Board for Community Colleges, a System Office located in Richmond, and twenty-three community colleges located on forty campuses throughout the Commonwealth. The VCCS mission is to provide comprehensive higher education and workforce training programs and services of superior quality that are financially and geographically accessible and that meet individual, business and community needs of the Commonwealth. The following discussion and analysis provides an overview of the financial position and activities of the Virginia Community College System (VCCS) for the year ended June 30, 2010. This discussion has been prepared by management and should be read in conjunction with the financial statements and footnotes. The VCCS financial statements have been prepared in accordance with GASB Statement 35, Basic Financial Statements – and Management’s Discussion and Analysis – for Public Colleges and Universities, as amended by GASB Statements 37, 38 and 39. The three required financial statements are the Statement of Net Assets, the Statement of Revenues, Expenses and Changes in Net Assets, and the Statement of Cash Flows. The community college foundations are included in the accompanying financial statements as a discrete component unit in a separate column. The following discussion and analysis does not include the financial condition and activities of the foundations. Financial Highlights The following represents significant financial highlights for the VCCS in fiscal year 2010:
On an annual basis, adjustments are made to the state budget to account for updated
salary costs, fringe benefit rates, and other savings/expenses resulting from statewide operations during the fiscal year. In fiscal year 2010, $13.9 million was removed from the VCCS budget for these purposes.
In May 2009, statewide budget reductions resulted in the VCCS losing $10.9 million in
state funding. This budget action was in addition to the $40 million in state funding that had been permanently deducted from the VCCS beginning in fiscal year 2008. These reductions carried through to fiscal year 2010.
The VCCS received $6.8 million federal funding for operating purposes in fiscal year
2010 as part of the American Recovery and Reinvestment Act (ARRA).
The State Board for Community Colleges approved separate tuition increases of $5.55 per credit hour for fall 2009 and $7.30 per credit hour for spring 2010. The technology fee rate was also increased by $1 per credit hour effective fall 2009. As a result of these increases, tuition and fee revenue increased approximately $42.9 million in fiscal year 2010.
From fiscal year 2009 to 2010, student full-time equivalent enrollment (FTEs) increased
12.81% from 108,573 FTEs to 122,479 FTEs resulting in an increase in tuition and fee collections of approximately $34 million in fiscal year 2010.
Below is a chart depicting full-time equivalent students attending the VCCS over the past five fiscal years.
One fucalcula Finan The tReven Statem The Syear. Net arelateoutstaimprononexpermaare aventitiedesig
ull time equivalated on an ann
ncial Stateme
three financianues, Expens
ment of Net A
Statement of NThe Stateme
assets are dived debt,” conanding balanovement of thoxpendable oanent endowmvailable for exes. Unrestricnated for spe
lent representsnual basis by ta
ents
al statementsses and Chan
Assets
Net Assets prent also provivided into thrensists of caces of any bose assets. Tr expendablements (availaxpenditure bycted net asseecific purposes
s 30 credit houraking the total c
s presented nge in Net Ass
resents the aides the amoee major catepital assets, borrowings thThe next catee. Nonexpe
able for investy the VCCS bets are not ss by manage
2
rs of classes tacredit hours tau
are the Statsets, and the
ssets and liabount of net asegories. The
net of acchat are attribegory is “Resendable resttment purposebut must be ssubject to extment of the V
aken by a studught divided by
tement of NStatement of
bilities of the ssets and thee first categorcumulated debutable to thestricted net astricted net aes only). Expspent for purpternally impo
VCCS.
dent over an acy 30.
et Assets, thf Cash Flows
VCCS at theeir availability ry, “Invested epreciation ae acquisition,ssets,” which assets are lpendable restposes determosed restrictio
cademic year.
he Statemen.
end of the fisfor expenditin capital, ne
and reduced , constructionare classifiedloan funds tricted net ass
mined by exteons and may
It is
t of
scal ure.
et of by
n or d as and sets rnal
y be

3
A summarized Statement of Net Assets is as follows:
(In thousands of dollars) As of June 30:
2010 2009* Assets Current assets $ 226,043 $ 189,804 Capital assets, net 923,380 840,207 Other non-current assets 65,287 48,237 Total Assets 1,214,710 1,078,248 Liabilities Current liabilities 161,527 140,055 Non-current liabilities 97,724 76,955 Total Liabilities 259,251 217,010 Net Assets Invested in capital assets, net of debt 875,357 798,975 Restricted-nonexpendable Restricted-expendable 8,832 13,429 Unrestricted 71,270 48,834 Total Net Assets $955,459 $861,238
*June 30, 2009 balances have been restated (see footnote 1M) Current assets consist of $185.8 million in cash and investments, $22.8 million in accounts, notes, and interest receivable, $3.3 million in amounts due from the Commonwealth, $11.8 million in prepaid expenses, and $2.3 million in inventories. Current assets increased by $36.2 million primarily due to increases in cash and cash equivalents of $34.5 million. This was comprised of increases in deferred revenue cash, securities lending cash, and locally held cash and cash equivalents of $13.3 million, $3.8 million, and $15.5 million, respectively. The deferred revenue and local cash increases are attributable to tuition and fee rate increases and higher enrollment. Also contributing to the increases in local cash and cash equivalents was $5.2 million fewer transfers to the Commonwealth for capital projects in fiscal year 2010 when compared to fiscal year 2009. Net capital assets increased by $83.2 million from fiscal year 2009 to fiscal year 2010. This increase can primarily be attributed to the capitalization of design and construction costs of numerous capital outlay projects. The project costs capitalized during 2010 include: TCC Regional Health Professional Center for $13.3 million, NVCC Phase VI Building-Annandale for $12.7 million, TCC Norfolk Student Center for $9.8 million, JTCC Midlothian Phase II for $2.5 million, LFCC Workforce Development & Workforce Training for $4.9 million, TCC Portsmouth Campus for $4.2 million, BRCC Information Technology Building for $3.4 million, PVCC Science & Technology Building for $5 million, NVCC Tyler Academic Building for $1.5 million, JSRCC Renovate Burnette Hall for $3 million, JSRCC Workforce Training Center for $2.1 million, GCC Academic Services Building for $1.2 million, TCC Blackwater Building for $2.7 million, DCC Student Center for $1.2 million, PHCC LRC/West Hall renovation for $2 million, TCC LRC Phase I Virginia Beach for $1.7 million, NVCC Phase III Loudoun for $1.9 million, NVCC Phase III Manassas for $1.2 million, VWCC Science & Technology Building for $1.3 million, various other TCC projects for $4.4 million, and various other JSRCC projects for $.9 million. Lastly, capitalized costs associated with the Monticello Visitor Center at PVCC were $2.3 million. Other non-current assets increased by $17.1 million in fiscal year 2010 from fiscal year 2009. The increase was attributed to cash with trustee of $21.9 million held for various capital outlay projects and amounts due from the Commonwealth of $7.3 million resulting from higher Virginia College Building Authority bond fund activity for capital projects at the end of fiscal year 2010. These increases were partially offset by decreases of $6.7 million in restricted cash resulting from

4
unreimbursed Virginia College Building Authority bond fund expenditure activity, $3.2 million in notes receivable becoming current assets and $2.3 million in appropriation available associated with fewer general fund dollars held by colleges at the end of fiscal year 2010. Current liabilities consist of accounts and retainage payable of $29.6 million, accrued payroll and leave compensation of $54.1 million, deferred revenue of $47.8 million, securities lending obligations of $18.1 million, debt obligations of $6.2 million, amounts due to the Commonwealth of $0.154 million, and deposits of $5.7 million. Current liabilities increased $21.5 million in fiscal year 2010 resulting from increases in deferred revenue of $12.5 million primarily associated with higher tuition and increased enrollments. Accrued payroll increased $4 million with $2.7 million due to the recognition of the fiscal year 2010 fourth quarter employer paid “member portion” of the VRS retirement payments that were delayed until fiscal year 2011. Net assets increased by $94.2 million in fiscal year 2010. Invested in capital assets, net of related debt, increased $76.4 million in fiscal year 2010. This was comprised of net capitalized asset increases in buildings of $115.8 million, equipment and intangible assets of $4.4 million, depreciable and non-depreciable land and land improvements of $6.8 million, infrastructure of $.67 million and offset by decreases in construction in progress of $44.7 million and additional capitalized asset debt of $6.8 million. Increases in unrestricted net assets of $22.4 million were primarily associated with increases in educational and general cash from summer revenue collections not deferred of $12.5 million and increases in unrestricted Local Government Investment Pool cash equivalents of $9.3 million. Decreases in restricted expendable net assets of $4.6 million resulted from the capital project activity at various community colleges. Statement of Revenues, Expenses and Changes in Net Assets The purpose of the Statement of Revenues, Expenses and Changes in Net Assets is to present operating and non-operating revenues received by the institution, operating and non-operating expenses incurred and any other revenues, expenses, gains and losses. Changes in net assets as presented on the Statement of Net Assets are based on the activity presented in the Statement of Revenues, Expenses and Changes in Net Assets. A summarized statement of revenues, expenses and changes in net assets follows:
(In thousands of dollars) For the year ended June 30:
2010
2009* Operating revenue $ 433,984 $367,455 Operating expenses 1,029,316 912,516 Operating loss (595,332) (545,061) Non-operating revenues(expenses): State appropriations 359,634 408,947 Local appropriations 2,289 1,834 Grants and gifts 217,891 122,388 Investment income 3,062 4,842 Interest expense (3,332) (2,279) Other (429) (747) Net non-operating revenue 579,115 534,985 Loss before other revenues, expenses, gains or losses (16,217) (10,076) Capital appropriations-state 91,387 72,428 Capital appropriations-local 7,339 13,618 Capital gifts and grants 11,712 8,320

5
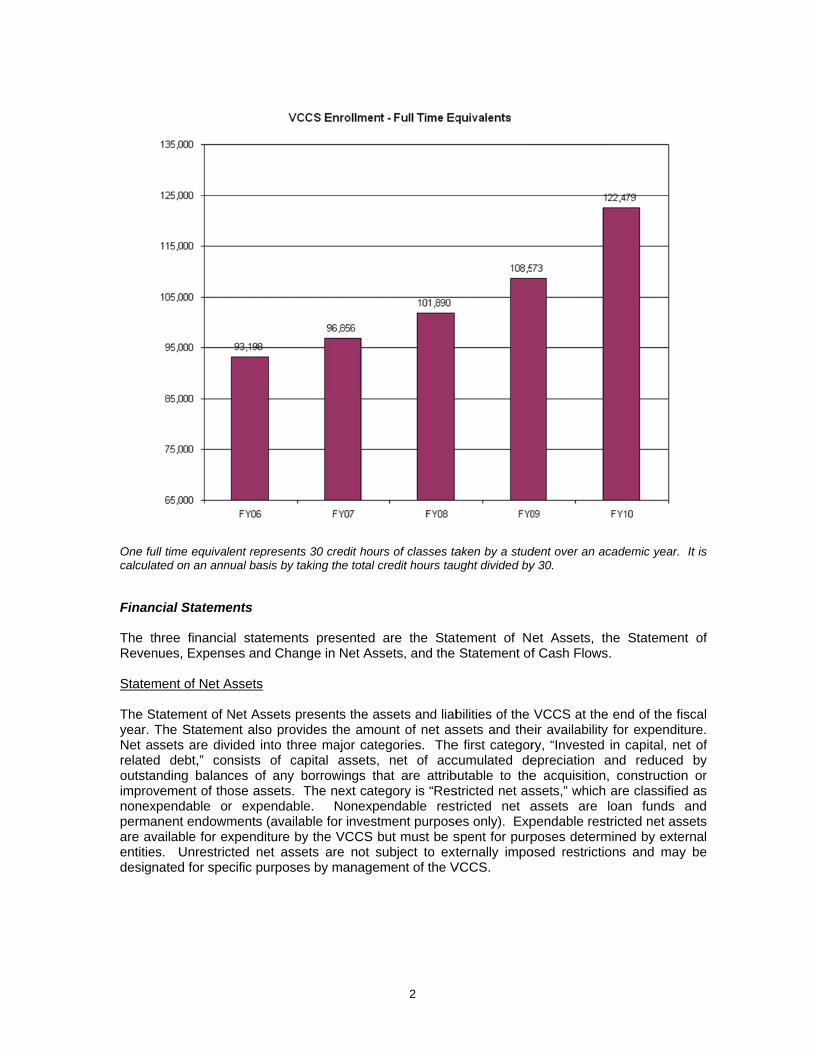
Increase in net assets 94,221 84,290 Net assets, beginning of year 861,238 776,948 Net assets, end of year $955,459 $861,238 *June 30, 2009 balances have been restated (see footnote 1M) Operating Revenues: Total operating revenues increased $66.5 million or 18.1% percent over prior year. Student tuition and fee revenues increased $44.7 million due to the moderate rise in both in-state and out-of-state tuition and fee rates effective for the fall term 2009 and increases in enrollment. In addition, federal grant revenues increased $22.2 million primarily due to the infusion of American Recovery and Reinvestment Act (ARRA) funding. Non-operating and Other Revenues: Total net non-operating revenue increased $44.1 million or 8.2% over the prior year. The increase is primarily due to the increase in grants and gifts of $95.5 million primarily associated with increases in federal Pell grant funding. This was offset by $49.3 million for decreases in state appropriation revenue largely attributable to general fund budget cuts in fiscal year 2010. State capital appropriations totaling $91.4 million increased $19 million or 26.2% over the prior year. This can be attributed to increased bond funding for capital projects. Operating Expenses: Operating expenses totaled approximately $1.029 billion for fiscal 2010 which grew by $116.8 million from the prior year. Revenue increases in Pell grant funding, ARRA funding, and moderate tuition and fee increases directly correspond to the increases in operating expenses.
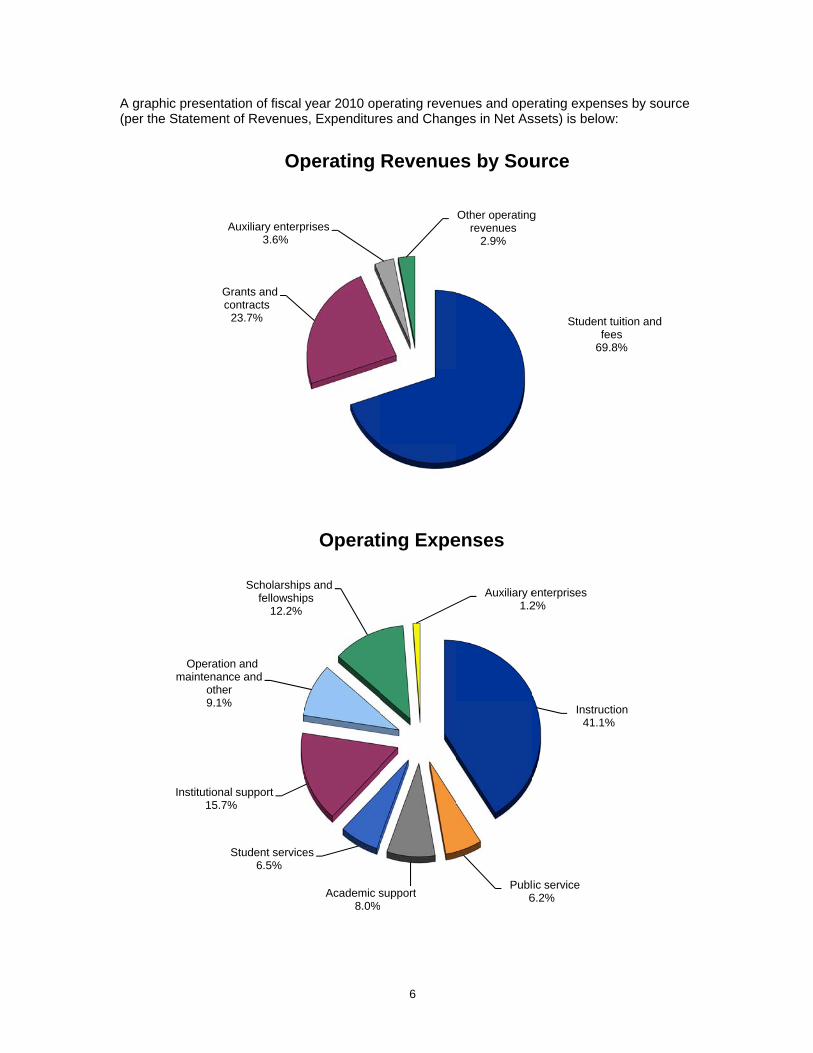
A gra(per th
phic presentahe Statement
Gc
A
Institutiona15.7%
Operatiomaintenan
othe9.1%
ation of fiscal t of Revenues
Grants and contracts
23.7%
Auxiliary enterp3.6%
Op
Student service6.5%
al support%
on and ce and r
%
Scholarshipfellowship
12.2%
year 2010 ops, Expenditure
prises
perating
Academic s8.0%
es
ps and ps
Operat
6
perating revenes and Chang
Revenue
support
ting Expe
nues and opeges in Net As
Other operatingrevenues
2.9%
es by Sou
Publ6
Auxiliary e1.2
enses
erating expensssets) is below
Student fe
69
g
urce
Instruc41.1%
ic service6.2%
enterprises2%
ses by sourcew:
tuition and ees.8%
ction%
e
7
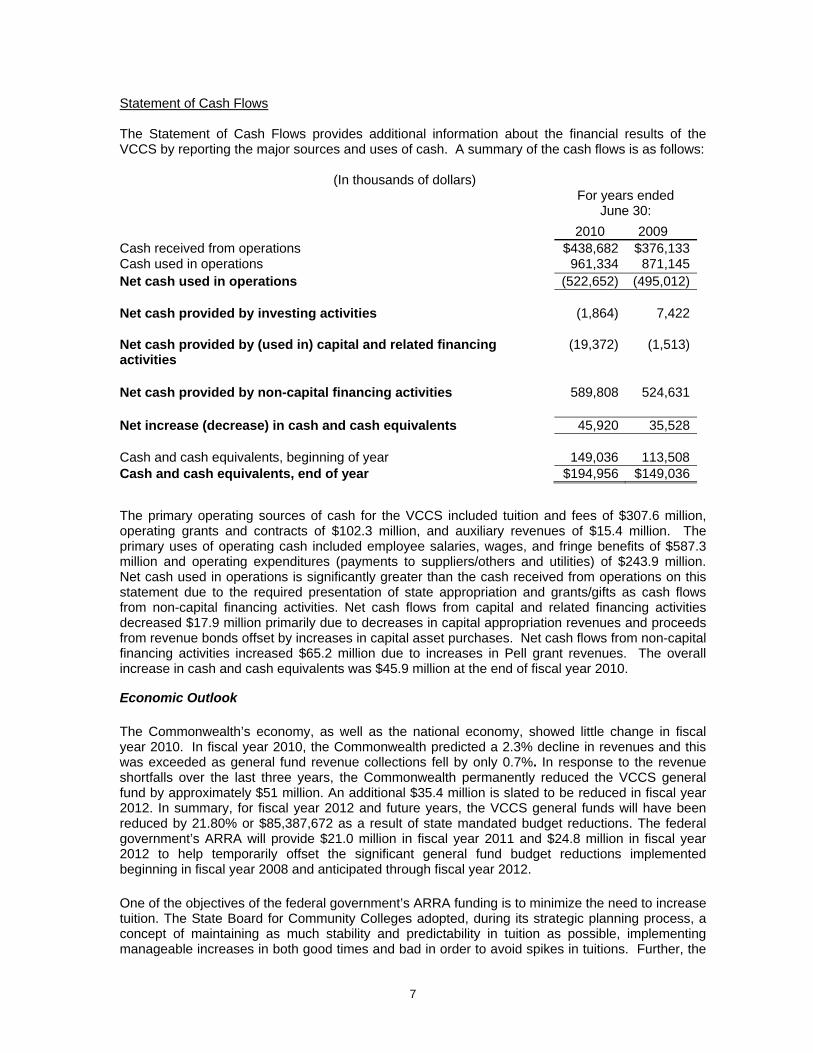
Statement of Cash Flows The Statement of Cash Flows provides additional information about the financial results of the VCCS by reporting the major sources and uses of cash. A summary of the cash flows is as follows:
(In thousands of dollars) For years ended
June 30: 2010 2009 Cash received from operations $438,682 $376,133Cash used in operations 961,334 871,145Net cash used in operations (522,652) (495,012) Net cash provided by investing activities (1,864) 7,422 Net cash provided by (used in) capital and related financing activities
(19,372) (1,513)
Net cash provided by non-capital financing activities 589,808 524,631 Net increase (decrease) in cash and cash equivalents 45,920 35,528 Cash and cash equivalents, beginning of year 149,036 113,508Cash and cash equivalents, end of year $194,956 $149,036 The primary operating sources of cash for the VCCS included tuition and fees of $307.6 million, operating grants and contracts of $102.3 million, and auxiliary revenues of $15.4 million. The primary uses of operating cash included employee salaries, wages, and fringe benefits of $587.3 million and operating expenditures (payments to suppliers/others and utilities) of $243.9 million. Net cash used in operations is significantly greater than the cash received from operations on this statement due to the required presentation of state appropriation and grants/gifts as cash flows from non-capital financing activities. Net cash flows from capital and related financing activities decreased $17.9 million primarily due to decreases in capital appropriation revenues and proceeds from revenue bonds offset by increases in capital asset purchases. Net cash flows from non-capital financing activities increased $65.2 million due to increases in Pell grant revenues. The overall increase in cash and cash equivalents was $45.9 million at the end of fiscal year 2010. Economic Outlook
The Commonwealth’s economy, as well as the national economy, showed little change in fiscal year 2010. In fiscal year 2010, the Commonwealth predicted a 2.3% decline in revenues and this was exceeded as general fund revenue collections fell by only 0.7%. In response to the revenue shortfalls over the last three years, the Commonwealth permanently reduced the VCCS general fund by approximately $51 million. An additional $35.4 million is slated to be reduced in fiscal year 2012. In summary, for fiscal year 2012 and future years, the VCCS general funds will have been reduced by 21.80% or $85,387,672 as a result of state mandated budget reductions. The federal government’s ARRA will provide $21.0 million in fiscal year 2011 and $24.8 million in fiscal year 2012 to help temporarily offset the significant general fund budget reductions implemented beginning in fiscal year 2008 and anticipated through fiscal year 2012.
One of the objectives of the federal government’s ARRA funding is to minimize the need to increase tuition. The State Board for Community Colleges adopted, during its strategic planning process, a concept of maintaining as much stability and predictability in tuition as possible, implementing manageable increases in both good times and bad in order to avoid spikes in tuitions. Further, the

8
Board has noted its intention to keep VCCS tuition and mandatory fees at less than half the rates of public four year institutions in Virginia. The VCCS’s rate in fiscal year 2011 is 37.2% of the average of the four-year institutions for total tuition and mandatory fees. Effective with the fall 2010 session, the State Board for Community Colleges approved a tuition increase of $8.50 per credit hour applicable to all in-state students and an increase of $13 per credit hour applicable to all out-of-state students. The in-state tuition increase will be mitigated by $2 per credit hour in ARRA funds in fiscal year 2011. It is anticipated that these actions will generate approximately $21.7 million in tuition revenues (non-ARRA) in fiscal year 2011. The technology fee was increased by $1 per credit hour, bringing the fee to $6.50 per credit hour for all students. The technology fee increase will generate additional revenue of $3.2 million in fiscal year 2011. Chapter 874, 2010 Virginia Acts of Assembly authorized capital outlay appropriations of $42,142,000 for fiscal year 2011. $37,142,000 of the capital appropriations are for new construction and renovations to existing facilities at the various community college campuses. $5,000,000 of the capital appropriations are for equipment purchases for previously authorized capital projects. The funding breakdown for the capital outlay appropriations are as follows: Higher Education Auxiliary Enterprise Funds ($18,937,000) and Higher Education Trust and Agency Funds ($23,205,000).
FINANCIAL STATEMENTS

Page 10
Component Units
VCCS Foundations
ASSETS
Current Assets Cash and cash equivalents (Note 2) 171,463,537 13,995,663 Appropriation available 7,894 Short term investments (Note 2) 14,345,946 6,300,207 Accounts receivable (Note 3) 18,756,205 640,788 Pledges receivable (Note 3) 2,817,701 Due from commonwealth 3,290,440 Interest receivable 22,293 146,089 Prepaid expenses 11,833,440 27,876 Inventories 2,296,366 150,530 Notes receivable (Note 3) 4,026,658 71,170Total Current Assets 226,042,779 24,150,024
Noncurrent Assets Restricted cash and cash equivalents (Note 2) (5,312,235) Cash with trustees (Note 2) 40,194,919 Endowment cash and cash equivalents (Note 2) 348,034 4,647,004 Appropriation available 1,386,663 Endowment investments (Note 2) 65,666,186 Other long-term investments (Note 2) 258,750 36,507,594 Accounts receivable, net 93,155 Investments in real estate 1,938,009 Pledges receivable (Note 3) 4,023,937 Due from commonwealth 28,056,304 Notes receivable (Note 3) 261,697 25,362 Non-depreciable capital assets, net (Note 4) 162,730,840 3,684,523 Depreciable capital assets, net (Note 4) 760,648,645 6,244,016Total Noncurrent Assets 988,666,772 122,736,631
Total Assets 1,214,709,551 146,886,655
Liabilities
Current Liabilities Accounts and retainage payable (Note 5) 29,569,828 1,018,649 Accrued payroll expense 39,408,029 1,147 Deferred revenue 47,752,907 389,408 Long-term liabilities-current portion (Note 7) 20,872,954 61,147 Securities lending obligation 18,064,036 Due to Commonwealth 153,450 Deposits 5,705,426Total Current Liabilities 161,526,630 1,470,351
Noncurrent Liabilities Account payable for noncurrent assets (Note 7) 53,041 Long-term liabilities (Note 7) 92,715,862 714,199 Due to federal government (Note 7) 4,954,912Total Noncurrent Liabilities 97,723,815 714,199
Total Liabilities 259,250,445 2,184,550
Net Assets
Invested in capital assets, net of related debt 875,357,437 9,928,539 Restricted for: Nonexpendable 60,348,730 Expendable 8,831,687 46,607,868 Unrestricted 71,269,982 27,816,968Total Net Assets 955,459,106 144,702,105
The accompanying Notes to the Financial Statements are an integral part of this statement.
Virginia Community College SystemConsolidated
Statement of Net AssetsAs of June 30, 2010

Page 11
Component Units
Revenues VCCS
FoundationsOperating Revenue Tuition and fees (net of scholarship allowance of $119,005,900) 302,820,898 Federal grants and contracts 90,264,724 445,000 State and local grants 3,954,931 520,000 Nongovernmental grants 8,470,233 2,503,773 Sales/services of education department 477,004 Auxiliary enterprises (net of scholarship allowance of $5,064,750) 15,632,391 Gifts and contributions 7,253,938 Endowment income 7,666,620 Other operating revenues 12,363,532 2,131,026Total Operating Revenue 433,983,713 20,520,357
ExpensesOperating Expenses Instruction 423,649,984 751,124 Public service 63,506,498 1,201,020 Academic support 82,586,361 4,206,256 Student services 66,766,374 13,098 Institutional support 161,363,264 7,782,966 Operation and maintenance 94,126,587 1,237,444 Scholarships and fellowships 125,182,325 3,688,259 Auxiliary enterprises 12,050,950 Fundraising 1,111,571 Other expenses 84,103 184,858Total Operating Expenses 1,029,316,446 20,176,596
Operating Income (Loss) (595,332,733) 343,761
Nonoperating Revenues(Expenses) State appropriations (Note 12) 359,633,898 Local appropriations 2,288,807 Grants and gifts 217,891,138 Investment income 3,062,623 5,969,161 Interest on capital asset related debt (3,332,063) (19,999) Other nonoperating revenue (expense) (428,987)Net Nonoperating Revenue 579,115,416 5,949,162
Income before other revenues, expenses gains (losses) (16,217,317) 6,292,923
Capital appropriations-state (Note 19) 91,387,268 Capital appropriations-local 7,338,490 Capital gifts, grants and contracts 11,712,281 662,216 Additions to permanent and term endowments 5,539,468Increase (Decrease) in Net Assets 94,220,722 12,494,607
Net AssetsNet Assets beginning of year as restated (Note 1M) 861,238,384 132,207,498Net Assets end of year 955,459,106 144,702,105
The accompanying Notes to the Financial Statements are an integral part of this statement.
Virginia Community College SystemConsolidated
Statement of Revenues, Expenses and Changes in Net AssetsFor the Year Ended June 30, 2010
Page 12
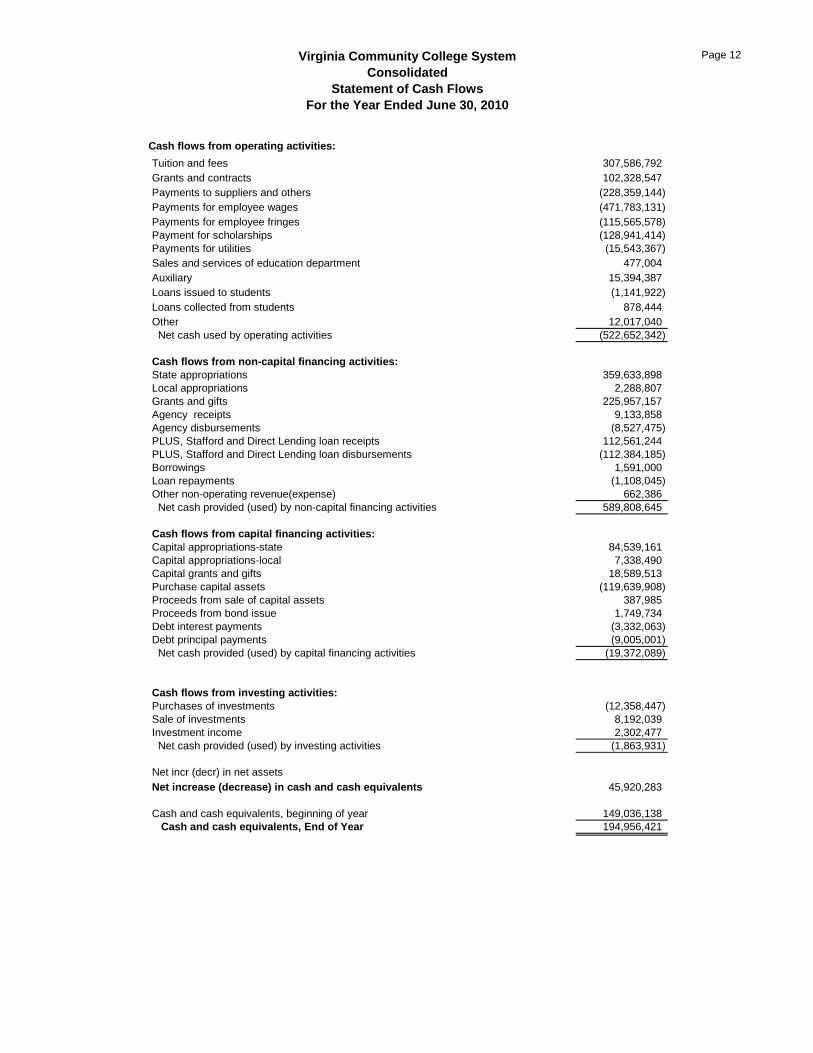
Cash flows from operating activities:
Tuition and fees 307,586,792 Grants and contracts 102,328,547 Payments to suppliers and others (228,359,144) Payments for employee wages (471,783,131) Payments for employee fringes (115,565,578) Payment for scholarships (128,941,414) Payments for utilities (15,543,367) Sales and services of education department 477,004 Auxiliary 15,394,387 Loans issued to students (1,141,922) Loans collected from students 878,444 Other 12,017,040 Net cash used by operating activities (522,652,342)
Cash flows from non-capital financing activities:State appropriations 359,633,898 Local appropriations 2,288,807 Grants and gifts 225,957,157 Agency receipts 9,133,858 Agency disbursements (8,527,475) PLUS, Stafford and Direct Lending loan receipts 112,561,244 PLUS, Stafford and Direct Lending loan disbursements (112,384,185) Borrowings 1,591,000 Loan repayments (1,108,045) Other non-operating revenue(expense) 662,386 Net cash provided (used) by non-capital financing activities 589,808,645
Cash flows from capital financing activities:Capital appropriations-state 84,539,161 Capital appropriations-local 7,338,490 Capital grants and gifts 18,589,513 Purchase capital assets (119,639,908) Proceeds from sale of capital assets 387,985 Proceeds from bond issue 1,749,734 Debt interest payments (3,332,063) Debt principal payments (9,005,001) Net cash provided (used) by capital financing activities (19,372,089)
Cash flows from investing activities:Purchases of investments (12,358,447) Sale of investments 8,192,039 Investment income 2,302,477 Net cash provided (used) by investing activities (1,863,931)
Net incr (decr) in net assetsNet increase (decrease) in cash and cash equivalents 45,920,283
Cash and cash equivalents, beginning of year 149,036,138 Cash and cash equivalents, End of Year 194,956,421
Virginia Community College SystemConsolidated
Statement of Cash FlowsFor the Year Ended June 30, 2010
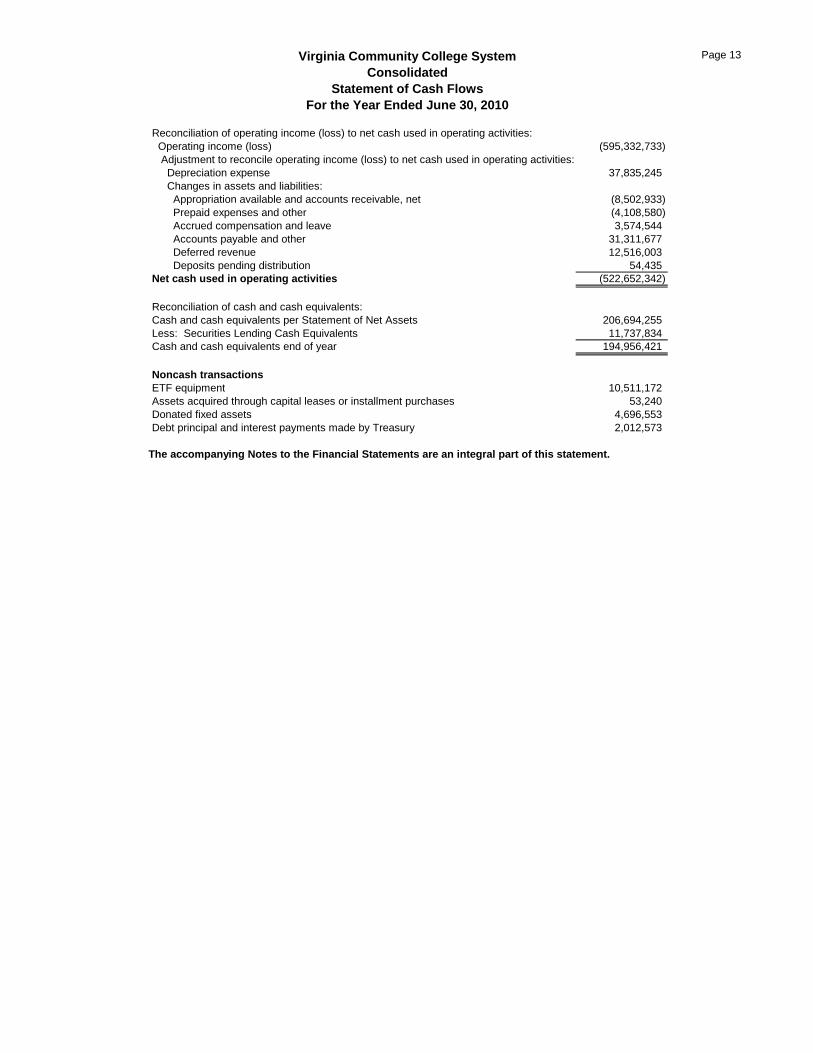
Page 13Virginia Community College SystemConsolidated
Statement of Cash FlowsFor the Year Ended June 30, 2010
Reconciliation of operating income (loss) to net cash used in operating activities: Operating income (loss) (595,332,733) Adjustment to reconcile operating income (loss) to net cash used in operating activities: Depreciation expense 37,835,245 Changes in assets and liabilities: Appropriation available and accounts receivable, net (8,502,933) Prepaid expenses and other (4,108,580) Accrued compensation and leave 3,574,544 Accounts payable and other 31,311,677 Deferred revenue 12,516,003 Deposits pending distribution 54,435 Net cash used in operating activities (522,652,342)
Reconciliation of cash and cash equivalents:Cash and cash equivalents per Statement of Net Assets 206,694,255 Less: Securities Lending Cash Equivalents 11,737,834 Cash and cash equivalents end of year 194,956,421
Noncash transactionsETF equipment 10,511,172 Assets acquired through capital leases or installment purchases 53,240 Donated fixed assets 4,696,553 Debt principal and interest payments made by Treasury 2,012,573
The accompanying Notes to the Financial Statements are an integral part of this statement.

NOTES TO THE FINANCIAL
STATEMENTS

15
VIRGINIA COMMUNITY COLLEGE SYSTEM
NOTES TO FINANCIAL STATEMENTS
As of June 30, 2010 1. SUMMARY OF SIGNIFICANT ACCOUNTING POLICIES A. Reporting Entity The Virginia Community College System (VCCS) was established as an
institution of higher education in 1965. The System includes the State Board for Community Colleges, a System Office located in Richmond, and twenty-three community colleges located on forty campuses throughout the Commonwealth. The State Board for Community Colleges is the governing body and is charged with the responsibility to establish, control, and administer a statewide system of publicly supported comprehensive community colleges. The System therefore functions as a statewide institution of higher learning.
The accompanying financial statements include all of the individual community colleges and the System Office under the control of the State Board for Community Colleges.
The System is a discrete component unit of the Commonwealth of Virginia and is included in the general-purpose financial statements of the Commonwealth. A separate report is prepared for the Commonwealth of Virginia that includes all agencies, boards, commissions, and authorities over which the Commonwealth exercises or has the ability to exercise oversight authority.
B. Community College Foundations
The community college foundations are legally separate, tax-exempt organizations formed to promote the achievements and further the aims and purposes of the colleges. The foundations accomplish their purposes through fundraising and funds management efforts that benefit the colleges and their programs. Although the colleges do not control the timing or amount of receipts from the foundations, the majority of resources or income thereon that the foundations hold and invest is restricted to the activities of the colleges by the donors. Because these restricted resources held by the foundations can only be used by, or for the benefit of the colleges, the foundations are considered component units under GASB Statement 39, Determining Whether Certain Organizations are Component Units. Accordingly, the community college foundations are presented as discrete component units in the financial statements. During the year ended June 30, 2010, the foundations distributed $8,320,601 to the colleges for both restricted and unrestricted purposes. Complete financial statements for the foundations can be obtained by writing the VCCS Office of Fiscal Services, 101 N. 14th St., Richmond, VA 23219.
C. Basis of Accounting
For financial reporting purposes, the VCCS is considered a special purpose
government engaged in only business-type activities. Business-type activities are those that are financed in whole or in part by fees charged to external parties for goods and services. Accordingly, the financial statements have been
16
presented using the economic resources measurement focus and the accrual basis of accounting. Revenues are recorded when earned and expenses are recorded when a liability is incurred, regardless of the timing of related cash flows. All material internal transactions have been eliminated.
Revenues and expenses of the summer academic term occur within two fiscal
years, because the term extends from May through August and the fiscal year ends on June 30. Expenses and an equal amount of revenue have been reported in the current period for the portion of the summer academic term from May 16 through June 30, 2010.
The VCCS has the option to apply all Financial Accounting Standards Board (FASB) pronouncements issued after November 30, 1989, unless FASB conflicts with GASB. The VCCS has elected not to apply FASB pronouncements issued after the applicable date. The community college foundations are private, nonprofit organizations that report under FASB standards, including FASB Statement 117, Financial Reporting for Not-for-Profit Organizations. As such, certain revenue recognition criteria and presentation features are different from GASB. No modifications have been made to the financial information of the foundations in the financial statements of the VCCS regarding these criteria and presentation features. The financial statements for the community college foundations are for the year ending June 30, 2010 except for Dabney S. Lancaster, Eastern Shore, Germanna, John Tyler, Lord Fairfax, Mountain Empire, New River, Piedmont, Tidewater (Educational and Real Estate Foundations), Virginia Western, and Wytheville (Educational and Scholarship Foundations) that are as of December 31, 2009.
D. Prepaid Assets Prepaid assets for rent, insurance, and similar items are recognized when
purchased and expensed when used. E. Inventories Inventories are stated at cost (primarily first-in, first-out method) and consist
mainly of goods purchased for resale and expendable supplies. F. Investments Investments meeting the valuation standards outlined in GASB Statement 31,
Accounting and Financial Reporting for Certain Investments and for External Investment Pools, have been shown at fair market value. The remaining investments have been recorded at cost.
G. Capital Assets
Plant assets consisting of land, buildings, infrastructure, equipment, library
books, intangible assets, and construction in progress are stated at appraised historical cost or actual cost where determinable. Improvements to buildings, infrastructure and land that significantly increase the usefulness, efficiency or life of the asset are capitalized. Routine maintenance and repairs are charged to operations when incurred. Interest expense relating to construction is capitalized. Donated assets are recorded at the estimated fair value at the date of donation. The fixed asset values presented in these financial statements are

17
extracted from the financial data maintained by the System’s Administrative Information System (AIS). Current fund expenditures for equipment are capitalized when the unit acquisition cost is $5,000 or greater and the estimated useful life is one year or more. Occupancy permits are used to determine when to reclassify buildings from construction-in-progress. Depreciation is calculated using the straight-line method over the estimated useful lives of the assets, generally 50 years for buildings, 20 to 25 years for infrastructure and land improvements, 3 to 25 years for equipment, 10 years for library books, and 5 to 10 years for intangible assets - computer software.
H. Accrued Compensated Absences
The amount of leave earned but not taken by all classified employees, administrative/professional faculty, teaching faculty, and presidents is recorded as a liability on the balance sheet. The amount reflects, as of June 30, all unused annual leave, compensatory leave, and the amount payable upon termination under the Commonwealth of Virginia's sick leave pay out policy. An additional liability amount has been included for those employees with less than five years of service based on the probability they will eventually become vested. Also included in the liability is the System’s share of the FICA taxes on leave balances for which employees will be compensated.
I. System Office Expenditures
With the exception of the workforce investment grant expenditure activity in the System Office of the VCCS classified as public service, the remaining expenditure activity in the System Office provides a variety of functions ranging from management control to centralized support services. Because most of these activities are management in nature and cover the operation of the entire System, they have been classified as institutional support.
J. Classification of Revenues and Expenses
The VCCS has classified its revenues as either operating or nonoperating revenues according to the following criteria: Operating revenues include activities that have the characteristics of exchange transactions, such as tuition and fees, sales and services of auxiliary enterprises, most federal, state and local grants and contracts, and interest on student loans. Nonoperating revenues include activities that have the characteristics of non-exchange transactions, such as gifts and contributions, state appropriations and investment income. Nonoperating expenses include interest on debt related to the purchase of capital assets and losses on disposal of capital equipment. All other expenses are classified as operating expenses.
K. Scholarship Discounts and Allowances
Student tuition and fees revenues, and certain other revenues from students, are reported net of scholarship discounts and allowances in the Statement of Revenue, Expenses, and Changes in Net Assets. Scholarship discounts and allowances are the difference between the stated charge for goods and services provided by the VCCS, and the amount that is paid by students and/or third parties making payments on the student’s behalf. Certain governmental grants and other federal, state or nongovernmental programs are recorded as either

18
operating or nonoperating revenues in the financial statements. To the extent that such revenues are used to satisfy tuition and fees and other student charges, the VCCS has recorded a scholarship discount and allowance.
L. Net Assets
Net assets are classified as follows: Invested in capital, net of related debt: Consists of capital assets, net of accumulated depreciation reduced by outstanding debt attributable to the acquisition, construction or improvement of those assets. Restricted net assets-nonexpendable: Restricted nonexpendable net assets are endowment funds in which donors have stipulated, as a condition of the gifts that the principal is to remain inviolate in perpetuity. Restricted net assets-expendable: Restricted expendable net assets include resources in which the VCCS is legally or contractually obligated to spend in accordance with restrictions imposed by external third parties. Unrestricted net assets: Unrestricted net assets represent resources that may be used at the discretion of the governing board for any lawful purpose. When an expense is incurred that can be paid from either restricted or unrestricted resources, it is the policy of the VCCS to first apply the expense towards restricted resources and then towards unrestricted resources.
M. Restatements
Statement of Changes in Revenues, Expenditures, and Net Assets: Net assets as of June 30, 2009 - previously reported $864,757,255 Correction of liability understatement ($3,518,871) Net assets as of July 1, 2009 - as restated $861,238,384
2. CASH AND INVESTMENTS
Cash and Cash Equivalents
Cash equivalents maintained by the VCCS are investments with original maturities of less than three months. Pursuant to Section 2.2-1800, et seq., Code of Virginia, all state funds of the VCCS are maintained by the Treasurer of Virginia who is responsible for the collection, disbursement, custody, and investment of state funds.
Deposits Local cash deposits with banks and savings institutions not with the Treasurer of Virginia are covered by federal depository insurance or collateralized in accordance with the Virginia Security of Public Deposits Act, Section 2.2-4400 et seq., Code of Virginia. Deposits covered by the Virginia Security of Public Deposits Act totaled $30,165,585 at June 30, 2010.

19
Investments Certain deposits and investments are held by the VCCS. Such investments are reported separately from cash and cash equivalents. Investments represent securities with original maturities of more than three months and for which management intends to hold the securities to maturity. Investments of the member colleges of the VCCS are limited to those allowed under Chapter 45, Investments of Public Funds Act, Sections 2.2-4500 and 2.2-4501 of the Code of Virginia. Commonwealth of Virginia law limits investments in stocks, bonds, notes, and other evidences of indebtedness of the Commonwealth and those unconditionally guaranteed as to the payment of principal and interest by the Commonwealth. Investments in United States agencies all carry the explicit guarantee of the United States government. Additionally, Virginia’s community colleges may participate in the Local Government Investment Pool as authorized by Chapter 46 of the Code of Virginia and managed by the Commonwealth of Virginia Treasury Board. Authorized investments in the Local Government Investment Pool are limited to those set forth for local officials in Chapter 45, Sections 2.2-4500 of the Code of Virginia. GASB Statement No. 40, Deposit and Investment Risk Disclosures – an amendment of GASB Statement No. 3, issued March 2003, became effective for the fiscal year ending June 30, 2005, and imposed new standards for financial reporting. The VCCS implemented the necessary changes to be in compliance with this Statement. The deposits and investments of state and local governments are exposed to risks that have the potential to result in losses. This Statement addresses common deposit and investment risks related to credit risk, concentration of credit risk, interest rate risk, foreign currency risk, and any other risks. As an element of interest rate risk, this Statement requires certain disclosures of investments that have fair values that are highly sensitive to changes in interest rates. As an element of credit risk, this Statement requires disclosure of credit quality ratings for investments in debt securities as well as investments in external investment pools, money market mutual funds, bond mutual funds, and other pooled investment of fixed-income securities. As an element of foreign currency risk, this Statement requires certain disclosures of investments that have fair values that could be adversely affected by changes in exchange rates. Deposit and investment policies related to the risks identified in the Statement are also required to be disclosed. Custodial Credit Risk The custodial credit risk for deposits is the risk that, in the event of the failure of a depository financial institution, a government will not be able to recover deposits or will not be able to recover collateral securities that are in the possession of an outside party. The custodial credit risk for investments is the risk that, in the event of failure of the counterparty to a transaction, a government will not be able to recover the value of investment or collateral securities that are in the possession of an outside party. VCCS has no investments exposed to custodial credit risk for 2010. Interest Rate Risk Disclosure of the maturities of investments is required when the fair market value is adversely affected by changes in interest rates. Investments subject to interest rate risk are outlined in the accompanying chart. Credit Risk Disclosure of the credit quality rating is required for investments exposed to the risk that an issuer or other counterparty will not fulfill its obligations. Investments subject to credit rate risk are outlined in the accompanying chart.

20
Concentration of Credit Risk Disclosure of any one issuer is required when it represents 5 percent or more of total investments. VCCS does not have such concentration of credit risk for 2010. Foreign Currency Risk Disclosure is required for investments exposed to changes in exchange rates that will adversely affect the fair value of an investment or a deposit. VCCS has no investments or deposits subject to Foreign Currency Risk for 2010. Cash Equivalents Fair Value Credit Rating
Local Govt. Investment Pool $53,409,935 AAA Certificates of Deposit 9,453,560 Not Rated Repurchase Agreements 3,831,656 Not Rated Mutual and Money Market Funds 2,057,754 Not Rated Securities Lending (1) 11,737,834 Total $80,490,739 Investment Maturities (In Years)
Investment Type Fair Value Less 1 yr 1-5 yrs
U.S. Govt. Treasury Bills $ 6,093,787 $6,093,787 Mutual Funds 709,800 709,800 Agency Mortgage Backed Securities 1,474,907 1,216,157 258,750Securities Lending (1) 6,326,202 6,326,202 Total $14,604,696 $14,345,946 $258,750
(1) GASB Statement Number 28, Accounting and Financial Reporting for Securities Lending
Transactions, establishes standards of accounting and financial reporting for transactions where governmental entities transfer securities to broker-dealers and other entities for collateral, and simultaneously agree to return the collateral for the same securities in the future. The amounts identified above represent the VCCS’ allocated share of securities received for securities lending transactions held in the general account of the Commonwealth of Virginia. The Commonwealth’s policy is to record unrealized gains and losses in the General Fund in the Commonwealth’s basic financial statements. When gains or losses are realized, the actual gains and losses are recorded by the affected agencies. Information related to the credit risk of these investments and securities lending transactions held in the general account is available in the Commonwealth of Virginia’s Comprehensive Annual Financial Report.
Community College Foundations
The Foundations had the following cash, cash equivalents and investments as of June 30, 2010: Cash and cash equivalents $ 18,642,667 Investments:
Mutual funds and money markets $ 49,945,082 Stocks 28,708,953 Corporate bonds 12,984,206 U.S. government securities 4,573,849 UVA investment fund 3,893,656
21
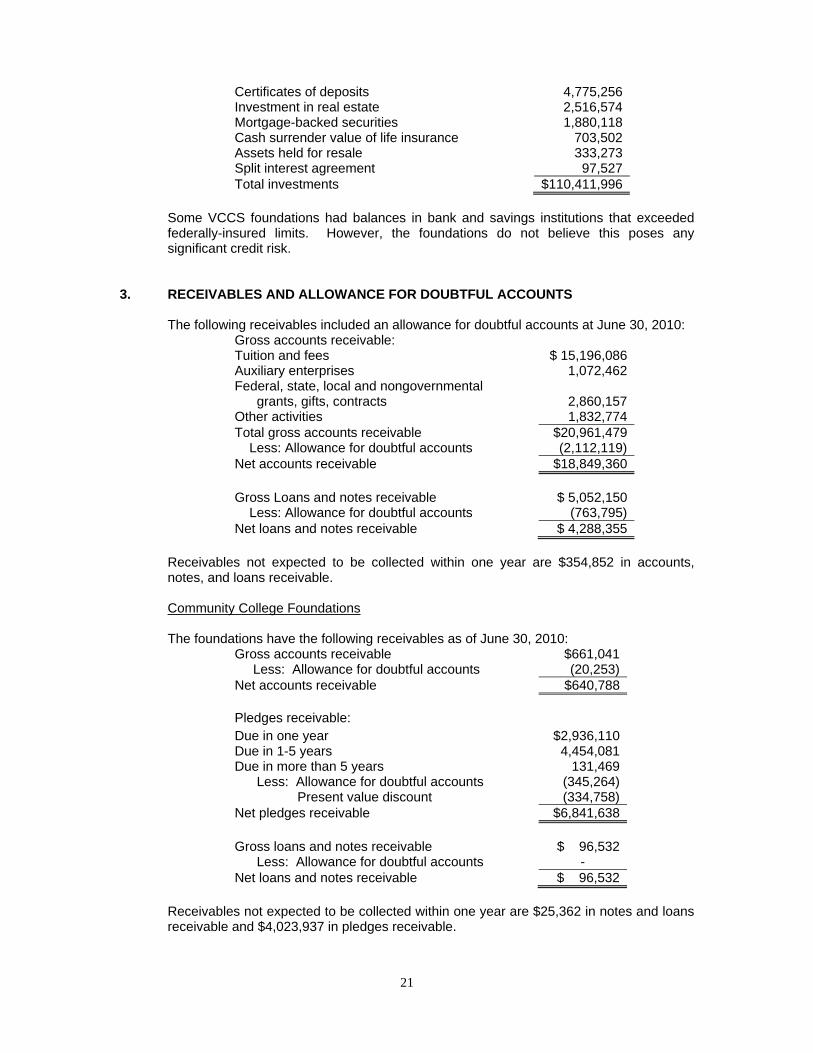
Certificates of deposits 4,775,256 Investment in real estate 2,516,574 Mortgage-backed securities 1,880,118 Cash surrender value of life insurance 703,502 Assets held for resale 333,273 Split interest agreement 97,527 Total investments $110,411,996
Some VCCS foundations had balances in bank and savings institutions that exceeded federally-insured limits. However, the foundations do not believe this poses any significant credit risk.
3. RECEIVABLES AND ALLOWANCE FOR DOUBTFUL ACCOUNTS The following receivables included an allowance for doubtful accounts at June 30, 2010:
Gross accounts receivable: Tuition and fees $ 15,196,086 Auxiliary enterprises 1,072,462 Federal, state, local and nongovernmental grants, gifts, contracts 2,860,157 Other activities 1,832,774 Total gross accounts receivable $20,961,479 Less: Allowance for doubtful accounts (2,112,119) Net accounts receivable $18,849,360 Gross Loans and notes receivable $ 5,052,150 Less: Allowance for doubtful accounts (763,795) Net loans and notes receivable $ 4,288,355
Receivables not expected to be collected within one year are $354,852 in accounts,
notes, and loans receivable.
Community College Foundations The foundations have the following receivables as of June 30, 2010:
Gross accounts receivable $661,041 Less: Allowance for doubtful accounts (20,253) Net accounts receivable $640,788 Pledges receivable: Due in one year $2,936,110 Due in 1-5 years 4,454,081 Due in more than 5 years 131,469 Less: Allowance for doubtful accounts (345,264) Present value discount (334,758) Net pledges receivable $6,841,638 Gross loans and notes receivable
$ 96,532
Less: Allowance for doubtful accounts - Net loans and notes receivable $ 96,532
Receivables not expected to be collected within one year are $25,362 in notes and loans
receivable and $4,023,937 in pledges receivable.

22
4. CAPITAL ASSETS Changes in capital assets for the year ended June 30, 2010 are as follows:
Community College Foundations The foundations had the following capital assets as of June 30, 2010:
Non-depreciable capital assets: Land $ 1,559,596 Works of art 124,927 Construction in Process 2,000,000 Total nondepreciable capital assets $ 3,684,523 Depreciable capital assets: Buildings $6,816,388 Equipment 688,036 Site improvement 57,029 Total depreciable capital assets $7,561,453 Less: Accumulated depreciation (1,317,437)
Beginning Balance Increases Decreases
Ending Balance
Nondepreciable capital assets: Land $34,145,481 2,930,394 (200,100) $36,875,775 Land improvements 15,012,044 1,292,221 16,304,265 Inexhaustible works of art 137,174 11,000 148,174 Construction in progress 154,092,057 94,975,302 (139,664,733) 109,402,626Total capital assets not being depreciated 203,386,756 99,208,917 (139,864,833) 162,730,840Depreciable capital assets: Buildings 701,740,466 134,329,924 836,070,390 Infrastructure 33,014,602 2,280,194 35,294,796 Equipment 161,874,931 19,186,437 (45,222,402) 135,838,966 Land improvements 57,125,889 4,864,566 61,990,455 Library books 42,122,243 2,282,078 (2,515,041) 41,889,280 Intangible 0 34,951,615 34,951,615Total other capital assets 995,878,131 197,894,814 (47,737,443) 1,146,035,502Less accumulated depreciation for:
Buildings (171,732,228) (18,500,341) (190,232,569) Infrastructure (14,206,051) (1,609,590) (15,815,641) Equipment (106,572,558) (13,522,847) 38,052,856 (82,042,549) Land improvements (33,531,972) (2,114,666) (35,646,638) Library books (33,015,369) (2,087,813) 2,515,041 (32,588,141) Intangible 0 (29,061,319) (29,061,319)Total accumulated depreciation (359,058,178) (66,896,576) 40,567,897 (385,386,857)
Other capital assets, net 636,819,953 130,998,238 (7,169,546) 760,648,645
Total capital assets, net $840,206,709 230,207,155 (147,034,379) $923,379,485

23
Depreciable capital assets, net $ 6,244,016 Total capital assets, net $9,928,539
5. ACCOUNTS AND RETAINAGE PAYABLE Accounts and retainage payable consisted of the following as of June 30, 2010:
Vendor payables $23,920,251Retainage payable 5,644,117Taxes payable 5,460Total $29,569,828
6. COMMITMENTS
At June 30, 2010, the VCCS had future commitments for construction contracts totaling approximately $104,226,780. The System held $5,644,117 as retainage payable on construction and architectural/engineering contracts for work performed. The retainage payable will be remitted to the various contractors upon satisfactory completion of the construction projects.
7. LONG-TERM LIABILITIES Long-term liability activity for the year ended June 30, 2010 is as follows:
Beginning Balance Additions Reductions
Ending Balance
Amounts Due Within One
Year Debt: Bonds payable $ 677,030 $ 4,800 $ 223,233 $ 458,597 $ 216,475Other capital leases 17,752,746 2,519,786 15,232,960 1,552,526Notes payable: Installment purchases 11,181,602 652,728 4,782,244 7,052,086 414,998
Pooled bonds 30,940,996 30,163,523 1,617,621 59,486,898 2,410,000Other notes payable 1,108,045 1,591,000 1,108,045 1,591,000 1,591,000Total bonds, notes and capital leases 61,660,419 32,412,051 10,250,929 83,821,541 6,184,999her liabilities: Compensated absences 30,220,535 20,642,079 21,095,339 29,767,275 14,687,955Federal loan program contributions
4,861,943 243,948 150,979 4,954,912
Total other liabilities 35,082,478 20,886,027 21,246,318 34,722,187 14,687,955
Total long-term liabilities $96,742,897 $53,298,078 $31,497,247 $118,543,728
$20,872,954

24
8. BONDS PAYABLE
Long-term debt in the form of bonds payable of the System as of June 30, 2010, consists of the following: Higher Education Refunding Bonds, Series 1999, issued $1,868,800 to advance
refund a portion of the Higher Education Bonds, Series 1992A. The balance is payable in annual installments ranging from approximately $185,000 to $240,000 with an average coupon rate of 4.18% payable semiannually. The final installment of $231,855 is due June 1, 2012. The outstanding balance at June 30, 2010 is $458,597.
Aggregate annual maturities of bonds payable for fiscal years after 2010:
Year Ending
June 30
Principal
Interest
Total
2011 216,475 25,166 241,641 2012 231,855 11,459 243,314
Plus: Bond Premium
19,667
19,667 Less: Bond Defeasance (9,400) (9,400) Total debt service Requirements
$458,597
$36,625
$495,222
9. NOTES PAYABLE Notes payable represents an agreement with the Virginia College Building Authority
(VCBA) to finance the following projects:
Parking and access road improvements for John Tyler Community College - The balance is to be repaid in ten annual installments ranging from $70,000 to $130,000 with an average coupon rate of 4.03% payable semiannually. The final installment of $130,000 is due September 1, 2013. The outstanding balance at June 30, 2010 is $475,000. Parking garage for the Medical Education campus of Northern Virginia Community College - The balance is to be repaid in twenty annual installments ranging from $265,000 to $555,000 with an average coupon rate of 4.27% payable semiannually. The final installment of $555,000 is due September 1, 2021. The outstanding balance at June 30, 2010 is $5,256,038.
Parking deck for the Annandale Campus of Northern Virginia Community College - The balance is to be repaid in twenty annual installments ranging from $310,000 to $400,000 with an average coupon rate of 4.35% payable semiannually. The final installment of $400,000 is due September 1, 2023. The outstanding balance at June 30, 2010 is $5,600,000.
Parking garage for J. Sargeant Reynolds Community College - The balance is to be repaid in twenty annual installments ranging from $110,000 to $330,000 with an average coupon rate of 4.95% payable semiannually. The final installment of $330,000 is due September 1, 2022. The outstanding balance at June 30, 2010 is $3,214,861.

25
Student Center for Tidewater Community College - The balance is to be repaid in twenty annual installments ranging from $480,000 to $1,100,000 with an average coupon rate of 4.17% payable semiannually. The final installment of $1,100,000 is due September 1, 2029. The outstanding balance at June 30, 2010 is $14,871,547. Workforce Training and Technology Center for J. Sargeant Reynolds Community College - The balance is to be repaid in nineteen annual installments ranging from $30,000 to $75,000 with an average coupon rate of 4.914% payable semiannually. The final installment of $75,000 is due September 1, 2029. The outstanding balance at June 30, 2010 is new debt of $920,000 and the unamortized bond premium of $86,763 for a total of $1,006,763. Student Center for Tidewater Community College Virginia Beach Campus. The balance is to be repaid in twenty annual installments ranging from $420,000 to $1,035,000 with an average coupon rate of 4.907% payable semiannually. The final installment of $1,035,000 is due September 1, 2029. The outstanding balance at June 30, 2010 is new debt of $13,540,000 and the unamortized bond premium of $1,243,283 for a total of $14,783,283. Student Center for Tidewater Community College Chesapeake Campus. The balance is to be repaid in twenty annual installments ranging from $295,000 to $725,000 with an average coupon rate of 4.907% payable semiannually. The final installment of $725,000 is due September 1, 2029. The outstanding balance at June 30, 2010 is new debt of $9,490,000 and the unamortized bond premium of $871,469 for a total of $10,361,469. Academic Building for Tidewater Community College Chesapeake Campus. The balance is to be repaid in fifteen annual installments ranging from $165,000 to $325,000 with an average coupon rate of 4.969% payable semiannually. The final installment of $325,000 is due September 1, 2024. The outstanding balance at June 30, 2010 is new debt of $3,535,000 and the unamortized bond premium of $382,937 for a total of $3,917,937.
The Virginia Community College System’s general revenues, not otherwise obligated, secures these notes. Other notes payable of $1,591,000 represents advances received from the Commonwealth of Virginia in anticipation of federal grant funding.
Scheduled maturities of notes payable are as follows:
Year Ending June 30 Principal Interest Total
Payments 2011 2,410,000 2,598,746 5,008,7462012 2,515,000 2,505,046 5,020,0462013 2,605,000 2,390,196 4,995,1962014 2,720,000 2,264,167 4,984,1672015 2,695,000 2,140,413 4,835,413
2016-2020 15,110,000 8,714,957 23,824,9572021-2025 15,725,000 4,875,831 20,600,8312026-2030 12,450,000 1,472,900 13,922,900Sub Totals $56,230,000 $26,962,256 $83,192,256
Plus: Bond Premium
3,357,998
3,357,998Less: Bond Defeasance (101,100) (101,100)
26
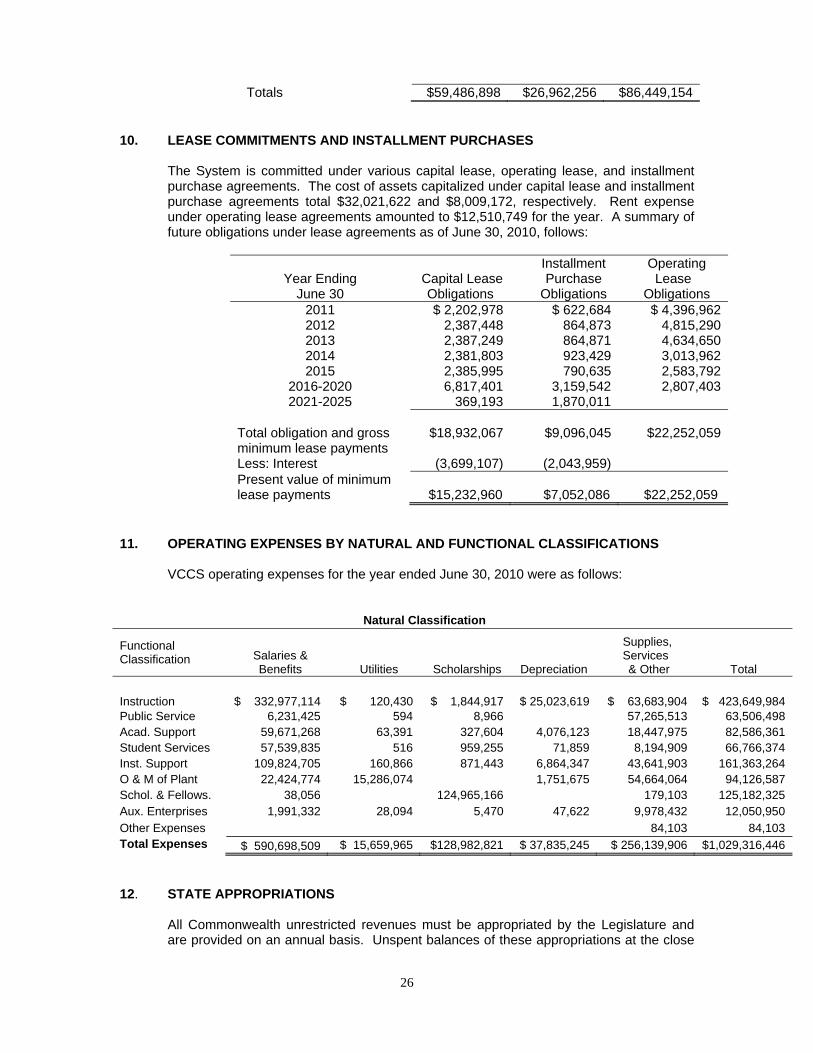
Totals $59,486,898 $26,962,256 $86,449,154 10. LEASE COMMITMENTS AND INSTALLMENT PURCHASES
The System is committed under various capital lease, operating lease, and installment purchase agreements. The cost of assets capitalized under capital lease and installment purchase agreements total $32,021,622 and $8,009,172, respectively. Rent expense under operating lease agreements amounted to $12,510,749 for the year. A summary of future obligations under lease agreements as of June 30, 2010, follows:
Year Ending
June 30
Capital Lease
Obligations
Installment Purchase
Obligations
Operating Lease
Obligations 2011 $ 2,202,978 $ 622,684 $ 4,396,9622012 2,387,448 864,873 4,815,2902013 2,387,249 864,871 4,634,6502014 2,381,803 923,429 3,013,9622015 2,385,995 790,635 2,583,792
2016-2020 6,817,401 3,159,542 2,807,4032021-2025 369,193 1,870,011
Total obligation and gross minimum lease payments
$18,932,067
$9,096,045
$22,252,059
Less: Interest (3,699,107) (2,043,959) Present value of minimum lease payments
$15,232,960
$7,052,086
$22,252,059
11. OPERATING EXPENSES BY NATURAL AND FUNCTIONAL CLASSIFICATIONS
VCCS operating expenses for the year ended June 30, 2010 were as follows:
Natural Classification
Functional Classification Salaries &
Benefits Utilities Scholarships Depreciation
Supplies, Services & Other Total
Instruction $ 332,977,114 $ 120,430 $ 1,844,917 $ 25,023,619 $ 63,683,904 $ 423,649,984 Public Service 6,231,425 594 8,966 57,265,513 63,506,498 Acad. Support 59,671,268 63,391 327,604 4,076,123 18,447,975 82,586,361 Student Services 57,539,835 516 959,255 71,859 8,194,909 66,766,374 Inst. Support 109,824,705 160,866 871,443 6,864,347 43,641,903 161,363,264 O & M of Plant 22,424,774 15,286,074 1,751,675 54,664,064 94,126,587 Schol. & Fellows. 38,056 124,965,166 179,103 125,182,325 Aux. Enterprises 1,991,332 28,094 5,470 47,622 9,978,432 12,050,950 Other Expenses 84,103 84,103 Total Expenses $ 590,698,509 $ 15,659,965 $128,982,821 $ 37,835,245 $ 256,139,906 $1,029,316,446 12. STATE APPROPRIATIONS All Commonwealth unrestricted revenues must be appropriated by the Legislature and
are provided on an annual basis. Unspent balances of these appropriations at the close

27
of the fiscal year revert to the Commonwealth's General Fund. These reverted funds are eligible for re-appropriation in fiscal year 2010-11 provided that the VCCS meets financial and administrative standards outlined in the Code of Virginia.
During the year ended June 30, 2010, the Virginia Community College System received
the following general fund appropriations in accordance with the Appropriation Act of 2009, Chapter 781, Acts of Assembly.
Appropriated - Chapter 781 - approved April 8, 2009
$396,407,442
Less:
Transfer 2010 net central account distributions (13,941,580)Other:
Transfer from SCHEV – VIVA 38,100Carryover fiscal year 2009 year-end balances 7,598,307Commonwealth budget reductions (50,898,741)Equipment Trust Fund lease payment (633,657)Transfer capital fee (1,753,660)Philpott manufacturing (443,462)Reversion (7,613,602)
Adjusted Unrestricted Appropriations $328,759,147
Other restricted appropriations were $30,874,751 for a total of $359,633,898.
13. EQUIPMENT TRUST FUND
The System participates in the Higher Education Equipment Trust Fund of the Virginia College Building Authority (VCBA). The Higher Education Equipment Trust Fund provides funds to public colleges and universities for equipment acquisition. In prior years, funds were provided in the form of a lease. During the year ended June 30, 2010, the VCBA financed the ETF program with state appropriations.
14. DONOR-RESTRICTED ENDOWMENTS
VCCS has two donor-restricted endowments. The net appreciation on investments of donor-restricted endowments that is available for expenditure by the governing board did not change for the year ended June 30, 2010. These amounts are reported as restricted expendable net assets. Total-return policy is followed for authorizing and spending investment income.
15. CONTINGENCIES ON GRANTS The VCCS receives assistance from non-state grantor agencies in the form of grants.
Entitlement to these resources is generally conditional upon compliance with the terms and conditions of grant agreements. Substantially all grants are subject to financial and compliance audits by the grantors. All disallowances as a result of these audits become a liability of the VCCS. As of June 30, 2010, the VCCS estimates that no material liabilities will result from such audits.

28
16. PENSION PLAN All qualified salaried employees of the VCCS must participate in one of two retirement
benefit plans - the Virginia Retirement System (VRS) or the Optional Retirement Plan (ORP). Classified employees are eligible to participate in the VRS only, while faculty rank employees are eligible to participate in either the VRS or the ORP.
The VRS is an agent multiple-employer public employee retirement system that acts as a
common investment and administrative agency for the Commonwealth of Virginia and its political subdivisions. This is a fixed benefit plan, with benefits vesting after five years of service. Current benefit provisions are based on a formula using years of service, salary, and age. The VRS does not measure assets and pension benefit obligations separately for individual State institutions. Information relating to this plan is available at the statewide level only in the Commonwealth of Virginia’s Comprehensive Annual Financial Report (CAFR). The Commonwealth, not the VCCS, has overall responsibility for contributions to this plan.
Participants in the ORP may select from one of five plan administrators for the receipt
and investment of contributions. This is a fixed-contribution plan where the retirement benefits received are based on the employer’s (10.4%) contributions, plus interest and dividends.
Individual contracts issued under the ORP plan provide for full and immediate vesting of
the VCCS contributions. Total pension costs under this plan were $5,661,513 and $5,613,906 for years ended June 30, 2010 and 2009, respectively. Contributions to the ORP plan were calculated using the base salary amount of $54,437,627 and $53,979,861 for fiscal years 2010 and 2009. The VCCS total payroll for fiscal years 2010 and 2009 was $473,536,334 and $460,989,155 respectively.
Employees of the VCCS are employees of the Commonwealth of Virginia. State
employees may participate in the Commonwealth’s Deferred Compensation Plan. Participating employees can contribute to the plan each pay period with the Commonwealth matching up to $20 per pay period. The dollar amount match can change depending on the funding available in the Commonwealth’s budget. The Deferred Compensation Plan is a qualified defined contribution plan under Section 401(a) of the Internal Revenue Code. Employer contributions under the Deferred Compensation Plan were approximately $1,701,922 for fiscal year 2010.
17. RISK MANAGEMENT The System is exposed to various risks of loss related to torts; theft of, damage to, and
destruction of assets; errors and omissions; non-performance of duty; injuries to employees; and natural disasters. The System participates in insurance plans maintained by the Commonwealth of Virginia. The state employee health care and worker’s compensation plan are administered by the Department of Human Resource Management, and the risk management insurance plans are administered by the Department of Treasury, Division of Risk Management. Risk management insurance includes property, general liability, faithful performance of duty bonds, automobile, and air and watercraft plans. The System pays premiums to each of these Departments for its insurance coverage. Information relating to the Commonwealth’s insurance plans is available at the statewide level in the Commonwealth of Virginia’s Comprehensive Annual Financial Report.
A Faithful Performance Duty Bond administered by the Commonwealth of Virginia’s Department of Treasury, Division of Risk Management, covers the employees of the

29
VCCS. The Faithful Performance Duty Bond provides coverage with liability limits of $500,000 for each occurrence.
18. POST-EMPLOYMENT BENEFITS
The Commonwealth participates in the VRS-administered statewide group life insurance program which provides post-employment life insurance to eligible retired and terminated employees. The Commonwealth also provides health care credit against the monthly insurance premiums of its retirees who have at least 15 years of state service and participate in the state’s health plan. Information related to these plans is available at the statewide level in the Commonwealth’s Comprehensive Annual Financial Report.
19. CAPITAL APPROPRIATIONS-STATE
Capital appropriations-state is comprised of the following: General Fund Reversion $ 222,145 Asbestos Claims Trust Fund Reversion Reduction (2,465) Virginia College Building Authority appropriation revenue 81,851,322 General Obligation Bond appropriation revenue 7,303,693 Tidewater Community College capital lease agreement 2,012,573 Total $91,387,268
20. COMPONENT UNIT FINANCIAL INFORMATION
Below is a summary of the foundations. VCCS has five major component units—Lord Fairfax Community College Educational Foundation, Northern Virginia Community College Educational Foundation, Mountain Empire Community College Educational Foundation, Patrick Henry Community College Foundation, and Southwest Virginia Community College Educational Foundation. Additionally, the System has twenty-two non-major component units—Blue Ridge Community College Educational Foundation, Central Virginia Community College Educational Foundation, Dabney S. Lancaster Community College Educational Foundation, Danville Community College Educational Foundation, Eastern Shore Community College Educational Foundation, Germanna Community College Educational Foundation, J. Sargeant Reynolds Community College Educational Foundation, J. Sargeant Reynolds Community College Real Estate Foundation, John Tyler Community College Foundation, New River Community College Educational Foundation, Paul D. Camp Community College Educational Foundation, Piedmont Community College Educational Foundation, Rappahannock Community College Educational Foundation, Southside Virginia Community College Educational Foundation, Thomas Nelson Community College Educational Foundation, Tidewater Community College Educational Foundation, Tidewater Community College Real Estate Foundation, Virginia Highlands Community College Educational Foundation, Virginia Western Community College Educational Foundation, Wytheville Community College Educational Foundation, Wytheville Community College Scholarship Foundation, and Community Colleges of Virginia Educational Foundation. These organizations are separately incorporated entities and other auditors examine the related financial statements.
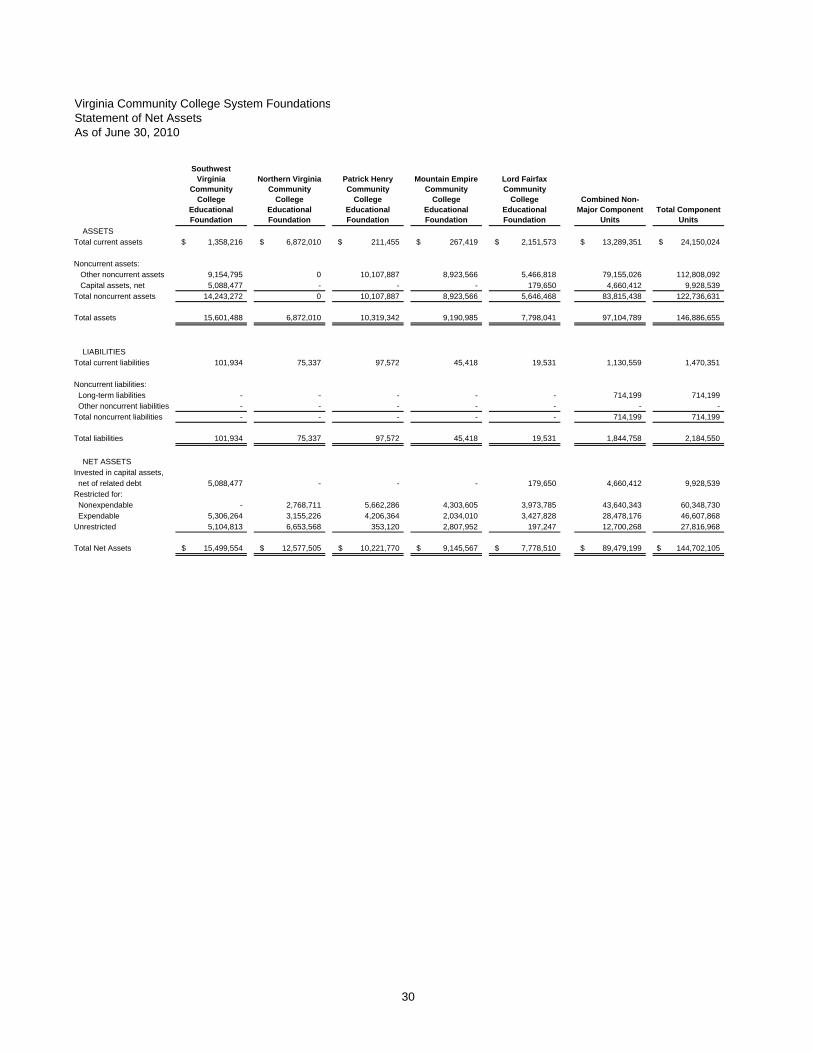
Virginia Community College System FoundationsStatement of Net AssetsAs of June 30, 2010
Southwest Virginia
Community College
Educational Foundation
Northern Virginia Community
College Educational Foundation
Patrick Henry Community
College Educational Foundation
Mountain Empire Community
College Educational Foundation
Lord Fairfax Community
College Educational Foundation
Combined Non-Major Component
UnitsTotal Component
Units
ASSETSTotal current assets 1,358,216$ 6,872,010$ 211,455$ 267,419$ 2,151,573$ 13,289,351$ 24,150,024$
Noncurrent assets: Other noncurrent assets 9,154,795 0 10,107,887 8,923,566 5,466,818 79,155,026 112,808,092 Capital assets, net 5,088,477 - - - 179,650 4,660,412 9,928,539Total noncurrent assets 14,243,272 0 10,107,887 8,923,566 5,646,468 83,815,438 122,736,631
Total assets 15,601,488 6,872,010 10,319,342 9,190,985 7,798,041 97,104,789 146,886,655
LIABILITIESTotal current liabilities 101,934 75,337 97,572 45,418 19,531 1,130,559 1,470,351
Noncurrent liabilities: Long-term liabilities - - - - - 714,199 714,199 Other noncurrent liabilities - - - - - - - Total noncurrent liabilities - - - - - 714,199 714,199
Total liabilities 101,934 75,337 97,572 45,418 19,531 1,844,758 2,184,550
NET ASSETSInvested in capital assets, net of related debt 5,088,477 - - - 179,650 4,660,412 9,928,539Restricted for: Nonexpendable - 2,768,711 5,662,286 4,303,605 3,973,785 43,640,343 60,348,730 Expendable 5,306,264 3,155,226 4,206,364 2,034,010 3,427,828 28,478,176 46,607,868Unrestricted 5,104,813 6,653,568 353,120 2,807,952 197,247 12,700,268 27,816,968
Total Net Assets 15,499,554$ 12,577,505$ 10,221,770$ 9,145,567$ 7,778,510$ 89,479,199$ 144,702,105$
30

Virginia Community College System FoundationsStatement of Revenues, Expenses, and Changes in Net AssetsAs of June 30, 2010
Southwest Virginia Community
College Educational Foundation
Northern Virginia Community
College Educational Foundation
Patrick Henry Community
College Educational Foundation
Mountain Empire Community
College Educational Foundation
Lord Fairfax Community College
Educational Foundation
Combined Non-Major
Component Units
Total Component Units
Total operating revenues 838,526$ 1,672,149$ 2,167,082$ 485,920$ 727,645$ 14,629,035$ 20,520,357$
Total operating expenses 1,108,391 1,571,714 1,347,273 429,200 2,322,064 13,397,954 20,176,596
Operating income (loss) (269,865) 100,435 819,809 56,720 (1,594,419) 1,231,081 343,761
Nonoperating revenues (expenses):Investment Income 1,126,823 1,147,562 320,542 807,614 177,481 2,389,139 5,969,161 Other nonoperating revenues (expenses) - - - - - (19,999) (19,999)
Net nonoperating revenue 1,126,823 1,147,562 320,542 807,614 177,481 2,369,140 5,949,162
Income before other revenues, expenses gains and losses 856,958 1,247,997 1,140,351 864,334 (1,416,938) 3,600,221 6,292,923
Capital gifts, grants and contracts 34,841 - - - - 627,375 662,216 Additions to permanent and term endowments - 67,618 69,300 319,756 125,095 4,957,699 5,539,468
Increase (decrease) in net assets 891,799 1,315,615 1,209,651 1,184,090 (1,291,843) 9,185,295 12,494,607
Net assets - beginning of year 14,607,755 11,261,890 9,012,119 7,961,477 9,070,353 80,293,904 132,207,498
Net assets - end of year 15,499,554$ 12,577,505$ 10,221,770$ 9,145,567$ 7,778,510$ 89,479,199$ 144,702,105$
31

32
21. PENDING LITIGATION
A few community colleges have been named as defendants in lawsuits. The final outcome of the lawsuits cannot be determined at this time. However, management is of the opinion that any ultimate liability to which the colleges may be exposed will not have a material effect upon the Virginia Community College System’s financial position.
22. SUBSEQUENT EVENTS
In November 2010, the Virginia Community College System issued a note to VCBA in the amount of $8,570,000. The proceeds of the note will be used to finance construction of the Student Center at the Tidewater Community College Virginia Beach Campus. The note bears interest at a rate of 3.11% and is payable in the years 2011 – 2031.
In November 2010, the Virginia Community College System issued a note to VCBA in the amount of $15,605,000. The proceeds of the note will be used to finance construction of the Student Center at the Tidewater Community College Portsmouth Campus. The note bears interest at a rate of 3.12% and is payable in the years 2011 – 2031.
In November 2010, the Virginia Community College System issued a note to VCBA in the amount of $6,055,000. The proceeds of the note will be used to finance construction of the Student Center at the Tidewater Community College Chesapeake Campus. The note bears interest at a rate of 3.12% and is payable in the years 2011 – 2031.
In November 2010, the Virginia Community College System issued a note to VCBA in the amount of $9,335,000. The proceeds of the note will be used to finance construction of the Student Recreation Center at Blue Ridge Community College. The note bears interest at a rate of 3.12% and is payable in the years 2011 – 2031.
In October 2010, the Commonwealth of Virginia refunded VCBA bonds with new bond issuances totaling $5,575,000 (VCCS portion). The new bonds have coupon rates ranging from 3.00% to 5.00%. The refunding decreased the total debt service payments to be made by $361,867.