Embed Size (px)
Citation preview
Virginia Green Industry Survey Virginia Green Industry Survey
1
Virginia Green Industry Survey. . . . . .
Published December 2003
Compiled byVIRGINIA AGRICULTURAL STATISTICS SERVICE
PO Box 1659RICHMOND, VA 23218-1659
(804) 771-2493
http://www.nass.usda.gov/va/
Kevin Barnes, State StatisticianDavid Mueller, Deputy State Statistician
Jason Jones, Statistician
Issued Cooperatively By
VIRGINIADEPARTMENT OF AGRICULTURE
& CONSUMER SERVICESJ. Carlton Courter, III, Commissioner
NATIONAL AGRICULTURALSTATISTICS SERVICE
U.S. DEPARTMENT OF AGRICULTURE
AcknowledgmentsWe extend a special thanks to all of the green industry producers and service providers who took the time to respond to the survey. We alsowant to thank members of the Virginia Nursery and Landscape Association for their invaluable assistance in the planning and support of thissurvey effort. Special thanks also to Sarah Hoffman, Survey Methods Branch, National Agricultural Statistics Service in Washington, D.C., forher technical assistance. Cover designed by Rachel Pittman, Virginia Agricultural Statistics Service.
24
Virginia Green Industry Survey Virginia Green Industry Survey
2
2002 Virginia Green Industry SurveyTable of Contents
EXECUTIVE SUMMARY . . . . . . . . . . . . . . . . . . . . . . . . . . . . . . . . . . . . . . . . . . . . . . . . . . . 3
SURVEY DESIGN . . . . . . . . . . . . . . . . . . . . . . . . . . . . . . . . . . . . . . . . . . . . . . . . . . . . . . . . . . 4
RESPONSE . . . . . . . . . . . . . . . . . . . . . . . . . . . . . . . . . . . . . . . . . . . . . . . . . . . . . . . . . . . . . . . . 5
RESULTS AND SUMMARY OF THE SURVEY . . . . . . . . . . . . . . . . . . . . . . . . . . . . . . . 6
Sales of Horticultural Products and Services . . . . . . . . . . . . . . . . . . . . . . . . . . . 6
Types of Plant Products Sold in Virginia . . . . . . . . . . . . . . . . . . . . . . . . . . . . . . 8
Method for Plant Products Sold in Virginia . . . . . . . . . . . . . . . . . . . . . . . . . . . 10
Source of Plant Material Sold . . . . . . . . . . . . . . . . . . . . . . . . . . . . . . . . . . . . . . . . 12
Destination of Plants Shipped . . . . . . . . . . . . . . . . . . . . . . . . . . . . . . . . . . . . . . . . 14
Destination of Plants Shipped by Product . . . . . . . . . . . . . . . . . . . . . . . . . . . . . 16
Virginia Green Industry Growing Space . . . . . . . . . . . . . . . . . . . . . . . . . . . . . . 18
Number of Green Industry Workers and Wages . . . . . . . . . . . . . . . . . . . . . . 20
Expenditures for Nursery Production and Landscape Services . . . . . . . . . 22
23
Virginia Green Industry Survey Virginia Green Industry Survey
3
Executive Summary
The face of agriculture in Virginia is rapidly changing to accommodate the economicrealities of the times. Nursery crops, while having a long history in Virginia’sagricultural profile, have emerged as a profitable and fast growing farm commodity.This statistical profile and economic survey provides insight into the significance ofnursery and landscape activities in Virginia.
Here are a few highlights from the statistical profile:· Gross receipts exceeded $1.14 billion in 2002
o Plant sales accounted for 31%o Landscape (maintenance only) accounted for 24%o Landscape Installation accounted for 32%o Design or Architectural Services accounted for 8%o Other categories accounted for 5%
· Woody plants topped product saleso Woody plants 55%o Annuals 21%o Herbaceous Perennials 13%o Other products (includes aquatic plants and christmas trees) 6%o Specialty Greenhouse Crops 5%
· Virginia wholesale growers generate over $204.6 million from 25,000production acres, including 17 million square feet of covered space.
· Over 23,300 people are employed by the industryo 54% are employed for over 150 dayso Average labor wage is $8.76/hr.
· Current Market value of total value of land, structures, and equipment was$898.5 million.
It is understood that the conclusion stated in this survey demonstrates a conservativeprofile of the “Green Industry” in Virginia.
Please take time to review all of the data included in this publication. This importantinformation is available to industry, legislators, lending institutions, and educators forformulating relevant policies and programs benefiting Virginia’s citizens and the“Green Industry”. We thank all those who participated and contributed to this veryinformative statistical and economic profile.
22
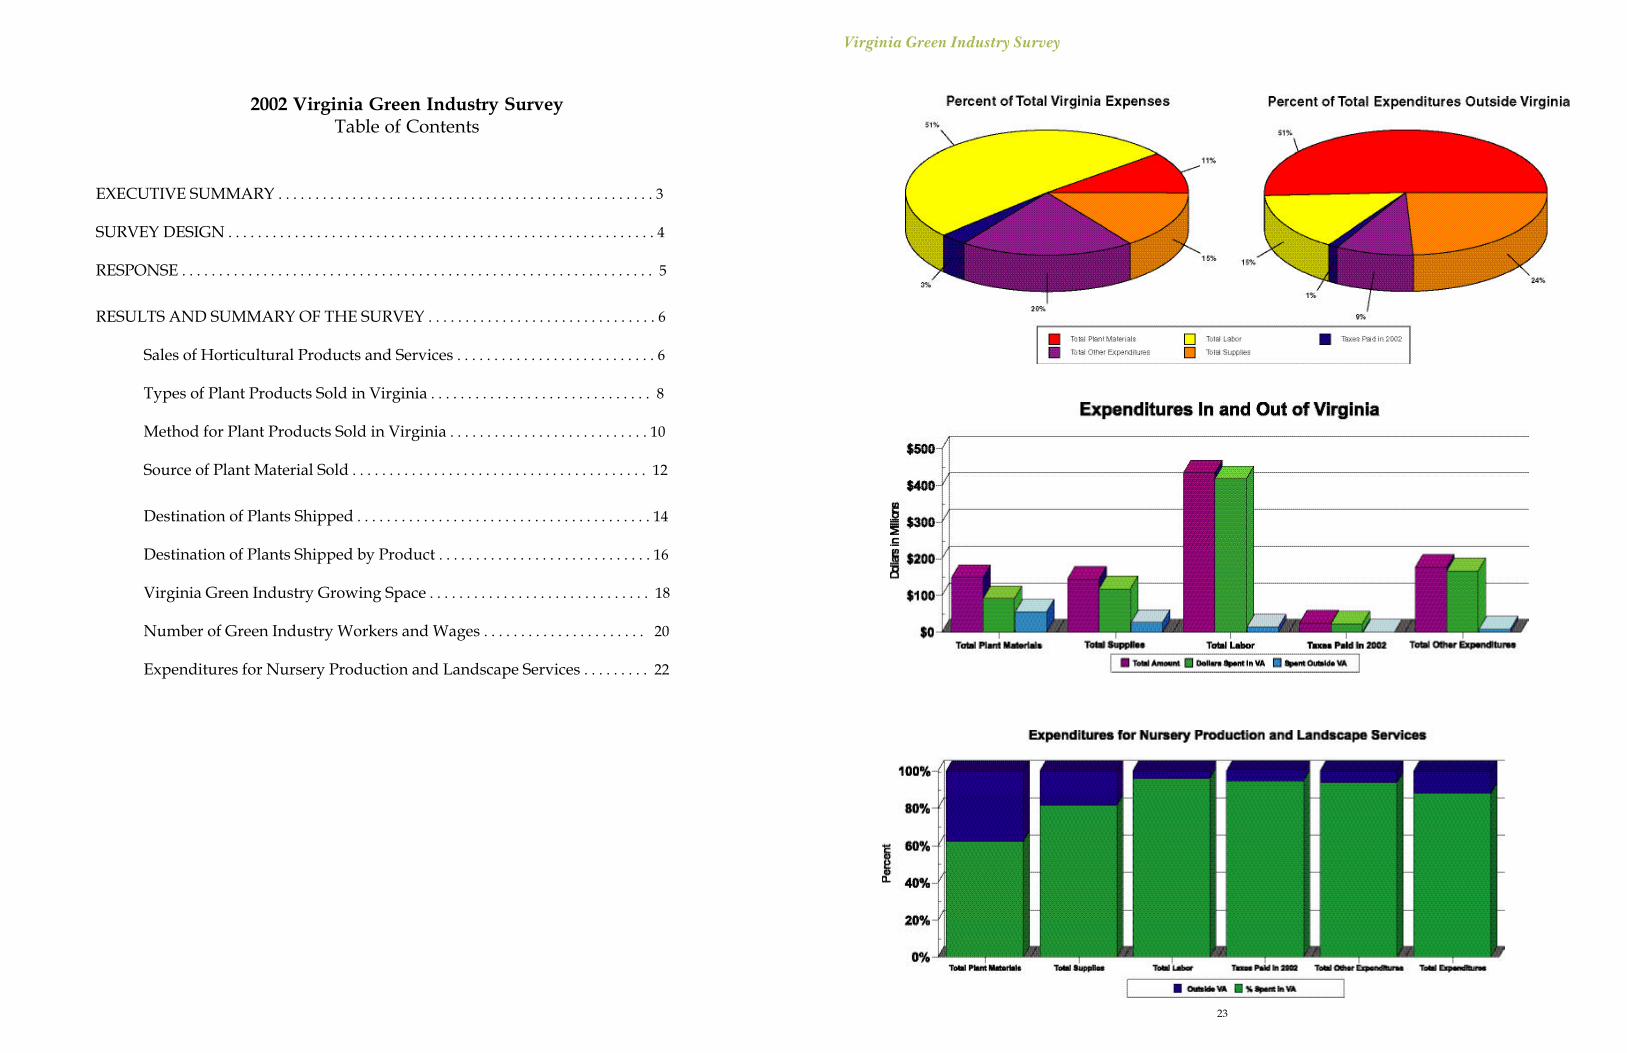
Expenditures for Nursery Production and Landscape Services
Total expenditures for Virginia in 2002, totaled $933.5 million. Eighty-eightpercent of these expenditures were spent in the Commonwealth, while theremaining 12% was spent outside of the state. The largest expense was labor at$434.9 million, with 96% of that total spent in Virginia. Other expendituresaccounted for $177.9 million, followed by plant materials at $150.2 million, andsupplies at $145.3 million. Plant materials accounted for the largest expenditureoutside the state at $56.9 million, representing 38% of plant materialexpenditures.
* Other includes equipment purchases, equipment renting and leasing, capital improvements,interest paid on business loans, insurance expenses, professional services, advertising, generaloffice expenses, and other expenditures.
Type of Expenditure Percent Spent in Virginia Percent Spent Outside Virginia Plant Materials 62 38 Total Supplies 82 18 Total Labor 96 4 Taxes Paid in 2002 95 5 Other Expenditures 94 6 Total Expenditures 88 12
Type of Expenditure
Total Amount
Percent of Total
Expenses
Dollars Spent in Virginia
Percent of Total Virginia Expenses
Dollars Spent
Outside Virginia
Percent of Total
Expenses Outside Virginia
Labor 434,975,000 47 418,873,000 51 16,102,000 15
Plant Materials 150,209,000 16 93,342,000 11 56,867,000 51
Supplies 145,338,000 15 118,500,000 15 26,838,000 24
Taxes Paid in 2002 25,036,000 3 23,784,000 3 1,252,000 1
Other* 177,892,000 19 167,762,000 20 10,130,000 9
Total 933,450,000 100 822,261,000 100 111,189,000 100
Virginia Green Industry Survey Virginia Green Industry Survey
4
2002 VIRGINIA GREEN SURVEY
The Green Industry has been one of the fastest growing agricultural segments over thelast decade. This growth has spurred dramatic interest in the industry’s size andeconomic importance. The 2002 Green Industry Survey is the first comprehensivestudy of the entire Green Industry ever conducted in Virginia. These statistics arecrucial in obtaining state and local government support on various issues.
OBJECTIVE
The purpose of the 2002 Green Industry Survey is to measure the economic importanceof Virginia’s nursery, greenhouse and landscape services industry. The surveyproduces current information on the production of various types of plants grown andsold in and outside of Virginia and landscape services provided by the industry. Inaddition, the study provides information on the number of workers employed by theindustry and average wage rates.
POPULATION
The Green Industry as defined for this survey includes businesses or individuals whoare wholesale producers or providers of landscape services. Wholesale producersinclude growers involved in wholesale only, re-wholesale distribution, or wholesale/retail. The landscape service providers includes businesses or individuals involved inlandscape installation, maintenance, design, and architecture. The survey did notattempt to cover the retail sector except where a wholesale producer also operated as aretail operation. For this reason large retail chains are excluded from the samplepopulation.
SURVEY DESIGN AND DATA COLLECTION
The sample included all wholesale nurseries licensed by the Virginia Department ofAgriculture and Consumer Services. In addition, other name sources were purchasedto compile a list of individuals and businesses involved in the Nursery and LandscapeIndustry.
21
Virginia Green Industry Survey Virginia Green Industry Survey
5
A sample of 4,246 questionnaires was mailed to potential respondents in December2002. In early January 2003 a second mail out was made to all who did not respond tothe initial mailing. Follow up telephone contacts were made to the remaining non-respondents who failed to returned the questionnaire by mail. The telephone followup effort focused more on the larger operations to improve overall coverage of theitems of interest.
NON-RESPONSE ADJUSTMENT
There was no attempt made to conduct a special study of the non-response population.The assumption was made that the characteristics of non-respondents were no differentthan those who responded to the survey. Therefore, missing items for partiallycompleted reports were estimated based on reported data from operations of similarsize and scope.
RESPONSE
A total of 1,146, or 27 percent of recipients responded to the survey. Of this total, 42indicated they were not in business at this time but will have future sales. Another 525reported they are no longer actively involved in the nursery or landscape business.
20
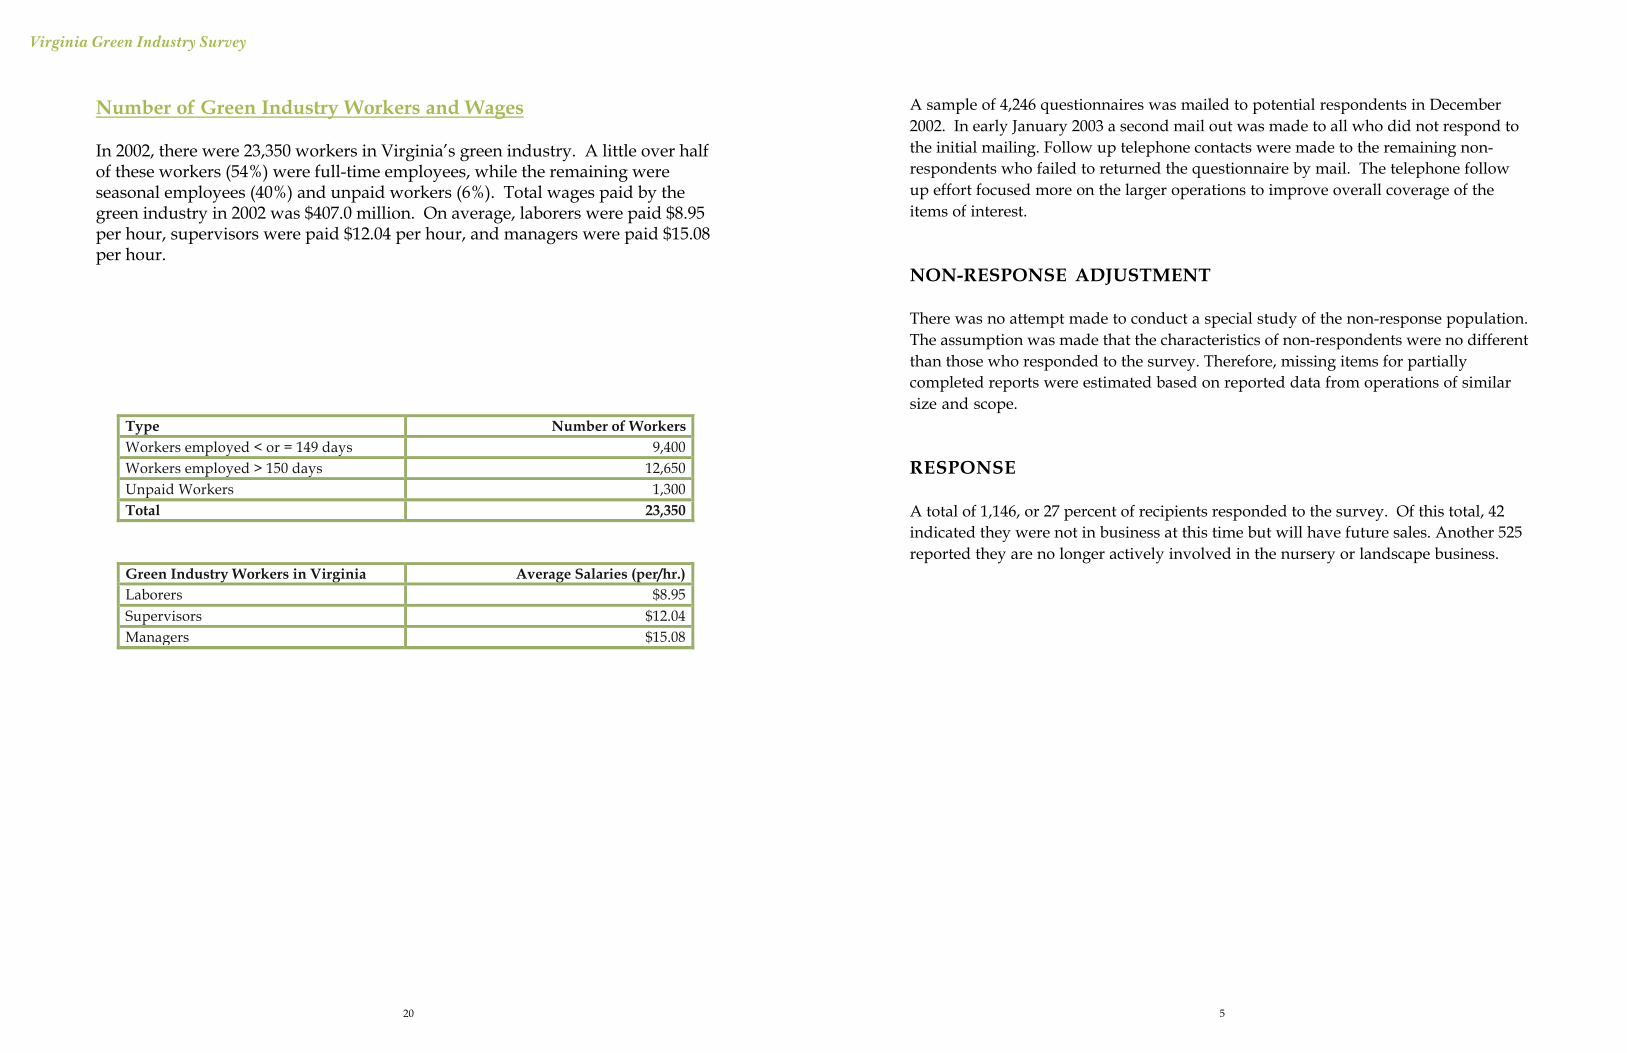
Number of Green Industry Workers and Wages
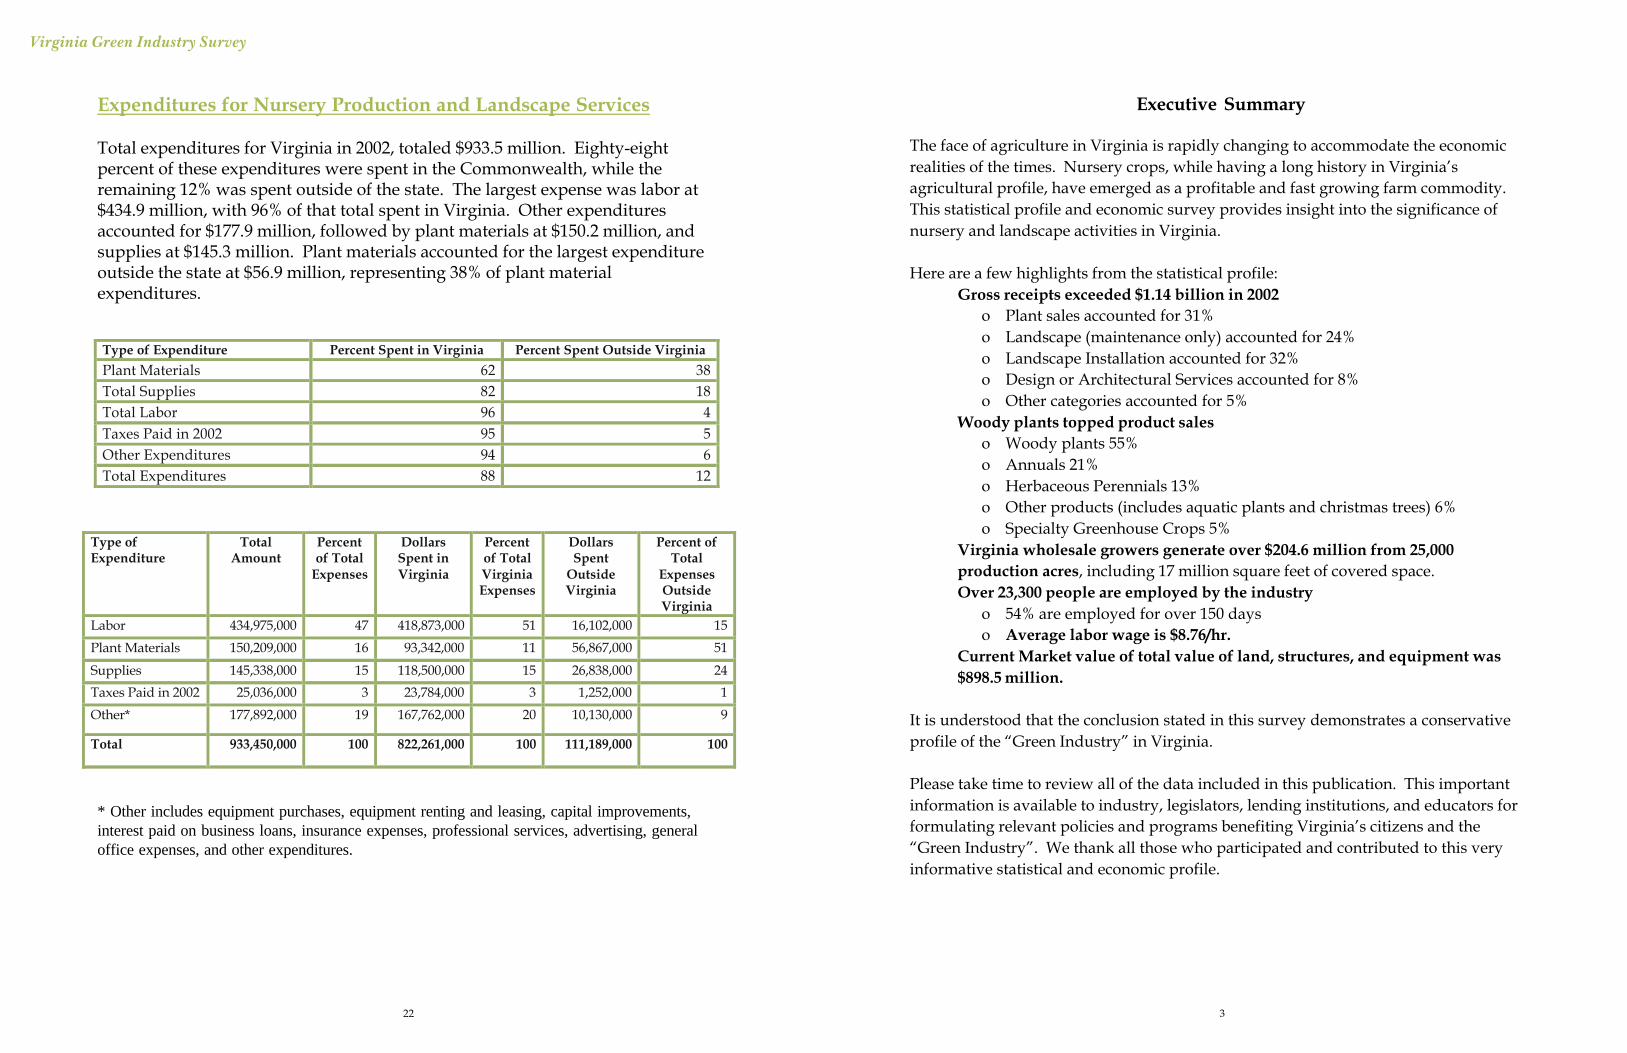
In 2002, there were 23,350 workers in Virginia’s green industry. A little over halfof these workers (54%) were full-time employees, while the remaining wereseasonal employees (40%) and unpaid workers (6%). Total wages paid by thegreen industry in 2002 was $407.0 million. On average, laborers were paid $8.95per hour, supervisors were paid $12.04 per hour, and managers were paid $15.08per hour.
Type Number of Workers Workers employed < or = 149 days 9,400 Workers employed > 150 days 12,650 Unpaid Workers 1,300 Total 23,350
Green Industry Workers in Virginia Average Salaries (per/hr.) Laborers $8.95 Supervisors $12.04 Managers $15.08
Virginia Green Industry Survey Virginia Green Industry Survey
6
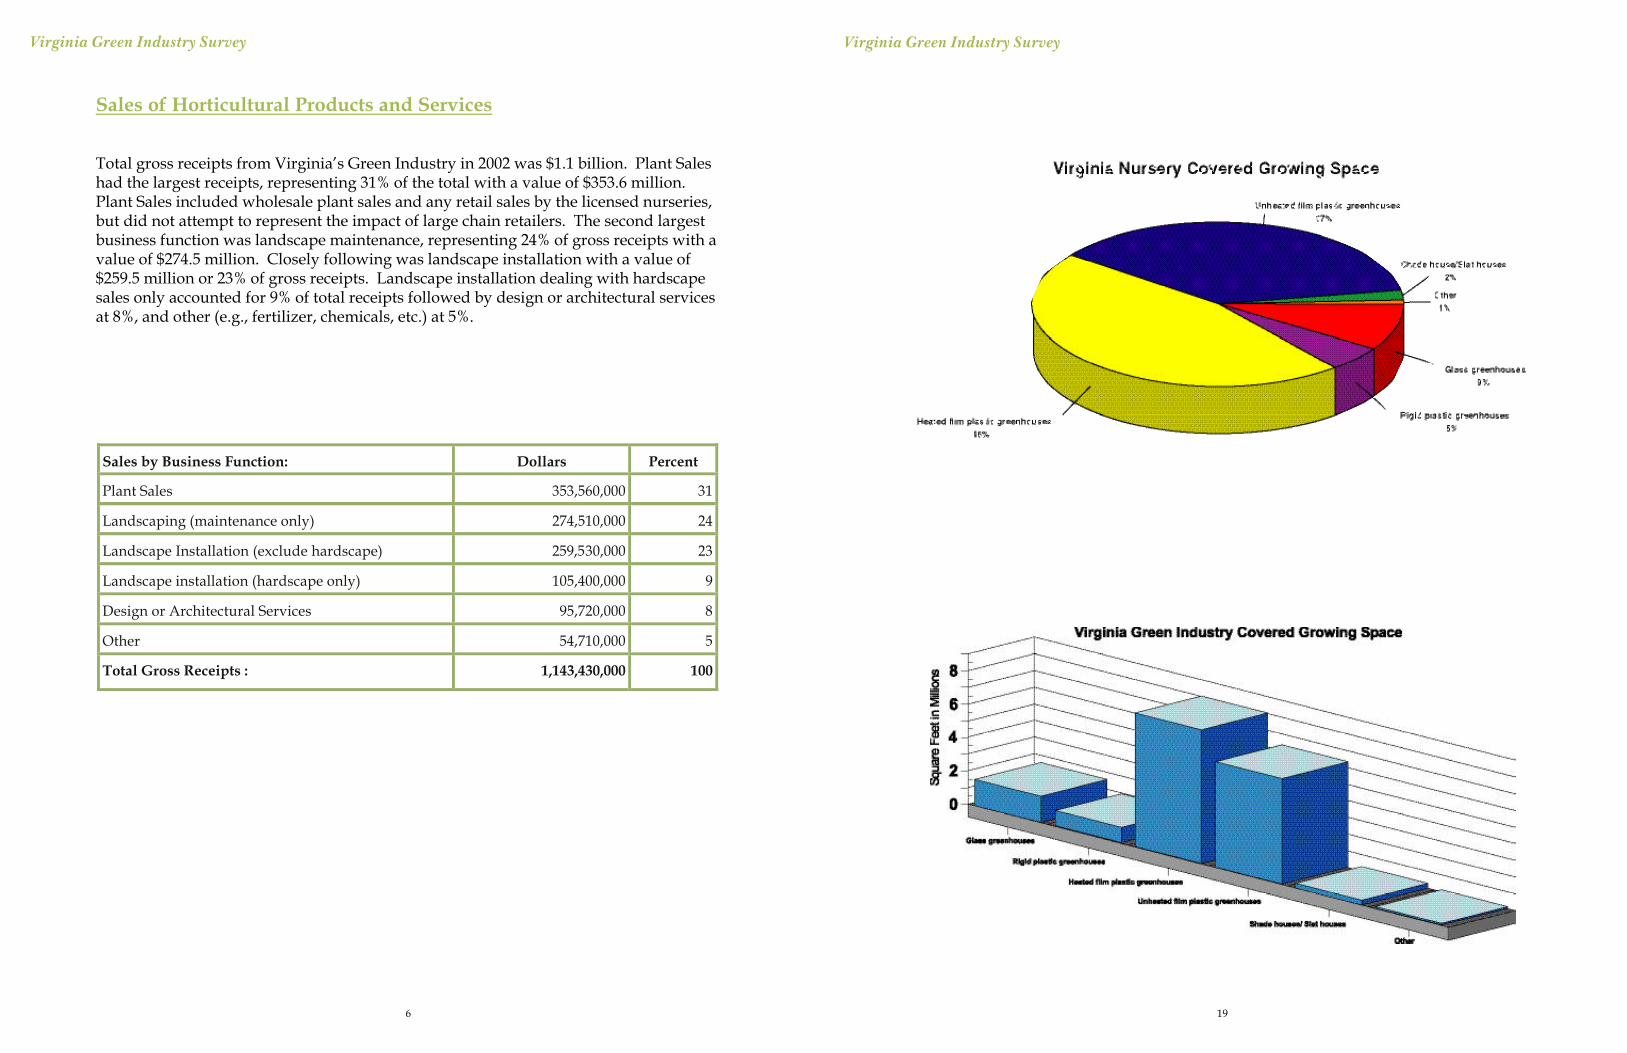
Sales of Horticultural Products and Services
Total gross receipts from Virginia’s Green Industry in 2002 was $1.1 billion. Plant Saleshad the largest receipts, representing 31% of the total with a value of $353.6 million.Plant Sales included wholesale plant sales and any retail sales by the licensed nurseries,but did not attempt to represent the impact of large chain retailers. The second largestbusiness function was landscape maintenance, representing 24% of gross receipts with avalue of $274.5 million. Closely following was landscape installation with a value of$259.5 million or 23% of gross receipts. Landscape installation dealing with hardscapesales only accounted for 9% of total receipts followed by design or architectural servicesat 8%, and other (e.g., fertilizer, chemicals, etc.) at 5%.
Sales by Business Function: Dollars Percent
Plant Sales 353,560,000 31
Landscaping (maintenance only) 274,510,000 24
Landscape Installation (exclude hardscape) 259,530,000 23
Landscape installation (hardscape only) 105,400,000 9
Design or Architectural Services 95,720,000 8
Other 54,710,000 5
Total Gross Receipts : 1,143,430,000 100
19
Virginia Green Industry Survey Virginia Green Industry Survey
718
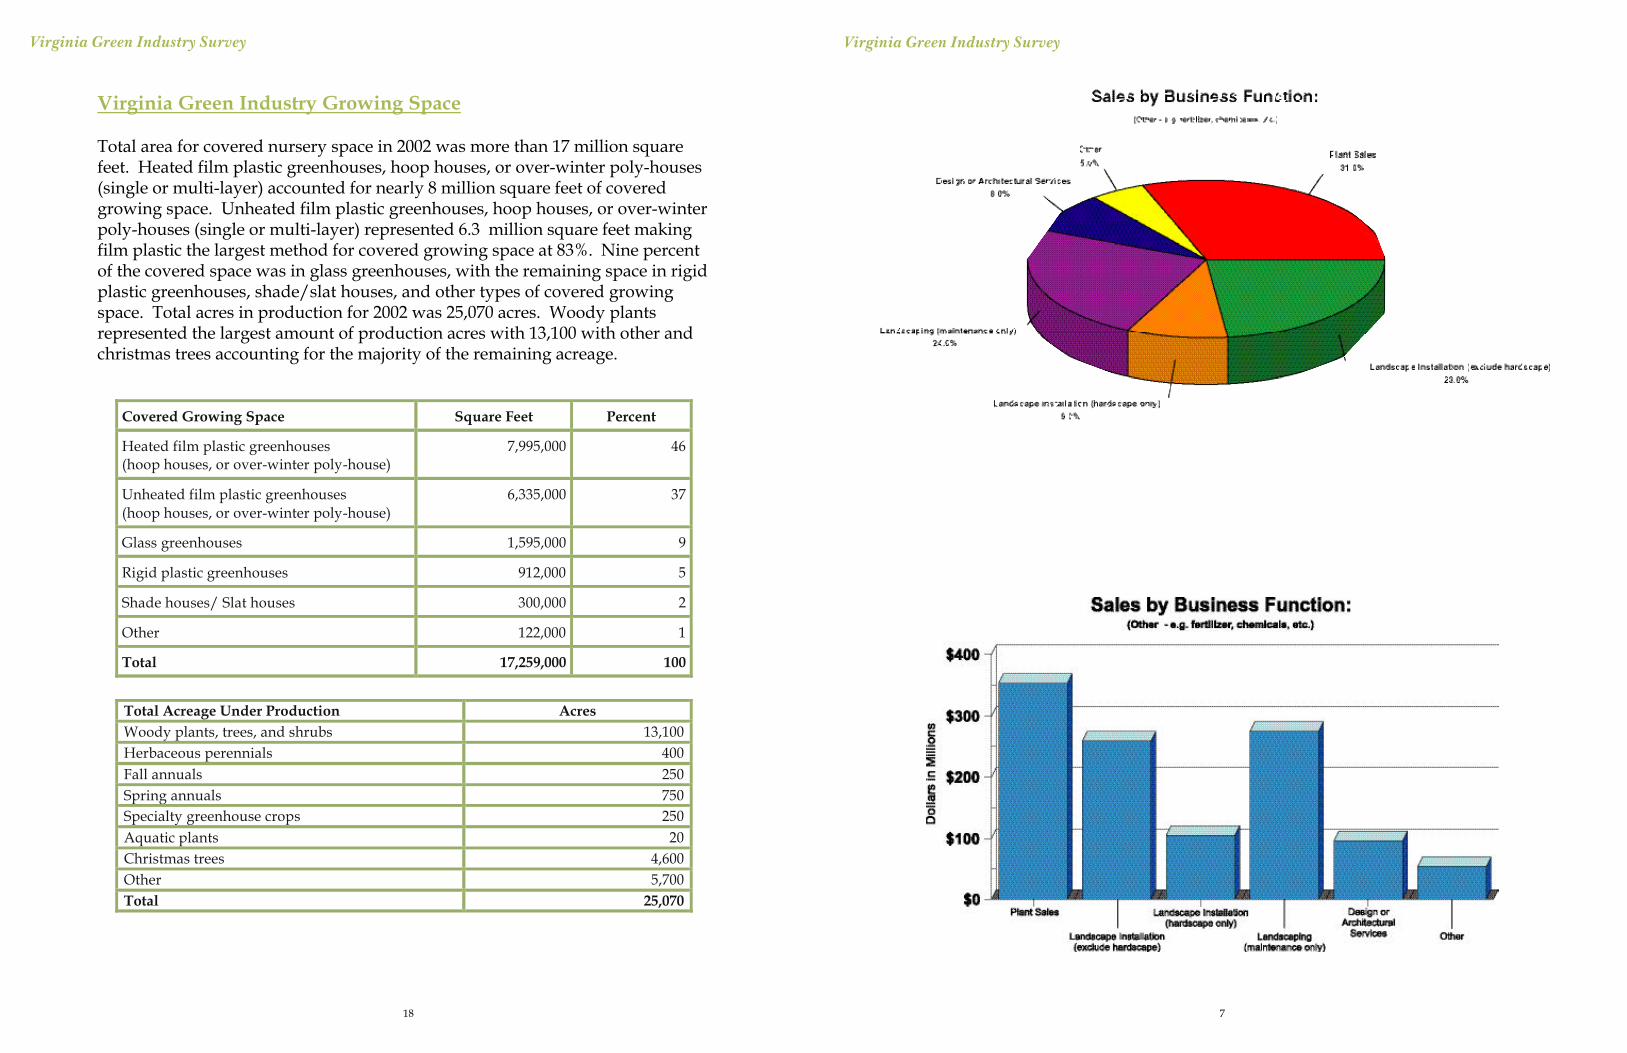
Virginia Green Industry Growing Space
Total area for covered nursery space in 2002 was more than 17 million squarefeet. Heated film plastic greenhouses, hoop houses, or over-winter poly-houses(single or multi-layer) accounted for nearly 8 million square feet of coveredgrowing space. Unheated film plastic greenhouses, hoop houses, or over-winterpoly-houses (single or multi-layer) represented 6.3 million square feet makingfilm plastic the largest method for covered growing space at 83%. Nine percentof the covered space was in glass greenhouses, with the remaining space in rigidplastic greenhouses, shade/slat houses, and other types of covered growingspace. Total acres in production for 2002 was 25,070 acres. Woody plantsrepresented the largest amount of production acres with 13,100 with other andchristmas trees accounting for the majority of the remaining acreage.
Covered Growing Space Square Feet Percent
Heated film plastic greenhouses (hoop houses, or over-winter poly-house)
7,995,000 46
Unheated film plastic greenhouses (hoop houses, or over-winter poly-house)
6,335,000 37
Glass greenhouses 1,595,000 9
Rigid plastic greenhouses 912,000 5
Shade houses/ Slat houses 300,000 2
Other 122,000 1
Total 17,259,000 100
Total Acreage Under Production Acres Woody plants, trees, and shrubs 13,100 Herbaceous perennials 400 Fall annuals 250 Spring annuals 750 Specialty greenhouse crops 250 Aquatic plants 20 Christmas trees 4,600 Other 5,700 Total 25,070
Virginia Green Industry Survey Virginia Green Industry Survey
8
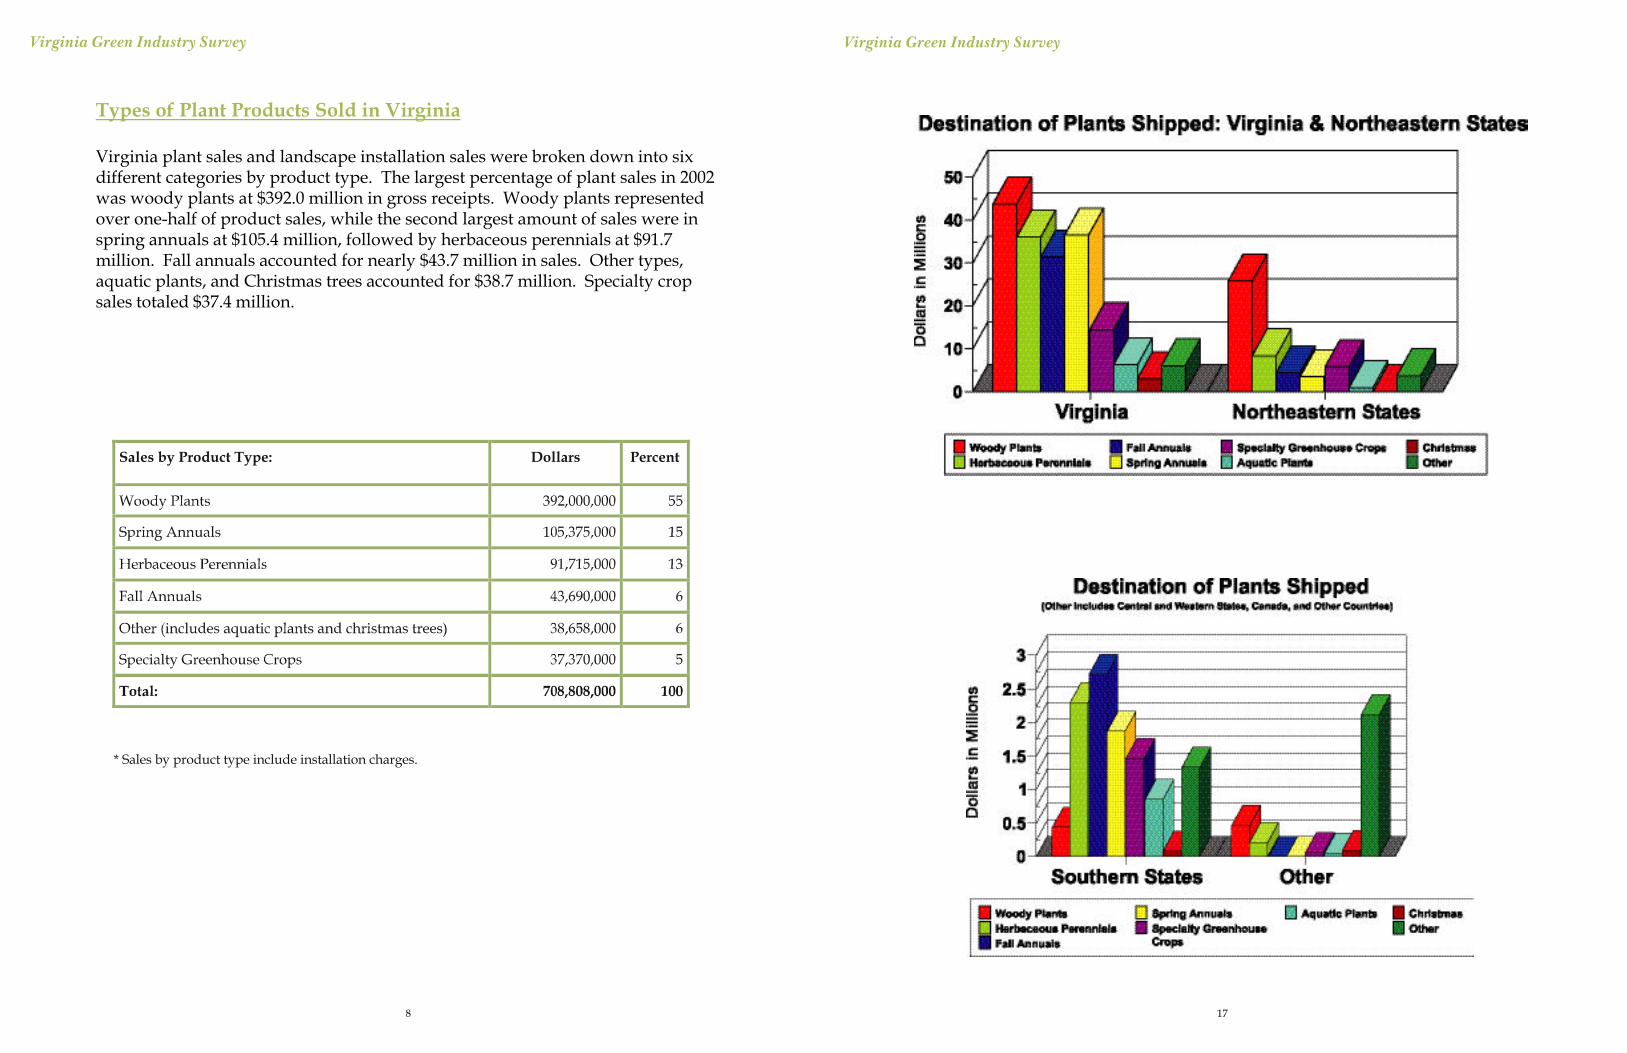
Types of Plant Products Sold in Virginia
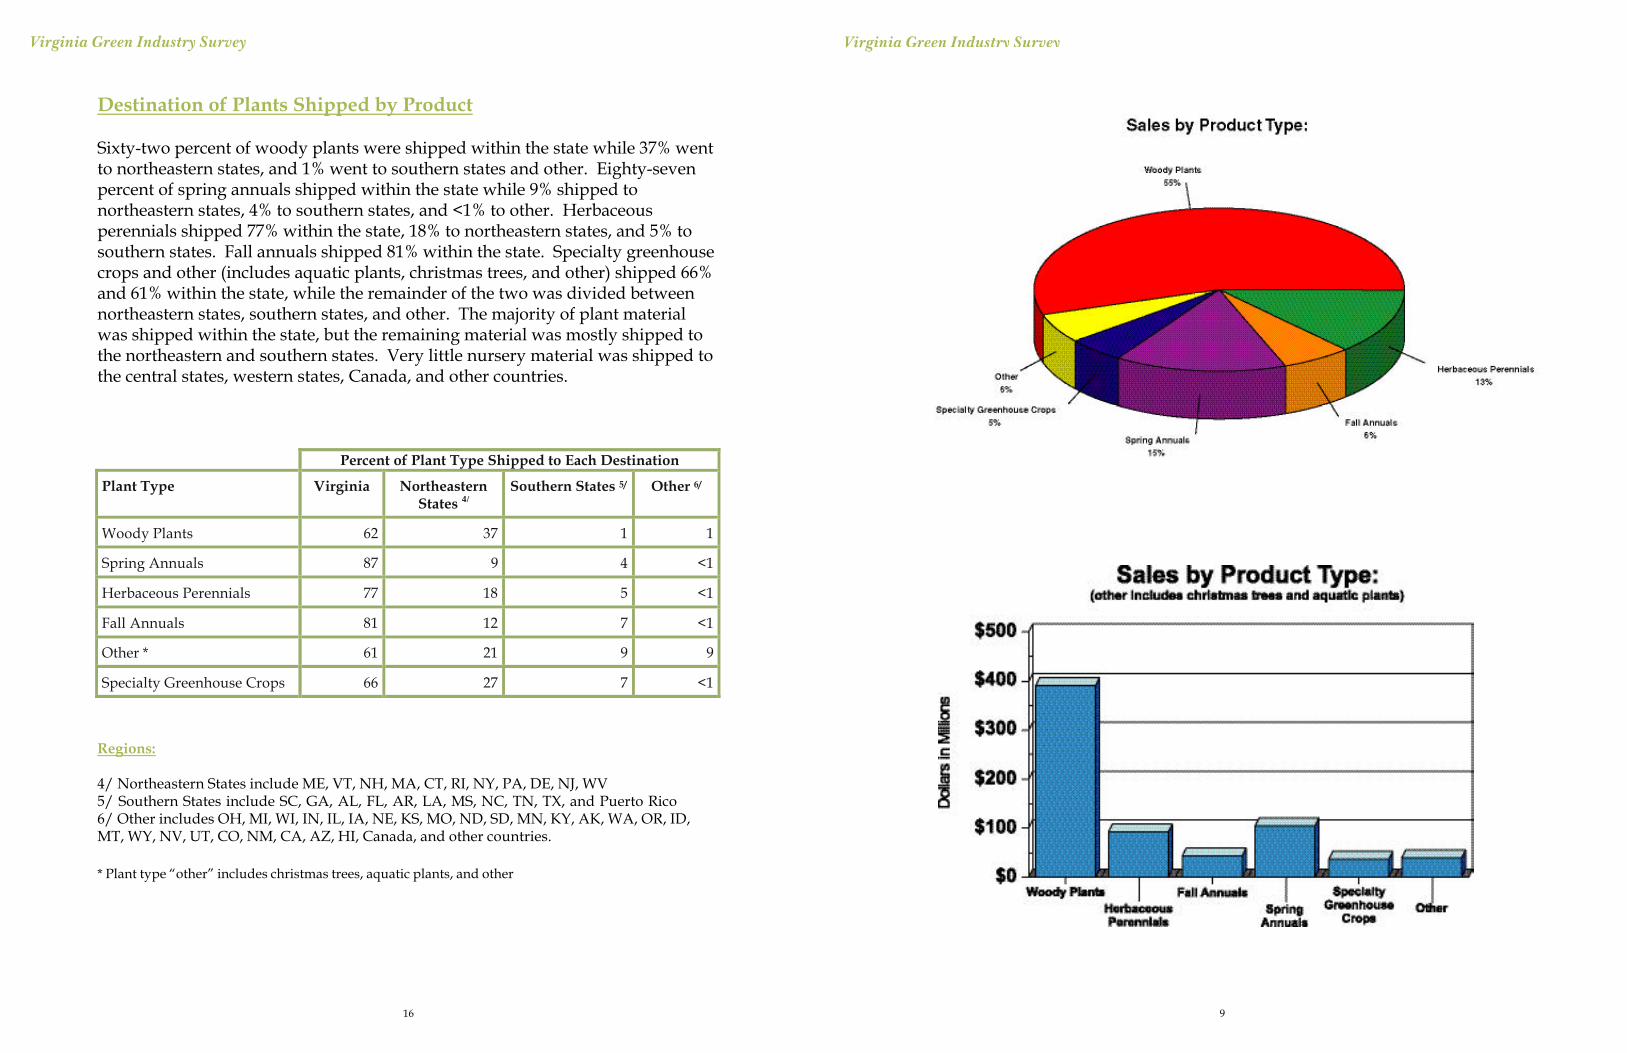
Virginia plant sales and landscape installation sales were broken down into sixdifferent categories by product type. The largest percentage of plant sales in 2002was woody plants at $392.0 million in gross receipts. Woody plants representedover one-half of product sales, while the second largest amount of sales were inspring annuals at $105.4 million, followed by herbaceous perennials at $91.7million. Fall annuals accounted for nearly $43.7 million in sales. Other types,aquatic plants, and Christmas trees accounted for $38.7 million. Specialty cropsales totaled $37.4 million.
* Sales by product type include installation charges.
Sales by Product Type: Dollars Percent
17
Virginia Green Industry Survey Virginia Green Industry Survey
916
Destination of Plants Shipped by Product
Sixty-two percent of woody plants were shipped within the state while 37% wentto northeastern states, and 1% went to southern states and other. Eighty-sevenpercent of spring annuals shipped within the state while 9% shipped tonortheastern states, 4% to southern states, and <1% to other. Herbaceousperennials shipped 77% within the state, 18% to northeastern states, and 5% tosouthern states. Fall annuals shipped 81% within the state. Specialty greenhousecrops and other (includes aquatic plants, christmas trees, and other) shipped 66%and 61% within the state, while the remainder of the two was divided betweennortheastern states, southern states, and other. The majority of plant materialwas shipped within the state, but the remaining material was mostly shipped tothe northeastern and southern states. Very little nursery material was shipped tothe central states, western states, Canada, and other countries.
Regions:
4/ Northeastern States include ME, VT, NH, MA, CT, RI, NY, PA, DE, NJ, WV5/ Southern States include SC, GA, AL, FL, AR, LA, MS, NC, TN, TX, and Puerto Rico6/ Other includes OH, MI, WI, IN, IL, IA, NE, KS, MO, ND, SD, MN, KY, AK, WA, OR, ID,MT, WY, NV, UT, CO, NM, CA, AZ, HI, Canada, and other countries.
* Plant type “other” includes christmas trees, aquatic plants, and other
Percent of Plant Type Shipped to Each Destination
Plant Type Virginia Northeastern States 4/
Southern States 5/ Other 6/
Woody Plants 62 37 1 1
Spring Annuals 87 9 4 <1
Herbaceous Perennials 77 18 5 <1
Fall Annuals 81 12 7 <1
Other * 61 21 9 9
Specialty Greenhouse Crops 66 27 7 <1
Virginia Green Industry Survey Virginia Green Industry Survey
10
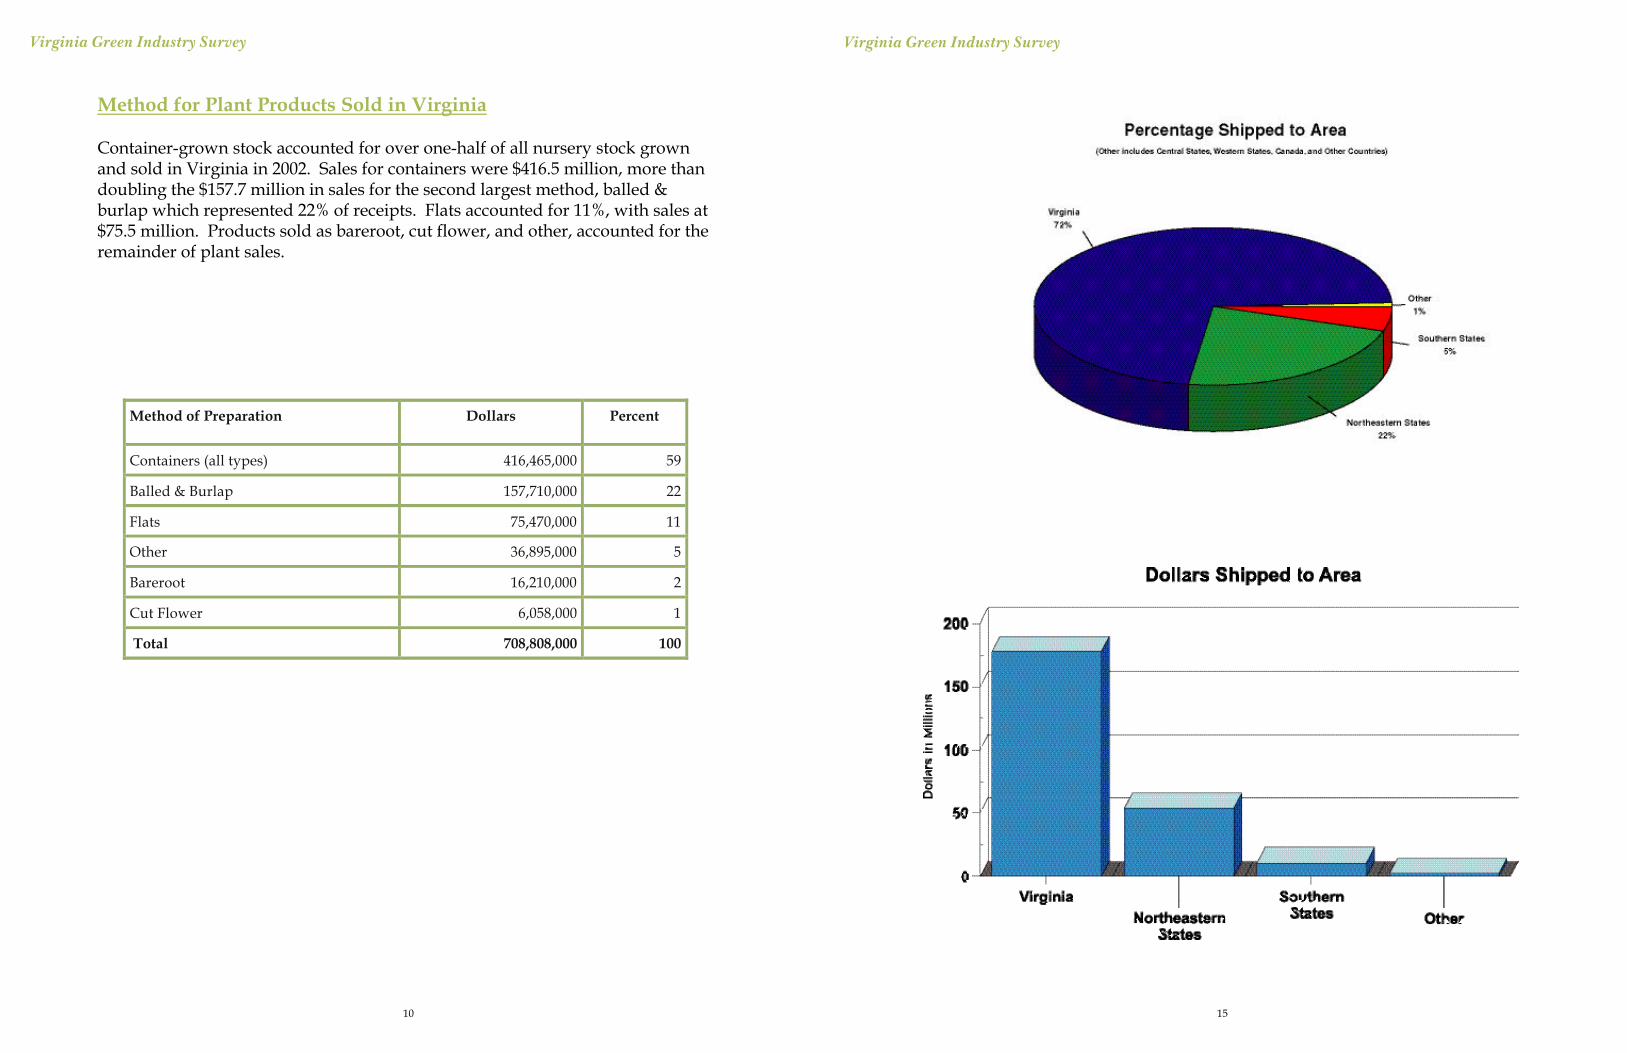
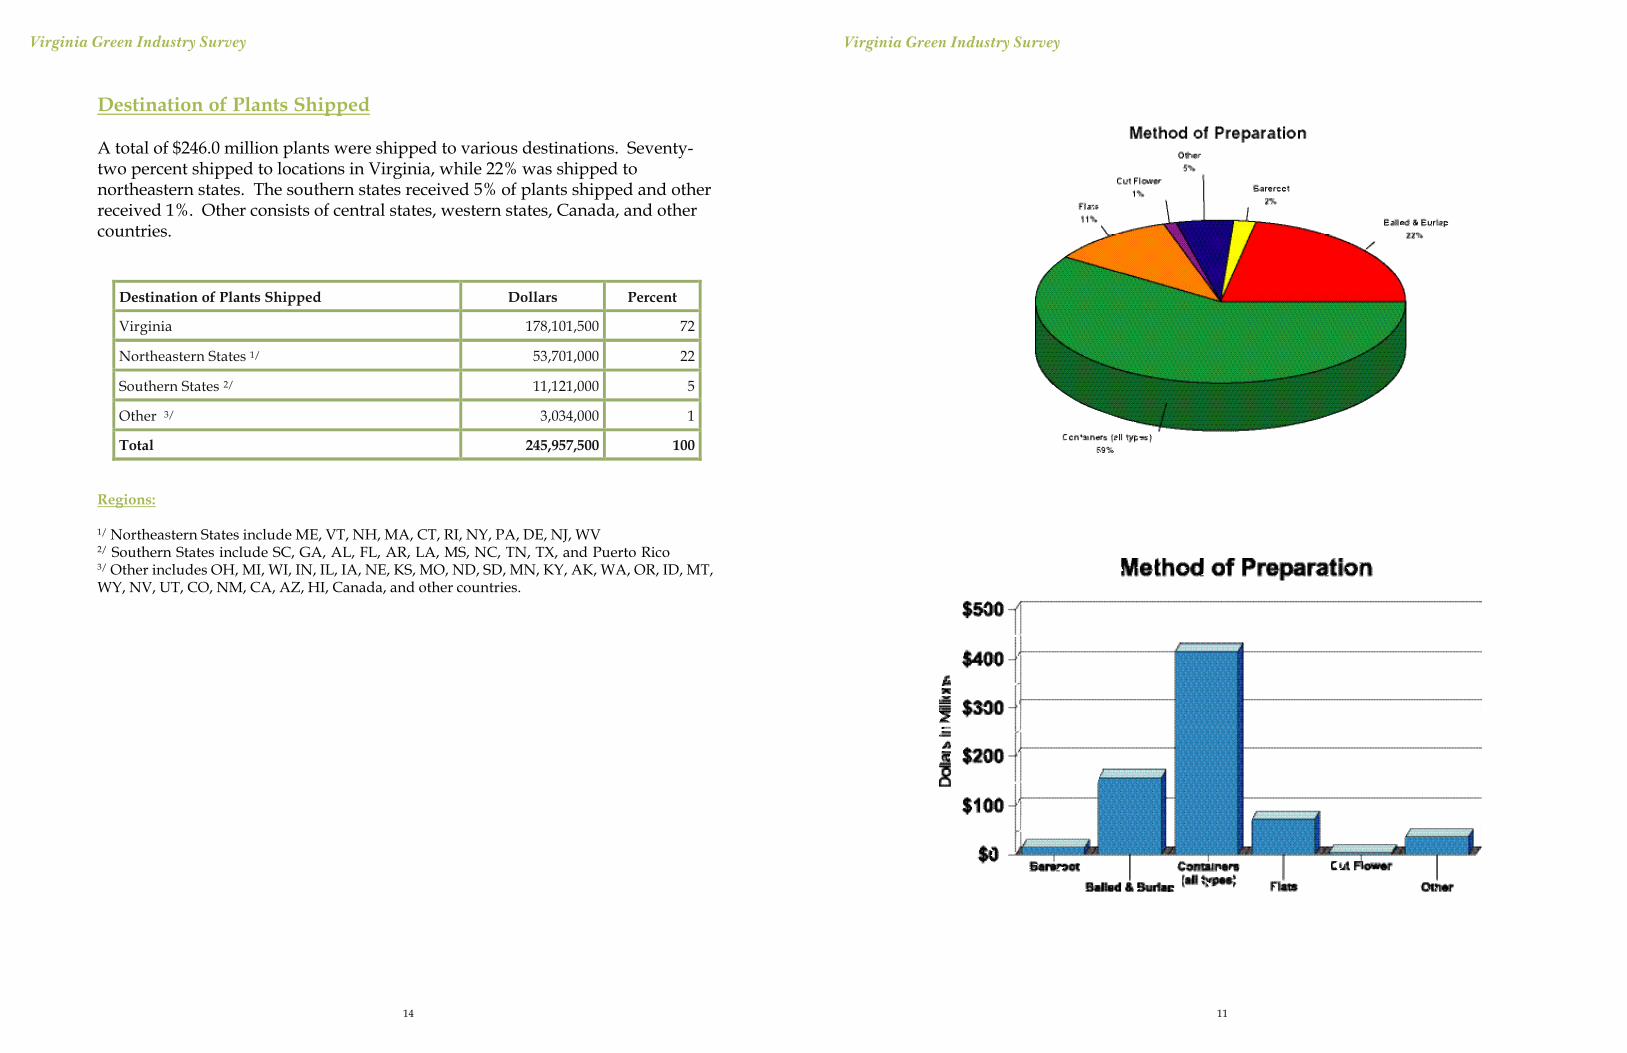
Method for Plant Products Sold in Virginia
Container-grown stock accounted for over one-half of all nursery stock grownand sold in Virginia in 2002. Sales for containers were $416.5 million, more thandoubling the $157.7 million in sales for the second largest method, balled &burlap which represented 22% of receipts. Flats accounted for 11%, with sales at$75.5 million. Products sold as bareroot, cut flower, and other, accounted for theremainder of plant sales.
Method of Preparation Dollars Percent
Containers (all types) 416,465,000 59
Balled & Burlap 157,710,000 22
Flats 75,470,000 11
Other 36,895,000 5
Bareroot 16,210,000 2
Cut Flower 6,058,000 1
Total 708,808,000 100
15
Virginia Green Industry Survey Virginia Green Industry Survey
1114
Destination of Plants Shipped
A total of $246.0 million plants were shipped to various destinations. Seventy-two percent shipped to locations in Virginia, while 22% was shipped tonortheastern states. The southern states received 5% of plants shipped and otherreceived 1%. Other consists of central states, western states, Canada, and othercountries.
Regions:
1/ Northeastern States include ME, VT, NH, MA, CT, RI, NY, PA, DE, NJ, WV2/ Southern States include SC, GA, AL, FL, AR, LA, MS, NC, TN, TX, and Puerto Rico3/ Other includes OH, MI, WI, IN, IL, IA, NE, KS, MO, ND, SD, MN, KY, AK, WA, OR, ID, MT,WY, NV, UT, CO, NM, CA, AZ, HI, Canada, and other countries.
Destination of Plants Shipped Dollars Percent
Virginia 178,101,500 72
Northeastern States 1/ 53,701,000 22
Southern States 2/ 11,121,000 5
Other 3/ 3,034,000 1
Total 245,957,500 100
Virginia Green Industry Survey Virginia Green Industry Survey
12
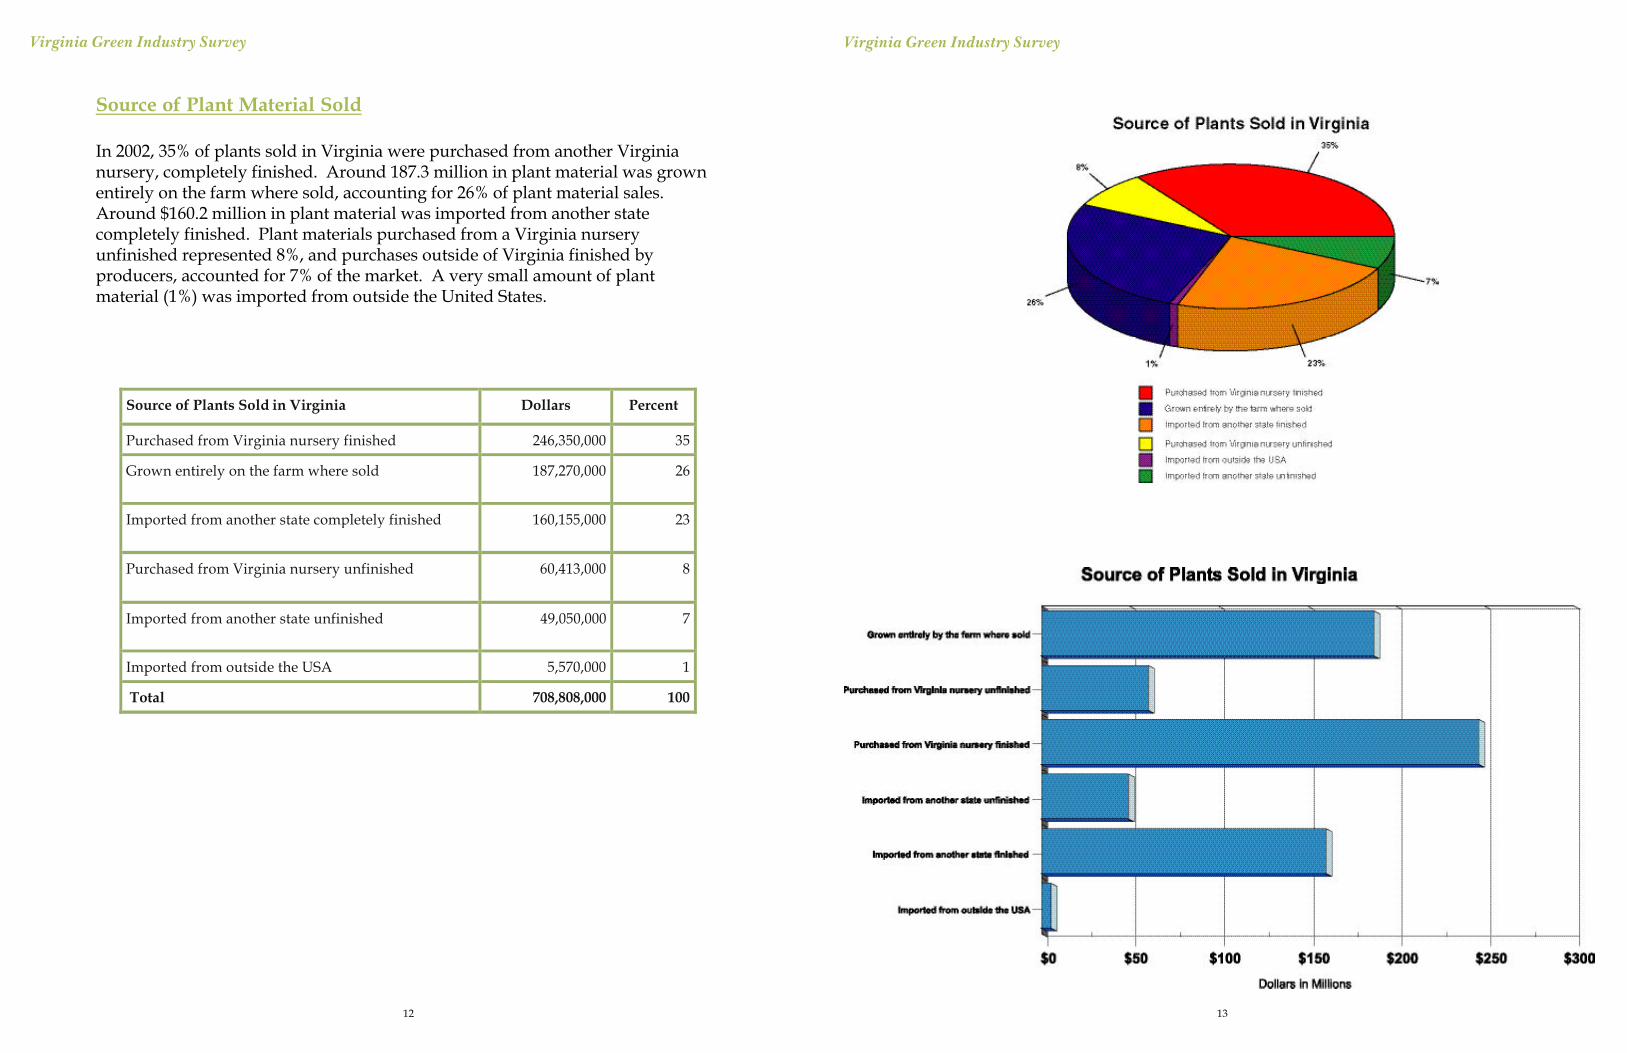
Source of Plant Material Sold
In 2002, 35% of plants sold in Virginia were purchased from another Virginianursery, completely finished. Around 187.3 million in plant material was grownentirely on the farm where sold, accounting for 26% of plant material sales.Around $160.2 million in plant material was imported from another statecompletely finished. Plant materials purchased from a Virginia nurseryunfinished represented 8%, and purchases outside of Virginia finished byproducers, accounted for 7% of the market. A very small amount of plantmaterial (1%) was imported from outside the United States.
Source of Plants Sold in Virginia Dollars Percent
Purchased from Virginia nursery finished 246,350,000 35
Grown entirely on the farm where sold 187,270,000 26
Imported from another state completely finished 160,155,000 23
Purchased from Virginia nursery unfinished 60,413,000 8
Imported from another state unfinished 49,050,000 7
Imported from outside the USA 5,570,000 1
Total 708,808,000 100
13