Embed Size (px)
Citation preview
Virginia Transportation Research Council, 530 Edgemont Road,Charlottesville, VA 22903-2454, www.vtrc.net, (434) 293 -1900
http://www.virginiadot.org/vtrc/main/online_reports/pdf/09-r23.pdf
Final Report VTRC 09-R23
research reportEvaluation
of Retroreflective Materialon Stop Sign Posts in Virginia
Virginia Transportation Research Council
LANCE E. DOUGALDAssociate Research Scientist
BENJAMIN H. COTTRELL, Jr., P.E.Associate Principal Research Scientist
Standard Title Page—Report on State Project Type Report: Final
Project No.: 90441
Report No.: VTRC 09-R23
Report Date: June 2009
No. Pages: 35
Period Covered:
Contract No.:
Title: Evaluation of Retroreflective Material on Stop Sign Posts in Virginia Author(s): Benjamin H. Cottrell, Jr., P.E., and Lance E. Dougald Performing Organization Name and Address: Virginia Transportation Research Council 530 Edgemont Road Charlottesville, VA 22903
Key Words: Stop Sign Posts Retroreflectivity Driver Compliance Visibility
Sponsoring Agencies’ Name and Address: Virginia Department of Transportation 1401 E. Broad Street Richmond, VA 23219
Supplementary Notes: This project was financed with state funds at an estimated cost of $66,228. Abstract: The 2003 Manual on Uniform Traffic Control Devices (MUTCD) provides departments of transportation (DOTs) the option of using retroreflective material on sign posts when the DOTs determine that there is a need to draw attention to the sign, especially at night. The MUTCD also provides standards for the design of these materials on the posts. The material must be at least 2 inches wide and must be placed the full length of the post from the sign to within 2 feet above the edge of the roadway. In addition, the color of the material must match the background color of the sign except that the color of the strip for “yield” and “do not enter” signs must be red. In response to receiving information about states that use retroreflective material on sign posts, Senator George L. Barker introduced Senate Joint Resolution (SJR) 119, co-sponsored with Senator Kenneth T. Cuccinelli, in the Virginia General Assembly. SJR 119 directed that the Virginia Department of Transportation (VDOT) study the feasibility, costs, and benefits of applying retroreflective material to stop sign posts statewide. The original bill was amended to add yield signs. Although the bill did not pass, the Virginia Transportation Research Council agreed to conduct this study, limiting the scope to stop signs.
The purpose of this study was to evaluate the effectiveness of retroreflective material on stop sign posts in Virginia with respect to visibility and driver compliance at the stop sign. The investigation included a review of the feasibility, costs, and benefits of this application. In addition, a review of practices by other localities and DOTs was performed and field studies were conducted to examine visibility and driver compliance. Key findings included:
• Very few state DOTs apply retroreflective panels on stop signs. • A video-based survey revealed that stop sign posts without the retroreflective panels are detected earlier
and seen more clearly during the day than posts with the panels. Conversely, stop sign posts with the retroreflective panels are detected earlier and seen more clearly at night than stop sign posts without the panels
• There is no difference in driver compliance for a stop sign with or without a retroreflective panel during the day or night.
• Retroreflective panels have only a minor impact on mean vehicle speeds as vehicles approach stop signs.
• The cost of adding and maintaining retroreflective panels on stop signs statewide is estimated at $1.186 million annually.

FINAL REPORT
EVALUATION OF RETROREFLECTIVE MATERIAL ON STOP SIGN POSTS IN VIRGINIA
Benjamin H. Cottrell, Jr., P.E. Associate Principal Research Scientist
Lance E. Dougald
Associate Research Scientist
Virginia Transportation Research Council (A partnership of the Virginia Department of Transportation
and the University of Virginia since 1948)
Charlottesville, Virginia
June 2009 VTRC 09-R23
ii
DISCLAIMER
The contents of this report reflect the views of the authors, who are responsible for the facts and the accuracy of the data presented herein. The contents do not necessarily reflect the official views or policies of the Virginia Department of Transportation, the Commonwealth Transportation Board, or the Federal Highway Administration. This report does not constitute a standard, specification, or regulation. Any inclusion of manufacturer names, trade names, or trademarks is for identification purposes only and is not to be considered an endorsement.
Copyright 2009 by the Commonwealth of Virginia. All rights reserved.

iii
ABSTRACT The 2003 Manual on Uniform Traffic Control Devices (MUTCD) provides departments of transportation (DOTs) the option of using retroreflective material on sign posts when the DOTs determine that there is a need to draw attention to the sign, especially at night. The MUTCD also provides standards for the design of these materials on the posts. The material must be at least 2 inches wide and must be placed the full length of the post from the sign to within 2 feet above the edge of the roadway. In addition, the color of the material must match the background color of the sign except that the color of the strip for “yield” and “do not enter” signs must be red. In response to receiving information about states that use retroreflective material on sign posts, Senator George L. Barker introduced Senate Joint Resolution (SJR) 119, co-sponsored with Senator Kenneth T. Cuccinelli, in the Virginia General Assembly. SJR 119 directed that the Virginia Department of Transportation (VDOT) study the feasibility, costs, and benefits of applying retroreflective material to stop sign posts statewide. The original bill was amended to add yield signs. Although the bill did not pass, the Virginia Transportation Research Council agreed to conduct this study, limiting the scope to stop signs.
The purpose of this study was to evaluate the effectiveness of retroreflective material on stop sign posts in Virginia with respect to visibility and driver compliance at the stop sign. The investigation included a review of the feasibility, costs, and benefits of this application. In addition, a review of practices by other localities and DOTs was performed and field studies were conducted to examine visibility and driver compliance. Key findings included:
• Very few state DOTs apply retroreflective panels on stop signs. • A video-based survey revealed that stop sign posts without the retroreflective panels
are detected earlier and seen more clearly during the day than posts with the panels. Conversely, stop sign posts with the retroreflective panels are detected earlier and seen more clearly at night than stop sign posts without the panels
• There is no difference in driver compliance for a stop sign with or without a retroreflective panel during the day or night.
• Retroreflective panels have only a minor impact on mean vehicle speeds as vehicles approach stop signs.
• The cost of adding and maintaining retroreflective panels on stop signs statewide is estimated at $1.186 million annually.
FINAL REPORT
EVALUATION OF RETROREFLECTIVE MATERIAL ON STOP SIGN POSTS IN VIRGINIA
Benjamin H. Cottrell, Jr., P.E.
Associate Principal Research Scientist
Lance E. Dougald Associate Research Scientist
INTRODUCTION
The 2003 Manual on Uniform Traffic Control Devices (MUTCD) provides departments of transportation (DOTs) the option of using retroreflective material on sign posts when the DOTs determine that there is a need to draw attention to the sign, especially at night.1 The MUTCD also provides standards for the design of these materials on the posts. The material must be at least 2 inches wide and must be placed the full length of the post from the sign to within 2 feet above the edge of the roadway. In addition, the color of the material must match the background color of the sign except that the color of the strip for “yield” and “do not enter” signs must be red. The MUTCD also addresses the use of retroreflective material on sign posts at highway-rail grade crossings. According to Federal Highway Administration (FHWA) staff responsible for the MUTCD, this option of retroreflective material on sign posts for regulatory and warning signs was added as an outgrowth of the research that evaluated similar treatments at highway-rail grade crossings.2 Although the overall focus of the highway rail-grade crossings research was aimed at gaining compliance for drivers to yield to trains at passive crossings, general findings could be applied to other types of signs. One such finding was that the mounting height of a sign might not make the best use of the vehicle’s headlight beam. In addition, the research showed that extending the retroreflective strip to within 2 feet of the ground line serves visually to stabilize the sign and tie it to the ground, providing a reference point when initial detection occurs. In response to receiving information about states that use retroreflective material on sign posts, Senator George L. Barker introduced Senate Joint Resolution (SJR) 119, co-sponsored with Senator Kenneth T. Cuccinelli, in the Virginia General Assembly. SJR 119, provided in Appendix A, requested that the Virginia Department of Transportation (VDOT) study the feasibility, costs, and benefits of applying retroreflective material to stop sign posts statewide. The original bill was amended to add yield signs. Although the bill did not pass, the Virginia Transportation Research Council (VTRC) agreed to conduct this study, limiting the scope to stop signs.
2
PURPOSE AND SCOPE
The purpose of this study was to evaluate the effectiveness of retroreflective material on stop sign posts in Virginia with respect to visibility and driver compliance at the stop sign. The investigation included a review of the feasibility, costs, and benefits of this application. In addition, a review of practices by other localities and DOTs was performed and field studies were conducted to examine visibility and driver compliance. A technical review panel that included VDOT staff and Senator Barker was created to participate in this effort.
METHODS
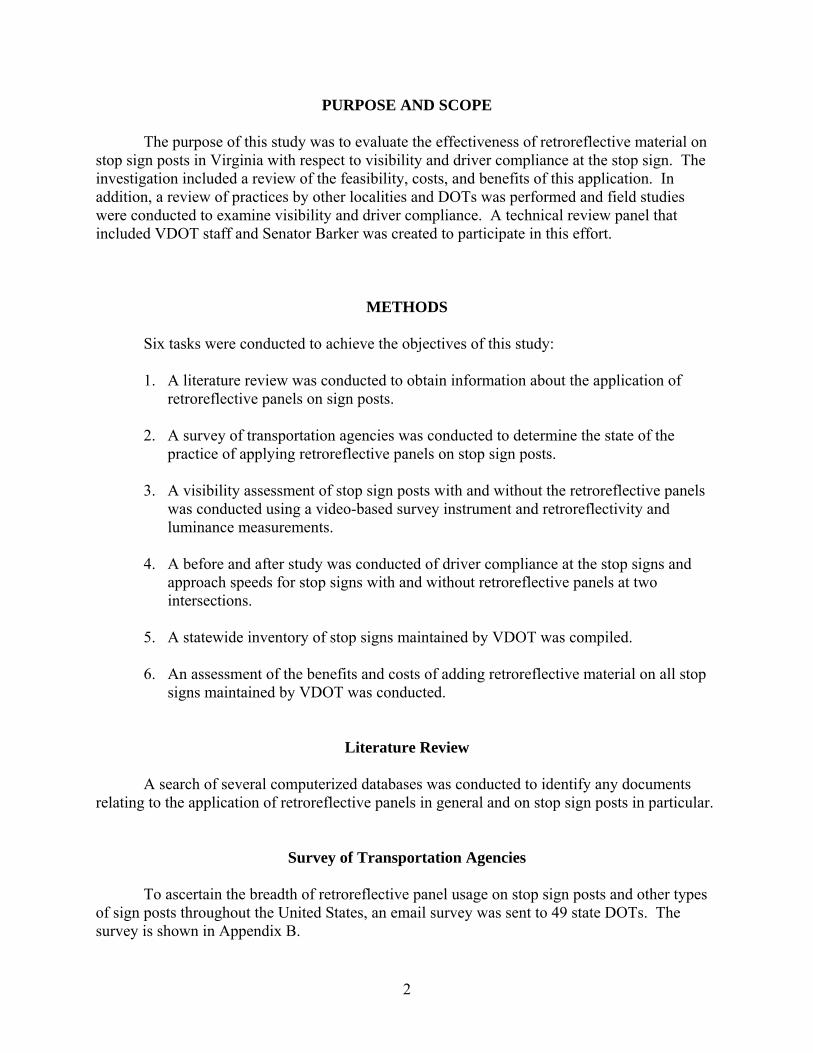
Six tasks were conducted to achieve the objectives of this study:
1. A literature review was conducted to obtain information about the application of
retroreflective panels on sign posts. 2. A survey of transportation agencies was conducted to determine the state of the
practice of applying retroreflective panels on stop sign posts.
3. A visibility assessment of stop sign posts with and without the retroreflective panels was conducted using a video-based survey instrument and retroreflectivity and luminance measurements.
4. A before and after study was conducted of driver compliance at the stop signs and
approach speeds for stop signs with and without retroreflective panels at two intersections.
5. A statewide inventory of stop signs maintained by VDOT was compiled.
6. An assessment of the benefits and costs of adding retroreflective material on all stop
signs maintained by VDOT was conducted.
Literature Review
A search of several computerized databases was conducted to identify any documents relating to the application of retroreflective panels in general and on stop sign posts in particular.
Survey of Transportation Agencies
To ascertain the breadth of retroreflective panel usage on stop sign posts and other types of sign posts throughout the United States, an email survey was sent to 49 state DOTs. The survey is shown in Appendix B.
3
Information requested in the survey for those states that used retroreflective panels included:
• application date for the program of using panels • policies/guidelines for the use of retroreflective panels • phase-in strategy (time period and approach for installing the panels to comply with
the policy) • number of signs with panels to date • color of panels (and panel size) • cost of adding panels • effectiveness • studies/reports • informal feedback.
The results of the survey were compiled and analyzed.
Visibility Assessment of Retroreflective Panels Applied to Stop Sign Posts
A video-based survey was administered to measure subjectively the added value of the retroreflective panels by obtaining opinions/preferences on stop signs with and without retroreflective panels on the sign posts during day and night conditions. In addition, retroreflectivity readings and luminance measurements were made of the signs and panels.
Video-Based Survey
A video based survey was developed for the purpose of gauging opinions on stop signs with and without retroreflective panels on the sign posts. The survey pool consisted of employees and students at VTRC and the University of Virginia.
To develop the survey, the researchers used an experimental site in Louisa County. The
site consists of a roadway leading to a rest area that was never constructed and is currently closed to the public. The site was chosen because it has a long, straight, and level stretch of roadway (approximately 1,780 feet) as well as a large parking area. To develop the survey, two tests were conducted at two sites within the confines of the rest area. The first test involved driving a vehicle during daytime and nighttime hours along the long section of roadway toward a stop sign with and without a retroreflective panel on its post. To replicate an actual intersection, the stop sign was placed at the intersection of two roadway segments. The vehicle driven was equipped with a distance measuring instrument (DMI) and two video cameras. One camera was mounted near the driver’s eyes and was set to approximate the driver’s field of view. Another camera was mounted in the rear of the vehicle and was set to capture the DMI readings. Four scenarios were evaluated and included the following:
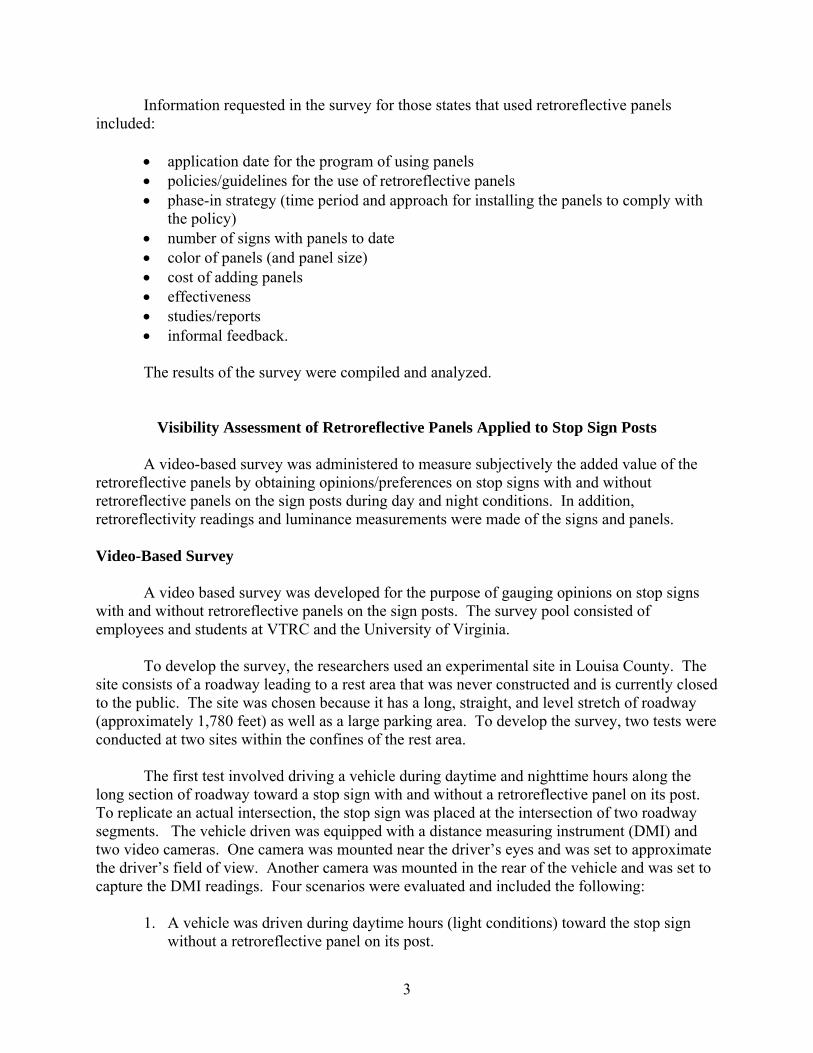
1. A vehicle was driven during daytime hours (light conditions) toward the stop sign without a retroreflective panel on its post.

4
2. A vehicle was driven during daytime hours toward a stop sign with a retroreflective panel on its post.
3. A vehicle was driven during nighttime hours (dark conditions) with low-beam headlights on toward the stop sign with a retroreflective panel on its post.
4. A vehicle was driven during nighttime hours with low-beam headlights on toward the stop sign without a retroreflective panel on its post.
Figure 1 shows the stop signs in each of the four scenarios.
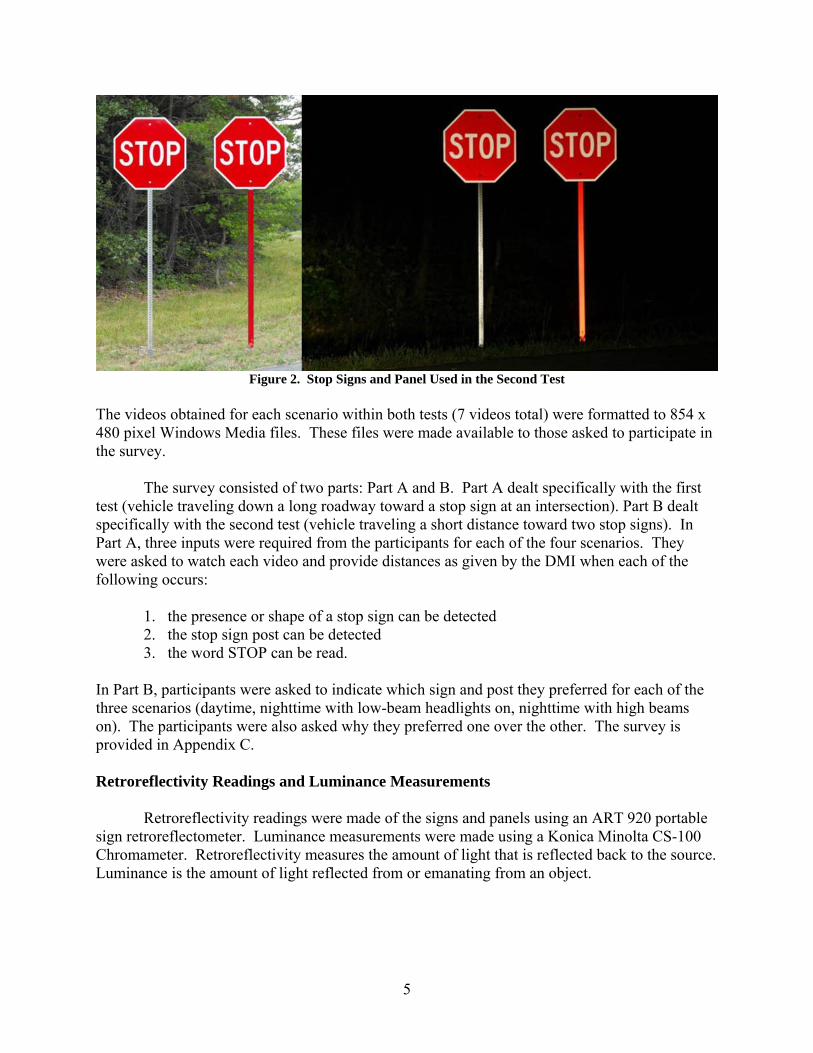
The second test used the large parking area at the rest area. For this test, a vehicle was driven toward two stop signs placed side by side; one with a retroreflective panel and one without. As in the case of the first test, the vehicle was equipped with a video camera that approximated the driver’s field of view. Because of the nature of this test, the DMI was not used. The vehicle was driven toward the stop signs during daytime and nighttime hours. Figure 2 shows the stop signs in light and dark conditions. Three scenarios were tested:
1. A vehicle was driven a short distance toward the stop signs during daytime hours
(light conditions). 2. A vehicle was driven a short distance toward the stop signs during nighttime hours
(dark conditions) with low-beam headlights on. 3. A vehicle was driven a short distance toward the stop signs during nighttime hours
with high-beam headlights on.
Figure 1. Stop Sign and Panel Used for the Four Scenarios in the First Test
5
Figure 2. Stop Signs and Panel Used in the Second Test
The videos obtained for each scenario within both tests (7 videos total) were formatted to 854 x 480 pixel Windows Media files. These files were made available to those asked to participate in the survey.
The survey consisted of two parts: Part A and B. Part A dealt specifically with the first
test (vehicle traveling down a long roadway toward a stop sign at an intersection). Part B dealt specifically with the second test (vehicle traveling a short distance toward two stop signs). In Part A, three inputs were required from the participants for each of the four scenarios. They were asked to watch each video and provide distances as given by the DMI when each of the following occurs:
1. the presence or shape of a stop sign can be detected 2. the stop sign post can be detected 3. the word STOP can be read.
In Part B, participants were asked to indicate which sign and post they preferred for each of the three scenarios (daytime, nighttime with low-beam headlights on, nighttime with high beams on). The participants were also asked why they preferred one over the other. The survey is provided in Appendix C. Retroreflectivity Readings and Luminance Measurements
Retroreflectivity readings were made of the signs and panels using an ART 920 portable sign retroreflectometer. Luminance measurements were made using a Konica Minolta CS-100 Chromameter. Retroreflectivity measures the amount of light that is reflected back to the source. Luminance is the amount of light reflected from or emanating from an object.

6
Before and After Study of Driver Compliance and Approach Speeds
Before and after studies of driver compliance and approach speeds were conducted to determine if a retroreflective panel on a stop sign post influences driver compliance. These tests were conducted during day and night periods both before and after the application of the retroreflective panels.
Two intersections were selected for these studies. Criteria for selecting the sites included
one lane approaching the stop sign, two through lanes on the cross street, sufficient volume to facilitate the compliance study, good sight distance, and an area available to observe the motorists.
The first study site chosen was at the intersection of Four Seasons Drive and
Commonwealth Drive in Albemarle County. This is in a residential area near two subdivisions. The second study site chosen, also in Albemarle County, was at the intersection of Pepsi Place and Greenbrier Drive, a commercial area with access to a Pepsi plant, the rear of the main U.S. post office, a senior center, an office building, and an assisted living facility.
Prior to the driver compliance and speed studies, new signs were installed to ensure that
the panels would not be brighter or more retroreflective than the stop sign itself. The material for both the signs and panels was 3M High Intensity Prismatic sheeting. Driver Compliance Studies
For the driver compliance studies, data were collected in 90-minute sessions. Each
vehicle passing through the intersection on the subject approach was classified into one of three groups: (1) full or complete stop (wheels locked for at least an instant), (2) roll (vehicle slows down and continues past stop sign), and (3) run (vehicle passes the stop sign at speeds above 10 mph). Chi square tests were used to compare proportions of driver compliance with and without the retroreflective panel.3
Approach Speed Studies
For the approach speed studies, the speed of each vehicle as it progressed toward the stop
signs was collected. This was accomplished by an observer tracking vehicles with a light detection and ranging (LIDAR) gun. The LIDAR gun was connected to a laptop installed with a laser data transfer program. While a vehicle was tracked, its speed, range (distance from the LIDAR gun), and time (to the nearest 100th of a second) were recorded. The LIDAR gun has the capability of recording data approximately every 0.3 second.
At both sites, the observer was inconspicuously located upstream of the stop signs and
vehicles were tracked as they receded from the observer.
7
Statewide Inventory of Stop Signs Maintained by VDOT
A statewide inventory of stop signs maintained by VDOT was compiled. This task was done with assistance from the VDOT regional maintenance staff managers.
Assessment of Benefits and Costs of Adding Retroreflective Material on Stop Signs Maintained By VDOT
The installation and maintenance costs of adding retroreflective panels on VDOT-maintained stop sign posts were calculated. Life cycle costs were analyzed, and the benefits of adding retroreflective panels were estimated. Annual Costs
SJR 119 stated that the study must consider the life cycle costs of applying and maintaining retroreflective material to stop sign posts statewide. A simplified method for life cycle cost analysis was used. The total installation and maintenance cost was divided by the service life to obtain the life cycle or an annualized cost for the life of the panel. Technically, this simplified method addresses the intent of life cycle cost comprehensively to include all costs over the service life without adding the complexity and uncertainty of the time value of money. A number of estimates and assumptions was made. The installation cost per sign including material, labor, and equipment was estimated. The labor rate, equipment rate, and estimated travel time to each site were provided by residency staff. The service life of the retroreflective panels is based on the sheeting manufacturer’s warranty of 10 years, which is consistent with the service life of VDOT signs using the same sheeting material. Typically, maintenance costs for signs are minimal; however, vandalism may occur and sign knockdowns may occur because of vehicles making sharp turns. Therefore, the annual maintenance costs were assumed to be 2 percent over the 10-year service life based on information from the staff of one region.
Costs and Benefits Assessment
No data were available to estimate the quantifiable benefits of using the retroreflective panels; therefore, there is no established accident reduction factor for these devices. Rather than estimate such a factor, the approach used was to estimate the number of crashes that would result in costs higher than the cost of installing and maintaining the retroreflective panels. This was achieved by using an estimated average crash cost. A study by Ohio University8 included an estimated value for crash mitigation for stop and yield signs of $48,745 per crash. That value was also used in the assessment.
8
RESULTS
Literature Review
Investigation of Retroreflective Sign Materials at Passive Railroad Crossings
A VTRC report published in 19954 determined the best configuration of retroreflective
material on railroad crossing (crossbuck) signs and posts to improve visibility and safety at passive highway-railroad grade crossings at night. Several states, including Minnesota and Ohio, were using retroreflective material on the posts and backs of crossbucks at that time with the configuration varying from state to state. Subsequently, five configurations were evaluated in the study. The double-sided crossbuck with retroreflective material along the full length of both sides of the posts was the recommended configuration.
FHWA Low-Cost Safety Improvements Pooled Fund Study As part of the FHWA’s Low-Cost Safety Improvements Pooled Fund Study to evaluate the safety effectiveness of several strategies, three FHWA Techbriefs were published on strategies for stop sign controlled intersections. The first was Safety Evaluation of STOP AHEAD Pavement Markings.5 This study concluded that a conservative estimate of a 15.4 percent reduction in crashes can be expected with these markings and that they may be most effective at locations with a high frequency of right angle and rear-end collisions. The Techbrief Safety Evaluation of Increasing Retroreflectivity of STOP Signs6 concluded that minimal reduction in crashes can be expected with the installation of stop signs with a higher retroreflectivity (about 4.3% for angle crashes). Because of its low cost, the strategy has the potential to reduce crashes cost effectively, particularly at lower volume intersections. The third Techbrief, Safety Evaluation of Flashing Beacons at Stop-Controlled Intersections,7 concluded that flashing beacons at stop-controlled intersections can be a cost-effective improvement, particularly for the lower cost non-actuated installations. Further, it concluded that an expected reduction in angle crashes would be at least 4 percent with such treatments. The effect may be larger for stop-sign mounted beacons and may be most effective for rural intersections and locations with a high frequency of the targeted collisions (angle, rear-end, and injury). (There is some question as to whether this countermeasure is low cost.) Benefits of Reflectorized Sign Posts to Drivers
As part of the state DOT survey, a PowerPoint presentation on the benefits of reflectorized sign posts to drivers by Oner and Zwahlen (Ohio University) was identified.8 This presentation described a preliminary non-sponsored study of the potential benefits of reflectorized posts. The study addressed red reflectorized sign posts for “stop ahead,” “stop,” “yield,” and “do not enter” signs and yellow posts for chevron and large directional arrows. The applications of these signs with reflectorized posts are required by the Ohio DOT (ODOT) in its comprehensive safety plan.
9
The study found that more illumination and color are present on a sign with the application of 24 to 65 percent more retroreflective sheeting on its post. Higher illumination and color are a result of the additional sheeting being closer to the headlamp axis. From a human factors perspective, an additional benefit is the increased perceptual grounding effect; it appears that the sign is anchored to its environment, thus providing more accurate distance information.
A cost-benefit analysis was performed by estimating the number of signs statewide in Ohio, the initial and maintenance cost costs for the reflectorized posts, and the cost of related crashes. The initial cost per sign was $10 with a 15-year service life. With a total estimated installation cost of $593,560 and a cost per crash of $48,745, 12.18 crashes per year need to be prevented to break even. It was concluded that it is not possible with any degree of certainty to determine whether or not this program is cost-effective. Recommended future research included determination of the actual installation cost, a user acceptance survey, a comprehensive before-after crash analysis, and a human factors study to measure the effectiveness of the reflectorized posts.
Survey of State DOTs
Twenty-four of the 49 state DOTs responded to the survey, for a 49 percent response rate.
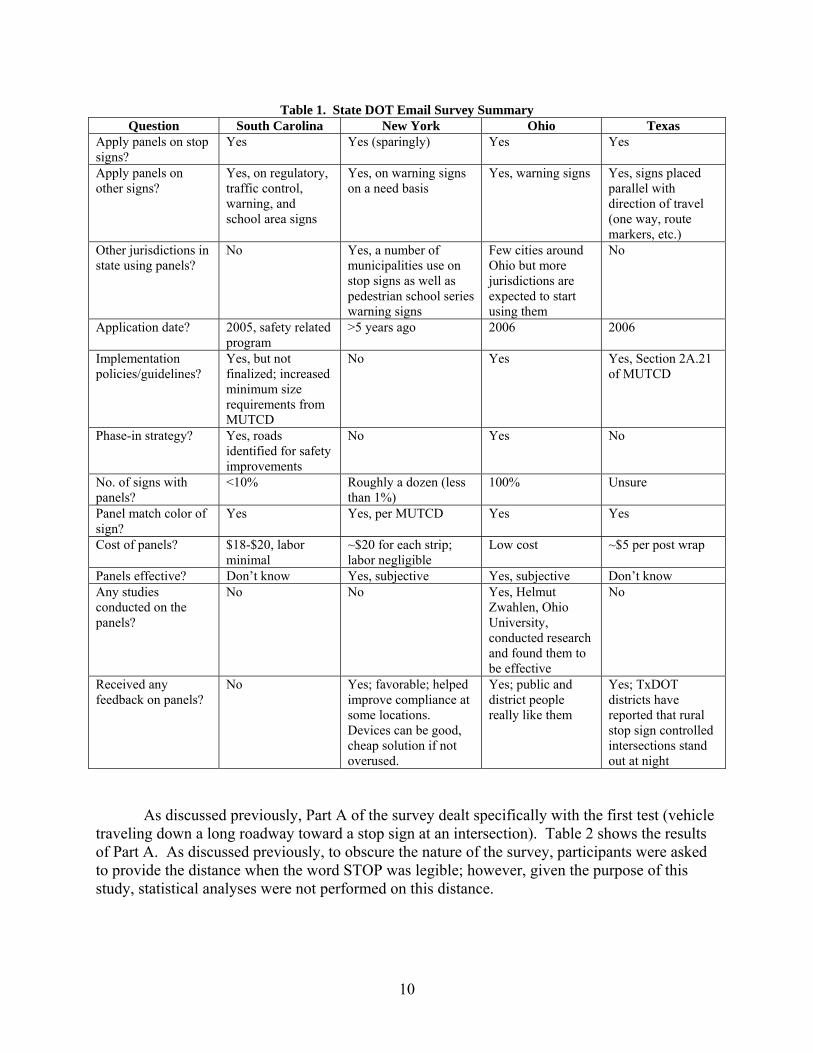
Of the 24 respondents, 4 states indicated they use retroreflective panels on stop signs: New York, Texas, South Carolina, and Ohio. Because of the potential negative impacts of overuse, New York, Texas, and South Carolina use the panels sparingly (1% to 10% of all stop signs) and typically apply them only at locations identified for safety improvements. Ohio uses retroreflective panels on all stop signs at state-maintained locations (100% of stop signs). No formal, published research had been conducted on the use of retroreflective panels; however, as previously discussed, unpublished research had been conducted by Ohio University.8 Table 1 summarizes the information from those DOTs that use the panels on stop signs.
In January 2006, ODOT required all stop, yield, and “do not enter” sign posts to be
reflectorized with red reflective sheeting material and all chevron, “stop ahead,” and one/two large directional arrow sign posts to be reflectorized with yellow reflective sheeting material as a part of the ODOT Comprehensive Highway Safety Plan.8 The vast majority of ODOT stop signs are on high-speed facilities. (Ohio is a home rule state so the cities take care of their own signs.) ODOT staff thought it critically important to make the stop signs as conspicuous as possible. Based on the low cost associated with adding retroreflective material to the sign posts, it was decided that all posts be reflectorized. ODOT has also dual-mounted all of the stop signs on high-speed approaches (as well as the “stop ahead” warning signs).9
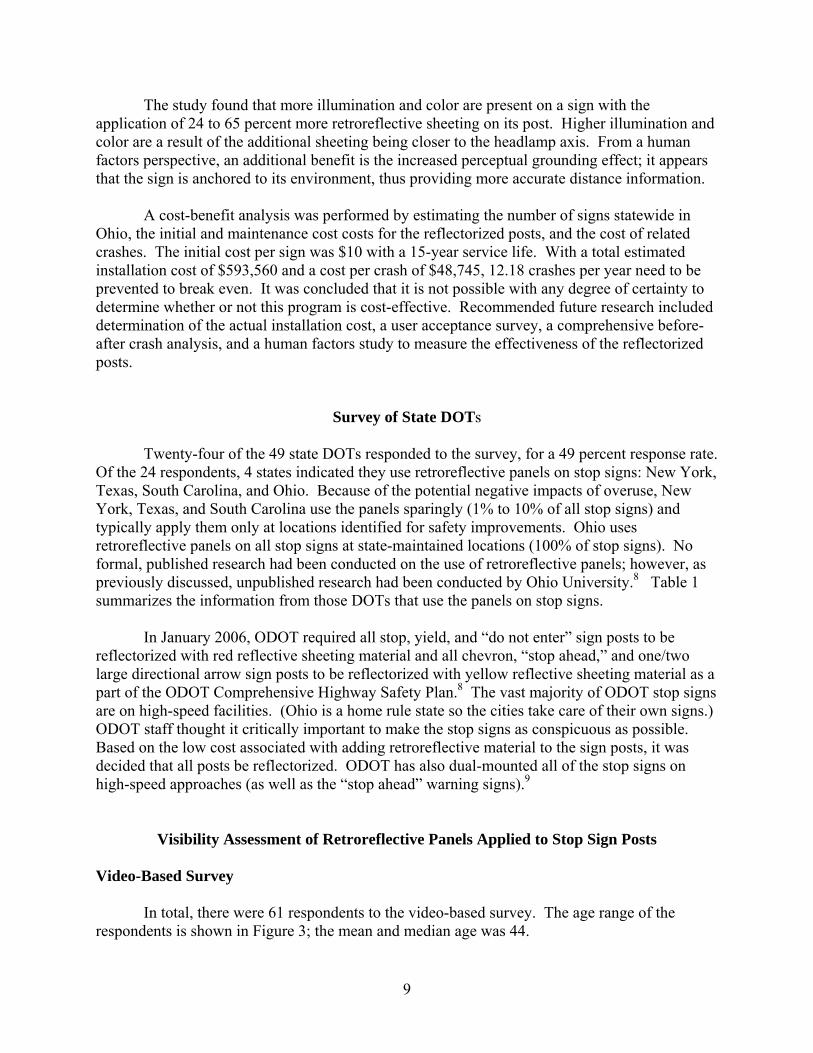
Visibility Assessment of Retroreflective Panels Applied to Stop Sign Posts Video-Based Survey In total, there were 61 respondents to the video-based survey. The age range of the respondents is shown in Figure 3; the mean and median age was 44.
10
As discussed previously, Part A of the survey dealt specifically with the first test (vehicle traveling down a long roadway toward a stop sign at an intersection). Table 2 shows the results of Part A. As discussed previously, to obscure the nature of the survey, participants were asked to provide the distance when the word STOP was legible; however, given the purpose of this study, statistical analyses were not performed on this distance.
Table 1. State DOT Email Survey Summary Question South Carolina New York Ohio Texas
Apply panels on stop signs?
Yes Yes (sparingly) Yes Yes
Apply panels on other signs?
Yes, on regulatory, traffic control, warning, and school area signs
Yes, on warning signs on a need basis
Yes, warning signs Yes, signs placed parallel with direction of travel (one way, route markers, etc.)
Other jurisdictions in state using panels?
No Yes, a number of municipalities use on stop signs as well as pedestrian school series warning signs
Few cities around Ohio but more jurisdictions are expected to start using them
No
Application date? 2005, safety related program
>5 years ago 2006 2006
Implementation policies/guidelines?
Yes, but not finalized; increased minimum size requirements from MUTCD
No Yes Yes, Section 2A.21 of MUTCD
Phase-in strategy? Yes, roads identified for safety improvements
No Yes No
No. of signs with panels?
<10% Roughly a dozen (less than 1%)
100% Unsure
Panel match color of sign?
Yes Yes, per MUTCD Yes Yes
Cost of panels? $18-$20, labor minimal
~$20 for each strip; labor negligible
Low cost ~$5 per post wrap
Panels effective? Don’t know Yes, subjective Yes, subjective Don’t know Any studies conducted on the panels?
No No Yes, Helmut Zwahlen, Ohio University, conducted research and found them to be effective
No
Received any feedback on panels?
No Yes; favorable; helped improve compliance at some locations. Devices can be good, cheap solution if not overused.
Yes; public and district people really like them
Yes; TxDOT districts have reported that rural stop sign controlled intersections stand out at night
11
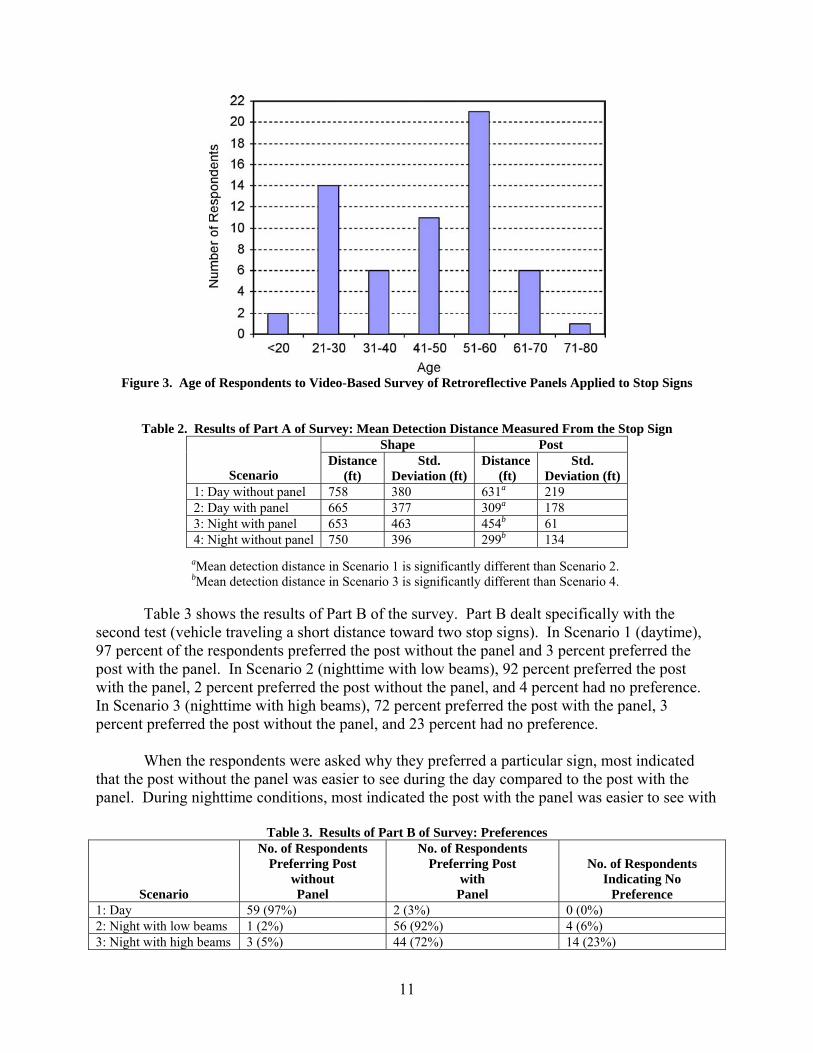
Figure 3. Age of Respondents to Video-Based Survey of Retroreflective Panels Applied to Stop Signs
Table 2. Results of Part A of Survey: Mean Detection Distance Measured From the Stop Sign
aMean detection distance in Scenario 1 is significantly different than Scenario 2. bMean detection distance in Scenario 3 is significantly different than Scenario 4.
Table 3 shows the results of Part B of the survey. Part B dealt specifically with the
second test (vehicle traveling a short distance toward two stop signs). In Scenario 1 (daytime), 97 percent of the respondents preferred the post without the panel and 3 percent preferred the post with the panel. In Scenario 2 (nighttime with low beams), 92 percent preferred the post with the panel, 2 percent preferred the post without the panel, and 4 percent had no preference. In Scenario 3 (nighttime with high beams), 72 percent preferred the post with the panel, 3 percent preferred the post without the panel, and 23 percent had no preference.
When the respondents were asked why they preferred a particular sign, most indicated
that the post without the panel was easier to see during the day compared to the post with the panel. During nighttime conditions, most indicated the post with the panel was easier to see with
Table 3. Results of Part B of Survey: Preferences
Scenario
No. of Respondents Preferring Post
without Panel
No. of Respondents Preferring Post
with Panel
No. of Respondents
Indicating No Preference
1: Day 59 (97%) 2 (3%) 0 (0%) 2: Night with low beams 1 (2%) 56 (92%) 4 (6%) 3: Night with high beams 3 (5%) 44 (72%) 14 (23%)
Shape Post
Scenario Distance
(ft) Std.
Deviation (ft) Distance
(ft) Std.
Deviation (ft) 1: Day without panel 758 380 631a 219 2: Day with panel 665 377 309a 178 3: Night with panel 653 463 454b 61 4: Night without panel 750 396 299b 134
12
low beams and high beams compared to the post without the panel. A higher number of respondents indicated “no preference” in Scenario 3 (as compared to Scenarios 1 and 2) because it was felt that both posts produced similar reflection when the vehicle progressed toward the stop sign with high beams on. Retroreflectivity and Luminance
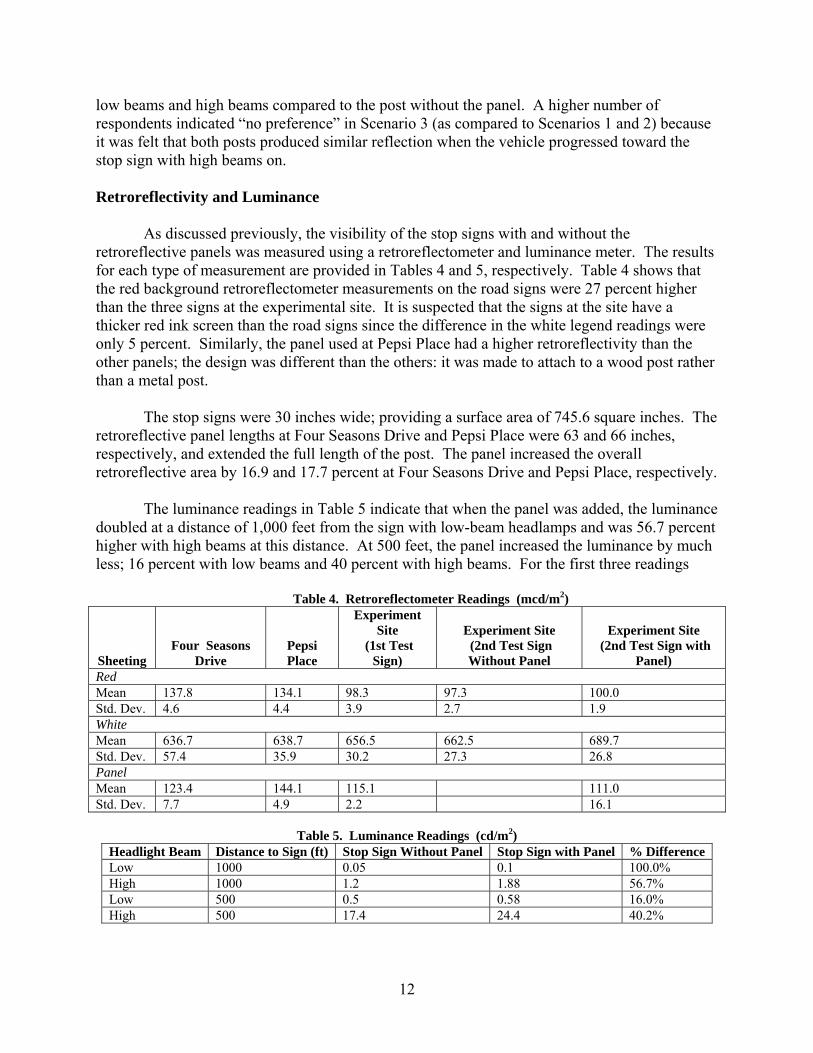
As discussed previously, the visibility of the stop signs with and without the retroreflective panels was measured using a retroreflectometer and luminance meter. The results for each type of measurement are provided in Tables 4 and 5, respectively. Table 4 shows that the red background retroreflectometer measurements on the road signs were 27 percent higher than the three signs at the experimental site. It is suspected that the signs at the site have a thicker red ink screen than the road signs since the difference in the white legend readings were only 5 percent. Similarly, the panel used at Pepsi Place had a higher retroreflectivity than the other panels; the design was different than the others: it was made to attach to a wood post rather than a metal post.
The stop signs were 30 inches wide; providing a surface area of 745.6 square inches. The
retroreflective panel lengths at Four Seasons Drive and Pepsi Place were 63 and 66 inches, respectively, and extended the full length of the post. The panel increased the overall retroreflective area by 16.9 and 17.7 percent at Four Seasons Drive and Pepsi Place, respectively.
The luminance readings in Table 5 indicate that when the panel was added, the luminance
doubled at a distance of 1,000 feet from the sign with low-beam headlamps and was 56.7 percent higher with high beams at this distance. At 500 feet, the panel increased the luminance by much less; 16 percent with low beams and 40 percent with high beams. For the first three readings
Table 4. Retroreflectometer Readings (mcd/m2)
Sheeting
Four Seasons Drive
Pepsi Place
Experiment Site
(1st Test Sign)
Experiment Site (2nd Test Sign Without Panel
Experiment Site
(2nd Test Sign with Panel)
Red Mean 137.8 134.1 98.3 97.3 100.0 Std. Dev. 4.6 4.4 3.9 2.7 1.9 White Mean 636.7 638.7 656.5 662.5 689.7 Std. Dev. 57.4 35.9 30.2 27.3 26.8 Panel Mean 123.4 144.1 115.1 111.0 Std. Dev. 7.7 4.9 2.2 16.1
Table 5. Luminance Readings (cd/m2)
Headlight Beam Distance to Sign (ft) Stop Sign Without Panel Stop Sign with Panel % Difference Low 1000 0.05 0.1 100.0% High 1000 1.2 1.88 56.7% Low 500 0.5 0.58 16.0% High 500 17.4 24.4 40.2%
13
(low beam at 1,000 feet, high beams at 1,000 feet, low beams at 500 feet), the luminance was very low; therefore, a small increase yields a high percentage increase.
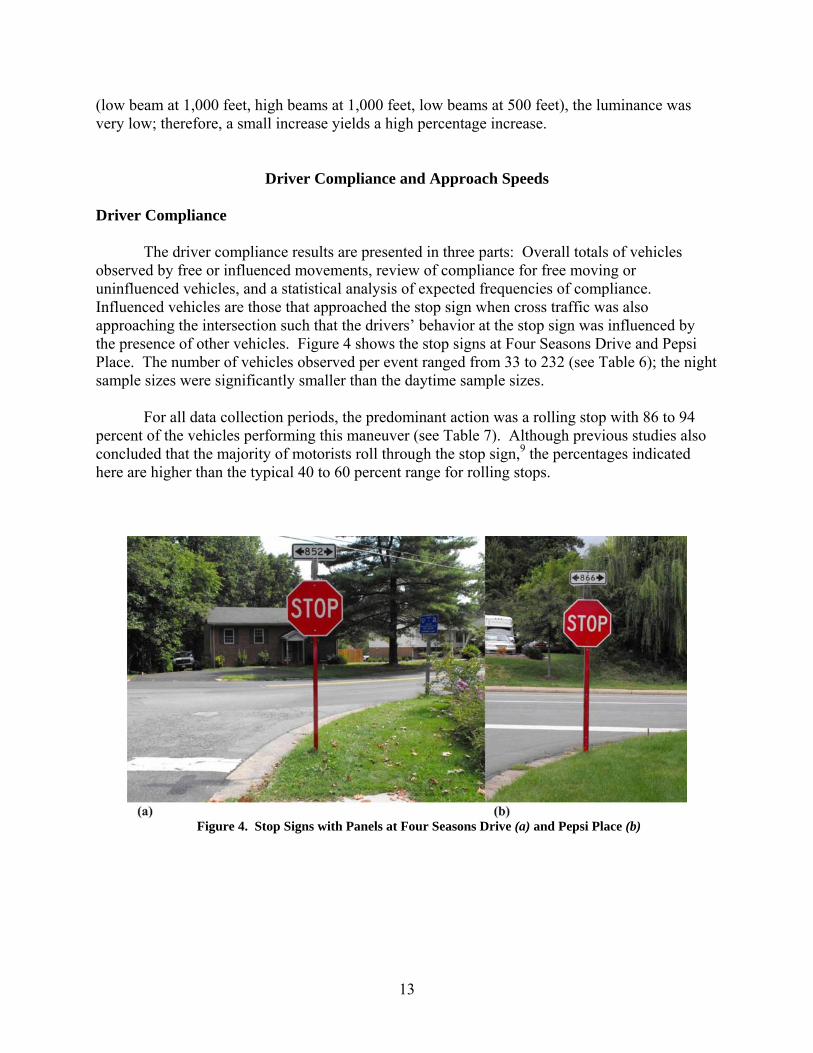
Driver Compliance and Approach Speeds Driver Compliance The driver compliance results are presented in three parts: Overall totals of vehicles observed by free or influenced movements, review of compliance for free moving or uninfluenced vehicles, and a statistical analysis of expected frequencies of compliance. Influenced vehicles are those that approached the stop sign when cross traffic was also approaching the intersection such that the drivers’ behavior at the stop sign was influenced by the presence of other vehicles. Figure 4 shows the stop signs at Four Seasons Drive and Pepsi Place. The number of vehicles observed per event ranged from 33 to 232 (see Table 6); the night sample sizes were significantly smaller than the daytime sample sizes.
For all data collection periods, the predominant action was a rolling stop with 86 to 94 percent of the vehicles performing this maneuver (see Table 7). Although previous studies also concluded that the majority of motorists roll through the stop sign,9 the percentages indicated here are higher than the typical 40 to 60 percent range for rolling stops.
Figure 4. Stop Signs with Panels at Four Seasons Drive (a) and Pepsi Place (b)
14
Table 6. Vehicles Observed for Driver Compliance Location/Time Total Free Total Influenced Total
Four Seasons Drive Day 86 (59%) 59 (41%) 145 Before Night 44 (69%) 20 (31%) 64 Day 98 (66%) 51 (34%) 149 After Night 67 (80%) 17 (20%) 84
Pepsi Place Before Day 87 (41%) 124 (59%) 211 Night 21 (64%) 12 (37%) 33 After Day 120 (52%) 112 (48%) 232 Night 68 (82%) 15 (18%) 83
Table 7. Driver Compliance for Free Moving Vehicles Location/Time Stop Roll Run
Four Seasons Drive Before Day 6 (7%) 76 (88%) 4 (5%) Night 3 (7%) 39 (89%) 2 (4%) After Day 2 (2%) 90 (92%) 6 (6%) Night 0 (0%) 61 (91%) 6 (9%) Pepsi Place Before Day 4 (5%) 81(93%) 2 (2%) Night 1 (5%) 18 (86%) 2 (9%) After Day 4 (3%) 112 (93%) 4 (3%) Night 3 (4%) 64 (94%) 1 (2%)
From the chi square test at an 0.05 level of significance (α = 0.05), it was determined that
there was no significant difference between driver compliance during the day or night, with or without the reflective panels, at either site. Approach Speeds
As previously discussed, individual vehicle speeds were obtained by an observer using a LIDAR gun as vehicles progressed toward the stop signs at the Four Seasons Drive / Commonwealth Drive and Pepsi Place / Greenbrier Drive intersections. The objective was to track vehicles in a free flow state (i.e., vehicles that were unimpeded by other vehicles) on their approach to the stop signs. Therefore, vehicles were not tracked if (1) it was determined that a leading vehicle was influencing the speed of a candidate vehicle and (2) if a vehicle or vehicles were queued at the stop signs thus potentially influencing the approach speed of a candidate vehicle.
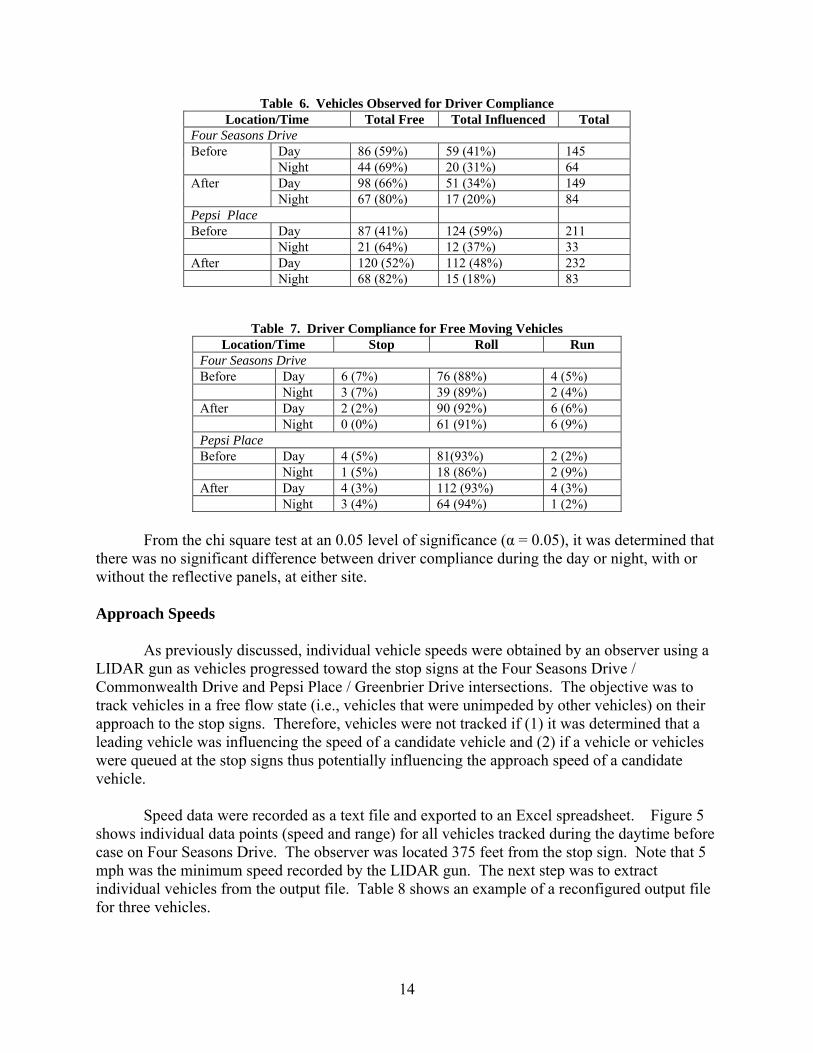
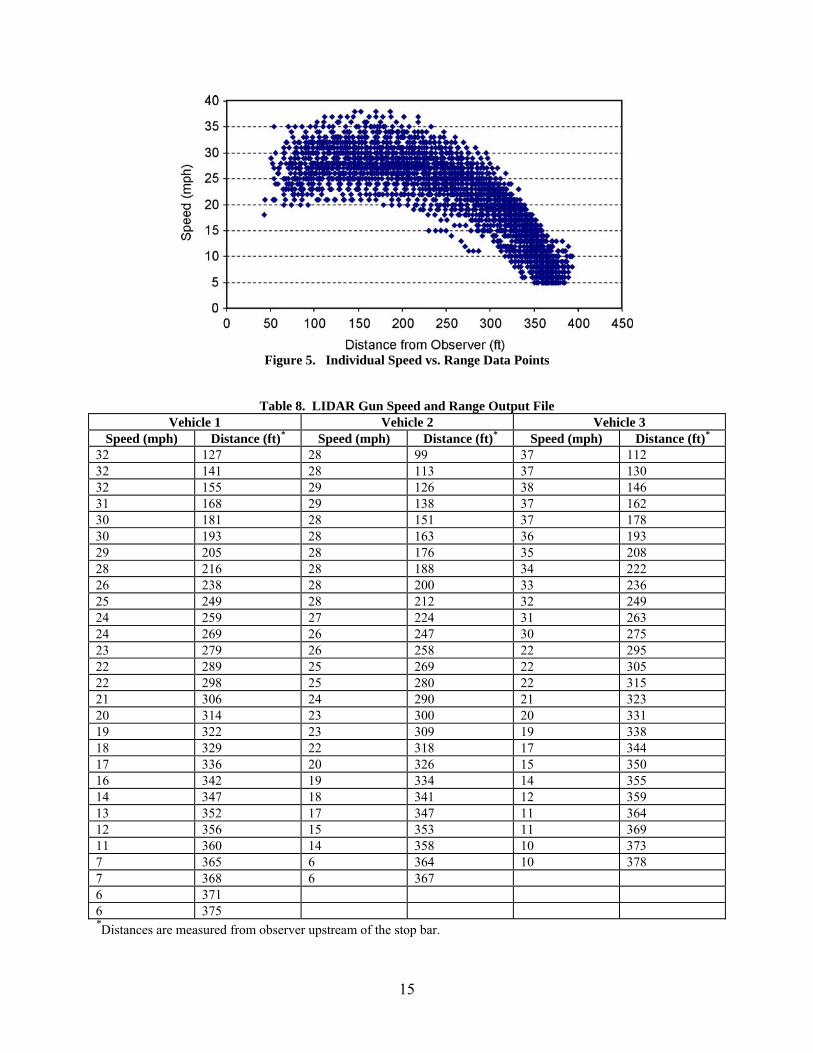
Speed data were recorded as a text file and exported to an Excel spreadsheet. Figure 5 shows individual data points (speed and range) for all vehicles tracked during the daytime before case on Four Seasons Drive. The observer was located 375 feet from the stop sign. Note that 5 mph was the minimum speed recorded by the LIDAR gun. The next step was to extract individual vehicles from the output file. Table 8 shows an example of a reconfigured output file for three vehicles.
15
Figure 5. Individual Speed vs. Range Data Points
Table 8. LIDAR Gun Speed and Range Output File Vehicle 1 Vehicle 2 Vehicle 3
Speed (mph) Distance (ft)* Speed (mph) Distance (ft)* Speed (mph) Distance (ft)*
32 127 28 99 37 112 32 141 28 113 37 130 32 155 29 126 38 146 31 168 29 138 37 162 30 181 28 151 37 178 30 193 28 163 36 193 29 205 28 176 35 208 28 216 28 188 34 222 26 238 28 200 33 236 25 249 28 212 32 249 24 259 27 224 31 263 24 269 26 247 30 275 23 279 26 258 22 295 22 289 25 269 22 305 22 298 25 280 22 315 21 306 24 290 21 323 20 314 23 300 20 331 19 322 23 309 19 338 18 329 22 318 17 344 17 336 20 326 15 350 16 342 19 334 14 355 14 347 18 341 12 359 13 352 17 347 11 364 12 356 15 353 11 369 11 360 14 358 10 373 7 365 6 364 10 378 7 368 6 367 6 371 6 375 *Distances are measured from observer upstream of the stop bar.
16
The raw data obtained in the field were then reduced to provide mean vehicle speeds in range bins. For Four Seasons Drive, the range bins were 0-25, 26-50, 51-100, 101-150, and 151-250 feet from the stop bar. For Pepsi Place, the range bins were 0-25, 26-50, 51-100, 101-150, and 151-200 feet from the stop bar. To allow for cleaner data representation and analyses, individual speeds were averaged within each range bin. Table 9 is an example of how this was accomplished for the same vehicles shown in Table 8.
Mean vehicle speeds per range bins were then averaged for all samples. For example, the mean speed of all three vehicles shown in Table 9, 250-151 feet from the stop sign would be:
mph6.313
3.361.285.30=
++
Table 9. Mean Vehicle Speeds (mph) per 100-ft Segment for Four Seasons Drive
Distance from Stop Bar (ft)
Vehicle 1
Vehicle 2
Vehicle 3
250-151 30.5 28.1 36.3 150-101 24.8 25.7 32.0 100-51 21.2 23.4 23.4 50-26 16.3 18.5 18.7 25-0 8.9 10.3 11.9
Four Seasons Drive Upon calculation of the mean speeds per range bin for each study case (day and night periods before and after application of retroreflective panel), plots were created for the purpose of identifying trends in mean speeds as vehicles approached the stop signs. Figure 6 shows the mean speed profiles for each study case. For the range bins of 250-151, 150-101, 100-51, 50-26, and 25-0 feet, the mean speeds during the daytime before period were 28.7, 25.8, 21.0, 15.4, and 9.6 mph, respectively. During the after period, the mean speeds were 28.6, 25.2, 20.6, 13.9, and 8.4 mph, respectively. Multiple comparison tests for all pair-wise differences between the before and after means for each range bin were conducted. In terms of significant differences, the tests at a 95 percent confidence interval (α = 0.05) indicated that in the 50-26 and 25-0 feet range bins, the before mean speeds (15.4 and 9.6 mph, respectively) differed significantly from the after mean speeds (13.9 and 8.4 mph, respectively). This finding indicates that during the daytime period, the retroreflective panel had a positive impact on speed reduction as vehicles approached the stop sign; however, the mean differences of 1.5 mph and 1.2 mph may be considered practically insignificant. No significant mean speed differences were found for the other range bins.
For the range bins of 250-151, 150-101, 100-51, 50-26, and 25-0 feet, the mean speeds for the nighttime “before” period were 27.8, 25.1, 20.5, 14.4, and 8.7 mph, respectively. During the “after” period, the mean speeds were 27.5, 25.4, 21.2, 15.2, and 8.9 mph, respectively. Multiple comparison tests for all pair-wise differences between the “before” and “after” means for each range bin were conducted and the results revealed that at a 95 percent confidence level, there were no statistically significant differences between the before/after mean speeds in any

17
Figure 6. Mean Speed Profiles for Four Seasons Drive
range bin. This finding indicates that the retroreflective panel had no impact on speed reduction as vehicles approached the stop sign during nighttime conditions. Detailed descriptive speed statistics at Four Seasons Drive can be found in Appendix D. Pepsi Place
Figure 7 shows the mean speed profiles for each study case at Pepsi Place (day and night periods before and after application of retroreflective panel). For the range bins of 200-151, 150-101, 100-51, 50-26, and 25-0, the mean speeds during the daytime before period were 21.9, 21.7, 18.3, 12.5, and 7.4 mph, respectively. During the after period, the mean speeds were 21.3, 21.0, 18.6, 14.5, and 8.6 mph, respectively. Multiple comparison tests at a 95 percent confidence interval indicated that the before mean speeds in the 50-26 and 25-0 range bins (12.5 and 7.4 mph, respectively) differed significantly from the after mean speeds (14.5 and 8.6 mph, respectively). This finding indicates that during the daytime period, the retroreflective panel had a negative impact on speed reduction as vehicles approached the stop sign (i.e., speeds were higher as vehicles approached the stop sign with the retroreflective panel); however the mean differences of 2.0 mph and 1.3 mph may be considered practically insignificant. No significant mean speed differences were found for the other range bins. For the same range bins the mean speeds for the nighttime before period were 18.3, 18.6, 17.2, 15.0, and 9.2 mph, respectively. During the after period, the mean speeds were 16.9, 17.8, 17.5, 15.2, and 9.5 mph, respectively. Multiple comparison tests for all pair-wise differences between the before and after means for each range bin were conducted and the results revealed
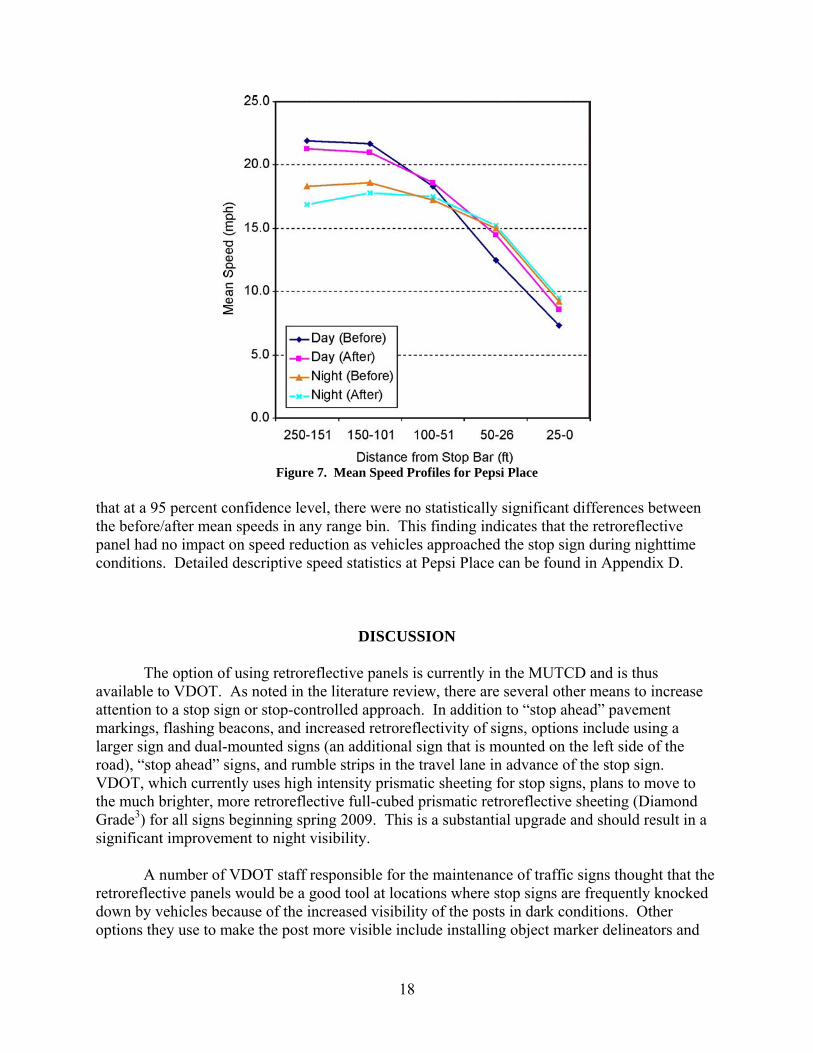
18
Figure 7. Mean Speed Profiles for Pepsi Place
that at a 95 percent confidence level, there were no statistically significant differences between the before/after mean speeds in any range bin. This finding indicates that the retroreflective panel had no impact on speed reduction as vehicles approached the stop sign during nighttime conditions. Detailed descriptive speed statistics at Pepsi Place can be found in Appendix D.
DISCUSSION
The option of using retroreflective panels is currently in the MUTCD and is thus
available to VDOT. As noted in the literature review, there are several other means to increase attention to a stop sign or stop-controlled approach. In addition to “stop ahead” pavement markings, flashing beacons, and increased retroreflectivity of signs, options include using a larger sign and dual-mounted signs (an additional sign that is mounted on the left side of the road), “stop ahead” signs, and rumble strips in the travel lane in advance of the stop sign. VDOT, which currently uses high intensity prismatic sheeting for stop signs, plans to move to the much brighter, more retroreflective full-cubed prismatic retroreflective sheeting (Diamond Grade3) for all signs beginning spring 2009. This is a substantial upgrade and should result in a significant improvement to night visibility.
A number of VDOT staff responsible for the maintenance of traffic signs thought that the
retroreflective panels would be a good tool at locations where stop signs are frequently knocked down by vehicles because of the increased visibility of the posts in dark conditions. Other options they use to make the post more visible include installing object marker delineators and
19
yellow retroreflective tubes in front of the stop signs. Another option where signs are frequently knocked down is to relocate the stop sign if feasible.
CONCLUSIONS
• Very few state DOTs apply retroreflective panels on stop signs. Those states that do tend to
use them sparingly and typically at locations identified for safety improvements (with the exception of Ohio, which uses them on 100% of their stop signs). The vast majority of ODOT stop signs are on high-speed facilities; therefore, staff thought it critically important to make the stop signs as conspicuous as possible. Based on the low cost associated with adding retroreflective material to sign posts, it was decided that all posts be reflectorized.
• Stop sign posts without the retroreflective panels are detected earlier and seen more clearly
during the day than posts with the panel. This is evidenced by (1) survey respondents indicating a greater detection distance from a stop sign without the panel versus the detection distance with the panel, and (2) a high number of survey respondents (97%) indicating that they preferred a stop sign post without the panel over a stop sign post with the panel because it can be seen more clearly.
• Stop sign posts with the retroreflective panel are detected earlier and seen more clearly at
night than a stop sign post without the panel. This is evidenced by (1) survey respondents indicating a greater detection distance from a stop sign with the panel versus the detection distance without the panel, and (2) a high number of survey respondents (92% for low beams and 72% for high beams) indicating that they preferred a stop sign post with the panel over a stop sign post without the panel because it can be seen more clearly.
• There is no difference in driver compliance between stop signs with and without a
retroreflective panel during the day and night. This is evidenced by a vast majority of drivers (85% or more) making a rolling stop with and without the retroreflective panel at the two intersections studied.
• The retroreflective panels have a minor impact on mean vehicle speeds as vehicles approach
stop signs. Although daytime mean speeds were significantly lower at Four Seasons Drive with the application of the retroreflective panel in the 50-26 and 25-0 foot range bins as compared to without the application, the mean differences of 1.5 mph and 1.2 mph, respectively, may be considered practically insignificant. In addition, the daytime results at Pepsi Place indicate that the application of the retroreflective panel had a negative impact on mean speeds in the 50-26 and 25-0 foot range bins (i.e., vehicle speeds were significantly higher in these range bins with the application of the retroreflective panel). As in the case of Four Seasons Drive, the mean speed differential in these range bins at Pepsi Place (2.0 and 1.3 mph, respectively) may be considered practically insignificant.
• The cost for adding retroreflective panels on stop signs statewide is roughly $1.186 million
annually. To be cost-effective statewide, it is estimated that at least 24.3 crashes need to be

20
reduced annually to recoup the cost for adding retroreflective panels on stop signs statewide. The benefit is difficult to estimate because accident reduction factors for retroreflective panels have not been developed.
• Several options for increasing attention to stop signs and stop-controlled intersections are
available. The options include “stop ahead” pavement markings, flashing beacons, stop bars, “stop ahead” signs, rumble strips, increased retroreflectivity, a larger sign, and dual-mounted signs (an additional sign that is mounted on the left side of the road).
COSTS AND BENEFITS ASSESSMENT
Estimated Number of Stop Signs Maintained by VDOT Statewide
Each VDOT regional maintenance manager was asked to provide stop sign inventory data. Their responses indicated that availability of this information is not consistent statewide. Three of the five regions have an inventory of stop signs on the interstate and primary highways. Some residencies have a stop sign inventory, but most do not and offered an estimate. The research team made some estimates where data were not available (one residency in the Northwest Region and the Central Region) based on the information from other residencies and regions. Table 10 presents the information obtained by region. Given these are estimates, it is suggested that 200,000 be used for the number of stop signs statewide.
Table 10. Inventory of Stop Signs by Region in Virginia
Highway System Southwest Northwest Eastern Northern Central Total Interstate 102 174 118 NA NA 394 Primary 378 213 109 NA NA 700 Secondary 2,9627 25,227 3,629 NA NA 58483 Total 30,107 25,614 3,856 95,000 45,000 199,577
NA: not available.
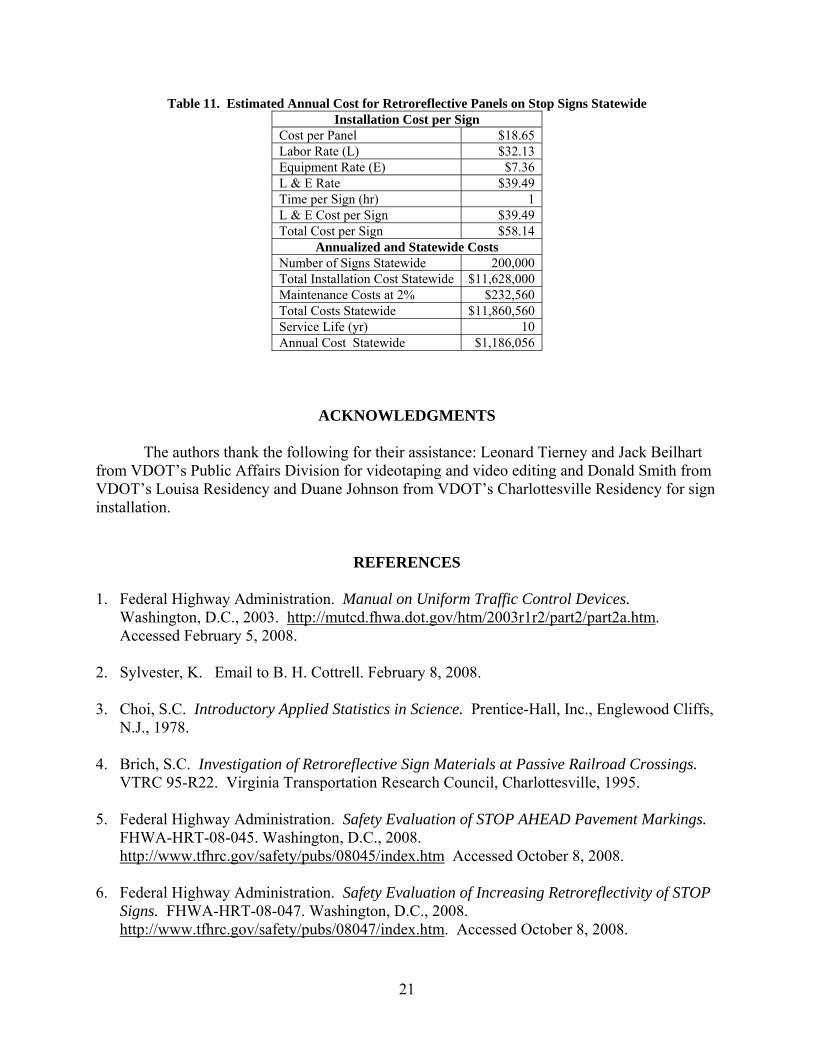
Annual Cost for Adding and Maintaining Retroreflective Panels on Stop Signs The total cost for adding and maintaining retroreflective panels on stop signs statewide is estimated at $11.86 million (see Table 11). Therefore, the annualized estimated cost for adding and maintaining retroreflective panels on stop signs statewide is $1.186 million.
Benefits Needed for Cost-Effectiveness
As stated previously, the approach used was to estimate the number of crashes that would result in costs higher than the cost of installing and maintaining the retroreflective panels. Ohio University’s study8 included an estimated value for crash mitigation for stop and yield signs of $48,745 per crash. That value was used in this analysis. It was found that to be cost-effective statewide in Virginia, at least 24.3 crashes need to be prevented annually over the 10-year service life of the panel.
21
Table 11. Estimated Annual Cost for Retroreflective Panels on Stop Signs Statewide Installation Cost per Sign
Cost per Panel $18.65 Labor Rate (L) $32.13 Equipment Rate (E) $7.36 L & E Rate $39.49 Time per Sign (hr) 1 L & E Cost per Sign $39.49 Total Cost per Sign $58.14
Annualized and Statewide Costs Number of Signs Statewide 200,000 Total Installation Cost Statewide $11,628,000 Maintenance Costs at 2% $232,560 Total Costs Statewide $11,860,560 Service Life (yr) 10 Annual Cost Statewide $1,186,056
ACKNOWLEDGMENTS
The authors thank the following for their assistance: Leonard Tierney and Jack Beilhart from VDOT’s Public Affairs Division for videotaping and video editing and Donald Smith from VDOT’s Louisa Residency and Duane Johnson from VDOT’s Charlottesville Residency for sign installation.
REFERENCES
1. Federal Highway Administration. Manual on Uniform Traffic Control Devices. Washington, D.C., 2003. http://mutcd.fhwa.dot.gov/htm/2003r1r2/part2/part2a.htm. Accessed February 5, 2008.
2. Sylvester, K. Email to B. H. Cottrell. February 8, 2008. 3. Choi, S.C. Introductory Applied Statistics in Science. Prentice-Hall, Inc., Englewood Cliffs,
N.J., 1978. 4. Brich, S.C. Investigation of Retroreflective Sign Materials at Passive Railroad Crossings.
VTRC 95-R22. Virginia Transportation Research Council, Charlottesville, 1995. 5. Federal Highway Administration. Safety Evaluation of STOP AHEAD Pavement Markings.
FHWA-HRT-08-045. Washington, D.C., 2008. http://www.tfhrc.gov/safety/pubs/08045/index.htm Accessed October 8, 2008.
6. Federal Highway Administration. Safety Evaluation of Increasing Retroreflectivity of STOP
Signs. FHWA-HRT-08-047. Washington, D.C., 2008. http://www.tfhrc.gov/safety/pubs/08047/index.htm. Accessed October 8, 2008.
22
7. Federal Highway Administration. Safety Evaluation of Flashing Beacons at Stop-Controlled Intersections. FHWA-HRT-08-048. Washington, D.C., 2008. http://www.tfhrc.gov/safety/pubs/08048/index.htm. Accessed October 8, 2008.
8. Oner, E., and Zwahlen, H.T. Benefits of Reflectorized Sign Posts to Drivers. Unpublished
document. Ohio University, Athens, 2007. 9. Holstein, D. Email B. H. Cottrell. August 1, 2008. 10. Cottrell, B.H. Using All-Way Stop Control for Residential Traffic Management. Virginia
Transportation Research Council, Charlottesville, 1996. http://www.virginiadot.org/vtrc/main/online_reports/pdf/96-R17.pdf Accessed October 14, 2008.
23
APPENDIX A
SENATE JOINT RESOLUTION NO. 119
Senate Amendments in [ ] -- January 29, 2008
Requesting the Department of Transportation to study the feasibility, costs, and benefits of applying retroreflective material to stop [ and yield ] sign posts statewide. Report.
---------- Patrons Prior to Engrossment—Senators Barker and Cuccinelli
---------- Unanimous consent to introduce
---------- Referred to Committee on Rules
----------
WHEREAS, the safety and security of the traveling public is of paramount importance to the Department of Transportation; and
WHEREAS, the Department of Transportation, in conjunction with other state transportation and safety agencies, continually strives to enhance the safety and security of motorists in Virginia; and
WHEREAS, retroreflective material, when applied to stop [and yield ] sign posts, may enhance the visibility and brightness of such signs for oncoming motorists, particularly during time periods when overall visibility is limited; and
WHEREAS, enhanced stop [ and yield ] sign visibility may help to reduce the likelihood of crashes at intersections where stop [ and yield ] signs are present; now, therefore, be it
RESOLVED by the Senate, the House of Delegates concurring, That the Department of Transportation be directed to study the feasibility, costs, and benefits of applying retroreflective material to stop [ and yield ] sign posts statewide.
In conducting its study, the Department of Transportation shall consider the lifecycle costs of applying and maintaining retroreflective material to stop [and yield] sign posts statewide, driver compliance with stop signs, the standards and guidelines contained in the federal Manual on Uniform Traffic Control Devices, and a literature review and survey of use and practices in other states.
All agencies of the Commonwealth shall provide assistance to the Department of Transportation for this study, upon request.
The Department of Transportation shall submit a report of its findings and recommendations to the Governor and the Chairmen of both the House and Senate Transportation Committees no later than November 30, 2008. The report shall be submitted as provided in the procedures of the

24
Division of Legislative Automated Systems for the processing of legislative documents and reports and shall be posted on the General Assembly's website: http://leg1.state.va.us/cgi-bin/legp504.exe?081+ful+SJ119E.

25
APPENDIX B
STATE DOT EMAIL SURVEY
1. Do you use retroreflective strips on stop sign posts? __yes __no 2. Do you use retroreflective strips on other types of sign posts? __yes __no 2a. If yes, for what types of signs? 3. Do you know of any other jurisdictions or states that use retroreflective strips on stop sign posts or other sign posts? If yes, please list them.
• If you answered yes to (1) above, please respond to questions X-X below. • If you answered yes to (2) above, please respond to questions X-X below. • If you answered no to both (1) and (2) above, thank you for your time. Please send your
responses back to surveyors. 4. When did you begin using the retroreflective material on stop sign posts? 5. Do you have a policy or guidelines on their use? __yes __no. If yes, please attach a copy or provide a link to the policy/guidelines. 6. Was their a phase in strategy? __yes __no. If yes, please describe. 7. Roughly, how many stop signs have sign post reflectors in your state? 8. If available, please provide typical drawings of the retroreflective material on stop sign posts including the strip’s size and type of marking material 9. Does the material color match the stop sign? 10. What is the total cost for applying retroreflective material on stop sign posts? 11. Are they effective? __yes __no __don’t know. If yes, how did you measure effectiveness? 12. Do you have any studies or reports on the sign post reflectors (stop signs or other types of signs)? __yes __no. If yes, please provide a link to the study or report. 13. Have you received any informal feedback about the retroreflective material on the sign posts (stop signs or other types of signs)? __yes __no. If yes, please provide commentary on that feedback.

26
27
APPENDIX C
HUMAN FACTORS SURVEY
The Virginia Transportation Research Council (VTRC) is conducting a survey on Stop Signs for the Virginia Department of Transportation (VDOT). The survey consists of four 1 minute videos that are included in Section A of this survey and three 20 second videos that are included in section B of this survey. Please refer to the instructions for each section. The survey will take approximately 10 minutes to complete. Your participation is greatly appreciated!
Section A Instructions: The 4 videos in this section are filmed inside a moving vehicle that is progressing towards a stop sign. The box within each video shows the distance in feet that the van has traveled. View the videos in the order of Video 1, then Video 2, then Video 3, then Video 4. Do not maximize video to full screen (i.e., use the default screen). Video 1:
1) Click on Video 1. 2) Press play 3) Watch video and pause video once you detect the presence (shape) of a stop sign. 4) Enter distance as indicated in the box in the upper left hand of the video.
Distance = __________ ft
5) Resume video and pause video when you detect the stop sign post. 6) Enter distance as indicated in the box in the upper left hand of the video.
Distance = __________ ft
7) Resume video and pause video when you can read STOP on the sign. 8) Enter the distance as indicated in the box in the upper left hand of the video.
Distance = __________ ft
Video 2:
1) Click on Video 2. 2) Press play 3) Watch video and pause video once you detect the presence (shape) of a stop sign. 4) Enter distance as indicated in the box in the upper left hand of the video.
Distance = __________ ft
28
5) Resume video and pause video when you detect the stop sign post. 6) Enter distance as indicated in the box in the upper left hand of the video.
Distance = __________ ft
7) Resume video and pause video when you can read STOP on the sign. 8) Enter the distance as indicated in the box in the upper left hand of the video.
Distance = __________ ft
Video 3:
1) Click on Video 3. 2) Press play 3) Watch video and pause video once you detect the presence (shape) of a stop sign. 4) Enter distance as indicated in the box in the upper left hand of the video.
Distance = __________ ft
5) Resume video and pause video when you detect the stop sign post. 6) Enter distance as indicated in the box in the upper left hand of the video.
Distance = __________ ft
7) Resume video and pause video when you can read STOP on the sign. 8) Enter the distance as indicated in the box in the upper left hand of the video.
Distance = __________ ft
Video 4:
1) Click on Video 4. 2) Press play 3) Watch video and pause video once you detect the presence of a stop sign. 4) Enter distance as indicated in the box in the upper left hand of the video.
Distance = __________ ft
5) Resume video and pause video when you detect the stop sign post. 6) Enter distance as indicated in the box in the upper left hand of the video.
Distance = __________ ft
7) Resume video and pause video when you can read STOP on the sign. 8) Enter the distance as indicated in the box in the upper left hand of the video.
Distance = __________ ft
29
Section B Instructions: The 3 videos in this section are filmed inside a moving vehicle that is progressing towards 2 stop signs that are side by side. View the videos in the order of Video 5, then Video 6, then Video 7. Video 5: Which sign and post do you prefer?
_____Left _____Right _____No Preference Why (including responses of “no preference”)? Video 6: Which sign and post do you prefer?
_____Left _____Right _____No Preference
Why (including responses of “no preference”)? Video 7: Which sign and post do you prefer?
_____Left _____Right _____No Preference
Why (including responses of “no preference”)? Your Age: ______ Do you have a driver’s license? ____yes ____no Thank You! Please email the completed survey to [email protected] by Thursday, October 9, 2008. If you have questions, please email Lance or call him at 434-293-1952 or Ben Cottrell at 434-293-1932. If you have additional comments, please provide on the next page.

30
31
APPENDIX D
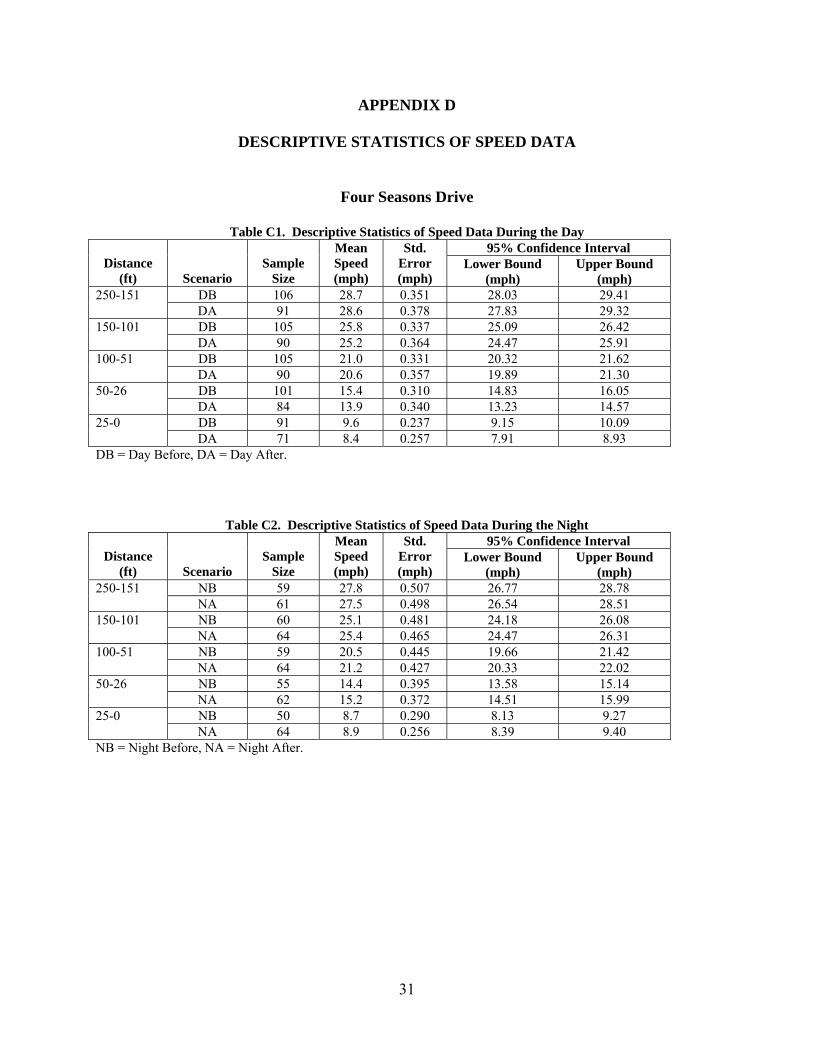
DESCRIPTIVE STATISTICS OF SPEED DATA
Four Seasons Drive
Table C1. Descriptive Statistics of Speed Data During the Day 95% Confidence Interval
Distance (ft)
Scenario
Sample
Size
Mean Speed (mph)
Std. Error (mph)
Lower Bound (mph)
Upper Bound (mph)
DB 106 28.7 0.351 28.03 29.41 250-151 DA 91 28.6 0.378 27.83 29.32 DB 105 25.8 0.337 25.09 26.42 150-101 DA 90 25.2 0.364 24.47 25.91 DB 105 21.0 0.331 20.32 21.62 100-51 DA 90 20.6 0.357 19.89 21.30 DB 101 15.4 0.310 14.83 16.05 50-26 DA 84 13.9 0.340 13.23 14.57 DB 91 9.6 0.237 9.15 10.09 25-0 DA 71 8.4 0.257 7.91 8.93
DB = Day Before, DA = Day After.
Table C2. Descriptive Statistics of Speed Data During the Night 95% Confidence Interval
Distance (ft)
Scenario
Sample
Size
Mean Speed (mph)
Std. Error (mph)
Lower Bound (mph)
Upper Bound (mph)
NB 59 27.8 0.507 26.77 28.78 250-151 NA 61 27.5 0.498 26.54 28.51 NB 60 25.1 0.481 24.18 26.08 150-101 NA 64 25.4 0.465 24.47 26.31 NB 59 20.5 0.445 19.66 21.42 100-51 NA 64 21.2 0.427 20.33 22.02 NB 55 14.4 0.395 13.58 15.14 50-26 NA 62 15.2 0.372 14.51 15.99 NB 50 8.7 0.290 8.13 9.27 25-0 NA 64 8.9 0.256 8.39 9.40
NB = Night Before, NA = Night After.
32
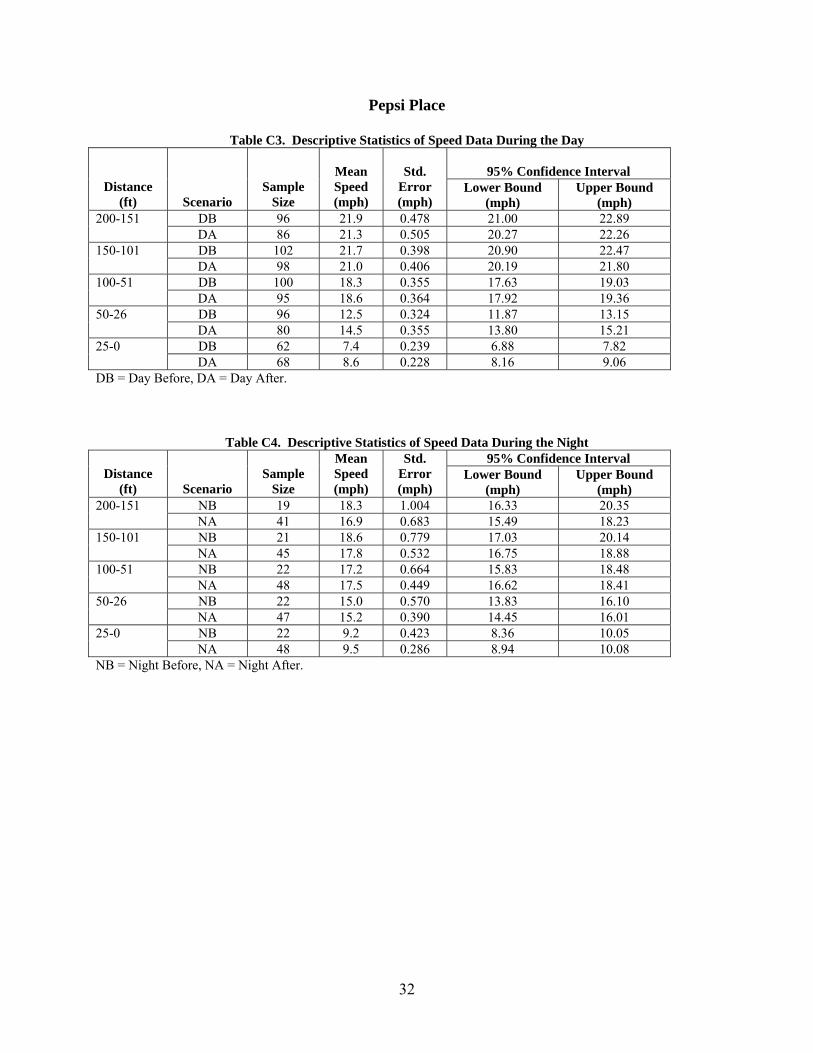
Pepsi Place
Table C3. Descriptive Statistics of Speed Data During the Day
95% Confidence Interval
Distance (ft)
Scenario
Sample Size
Mean Speed (mph)
Std.
Error (mph)
Lower Bound (mph)
Upper Bound (mph)
DB 96 21.9 0.478 21.00 22.89 200-151 DA 86 21.3 0.505 20.27 22.26 DB 102 21.7 0.398 20.90 22.47 150-101 DA 98 21.0 0.406 20.19 21.80 DB 100 18.3 0.355 17.63 19.03 100-51 DA 95 18.6 0.364 17.92 19.36 DB 96 12.5 0.324 11.87 13.15 50-26 DA 80 14.5 0.355 13.80 15.21 DB 62 7.4 0.239 6.88 7.82 25-0 DA 68 8.6 0.228 8.16 9.06
DB = Day Before, DA = Day After.
Table C4. Descriptive Statistics of Speed Data During the Night 95% Confidence Interval
Distance (ft)
Scenario
Sample
Size
Mean Speed (mph)
Std. Error (mph)
Lower Bound (mph)
Upper Bound (mph)
NB 19 18.3 1.004 16.33 20.35 200-151 NA 41 16.9 0.683 15.49 18.23 NB 21 18.6 0.779 17.03 20.14 150-101 NA 45 17.8 0.532 16.75 18.88 NB 22 17.2 0.664 15.83 18.48 100-51 NA 48 17.5 0.449 16.62 18.41 NB 22 15.0 0.570 13.83 16.10 50-26 NA 47 15.2 0.390 14.45 16.01 NB 22 9.2 0.423 8.36 10.05 25-0 NA 48 9.5 0.286 8.94 10.08
NB = Night Before, NA = Night After.