Embed Size (px)
Citation preview
Fritsch 3
Virtual cities and landscape models – what has photogrammetry to offer?
DIETER FRITSCH, Stuttgart
ABSTRACT The demand for geocoded (geographical, spatial) data will considerably grow for the next years. One driving force is the Internet, which allows the user to visit all spots on the Earth if their data is digitally stored and web-accessable. Another request for digital landscapes and city models comes from the communication technology to provide transmitters at the right spots and therefore to overcome ‘dead areas’ of mobile communication. In near future mobile phones evolve to Personal Digital Assistants (PDAs) offering the power of local information systems to allow for navigation, routing, visualization of 3D location data, queries of shop offers etc. Further examples could easily be cited, but would overload this abstract. Photogrammetry as a science and technology of acquisition and processing of photographically (currently evolving in opto-electronically generated) images for determination of form, shape, position or characteristics of arbitrarily features is the answer to generate virtual cities and landscapes. This paper features photogrammetry according to its products and integrates it in an interactive multimedia environment.
1. INTRODUCTION
All spatial science professionals are no longer the only ones who should gain access to and present geographical information. This holds also for photogrammetry which developed in three directions: the refinements in image data collection (from film-based to purely digital), aiming at a high degree of automation in data processing, and to spread its products to meet the requirements of an information society. At present, we live in the being digital age (N. Negroponte, 1995), where (nearly) no limits exist – at least from a technical point-of-view – to access digital data and use it for maintaining and improving our daily business and private life. There have been many comments about the needed evolution of current-day tools like Geographic Information Systems (GIS) that are used to integrate the collection, storage, retrieval, manipulation and display of spatial data. It seems today, taking beside argues of some academics on the mechanistic flavor, that this technology is firmly established and provides the basis for geographic data processing for many years to come (W. Cartwright/M.P.Peterson, 1999). GIS as an interdisciplinary tool kit for spatial sciences like cartography, ecology, geodesy, geography, geology, landscape planning, and last but not least photogrammetry has finally opened new application fields - also called areas-of-interest – for all spatial science professionals, albeit for a very small group of people in private companies and administration when measured on the scale of public interest. All professionals have to undertake courses and training on how to use GIS and photogrammetry software according to its roots in basic mathematics and database design, the usage of storage devices such as CD-ROMs, DVDs, Digital Video Tapes, etc., and last but not least how to make most profit of the Internet. This is the real chance for photogrammetry to offer its high quality mapping products to the public. With the invention of the World Wide Web (WWW) data of all kind are made accessible to everybody who is linked to a WWW server. All of a sudden a tool was made available easy-to-use and most powerful, which integrates text, imagery, animation and oral information. Its idea dates back to 1989 when Tim Berners-Lee proposed the WWW project to CERN (Europaen Council for Nuclear Research) Particle Physics Laboratory in Switzerland. Originally designed for international physicists to collaborate on-line in their research, its usage grows as tremendously as no other technological tool did. The WWW is an information discovery system for browsing and searching
'Photogrammetric Week '99' D. Fritsch & R. Spiller, Eds., Wichmann Verlag, Heidelberg, 1999.
4 Fritsch
the Internet’s worldwide Web of digital information. The Web can be travelled by following hypertext links from document to document that may reside in any of the many servers in different global locations. In terms of Web servers the WWW grew from 130 in 1993 to an estimated 660.000 in 1997 and by late 1998 servers numbered over a staggering 3.5 Million (The Netcraft Web Server Survey). Using the WWW the public can use all data available on the Web, also photogrammetric products like 3D cities and landscapes. This infrastructure is the real challenge in near future because it breaks through the knowledge of GIS professionals in using their products for daily life. Therefore, it is out of question, that all GIS data collection and data processing disciplines, such as photogrammetry, will definitely have a real increase in public interest. If data on landscapes and cities is available on the Web a great variety of queries becomes feasible: making virtual walks through streets of a city, to visit virtually a hotel’s room, planning of a Mountain Bike tour, computer-aided design of your garden etc. Designing and using 3D landscapes is therefore a natural humans tend to visualize the physical landscape of a profile where one’s life is currently grounded. The floor to a realistic landscape visualization was opened by multimedia developments and corresponding software. Today’s 3D software provides powerful design tools for designing landscapes with unprecedented control and accuracy. The challenge for multimedia geo-scientists will be melding the design heritage of traditional photogrammetry and cartography with today’s digital techniques. It is important to note, that using the Web efficiently one should be familiar with the offered tools like HTML, DHTML, VRML, Java and JavaScript. In the following a brief overview is given on the first three items.
1.1. HTML and DHTML
The original WWW format was the hypertext markup language (HTML). Its principle is to have a data structure that is easy to use and can manage text, hypertext and images. The basic element is the tag. Labeling each element with a tag informs the browser how to display it. With the increase of users of the WWW also the demand for more control increased, thus HTML has gone trough several major updates. Each update came with additional tags and tag parameters. The HTML quality is observed by the World Wide Web Consortium. A major improvement to HTML was the IMAP tag. This tag allows the designer to link different parts of an image to different WWW content. The IMAP tag allows photogrammetrists and cartographers to develop multiple paths through a site’s content based on users interaction. With a more robust HTML vocabulary and enhancing by means of the IMPAP tag, photogrammetrists could start developing simple interactive visualizations of landscapes and 3D cities. A major concern about HTML is format compatibility with the browser (Netscape, MS Internet Explorer, etc.). New HTML tags and parameters are not recognised by old browsers. When designing an interactive visualization of an landscape and/or 3D city, the photogrammetrists risks losing viewers by using the latest HTML standards. There is a trade-off between increased interaction and a decreased demand. Thus, it is recommended to inform the user of the photogrammetric product of the best browser and version for the site. Dynamic HTML is being widely published for the next generation of WWW development, it is an enhancement of HTML. Both Microsoft and Netscape added Cascading Style Sheets (CSS) and the ability to position elements at absolute location to their browsers, before the WWW Consortium recommended these standards. By the way, the WWW Consortium has not yet adopted the term DHTML. Contrary to political discussions, DHTML is a major change for the base web data format. It allows photogrammetrists to develop increased user interactions. Before CSS a web element would not change until the original HTML page was edited. With CSS the
'Photogrammetric Week '99' D. Fritsch & R. Spiller, Eds., Wichmann Verlag, Heidelberg, 1999.
Fritsch 5
photogrammetric community can develop methods that allow to change display characteristics at the client computer. DHTML is therefore a real progress.
1.2. VRML
The Virtual Reality Modeling Language (VRML) is an international standard for describing interactive 3D objects, worlds and landscapes. The current VRML97 specification is sufficient for geographically modeling in a number of areas: modeling of diverse coordinate systems, handling Digital Terrain Models, precision of coordinate locations, modeling to earth time references; and database linking. Pioneering work by the GeoVRML Working Group is addressing issues relating to providing additional geographical functionality with any future VRML specification. For more information refer to K. Moore (1999). The diverse VRML browsers are different according to processing speed and color visualization. In table 1 four VRML browsers are listed which are often used for 3D visualization. Table 1: Diverse VRML players Product: Community Place Cosmo Player GLView WorldView Vendor: Sony Silicon Graphics MKC Software Intervista URL: www.hkstar.com cosmosoftware.com www.mksoft.com www.intervista.com VRML is not always very exciting. For many users, the experience is limited by Internet bandwidth and the graphic hardware performance. For that reason, it is important to make download and rendering as effective as possible. Very complex geometries should be avoided in 3D.
2. DIGITAL TERRAIN MODELS, ORTHOS AND LANDSCAPES
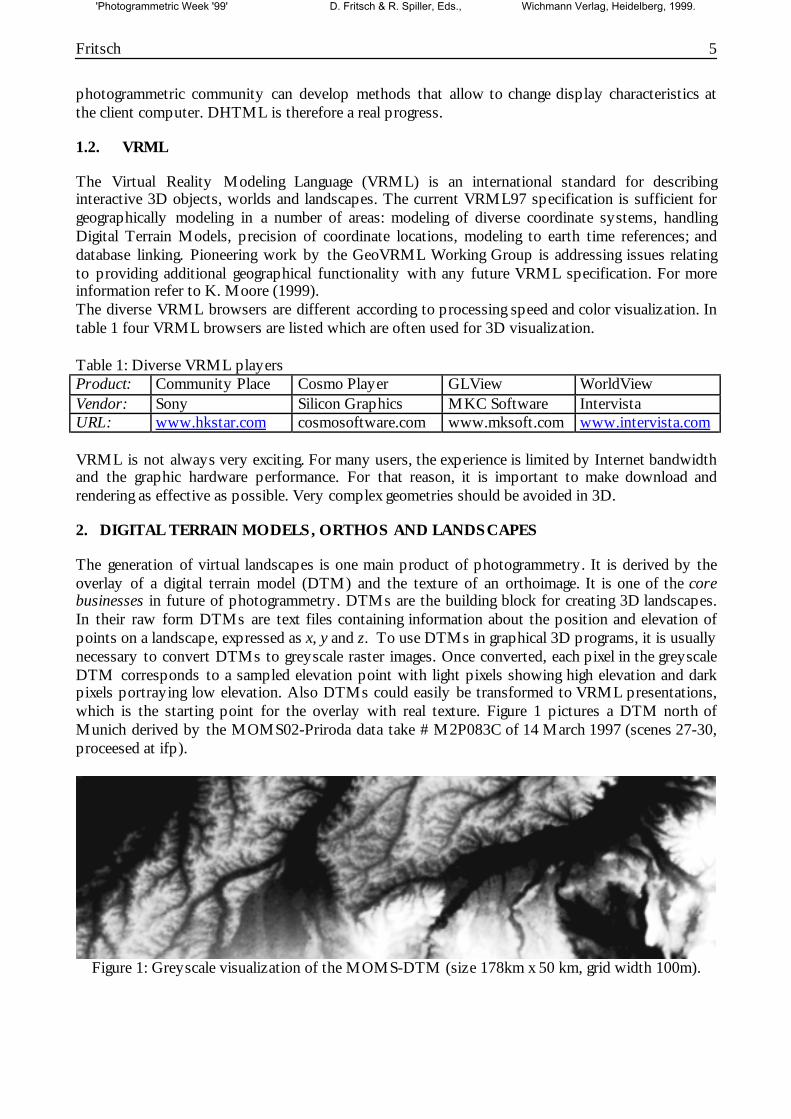
The generation of virtual landscapes is one main product of photogrammetry. It is derived by the overlay of a digital terrain model (DTM) and the texture of an orthoimage. It is one of the core businesses in future of photogrammetry. DTMs are the building block for creating 3D landscapes. In their raw form DTMs are text files containing information about the position and elevation of points on a landscape, expressed as x, y and z. To use DTMs in graphical 3D programs, it is usually necessary to convert DTMs to greyscale raster images. Once converted, each pixel in the greyscale DTM corresponds to a sampled elevation point with light pixels showing high elevation and dark pixels portraying low elevation. Also DTMs could easily be transformed to VRML presentations, which is the starting point for the overlay with real texture. Figure 1 pictures a DTM north of Munich derived by the MOMS02-Priroda data take # M2P083C of 14 March 1997 (scenes 27-30, proceesed at ifp).
Figure 1: Greyscale visualization of the MOMS-DTM (size 178km x 50 km, grid width 100m).
'Photogrammetric Week '99' D. Fritsch & R. Spiller, Eds., Wichmann Verlag, Heidelberg, 1999.
6 Fritsch
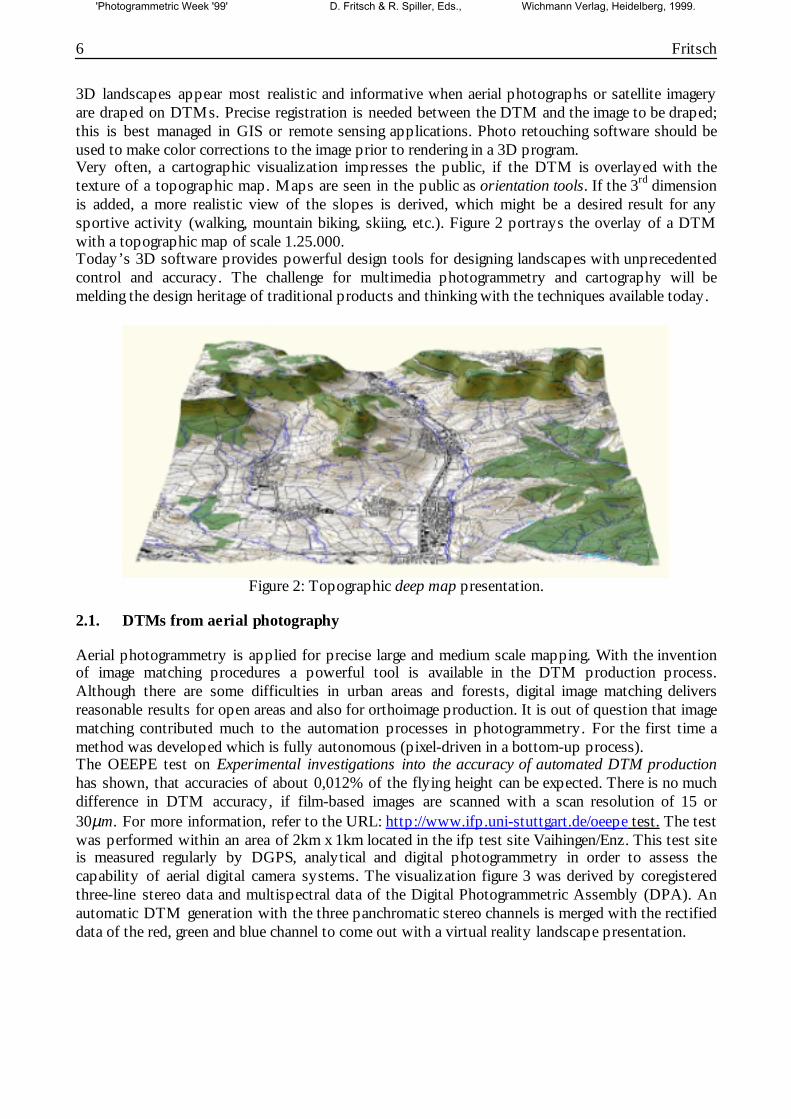
3D landscapes appear most realistic and informative when aerial photographs or satellite imagery are draped on DTMs. Precise registration is needed between the DTM and the image to be draped; this is best managed in GIS or remote sensing applications. Photo retouching software should be used to make color corrections to the image prior to rendering in a 3D program. Very often, a cartographic visualization impresses the public, if the DTM is overlayed with the texture of a topographic map. Maps are seen in the public as orientation tools. If the 3rd dimension is added, a more realistic view of the slopes is derived, which might be a desired result for any sportive activity (walking, mountain biking, skiing, etc.). Figure 2 portrays the overlay of a DTM with a topographic map of scale 1.25.000. Today’s 3D software provides powerful design tools for designing landscapes with unprecedented control and accuracy. The challenge for multimedia photogrammetry and cartography will be melding the design heritage of traditional products and thinking with the techniques available today.
Figure 2: Topographic deep map presentation.
2.1. DTMs from aerial photography
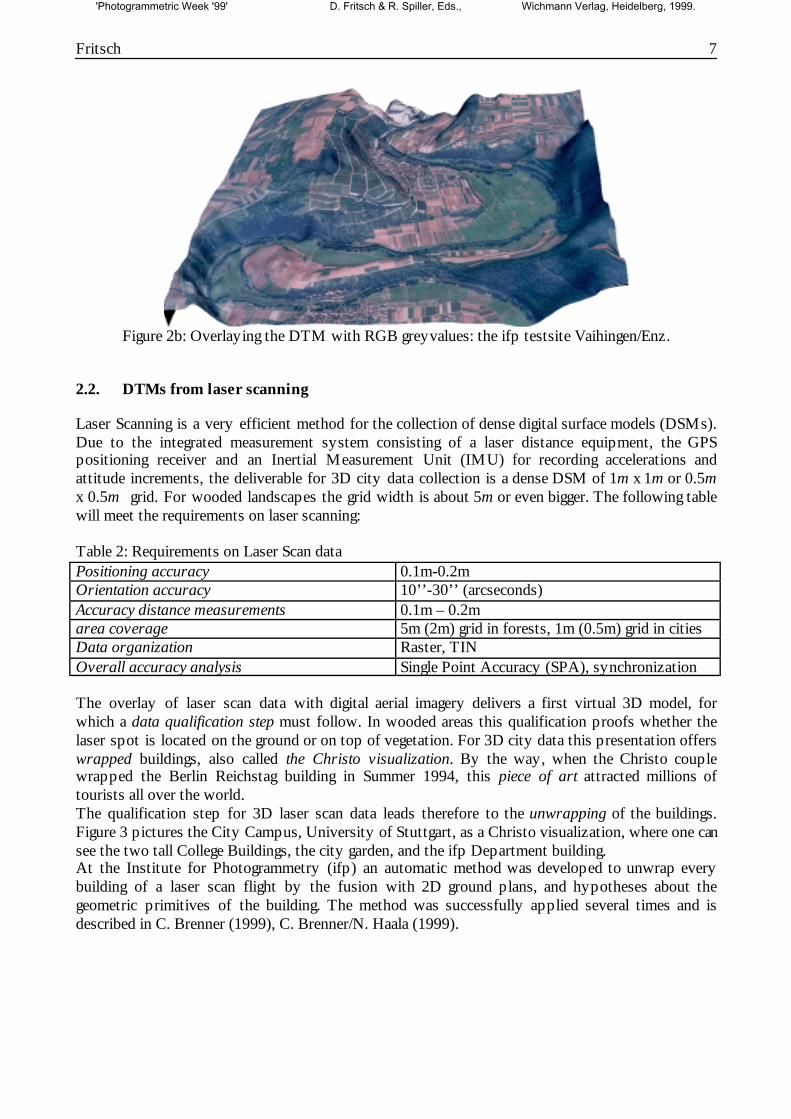
Aerial photogrammetry is applied for precise large and medium scale mapping. With the invention of image matching procedures a powerful tool is available in the DTM production process. Although there are some difficulties in urban areas and forests, digital image matching delivers reasonable results for open areas and also for orthoimage production. It is out of question that image matching contributed much to the automation processes in photogrammetry. For the first time a method was developed which is fully autonomous (pixel-driven in a bottom-up process). The OEEPE test on Experimental investigations into the accuracy of automated DTM production has shown, that accuracies of about 0,012% of the flying height can be expected. There is no much difference in DTM accuracy, if film-based images are scanned with a scan resolution of 15 or 30µm. For more information, refer to the URL: http://www.ifp.uni-stuttgart.de/oeepe test. The test was performed within an area of 2km x 1km located in the ifp test site Vaihingen/Enz. This test site is measured regularly by DGPS, analytical and digital photogrammetry in order to assess the capability of aerial digital camera systems. The visualization figure 3 was derived by coregistered three-line stereo data and multispectral data of the Digital Photogrammetric Assembly (DPA). An automatic DTM generation with the three panchromatic stereo channels is merged with the rectified data of the red, green and blue channel to come out with a virtual reality landscape presentation.
'Photogrammetric Week '99' D. Fritsch & R. Spiller, Eds., Wichmann Verlag, Heidelberg, 1999.
Fritsch 7
Figure 2b: Overlaying the DTM with RGB greyvalues: the ifp testsite Vaihingen/Enz.
2.2. DTMs from laser scanning
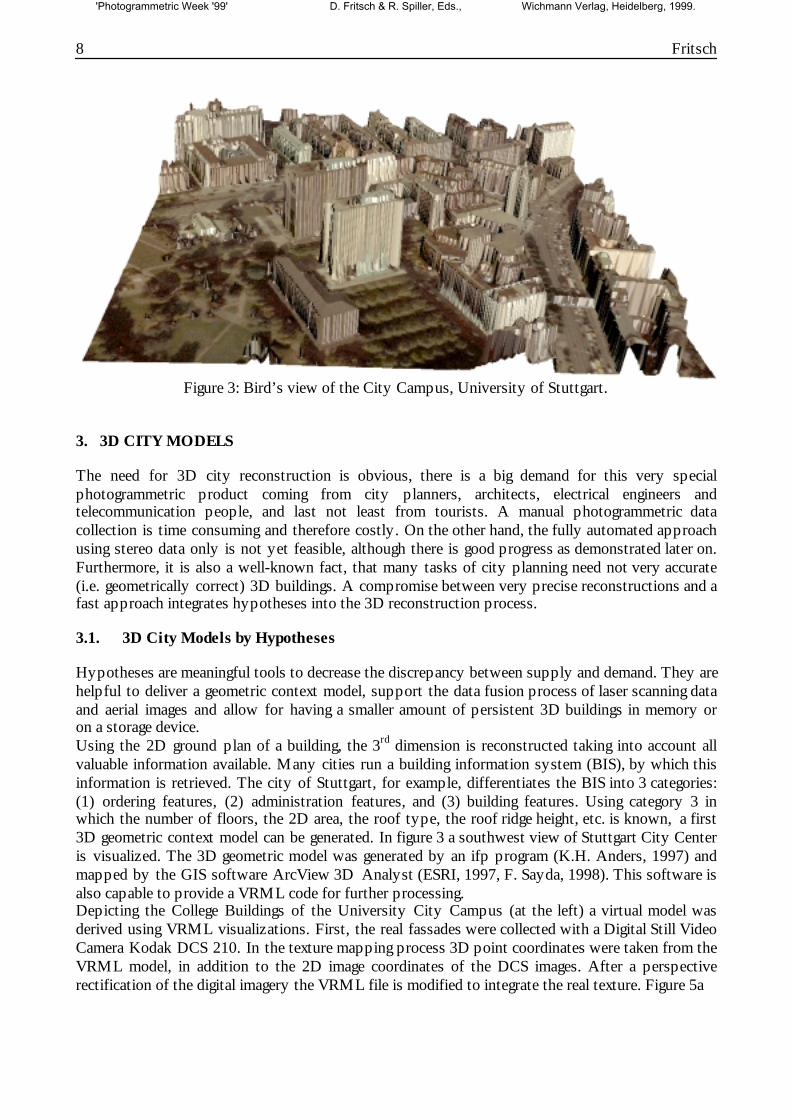
Laser Scanning is a very efficient method for the collection of dense digital surface models (DSMs). Due to the integrated measurement system consisting of a laser distance equipment, the GPS positioning receiver and an Inertial Measurement Unit (IMU) for recording accelerations and attitude increments, the deliverable for 3D city data collection is a dense DSM of 1m x 1m or 0.5m x 0.5m grid. For wooded landscapes the grid width is about 5m or even bigger. The following table will meet the requirements on laser scanning: Table 2: Requirements on Laser Scan data Positioning accuracy 0.1m-0.2m Orientation accuracy 10’’-30’’ (arcseconds) Accuracy distance measurements 0.1m – 0.2m area coverage 5m (2m) grid in forests, 1m (0.5m) grid in cities Data organization Raster, TIN Overall accuracy analysis Single Point Accuracy (SPA), synchronization The overlay of laser scan data with digital aerial imagery delivers a first virtual 3D model, for which a data qualification step must follow. In wooded areas this qualification proofs whether the laser spot is located on the ground or on top of vegetation. For 3D city data this presentation offers wrapped buildings, also called the Christo visualization. By the way, when the Christo couple wrapped the Berlin Reichstag building in Summer 1994, this piece of art attracted millions of tourists all over the world. The qualification step for 3D laser scan data leads therefore to the unwrapping of the buildings. Figure 3 pictures the City Campus, University of Stuttgart, as a Christo visualization, where one can see the two tall College Buildings, the city garden, and the ifp Department building. At the Institute for Photogrammetry (ifp) an automatic method was developed to unwrap every building of a laser scan flight by the fusion with 2D ground plans, and hypotheses about the geometric primitives of the building. The method was successfully applied several times and is described in C. Brenner (1999), C. Brenner/N. Haala (1999).
'Photogrammetric Week '99' D. Fritsch & R. Spiller, Eds., Wichmann Verlag, Heidelberg, 1999.
8 Fritsch
Figure 3: Bird’s view of the City Campus, University of Stuttgart.
3. 3D CITY MODELS
The need for 3D city reconstruction is obvious, there is a big demand for this very special photogrammetric product coming from city planners, architects, electrical engineers and telecommunication people, and last not least from tourists. A manual photogrammetric data collection is time consuming and therefore costly. On the other hand, the fully automated approach using stereo data only is not yet feasible, although there is good progress as demonstrated later on. Furthermore, it is also a well-known fact, that many tasks of city planning need not very accurate (i.e. geometrically correct) 3D buildings. A compromise between very precise reconstructions and a fast approach integrates hypotheses into the 3D reconstruction process.
3.1. 3D City Models by Hypotheses
Hypotheses are meaningful tools to decrease the discrepancy between supply and demand. They are helpful to deliver a geometric context model, support the data fusion process of laser scanning data and aerial images and allow for having a smaller amount of persistent 3D buildings in memory or on a storage device. Using the 2D ground plan of a building, the 3rd dimension is reconstructed taking into account all valuable information available. Many cities run a building information system (BIS), by which this information is retrieved. The city of Stuttgart, for example, differentiates the BIS into 3 categories: (1) ordering features, (2) administration features, and (3) building features. Using category 3 in which the number of floors, the 2D area, the roof type, the roof ridge height, etc. is known, a first 3D geometric context model can be generated. In figure 3 a southwest view of Stuttgart City Center is visualized. The 3D geometric model was generated by an ifp program (K.H. Anders, 1997) and mapped by the GIS software ArcView 3D Analyst (ESRI, 1997, F. Sayda, 1998). This software is also capable to provide a VRML code for further processing. Depicting the College Buildings of the University City Campus (at the left) a virtual model was derived using VRML visualizations. First, the real fassades were collected with a Digital Still Video Camera Kodak DCS 210. In the texture mapping process 3D point coordinates were taken from the VRML model, in addition to the 2D image coordinates of the DCS images. After a perspective rectification of the digital imagery the VRML file is modified to integrate the real texture. Figure 5a
'Photogrammetric Week '99' D. Fritsch & R. Spiller, Eds., Wichmann Verlag, Heidelberg, 1999.
Fritsch 9
Figure 4: Southwest view of Stuttgart City Center.
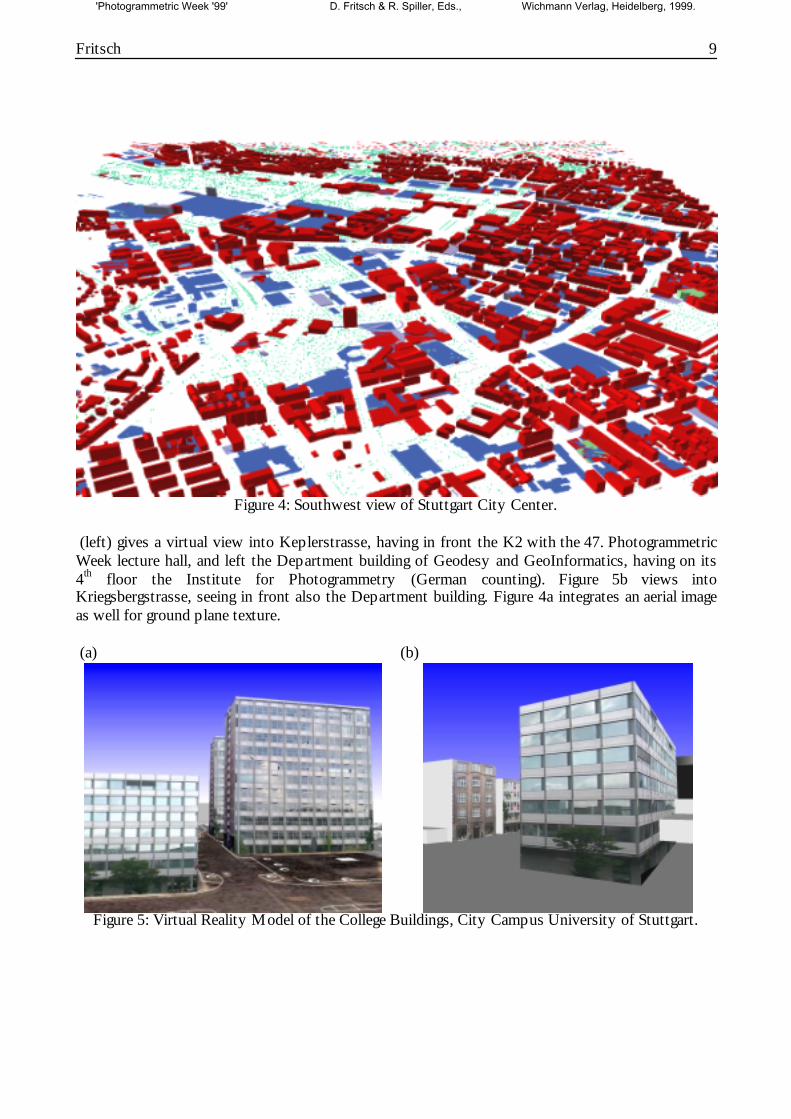
(left) gives a virtual view into Keplerstrasse, having in front the K2 with the 47. Photogrammetric Week lecture hall, and left the Department building of Geodesy and GeoInformatics, having on its 4th floor the Institute for Photogrammetry (German counting). Figure 5b views into Kriegsbergstrasse, seeing in front also the Department building. Figure 4a integrates an aerial image as well for ground plane texture. (a) (b)
Figure 5: Virtual Reality Model of the College Buildings, City Campus University of Stuttgart.
'Photogrammetric Week '99' D. Fritsch & R. Spiller, Eds., Wichmann Verlag, Heidelberg, 1999.
10 Fritsch
3.2. 3D City Models by Monocular Building Detection
Monocular building detection is described in R. Nevatia et al., 1997, and F. Cheng (1994). The first paper describes a method for detecting rectlinear buildings and constructing their 3D shape descriptions from a single aerial image of a general viewpoint. 2D roof hypotheses are generated from linear features by perceptual grouping. The second paper, (a PhD thesis) reconstructs 3D buildings from SPOT pan imagery using the shadows of the buildings and the sun elevation angle. The whole part of the City of Stuttgart is reconstructed coming to an accuracy of about 5-8m in the vertical.
3.3. Stereoscopic Building Detection
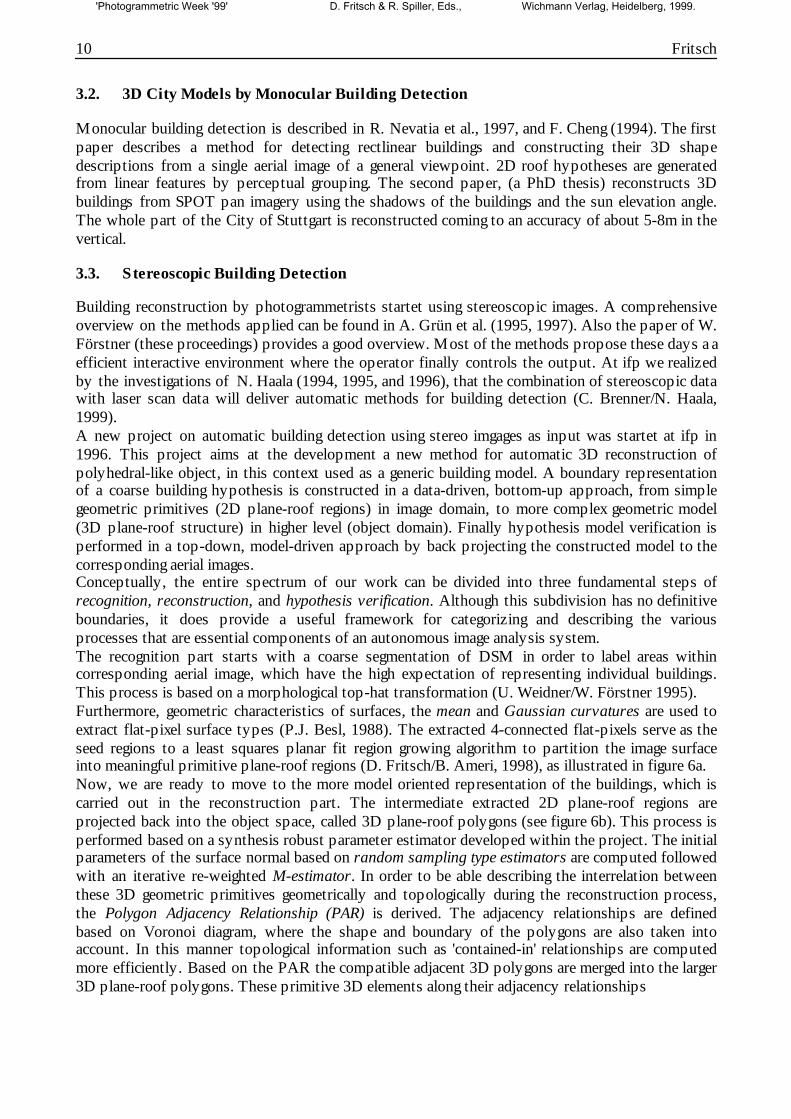
Building reconstruction by photogrammetrists startet using stereoscopic images. A comprehensive overview on the methods applied can be found in A. Grün et al. (1995, 1997). Also the paper of W. Förstner (these proceedings) provides a good overview. Most of the methods propose these days a a efficient interactive environment where the operator finally controls the output. At ifp we realized by the investigations of N. Haala (1994, 1995, and 1996), that the combination of stereoscopic data with laser scan data will deliver automatic methods for building detection (C. Brenner/N. Haala, 1999). A new project on automatic building detection using stereo imgages as input was startet at ifp in 1996. This project aims at the development a new method for automatic 3D reconstruction of polyhedral-like object, in this context used as a generic building model. A boundary representation of a coarse building hypothesis is constructed in a data-driven, bottom-up approach, from simple geometric primitives (2D plane-roof regions) in image domain, to more complex geometric model (3D plane-roof structure) in higher level (object domain). Finally hypothesis model verification is performed in a top-down, model-driven approach by back projecting the constructed model to the corresponding aerial images. Conceptually, the entire spectrum of our work can be divided into three fundamental steps of recognition, reconstruction, and hypothesis verification. Although this subdivision has no definitive boundaries, it does provide a useful framework for categorizing and describing the various processes that are essential components of an autonomous image analysis system. The recognition part starts with a coarse segmentation of DSM in order to label areas within corresponding aerial image, which have the high expectation of representing individual buildings. This process is based on a morphological top-hat transformation (U. Weidner/W. Förstner 1995). Furthermore, geometric characteristics of surfaces, the mean and Gaussian curvatures are used to extract flat-pixel surface types (P.J. Besl, 1988). The extracted 4-connected flat-pixels serve as the seed regions to a least squares planar fit region growing algorithm to partition the image surface into meaningful primitive plane-roof regions (D. Fritsch/B. Ameri, 1998), as illustrated in figure 6a. Now, we are ready to move to the more model oriented representation of the buildings, which is carried out in the reconstruction part. The intermediate extracted 2D plane-roof regions are projected back into the object space, called 3D plane-roof polygons (see figure 6b). This process is performed based on a synthesis robust parameter estimator developed within the project. The initial parameters of the surface normal based on random sampling type estimators are computed followed with an iterative re-weighted M-estimator. In order to be able describing the interrelation between these 3D geometric primitives geometrically and topologically during the reconstruction process, the Polygon Adjacency Relationship (PAR) is derived. The adjacency relationships are defined based on Voronoi diagram, where the shape and boundary of the polygons are also taken into account. In this manner topological information such as 'contained-in' relationships are computed more efficiently. Based on the PAR the compatible adjacent 3D polygons are merged into the larger 3D plane-roof polygons. These primitive 3D elements along their adjacency relationships
'Photogrammetric Week '99' D. Fritsch & R. Spiller, Eds., Wichmann Verlag, Heidelberg, 1999.
Fritsch 11
(a) (c) (e)
(b) (d) (f)
Figure 6: Processes of 3D building reconstruction: (a) 2D plane-roof polygons, (b) 3D plane-roof polygons, (c) reconstructed coarse building model, (d) reconstructed 3D coarse building model,
(e) modified building model (2D view), and (f) modified 3D building model information are input to the POLY-MODELER (B. Ameri/D. Fritsch, 1999), where they are geometrically and/or topologically combined to generate the coarse generic polyhedral-like building models (see figure 6d). Here is the starting point for hypothesis verification in a top-down fashion. Treating the hypothesis model as evidence leads to a set of confidence intervals that can be used as a search space to find the corresponding 2D image primitives and performing a consistency verification of the constructed coarse model (figure 6f). Figure 6 depicts the corresponding results of the subsequent processes of segmentation, coarse model reconstruction and model verification in image and object space. Following this strategy we are able to reconstruct also very complex buildings automatically.
4. COMPUTER AIDED FACILITY MANAGEMENT (CAFM)
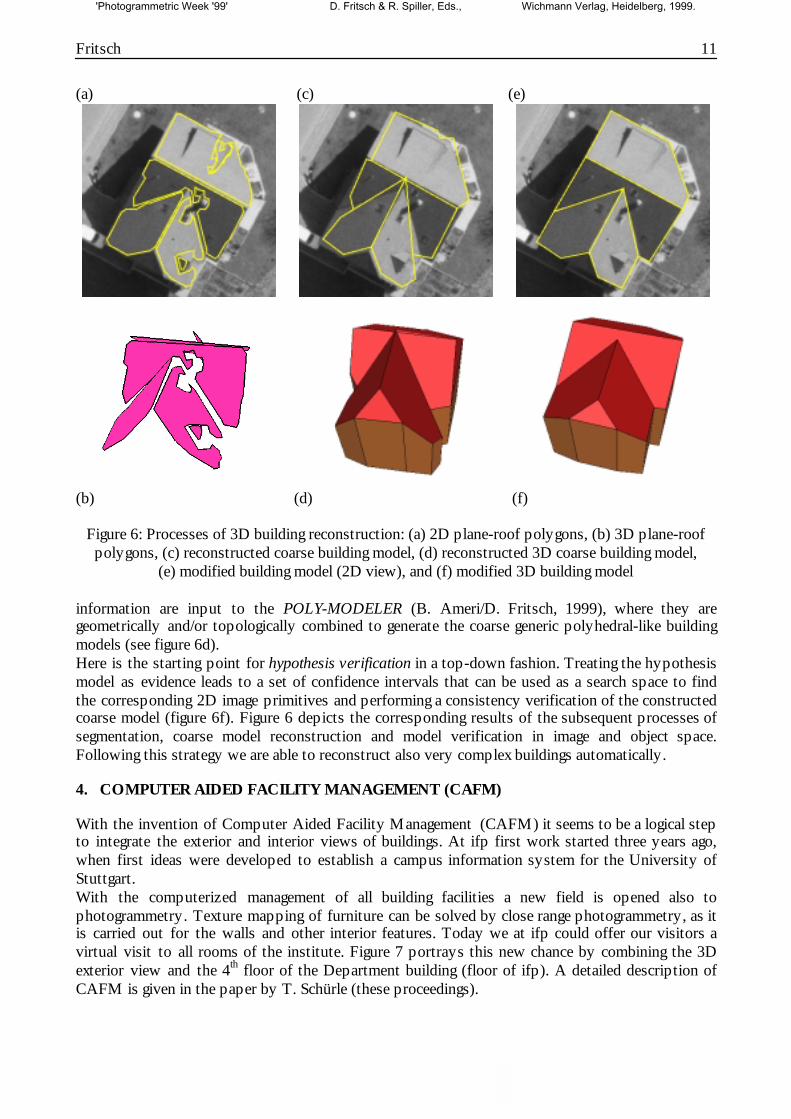
With the invention of Computer Aided Facility Management (CAFM) it seems to be a logical step to integrate the exterior and interior views of buildings. At ifp first work started three years ago, when first ideas were developed to establish a campus information system for the University of Stuttgart. With the computerized management of all building facilities a new field is opened also to photogrammetry. Texture mapping of furniture can be solved by close range photogrammetry, as it is carried out for the walls and other interior features. Today we at ifp could offer our visitors a virtual visit to all rooms of the institute. Figure 7 portrays this new chance by combining the 3D exterior view and the 4th floor of the Department building (floor of ifp). A detailed description of CAFM is given in the paper by T. Schürle (these proceedings).
'Photogrammetric Week '99' D. Fritsch & R. Spiller, Eds., Wichmann Verlag, Heidelberg, 1999.
12 Fritsch
Figure 7: Exterior and interior view of the building facility, Institute for Photogrammetry (ifp), University of Stuttgart.
5. OUTLOOK AND CONCLUSIONS
The production of virtual cities and landscapes by photogrammetry offers photogrammetrists new chances for the future. The paper started with a brief review of the WWW which serves as one main infrastructure for data distribution. As one easily realizes it is important to apply the toolkit of WWW browsers, like HTML, DHTML; VRML, Java and JavaScript to offer our products to the public. As far as landscape visualization is concerned photogrammetry offers the 3D basis: the DTM. An overlay with texture collected by film-based and in near future digital camera system provides the virtual landscape model in its real color. Both technologies, DTM generation using image matching and laser scanning are complementary to each other, what means both will be used for different applications. 3D city modeling seems to be in a new progress which was made within the last two years. The data fusion method combining all available data of ground plans, aerial photographs and laser scanning leads to a new step in automation, although not all buildings could be seen as finally shaped. Also here, an interactive environment for the improvement of the reconstruction process is necessary. But the degree of realism is dependent on the level of detail, as we all know. The examples shown in this paper direct photogrammetry into the multimedia age. It is quite fascinating which applications can be solved nowadays using the tools of multimedia software. For the author, it is redundant to say that multimedia photogrammetry just evolved and will serve as a new basis for the next years to come.
6. REFERENCES
Ameri, B., Fritsch, D. (1999): 3-D Reconstruction of Polyhedral-like Building Model. Int. Achives of Photogrammety and Remote Sensing (IAPRS), 32, Part 3-2W5, Munich.
Anders, K.H. (1997): Automated Interpretation of Digital Landscape Models. In: Photogrammetric Week ’97, Eds. D. Fritsch, D. Hobbie, Wichmann, Heidelberg, pp. 13-24.
Bauer, W. (1997): Anforderungen an 3D-Stadtmodelle am Beispiel Stuttgart 21. In: Photogrammetric Week ‘97, Eds. D. Fritsch, D. Hobbie, Wichmann, Heidelberg, pp. 165-173.
Besl, Paul J. (1988): Segmentation Through Variable Order Surface Fitting. IEEE Transactions on Pattern Analysis and Machine Intelligence, Vol. 10, No. 2, pp. 167-192, 1998.
Brenner, C. (1999). Interactive Modeling Tools for 3D Building Reconstruction. These Proceedings.
'Photogrammetric Week '99' D. Fritsch & R. Spiller, Eds., Wichmann Verlag, Heidelberg, 1999.
Fritsch 13
Brenner, C., Haala, N. (1999): Rapid Production of Virtual Reality City Models. Geo-Information- Systems (GIS), 12, 2/99, pp. 22-28.
Cartwright, W., Peterson, M.P., Gartner, G. (1999): Multimedia Cartography. Springer, Berlin, 343p.
Cheng, F. (1994): Aussagen der Fernerkundung zur Bestimmung städtischer Gebäudehöhenstrukkturen auf der Basis von Satellitendaten. Dissertation Universität Stuttgart.
Danahy, J. (1997): A Set of Visualization Data Needs in Urban Environmental Planning and Design for Photogrammetric Data. In: In: Automatic Extraction of Man-Made Objects from Aerial and Space Images (II), Eds. A. Grün, E.P. Baltsavias, O. Henricsson, Birkhäuser, Basel, pp. 357-366.
ESRI (1997): ArcView 3D Analyst. Documentation Environmental Systems Research Institute Inc., Redlands.
Förstner, W. (1999): 3D-City Models: Automatic and Semiautomatic Acquisition Methods. These Proceedings.
Fritsch, D., Ameri, B (1998): Geometric Characteristics of Digital Surfaces: A key Towards 3-D Building Reconstruction. Int. Archives of Photogrammetry and Remote Sensing (IAPRS), 32, Part 3/1, pp. 119-126.
Gülch, E. (1997): Application of Semi-Automatic Building Acquisition. In: In: In: Automatic Extraction of Man-Made Objects from Aerial and Space Images (II), Eds. A. Grün, E.P. Baltsavias, O. Henricsson, Birkhäuser, Basel, pp. 129-138.
Gruber, M., Kofler, M., Leberl, F. (1997): Managing Large 3D Urban Database Contents supporting Phototexture and Levels of Detail. In: Automatic Extraction of Man-Made Objects from Aerial and Space Images (II), Eds. A. Grün, E.P. Baltsavias, O. Henricsson, Birkhäuser, Basel, pp. 377-386.
Grün, A. (1997): Automation in Building Reconstruction. In: Photogrammetric Week ’97, Eds. D. Fritsch, D. Hobbie, Wichmann, Heidelberg, pp. 175-186.
Grün, A., Kübler, O., Agouris, P. (1995): Automatic Extraction of Man-Made Objects from Aerial Space Image. Birkhäuser, Basel, 322 p.
Grün, A., Baltsavias, E.P., Henricsson, O. (Eds.)(1997): Automatic Extraction of Man-Made Objects from Aerial and Space Images. Birkhäuser, Basel, 394 p.
Grün, A., Dan, H. (1997): TOBAGO – A Topology Builder for the Automated Generation of Building Models. In: In: In: Automatic Extraction of Man-Made Objects from Aerial and Space Images (II), Eds. A. Grün, E.P. Baltsavias, O. Henricsson, Birkhäuser, Basel, pp. 149-160.
Haala, N. (1994): Detection of Buildings by Fusion of Range and Image Data. Int. Archives Photogrammetry and Remote Sensing. SPIE Proceedings, Munich, pp. 341-346.
Haala, N. (1995): 3D Building Reconstruction Using Linear Edge Segments. In: Photogrammetric Week ’95, Eds. D. Fritsch, D. Hobbie, Wichmann, Heidelberg, pp. 19-28.
Haala, N. (1996): Gebäuderekonstruktion durch Kombination von Bild- und Höhendaten. Deutsche Geodätische Kommission, Reihe C, Nr. 460, München, 92 p.
Haala, N., Brenner, C. (1997): Interpretation of Urban Surface Models using 2D Building Information. In: In: In: Automatic Extraction of Man-Made Objects from Aerial and Space Images (II), Eds. A. Grün, E.P. Baltsavias, O. Henricsson, Birkhäuser, Basel, pp. 213-222.
Heitzmann, P. Philipp, R (1999): Digitale geologische Karten als Grundlage für die Umweltplanung. In: GIS in Geowissenschaften und Umwelt, Hrsg. K. Asch, Springer, Berlin, pp. 3-24.
Henricsson, O., Baltsavias, E. (1997): 3-D Building Reconstruction with ARUBA: A Qualitative and Quantitative Evaluation. In: In: Automatic Extraction of Man-Made Objects from Aerial and Space Images (II), Eds. A. Grün, E.P. Baltsavias, O. Henricsson, Birkhäuser, Basel, pp. 65-76.
'Photogrammetric Week '99' D. Fritsch & R. Spiller, Eds., Wichmann Verlag, Heidelberg, 1999.

14 Fritsch
Lange, E. (1998): Realität und computergestützte visuelle Simulation. Eine empirische Untersuchung über den Realitätsgrad virtueller Landschaften am Beispiel des Talraums Brunnen/Schwyz. Dissertation ETH Zürich, Nr. 12551, Institut für Orts-, Regional und Landesplanung.
Lange, E. (1999): Von der analogen zur GIS-gestützten 3D-Visualisierung bei der Planung von Landschaften. Geo-Information-Systems (GIS), 2/99, pp. 29-37.
Loodts, J. (1997): From Large Scale DTM-Extraction to Feature Extraction. In: In: Automatic Extraction of Man-Made Objects from Aerial and Space Images (II), Eds. A. Grün, E.P. Baltsavias, O. Henricsson, Birkhäuser, Basel, pp. 53-62.
Moore K. (1999): VRML and Java for Interactive 3D Cartography. In: Multimedia Cartography, Eds. W. Cartwright, M.P. Peterson, G. Gartner, Springer, Berlin.
Negroponte, N. (1995): Being Digital. Coronet Books, London, 249 p. Nevatia, R., Lin, C., Huertas, A. (1997): A System for Building Detection from Aerial Images. In:
In: In: Automatic Extraction of Man-Made Objects from Aerial and Space Images (II), Eds. A. Grün, E.P. Baltsavias, O. Henricsson, Birkhäuser, Basel, pp. 77-86.
Pilouk, M. (1997): Development of the ArcView 3D Analyst Extension. Int. Archives of Photogrammetry and Remote Sensing, 32, Part 3-4W2, Stuttgart, pp. 196-202.
Rumbaugh, J., Balah, M., Premerlani, W., Eddy, F., Lorensen, W. (1991): Object Oriented Modeling and Design, Prentice Hall, 120 p.
Sayda, F. (1998): Untersuchung der Anwendungsmöglichkeiten des ArcView 3D Analyst. Studienarbeit Institut für Photogrammetrie, Universität Stuttgart (nicht veröffentlicht).
Weidner, U. and W. Förstner (1995): Towards Automatic Building Extraction from High Resolution Digital Elevation Models. ISPRS Journal, 50, No. 4, pp.38-49.
Weidner, U. (1997): Digital Surface Models for Building Extraction. In: In: In: Automatic Extraction of Man-Made Objects from Aerial and Space Images (II), Eds. A. Grün, E.P. Baltsavias, O. Henricsson, Birkhäuser, Basel, pp. 193-202.
'Photogrammetric Week '99' D. Fritsch & R. Spiller, Eds., Wichmann Verlag, Heidelberg, 1999.