Embed Size (px)
Citation preview
Virtual Watercoolers: A Field Experiment on Virtual Synchronous Interactions and Performance of Organizational Newcomers Iavor Bojinov Prithwiraj Choudhury Jacqueline N. Lane
Working Paper 21-125
Working Paper 21-125
Copyright © 2021 Iavor Bojinov, Prithwiraj Choudhury, and Jacqueline N. Lane.
Working papers are in draft form. This working paper is distributed for purposes of comment and discussion only. It may not be reproduced without permission of the copyright holder. Copies of working papers are available from the author.
Funding for this research was provided in part by Harvard Business School.
Virtual Watercoolers: A Field Experiment on Virtual Synchronous Interactions and Performance of Organizational Newcomers
Iavor Bojinov Harvard Business School
Prithwiraj Choudhury Harvard Business School
Jacqueline N. Lane Harvard Business School
1
Virtual Watercoolers: A Field Experiment on Virtual Synchronous Interactions and
Performance of Organizational Newcomers
Iavor Bojinov, Prithwiraj Choudhury, and Jacqueline N. Lane1
Abstract
Do virtual, yet informal and synchronous, interactions affect individual performance outcomes of organizational newcomers? We report results from a randomized field experiment conducted at a large global organization that estimates the performance effects of “virtual water coolers” for remote interns participating in the firm’s flagship summer internship program. Findings indicate that interns who had randomized opportunities to interact synchronously and informally with senior managers were significantly more likely to receive offers for full-time employment, achieved higher weekly performance ratings, and had more positive attitudes toward their remote internships. Further, we observed stronger results when the interns and senior managers were demographically similar. Secondary results also hint at a possible abductive explanation of the performance effects: virtual watercoolers between interns and senior managers may have facilitated knowledge and advice sharing. This study demonstrates that hosting brief virtual water cooler sessions with senior managers might have job and career benefits for organizational newcomers working in remote workplaces, an insight with immediate managerial relevance.
Keywords: remote work, virtual water coolers, social interactions, performance, careers, field experiment
1 Iavor Bojinov, Harvard Business School (email: [email protected]); Prithwiraj Choudhury, Harvard Business School (email: [email protected]); Jacqueline N. Lane, Harvard Business School (email: [email protected]). All authors made equal contributions to the project and are listed alphabetically.
2
1. Introduction
The past two decades have witnessed a growing adoption of remote and distributed work (Gajendran and
Harrison 2007, Hinds et al. 2002, Wiesenfeld et al. 1999). A more recent literature documents causal
productivity gains from provisioning remote work (Bloom et al. 2015, Choudhury et al. 2020), and a recent
working paper estimates that after the COVID-19 pandemic, 25% of work will be supplied by remote
workers, compared with just 5% prior to the pandemic (Barrero et al. 2020). However, CEOs remain
concerned with the widespread adoption of remote work—such as Arvind Krishna at IBM, who has said he
expects 80% of the company’s employees to work in a hybrid model after the pandemic—due to the reduced
quality of informal interactions in the workplace (Ford and Chang 2021). These managerial concerns around
informal interactions and onboarding workers in remote workplaces are echoed in prior organizational
literature. In particular, researchers have theorized that the absence of face-to-face interactions between
organizational newcomers working remotely and senior managers might negatively affect opportunities for
remote workers to build relational ties with peers and supervisors (Golden 2006) and lead to remote
newcomers missing out on mentoring opportunities and other forms of information exchange that might
affect their performance (Cooper and Kurland 2002, Nardi and Whittaker 2002).
It is, however, important to point out that advances in communication technology such as Zoom,
Microsoft Teams, Google Hangouts, etc., now allow for virtual synchronous interactions. This being said, we know
little about how virtual, yet synchronous and informal, interactions between organizational newcomers and
senior managers affect performance and career outcomes of remote workers. This leads to our research
question: Are informal, synchronous interactions in a remote workplace effective in shaping performance and career outcomes of
organizational newcomers? Answering this question has immediate managerial relevance given that global vaccine
distribution timelines remain uncertain (O’Dowd and Hagan 2021) and a large number of workers are likely
to be onboarded remotely in 2021.
To study this question, we report results from a field experiment on 1,370 remote new summer
interns distributed across eight divisions and 16 program cities in a large global organization to measure the
causal effects of virtual “water cooler” (WC) interactions on the interns’ performance, career outcomes, and
3
attitudes toward their remote internship experience. The intervention, which focused on exogenously varying
the interns’ access to different types of opportunities for interactions with peers and/or senior managers,
represents, to the best of our knowledge, the first experimental evidence showing whether and how randomly
orchestrated “serendipitous” informal and synchronous interactions can improve job performance and career
outcomes for organizational newcomers working remotely.
The experimental design allowed us to study the performance and career effects of different types of
virtual interactions among workers. The interactions varied by the formality of the communication (informal
versus formal) and synchronicity of communication (asynchronous versus synchronous). Whereas informal
communication refers to interactions that are nonprescribed and social in nature, formal communication
tends to be associated with work-related tasks, activities, and decision-making authority (Tushman and
Romanelli 1983). The synchronicity of communication can be described as asynchronous versus
synchronous, which refers to the extent to which the interactions are real-time and occur at the same place
and time (i.e., synchronous) or across place and time (i.e., asynchronous) (Brown et al. 2010, Dennis et al.
2008). Whereas synchronous communication is often associated with voice (e.g., face-to-face, teleconference),
asynchronous communication is more often associated with data (e.g., email, chat, discussion forum)
(Rathnam et al. 1995). Along these two dimensions, serendipitous encounters—which are the kind of
interactions people have with their colleagues outside of formal meetings and work activities—tend to be
both informal and synchronous in nature (Fayard and Weeks 2007, Lane et al. 2020).
The main treatment intervention offered interns opportunities for remote informal and synchronous
interactions via virtual water coolers (WCs) (i.e., teleconference) either: (1) with three or four other interns in
the intern-only WCs or (2) with a senior manager and three or four other interns in the intern-senior manager
WCs. In consultation with executives from the organization and to mitigate concerns related to Hawthorne
effects, three control conditions were implemented. The first two control conditions were active controls (i.e.,
control conditions where the participants were engaging in an activity during the intervention period but not
participating in a virtual water cooler). The first was an asynchronous question and answer (Q&A) discussion
forum between interns and senior managers in which interns asked questions and were randomly selected to
4
receive a reply from a senior manager each week. The second active control was an intern group project, in
which interns were randomly assigned to small groups of three to four interns that met each week to work on
a research project together. The third control condition was a passive control (i.e., the “no intervention”
control condition where the participants did not engage in any activity), which did not have prearranged
opportunities for interactions of any kind with peers or managers.
A particularly attractive feature of the experimental design is the ability to measure a near-term,
objective outcome. The main performance outcome corresponds to the interns’ likelihood of receiving a full-
time job offer at the end of the five-week internship program. We also complement this main career outcome
measure with the interns’ final performance ratings from their direct supervisors, and the interns’ self-
reported end-of-program attitudes toward their remote internship experience, which we collected using
survey instruments. One noteworthy innovation of the experimental design is the implementation of a panel
experiment structure that exogenously varied the WC treatment dose for each intern, by altering the frequency
that the interns were invited to attend the WC sessions (Bojinov et al. 2020). Moreover, field experiments or
randomized controlled trials (RCTs) provide one powerful method for ruling out rival hypotheses, making it a
suitable method for our study, given the new and evolving nature of the remote work phenomenon (King et
al. 2019, Mitchell and Tsui 2012).
Our main results show that that interns who were randomly assigned to informal and synchronous
interactions in virtual intern-senior manager WCs with three to four other interns and senior managers were
4.7 and 7.3 percentage points (pp) more likely to receive full-time job offers at the end of the program
compared to the asynchronous Q&A and intern group project active controls. Turning to performance
outcomes, we find that the intern-senior manager WC condition received improved final performance ratings
from their direct supervisors. It is important to note that the senior managers in the WC sessions did not
include the interns’ direct supervisors (who could be categorized as middle managers in the organization). We
also find that compared to the other experimental conditions, the job outcome and final performance effects
were strengthened to 9-13 pp for demographically similar intern-senior manager pairs and to 6-12 pp for
interns who were exogenously assigned to a higher number of WC sessions.
5
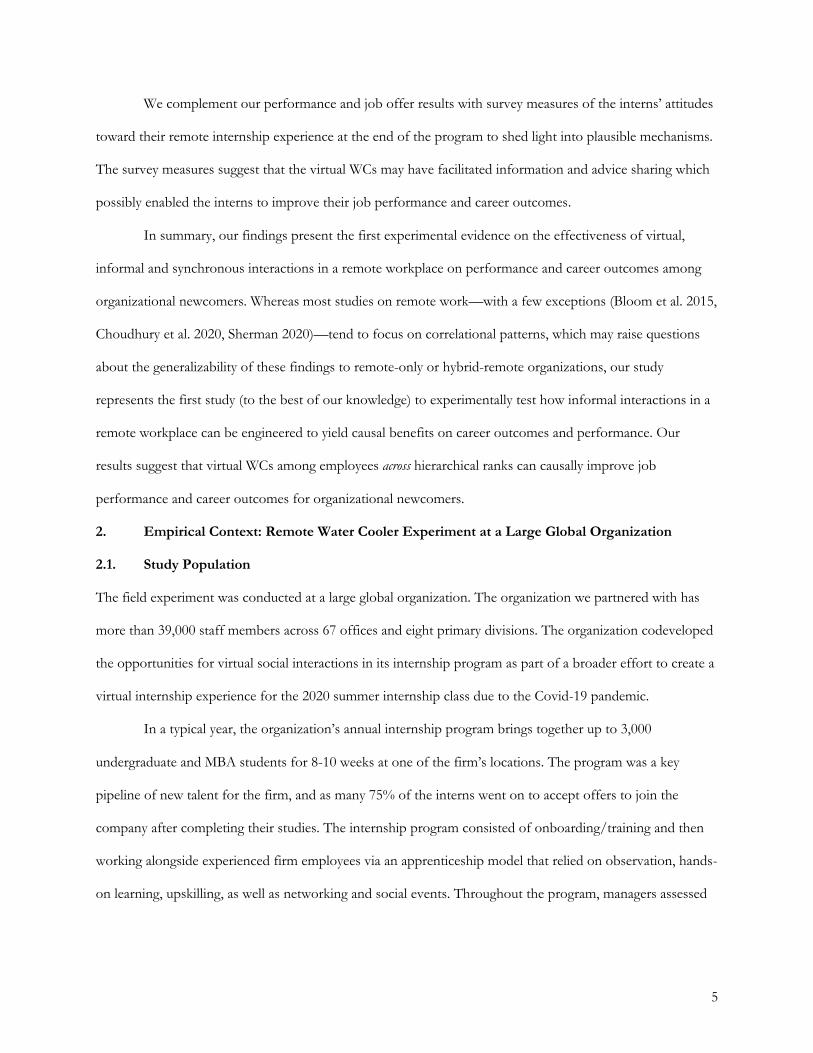
We complement our performance and job offer results with survey measures of the interns’ attitudes
toward their remote internship experience at the end of the program to shed light into plausible mechanisms.
The survey measures suggest that the virtual WCs may have facilitated information and advice sharing which
possibly enabled the interns to improve their job performance and career outcomes.
In summary, our findings present the first experimental evidence on the effectiveness of virtual,
informal and synchronous interactions in a remote workplace on performance and career outcomes among
organizational newcomers. Whereas most studies on remote work—with a few exceptions (Bloom et al. 2015,
Choudhury et al. 2020, Sherman 2020)—tend to focus on correlational patterns, which may raise questions
about the generalizability of these findings to remote-only or hybrid-remote organizations, our study
represents the first study (to the best of our knowledge) to experimentally test how informal interactions in a
remote workplace can be engineered to yield causal benefits on career outcomes and performance. Our
results suggest that virtual WCs among employees across hierarchical ranks can causally improve job
performance and career outcomes for organizational newcomers.
2. Empirical Context: Remote Water Cooler Experiment at a Large Global Organization
2.1. Study Population
The field experiment was conducted at a large global organization. The organization we partnered with has
more than 39,000 staff members across 67 offices and eight primary divisions. The organization codeveloped
the opportunities for virtual social interactions in its internship program as part of a broader effort to create a
virtual internship experience for the 2020 summer internship class due to the Covid-19 pandemic.
In a typical year, the organization’s annual internship program brings together up to 3,000
undergraduate and MBA students for 8-10 weeks at one of the firm’s locations. The program was a key
pipeline of new talent for the firm, and as many 75% of the interns went on to accept offers to join the
company after completing their studies. The internship program consisted of onboarding/training and then
working alongside experienced firm employees via an apprenticeship model that relied on observation, hands-
on learning, upskilling, as well as networking and social events. Throughout the program, managers assessed
6
the interns’ weekly performance via an internal review system. At the close of the program, the firm extended
job offers to interns based on their performance and firm head count needs.
Due to the Covid-19 pandemic, the firm decided to conduct the 2020 summer internship virtually
over a shortened five-week internship. The internship experience would leverage new digital platforms and
incorporate more structured networking and interactive opportunities into the interns’ schedules. As firm
executives worked to develop a virtual internship program, a key concern was ensuring access to socialization
with other interns and senior managers. The firm was particularly concerned that interns would lose a sense
of rapport and camaraderie with their cohort and miss out on opportunities for mentoring. We partnered
with the firm to advise the design of a randomized controlled trial (RCT) that offered a range of different
types of remote social interactions for interns. All 1,370 interns in the firm’s North American internship
program participated in the RCT during weeks 2-5 of their internship. There was no consent process for the
study since the firm developed the experimental conditions as part of the internship program, executed the
experiment and administered all surveys. The firm anonymized all experimental, demographic, and survey
data before sharing the data with the researchers as observational data.
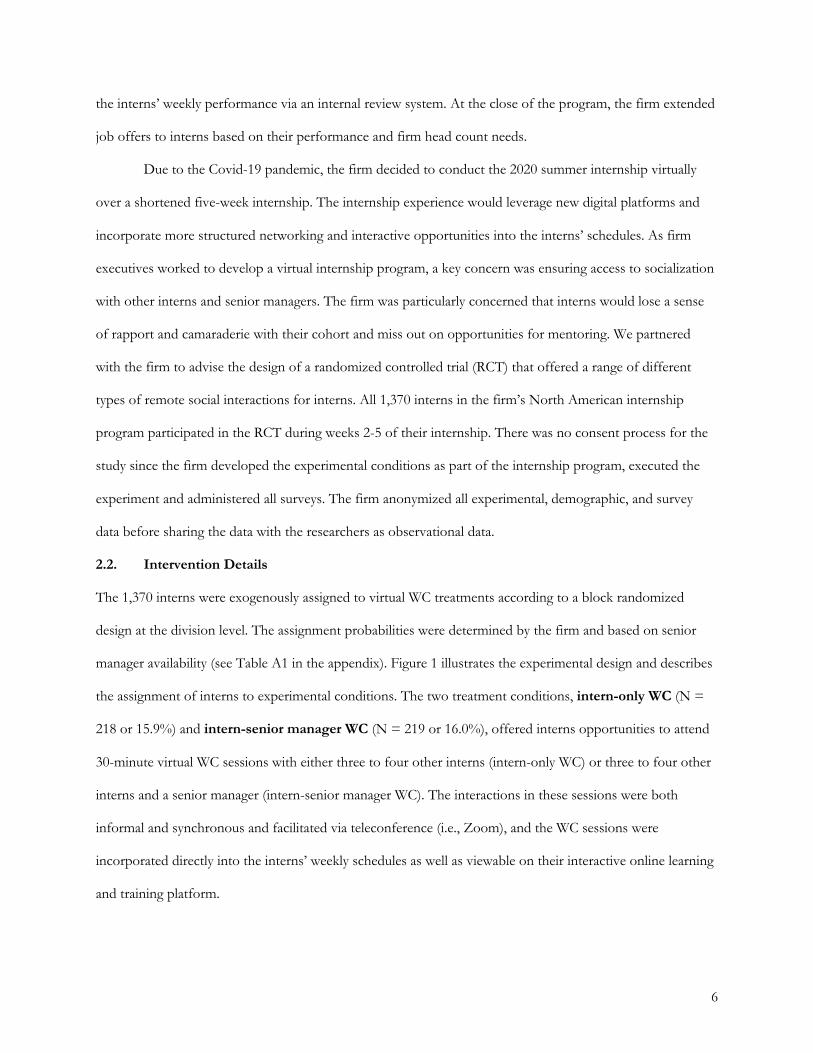
2.2. Intervention Details
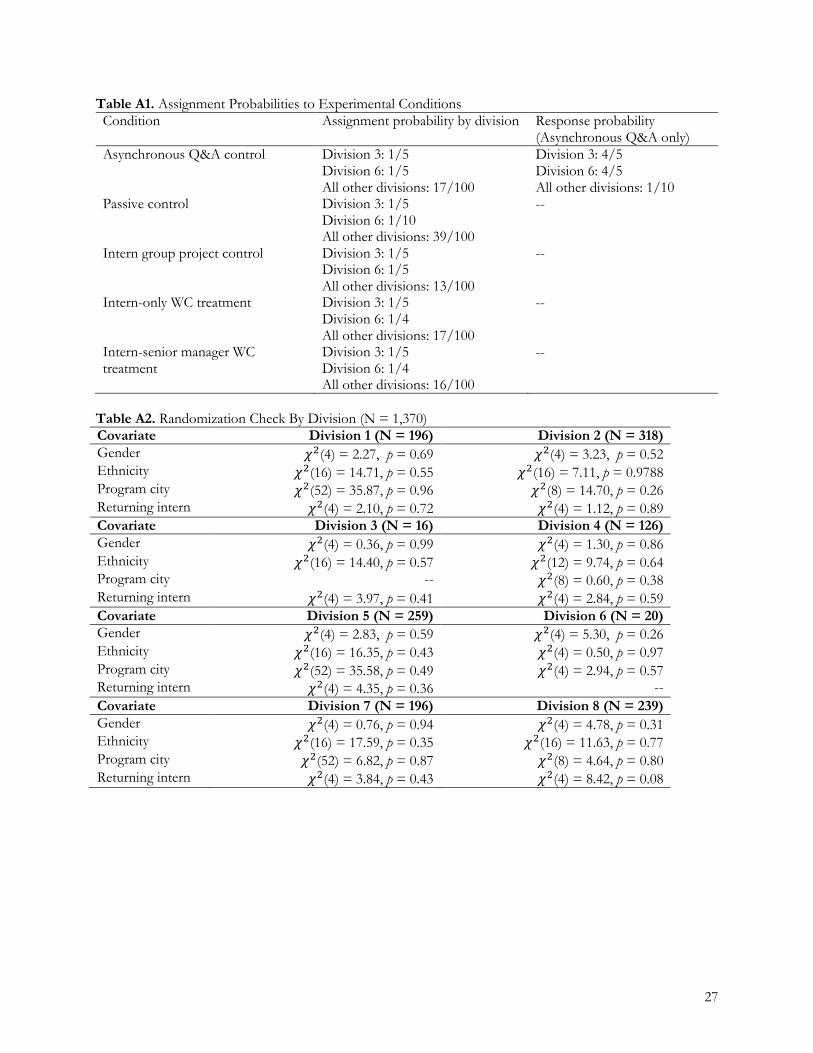
The 1,370 interns were exogenously assigned to virtual WC treatments according to a block randomized
design at the division level. The assignment probabilities were determined by the firm and based on senior
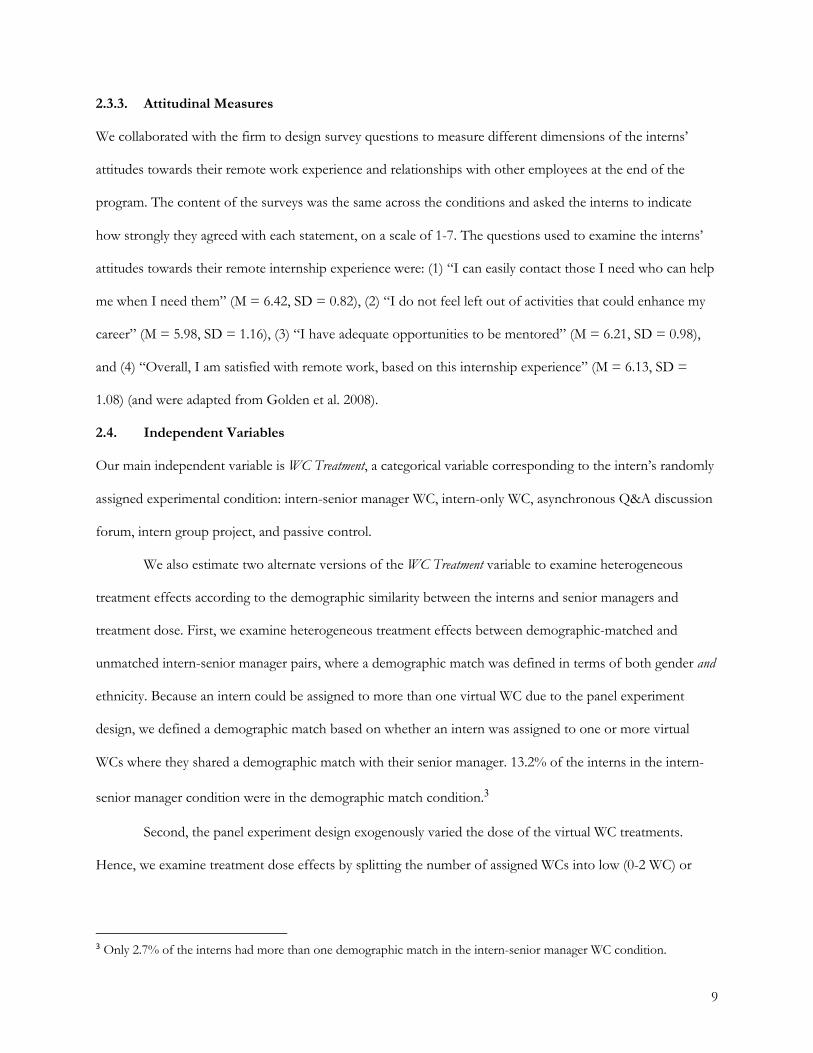
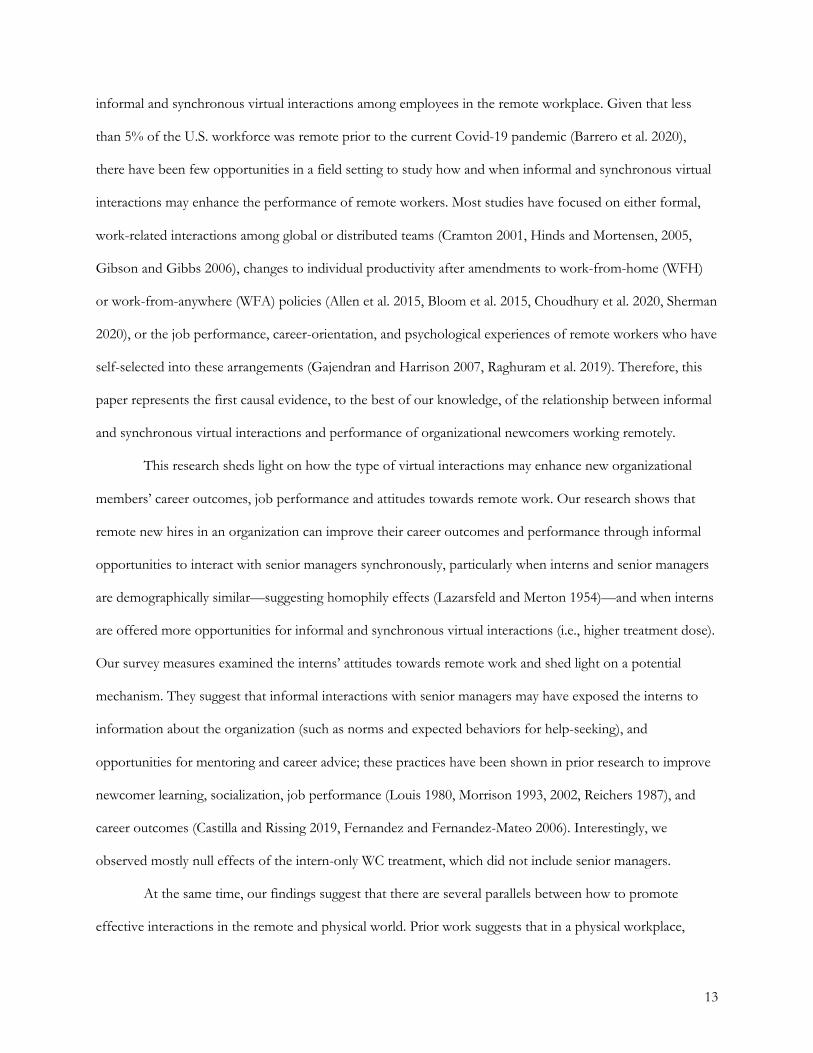
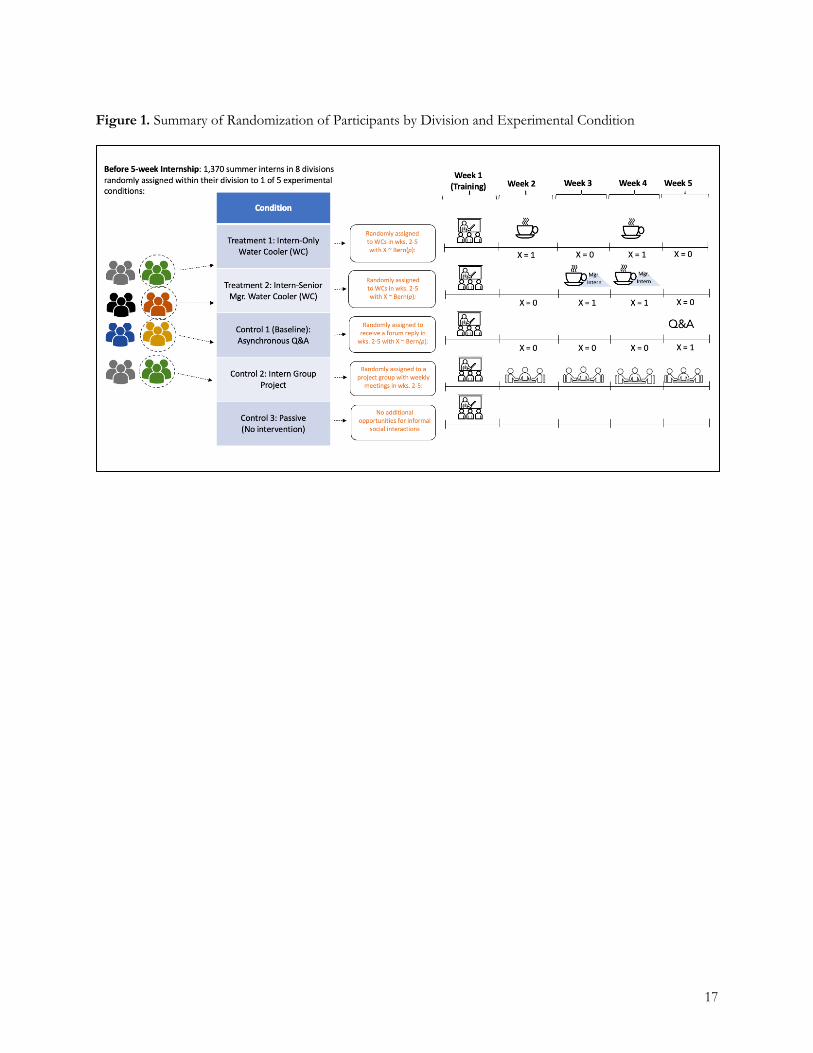
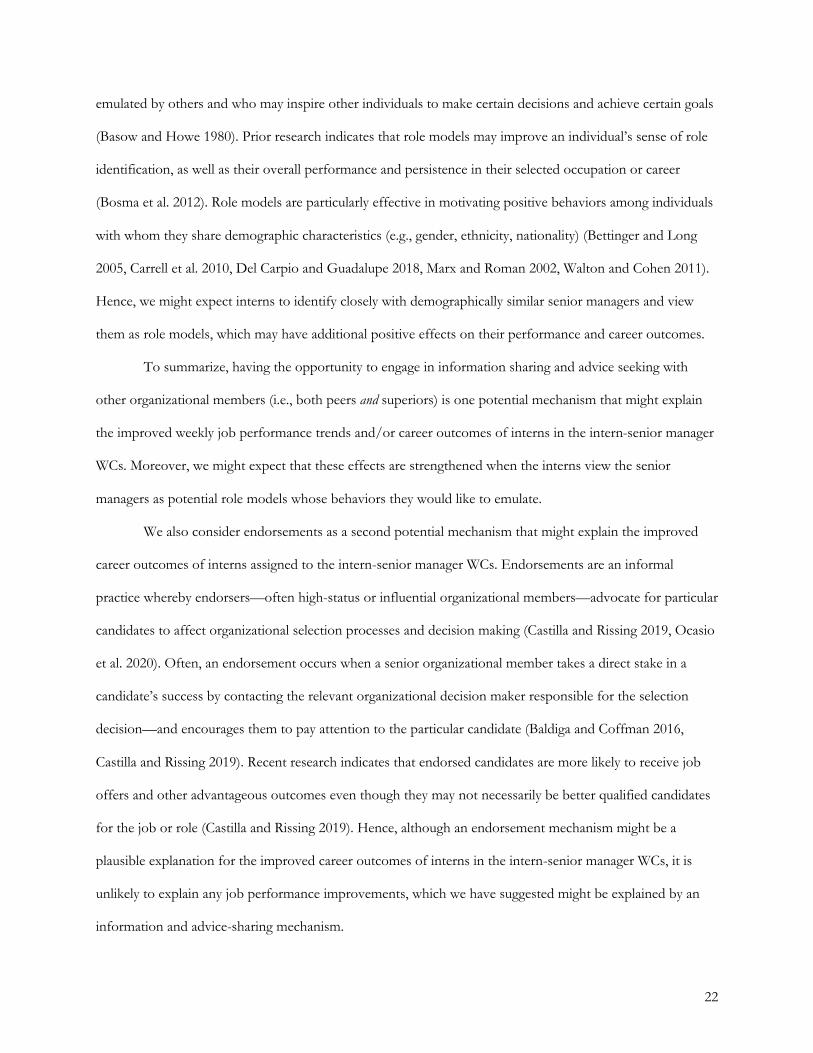
manager availability (see Table A1 in the appendix). Figure 1 illustrates the experimental design and describes
the assignment of interns to experimental conditions. The two treatment conditions, intern-only WC (N =
218 or 15.9%) and intern-senior manager WC (N = 219 or 16.0%), offered interns opportunities to attend
30-minute virtual WC sessions with either three to four other interns (intern-only WC) or three to four other
interns and a senior manager (intern-senior manager WC). The interactions in these sessions were both
informal and synchronous and facilitated via teleconference (i.e., Zoom), and the WC sessions were
incorporated directly into the interns’ weekly schedules as well as viewable on their interactive online learning
and training platform.
7
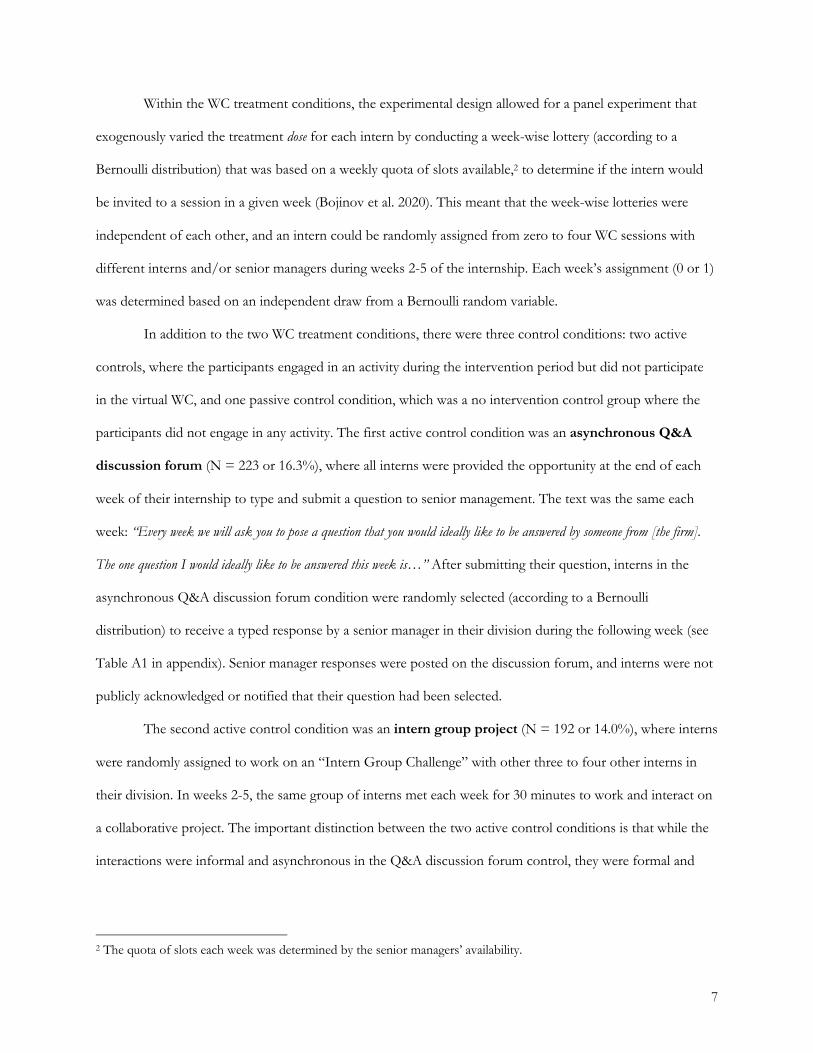
Within the WC treatment conditions, the experimental design allowed for a panel experiment that
exogenously varied the treatment dose for each intern by conducting a week-wise lottery (according to a
Bernoulli distribution) that was based on a weekly quota of slots available,2 to determine if the intern would
be invited to a session in a given week (Bojinov et al. 2020). This meant that the week-wise lotteries were
independent of each other, and an intern could be randomly assigned from zero to four WC sessions with
different interns and/or senior managers during weeks 2-5 of the internship. Each week’s assignment (0 or 1)
was determined based on an independent draw from a Bernoulli random variable.
In addition to the two WC treatment conditions, there were three control conditions: two active
controls, where the participants engaged in an activity during the intervention period but did not participate
in the virtual WC, and one passive control condition, which was a no intervention control group where the
participants did not engage in any activity. The first active control condition was an asynchronous Q&A
discussion forum (N = 223 or 16.3%), where all interns were provided the opportunity at the end of each
week of their internship to type and submit a question to senior management. The text was the same each
week: “Every week we will ask you to pose a question that you would ideally like to be answered by someone from [the firm].
The one question I would ideally like to be answered this week is…” After submitting their question, interns in the
asynchronous Q&A discussion forum condition were randomly selected (according to a Bernoulli
distribution) to receive a typed response by a senior manager in their division during the following week (see
Table A1 in appendix). Senior manager responses were posted on the discussion forum, and interns were not
publicly acknowledged or notified that their question had been selected.
The second active control condition was an intern group project (N = 192 or 14.0%), where interns
were randomly assigned to work on an “Intern Group Challenge” with other three to four other interns in
their division. In weeks 2-5, the same group of interns met each week for 30 minutes to work and interact on
a collaborative project. The important distinction between the two active control conditions is that while the
interactions were informal and asynchronous in the Q&A discussion forum control, they were formal and
2 The quota of slots each week was determined by the senior managers’ availability.
8
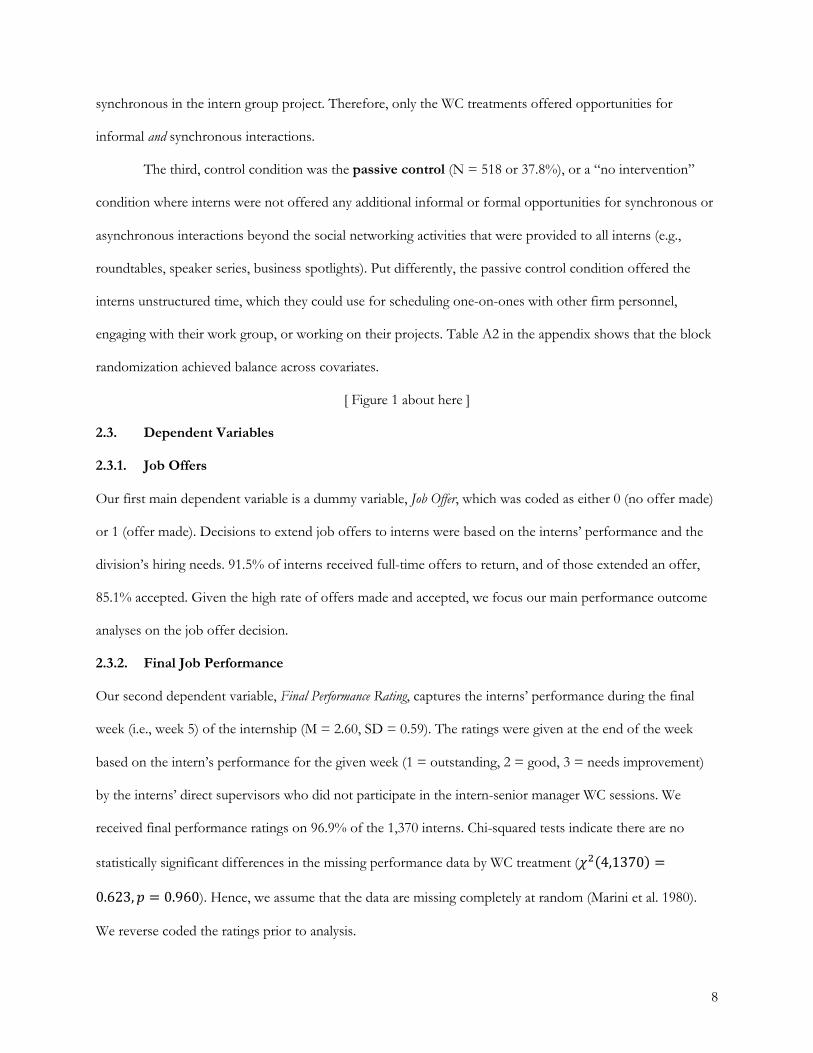
synchronous in the intern group project. Therefore, only the WC treatments offered opportunities for
informal and synchronous interactions.
The third, control condition was the passive control (N = 518 or 37.8%), or a “no intervention”
condition where interns were not offered any additional informal or formal opportunities for synchronous or
asynchronous interactions beyond the social networking activities that were provided to all interns (e.g.,
roundtables, speaker series, business spotlights). Put differently, the passive control condition offered the
interns unstructured time, which they could use for scheduling one-on-ones with other firm personnel,
engaging with their work group, or working on their projects. Table A2 in the appendix shows that the block
randomization achieved balance across covariates.
[ Figure 1 about here ]
2.3. Dependent Variables
2.3.1. Job Offers
Our first main dependent variable is a dummy variable, Job Offer, which was coded as either 0 (no offer made)
or 1 (offer made). Decisions to extend job offers to interns were based on the interns’ performance and the
division’s hiring needs. 91.5% of interns received full-time offers to return, and of those extended an offer,
85.1% accepted. Given the high rate of offers made and accepted, we focus our main performance outcome
analyses on the job offer decision.
2.3.2. Final Job Performance
Our second dependent variable, Final Performance Rating, captures the interns’ performance during the final
week (i.e., week 5) of the internship (M = 2.60, SD = 0.59). The ratings were given at the end of the week
based on the intern’s performance for the given week (1 = outstanding, 2 = good, 3 = needs improvement)
by the interns’ direct supervisors who did not participate in the intern-senior manager WC sessions. We
received final performance ratings on 96.9% of the 1,370 interns. Chi-squared tests indicate there are no
statistically significant differences in the missing performance data by WC treatment (!!(4,1370) =
0.623, . = 0.960). Hence, we assume that the data are missing completely at random (Marini et al. 1980).
We reverse coded the ratings prior to analysis.
9
2.3.3. Attitudinal Measures
We collaborated with the firm to design survey questions to measure different dimensions of the interns’
attitudes towards their remote work experience and relationships with other employees at the end of the
program. The content of the surveys was the same across the conditions and asked the interns to indicate
how strongly they agreed with each statement, on a scale of 1-7. The questions used to examine the interns’
attitudes towards their remote internship experience were: (1) “I can easily contact those I need who can help
me when I need them” (M = 6.42, SD = 0.82), (2) “I do not feel left out of activities that could enhance my
career” (M = 5.98, SD = 1.16), (3) “I have adequate opportunities to be mentored” (M = 6.21, SD = 0.98),
and (4) “Overall, I am satisfied with remote work, based on this internship experience” (M = 6.13, SD =
1.08) (and were adapted from Golden et al. 2008).
2.4. Independent Variables
Our main independent variable is WC Treatment, a categorical variable corresponding to the intern’s randomly
assigned experimental condition: intern-senior manager WC, intern-only WC, asynchronous Q&A discussion
forum, intern group project, and passive control.
We also estimate two alternate versions of the WC Treatment variable to examine heterogeneous
treatment effects according to the demographic similarity between the interns and senior managers and
treatment dose. First, we examine heterogeneous treatment effects between demographic-matched and
unmatched intern-senior manager pairs, where a demographic match was defined in terms of both gender and
ethnicity. Because an intern could be assigned to more than one virtual WC due to the panel experiment
design, we defined a demographic match based on whether an intern was assigned to one or more virtual
WCs where they shared a demographic match with their senior manager. 13.2% of the interns in the intern-
senior manager condition were in the demographic match condition.3
Second, the panel experiment design exogenously varied the dose of the virtual WC treatments.
Hence, we examine treatment dose effects by splitting the number of assigned WCs into low (0-2 WC) or
3 Only 2.7% of the interns had more than one demographic match in the intern-senior manager WC condition.
10
high (3-4 WC) treatment dose. 19.6% of interns in the intern-senior manager WC were randomly assigned to
a high treatment dose.
3. Statistical Analysis
For our baseline analysis, we use a block-specific difference-in-means (BDIM) approach that accounts for the
block (i.e., organizational division) randomization structure to estimate overall treatment effects. The BDIM
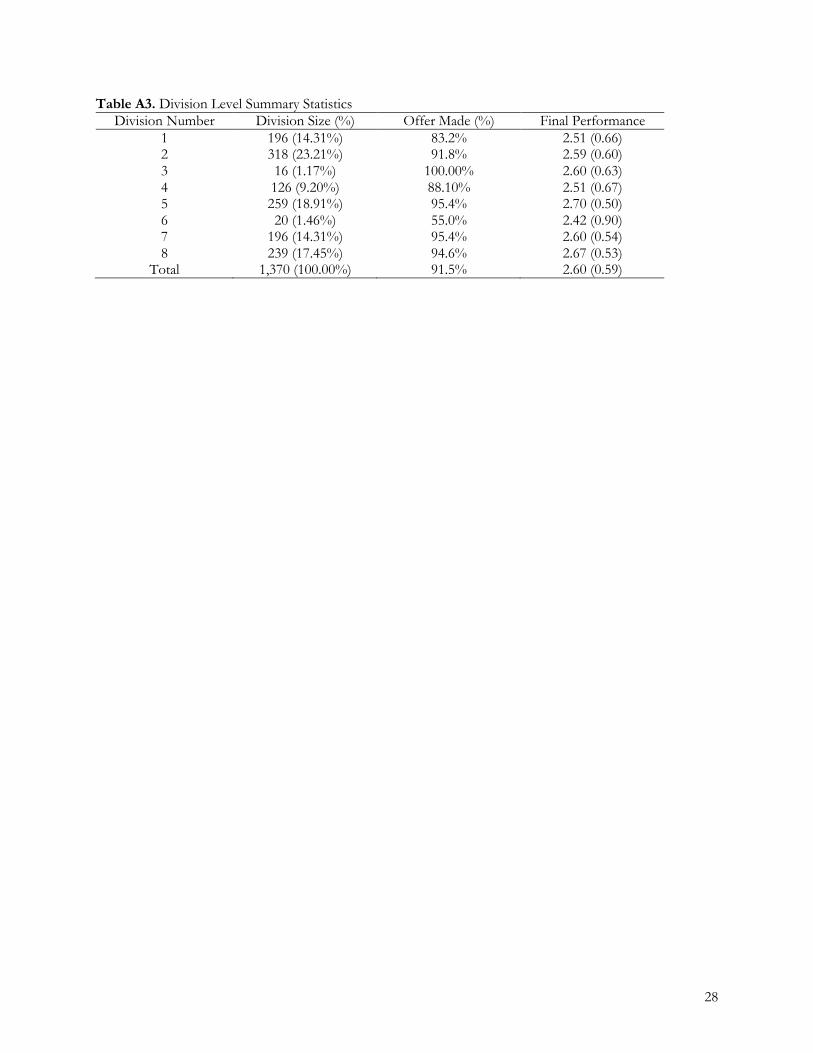
is the natural estimator for blocked randomized experiments as it is the weighted average (the weights depend
on the blocks' size; see Table A3 in the appendix) of the within block treatment effects (Cox and Reid 2000).
We analyze the data on an intent-to-treat basis, which means we analyze data from all participants
randomized into a condition, regardless of whether they actually engaged in the activity or conversation
(Lachin 2000). Our results are robust for employing saturated OLS models (Lin 2013) (see Tables A4-A18 for
BDIM results and Tables A21-A37 for fully interacted OLS model results).
4. Results
4.1. Job Offer Results
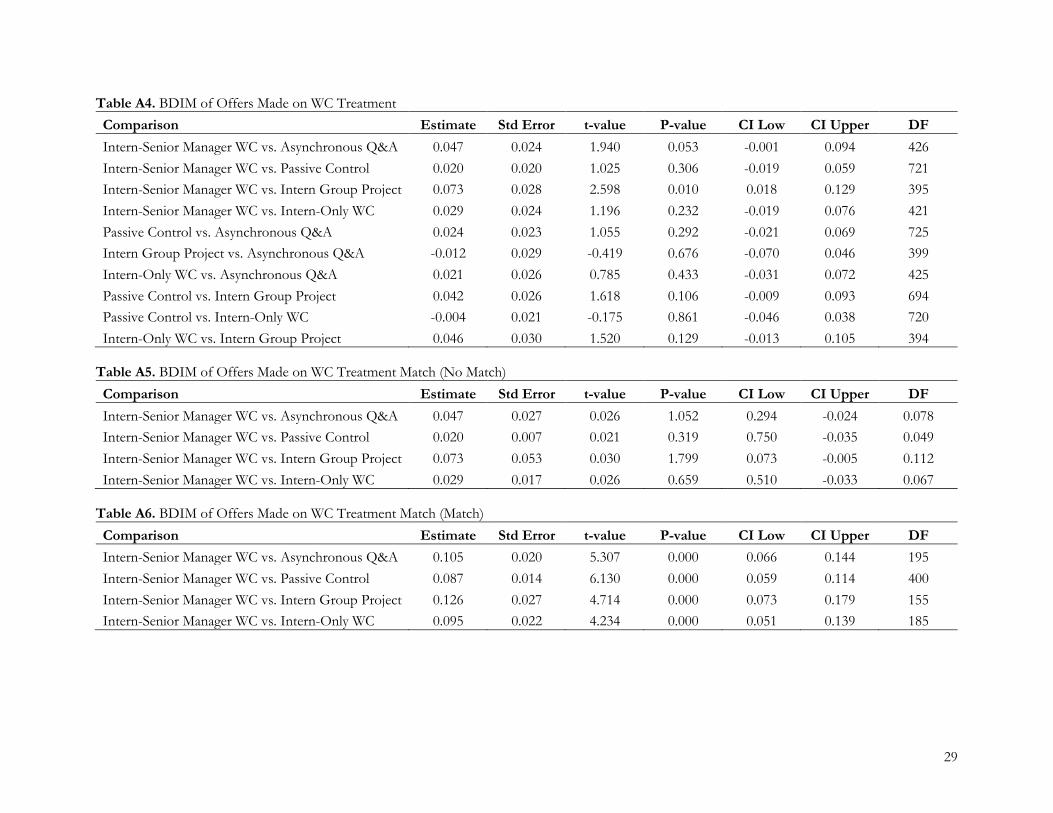
The intern-senior manager WCs had a significant and positive effect on the interns’ end of program job
offers. We find that interns who were exogenously assigned to the intern-senior manager WCs were 4.7 pp
more likely to receive an offer than the asynchronous Q&A control (BDIM = 0.047, p = 0.053), and 7.3pp
more likely to receive an offer than the intern group project control condition (BDIM = 0.073, p = 0.010).
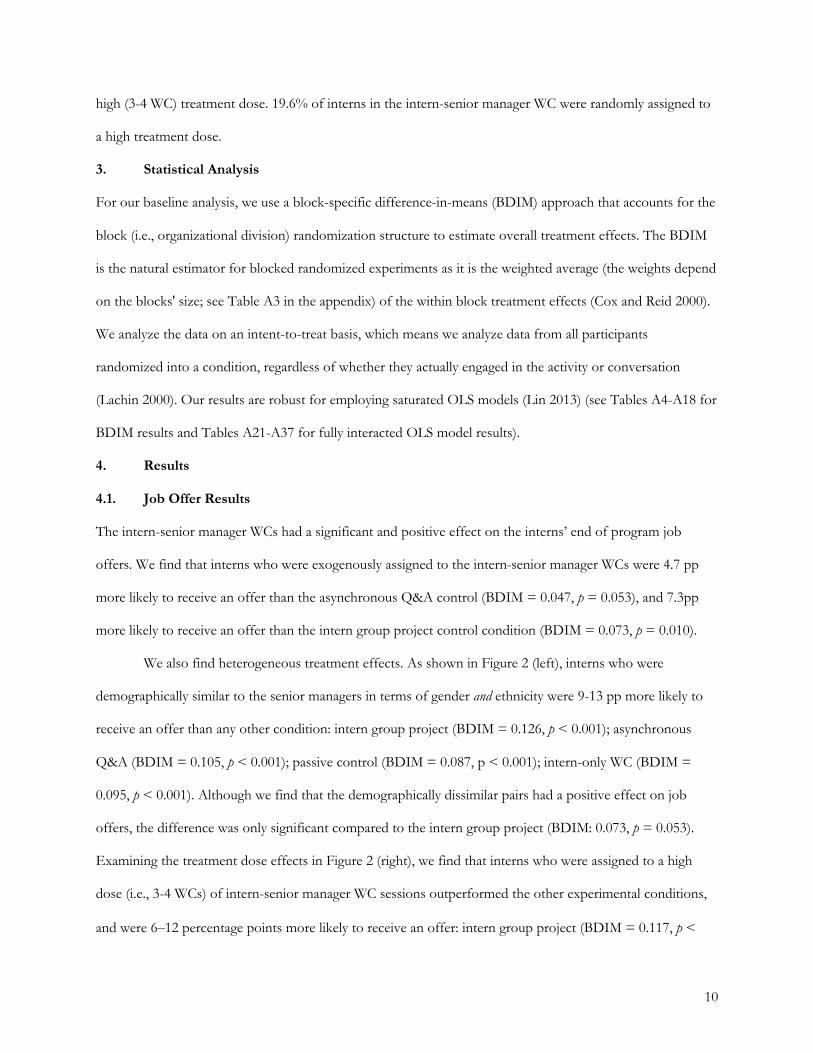
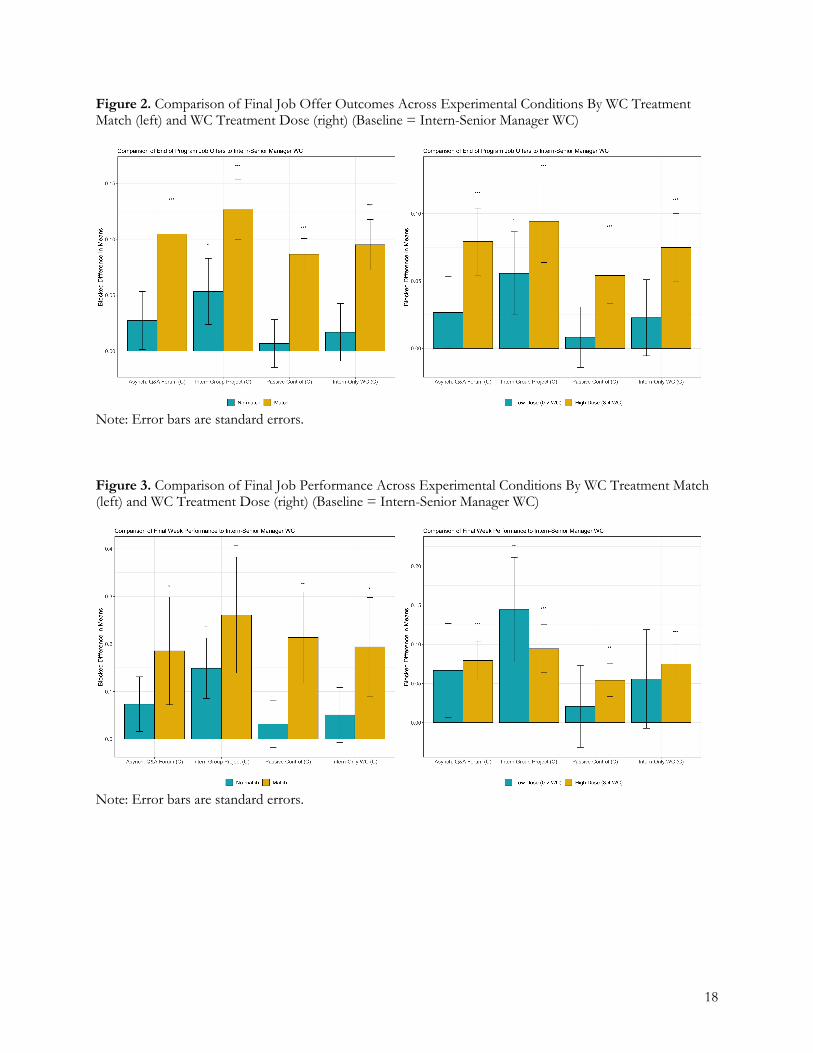
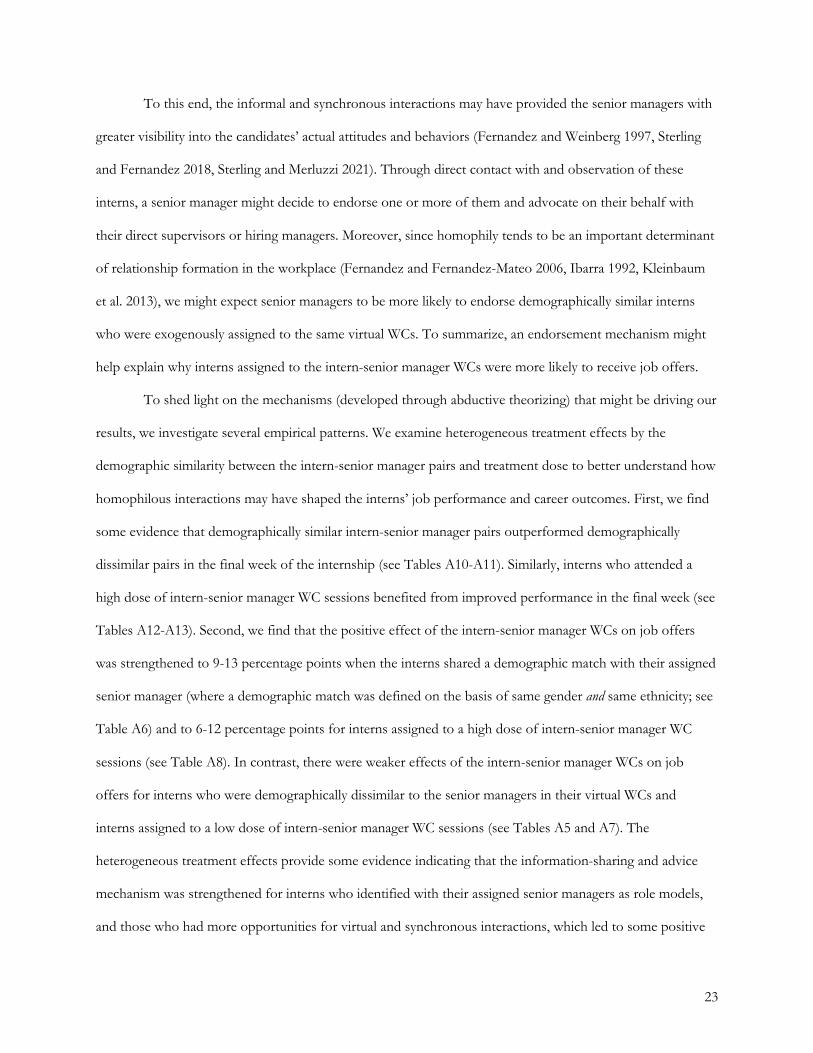
We also find heterogeneous treatment effects. As shown in Figure 2 (left), interns who were
demographically similar to the senior managers in terms of gender and ethnicity were 9-13 pp more likely to
receive an offer than any other condition: intern group project (BDIM = 0.126, p < 0.001); asynchronous
Q&A (BDIM = 0.105, p < 0.001); passive control (BDIM = 0.087, p < 0.001); intern-only WC (BDIM =
0.095, p < 0.001). Although we find that the demographically dissimilar pairs had a positive effect on job
offers, the difference was only significant compared to the intern group project (BDIM: 0.073, p = 0.053).
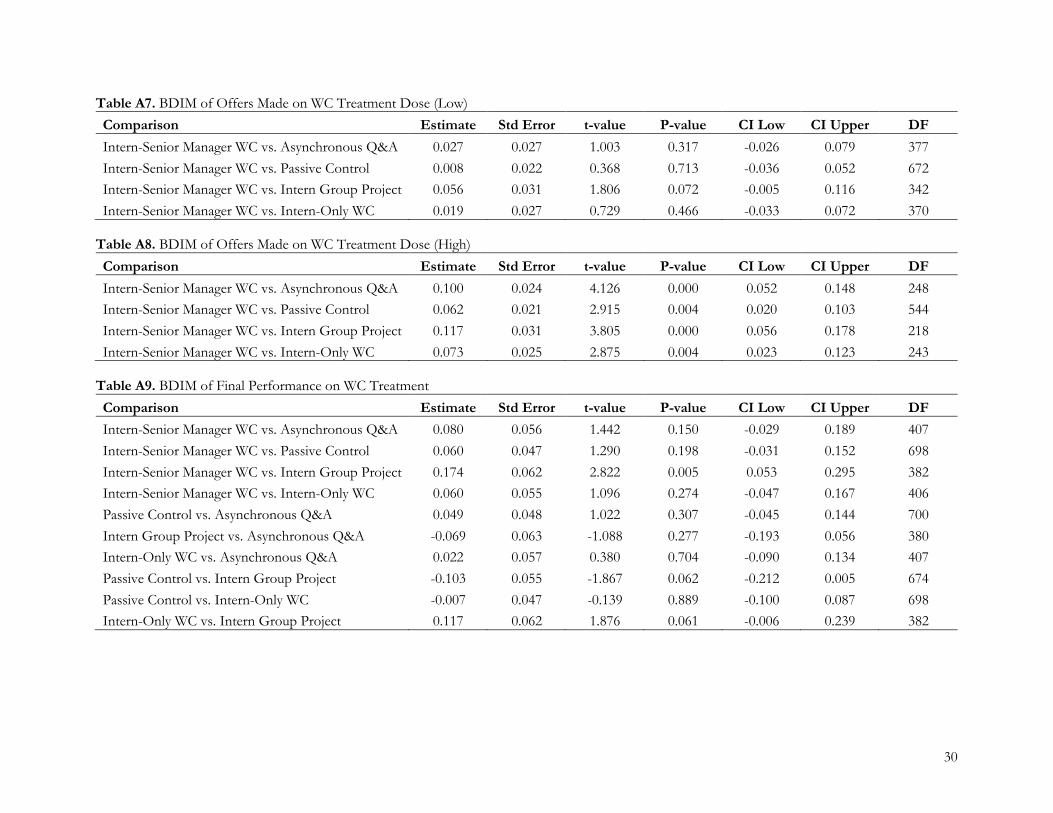
Examining the treatment dose effects in Figure 2 (right), we find that interns who were assigned to a high
dose (i.e., 3-4 WCs) of intern-senior manager WC sessions outperformed the other experimental conditions,
and were 6‒12 percentage points more likely to receive an offer: intern group project (BDIM = 0.117, p <
11
0.001); asynchronous Q&A (BDIM = 0.100, p < 0.001); passive control (BDIM = 0.062, p = 0.004); intern-
only WC (BDIM = 0.073, p = 0.004). In contrast, we found weaker effects of a low dose of intern-senior
manager WC sessions (intern group project: BDIM = 0.056, p = 0.072; asynchronous Q&A: BDIM = 0.027,
p = 0.317; passive control: BDIM = 0.008, p = 0.713; intern-only WC: BDIM = 0.019, p = 0.466).
Overall, we find that the intern-senior manager WCs improved the likelihood of receiving a job offer,
and the effects were strengthened among demographically similar pairs and interns with more opportunities
to attend WC sessions. Results are robust for saturated OLS models (see appendix).
4.2. Final Job Performance Results
The intern-senior manager WCs had a significant and positive effect on the interns’ final performance ratings,
particularly when we examined heterogeneous treatment effects by demographic similarity and treatment
dose. We observe that the intern-senior manager WC condition benefitted from improved final performance
ratings, and that the difference was statistically significant compared to the intern group project condition
(BDIM = 0.174, p = 0.005).
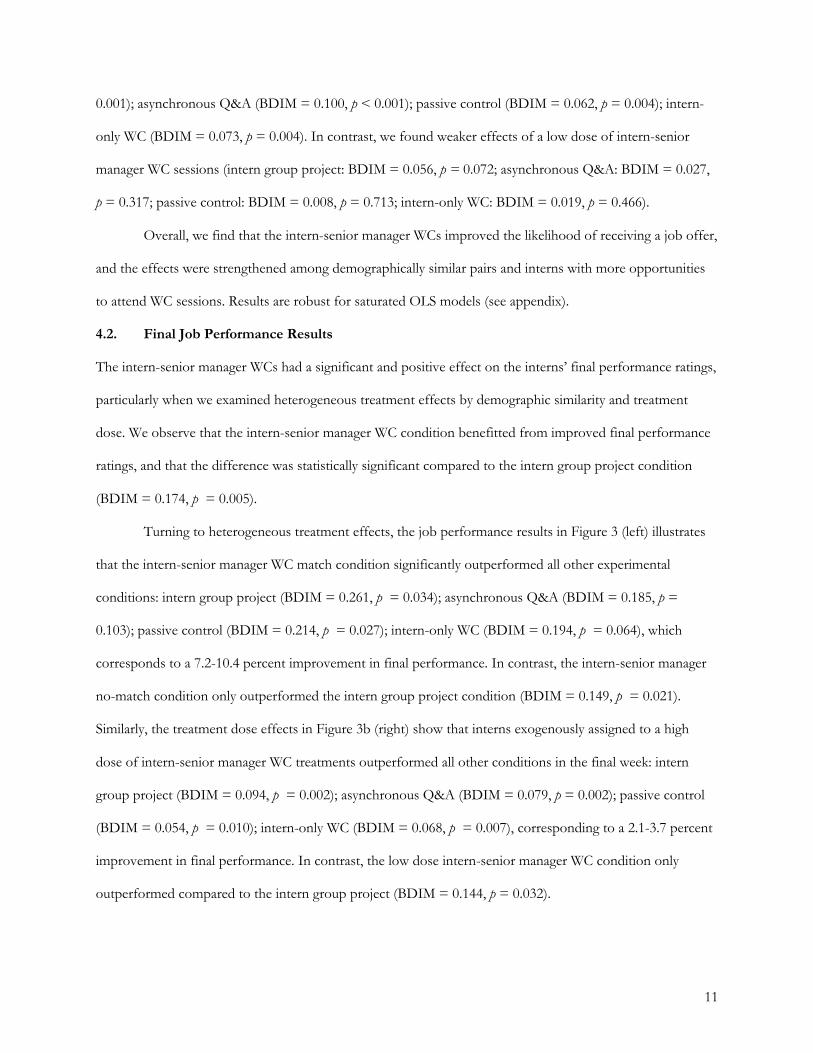
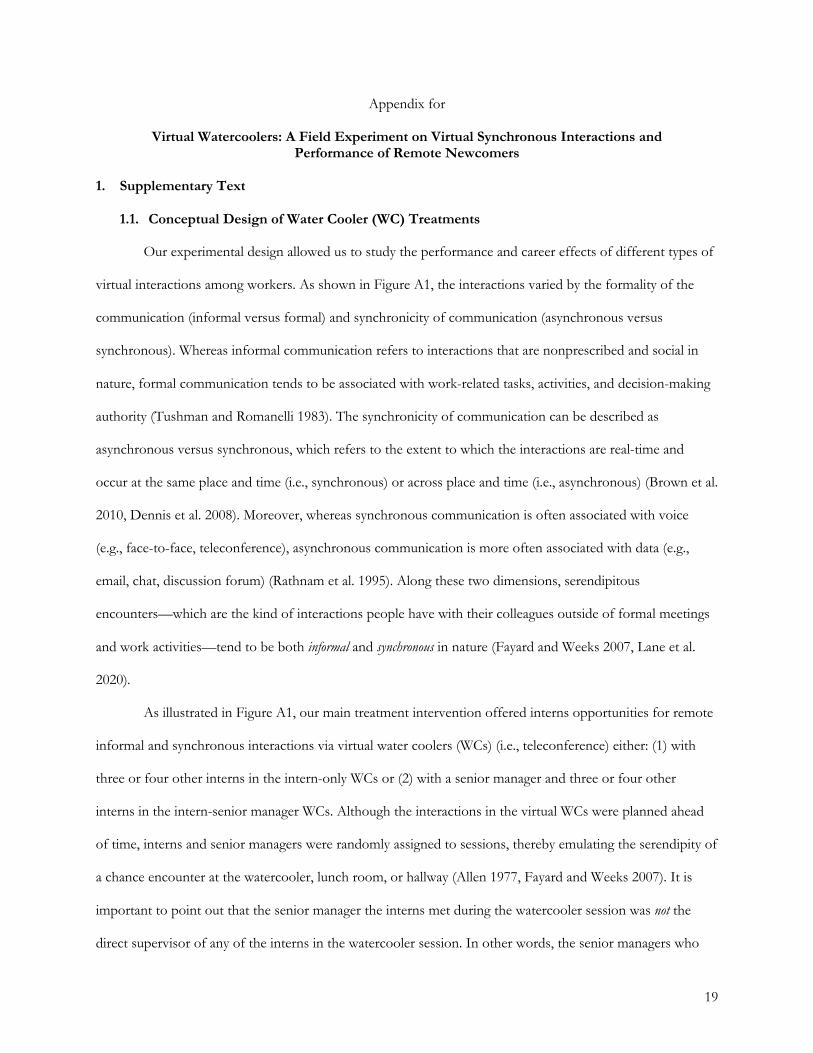
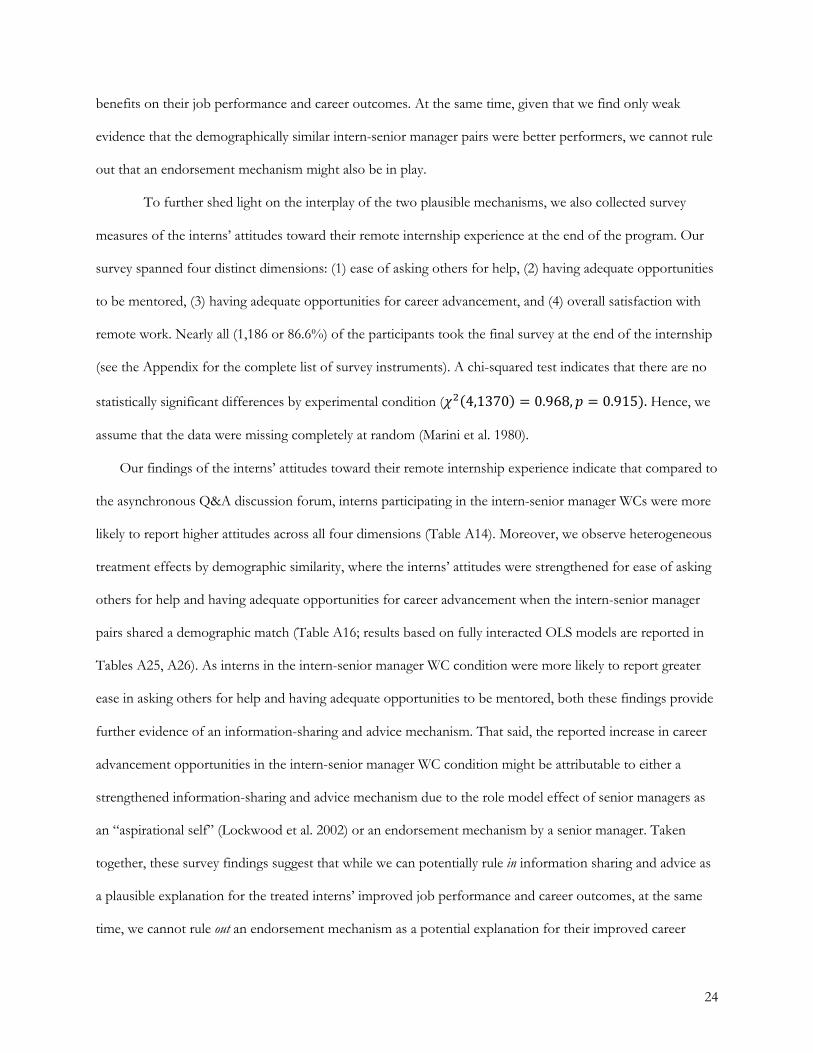
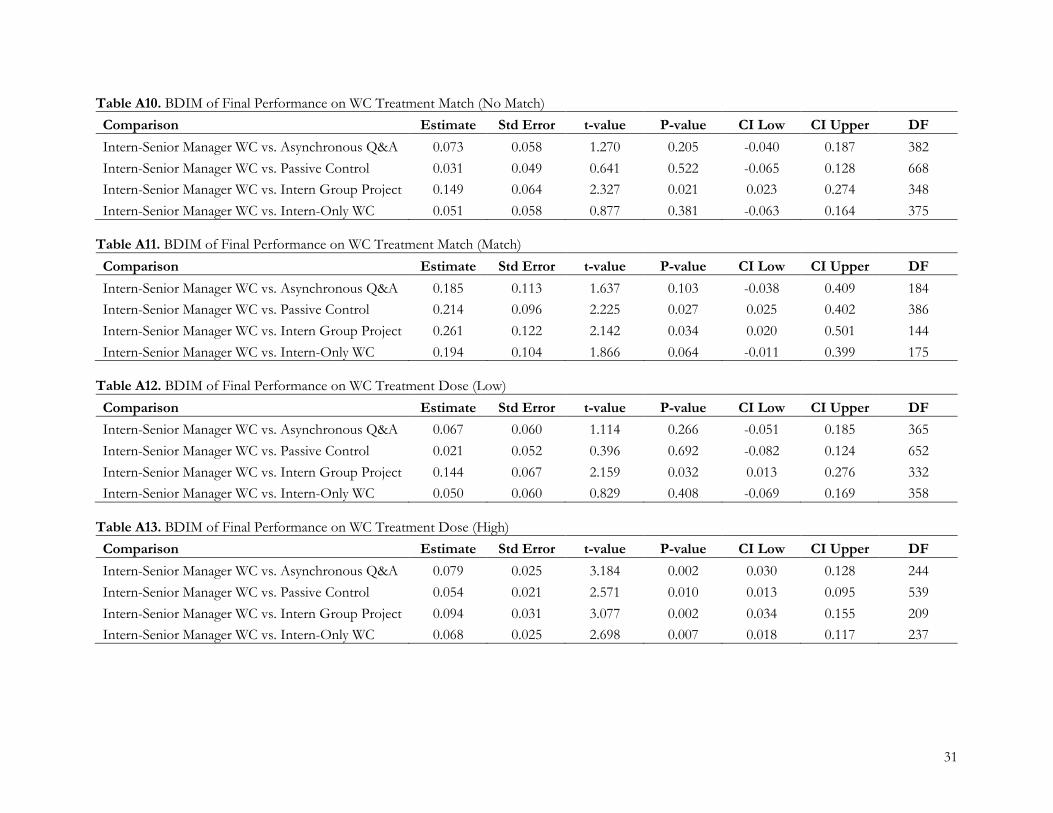
Turning to heterogeneous treatment effects, the job performance results in Figure 3 (left) illustrates
that the intern-senior manager WC match condition significantly outperformed all other experimental
conditions: intern group project (BDIM = 0.261, p = 0.034); asynchronous Q&A (BDIM = 0.185, p =
0.103); passive control (BDIM = 0.214, p = 0.027); intern-only WC (BDIM = 0.194, p = 0.064), which
corresponds to a 7.2-10.4 percent improvement in final performance. In contrast, the intern-senior manager
no-match condition only outperformed the intern group project condition (BDIM = 0.149, p = 0.021).
Similarly, the treatment dose effects in Figure 3b (right) show that interns exogenously assigned to a high
dose of intern-senior manager WC treatments outperformed all other conditions in the final week: intern
group project (BDIM = 0.094, p = 0.002); asynchronous Q&A (BDIM = 0.079, p = 0.002); passive control
(BDIM = 0.054, p = 0.010); intern-only WC (BDIM = 0.068, p = 0.007), corresponding to a 2.1-3.7 percent
improvement in final performance. In contrast, the low dose intern-senior manager WC condition only
outperformed compared to the intern group project (BDIM = 0.144, p = 0.032).
12
Taken together, the results suggest that the intern-senior manager WCs positively increased the
interns’ job performance, and that these effects were strengthened when the interns and senior managers
shared a demographic match and when there were more opportunities to attend the WC sessions. Results are
robust for saturated OLS models (see appendix).
4.3. Abductive Explanations: End of Internship Survey Results
In the spirit of generating abductive explanations (King et al. 2019)4 of our main results, we leveraged interns’
responses from an end-of-internship survey. This enables us to rule in one plausible mechanism, i.e., the
performance enhancing benefits of sharing information and advice with organizational newcomers (e.g.,
Cooper and Kurland 2002). A detailed discussion is documented in the appendix (section 1.2 of appendix;
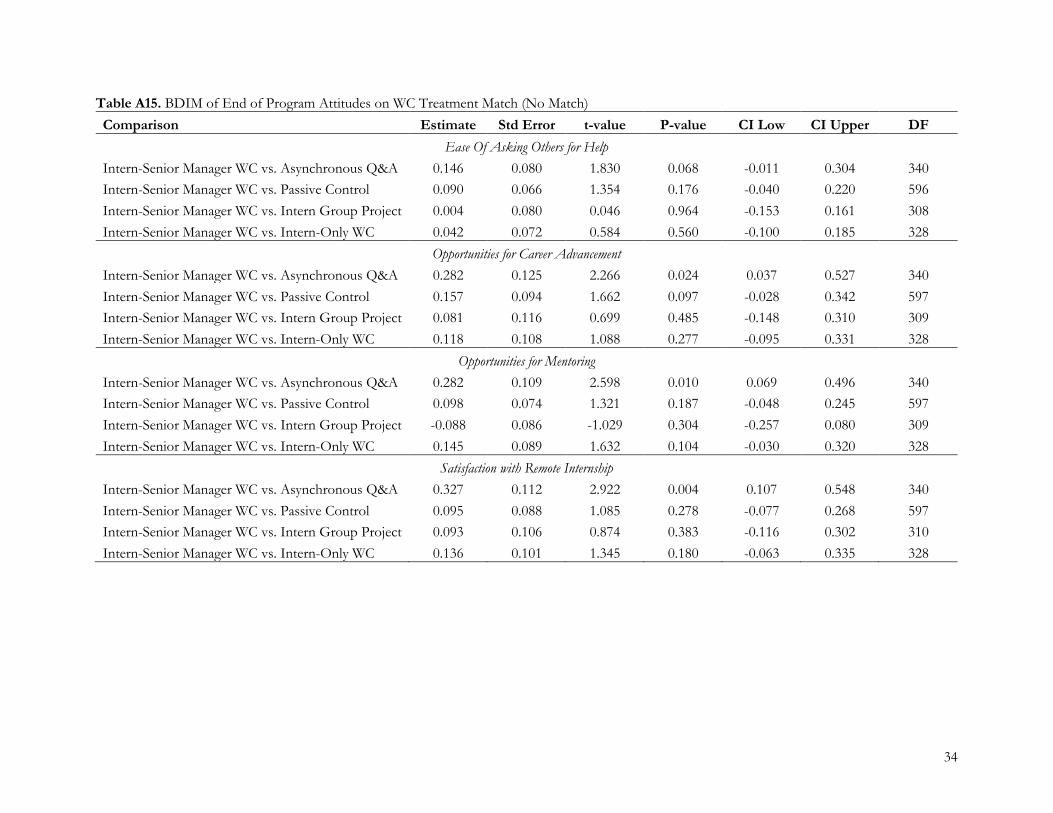
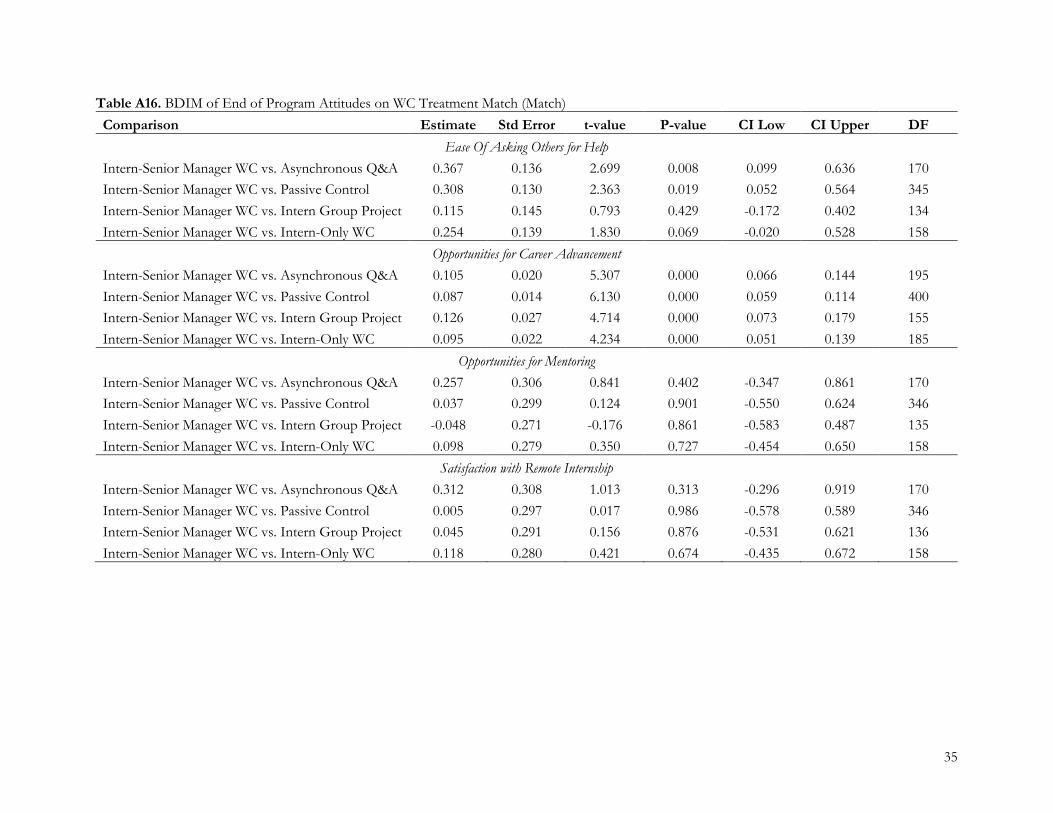
Tables A14, A16, A25, A26).
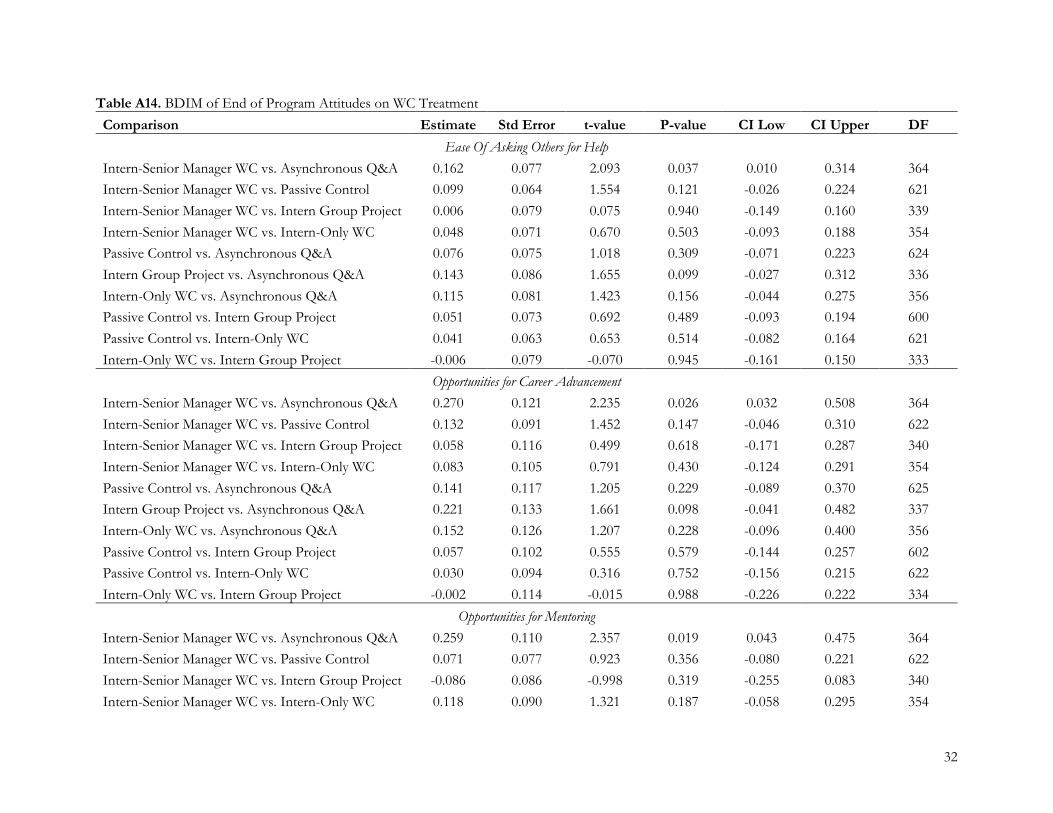
We find that the intern-senior manager WC condition had directionally higher attitudes than the
other conditions, and that the positive effect was significant compared to the asynchronous Q&A condition
across all four attitudinal measures: ease of contacting others for help (BDIM = 0.162, p = 0.037),
opportunities for career enhancement (BDIM = 0.270, p = 0.026) and mentorship (BDIM = 0.259, p =
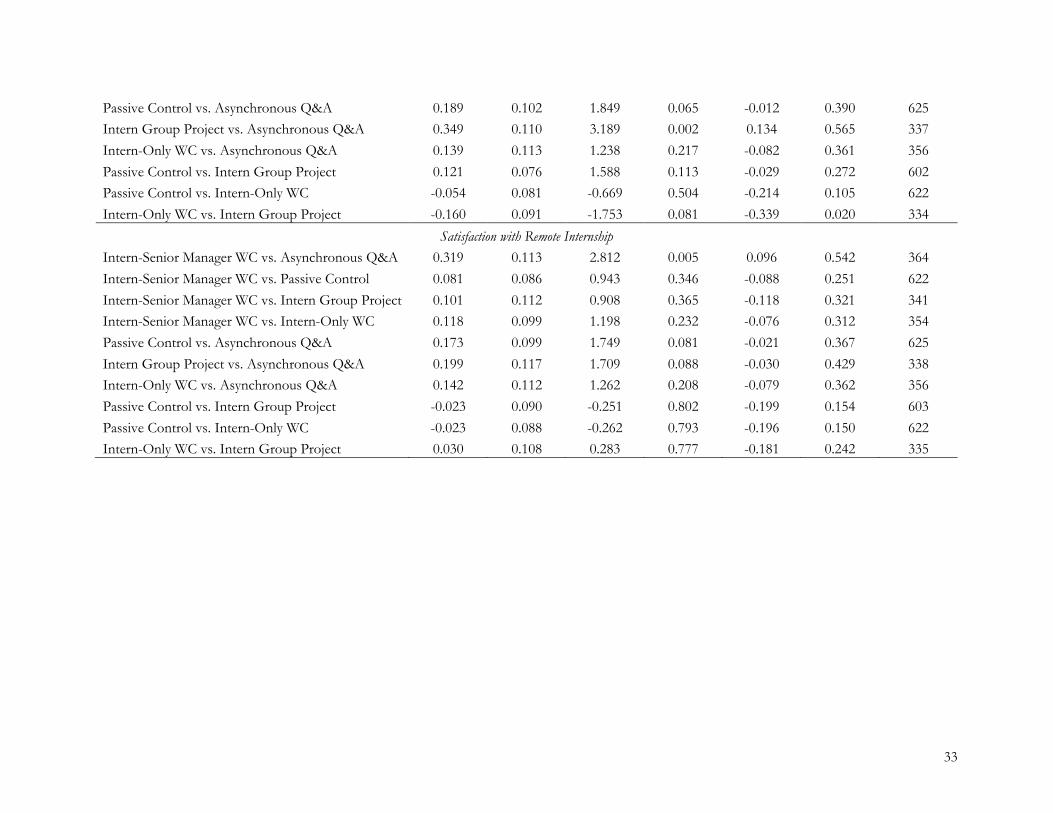
0.019), as well as overall satisfaction with remote work (BDIM = 0.319, p = 0.005), corresponding to a 2.6-5.4
percent increase in attitudes. We also note there are heterogeneous treatment effects for the intern-senior
manager WC match condition towards ease of asking others for help (intern group project: BDIM = 0.115,
ns; asynchronous Q&A: BDIM = 0.367, p = 0.008; passive control: BDIM = 0.308, p = 0.019; intern-only
WC: BDIM = 0.254, p = 0.069), as well as opportunities for career enhancement (intern group project: BDIM
= 0.126, p < 0.001; asynchronous Q&A: BDIM = 0.105, p < 0.001; passive control: BDIM = 0.087, p <
0.001; intern-only WC: BDIM = 0.095, p < 0.001).
5. Discussion
Our study that leverages a field experiment testing the effects of virtual watercoolers on performance of
remote interns offers important new theoretical and applied insights on the effectiveness of scheduling
4 Abductive reasoning or explanations is a process of reasoning based on creating and testing hypotheses using the best information or evidence available to look for cause-and-effect relationships.
13
informal and synchronous virtual interactions among employees in the remote workplace. Given that less
than 5% of the U.S. workforce was remote prior to the current Covid-19 pandemic (Barrero et al. 2020),
there have been few opportunities in a field setting to study how and when informal and synchronous virtual
interactions may enhance the performance of remote workers. Most studies have focused on either formal,
work-related interactions among global or distributed teams (Cramton 2001, Hinds and Mortensen, 2005,
Gibson and Gibbs 2006), changes to individual productivity after amendments to work-from-home (WFH)
or work-from-anywhere (WFA) policies (Allen et al. 2015, Bloom et al. 2015, Choudhury et al. 2020, Sherman
2020), or the job performance, career-orientation, and psychological experiences of remote workers who have
self-selected into these arrangements (Gajendran and Harrison 2007, Raghuram et al. 2019). Therefore, this
paper represents the first causal evidence, to the best of our knowledge, of the relationship between informal
and synchronous virtual interactions and performance of organizational newcomers working remotely.
This research sheds light on how the type of virtual interactions may enhance new organizational
members’ career outcomes, job performance and attitudes towards remote work. Our research shows that
remote new hires in an organization can improve their career outcomes and performance through informal
opportunities to interact with senior managers synchronously, particularly when interns and senior managers
are demographically similar—suggesting homophily effects (Lazarsfeld and Merton 1954)—and when interns
are offered more opportunities for informal and synchronous virtual interactions (i.e., higher treatment dose).
Our survey measures examined the interns’ attitudes towards remote work and shed light on a potential
mechanism. They suggest that informal interactions with senior managers may have exposed the interns to
information about the organization (such as norms and expected behaviors for help-seeking), and
opportunities for mentoring and career advice; these practices have been shown in prior research to improve
newcomer learning, socialization, job performance (Louis 1980, Morrison 1993, 2002, Reichers 1987), and
career outcomes (Castilla and Rissing 2019, Fernandez and Fernandez-Mateo 2006). Interestingly, we
observed mostly null effects of the intern-only WC treatment, which did not include senior managers.
At the same time, our findings suggest that there are several parallels between how to promote
effective interactions in the remote and physical world. Prior work suggests that in a physical workplace,
14
informal interactions with senior organizational members can improve an employee’s social assimilation and
performance (Ancona and Caldwell 1992, Morrison 2002, Ostroff and Kozlowski 1992), while research on
homophily indicates that employees prefer to form interpersonal and advice-seeking relations with
demographically similar others within their organizations (Fernandez and Fernandez-Mateo 2006, Kleinbaum
et al. 2013). However, we have no prior insights on the performance effects of informal social interactions in
a remote workplace. Overall, our results are encouraging, as they suggest that opportunities for brief informal
and synchronous interactions with senior members can enhance a new employee’s socialization to the
organization and improve their productivity in a short amount of time.
This work is not without limitations. First, we focused on a five-week internship experience, whereas
the sharing of information and advice through informal interactions often depends on interpersonal trust and
may require more time to develop (Levin and Cross 2004). Hence, future research should measure how WC
treatments affect performance, career outcomes and knowledge/advice sharing over a longer duration.
Second, while we focused on a completely virtual setting, where all employees were remote, it is likely that
after the pandemic ends, firms will implement policies that embrace hybrid-remote work practices (Barrero et
al. 2020). Therefore, future research should aim to examine what types of informal social interactions will be
most likely to benefit workers who work partly in the office and partly remote, and/or remote workers in a
hybrid remote workplace. Third, our research was conducted within a single organization which makes the
context of our results specific to the organization. We also focused on newcomers to an organization—
specifically interns, who may have different requirements and needs for social interactions, compared to
existing employees who may have already established social capital (Sterling and Fernandez 2018, Sterling and
Merluzzi 2021). That said, understanding how virtual interactions enhances performance for both newcomers
and firm insiders is critical, particularly as organizations onboard new remote workers both during and
beyond the pandemic.
In summary, our study, to the best of our knowledge, presents the first experimental evidence on
whether informal interactions in a remote workplace improve performance outcomes among organizational
newcomers. Our results suggest that informal and synchronous interactions with peers and senior
15
organizational members can be beneficial for improving career outcomes, job performance and attitudes
toward remote work. Insights from our study are of immediate relevance as firms transition to all-remote and
hybrid-remote work arrangements.
References
Allen TD, Golden TD, Shockley KM (2015) How effective is telecommuting? Assessing the status of our scientific findings. Psychol. Sci. Public Interest 16(2):40–68.
Ancona DG, Caldwell DF (1992) Demography and design: Predictors of new product team performance. Organ. Sci. 3(3):321–341.
Barrero JM, Bloom N, Davis SJ (2020) Why Working From Home Will Stick. Univ. Chic. Becker Friedman Inst. Econ. Work. Pap. (2020–174).
Bloom N, Liang J, Roberts J, Ying ZJ (2015) Does working from home work? Evidence from a Chinese experiment. Q. J. Econ. 130(1):165–218.
Bojinov I, Rambachan A, Shephard N (2020) Panel Experiments and Dynamic Causal Effects: A Finite Population Perspective. Quantitative Economics, Accepted.
Brown SA, Dennis AR, Venkatesh V (2010) Predicting collaboration technology use: Integrating technology adoption and collaboration research. J. Manag. Inf. Syst. 27(2):9–54.
Castilla EJ, Rissing BA (2019) Best in class: The returns on application endorsements in higher education. Adm. Sci. Q. 64(1):230–270.
Choudhury P, Foroughi C, Larson BZ (2020) Work-from-anywhere: The productivity effects of geographic flexibility. Strateg. Manag. J. 2020(1):1–29.
Cooper CD, Kurland NB (2002) Telecommuting, professional isolation, and employee development in public and private organizations. J. Organ. Behav. Int. J. Ind. Occup. Organ. Psychol. Behav. 23(4):511–532.
Cox DR, Reid N (2000) The theory of the design of experiments (CRC Press). Cramton CD (2001) The mutual knowledge problem and its consequences for dispersed collaboration. Organ.
Sci. 12(3):346–371. Dennis AR, Fuller RM, Valacich JS (2008) Media, tasks, and communication processes: A theory of media
synchronicity. MIS Q.:575–600. Fayard AL, Weeks J (2007) Photocopiers and water-coolers: The affordances of informal interaction. Organ.
Stud. 28(5):605–634. Fernandez RM, Fernandez-Mateo I (2006) Networks, race, and hiring. Am. Sociol. Rev. 71(1):42–71. Ford B, Chang E (2021) IBM Sees 80% of Employees Working in Hybrid Roles After Pandemic. (March 31)
https://www.bloomberg.com/news/articles/2021-03-31/ibm-expects-80-of-its-employees-to-work-hybrid-post-pandemic?
Gajendran RS, Harrison DA (2007) The good, the bad, and the unknown about telecommuting: meta-analysis of psychological mediators and individual consequences. J. Appl. Psychol. 92(6):1524.
Gibson CB, Gibbs JL (2006) Unpacking the concept of virtuality: The effects of geographic dispersion, electronic dependence, dynamic structure, and national diversity on team innovation. Adm. Sci. Q. 51(3):451–495.
Golden TD (2006) The role of relationships in understanding telecommuter satisfaction. J. Organ. Behav. Int. J. Ind. Occup. Organ. Psychol. Behav. 27(3):319–340.
Golden TD, Veiga JF, Dino RN (2008) The impact of professional isolation on teleworker job performance and turnover intentions: does time spent teleworking, interacting face-to-face, or having access to communication-enhancing technology matter? J. Appl. Psychol. 93(6):1412.
Hinds P, Kiesler SB, Kiesler S (2002) Distributed work (MIT press). King AA, Goldfarb B, Simcoe T (2019) Learning from testimony on quantitative research in management.
Acad. Manage. Rev. (ja).

16
Kleinbaum AM, Stuart TE, Tushman ML (2013) Discretion within constraint: Homophily and structure in a formal organization. Organ. Sci. 24(5):1316–1336.
Lachin JM (2000) Statistical considerations in the intent-to-treat principle. Control. Clin. Trials 21(3):167–189. Lane JN, Ganguli I, Gaule P, Guinan E, Lakhani KR (2020) Engineering serendipity: When does knowledge
sharing lead to knowledge production? Strateg. Manag. J. Lazarsfeld PF, Merton RK (1954) Friendship as a social process: A substantive and methodological analysis.
Freedom Control Mod. Soc. 18(1):18–66. Levin DZ, Cross R (2004) The strength of weak ties you can trust: The mediating role of trust in effective
knowledge transfer. Manag. Sci. 50(11):1477–1490. Lin W (2013) Agnostic notes on regression adjustments to experimental data: Reexamining Freedman’s
critique. Ann. Appl. Stat. 7(1):295–318. Louis MR (1980) Surprise and sense making: What newcomers experience in entering unfamiliar
organizational settings. Adm. Sci. Q.:226–251. Marini MM, Olsen AR, Rubin DB (1980) Maximum-likelihood estimation in panel studies with missing data.
Sociol. Methodol. 11:314–357. Mitchell W, Tsui AS (2012) Research in Emerging Economy Contexts: Selected Articles from MOR and three
SMS journals (GSJ, SEJ, and SMJ). Morrison EW (1993) Longitudinal study of the effects of information seeking on newcomer socialization. J.
Appl. Psychol. 78(2):173. Morrison EW (2002) Newcomers’ relationships: The role of social network ties during socialization. Acad.
Manage. J. 45(6):1149–1160. Nardi BA, Whittaker S (2002) The place of face-to-face communication in distributed work. Distrib. Work
83:112. O’Dowd P, Hagan A (2021) Uncertain COVID-19 Vaccine Distribution Leaves Many Navigating Ethics of
Skipping The Line. WBUR (January 28) https://www.wbur.org/hereandnow/2021/01/28/vaccine-ethics-skipping-line.
Ostroff C, Kozlowski SW (1992) Organizational socialization as a learning process: The role of information acquisition. Pers. Psychol. 45(4):849–874.
Raghuram S, Hill NS, Gibbs JL, Maruping LM (2019) Virtual work: Bridging research clusters. Acad. Manag. Ann. 13(1):308–341.
Rathnam S, Mahajan V, Whinston AB (1995) Facilitating coordination in customer support teams: A framework and its implications for the design of information technology. Manag. Sci. 41(12):1900–1921.
Reichers AE (1987) An interactionist perspective on newcomer socialization rates. Acad. Manage. Rev. 12(2):278–287.
Sherman EL (2020) Discretionary remote working helps mothers without harming non-mothers: Evidence from a field experiment. Manag. Sci. 66(3):1351–1374.
Sterling A, Merluzzi J (2021) A longer way in: Tryouts as alternative hiring arrangements in organizations. Res. Organ. Behav.:100122.
Sterling AD, Fernandez RM (2018) Once in the door: Gender, tryouts, and the initial salaries of managers. Manag. Sci. 64(11):5444–5460.
Tushman ML, Romanelli E (1983) Uncertainty, social location and influence in decision making: A sociometric analysis. Manag. Sci. 29(1):12–23.
Wiesenfeld BM, Raghuram S, Garud R (1999) Communication patterns as determinants of organizational identification in a virtual organization. Organ. Sci. 10(6):777–790.
17
Figure 1. Summary of Randomization of Participants by Division and Experimental Condition
18
Figure 2. Comparison of Final Job Offer Outcomes Across Experimental Conditions By WC Treatment Match (left) and WC Treatment Dose (right) (Baseline = Intern-Senior Manager WC)
Note: Error bars are standard errors. Figure 3. Comparison of Final Job Performance Across Experimental Conditions By WC Treatment Match (left) and WC Treatment Dose (right) (Baseline = Intern-Senior Manager WC)
Note: Error bars are standard errors.
19
Appendix for
Virtual Watercoolers: A Field Experiment on Virtual Synchronous Interactions and Performance of Remote Newcomers
1. Supplementary Text
1.1. Conceptual Design of Water Cooler (WC) Treatments
Our experimental design allowed us to study the performance and career effects of different types of
virtual interactions among workers. As shown in Figure A1, the interactions varied by the formality of the
communication (informal versus formal) and synchronicity of communication (asynchronous versus
synchronous). Whereas informal communication refers to interactions that are nonprescribed and social in
nature, formal communication tends to be associated with work-related tasks, activities, and decision-making
authority (Tushman and Romanelli 1983). The synchronicity of communication can be described as
asynchronous versus synchronous, which refers to the extent to which the interactions are real-time and
occur at the same place and time (i.e., synchronous) or across place and time (i.e., asynchronous) (Brown et al.
2010, Dennis et al. 2008). Moreover, whereas synchronous communication is often associated with voice
(e.g., face-to-face, teleconference), asynchronous communication is more often associated with data (e.g.,
email, chat, discussion forum) (Rathnam et al. 1995). Along these two dimensions, serendipitous
encounters—which are the kind of interactions people have with their colleagues outside of formal meetings
and work activities—tend to be both informal and synchronous in nature (Fayard and Weeks 2007, Lane et al.
2020).
As illustrated in Figure A1, our main treatment intervention offered interns opportunities for remote
informal and synchronous interactions via virtual water coolers (WCs) (i.e., teleconference) either: (1) with
three or four other interns in the intern-only WCs or (2) with a senior manager and three or four other
interns in the intern-senior manager WCs. Although the interactions in the virtual WCs were planned ahead
of time, interns and senior managers were randomly assigned to sessions, thereby emulating the serendipity of
a chance encounter at the watercooler, lunch room, or hallway (Allen 1977, Fayard and Weeks 2007). It is
important to point out that the senior manager the interns met during the watercooler session was not the
direct supervisor of any of the interns in the watercooler session. In other words, the senior managers who
20
participated in the virtual watercoolers were not responsible for measuring interns’ performance during their
internship or deciding whether to offer the interns full-time employment at the end of the internship.
In consultation with executives from the organization and to mitigate concerns related to Hawthorne
effects, we also designed and implemented three control conditions. The first two control conditions were
active controls (i.e., control conditions where the participants were engaging in an activity during the
intervention period but not participating in a virtual water cooler). The first was an asynchronous question
and answer (Q&A) discussion forum between interns and senior managers in which interns asked questions
and were randomly selected to receive a reply from a senior manager each week. Figure A1 illustrates that
although the discussion forum offered interns opportunities for informal interactions, they were
asynchronous in nature and, therefore, not in real time. The second active control was an intern group
project, in which interns were randomly assigned to small groups of three to four interns that met each week
to work on a research project together. As shown in Figure A1, although the intern group project offered
interns opportunities for synchronous interactions via teleconference, their interactions were formal and
focused on accomplishing a work task. The third control condition was a passive control (i.e., the “no
intervention” control condition where the participants did not engage in any activity), which did not have
prearranged opportunities for interactions of any kind with peers or managers. Put differently, this meant that
the passive control condition was implicitly offered unstructured time as a placebo, which made them a poor
baseline control condition because it likely meant that these interns had extra time to complete their work
tasks.
1.2. Abductive Explanations for Plausible Mechanisms for WC Treatment Effects
We draw on prior theory to shed light on plausible explanations of our result that intern-senior
manager WCs led to improved performance and career outcomes. We do so in the spirit of “red-state papers”
(Mitchell and Tsui 2012), which use extant theory to understand more deeply an important empirical
phenomenon, and recent calls to use abductive explanations to shed light on empirical patterns (King et al.
2019).5 Building on prior theory, we identify two potential mechanisms that might be in play: (1) information
5 To quote King et al. (2019:24), “research that uses abduction to develop plausible explanations is well suited to
21
and advice sharing with senior managers and other treated interns and (2) endorsements of treated interns by
senior managers. Based on prior theory, we also abductively theorize how these two mechanisms might be
particularly salient for demographically similar pairs of interns and senior managers.
First, prior work on organizational socialization of firm newcomers suggests that information
sharing and advice seeking with peers and superiors positively affect job performance (Comer 1991, Cooper
and Kurland 2002, Morrison 1993). Two types of information-seeking behaviors tend to have performance-
enhancing effects on newcomers: “technical” knowledge, such as the skills, responsibilities, and demands that
newcomers need to execute tasks competently, and “social” knowledge of the people, values, norms, and
information about expected attitudes and behaviors (Comer 1991, Louis 1980, Morrison 1993). Prior research
indicates that interactions with both peers and superiors can improve newcomers’ socialization into their
organization and positively affect their job performance (Comer 1991, Louis et al. 1983, Morrison 2002).
Along with information acquisition, newcomers also need sufficient social and performance feedback to
become appropriately acculturated into their organizations and to perform their job roles effectively (Ashford
1986, Louis 1980, Morrison 1993). Whereas peers tend to be critical sources of feedback on the social
behavior of newcomers, senior organizational members are typically better informed to provide performance
feedback (Morrison 1993). To this end, mentors are often an instrumental component of a new employee’s
socialization—offering feedback, coaching, counseling, and providing informal advice to mentees (Louis
1980, Morrison 1993, Ostroff and Kozlowski 1992, 1993). This can enable newcomers to identify problems
in their task performance and make adjustments if needed (Ashford et al. 2003, Louis 1980).
Yet despite having the opportunity to acquire information and advice from their interactions, interns
may differ in their propensity to make constructive use of feedback and advice (London and Smither 2002).
We might expect that interns are more inclined to make use of feedback and adjust their behaviors when they
identify closely with the senior managers in their virtual WCs and view them as potential role models (Allen
and Meyer 1990, Bosma et al. 2012, Filstad 2004). A role model is someone who sets an example to be
the management research setting…pre-specification is impractical for most research conducted on archival datasets.” Mitchell and Tsui (2012:2) note that “The focus of red research is on the phenomenon while existing theory or theories provide a means by which to focus on and obtain an understanding of the phenomenon.”
22
emulated by others and who may inspire other individuals to make certain decisions and achieve certain goals
(Basow and Howe 1980). Prior research indicates that role models may improve an individual’s sense of role
identification, as well as their overall performance and persistence in their selected occupation or career
(Bosma et al. 2012). Role models are particularly effective in motivating positive behaviors among individuals
with whom they share demographic characteristics (e.g., gender, ethnicity, nationality) (Bettinger and Long
2005, Carrell et al. 2010, Del Carpio and Guadalupe 2018, Marx and Roman 2002, Walton and Cohen 2011).
Hence, we might expect interns to identify closely with demographically similar senior managers and view
them as role models, which may have additional positive effects on their performance and career outcomes.
To summarize, having the opportunity to engage in information sharing and advice seeking with
other organizational members (i.e., both peers and superiors) is one potential mechanism that might explain
the improved weekly job performance trends and/or career outcomes of interns in the intern-senior manager
WCs. Moreover, we might expect that these effects are strengthened when the interns view the senior
managers as potential role models whose behaviors they would like to emulate.
We also consider endorsements as a second potential mechanism that might explain the improved
career outcomes of interns assigned to the intern-senior manager WCs. Endorsements are an informal
practice whereby endorsers—often high-status or influential organizational members—advocate for particular
candidates to affect organizational selection processes and decision making (Castilla and Rissing 2019, Ocasio
et al. 2020). Often, an endorsement occurs when a senior organizational member takes a direct stake in a
candidate’s success by contacting the relevant organizational decision maker responsible for the selection
decision—and encourages them to pay attention to the particular candidate (Baldiga and Coffman 2016,
Castilla and Rissing 2019). Recent research indicates that endorsed candidates are more likely to receive job
offers and other advantageous outcomes even though they may not necessarily be better qualified candidates
for the job or role (Castilla and Rissing 2019). Hence, although an endorsement mechanism might be a
plausible explanation for the improved career outcomes of interns in the intern-senior manager WCs, it is
unlikely to explain any job performance improvements, which we have suggested might be explained by an
information and advice-sharing mechanism.
23
To this end, the informal and synchronous interactions may have provided the senior managers with
greater visibility into the candidates’ actual attitudes and behaviors (Fernandez and Weinberg 1997, Sterling
and Fernandez 2018, Sterling and Merluzzi 2021). Through direct contact with and observation of these
interns, a senior manager might decide to endorse one or more of them and advocate on their behalf with
their direct supervisors or hiring managers. Moreover, since homophily tends to be an important determinant
of relationship formation in the workplace (Fernandez and Fernandez-Mateo 2006, Ibarra 1992, Kleinbaum
et al. 2013), we might expect senior managers to be more likely to endorse demographically similar interns
who were exogenously assigned to the same virtual WCs. To summarize, an endorsement mechanism might
help explain why interns assigned to the intern-senior manager WCs were more likely to receive job offers.
To shed light on the mechanisms (developed through abductive theorizing) that might be driving our
results, we investigate several empirical patterns. We examine heterogeneous treatment effects by the
demographic similarity between the intern-senior manager pairs and treatment dose to better understand how
homophilous interactions may have shaped the interns’ job performance and career outcomes. First, we find
some evidence that demographically similar intern-senior manager pairs outperformed demographically
dissimilar pairs in the final week of the internship (see Tables A10-A11). Similarly, interns who attended a
high dose of intern-senior manager WC sessions benefited from improved performance in the final week (see
Tables A12-A13). Second, we find that the positive effect of the intern-senior manager WCs on job offers
was strengthened to 9-13 percentage points when the interns shared a demographic match with their assigned
senior manager (where a demographic match was defined on the basis of same gender and same ethnicity; see
Table A6) and to 6-12 percentage points for interns assigned to a high dose of intern-senior manager WC
sessions (see Table A8). In contrast, there were weaker effects of the intern-senior manager WCs on job
offers for interns who were demographically dissimilar to the senior managers in their virtual WCs and
interns assigned to a low dose of intern-senior manager WC sessions (see Tables A5 and A7). The
heterogeneous treatment effects provide some evidence indicating that the information-sharing and advice
mechanism was strengthened for interns who identified with their assigned senior managers as role models,
and those who had more opportunities for virtual and synchronous interactions, which led to some positive
24
benefits on their job performance and career outcomes. At the same time, given that we find only weak
evidence that the demographically similar intern-senior manager pairs were better performers, we cannot rule
out that an endorsement mechanism might also be in play.
To further shed light on the interplay of the two plausible mechanisms, we also collected survey
measures of the interns’ attitudes toward their remote internship experience at the end of the program. Our
survey spanned four distinct dimensions: (1) ease of asking others for help, (2) having adequate opportunities
to be mentored, (3) having adequate opportunities for career advancement, and (4) overall satisfaction with
remote work. Nearly all (1,186 or 86.6%) of the participants took the final survey at the end of the internship
(see the Appendix for the complete list of survey instruments). A chi-squared test indicates that there are no
statistically significant differences by experimental condition (!!(4,1370) = 0.968, . = 0.915). Hence, we
assume that the data were missing completely at random (Marini et al. 1980).
Our findings of the interns’ attitudes toward their remote internship experience indicate that compared to
the asynchronous Q&A discussion forum, interns participating in the intern-senior manager WCs were more
likely to report higher attitudes across all four dimensions (Table A14). Moreover, we observe heterogeneous
treatment effects by demographic similarity, where the interns’ attitudes were strengthened for ease of asking
others for help and having adequate opportunities for career advancement when the intern-senior manager
pairs shared a demographic match (Table A16; results based on fully interacted OLS models are reported in
Tables A25, A26). As interns in the intern-senior manager WC condition were more likely to report greater
ease in asking others for help and having adequate opportunities to be mentored, both these findings provide
further evidence of an information-sharing and advice mechanism. That said, the reported increase in career
advancement opportunities in the intern-senior manager WC condition might be attributable to either a
strengthened information-sharing and advice mechanism due to the role model effect of senior managers as
an “aspirational self” (Lockwood et al. 2002) or an endorsement mechanism by a senior manager. Taken
together, these survey findings suggest that while we can potentially rule in information sharing and advice as
a plausible explanation for the treated interns’ improved job performance and career outcomes, at the same
time, we cannot rule out an endorsement mechanism as a potential explanation for their improved career
25
outcomes. Our final survey measure, satisfaction with remote work, indicates that having opportunities for
informal and synchronous interactions with other interns and senior managers increased the interns’ overall
satisfaction with their remote work arrangements.
2. Analysis Strategy for Main Results Our main method of analysis is the block-specific difference-in-means approach (BDIM) that accounts for
the block (or division in this context) randomization structure to estimate overall treatment effects and
analyze treatment effect differences depending on the demographic match (gender and ethnicity) between the
intern and the senior manager in the intern-senior manager WCs. Table A2 shows that overall, the
randomization achieved balance across covariates in each division and Table A3 shows the size of each
division as well as the job offers made (%) and the mean final performance rating by division.
The BDIM is the natural estimator for blocked randomized experiments as it is the weighted average
(the weights depend on the blocks' size) of the within block treatment effects (Cox and Reid 2000). For the
analysis on treatment effect differences, we exclude divisions where there was insufficient sample size (i.e.,
there is a minimum threshold of 2 interns required to compute the variance) for the intern-senior manager
WC treatment match/non-match and treatment low/high dose conditions. Tables A4-18 report the pairwise
comparisons using BDIM for the end of program career outcomes (Tables A4-A8), final performance (Tables
A9-A13) and attitudinal outcomes (Tables A14-A18).
2.1. Additional BDIM Results on Weekly Performance We examine the interns’ weekly performance (i.e., weeks 2-5) on First WC Treatment, which differentiates
between the interns’ weekly performance before and after they were assigned to their first virtual WC. Recall
that due to the panel experiment design, this meant that the week of an intern’s first WC treatment was
exogenously determined, where an intern could be assigned to their virtual WC any time from week 2 to 5 of
the internship. Hence, we use the variable, First WC Treatment to account for the periods before and after an
intern was first assigned to a virtual WC. The variable, First WC Treatment has the following seven categories:
intern-senior manager pre-WC, intern-senior manager post-WC, intern-only pre-WC, intern-only post-WC,
26
asynchronous Q&A discussion forum, intern group project, and passive control. The weekly performance
results are presented in Table A19 (pre-WC comparisons) and Table A20 (post-WC comparisons).
3. Robustness Check: Fully Interacted Ordinary Least Squares (OLS) Models As a robustness check of our main analyses using the BDIM approach, we use fully interacted or saturated
ordinary least squares (OLS) models to causally estimate the WC treatment effects on the interns’ job
performance, career outcomes, and attitudes. According to Lin (2013), fully interacted models are important
for obtaining unbiased estimates of treatment effects in block randomized designs when the treatment
assignment probabilities are different across the block, which is the division in our setting (see Table A1 for
assignment probabilities) (Lin 2013). We use the following model to estimate the causal effect of the WC
treatment on the likelihood of receiving a job offer at the end of the program:
23467789" = :#(;<=98>?@8A?") + :!(;<=98>?@8A?") ⋅ D" + D" + E" , [1]
where ;<=98>?@8A?" corresponds to the intern F’s experimental condition, D" is the division fixed
effects,and E" is the error term. We also estimate alternate versions of Equation [1] where we replace
;<=98>?@8A?" with ;<=98>?@8A?G>?Hℎ" to examine heterogeneous treatment effects by
demographic similarity and with ;<=98>?@8A?J3K8" to examine heterogeneous treatment effects by
treatment dose. We note that for the regressions examining heterogeneous treatment effects by demographic
similarity and treatment dose, we perform the analyses on a subset of divisions that had a minimum number
of two interns assigned to both the no-match and match conditions and low dose and high dose conditions,
which is the minimum sample size needed to compute the variance of the point estimates. Lastly, we estimate
alternate versions of Equation [1] where we replace 23467789" , the dependent variable in Equation [1] with
L89739@>AH8",%, which is the performance rating for intern F in week ? (for ? in weeks 2-5) as well as the
four attitudinal measures corresponding to the different dimensions of the interns’ satisfaction with their
remote internship experience: M>?FK7>H?F3ANF?ℎO8@3?8;39P" ,
6..39?QAF?F8K739<>9889RAℎ>AH8@8A?" , 6..39?QAF?F8K?348G8A?398S" , and
R>K837TKPFAU6?ℎ89K739V8W." . The results are presented in Tables A21-A37 and they are consistent
with the BDIM approach.
27
Table A1. Assignment Probabilities to Experimental Conditions Condition Assignment probability by division Response probability
(Asynchronous Q&A only) Asynchronous Q&A control Division 3: 1/5
Division 6: 1/5 All other divisions: 17/100
Division 3: 4/5 Division 6: 4/5 All other divisions: 1/10
Passive control Division 3: 1/5 Division 6: 1/10 All other divisions: 39/100
--
Intern group project control Division 3: 1/5 Division 6: 1/5 All other divisions: 13/100
--
Intern-only WC treatment Division 3: 1/5 Division 6: 1/4 All other divisions: 17/100
--
Intern-senior manager WC treatment
Division 3: 1/5 Division 6: 1/4 All other divisions: 16/100
--
Table A2. Randomization Check By Division (N = 1,370) Covariate Division 1 (N = 196) Division 2 (N = 318) Gender !!(4) = 2.27, p = 0.69 !!(4) = 3.23, p = 0.52 Ethnicity !!(16) = 14.71, p = 0.55 !!(16) = 7.11, p = 0.9788 Program city !!(52) = 35.87, p = 0.96 !!(8) = 14.70, p = 0.26 Returning intern !!(4) = 2.10, p = 0.72 !!(4) = 1.12, p = 0.89 Covariate Division 3 (N = 16) Division 4 (N = 126) Gender !!(4) = 0.36, p = 0.99 !!(4) = 1.30, p = 0.86 Ethnicity !!(16) = 14.40, p = 0.57 !!(12) = 9.74, p = 0.64 Program city -- !!(8) = 0.60, p = 0.38 Returning intern !!(4) = 3.97, p = 0.41 !!(4) = 2.84, p = 0.59 Covariate Division 5 (N = 259) Division 6 (N = 20) Gender !!(4) = 2.83, p = 0.59 !!(4) = 5.30, p = 0.26 Ethnicity !!(16) = 16.35, p = 0.43 !!(4) = 0.50, p = 0.97 Program city !!(52) = 35.58, p = 0.49 !!(4) = 2.94, p = 0.57 Returning intern !!(4) = 4.35, p = 0.36 --
Covariate Division 7 (N = 196) Division 8 (N = 239) Gender !!(4) = 0.76, p = 0.94 !!(4) = 4.78, p = 0.31 Ethnicity !!(16) = 17.59, p = 0.35 !!(16) = 11.63, p = 0.77 Program city !!(52) = 6.82, p = 0.87 !!(8) = 4.64, p = 0.80 Returning intern !!(4) = 3.84, p = 0.43 !!(4) = 8.42, p = 0.08
28
Table A3. Division Level Summary Statistics Division Number Division Size (%) Offer Made (%) Final Performance
1 196 (14.31%) 83.2% 2.51 (0.66) 2 318 (23.21%) 91.8% 2.59 (0.60) 3 16 (1.17%) 100.00% 2.60 (0.63) 4 126 (9.20%) 88.10% 2.51 (0.67) 5 259 (18.91%) 95.4% 2.70 (0.50) 6 20 (1.46%) 55.0% 2.42 (0.90) 7 196 (14.31%) 95.4% 2.60 (0.54) 8 239 (17.45%) 94.6% 2.67 (0.53)
Total 1,370 (100.00%) 91.5% 2.60 (0.59)
29
Table A4. BDIM of Offers Made on WC Treatment Comparison Estimate Std Error t-value P-value CI Low CI Upper DF Intern-Senior Manager WC vs. Asynchronous Q&A 0.047 0.024 1.940 0.053 -0.001 0.094 426 Intern-Senior Manager WC vs. Passive Control 0.020 0.020 1.025 0.306 -0.019 0.059 721 Intern-Senior Manager WC vs. Intern Group Project 0.073 0.028 2.598 0.010 0.018 0.129 395 Intern-Senior Manager WC vs. Intern-Only WC 0.029 0.024 1.196 0.232 -0.019 0.076 421 Passive Control vs. Asynchronous Q&A 0.024 0.023 1.055 0.292 -0.021 0.069 725 Intern Group Project vs. Asynchronous Q&A -0.012 0.029 -0.419 0.676 -0.070 0.046 399 Intern-Only WC vs. Asynchronous Q&A 0.021 0.026 0.785 0.433 -0.031 0.072 425 Passive Control vs. Intern Group Project 0.042 0.026 1.618 0.106 -0.009 0.093 694 Passive Control vs. Intern-Only WC -0.004 0.021 -0.175 0.861 -0.046 0.038 720 Intern-Only WC vs. Intern Group Project 0.046 0.030 1.520 0.129 -0.013 0.105 394
Table A5. BDIM of Offers Made on WC Treatment Match (No Match) Comparison Estimate Std Error t-value P-value CI Low CI Upper DF Intern-Senior Manager WC vs. Asynchronous Q&A 0.047 0.027 0.026 1.052 0.294 -0.024 0.078 Intern-Senior Manager WC vs. Passive Control 0.020 0.007 0.021 0.319 0.750 -0.035 0.049 Intern-Senior Manager WC vs. Intern Group Project 0.073 0.053 0.030 1.799 0.073 -0.005 0.112 Intern-Senior Manager WC vs. Intern-Only WC 0.029 0.017 0.026 0.659 0.510 -0.033 0.067
Table A6. BDIM of Offers Made on WC Treatment Match (Match) Comparison Estimate Std Error t-value P-value CI Low CI Upper DF Intern-Senior Manager WC vs. Asynchronous Q&A 0.105 0.020 5.307 0.000 0.066 0.144 195 Intern-Senior Manager WC vs. Passive Control 0.087 0.014 6.130 0.000 0.059 0.114 400 Intern-Senior Manager WC vs. Intern Group Project 0.126 0.027 4.714 0.000 0.073 0.179 155 Intern-Senior Manager WC vs. Intern-Only WC 0.095 0.022 4.234 0.000 0.051 0.139 185
30
Table A7. BDIM of Offers Made on WC Treatment Dose (Low) Comparison Estimate Std Error t-value P-value CI Low CI Upper DF Intern-Senior Manager WC vs. Asynchronous Q&A 0.027 0.027 1.003 0.317 -0.026 0.079 377 Intern-Senior Manager WC vs. Passive Control 0.008 0.022 0.368 0.713 -0.036 0.052 672 Intern-Senior Manager WC vs. Intern Group Project 0.056 0.031 1.806 0.072 -0.005 0.116 342 Intern-Senior Manager WC vs. Intern-Only WC 0.019 0.027 0.729 0.466 -0.033 0.072 370
Table A8. BDIM of Offers Made on WC Treatment Dose (High) Comparison Estimate Std Error t-value P-value CI Low CI Upper DF Intern-Senior Manager WC vs. Asynchronous Q&A 0.100 0.024 4.126 0.000 0.052 0.148 248 Intern-Senior Manager WC vs. Passive Control 0.062 0.021 2.915 0.004 0.020 0.103 544 Intern-Senior Manager WC vs. Intern Group Project 0.117 0.031 3.805 0.000 0.056 0.178 218 Intern-Senior Manager WC vs. Intern-Only WC 0.073 0.025 2.875 0.004 0.023 0.123 243
Table A9. BDIM of Final Performance on WC Treatment Comparison Estimate Std Error t-value P-value CI Low CI Upper DF Intern-Senior Manager WC vs. Asynchronous Q&A 0.080 0.056 1.442 0.150 -0.029 0.189 407 Intern-Senior Manager WC vs. Passive Control 0.060 0.047 1.290 0.198 -0.031 0.152 698 Intern-Senior Manager WC vs. Intern Group Project 0.174 0.062 2.822 0.005 0.053 0.295 382 Intern-Senior Manager WC vs. Intern-Only WC 0.060 0.055 1.096 0.274 -0.047 0.167 406 Passive Control vs. Asynchronous Q&A 0.049 0.048 1.022 0.307 -0.045 0.144 700 Intern Group Project vs. Asynchronous Q&A -0.069 0.063 -1.088 0.277 -0.193 0.056 380 Intern-Only WC vs. Asynchronous Q&A 0.022 0.057 0.380 0.704 -0.090 0.134 407 Passive Control vs. Intern Group Project -0.103 0.055 -1.867 0.062 -0.212 0.005 674 Passive Control vs. Intern-Only WC -0.007 0.047 -0.139 0.889 -0.100 0.087 698 Intern-Only WC vs. Intern Group Project 0.117 0.062 1.876 0.061 -0.006 0.239 382
31
Table A10. BDIM of Final Performance on WC Treatment Match (No Match) Comparison Estimate Std Error t-value P-value CI Low CI Upper DF Intern-Senior Manager WC vs. Asynchronous Q&A 0.073 0.058 1.270 0.205 -0.040 0.187 382 Intern-Senior Manager WC vs. Passive Control 0.031 0.049 0.641 0.522 -0.065 0.128 668 Intern-Senior Manager WC vs. Intern Group Project 0.149 0.064 2.327 0.021 0.023 0.274 348 Intern-Senior Manager WC vs. Intern-Only WC 0.051 0.058 0.877 0.381 -0.063 0.164 375
Table A11. BDIM of Final Performance on WC Treatment Match (Match) Comparison Estimate Std Error t-value P-value CI Low CI Upper DF Intern-Senior Manager WC vs. Asynchronous Q&A 0.185 0.113 1.637 0.103 -0.038 0.409 184 Intern-Senior Manager WC vs. Passive Control 0.214 0.096 2.225 0.027 0.025 0.402 386 Intern-Senior Manager WC vs. Intern Group Project 0.261 0.122 2.142 0.034 0.020 0.501 144 Intern-Senior Manager WC vs. Intern-Only WC 0.194 0.104 1.866 0.064 -0.011 0.399 175
Table A12. BDIM of Final Performance on WC Treatment Dose (Low) Comparison Estimate Std Error t-value P-value CI Low CI Upper DF Intern-Senior Manager WC vs. Asynchronous Q&A 0.067 0.060 1.114 0.266 -0.051 0.185 365 Intern-Senior Manager WC vs. Passive Control 0.021 0.052 0.396 0.692 -0.082 0.124 652 Intern-Senior Manager WC vs. Intern Group Project 0.144 0.067 2.159 0.032 0.013 0.276 332 Intern-Senior Manager WC vs. Intern-Only WC 0.050 0.060 0.829 0.408 -0.069 0.169 358
Table A13. BDIM of Final Performance on WC Treatment Dose (High) Comparison Estimate Std Error t-value P-value CI Low CI Upper DF Intern-Senior Manager WC vs. Asynchronous Q&A 0.079 0.025 3.184 0.002 0.030 0.128 244 Intern-Senior Manager WC vs. Passive Control 0.054 0.021 2.571 0.010 0.013 0.095 539 Intern-Senior Manager WC vs. Intern Group Project 0.094 0.031 3.077 0.002 0.034 0.155 209 Intern-Senior Manager WC vs. Intern-Only WC 0.068 0.025 2.698 0.007 0.018 0.117 237
32
Table A14. BDIM of End of Program Attitudes on WC Treatment Comparison Estimate Std Error t-value P-value CI Low CI Upper DF
Ease Of Asking Others for Help Intern-Senior Manager WC vs. Asynchronous Q&A 0.162 0.077 2.093 0.037 0.010 0.314 364 Intern-Senior Manager WC vs. Passive Control 0.099 0.064 1.554 0.121 -0.026 0.224 621 Intern-Senior Manager WC vs. Intern Group Project 0.006 0.079 0.075 0.940 -0.149 0.160 339 Intern-Senior Manager WC vs. Intern-Only WC 0.048 0.071 0.670 0.503 -0.093 0.188 354 Passive Control vs. Asynchronous Q&A 0.076 0.075 1.018 0.309 -0.071 0.223 624 Intern Group Project vs. Asynchronous Q&A 0.143 0.086 1.655 0.099 -0.027 0.312 336 Intern-Only WC vs. Asynchronous Q&A 0.115 0.081 1.423 0.156 -0.044 0.275 356 Passive Control vs. Intern Group Project 0.051 0.073 0.692 0.489 -0.093 0.194 600 Passive Control vs. Intern-Only WC 0.041 0.063 0.653 0.514 -0.082 0.164 621 Intern-Only WC vs. Intern Group Project -0.006 0.079 -0.070 0.945 -0.161 0.150 333
Opportunities for Career Advancement Intern-Senior Manager WC vs. Asynchronous Q&A 0.270 0.121 2.235 0.026 0.032 0.508 364 Intern-Senior Manager WC vs. Passive Control 0.132 0.091 1.452 0.147 -0.046 0.310 622 Intern-Senior Manager WC vs. Intern Group Project 0.058 0.116 0.499 0.618 -0.171 0.287 340 Intern-Senior Manager WC vs. Intern-Only WC 0.083 0.105 0.791 0.430 -0.124 0.291 354 Passive Control vs. Asynchronous Q&A 0.141 0.117 1.205 0.229 -0.089 0.370 625 Intern Group Project vs. Asynchronous Q&A 0.221 0.133 1.661 0.098 -0.041 0.482 337 Intern-Only WC vs. Asynchronous Q&A 0.152 0.126 1.207 0.228 -0.096 0.400 356 Passive Control vs. Intern Group Project 0.057 0.102 0.555 0.579 -0.144 0.257 602 Passive Control vs. Intern-Only WC 0.030 0.094 0.316 0.752 -0.156 0.215 622 Intern-Only WC vs. Intern Group Project -0.002 0.114 -0.015 0.988 -0.226 0.222 334
Opportunities for Mentoring Intern-Senior Manager WC vs. Asynchronous Q&A 0.259 0.110 2.357 0.019 0.043 0.475 364 Intern-Senior Manager WC vs. Passive Control 0.071 0.077 0.923 0.356 -0.080 0.221 622 Intern-Senior Manager WC vs. Intern Group Project -0.086 0.086 -0.998 0.319 -0.255 0.083 340 Intern-Senior Manager WC vs. Intern-Only WC 0.118 0.090 1.321 0.187 -0.058 0.295 354
33
Passive Control vs. Asynchronous Q&A 0.189 0.102 1.849 0.065 -0.012 0.390 625 Intern Group Project vs. Asynchronous Q&A 0.349 0.110 3.189 0.002 0.134 0.565 337 Intern-Only WC vs. Asynchronous Q&A 0.139 0.113 1.238 0.217 -0.082 0.361 356 Passive Control vs. Intern Group Project 0.121 0.076 1.588 0.113 -0.029 0.272 602 Passive Control vs. Intern-Only WC -0.054 0.081 -0.669 0.504 -0.214 0.105 622 Intern-Only WC vs. Intern Group Project -0.160 0.091 -1.753 0.081 -0.339 0.020 334
Satisfaction with Remote Internship Intern-Senior Manager WC vs. Asynchronous Q&A 0.319 0.113 2.812 0.005 0.096 0.542 364 Intern-Senior Manager WC vs. Passive Control 0.081 0.086 0.943 0.346 -0.088 0.251 622 Intern-Senior Manager WC vs. Intern Group Project 0.101 0.112 0.908 0.365 -0.118 0.321 341 Intern-Senior Manager WC vs. Intern-Only WC 0.118 0.099 1.198 0.232 -0.076 0.312 354 Passive Control vs. Asynchronous Q&A 0.173 0.099 1.749 0.081 -0.021 0.367 625 Intern Group Project vs. Asynchronous Q&A 0.199 0.117 1.709 0.088 -0.030 0.429 338 Intern-Only WC vs. Asynchronous Q&A 0.142 0.112 1.262 0.208 -0.079 0.362 356 Passive Control vs. Intern Group Project -0.023 0.090 -0.251 0.802 -0.199 0.154 603 Passive Control vs. Intern-Only WC -0.023 0.088 -0.262 0.793 -0.196 0.150 622 Intern-Only WC vs. Intern Group Project 0.030 0.108 0.283 0.777 -0.181 0.242 335
34
Table A15. BDIM of End of Program Attitudes on WC Treatment Match (No Match) Comparison Estimate Std Error t-value P-value CI Low CI Upper DF
Ease Of Asking Others for Help Intern-Senior Manager WC vs. Asynchronous Q&A 0.146 0.080 1.830 0.068 -0.011 0.304 340 Intern-Senior Manager WC vs. Passive Control 0.090 0.066 1.354 0.176 -0.040 0.220 596 Intern-Senior Manager WC vs. Intern Group Project 0.004 0.080 0.046 0.964 -0.153 0.161 308 Intern-Senior Manager WC vs. Intern-Only WC 0.042 0.072 0.584 0.560 -0.100 0.185 328
Opportunities for Career Advancement Intern-Senior Manager WC vs. Asynchronous Q&A 0.282 0.125 2.266 0.024 0.037 0.527 340 Intern-Senior Manager WC vs. Passive Control 0.157 0.094 1.662 0.097 -0.028 0.342 597 Intern-Senior Manager WC vs. Intern Group Project 0.081 0.116 0.699 0.485 -0.148 0.310 309 Intern-Senior Manager WC vs. Intern-Only WC 0.118 0.108 1.088 0.277 -0.095 0.331 328
Opportunities for Mentoring Intern-Senior Manager WC vs. Asynchronous Q&A 0.282 0.109 2.598 0.010 0.069 0.496 340 Intern-Senior Manager WC vs. Passive Control 0.098 0.074 1.321 0.187 -0.048 0.245 597 Intern-Senior Manager WC vs. Intern Group Project -0.088 0.086 -1.029 0.304 -0.257 0.080 309 Intern-Senior Manager WC vs. Intern-Only WC 0.145 0.089 1.632 0.104 -0.030 0.320 328
Satisfaction with Remote Internship Intern-Senior Manager WC vs. Asynchronous Q&A 0.327 0.112 2.922 0.004 0.107 0.548 340 Intern-Senior Manager WC vs. Passive Control 0.095 0.088 1.085 0.278 -0.077 0.268 597 Intern-Senior Manager WC vs. Intern Group Project 0.093 0.106 0.874 0.383 -0.116 0.302 310 Intern-Senior Manager WC vs. Intern-Only WC 0.136 0.101 1.345 0.180 -0.063 0.335 328
35
Table A16. BDIM of End of Program Attitudes on WC Treatment Match (Match) Comparison Estimate Std Error t-value P-value CI Low CI Upper DF
Ease Of Asking Others for Help Intern-Senior Manager WC vs. Asynchronous Q&A 0.367 0.136 2.699 0.008 0.099 0.636 170 Intern-Senior Manager WC vs. Passive Control 0.308 0.130 2.363 0.019 0.052 0.564 345 Intern-Senior Manager WC vs. Intern Group Project 0.115 0.145 0.793 0.429 -0.172 0.402 134 Intern-Senior Manager WC vs. Intern-Only WC 0.254 0.139 1.830 0.069 -0.020 0.528 158
Opportunities for Career Advancement Intern-Senior Manager WC vs. Asynchronous Q&A 0.105 0.020 5.307 0.000 0.066 0.144 195 Intern-Senior Manager WC vs. Passive Control 0.087 0.014 6.130 0.000 0.059 0.114 400 Intern-Senior Manager WC vs. Intern Group Project 0.126 0.027 4.714 0.000 0.073 0.179 155 Intern-Senior Manager WC vs. Intern-Only WC 0.095 0.022 4.234 0.000 0.051 0.139 185
Opportunities for Mentoring Intern-Senior Manager WC vs. Asynchronous Q&A 0.257 0.306 0.841 0.402 -0.347 0.861 170 Intern-Senior Manager WC vs. Passive Control 0.037 0.299 0.124 0.901 -0.550 0.624 346 Intern-Senior Manager WC vs. Intern Group Project -0.048 0.271 -0.176 0.861 -0.583 0.487 135 Intern-Senior Manager WC vs. Intern-Only WC 0.098 0.279 0.350 0.727 -0.454 0.650 158
Satisfaction with Remote Internship Intern-Senior Manager WC vs. Asynchronous Q&A 0.312 0.308 1.013 0.313 -0.296 0.919 170 Intern-Senior Manager WC vs. Passive Control 0.005 0.297 0.017 0.986 -0.578 0.589 346 Intern-Senior Manager WC vs. Intern Group Project 0.045 0.291 0.156 0.876 -0.531 0.621 136 Intern-Senior Manager WC vs. Intern-Only WC 0.118 0.280 0.421 0.674 -0.435 0.672 158

36
Table A17. BDIM of End of Program Attitudes on WC Treatment Dose (Low) Comparison Estimate Std Error t-value P-value CI Low CI Upper DF
Ease Of Asking Others for Help Intern-Senior Manager WC vs. Asynchronous Q&A 0.149 0.088 1.688 0.093 -0.025 0.323 277 Intern-Senior Manager WC vs. Passive Control 0.105 0.076 1.375 0.170 -0.045 0.255 537 Intern-Senior Manager WC vs. Intern Group Project 0.016 0.086 0.184 0.854 -0.154 0.186 246 Intern-Senior Manager WC vs. Intern-Only WC 0.092 0.096 0.952 0.342 -0.098 0.282 188
Opportunities for Career Advancement Intern-Senior Manager WC vs. Asynchronous Q&A 0.304 0.133 2.282 0.023 0.042 0.565 277 Intern-Senior Manager WC vs. Passive Control 0.205 0.108 1.903 0.058 -0.007 0.418 538 Intern-Senior Manager WC vs. Intern Group Project 0.109 0.130 0.838 0.403 -0.147 0.366 247 Intern-Senior Manager WC vs. Intern-Only WC 0.150 0.141 1.066 0.288 -0.128 0.428 188
Opportunities for Mentoring Intern-Senior Manager WC vs. Asynchronous Q&A 0.203 0.163 1.248 0.213 -0.117 0.524 277 Intern-Senior Manager WC vs. Passive Control -0.002 0.146 -0.014 0.989 -0.289 0.285 538 Intern-Senior Manager WC vs. Intern Group Project -0.179 0.137 -1.302 0.194 -0.450 0.092 247 Intern-Senior Manager WC vs. Intern-Only WC 0.132 0.146 0.903 0.368 -0.156 0.419 188
Satisfaction with Remote Internship Intern-Senior Manager WC vs. Asynchronous Q&A 0.191 0.167 1.146 0.253 -0.137 0.520 277 Intern-Senior Manager WC vs. Passive Control -0.009 0.161 -0.055 0.956 -0.325 0.307 538 Intern-Senior Manager WC vs. Intern Group Project -0.024 0.157 -0.150 0.881 -0.332 0.285 248 Intern-Senior Manager WC vs. Intern-Only WC 0.114 0.149 0.766 0.445 -0.180 0.409 188

37
Table A18. BDIM of End of Program Attitudes on WC Treatment Dose (High) Comparison Estimate Std Error t-value P-value CI Low CI Upper DF
Ease Of Asking Others for Help Intern-Senior Manager WC vs. Asynchronous Q&A 0.224 0.101 2.213 0.028 0.025 0.424 256 Intern-Senior Manager WC vs. Passive Control 0.129 0.089 1.440 0.150 -0.047 0.304 516 Intern-Senior Manager WC vs. Intern Group Project 0.069 0.103 0.671 0.503 -0.134 0.273 225 Intern-Senior Manager WC vs. Intern-Only WC 0.174 0.109 1.588 0.114 -0.042 0.390 167
Opportunities for Career Advancement Intern-Senior Manager WC vs. Asynchronous Q&A 0.047 0.030 1.564 0.119 -0.012 0.107 296 Intern-Senior Manager WC vs. Passive Control 0.019 0.027 0.720 0.472 -0.033 0.071 591 Intern-Senior Manager WC vs. Intern Group Project 0.057 0.033 1.718 0.087 -0.008 0.123 261 Intern-Senior Manager WC vs. Intern-Only WC 0.086 0.042 2.039 0.043 0.003 0.169 190
Opportunities for Mentoring Intern-Senior Manager WC vs. Asynchronous Q&A 0.382 0.125 3.061 0.002 0.136 0.627 256 Intern-Senior Manager WC vs. Passive Control 0.166 0.094 1.769 0.077 -0.018 0.351 517 Intern-Senior Manager WC vs. Intern Group Project 0.024 0.103 0.233 0.816 -0.179 0.227 226 Intern-Senior Manager WC vs. Intern-Only WC 0.376 0.141 2.668 0.008 0.098 0.655 167
Satisfaction with Remote Internship Intern-Senior Manager WC vs. Asynchronous Q&A 0.312 0.308 1.013 0.313 -0.296 0.919 170 Intern-Senior Manager WC vs. Passive Control 0.005 0.297 0.017 0.986 -0.578 0.589 346 Intern-Senior Manager WC vs. Intern Group Project 0.045 0.291 0.156 0.876 -0.531 0.621 136 Intern-Senior Manager WC vs. Intern-Only WC 0.118 0.280 0.421 0.674 -0.435 0.672 158
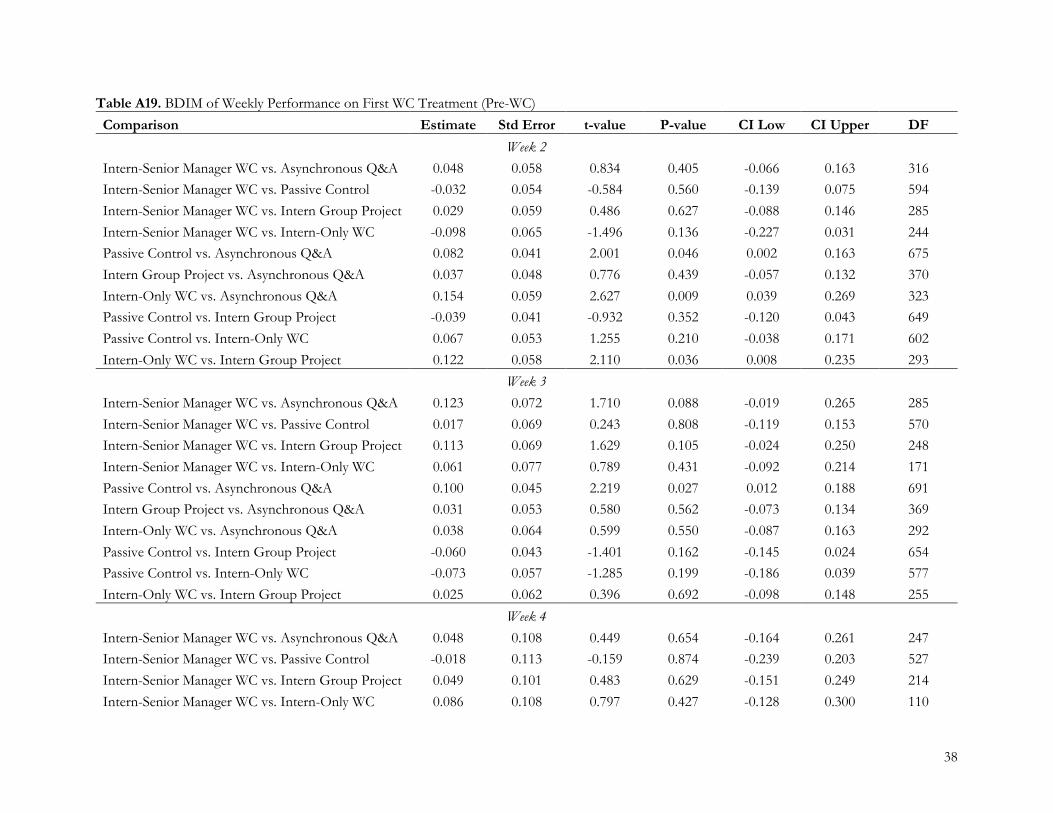
38
Table A19. BDIM of Weekly Performance on First WC Treatment (Pre-WC) Comparison Estimate Std Error t-value P-value CI Low CI Upper DF
Week 2 Intern-Senior Manager WC vs. Asynchronous Q&A 0.048 0.058 0.834 0.405 -0.066 0.163 316 Intern-Senior Manager WC vs. Passive Control -0.032 0.054 -0.584 0.560 -0.139 0.075 594 Intern-Senior Manager WC vs. Intern Group Project 0.029 0.059 0.486 0.627 -0.088 0.146 285 Intern-Senior Manager WC vs. Intern-Only WC -0.098 0.065 -1.496 0.136 -0.227 0.031 244 Passive Control vs. Asynchronous Q&A 0.082 0.041 2.001 0.046 0.002 0.163 675 Intern Group Project vs. Asynchronous Q&A 0.037 0.048 0.776 0.439 -0.057 0.132 370 Intern-Only WC vs. Asynchronous Q&A 0.154 0.059 2.627 0.009 0.039 0.269 323 Passive Control vs. Intern Group Project -0.039 0.041 -0.932 0.352 -0.120 0.043 649 Passive Control vs. Intern-Only WC 0.067 0.053 1.255 0.210 -0.038 0.171 602 Intern-Only WC vs. Intern Group Project 0.122 0.058 2.110 0.036 0.008 0.235 293
Week 3 Intern-Senior Manager WC vs. Asynchronous Q&A 0.123 0.072 1.710 0.088 -0.019 0.265 285 Intern-Senior Manager WC vs. Passive Control 0.017 0.069 0.243 0.808 -0.119 0.153 570 Intern-Senior Manager WC vs. Intern Group Project 0.113 0.069 1.629 0.105 -0.024 0.250 248 Intern-Senior Manager WC vs. Intern-Only WC 0.061 0.077 0.789 0.431 -0.092 0.214 171 Passive Control vs. Asynchronous Q&A 0.100 0.045 2.219 0.027 0.012 0.188 691 Intern Group Project vs. Asynchronous Q&A 0.031 0.053 0.580 0.562 -0.073 0.134 369 Intern-Only WC vs. Asynchronous Q&A 0.038 0.064 0.599 0.550 -0.087 0.163 292 Passive Control vs. Intern Group Project -0.060 0.043 -1.401 0.162 -0.145 0.024 654 Passive Control vs. Intern-Only WC -0.073 0.057 -1.285 0.199 -0.186 0.039 577 Intern-Only WC vs. Intern Group Project 0.025 0.062 0.396 0.692 -0.098 0.148 255
Week 4 Intern-Senior Manager WC vs. Asynchronous Q&A 0.048 0.108 0.449 0.654 -0.164 0.261 247 Intern-Senior Manager WC vs. Passive Control -0.018 0.113 -0.159 0.874 -0.239 0.203 527 Intern-Senior Manager WC vs. Intern Group Project 0.049 0.101 0.483 0.629 -0.151 0.249 214 Intern-Senior Manager WC vs. Intern-Only WC 0.086 0.108 0.797 0.427 -0.128 0.300 110
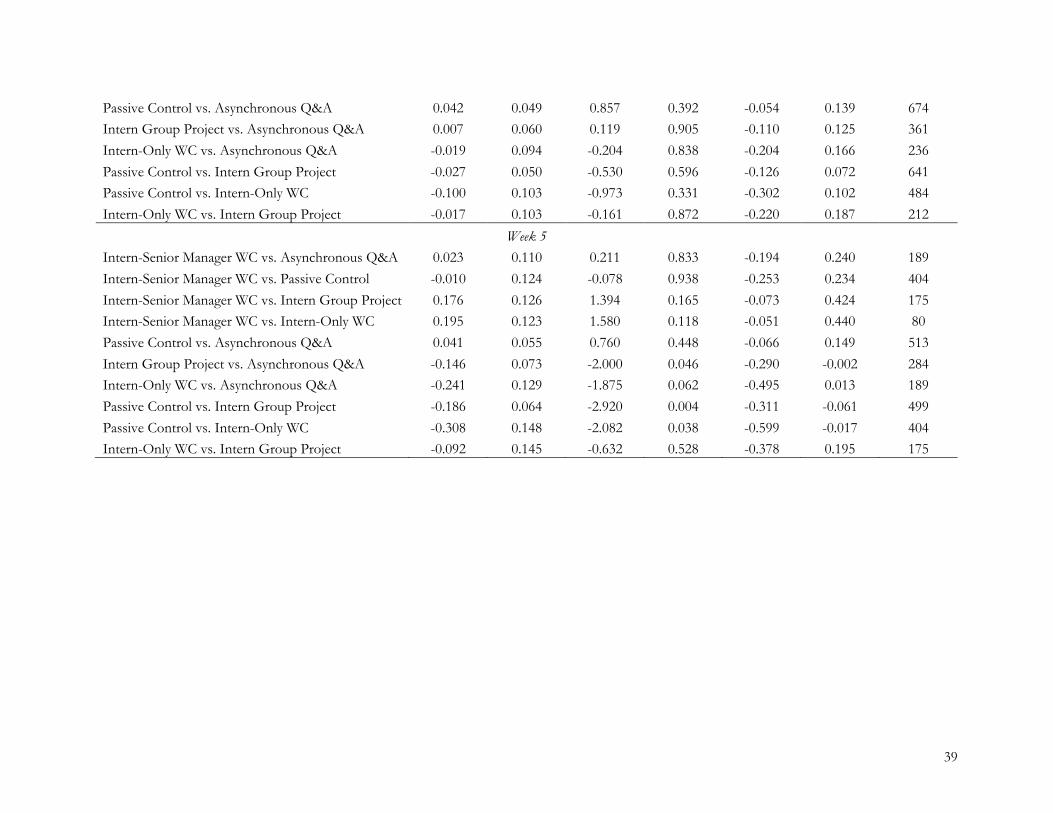
39
Passive Control vs. Asynchronous Q&A 0.042 0.049 0.857 0.392 -0.054 0.139 674 Intern Group Project vs. Asynchronous Q&A 0.007 0.060 0.119 0.905 -0.110 0.125 361 Intern-Only WC vs. Asynchronous Q&A -0.019 0.094 -0.204 0.838 -0.204 0.166 236 Passive Control vs. Intern Group Project -0.027 0.050 -0.530 0.596 -0.126 0.072 641 Passive Control vs. Intern-Only WC -0.100 0.103 -0.973 0.331 -0.302 0.102 484 Intern-Only WC vs. Intern Group Project -0.017 0.103 -0.161 0.872 -0.220 0.187 212
Week 5 Intern-Senior Manager WC vs. Asynchronous Q&A 0.023 0.110 0.211 0.833 -0.194 0.240 189 Intern-Senior Manager WC vs. Passive Control -0.010 0.124 -0.078 0.938 -0.253 0.234 404 Intern-Senior Manager WC vs. Intern Group Project 0.176 0.126 1.394 0.165 -0.073 0.424 175 Intern-Senior Manager WC vs. Intern-Only WC 0.195 0.123 1.580 0.118 -0.051 0.440 80 Passive Control vs. Asynchronous Q&A 0.041 0.055 0.760 0.448 -0.066 0.149 513 Intern Group Project vs. Asynchronous Q&A -0.146 0.073 -2.000 0.046 -0.290 -0.002 284 Intern-Only WC vs. Asynchronous Q&A -0.241 0.129 -1.875 0.062 -0.495 0.013 189 Passive Control vs. Intern Group Project -0.186 0.064 -2.920 0.004 -0.311 -0.061 499 Passive Control vs. Intern-Only WC -0.308 0.148 -2.082 0.038 -0.599 -0.017 404 Intern-Only WC vs. Intern Group Project -0.092 0.145 -0.632 0.528 -0.378 0.195 175

40
Table A20. BDIM of Weekly Performance on First WC Treatment (Post-WC) Comparison Estimate Std Error t-value P-value CI Low CI Upper DF
Week 2 Intern-Senior Manager WC vs. Asynchronous Q&A 0.152 0.071 2.127 0.034 0.011 0.293 268 Intern-Senior Manager WC vs. Passive Control 0.065 0.066 0.987 0.324 -0.065 0.196 547 Intern-Senior Manager WC vs. Intern Group Project 0.123 0.069 1.788 0.075 -0.012 0.258 242 Intern-Senior Manager WC vs. Intern-Only WC 0.114 0.085 1.347 0.180 -0.054 0.282 135 Passive Control vs. Asynchronous Q&A 0.082 0.041 2.001 0.046 0.002 0.163 675 Intern Group Project vs. Asynchronous Q&A 0.037 0.048 0.776 0.439 -0.057 0.132 370 Intern-Only WC vs. Asynchronous Q&A 0.069 0.077 0.898 0.370 -0.082 0.220 263 Passive Control vs. Intern Group Project -0.039 0.041 -0.932 0.352 -0.120 0.043 649 Passive Control vs. Intern-Only WC -0.015 0.071 -0.215 0.830 -0.154 0.124 542 Intern-Only WC vs. Intern Group Project 0.019 0.072 0.262 0.793 -0.122 0.160 237
Week 3 Intern-Senior Manager WC vs. Asynchronous Q&A 0.129 0.061 2.121 0.035 0.009 0.249 322 Intern-Senior Manager WC vs. Passive Control 0.035 0.054 0.647 0.518 -0.071 0.140 607 Intern-Senior Manager WC vs. Intern Group Project 0.099 0.059 1.669 0.096 -0.018 0.216 289 Intern-Senior Manager WC vs. Intern-Only WC 0.029 0.068 0.422 0.673 -0.106 0.163 227 Passive Control vs. Asynchronous Q&A 0.097 0.045 2.183 0.029 0.010 0.185 697 Intern Group Project vs. Asynchronous Q&A 0.034 0.052 0.657 0.512 -0.067 0.135 379 Intern-Only WC vs. Asynchronous Q&A 0.107 0.067 1.602 0.110 -0.024 0.239 317 Passive Control vs. Intern Group Project -0.055 0.042 -1.292 0.197 -0.138 0.028 664 Passive Control vs. Intern-Only WC 0.011 0.058 0.180 0.857 -0.104 0.125 602 Intern-Only WC vs. Intern Group Project 0.069 0.064 1.079 0.282 -0.057 0.196 284
Week 4 Intern-Senior Manager WC vs. Asynchronous Q&A 0.078 0.060 1.294 0.196 -0.041 0.197 343 Intern-Senior Manager WC vs. Passive Control 0.063 0.052 1.211 0.226 -0.039 0.164 623 Intern-Senior Manager WC vs. Intern Group Project 0.074 0.062 1.202 0.230 -0.047 0.196 314 Intern-Senior Manager WC vs. Intern-Only WC -0.005 0.065 -0.079 0.937 -0.133 0.123 272
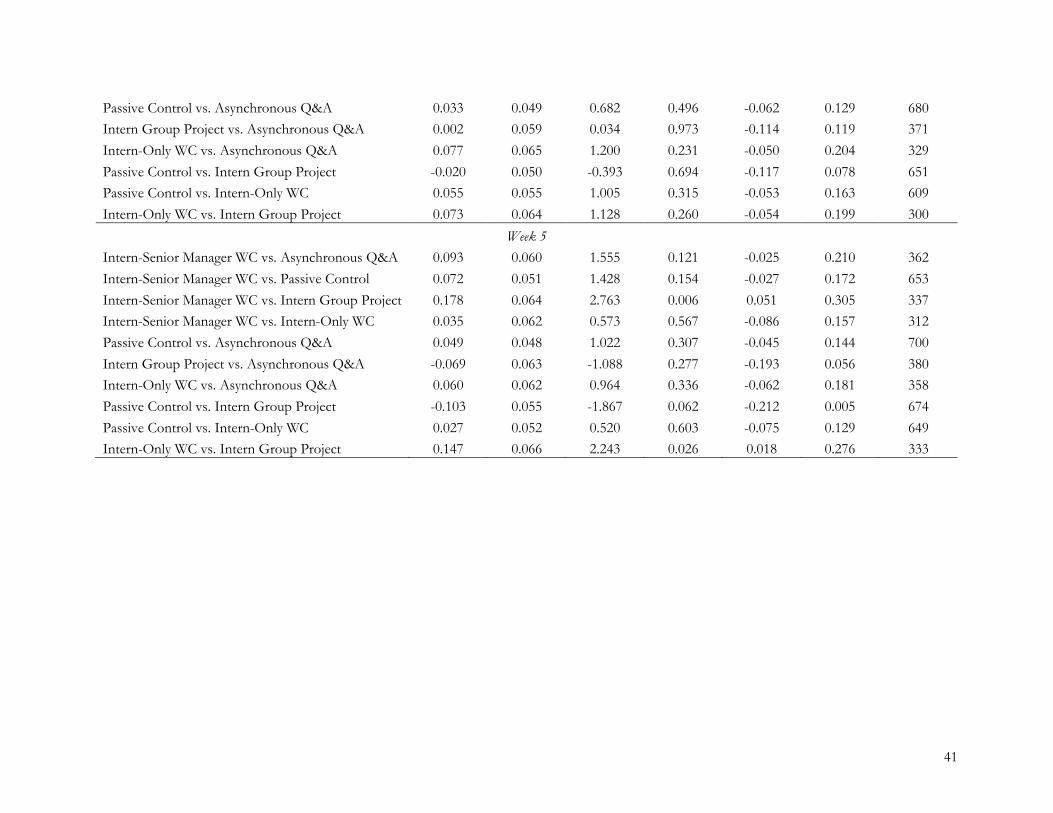
41
Passive Control vs. Asynchronous Q&A 0.033 0.049 0.682 0.496 -0.062 0.129 680 Intern Group Project vs. Asynchronous Q&A 0.002 0.059 0.034 0.973 -0.114 0.119 371 Intern-Only WC vs. Asynchronous Q&A 0.077 0.065 1.200 0.231 -0.050 0.204 329 Passive Control vs. Intern Group Project -0.020 0.050 -0.393 0.694 -0.117 0.078 651 Passive Control vs. Intern-Only WC 0.055 0.055 1.005 0.315 -0.053 0.163 609 Intern-Only WC vs. Intern Group Project 0.073 0.064 1.128 0.260 -0.054 0.199 300
Week 5 Intern-Senior Manager WC vs. Asynchronous Q&A 0.093 0.060 1.555 0.121 -0.025 0.210 362 Intern-Senior Manager WC vs. Passive Control 0.072 0.051 1.428 0.154 -0.027 0.172 653 Intern-Senior Manager WC vs. Intern Group Project 0.178 0.064 2.763 0.006 0.051 0.305 337 Intern-Senior Manager WC vs. Intern-Only WC 0.035 0.062 0.573 0.567 -0.086 0.157 312 Passive Control vs. Asynchronous Q&A 0.049 0.048 1.022 0.307 -0.045 0.144 700 Intern Group Project vs. Asynchronous Q&A -0.069 0.063 -1.088 0.277 -0.193 0.056 380 Intern-Only WC vs. Asynchronous Q&A 0.060 0.062 0.964 0.336 -0.062 0.181 358 Passive Control vs. Intern Group Project -0.103 0.055 -1.867 0.062 -0.212 0.005 674 Passive Control vs. Intern-Only WC 0.027 0.052 0.520 0.603 -0.075 0.129 649 Intern-Only WC vs. Intern Group Project 0.147 0.066 2.243 0.026 0.018 0.276 333
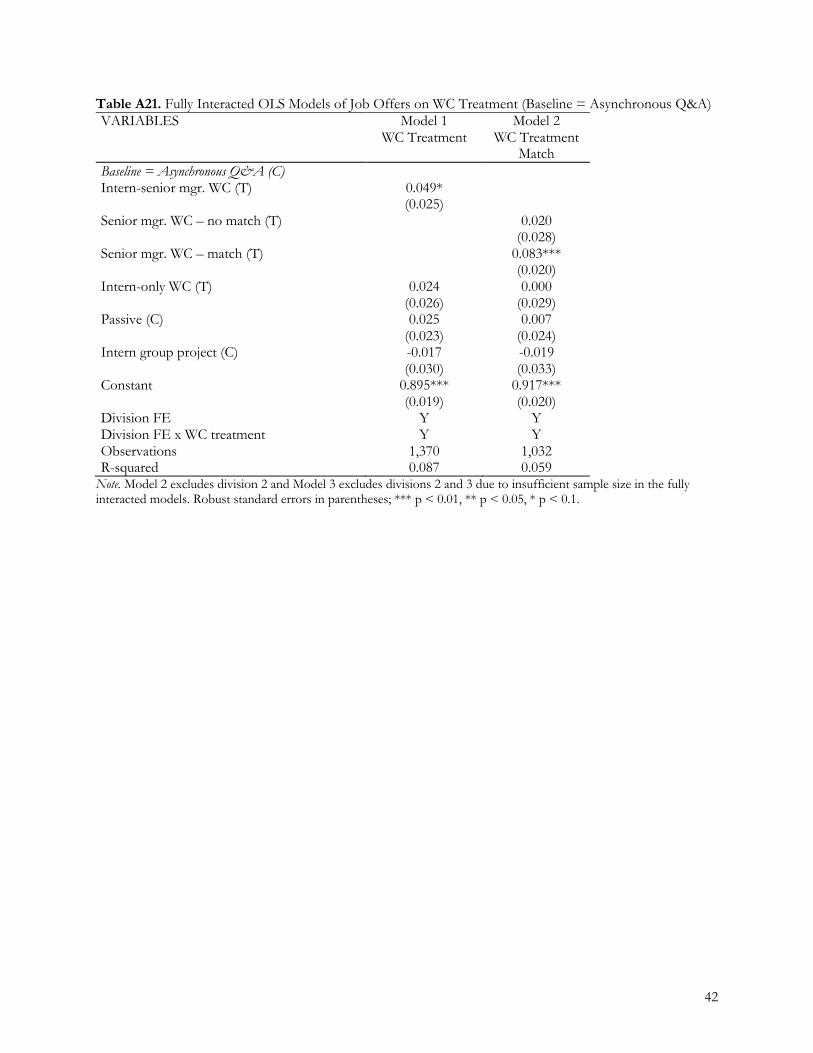
42
Table A21. Fully Interacted OLS Models of Job Offers on WC Treatment (Baseline = Asynchronous Q&A) VARIABLES Model 1
WC Treatment Model 2
WC Treatment Match
Baseline = Asynchronous Q&A (C) Intern-senior mgr. WC (T) 0.049* (0.025) Senior mgr. WC – no match (T) 0.020 (0.028) Senior mgr. WC – match (T) 0.083*** (0.020) Intern-only WC (T) 0.024 0.000 (0.026) (0.029) Passive (C) 0.025 0.007 (0.023) (0.024) Intern group project (C) -0.017 -0.019 (0.030) (0.033) Constant 0.895*** 0.917*** (0.019) (0.020) Division FE Y Y Division FE x WC treatment Y Y Observations 1,370 1,032 R-squared 0.087 0.059
Note. Model 2 excludes division 2 and Model 3 excludes divisions 2 and 3 due to insufficient sample size in the fully interacted models. Robust standard errors in parentheses; *** p < 0.01, ** p < 0.05, * p < 0.1.
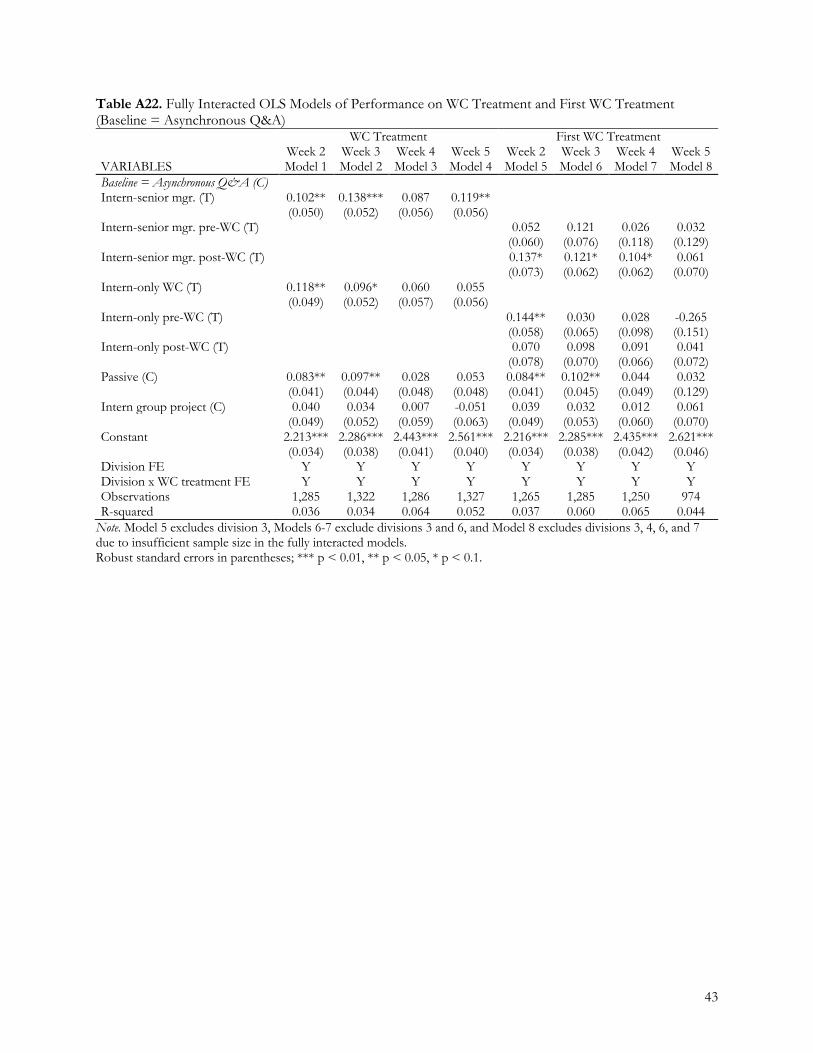
43
Table A22. Fully Interacted OLS Models of Performance on WC Treatment and First WC Treatment (Baseline = Asynchronous Q&A) WC Treatment First WC Treatment Week 2 Week 3 Week 4 Week 5 Week 2 Week 3 Week 4 Week 5 VARIABLES Model 1 Model 2 Model 3 Model 4 Model 5 Model 6 Model 7 Model 8 Baseline = Asynchronous Q&A (C) Intern-senior mgr. (T) 0.102** 0.138*** 0.087 0.119** (0.050) (0.052) (0.056) (0.056) Intern-senior mgr. pre-WC (T) 0.052 0.121 0.026 0.032 (0.060) (0.076) (0.118) (0.129) Intern-senior mgr. post-WC (T) 0.137* 0.121* 0.104* 0.061 (0.073) (0.062) (0.062) (0.070) Intern-only WC (T) 0.118** 0.096* 0.060 0.055 (0.049) (0.052) (0.057) (0.056) Intern-only pre-WC (T) 0.144** 0.030 0.028 -0.265 (0.058) (0.065) (0.098) (0.151) Intern-only post-WC (T) 0.070 0.098 0.091 0.041 (0.078) (0.070) (0.066) (0.072) Passive (C) 0.083** 0.097** 0.028 0.053 0.084** 0.102** 0.044 0.032 (0.041) (0.044) (0.048) (0.048) (0.041) (0.045) (0.049) (0.129) Intern group project (C) 0.040 0.034 0.007 -0.051 0.039 0.032 0.012 0.061 (0.049) (0.052) (0.059) (0.063) (0.049) (0.053) (0.060) (0.070) Constant 2.213*** 2.286*** 2.443*** 2.561*** 2.216*** 2.285*** 2.435*** 2.621*** (0.034) (0.038) (0.041) (0.040) (0.034) (0.038) (0.042) (0.046) Division FE Y Y Y Y Y Y Y Y Division x WC treatment FE Y Y Y Y Y Y Y Y Observations 1,285 1,322 1,286 1,327 1,265 1,285 1,250 974 R-squared 0.036 0.034 0.064 0.052 0.037 0.060 0.065 0.044
Note. Model 5 excludes division 3, Models 6-7 exclude divisions 3 and 6, and Model 8 excludes divisions 3, 4, 6, and 7 due to insufficient sample size in the fully interacted models. Robust standard errors in parentheses; *** p < 0.01, ** p < 0.05, * p < 0.1.
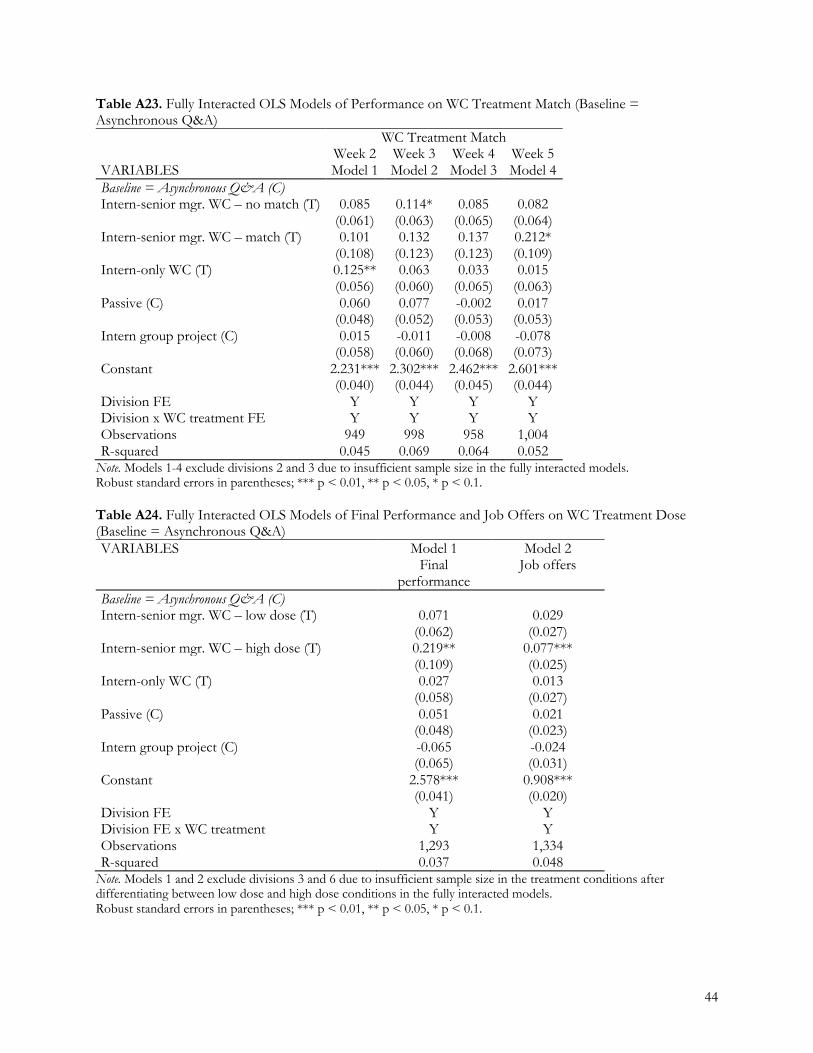
44
Table A23. Fully Interacted OLS Models of Performance on WC Treatment Match (Baseline = Asynchronous Q&A) WC Treatment Match Week 2 Week 3 Week 4 Week 5 VARIABLES Model 1 Model 2 Model 3 Model 4 Baseline = Asynchronous Q&A (C) Intern-senior mgr. WC – no match (T) 0.085 0.114* 0.085 0.082 (0.061) (0.063) (0.065) (0.064) Intern-senior mgr. WC – match (T) 0.101 0.132 0.137 0.212* (0.108) (0.123) (0.123) (0.109) Intern-only WC (T) 0.125** 0.063 0.033 0.015 (0.056) (0.060) (0.065) (0.063) Passive (C) 0.060 0.077 -0.002 0.017 (0.048) (0.052) (0.053) (0.053) Intern group project (C) 0.015 -0.011 -0.008 -0.078 (0.058) (0.060) (0.068) (0.073) Constant 2.231*** 2.302*** 2.462*** 2.601*** (0.040) (0.044) (0.045) (0.044) Division FE Y Y Y Y Division x WC treatment FE Y Y Y Y Observations 949 998 958 1,004 R-squared 0.045 0.069 0.064 0.052
Note. Models 1-4 exclude divisions 2 and 3 due to insufficient sample size in the fully interacted models. Robust standard errors in parentheses; *** p < 0.01, ** p < 0.05, * p < 0.1. Table A24. Fully Interacted OLS Models of Final Performance and Job Offers on WC Treatment Dose (Baseline = Asynchronous Q&A) VARIABLES Model 1
Final performance
Model 2 Job offers
Baseline = Asynchronous Q&A (C) Intern-senior mgr. WC – low dose (T) 0.071 0.029 (0.062) (0.027) Intern-senior mgr. WC – high dose (T) 0.219** 0.077*** (0.109) (0.025) Intern-only WC (T) 0.027 0.013 (0.058) (0.027) Passive (C) 0.051 0.021 (0.048) (0.023) Intern group project (C) -0.065 -0.024 (0.065) (0.031) Constant 2.578*** 0.908*** (0.041) (0.020) Division FE Y Y Division FE x WC treatment Y Y Observations 1,293 1,334 R-squared 0.037 0.048
Note. Models 1 and 2 exclude divisions 3 and 6 due to insufficient sample size in the treatment conditions after differentiating between low dose and high dose conditions in the fully interacted models. Robust standard errors in parentheses; *** p < 0.01, ** p < 0.05, * p < 0.1.
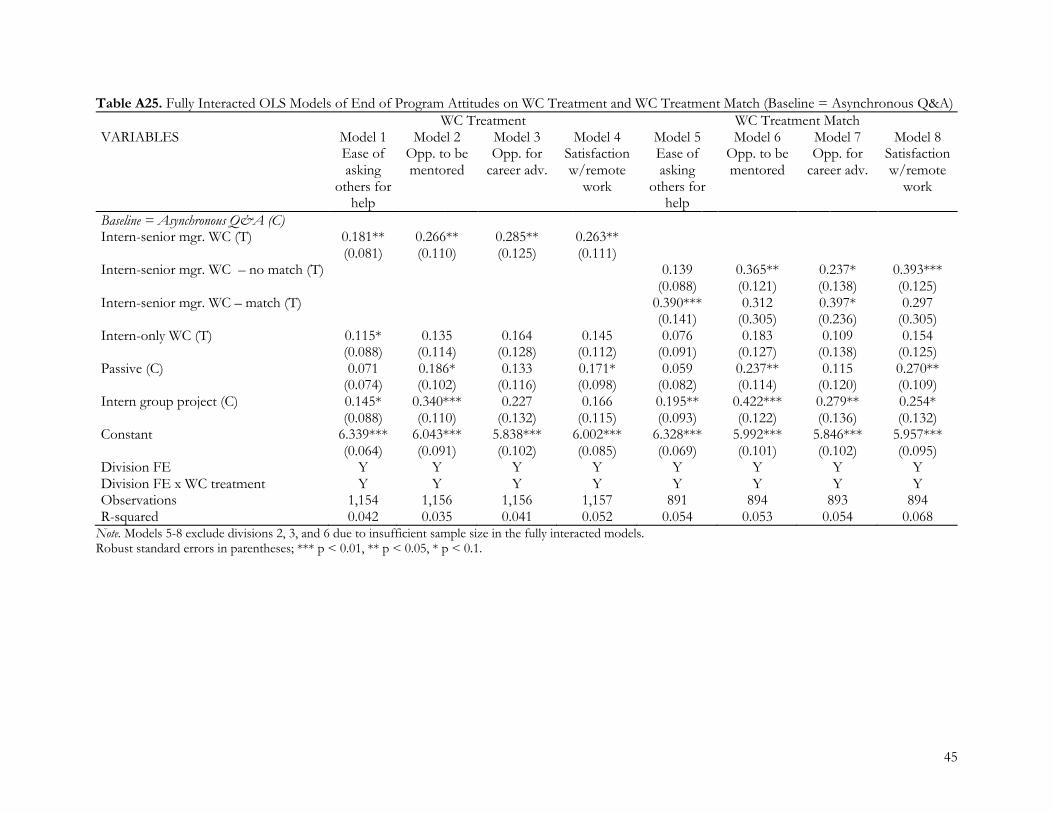
45
Table A25. Fully Interacted OLS Models of End of Program Attitudes on WC Treatment and WC Treatment Match (Baseline = Asynchronous Q&A) WC Treatment WC Treatment Match VARIABLES Model 1
Ease of asking
others for help
Model 2 Opp. to be mentored
Model 3 Opp. for
career adv.
Model 4 Satisfaction w/remote
work
Model 5 Ease of asking
others for help
Model 6 Opp. to be mentored
Model 7 Opp. for
career adv.
Model 8 Satisfaction w/remote
work
Baseline = Asynchronous Q&A (C) Intern-senior mgr. WC (T) 0.181** 0.266** 0.285** 0.263** (0.081) (0.110) (0.125) (0.111) Intern-senior mgr. WC – no match (T) 0.139 0.365** 0.237* 0.393*** (0.088) (0.121) (0.138) (0.125) Intern-senior mgr. WC – match (T) 0.390*** 0.312 0.397* 0.297 (0.141) (0.305) (0.236) (0.305) Intern-only WC (T) 0.115* 0.135 0.164 0.145 0.076 0.183 0.109 0.154 (0.088) (0.114) (0.128) (0.112) (0.091) (0.127) (0.138) (0.125) Passive (C) 0.071 0.186* 0.133 0.171* 0.059 0.237** 0.115 0.270** (0.074) (0.102) (0.116) (0.098) (0.082) (0.114) (0.120) (0.109) Intern group project (C) 0.145* 0.340*** 0.227 0.166 0.195** 0.422*** 0.279** 0.254* (0.088) (0.110) (0.132) (0.115) (0.093) (0.122) (0.136) (0.132) Constant 6.339*** 6.043*** 5.838*** 6.002*** 6.328*** 5.992*** 5.846*** 5.957*** (0.064) (0.091) (0.102) (0.085) (0.069) (0.101) (0.102) (0.095) Division FE Y Y Y Y Y Y Y Y Division FE x WC treatment Y Y Y Y Y Y Y Y Observations 1,154 1,156 1,156 1,157 891 894 893 894 R-squared 0.042 0.035 0.041 0.052 0.054 0.053 0.054 0.068 Note. Models 5-8 exclude divisions 2, 3, and 6 due to insufficient sample size in the fully interacted models. Robust standard errors in parentheses; *** p < 0.01, ** p < 0.05, * p < 0.1.
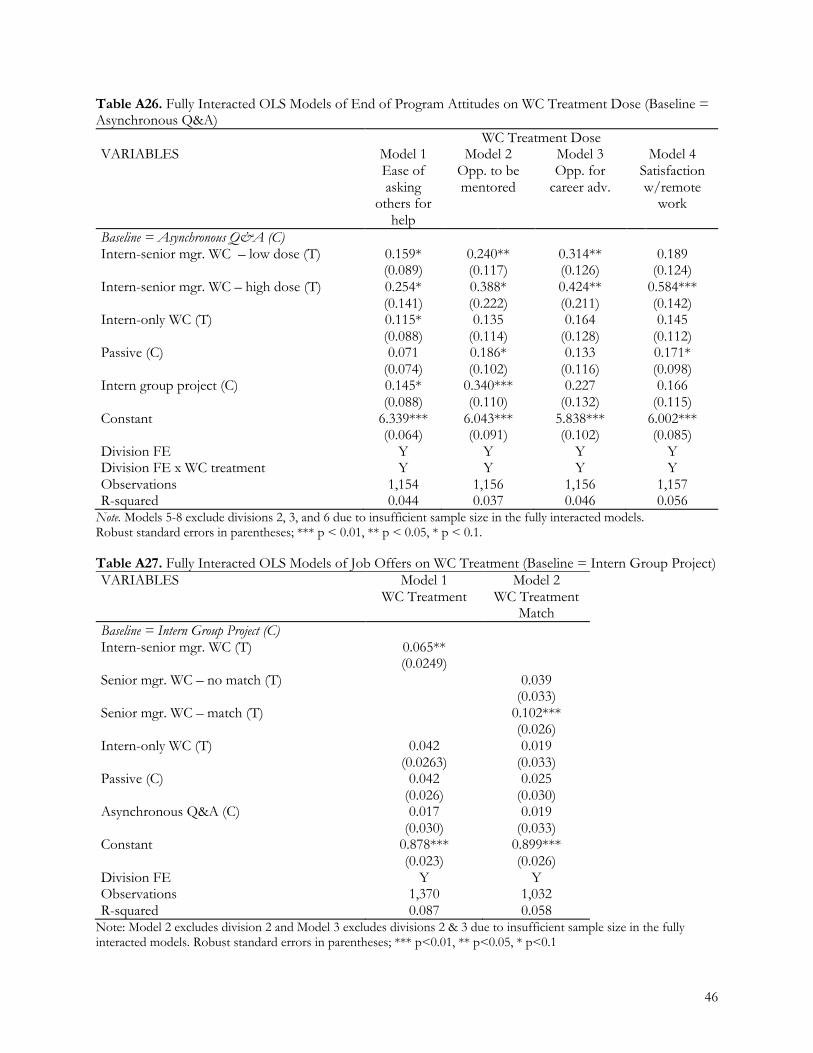
46
Table A26. Fully Interacted OLS Models of End of Program Attitudes on WC Treatment Dose (Baseline = Asynchronous Q&A) WC Treatment Dose VARIABLES Model 1
Ease of asking
others for help
Model 2 Opp. to be mentored
Model 3 Opp. for
career adv.
Model 4 Satisfaction w/remote
work
Baseline = Asynchronous Q&A (C) Intern-senior mgr. WC – low dose (T) 0.159* 0.240** 0.314** 0.189 (0.089) (0.117) (0.126) (0.124) Intern-senior mgr. WC – high dose (T) 0.254* 0.388* 0.424** 0.584*** (0.141) (0.222) (0.211) (0.142) Intern-only WC (T) 0.115* 0.135 0.164 0.145 (0.088) (0.114) (0.128) (0.112) Passive (C) 0.071 0.186* 0.133 0.171* (0.074) (0.102) (0.116) (0.098) Intern group project (C) 0.145* 0.340*** 0.227 0.166 (0.088) (0.110) (0.132) (0.115) Constant 6.339*** 6.043*** 5.838*** 6.002*** (0.064) (0.091) (0.102) (0.085) Division FE Y Y Y Y Division FE x WC treatment Y Y Y Y Observations 1,154 1,156 1,156 1,157 R-squared 0.044 0.037 0.046 0.056
Note. Models 5-8 exclude divisions 2, 3, and 6 due to insufficient sample size in the fully interacted models. Robust standard errors in parentheses; *** p < 0.01, ** p < 0.05, * p < 0.1. Table A27. Fully Interacted OLS Models of Job Offers on WC Treatment (Baseline = Intern Group Project) VARIABLES Model 1
WC Treatment Model 2
WC Treatment Match
Baseline = Intern Group Project (C) Intern-senior mgr. WC (T) 0.065** (0.0249) Senior mgr. WC – no match (T) 0.039 (0.033) Senior mgr. WC – match (T) 0.102*** (0.026) Intern-only WC (T) 0.042 0.019 (0.0263) (0.033) Passive (C) 0.042 0.025 (0.026) (0.030) Asynchronous Q&A (C) 0.017 0.019 (0.030) (0.033) Constant 0.878*** 0.899*** (0.023) (0.026) Division FE Y Y Observations 1,370 1,032 R-squared 0.087 0.058
Note: Model 2 excludes division 2 and Model 3 excludes divisions 2 & 3 due to insufficient sample size in the fully interacted models. Robust standard errors in parentheses; *** p<0.01, ** p<0.05, * p<0.1
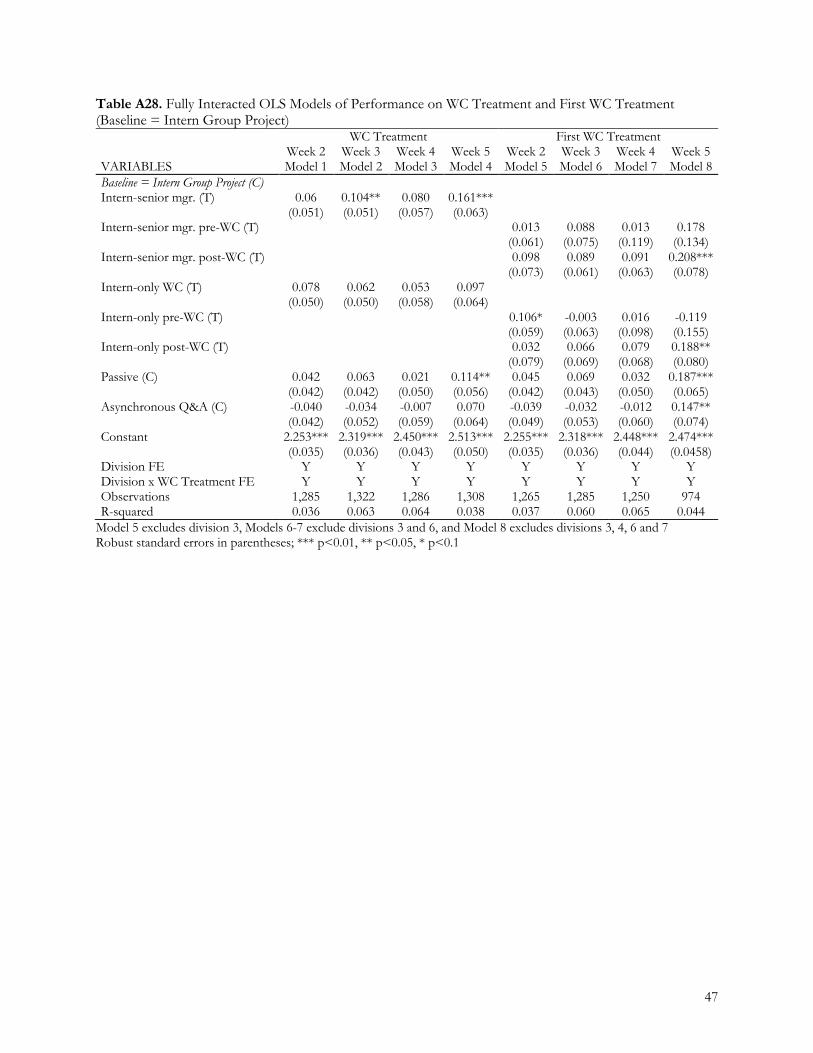
47
Table A28. Fully Interacted OLS Models of Performance on WC Treatment and First WC Treatment (Baseline = Intern Group Project) WC Treatment First WC Treatment Week 2 Week 3 Week 4 Week 5 Week 2 Week 3 Week 4 Week 5 VARIABLES Model 1 Model 2 Model 3 Model 4 Model 5 Model 6 Model 7 Model 8 Baseline = Intern Group Project (C) Intern-senior mgr. (T) 0.06 0.104** 0.080 0.161*** (0.051) (0.051) (0.057) (0.063) Intern-senior mgr. pre-WC (T) 0.013 0.088 0.013 0.178 (0.061) (0.075) (0.119) (0.134) Intern-senior mgr. post-WC (T) 0.098 0.089 0.091 0.208*** (0.073) (0.061) (0.063) (0.078) Intern-only WC (T) 0.078 0.062 0.053 0.097 (0.050) (0.050) (0.058) (0.064) Intern-only pre-WC (T) 0.106* -0.003 0.016 -0.119 (0.059) (0.063) (0.098) (0.155) Intern-only post-WC (T) 0.032 0.066 0.079 0.188** (0.079) (0.069) (0.068) (0.080) Passive (C) 0.042 0.063 0.021 0.114** 0.045 0.069 0.032 0.187*** (0.042) (0.042) (0.050) (0.056) (0.042) (0.043) (0.050) (0.065) Asynchronous Q&A (C) -0.040 -0.034 -0.007 0.070 -0.039 -0.032 -0.012 0.147** (0.042) (0.052) (0.059) (0.064) (0.049) (0.053) (0.060) (0.074) Constant 2.253*** 2.319*** 2.450*** 2.513*** 2.255*** 2.318*** 2.448*** 2.474*** (0.035) (0.036) (0.043) (0.050) (0.035) (0.036) (0.044) (0.0458) Division FE Y Y Y Y Y Y Y Y Division x WC Treatment FE Y Y Y Y Y Y Y Y Observations 1,285 1,322 1,286 1,308 1,265 1,285 1,250 974 R-squared 0.036 0.063 0.064 0.038 0.037 0.060 0.065 0.044
Model 5 excludes division 3, Models 6-7 exclude divisions 3 and 6, and Model 8 excludes divisions 3, 4, 6 and 7 Robust standard errors in parentheses; *** p<0.01, ** p<0.05, * p<0.1
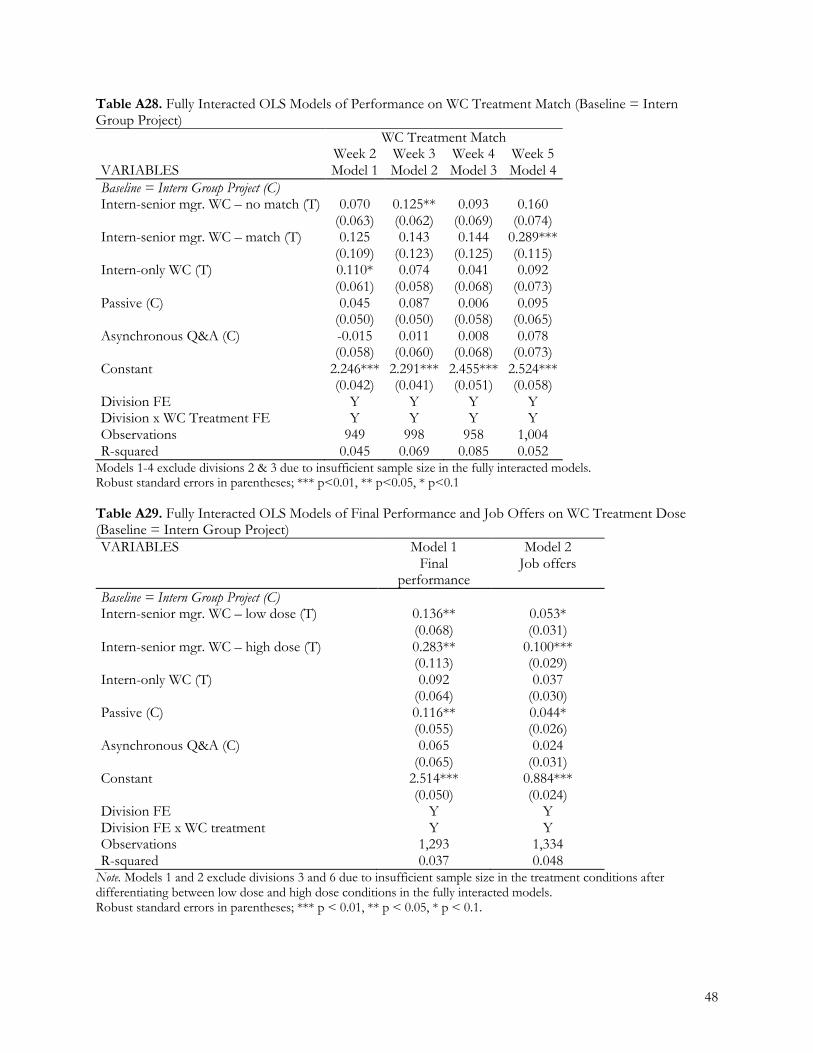
48
Table A28. Fully Interacted OLS Models of Performance on WC Treatment Match (Baseline = Intern Group Project) WC Treatment Match Week 2 Week 3 Week 4 Week 5 VARIABLES Model 1 Model 2 Model 3 Model 4 Baseline = Intern Group Project (C) Intern-senior mgr. WC – no match (T) 0.070 0.125** 0.093 0.160 (0.063) (0.062) (0.069) (0.074) Intern-senior mgr. WC – match (T) 0.125 0.143 0.144 0.289*** (0.109) (0.123) (0.125) (0.115) Intern-only WC (T) 0.110* 0.074 0.041 0.092 (0.061) (0.058) (0.068) (0.073) Passive (C) 0.045 0.087 0.006 0.095 (0.050) (0.050) (0.058) (0.065) Asynchronous Q&A (C) -0.015 0.011 0.008 0.078 (0.058) (0.060) (0.068) (0.073) Constant 2.246*** 2.291*** 2.455*** 2.524*** (0.042) (0.041) (0.051) (0.058) Division FE Y Y Y Y Division x WC Treatment FE Y Y Y Y Observations 949 998 958 1,004 R-squared 0.045 0.069 0.085 0.052
Models 1-4 exclude divisions 2 & 3 due to insufficient sample size in the fully interacted models. Robust standard errors in parentheses; *** p<0.01, ** p<0.05, * p<0.1 Table A29. Fully Interacted OLS Models of Final Performance and Job Offers on WC Treatment Dose (Baseline = Intern Group Project) VARIABLES Model 1
Final performance
Model 2 Job offers
Baseline = Intern Group Project (C) Intern-senior mgr. WC – low dose (T) 0.136** 0.053* (0.068) (0.031) Intern-senior mgr. WC – high dose (T) 0.283** 0.100*** (0.113) (0.029) Intern-only WC (T) 0.092 0.037 (0.064) (0.030) Passive (C) 0.116** 0.044* (0.055) (0.026) Asynchronous Q&A (C) 0.065 0.024 (0.065) (0.031) Constant 2.514*** 0.884*** (0.050) (0.024) Division FE Y Y Division FE x WC treatment Y Y Observations 1,293 1,334 R-squared 0.037 0.048
Note. Models 1 and 2 exclude divisions 3 and 6 due to insufficient sample size in the treatment conditions after differentiating between low dose and high dose conditions in the fully interacted models. Robust standard errors in parentheses; *** p < 0.01, ** p < 0.05, * p < 0.1.
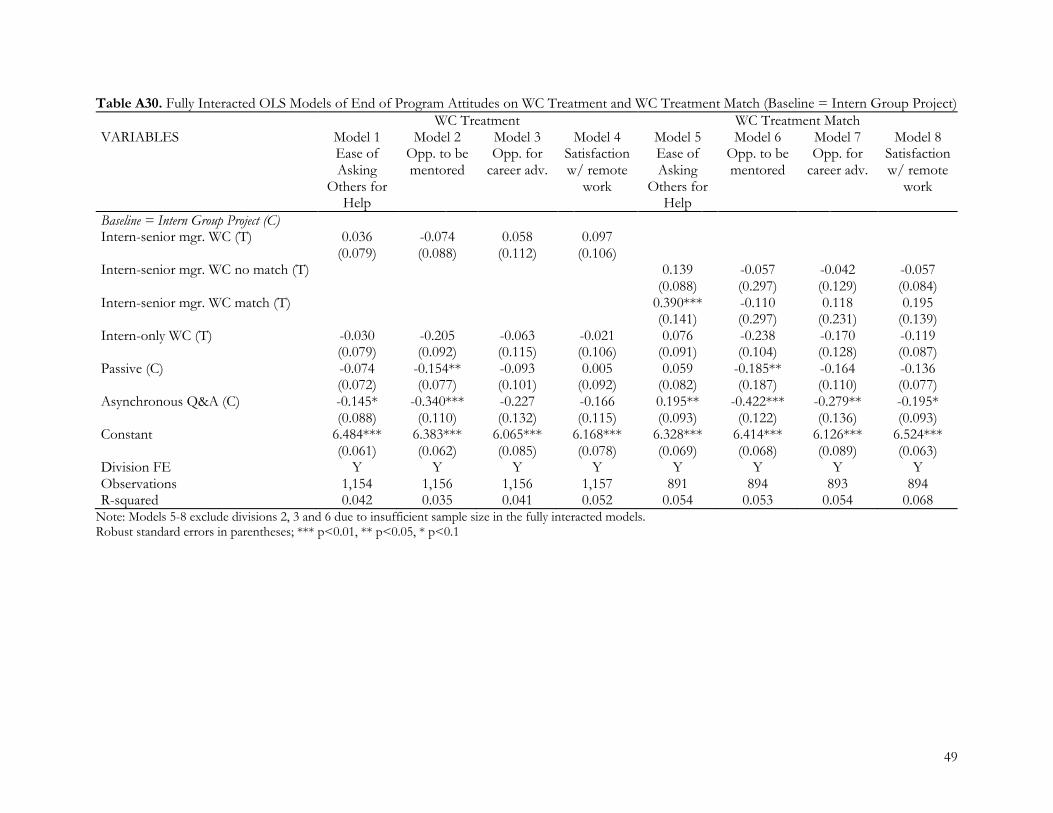
49
Table A30. Fully Interacted OLS Models of End of Program Attitudes on WC Treatment and WC Treatment Match (Baseline = Intern Group Project) WC Treatment WC Treatment Match VARIABLES Model 1
Ease of Asking
Others for Help
Model 2 Opp. to be mentored
Model 3 Opp. for
career adv.
Model 4 Satisfaction w/ remote
work
Model 5 Ease of Asking
Others for Help
Model 6 Opp. to be mentored
Model 7 Opp. for
career adv.
Model 8 Satisfaction w/ remote
work
Baseline = Intern Group Project (C) Intern-senior mgr. WC (T) 0.036 -0.074 0.058 0.097 (0.079) (0.088) (0.112) (0.106) Intern-senior mgr. WC no match (T) 0.139 -0.057 -0.042 -0.057 (0.088) (0.297) (0.129) (0.084) Intern-senior mgr. WC match (T) 0.390*** -0.110 0.118 0.195 (0.141) (0.297) (0.231) (0.139) Intern-only WC (T) -0.030 -0.205 -0.063 -0.021 0.076 -0.238 -0.170 -0.119 (0.079) (0.092) (0.115) (0.106) (0.091) (0.104) (0.128) (0.087) Passive (C) -0.074 -0.154** -0.093 0.005 0.059 -0.185** -0.164 -0.136 (0.072) (0.077) (0.101) (0.092) (0.082) (0.187) (0.110) (0.077) Asynchronous Q&A (C) -0.145* -0.340*** -0.227 -0.166 0.195** -0.422*** -0.279** -0.195* (0.088) (0.110) (0.132) (0.115) (0.093) (0.122) (0.136) (0.093) Constant 6.484*** 6.383*** 6.065*** 6.168*** 6.328*** 6.414*** 6.126*** 6.524*** (0.061) (0.062) (0.085) (0.078) (0.069) (0.068) (0.089) (0.063) Division FE Y Y Y Y Y Y Y Y Observations 1,154 1,156 1,156 1,157 891 894 893 894 R-squared 0.042 0.035 0.041 0.052 0.054 0.053 0.054 0.068
Note: Models 5-8 exclude divisions 2, 3 and 6 due to insufficient sample size in the fully interacted models. Robust standard errors in parentheses; *** p<0.01, ** p<0.05, * p<0.1
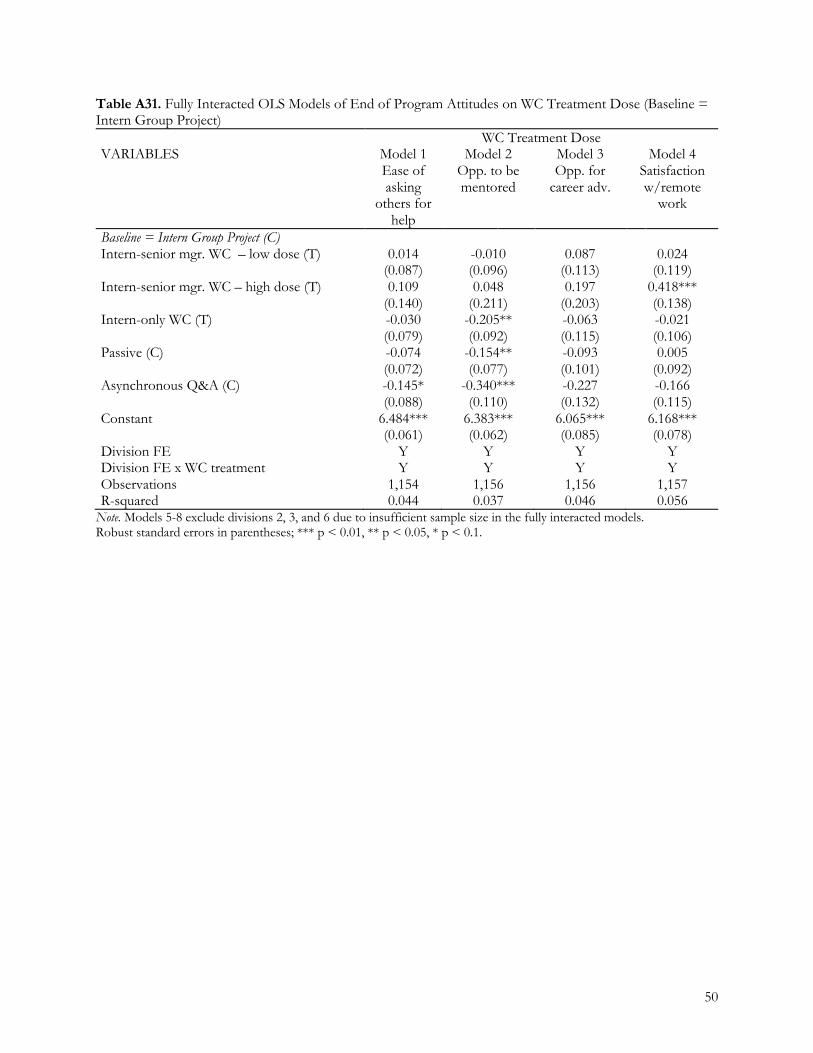
50
Table A31. Fully Interacted OLS Models of End of Program Attitudes on WC Treatment Dose (Baseline = Intern Group Project) WC Treatment Dose VARIABLES Model 1
Ease of asking
others for help
Model 2 Opp. to be mentored
Model 3 Opp. for
career adv.
Model 4 Satisfaction w/remote
work
Baseline = Intern Group Project (C) Intern-senior mgr. WC – low dose (T) 0.014 -0.010 0.087 0.024 (0.087) (0.096) (0.113) (0.119) Intern-senior mgr. WC – high dose (T) 0.109 0.048 0.197 0.418*** (0.140) (0.211) (0.203) (0.138) Intern-only WC (T) -0.030 -0.205** -0.063 -0.021 (0.079) (0.092) (0.115) (0.106) Passive (C) -0.074 -0.154** -0.093 0.005 (0.072) (0.077) (0.101) (0.092) Asynchronous Q&A (C) -0.145* -0.340*** -0.227 -0.166 (0.088) (0.110) (0.132) (0.115) Constant 6.484*** 6.383*** 6.065*** 6.168*** (0.061) (0.062) (0.085) (0.078) Division FE Y Y Y Y Division FE x WC treatment Y Y Y Y Observations 1,154 1,156 1,156 1,157 R-squared 0.044 0.037 0.046 0.056
Note. Models 5-8 exclude divisions 2, 3, and 6 due to insufficient sample size in the fully interacted models. Robust standard errors in parentheses; *** p < 0.01, ** p < 0.05, * p < 0.1.
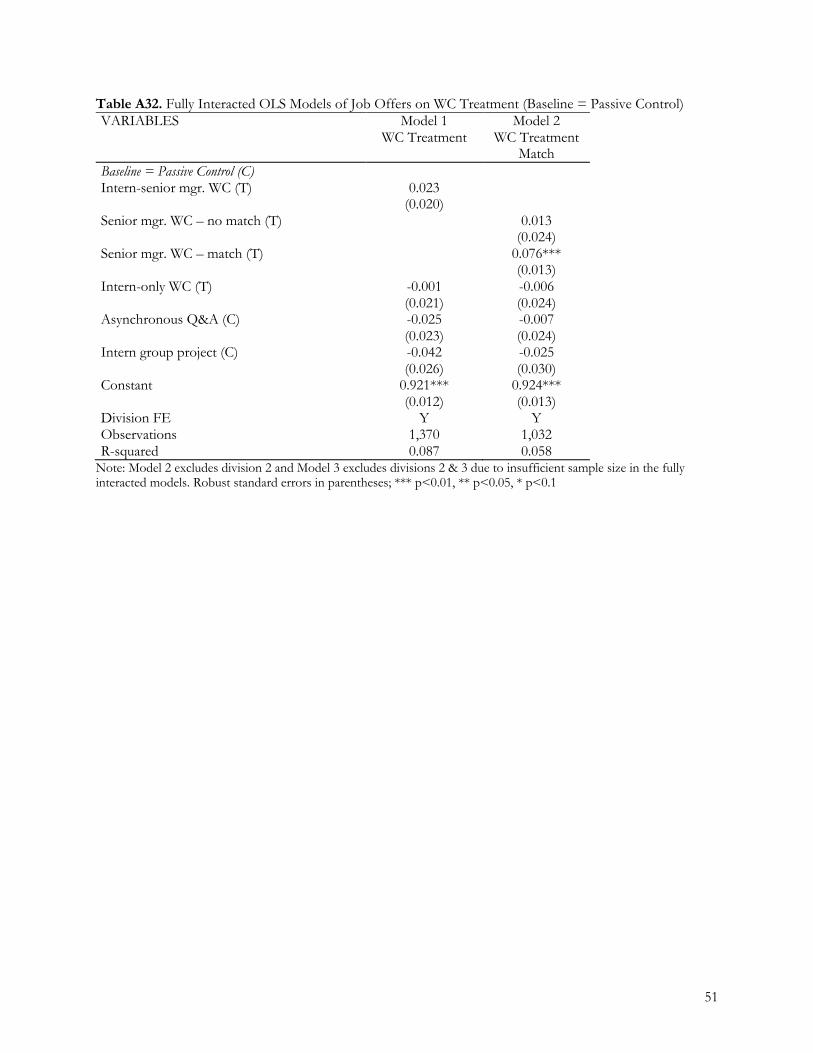
51
Table A32. Fully Interacted OLS Models of Job Offers on WC Treatment (Baseline = Passive Control) VARIABLES Model 1
WC Treatment Model 2
WC Treatment Match
Baseline = Passive Control (C) Intern-senior mgr. WC (T) 0.023 (0.020) Senior mgr. WC – no match (T) 0.013 (0.024) Senior mgr. WC – match (T) 0.076*** (0.013) Intern-only WC (T) -0.001 -0.006 (0.021) (0.024) Asynchronous Q&A (C) -0.025 -0.007 (0.023) (0.024) Intern group project (C) -0.042 -0.025 (0.026) (0.030) Constant 0.921*** 0.924*** (0.012) (0.013) Division FE Y Y Observations 1,370 1,032 R-squared 0.087 0.058
Note: Model 2 excludes division 2 and Model 3 excludes divisions 2 & 3 due to insufficient sample size in the fully interacted models. Robust standard errors in parentheses; *** p<0.01, ** p<0.05, * p<0.1
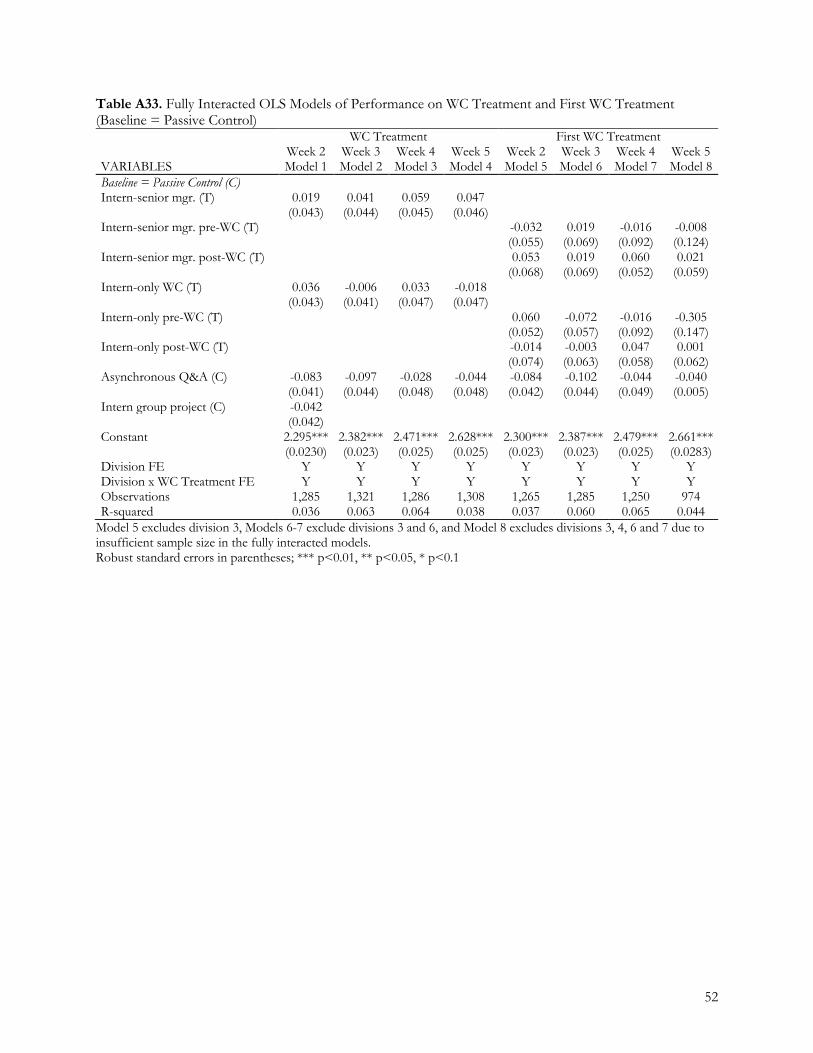
52
Table A33. Fully Interacted OLS Models of Performance on WC Treatment and First WC Treatment (Baseline = Passive Control) WC Treatment First WC Treatment Week 2 Week 3 Week 4 Week 5 Week 2 Week 3 Week 4 Week 5 VARIABLES Model 1 Model 2 Model 3 Model 4 Model 5 Model 6 Model 7 Model 8 Baseline = Passive Control (C) Intern-senior mgr. (T) 0.019 0.041 0.059 0.047 (0.043) (0.044) (0.045) (0.046) Intern-senior mgr. pre-WC (T) -0.032 0.019 -0.016 -0.008 (0.055) (0.069) (0.092) (0.124) Intern-senior mgr. post-WC (T) 0.053 0.019 0.060 0.021 (0.068) (0.069) (0.052) (0.059) Intern-only WC (T) 0.036 -0.006 0.033 -0.018 (0.043) (0.041) (0.047) (0.047) Intern-only pre-WC (T) 0.060 -0.072 -0.016 -0.305 (0.052) (0.057) (0.092) (0.147) Intern-only post-WC (T) -0.014 -0.003 0.047 0.001 (0.074) (0.063) (0.058) (0.062) Asynchronous Q&A (C) -0.083 -0.097 -0.028 -0.044 -0.084 -0.102 -0.044 -0.040 (0.041) (0.044) (0.048) (0.048) (0.042) (0.044) (0.049) (0.005) Intern group project (C) -0.042 (0.042) Constant 2.295*** 2.382*** 2.471*** 2.628*** 2.300*** 2.387*** 2.479*** 2.661*** (0.0230) (0.023) (0.025) (0.025) (0.023) (0.023) (0.025) (0.0283) Division FE Y Y Y Y Y Y Y Y Division x WC Treatment FE Y Y Y Y Y Y Y Y Observations 1,285 1,321 1,286 1,308 1,265 1,285 1,250 974 R-squared 0.036 0.063 0.064 0.038 0.037 0.060 0.065 0.044
Model 5 excludes division 3, Models 6-7 exclude divisions 3 and 6, and Model 8 excludes divisions 3, 4, 6 and 7 due to insufficient sample size in the fully interacted models. Robust standard errors in parentheses; *** p<0.01, ** p<0.05, * p<0.1
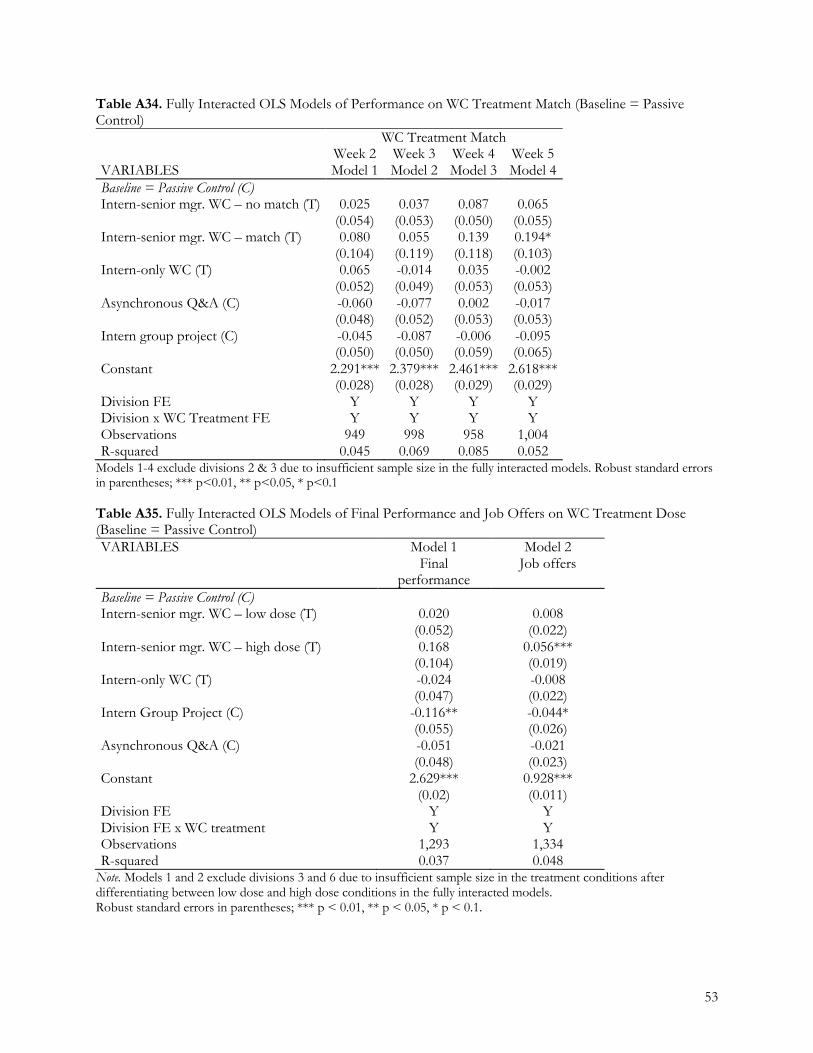
53
Table A34. Fully Interacted OLS Models of Performance on WC Treatment Match (Baseline = Passive Control) WC Treatment Match Week 2 Week 3 Week 4 Week 5 VARIABLES Model 1 Model 2 Model 3 Model 4 Baseline = Passive Control (C) Intern-senior mgr. WC – no match (T) 0.025 0.037 0.087 0.065 (0.054) (0.053) (0.050) (0.055) Intern-senior mgr. WC – match (T) 0.080 0.055 0.139 0.194* (0.104) (0.119) (0.118) (0.103) Intern-only WC (T) 0.065 -0.014 0.035 -0.002 (0.052) (0.049) (0.053) (0.053) Asynchronous Q&A (C) -0.060 -0.077 0.002 -0.017 (0.048) (0.052) (0.053) (0.053) Intern group project (C) -0.045 -0.087 -0.006 -0.095 (0.050) (0.050) (0.059) (0.065) Constant 2.291*** 2.379*** 2.461*** 2.618*** (0.028) (0.028) (0.029) (0.029) Division FE Y Y Y Y Division x WC Treatment FE Y Y Y Y Observations 949 998 958 1,004 R-squared 0.045 0.069 0.085 0.052
Models 1-4 exclude divisions 2 & 3 due to insufficient sample size in the fully interacted models. Robust standard errors in parentheses; *** p<0.01, ** p<0.05, * p<0.1 Table A35. Fully Interacted OLS Models of Final Performance and Job Offers on WC Treatment Dose (Baseline = Passive Control) VARIABLES Model 1
Final performance
Model 2 Job offers
Baseline = Passive Control (C) Intern-senior mgr. WC – low dose (T) 0.020 0.008 (0.052) (0.022) Intern-senior mgr. WC – high dose (T) 0.168 0.056*** (0.104) (0.019) Intern-only WC (T) -0.024 -0.008 (0.047) (0.022) Intern Group Project (C) -0.116** -0.044* (0.055) (0.026) Asynchronous Q&A (C) -0.051 -0.021 (0.048) (0.023) Constant 2.629*** 0.928*** (0.02) (0.011) Division FE Y Y Division FE x WC treatment Y Y Observations 1,293 1,334 R-squared 0.037 0.048
Note. Models 1 and 2 exclude divisions 3 and 6 due to insufficient sample size in the treatment conditions after differentiating between low dose and high dose conditions in the fully interacted models. Robust standard errors in parentheses; *** p < 0.01, ** p < 0.05, * p < 0.1.
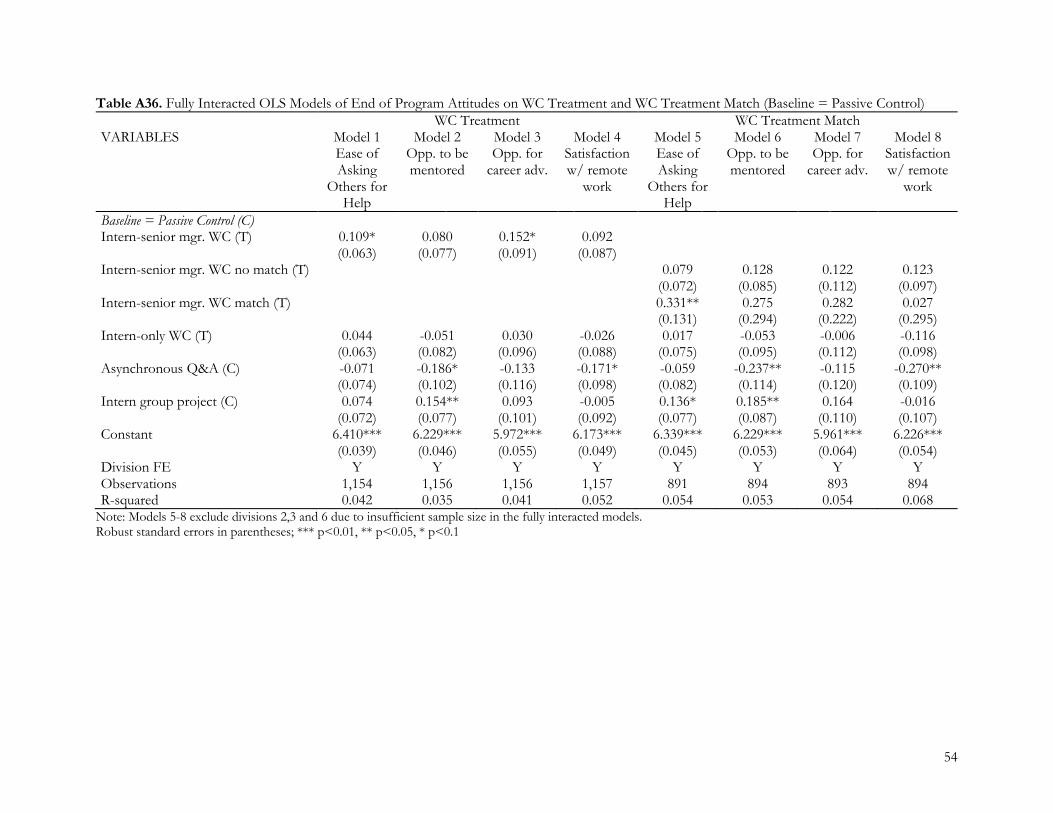
54
Table A36. Fully Interacted OLS Models of End of Program Attitudes on WC Treatment and WC Treatment Match (Baseline = Passive Control) WC Treatment WC Treatment Match VARIABLES Model 1
Ease of Asking
Others for Help
Model 2 Opp. to be mentored
Model 3 Opp. for
career adv.
Model 4 Satisfaction w/ remote
work
Model 5 Ease of Asking
Others for Help
Model 6 Opp. to be mentored
Model 7 Opp. for
career adv.
Model 8 Satisfaction w/ remote
work
Baseline = Passive Control (C) Intern-senior mgr. WC (T) 0.109* 0.080 0.152* 0.092 (0.063) (0.077) (0.091) (0.087) Intern-senior mgr. WC no match (T) 0.079 0.128 0.122 0.123 (0.072) (0.085) (0.112) (0.097) Intern-senior mgr. WC match (T) 0.331** 0.275 0.282 0.027 (0.131) (0.294) (0.222) (0.295) Intern-only WC (T) 0.044 -0.051 0.030 -0.026 0.017 -0.053 -0.006 -0.116 (0.063) (0.082) (0.096) (0.088) (0.075) (0.095) (0.112) (0.098) Asynchronous Q&A (C) -0.071 -0.186* -0.133 -0.171* -0.059 -0.237** -0.115 -0.270** (0.074) (0.102) (0.116) (0.098) (0.082) (0.114) (0.120) (0.109) Intern group project (C) 0.074 0.154** 0.093 -0.005 0.136* 0.185** 0.164 -0.016 (0.072) (0.077) (0.101) (0.092) (0.077) (0.087) (0.110) (0.107) Constant 6.410*** 6.229*** 5.972*** 6.173*** 6.339*** 6.229*** 5.961*** 6.226*** (0.039) (0.046) (0.055) (0.049) (0.045) (0.053) (0.064) (0.054) Division FE Y Y Y Y Y Y Y Y Observations 1,154 1,156 1,156 1,157 891 894 893 894 R-squared 0.042 0.035 0.041 0.052 0.054 0.053 0.054 0.068
Note: Models 5-8 exclude divisions 2,3 and 6 due to insufficient sample size in the fully interacted models. Robust standard errors in parentheses; *** p<0.01, ** p<0.05, * p<0.1
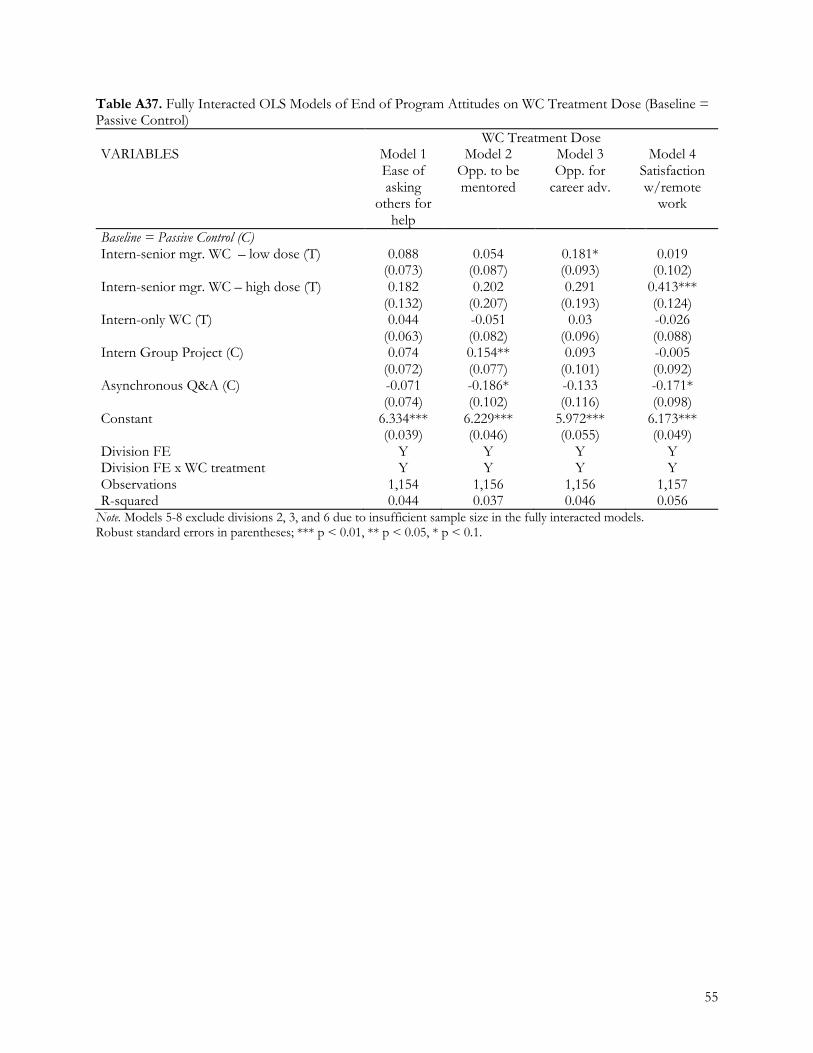
55
Table A37. Fully Interacted OLS Models of End of Program Attitudes on WC Treatment Dose (Baseline = Passive Control) WC Treatment Dose VARIABLES Model 1
Ease of asking
others for help
Model 2 Opp. to be mentored
Model 3 Opp. for
career adv.
Model 4 Satisfaction w/remote
work
Baseline = Passive Control (C) Intern-senior mgr. WC – low dose (T) 0.088 0.054 0.181* 0.019 (0.073) (0.087) (0.093) (0.102) Intern-senior mgr. WC – high dose (T) 0.182 0.202 0.291 0.413*** (0.132) (0.207) (0.193) (0.124) Intern-only WC (T) 0.044 -0.051 0.03 -0.026 (0.063) (0.082) (0.096) (0.088) Intern Group Project (C) 0.074 0.154** 0.093 -0.005 (0.072) (0.077) (0.101) (0.092) Asynchronous Q&A (C) -0.071 -0.186* -0.133 -0.171* (0.074) (0.102) (0.116) (0.098) Constant 6.334*** 6.229*** 5.972*** 6.173*** (0.039) (0.046) (0.055) (0.049) Division FE Y Y Y Y Division FE x WC treatment Y Y Y Y Observations 1,154 1,156 1,156 1,157 R-squared 0.044 0.037 0.046 0.056 Note. Models 5-8 exclude divisions 2, 3, and 6 due to insufficient sample size in the fully interacted models. Robust standard errors in parentheses; *** p < 0.01, ** p < 0.05, * p < 0.1.
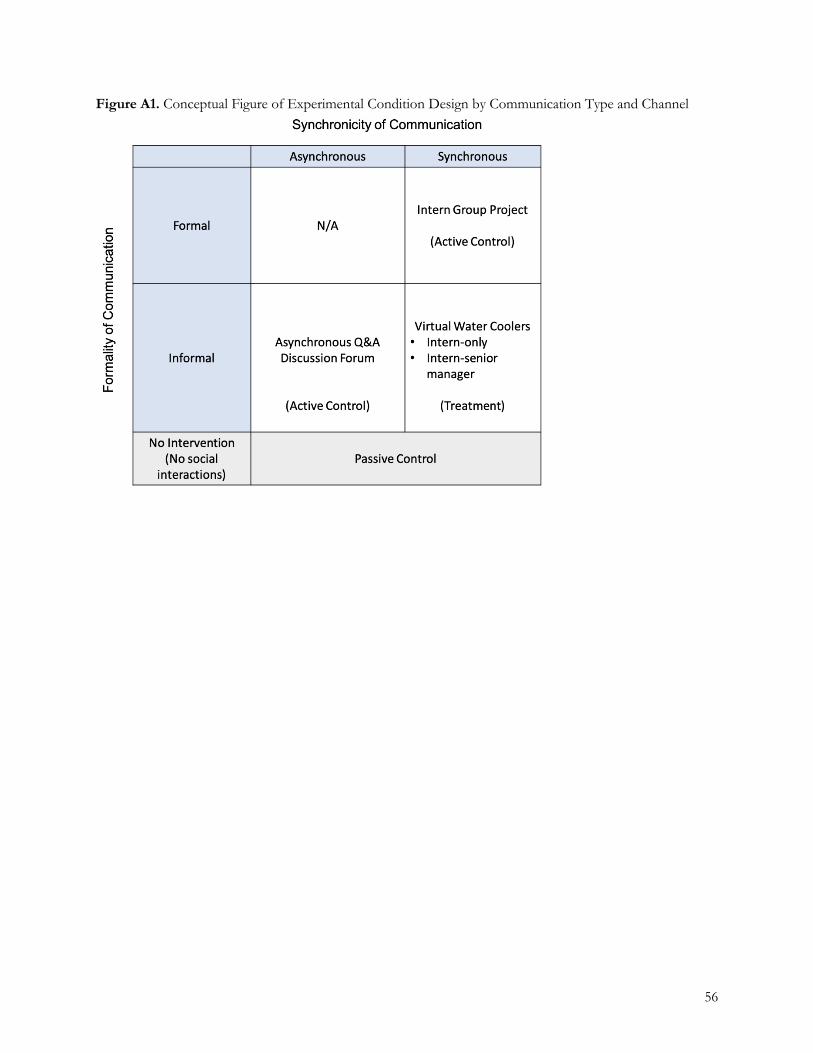
56
Figure A1. Conceptual Figure of Experimental Condition Design by Communication Type and Channel
57
4. Survey Instruments
Weekly Question for Asynchronous Q&A Discussion Forum (Week 1-4)
1. Every week we will ask you to pose a question that you would ideally like to be answered by someone from GS. The one question I would ideally like to be answered this week is:
Weekly Surveys on Attitudes Towards Socialization Opportunities (Weeks 1-5) (Adapted from
Golden 2007, Hackman and Oldham 1975, Raghuram et al. 2001)
Please indicate how strongly you agree with the following statements (1 = strongly disagree; 7 = strongly agree): 1. The social events in my virtual internship are adequate to build a sense of community. 2. I have friendly coworkers. 3. I wish I had more informal interactions with others. (R) 4. This week, I am satisfied with the socialization opportunities in this virtual internship. 5. Count of Professionals networked with. 6. Count of Interns networked with.
End of Program Attitudes Towards Remote Internship (Week 5) (Adapted from Golden et al. 2008)
Please indicate how strongly you agree with the following statements (1 = strongly disagree; 7 = strongly agree): 1. Overall, I am satisfied with remote work based on this internship experience. 2. I do not feel left out of activities and meetings that could enhance my career. 3. I have adequate opportunities to be mentored. 4. I can easily contact those who can help me when I need them.
End of Program Attitudes Towards Performance* (Week 5) (Adapted from Staples et al. 1999)
Please indicate how strongly you agree with the following statements (1 = strongly disagree; 7 = strongly agree):
1. I believe I am an effective intern. 2. Compared to other interns this year, I think I performed in the top 25%. 3. I am happy with the quality of my work output. 4. I work very efficiently. 5. I am a highly productive intern. 6. My manager believes I am an efficient intern.
End of Program Attitudes Towards Work Team* (Week 5) (Golden and Raghuram 2010)
Please indicate how strongly you agree with the following statements (1 = strongly disagree; 7 = strongly agree):
1. In my remote work team, we discuss work-related problems and solutions. 2. In my remote work team, we share work-related success and failure experiences. 3. I can get solutions to the problems from people who work from other locations. 4. I feel comfortable in seeking help from people on my team.
Frequency of Technology Use* (Week 5)
Please rate the usefulness of different technology you used throughout the internship (1 = extremely useless; 7 = extremely useful):
1. Outlook 2. Skype messenger 3. Jabber 4. Symphony 5. NovoEd 6. Zoom
End of Program Attitudes for Returning Interns Only (N = 90)* (Week 5)
Compared to your previous [Firm] internship experience, how would you rate your satisfaction with the following factors during
this year’s internship (1 = Much lower; 7 = Much higher):
1. Your productivity.
58
2. The work assigned to you. 3. Opportunities for collaboration. 4. Opportunities for exposure to senior leaders. 5. Your level of interaction with other interns. 6. Your level of interaction with members of your team. 7. Your level of interaction with Firm employees outside your team. 8. The overall internship experience.
* Included in end of internship program survey but not used in study.
59
5. References
Allen NJ, Meyer JP (1990) Organizational socialization tactics: A longitudinal analysis of links to newcomers’
commitment and role orientation. Acad. Manage. J. 33(4):847–858. Allen TJ (1977) Managing the flow of technology: Technology transfer and the dissemination of technological
information within the R&D organisation. Camb. MA Mass. Inst. Technol. Ashford SJ (1986) Feedback-seeking in individual adaptation: A resource perspective. Acad. Manage. J.
29(3):465–487. Ashford SJ, Blatt R, VandeWalle D (2003) Reflections on the looking glass: A review of research on
feedback-seeking behavior in organizations. J. Manag. 29(6):773–799. Baldiga NR, Coffman KB (2016) Laboratory evidence on the effects of sponsorship on the competitive
preferences of men and women. Manag. Sci. 64(2):888–901. Basow SA, Howe KG (1980) Role-model influence: Effects of sex and sex-role attitude in college students.
Psychol. Women Q. 4(4):558–572. Bettinger EP, Long BT (2005) Do faculty serve as role models? The impact of instructor gender on female
students. Am. Econ. Rev. 95(2):152–157. Bosma N, Hessels J, Schutjens V, Van Praag M, Verheul I (2012) Entrepreneurship and role models. J. Econ.
Psychol. 33(2):410–424. Brown SA, Dennis AR, Venkatesh V (2010) Predicting collaboration technology use: Integrating technology
adoption and collaboration research. J. Manag. Inf. Syst. 27(2):9–54. Carrell SE, Page ME, West JE (2010) Sex and science: How professor gender perpetuates the gender gap. Q.
J. Econ. 125(3):1101–1144. Castilla EJ, Rissing BA (2019) Best in class: The returns on application endorsements in higher education.
Adm. Sci. Q. 64(1):230–270. Comer DR (1991) Organizational newcomers’ acquisition of information from peers. Manag. Commun. Q.
5(1):64–89. Cooper CD, Kurland NB (2002) Telecommuting, professional isolation, and employee development in public
and private organizations. J. Organ. Behav. Int. J. Ind. Occup. Organ. Psychol. Behav. 23(4):511–532. Cox DR, Reid N (2000) The theory of the design of experiments (CRC Press). Del Carpio L, Guadalupe M (2018) More women in tech? Evidence from a field experiment addressing social
identity. Dennis AR, Fuller RM, Valacich JS (2008) Media, tasks, and communication processes: A theory of media
synchronicity. MIS Q.:575–600. Fayard AL, Weeks J (2007) Photocopiers and water-coolers: The affordances of informal interaction. Organ.
Stud. 28(5):605–634. Fernandez RM, Fernandez-Mateo I (2006) Networks, race, and hiring. Am. Sociol. Rev. 71(1):42–71. Fernandez RM, Weinberg N (1997) Sifting and sorting: Personal contacts and hiring in a retail bank. Am.
Sociol. Rev. 62:883–902. Filstad C (2004) How newcomers use role models in organizational socialization. J. Workplace Learn. Golden T (2007) Co-workers who telework and the impact on those in the office: Understanding the
implications of virtual work for co-worker satisfaction and turnover intentions. Hum. Relat. 60(11):1641–1667.
Golden TD, Raghuram S (2010) Teleworker knowledge sharing and the role of altered relational and technological interactions. J. Organ. Behav. 31(8):1061–1085.
Golden TD, Veiga JF, Dino RN (2008) The impact of professional isolation on teleworker job performance and turnover intentions: does time spent teleworking, interacting face-to-face, or having access to communication-enhancing technology matter? J. Appl. Psychol. 93(6):1412.
Hackman JR, Oldham GR (1975) Development of the job diagnostic survey. J. Appl. Psychol. 60(2):159. Ibarra H (1992) Homophily and differential returns: Sex differences in network structure and access in an
advertising firm. Adm. Sci. Q.:422–447. King AA, Goldfarb B, Simcoe T (2019) Learning from testimony on quantitative research in management.
Acad. Manage. Rev. (ja).
60
Kleinbaum AM, Stuart TE, Tushman ML (2013) Discretion within constraint: Homophily and structure in a formal organization. Organ. Sci. 24(5):1316–1336.
Lane JN, Ganguli I, Gaule P, Guinan E, Lakhani KR (2020) Engineering serendipity: When does knowledge sharing lead to knowledge production? Strateg. Manag. J.
Lin W (2013) Agnostic notes on regression adjustments to experimental data: Reexamining Freedman’s critique. Ann. Appl. Stat. 7(1):295–318.
London M, Smither JW (2002) Feedback orientation, feedback culture, and the longitudinal performance management process. Hum. Resour. Manag. Rev. 12(1):81–100.
Louis MR (1980) Career transitions: Varieties and commonalities. Acad. Manage. Rev. 5(3):329–340. Louis MR, Posner BZ, Powell GN (1983) The availability and helpfulness of socialization practices. Pers.
Psychol. 36(4):857–866. Marini MM, Olsen AR, Rubin DB (1980) Maximum-likelihood estimation in panel studies with missing data.
Sociol. Methodol. 11:314–357. Marx DM, Roman JS (2002) Female role models: Protecting women’s math test performance. Pers. Soc.
Psychol. Bull. 28(9):1183–1193. Mitchell W, Tsui AS (2012) Research in Emerging Economy Contexts: Selected Articles from MOR and three
SMS journals (GSJ, SEJ, and SMJ). Morrison EW (1993) Longitudinal study of the effects of information seeking on newcomer socialization. J.
Appl. Psychol. 78(2):173. Morrison EW (2002) Newcomers’ relationships: The role of social network ties during socialization. Acad.
Manage. J. 45(6):1149–1160. Ocasio W, Pozner JE, Milner D (2020) Varieties of political capital and power in organizations: A review and
integrative framework. Acad. Manag. Ann. 14(1):303–338. Ostroff C, Kozlowski SW (1992) Organizational socialization as a learning process: The role of information
acquisition. Pers. Psychol. 45(4):849–874. Ostroff C, Kozlowski SW (1993) The role of mentoring in the information gathering processes of newcomers
during early organizational socialization. J. Vocat. Behav. 42(2):170–183. Raghuram S, Garud R, Wiesenfeld B, Gupta V (2001) Factors contributing to virtual work adjustment. J.
Manag. 27(3):383–405. Rathnam S, Mahajan V, Whinston AB (1995) Facilitating coordination in customer support teams: A
framework and its implications for the design of information technology. Manag. Sci. 41(12):1900–1921.
Staples DS, Hulland JS, Higgins CA (1999) A self-efficacy theory explanation for the management of remote workers in virtual organizations. Organ. Sci. 10(6):758–776.
Sterling A, Merluzzi J (2021) A longer way in: Tryouts as alternative hiring arrangements in organizations. Res.
Organ. Behav.:100122. Sterling AD, Fernandez RM (2018) Once in the door: Gender, tryouts, and the initial salaries of managers.
Manag. Sci. 64(11):5444–5460. Tushman ML, Romanelli E (1983) Uncertainty, social location and influence in decision making: A
sociometric analysis. Manag. Sci. 29(1):12–23. Walton GM, Cohen GL (2011) A brief social-belonging intervention improves academic and health outcomes
of minority students. Science 331(6023):1447–1451.