Embed Size (px)
Citation preview
Visa Inc.Fiscal Fourth Quarter 2019Financial Results
October 24, 2019
Fiscal Fourth Quarter 2019 Financial Results2 ©2019 Visa. All rights reserved.
This presentation contains forward-looking statements within the meaning of the U.S. Private Securities Litigation Reform Act of 1995 that relate to, among other things, our future operations, prospects, developments, strategies, business growth and financial outlook for fiscal full-year 2020. Forward-looking statements generally are identified by words such as “believes,” “estimates,” “expects,” “intends,” “may,” “projects,” “outlook”, “could,” “should,” “will,” “continue” and other similar expressions. All statements other than statements of historical fact could be forward-looking statements, which speak only as of the date they are made, are not guarantees of future performance and are subject to certain risks, uncertainties and other factors, many of which are beyond our control and are difficult to predict.
Actual results could differ materially from those expressed in, or implied by, our forward-looking statements due to a variety of factors, including, but not limited to:
• increased oversight and regulation of the global payments industry and our business;
• impact of government-imposed restrictions on international payment systems;
• outcome of tax, litigation and governmental investigation matters;
• increasingly intense competition in the payments industry, including competition for our clients and merchants;
• proliferation and continuous evolution of new technologies and business models;
• our ability to maintain relationships with our clients, merchants and other third parties;
• brand or reputational damage;
• management changes;
• impact of global economic, political, market and social events or conditions;
• exposure to loss or illiquidity due to settlement guarantees;
• uncertainty surrounding the impact of the United Kingdom’s withdrawal from the European Union;
• a disruption, failure, breach or cyber-attack of our networks or systems;
• risks, uncertainties and the failure to achieve the anticipated benefits with respect to our acquisitions and other strategic investments; and
• other factors described in our filings with the U.S. Securities and Exchange Commission, including our Annual Report on Form 10-K for the
year ended September 30, 2018, and our subsequent reports on Forms 10-Q and 8-K.
Except as required by law, we do not intend to update or revise any forward-looking statements as a result of new information, future events or otherwise.
Forward-Looking Statements
Fiscal Fourth Quarter 2019 Financial Results3 ©2019 Visa. All rights reserved.
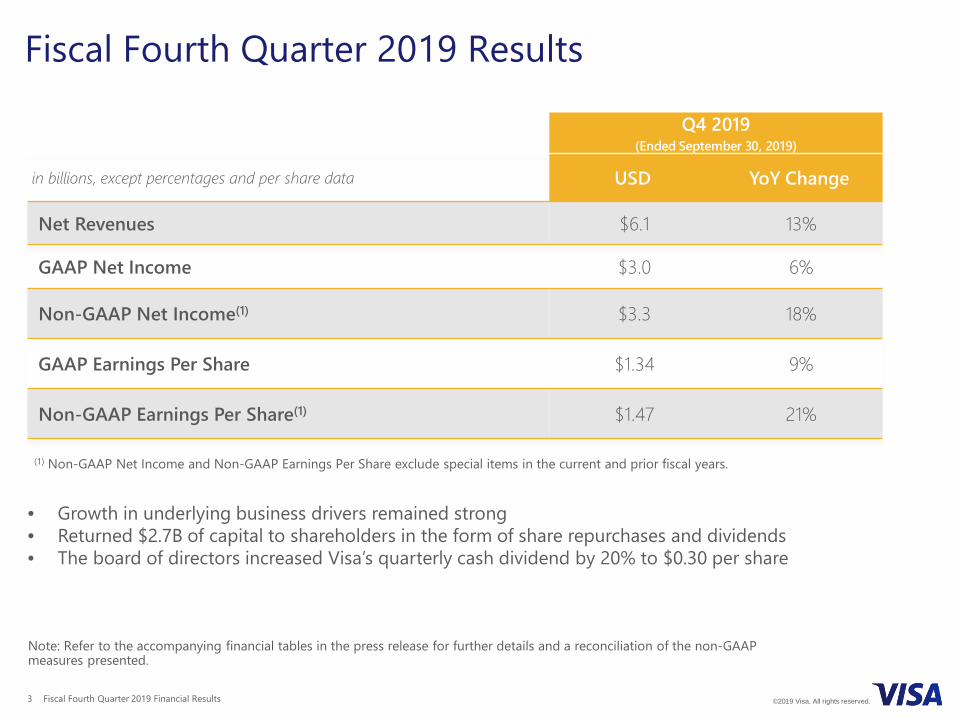
Fiscal Fourth Quarter 2019 Results
Q4 2019(Ended September 30, 2019)
in billions, except percentages and per share data USD YoY Change
Net Revenues $6.1 13%
GAAP Net Income $3.0 6%
Non-GAAP Net Income(1) $3.3 18%
GAAP Earnings Per Share $1.34 9%
Non-GAAP Earnings Per Share(1) $1.47 21%
Note: Refer to the accompanying financial tables in the press release for further details and a reconciliation of the non-GAAP measures presented.
• Growth in underlying business drivers remained strong• Returned $2.7B of capital to shareholders in the form of share repurchases and dividends• The board of directors increased Visa’s quarterly cash dividend by 20% to $0.30 per share
(1) Non-GAAP Net Income and Non-GAAP Earnings Per Share exclude special items in the current and prior fiscal years.
Fiscal Fourth Quarter 2019 Financial Results4 ©2019 Visa. All rights reserved.
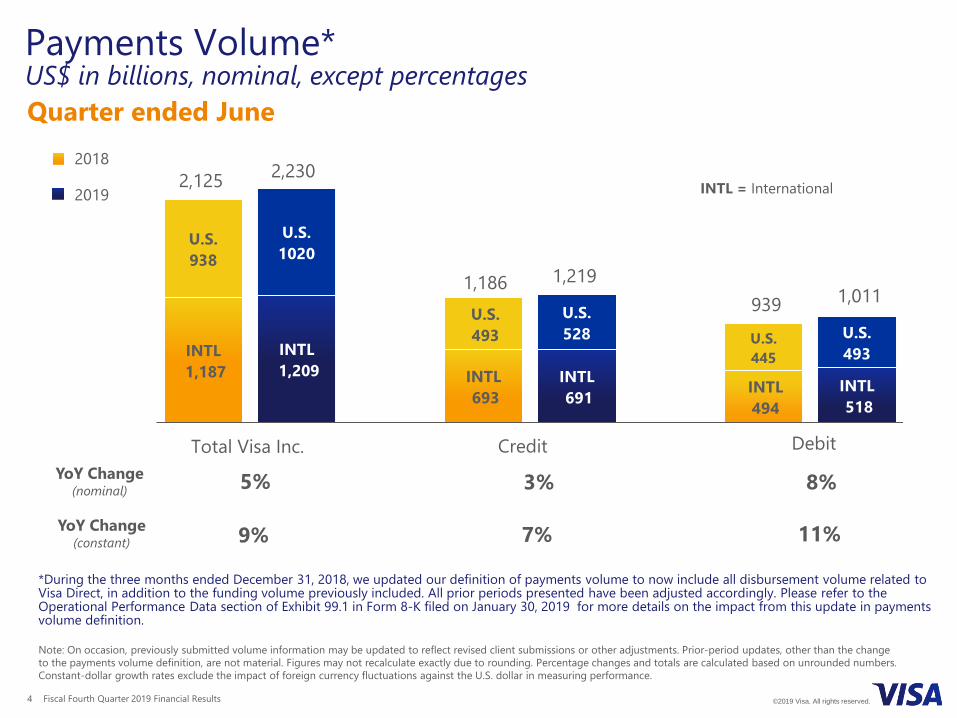
Quarter ended June
Payments Volume*US$ in billions, nominal, except percentages
INTL1,187
INTL1,209 INTL
693 INTL691 INTL
494 INTL518
U.S.938
U.S.1020
U.S.493
U.S.528 U.S.
445U.S.493
2,125 2,230
1,186 1,219 939 1,011
INTL = International
Total Visa Inc. Credit Debit
YoY Change(constant) 9% 7% 11%
YoY Change(nominal) 3% 8%5%
Note: On occasion, previously submitted volume information may be updated to reflect revised client submissions or other adjustments. Prior-period updates, other than the change to the payments volume definition, are not material. Figures may not recalculate exactly due to rounding. Percentage changes and totals are calculated based on unrounded numbers. Constant-dollar growth rates exclude the impact of foreign currency fluctuations against the U.S. dollar in measuring performance.
2018
2019
*During the three months ended December 31, 2018, we updated our definition of payments volume to now include all disbursement volume related to Visa Direct, in addition to the funding volume previously included. All prior periods presented have been adjusted accordingly. Please refer to the Operational Performance Data section of Exhibit 99.1 in Form 8-K filed on January 30, 2019 for more details on the impact from this update in payments volume definition.
Fiscal Fourth Quarter 2019 Financial Results5 ©2019 Visa. All rights reserved.
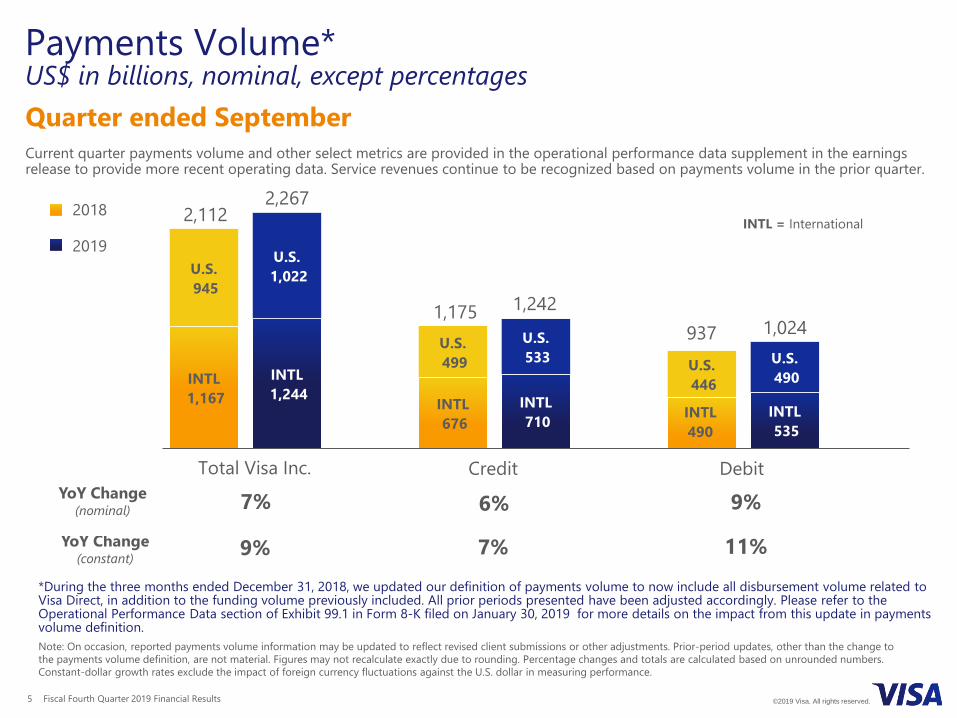
Quarter ended September Current quarter payments volume and other select metrics are provided in the operational performance data supplement in the earnings release to provide more recent operating data. Service revenues continue to be recognized based on payments volume in the prior quarter.
Payments Volume*US$ in billions, nominal, except percentages
YoY Change(constant) 9% 7% 11%
YoY Change(nominal) 6% 9%7%
Note: On occasion, reported payments volume information may be updated to reflect revised client submissions or other adjustments. Prior-period updates, other than the change to the payments volume definition, are not material. Figures may not recalculate exactly due to rounding. Percentage changes and totals are calculated based on unrounded numbers. Constant-dollar growth rates exclude the impact of foreign currency fluctuations against the U.S. dollar in measuring performance.
INTL 09
U.S.575
U.S.631
U.S.277
U.S.313
INTL1,167
INTL1,244 INTL
676 INTL710 INTL
490 INTL535
U.S.945
U.S.1,022
U.S.499
U.S.533 U.S.
446
U.S.490
2,112 2,267
1,175 1,242 937 1,024
INTL = International
Total Visa Inc. Credit Debit
2018
2019
*During the three months ended December 31, 2018, we updated our definition of payments volume to now include all disbursement volume related to Visa Direct, in addition to the funding volume previously included. All prior periods presented have been adjusted accordingly. Please refer to the Operational Performance Data section of Exhibit 99.1 in Form 8-K filed on January 30, 2019 for more details on the impact from this update in payments volume definition.
Fiscal Fourth Quarter 2019 Financial Results6 ©2019 Visa. All rights reserved.
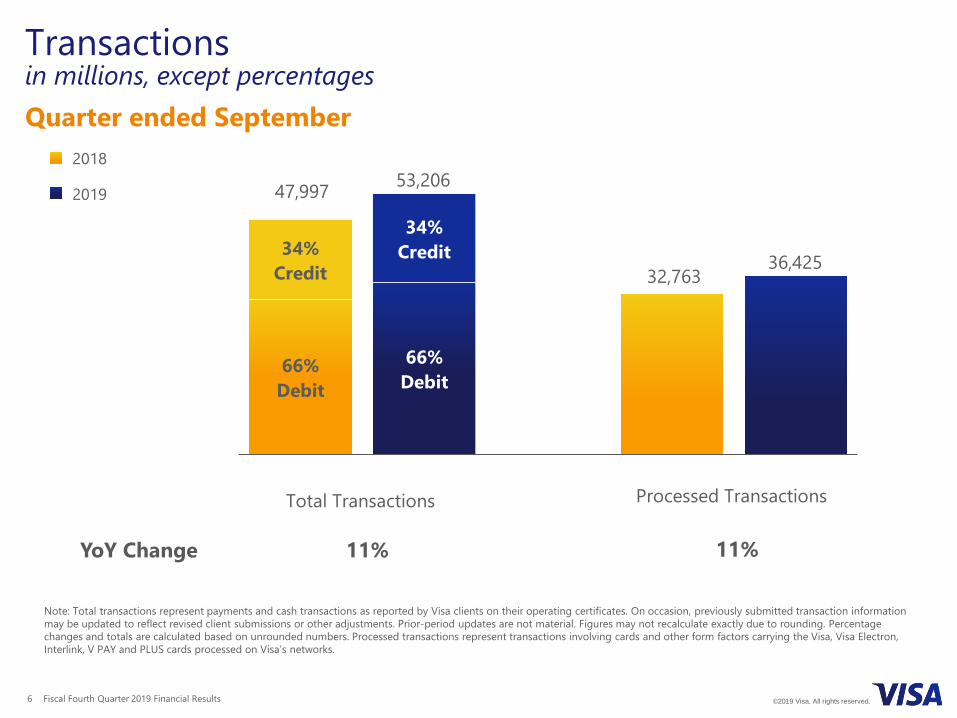
Quarter ended September
Transactionsin millions, except percentages
Note: Total transactions represent payments and cash transactions as reported by Visa clients on their operating certificates. On occasion, previously submitted transaction information may be updated to reflect revised client submissions or other adjustments. Prior-period updates are not material. Figures may not recalculate exactly due to rounding. Percentage changes and totals are calculated based on unrounded numbers. Processed transactions represent transactions involving cards and other form factors carrying the Visa, Visa Electron, Interlink, V PAY and PLUS cards processed on Visa’s networks.
Credit38%
YoY Change 11% 11%
Debit62%
Credit38%
66%Debit
66%Debit
34%Credit
34%Credit
47,997 53,206
32,763 36,425
Processed TransactionsTotal Transactions
2018
2019
Fiscal Fourth Quarter 2019 Financial Results7 ©2019 Visa. All rights reserved.
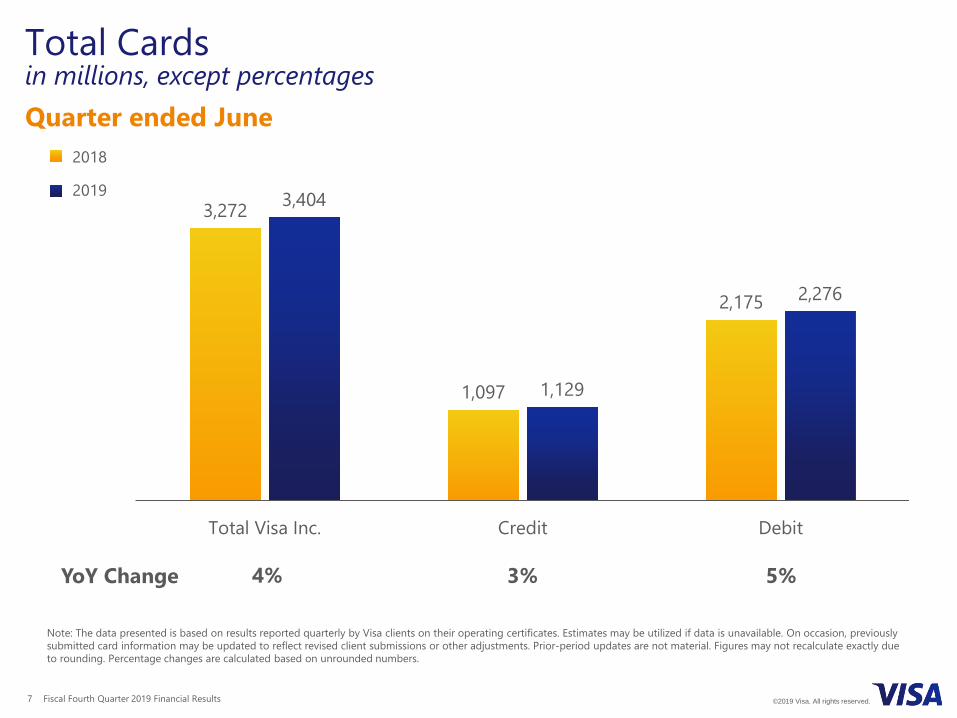
Quarter ended June
Total Cardsin millions, except percentages
3,272
1,097
2,175
3,404
1,129
2,276
Total Visa Inc. Credit Debit
Note: The data presented is based on results reported quarterly by Visa clients on their operating certificates. Estimates may be utilized if data is unavailable. On occasion, previously submitted card information may be updated to reflect revised client submissions or other adjustments. Prior-period updates are not material. Figures may not recalculate exactly due to rounding. Percentage changes are calculated based on unrounded numbers.
YoY Change 3% 5%4%
2018
2019
Fiscal Fourth Quarter 2019 Financial Results8 ©2019 Visa. All rights reserved.
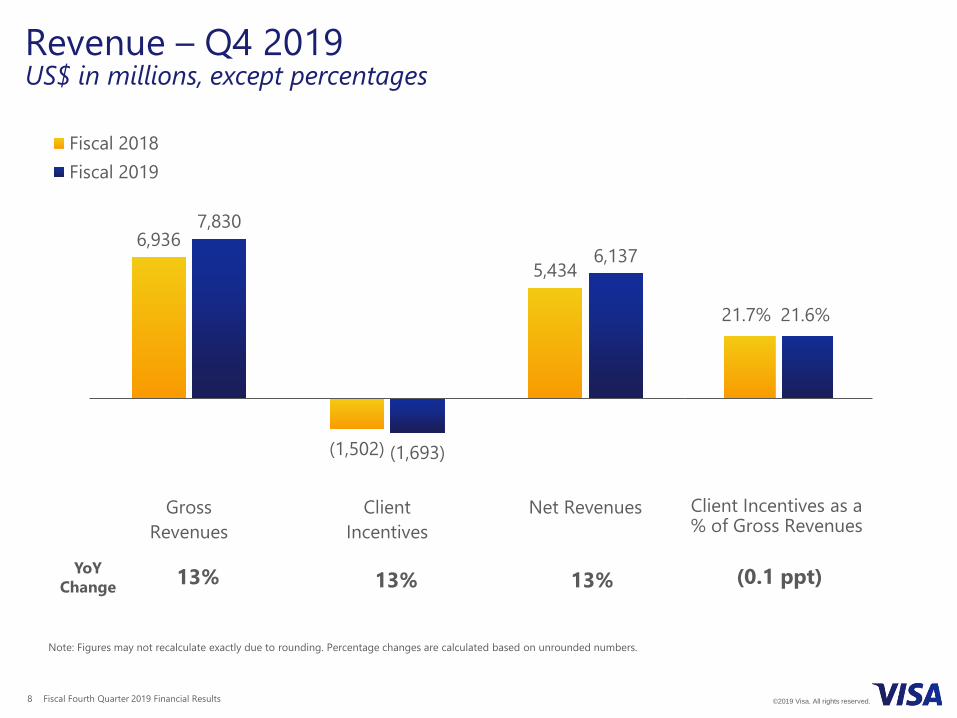
6,936
(1,502)
5,434
7,830
(1,693)
6,137
GrossRevenues
ClientIncentives
Net Revenues
Fiscal 2018Fiscal 2019
Revenue – Q4 2019US$ in millions, except percentages
YoY Change 13% 13%13%
Note: Figures may not recalculate exactly due to rounding. Percentage changes are calculated based on unrounded numbers.
21.7% 21.6%
Client Incentives as a % of Gross Revenues
(0.1 ppt)
Fiscal Fourth Quarter 2019 Financial Results9 ©2019 Visa. All rights reserved.
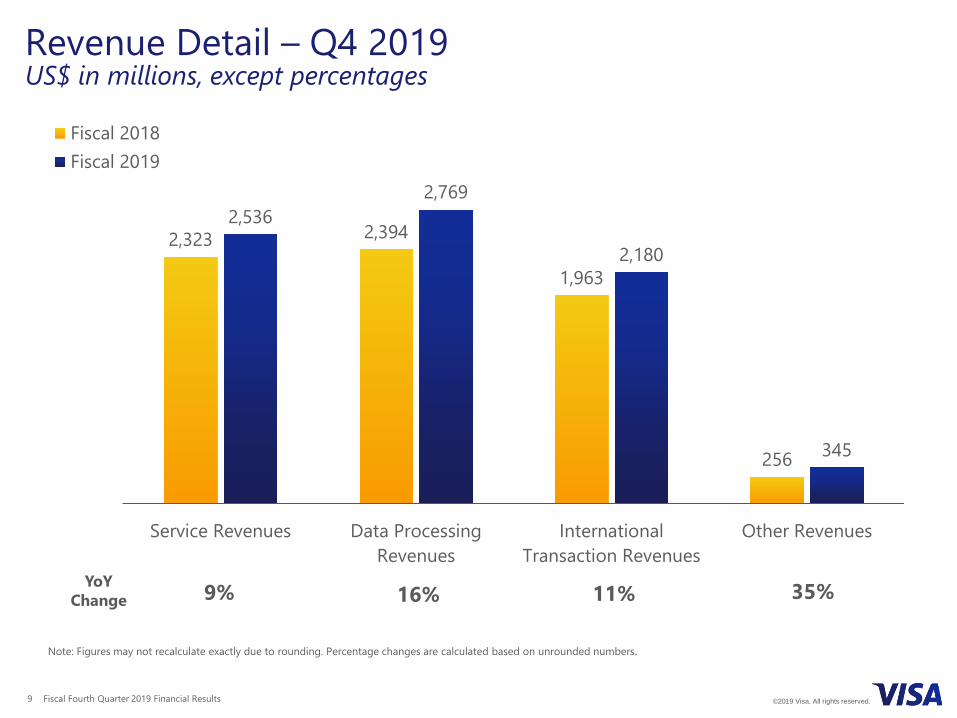
Revenue Detail – Q4 2019US$ in millions, except percentages
2,323 2,394
1,963
256
2,536 2,769
2,180
345
Service Revenues Data ProcessingRevenues
InternationalTransaction Revenues
Other Revenues
Fiscal 2018Fiscal 2019
YoYChange 16% 11%9% 35%
Note: Figures may not recalculate exactly due to rounding. Percentage changes are calculated based on unrounded numbers.
Fiscal Fourth Quarter 2019 Financial Results10 ©2019 Visa. All rights reserved.
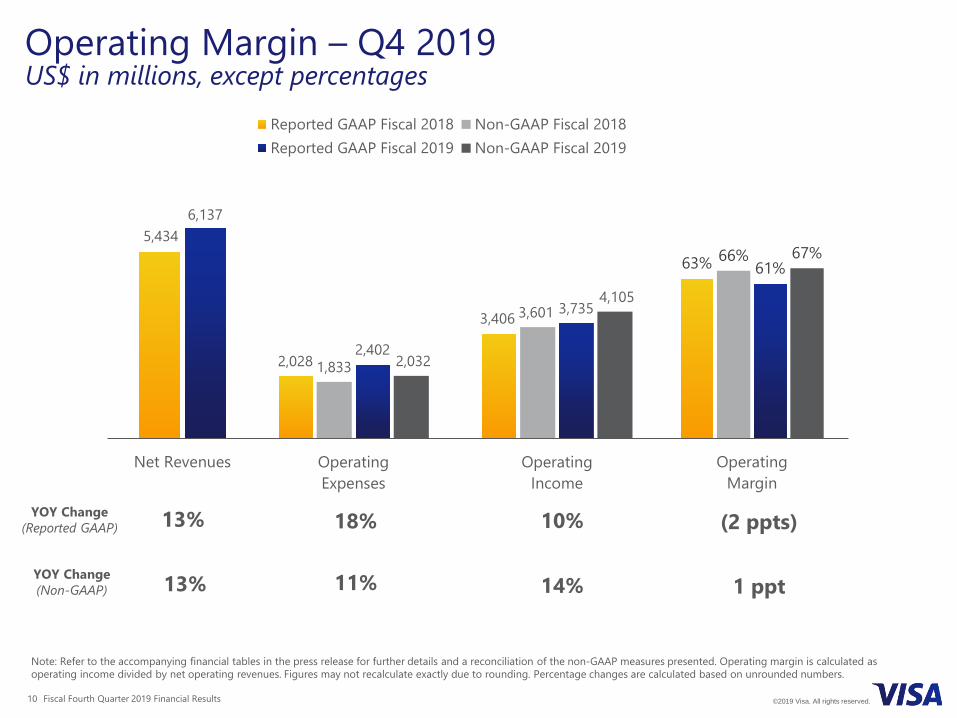
Operating Margin – Q4 2019US$ in millions, except percentages
Note: Refer to the accompanying financial tables in the press release for further details and a reconciliation of the non-GAAP measures presented. Operating margin is calculated as operating income divided by net operating revenues. Figures may not recalculate exactly due to rounding. Percentage changes are calculated based on unrounded numbers.
13% 10%18% (2 ppts)YOY Change(Reported GAAP)
5,434 6,137
Net Revenues
63% 66%61%
67%
OperatingMargin
13% 14%11% 1 pptYOY Change(Non-GAAP)
2,028
3,406
1,833
3,601
2,402
3,735
2,032
4,105
OperatingExpenses
OperatingIncome
Reported GAAP Fiscal 2018 Non-GAAP Fiscal 2018Reported GAAP Fiscal 2019 Non-GAAP Fiscal 2019
Fiscal Fourth Quarter 2019 Financial Results11 ©2019 Visa. All rights reserved.
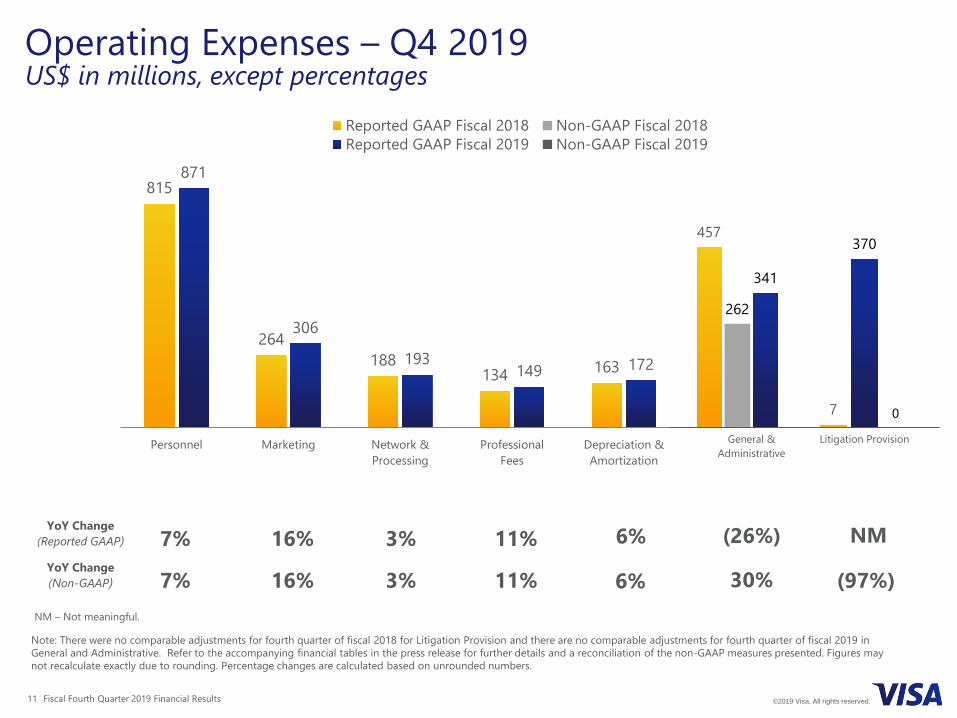
Operating Expenses – Q4 2019US$ in millions, except percentages
815
264 188
134 163
871
306
193 149 172
Personnel Marketing Network &Processing
ProfessionalFees
Depreciation &Amortization
NM
Note: There were no comparable adjustments for fourth quarter of fiscal 2018 for Litigation Provision and there are no comparable adjustments for fourth quarter of fiscal 2019 in General and Administrative. Refer to the accompanying financial tables in the press release for further details and a reconciliation of the non-GAAP measures presented. Figures may not recalculate exactly due to rounding. Percentage changes are calculated based on unrounded numbers.
YoY Change(Reported GAAP) 3% 11%7% (26%)6%16%
7
370
0
Litigation Provision
457
262
341
General &Administrative
Reported GAAP Fiscal 2018 Non-GAAP Fiscal 2018Reported GAAP Fiscal 2019 Non-GAAP Fiscal 2019
YoY Change(Non-GAAP) 3% 11%7% 30%6%16% (97%)
NM – Not meaningful.
Fiscal Fourth Quarter 2019 Financial Results12 ©2019 Visa. All rights reserved.
Other Financial Results and Highlights
• Cash, cash equivalents and investment securities of $14.2 billion as of September 30, 2019
• Adjusted free cash flow of $3.8 billion for the fiscal fourth quarter• Capital expenditures of $249 million during the fiscal fourth quarter• During the three months ended September 30, 2019, Visa reached full ownership
of Earthport, a provider of cross-border payment services to banks, money transfer service providers and businesses. Visa also completed the acquisitions of Payworks, a provider of next-generation payment gateway software for the point-of-sale, and Verifi, a leader in technology solutions that reduce chargebacks.
• In September 2019, Visa recorded a $370 million accrual in connection with the MDL 1720, depositing an additional $300 million into its litigation escrow and taking into account $70 million in available funds resulting primarily from accrued interest.
• On October 22, 2019, Visa announced it completed the acquisition of the token services and ticketing business of Rambus.
See appendix for reconciliation of adjusted free cash flow to the closest comparable U.S. GAAP financial measure.
Fiscal Fourth Quarter 2019 Financial Results13 ©2019 Visa. All rights reserved.
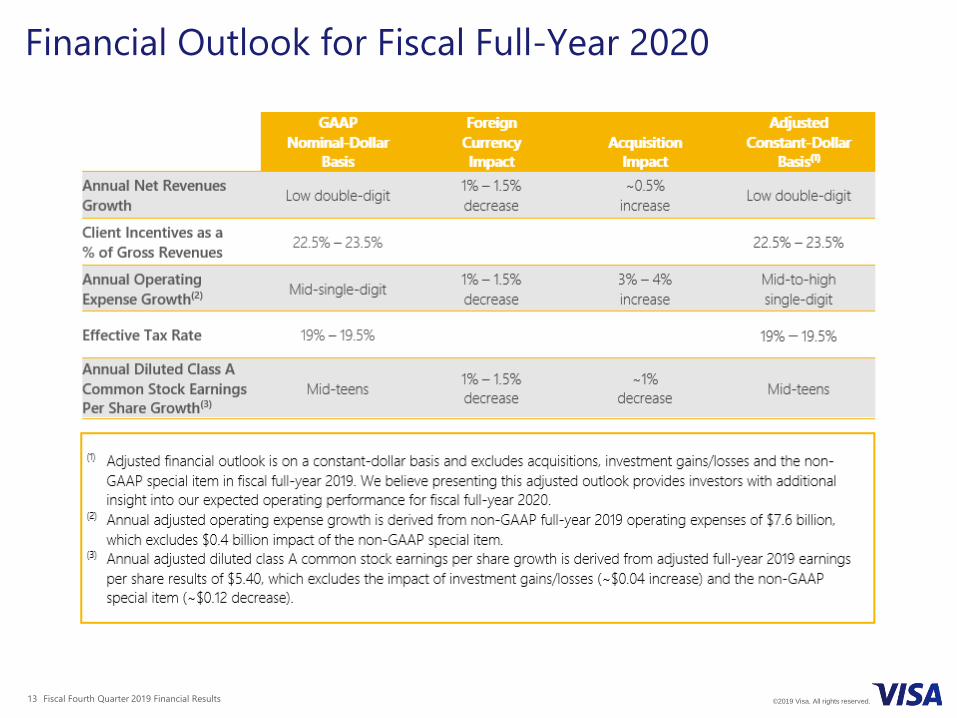
Financial Outlook for Fiscal Full-Year 2020

Appendix
Fiscal Fourth Quarter 2019 Financial Results15 ©2019 Visa. All rights reserved.
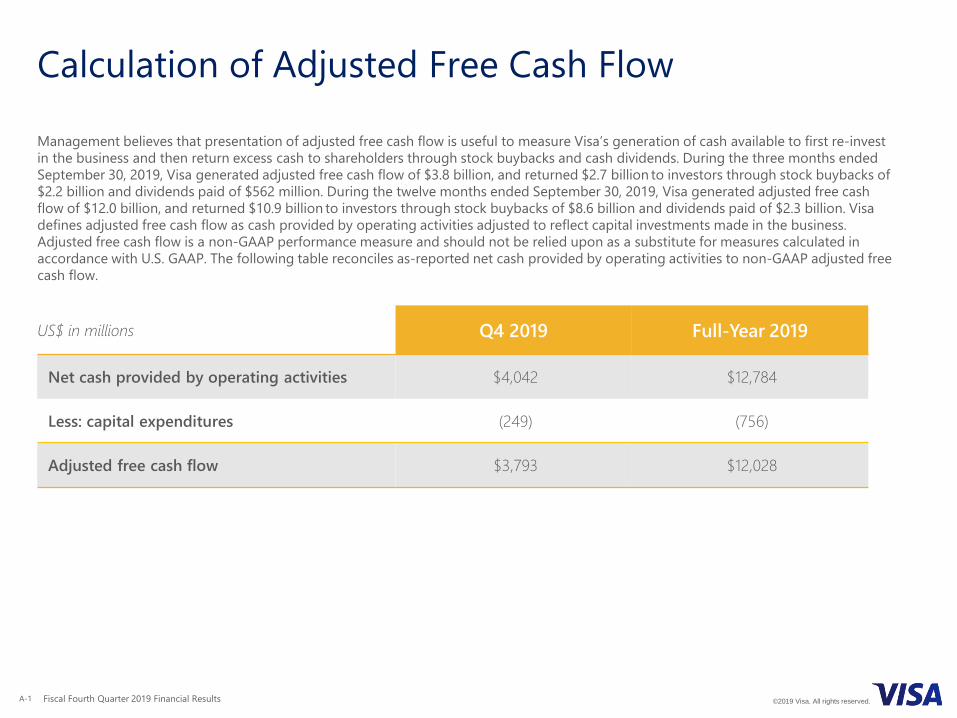
Calculation of Adjusted Free Cash Flow
A-1
Management believes that presentation of adjusted free cash flow is useful to measure Visa’s generation of cash available to first re-invest in the business and then return excess cash to shareholders through stock buybacks and cash dividends. During the three months ended September 30, 2019, Visa generated adjusted free cash flow of $3.8 billion, and returned $2.7 billion to investors through stock buybacks of $2.2 billion and dividends paid of $562 million. During the twelve months ended September 30, 2019, Visa generated adjusted free cash flow of $12.0 billion, and returned $10.9 billion to investors through stock buybacks of $8.6 billion and dividends paid of $2.3 billion. Visa defines adjusted free cash flow as cash provided by operating activities adjusted to reflect capital investments made in the business. Adjusted free cash flow is a non-GAAP performance measure and should not be relied upon as a substitute for measures calculated in accordance with U.S. GAAP. The following table reconciles as-reported net cash provided by operating activities to non-GAAP adjusted free cash flow.
US$ in millions Q4 2019 Full-Year 2019
Net cash provided by operating activities $4,042 $12,784
Less: capital expenditures (249) (756)
Adjusted free cash flow $3,793 $12,028