Embed Size (px)
Citation preview
PetrocontrolAdvanced Control & Optimization
34 East 30th Street, New York, NY 10016 • Tel: 212-481-6195 • Fax: 212-447-8756 • [email protected]
VISBREAKER MONITORING FOR MAXIMUM CONVERSION
Z. Friedman, PetrocontrolW. A. Kuijl, RUHR-OL
K. Wolfsgruber, Maraven S.A.
Paper presented at the PDVSA Deep Conversion workshop, June 1993, CorpusChristi.
Visbreaker monitoring page 1
VISBREAKER MONITORING FOR MAXIMUM CONVERSION
Refineries with many crude switches require frequent readjustment of plant processingparameters to bring the units back to high performance. This paper will show a methodfor improving the visbreaker operation by means of a conversion model. With the helpof this model, the unit can be brought to near optimal condition immediately followingthe feedstock switch.
The Operator’s Dilemma
Well-trained operators try to push the visbreaker conversion to the target fuel oil stabilityconstraint. However, no such number representing the “maximum conversion” isavailable to them. Upon feedstock switch or throughput change, the visbreakeroperator is forced to start conservatively and then move slowly towards the target fueloil stability constraint. Each time he makes a move, he has to wait for the unit to reachsteady state, and then call for a fuel oil stability test. Based on the test result he wouldmake a severity adjustment, waits again for steady state and takes another sample.This way of creeping towards maximum conversion can take a day or even more whenthe feed switches are accompanied by throughput changes.
While the major problem facing the operator is lack of information about how to set thetarget severity, there is the additional problem of how to measure the actual conversionand compare it against the target.
We arbitrarily define conversion as the yield of material boiling below 165°C. Thisdefinition roughly equates conversion to the observed yield of naphtha and offgas whenmaintaining a naphtha cutpoint of about 165°C. However, a different naphtha cutpointor changes in LPG absorption rates in naphtha renders a direct measurement ofconversion imprecise, and it may lead to an erroneous conclusion.
Proposed Solution
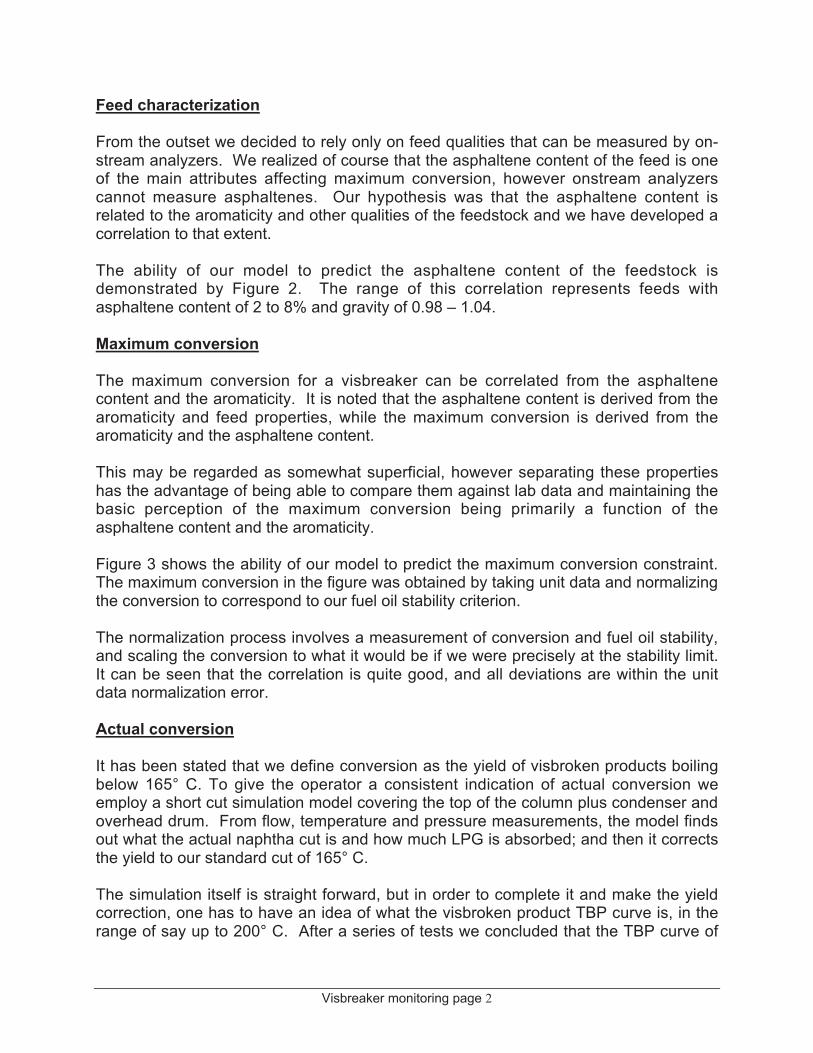
The authors have developed an operating tool containing three parts as shown in Figure1.
(a) A correlation between measurable feedstock qualities and maximum conversion willbe displayed to the operator continuously.
(b) A short cut simulation for correcting the measured yield of naphtha and off-gas to165° C -minus conversion. The operator will then be able to compare the desiredversus actual conversion and make a decision as to whether to increase or decreasethe visbreaking severity.
(c) A control program for holding the conversion constant at its target in the face ofchanging reaction conditions or throughput.
Visbreaker monitoring page 2
Feed characterization
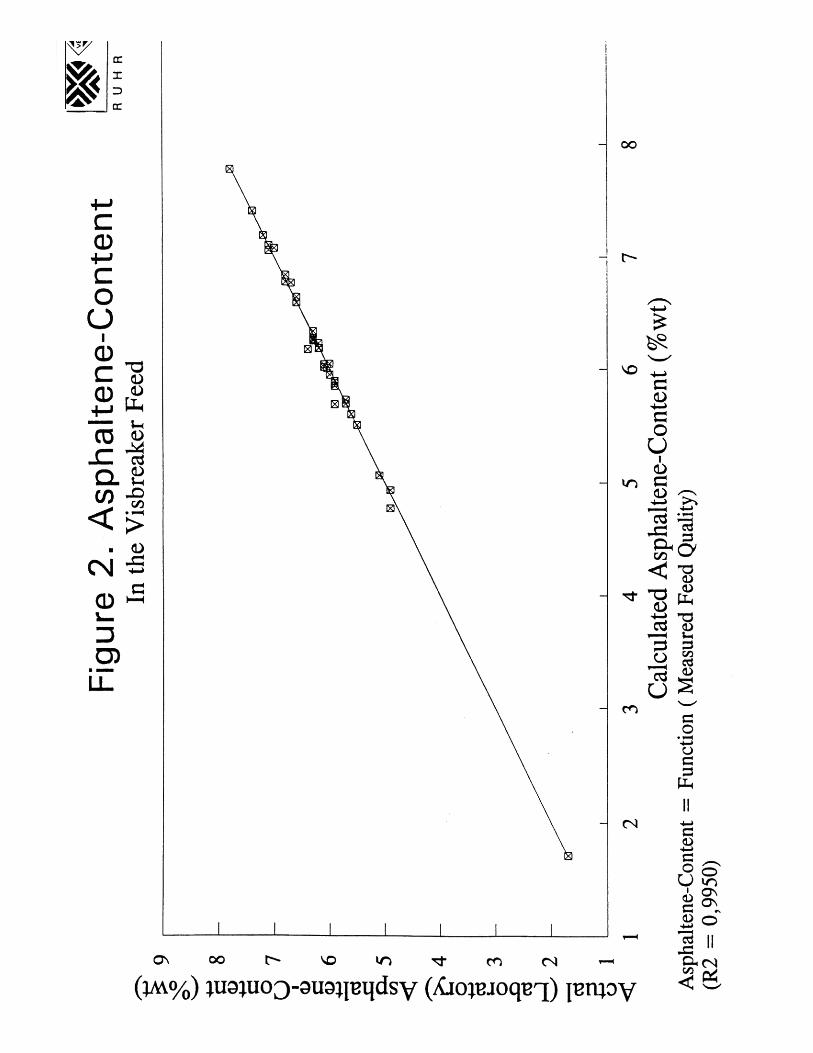
From the outset we decided to rely only on feed qualities that can be measured by on-stream analyzers. We realized of course that the asphaltene content of the feed is oneof the main attributes affecting maximum conversion, however onstream analyzerscannot measure asphaltenes. Our hypothesis was that the asphaltene content isrelated to the aromaticity and other qualities of the feedstock and we have developed acorrelation to that extent.
The ability of our model to predict the asphaltene content of the feedstock isdemonstrated by Figure 2. The range of this correlation represents feeds withasphaltene content of 2 to 8% and gravity of 0.98 – 1.04.
Maximum conversion
The maximum conversion for a visbreaker can be correlated from the asphaltenecontent and the aromaticity. It is noted that the asphaltene content is derived from thearomaticity and feed properties, while the maximum conversion is derived from thearomaticity and the asphaltene content.
This may be regarded as somewhat superficial, however separating these propertieshas the advantage of being able to compare them against lab data and maintaining thebasic perception of the maximum conversion being primarily a function of theasphaltene content and the aromaticity.
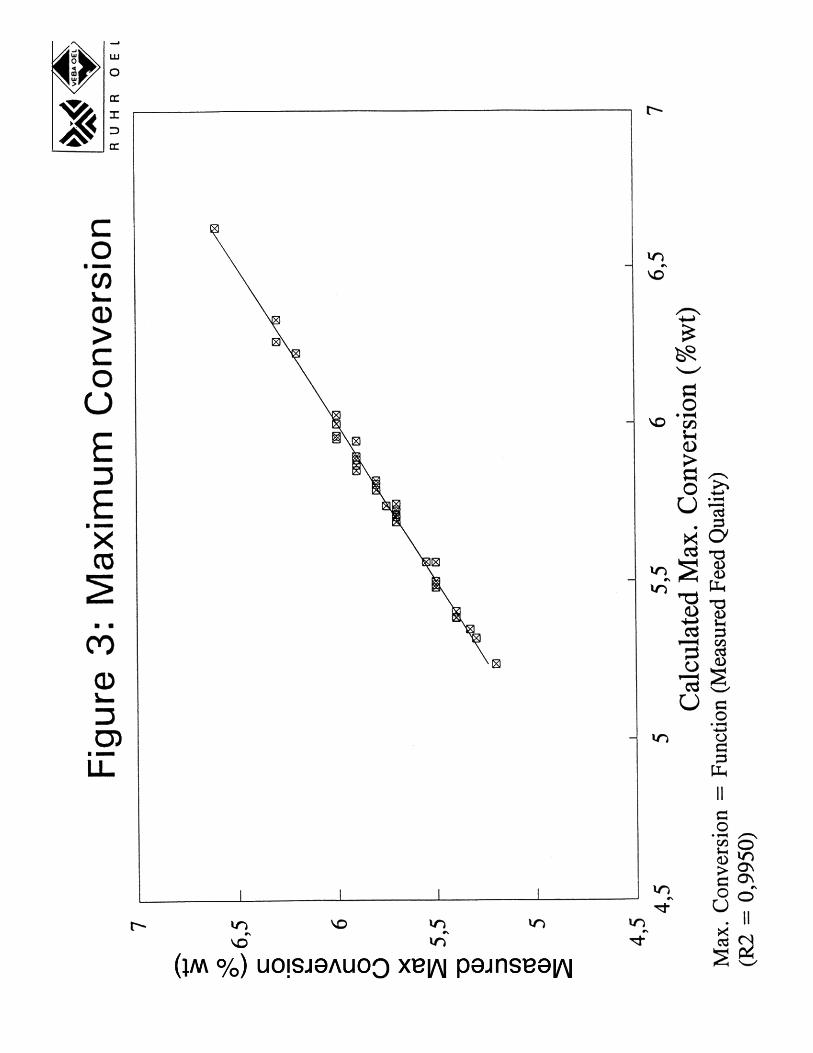
Figure 3 shows the ability of our model to predict the maximum conversion constraint.The maximum conversion in the figure was obtained by taking unit data and normalizingthe conversion to correspond to our fuel oil stability criterion.
The normalization process involves a measurement of conversion and fuel oil stability,and scaling the conversion to what it would be if we were precisely at the stability limit.It can be seen that the correlation is quite good, and all deviations are within the unitdata normalization error.
Actual conversion
It has been stated that we define conversion as the yield of visbroken products boilingbelow 165° C. To give the operator a consistent indication of actual conversion weemploy a short cut simulation model covering the top of the column plus condenser andoverhead drum. From flow, temperature and pressure measurements, the model findsout what the actual naphtha cut is and how much LPG is absorbed; and then it correctsthe yield to our standard cut of 165° C.
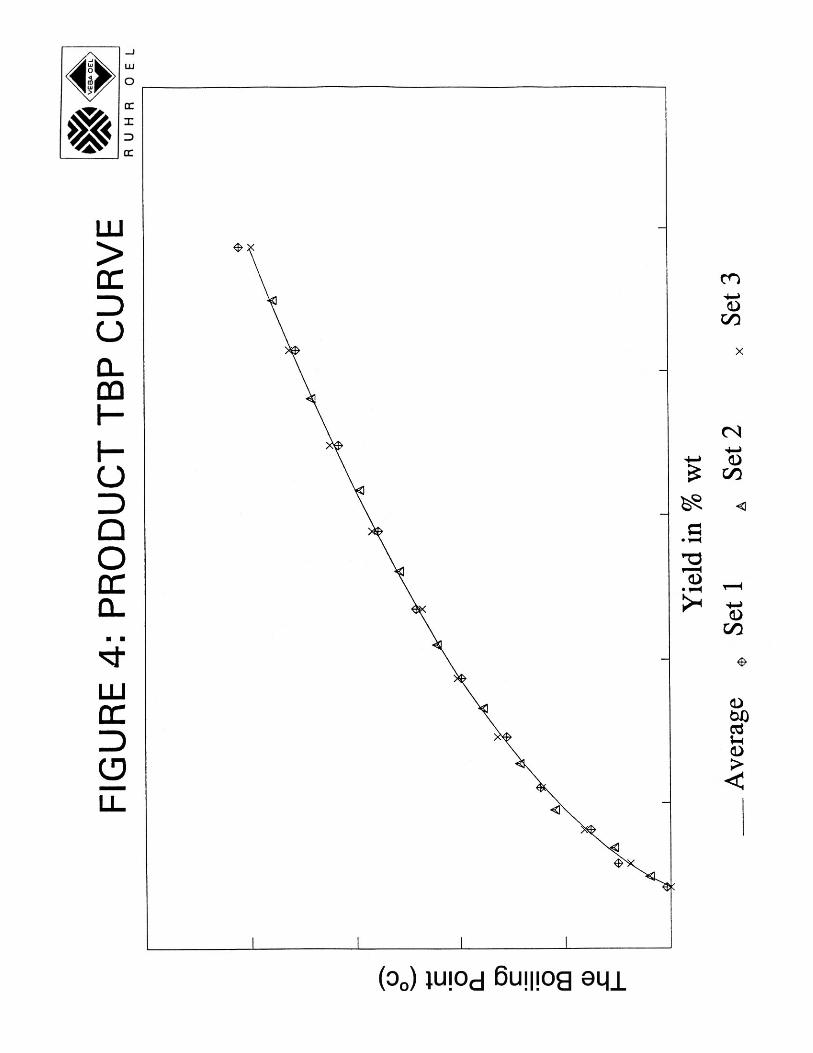
The simulation itself is straight forward, but in order to complete it and make the yieldcorrection, one has to have an idea of what the visbroken product TBP curve is, in therange of say up to 200° C. After a series of tests we concluded that the TBP curve of

Visbreaker monitoring page 3
visbroken light material is neither a function of feedstock nor of severity. The shape ofthe TBP curve consistently turned out as per figure 4.
This was a very interesting and helpful conclusion. It permitted us to easily determinepseudo components and improve the simulation precision.
Furnace outlet temperature
Although the above procedures, implemented as an off-line control scheme, wouldsuffice for the purpose of severity control, it is helpful to also guide the operator insetting the furnace outlet temperature to achieve the maximum conversion. This isparticularly needed when dealing with simultaneous visbreaker feed rate and qualitychanges.
The reaction section simulation program incorporates the following features:
• The conversion reaction is assumed to have a first order kinetics, with the reactionrate constant being a function of feed properties.
• An evaporation model calculating the vapor liquid ratio as a function of temperature,pressure and conversion. This information is needed for integrating thetemperature/residence time dependent conversion rate.
Test Results and Conclusion
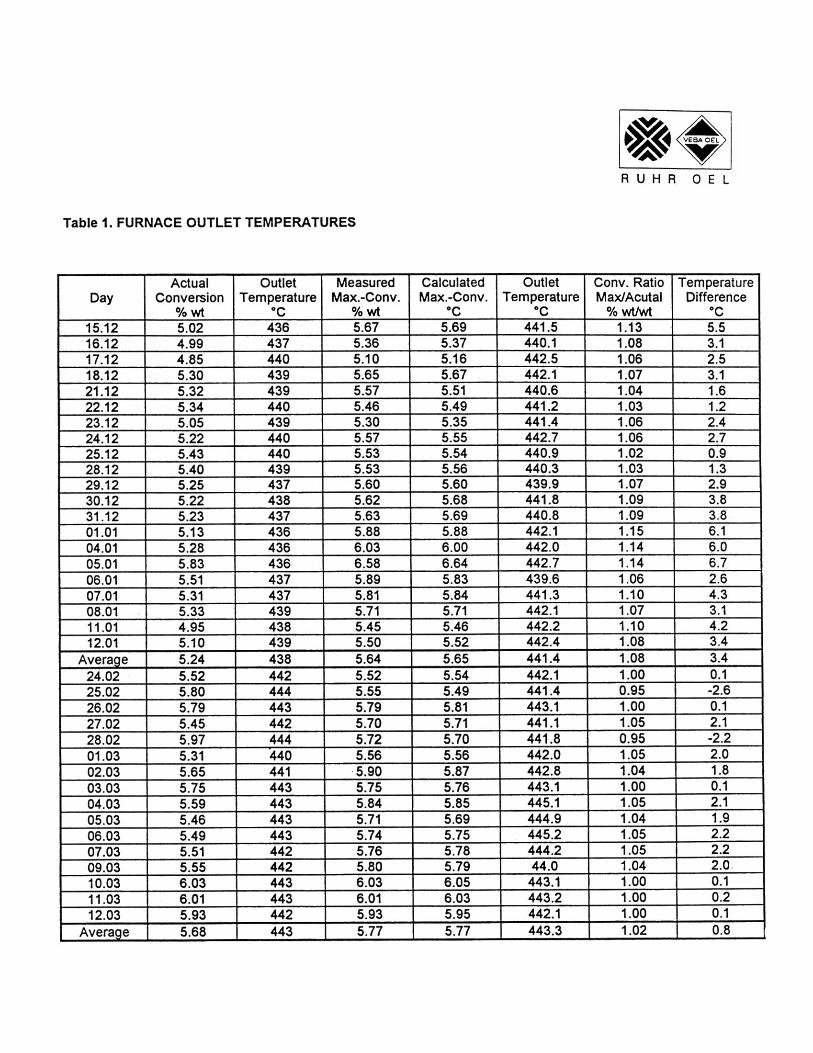
The ability of our reaction simulation to advise a reasonable coil outlet-temperature isdemonstrated in Table 1. This table shows, through a period of three months, theactual versus maximum desired conversion, and the actual versus suggested coil outlettemperature. It can be seen that when the conversion is below maximum, the programconsistently suggests a temperature that is higher than the current measurement.There were two events of overcracking, on the 25th and 28th of February; and in bothcases the program suggested a decrease in the temperature.
Our approach for the prediction of maximum conversion versus actual conversion, andadvising the operator on how to move the severity has proven feasible and we plan tonext implement it in open loop as an operator guidance tool.


![The aromaticity of dicupra[10]annulenes](https://img.pdfslide.net/doc/110x75/621446873bef455f0e352980/the-aromaticity-of-dicupra10annulenes.jpg)