Embed Size (px)
Citation preview

Research ArticleVisible Light-Driven Gas-Phase Artificial PhotosynthesisReactions over Ruthenium Metal Nanoparticles Modified withAnatase TiO2
Eduardo Morais ,1 Colin O’Modhrain,1 K. Ravindranathan Thampi ,2
and James A. Sullivan 1
1UCD School of Chemistry, University College Dublin, Belfield, Dublin 4, Ireland2UCD School of Chemical and Bioprocess Engineering, University College Dublin, Belfield Dublin 4, Ireland
Correspondence should be addressed to K. Ravindranathan Thampi; [email protected] James A. Sullivan; [email protected]
Received 31 January 2019; Accepted 5 March 2019; Published 30 April 2019
Guest Editor: Wei Wei
Copyright © 2019 EduardoMorais et al. This is an open access article distributed under the Creative Commons Attribution License,which permits unrestricted use, distribution, and reproduction in any medium, provided the original work is properly cited.
Ruthenium metal nanoparticles with a narrow size distribution have been synthesised via a solvothermal method. The solids werecharacterised using a range of analytical techniques (XRD, TEM, TPD, and XPS) and tested in the CO2+H2O reaction undersimulated solar radiation, showing photocatalytic activity towards the production of CH4 and CO. The photocatalysis waspromoted through a plasmonic excitation of the Ru. The addition of Ti to the preparation resulted in the formation of anataseTiO2. Notwithstanding the fact that the energy of the light used during the photocatalysis was insufficient to excite TiO2, itspresence affects the catalysts’ optical and chemical properties and the product (CH4/CO) ratios, favouring the evolution of COover that of CH4 (suggesting exciton transfer to TiO2 from plasmonically excited Ru).
1. Introduction
Increasing concentrations of atmospheric CO2 have drawnconsiderable attention in the scientific sphere drivingresearchers to seek strategies to reduce current levels and cur-tail overall emissions [1, 2]. CO2 utilisation is a desirablestrategy as it can potentially lead to decreased levels of atmo-spheric CO2 and the generation of products that aid energyand rawmaterial demand. Thus, with an appropriate process,from an undesired waste, CO2 becomes a valuable and cheapfeedstock [3, 4].
Reduction of CO2 using H2O involves the breaking ofstrong C=O and O-H bonds and thus requires energyinput [5, 6]. The photoconversion of CO2 is performedby nature through photosynthesis [7]. Artificial photosyn-thesis (AP) involves the reduction of CO2 using H2O andsolar energy in a nonbiological system. However, C=Oand O–H bonds are optically inert in the range of near-UV and visible light (200–900nm) making the use of a
photocatalyst a requirement [1, 7, 8]. The photochemicalreduction of CO2 is a multiple electron transfer processleading to the formation of many different products rang-ing between CO and CH4 and including all semireducedC1 and C2 species [8, 9]. Following over 40 years ofresearch on this reaction, the scientific community is stilla long way from producing efficient and viable devices forpromoting artificial photosynthesis and there are manyunresolved questions surrounding the reaction mechanismsand other parametric effects [9, 10].
Nanocrystals of noble metals have been used in variousapplications including electronics, optics, magnetics, andcatalysis and exhibit unique electronic, photonic, and cata-lytic properties compared to their bulk counterparts [11].Ruthenium (Ru) is a widely used catalyst for the promotionof active and selective CO2 and organic reactions [12, 13].Despite being an important element in catalysis, the appli-cation of Ru nanoparticles in the AP reaction, to our knowl-edge, has not been reported. This study describes a facile
HindawiInternational Journal of PhotoenergyVolume 2019, Article ID 3651603, 10 pageshttps://doi.org/10.1155/2019/3651603
solvatothermal approach to fabricate nanoparticles of ruthe-nium (in the presence and absence of TiO2) from an etha-nol solvent.
Three catalysts were prepared. The materials were char-acterised, and their catalytic activity was investigated in theAP reaction under batch reaction conditions. The describedresults show the first example of the use of metallic nano-particles in an artificial photosynthetic reaction withoutthe aid of a semiconductor component. It is also the firstexample of plasmon-promoted photocatalysis over Runanoparticles and of plasmon excitation transfer from Ruto TiO2.
2. Experiment
2.1. Preparation of the Photocatalysts. The ruthenium-basedphotocatalysts were prepared using a solvothermal route.At room temperature, RuCl3·3H2O (Sigma-Aldrich, 100mg,0.5mmol) was left to equilibrate overnight in absolute etha-nol (Fischer, 12mL). The resulting solution was then trans-ferred to a 20mL Teflon-lined, stainless-steel autoclave(Parr) and heated at 160°C for 12 hours. The resulting solidwas centrifuged, washed with distilled water and acetone sev-eral times, and dried at 60°C overnight. This procedure wasrepeated adding TiCl3 (Acros, 20% in ethanol) to the RuCl3solution after the equilibration. The addition of TiCl3 wascarried out dropwise at two Ru : Ti molar ratios: 10 : 1 and1 : 10. Thus, three different RuxTiy samples were prepared(Ru1Ti0, Ru10Ti1, and Ru1Ti10), where x and y are the respec-tive Ru : Ti molar ratios. These are designated as 100%Ru,10%TiO2/Ru, and 10%Ru/TiO2 in the text.
2.2. Characterisation Methods. X-ray powder diffractionanalysis was carried out on a Siemens D500 Kristalloflexdiffractometer using Cu Kα radiation (λ = 1 54056Å). Thevoltage and the current were set to 40 kV and 30mA,respectively, and the scan was conducted in 2θ mode, anangular range of 10–90°, 0.01 step per degree, and 5 secondsper step.
UV-visible spectra were recorded on a Jasco V-650instrument equipped with an integrating sphere (ISV-722).Absorbance was recorded in the range of 190–900nm inbaseline correction mode, with background spectra beingcollected prior to the experiments.
A Quantachrome NovaWin2 instrument was used toobtain N2 adsorption/desorption isotherms at 77.3K. TheBET-specific surface area (SBET) was calculated from the lin-ear fit of the data in the N2 adsorption/desorption isothermsover the relative pressure range (P/P0) of 0.05–0.30 using theBrunauer-Emmett-Teller (BET) equation.
Samples for TEM (Transmission Electron Microscopy)analysis were dispersed in isopropanol and sonicated for 15minutes. 10μL of the suspension was then dropped ontoholey carbon films supported by copper TEM meshes. Thesolvent was evaporated prior to analysis. Images wererecorded on a FEI Tecnai G220 TWIN microscope operatedat 200 kV.
XPS (X-ray Photoelectron Spectroscopy) analysis wasperformed on a Kratos Axis Ultra DLD instrument. Samples
for XPS were pressed into pellets using a hydraulic pressprior to analysis.
TPD (Temperature Programmed Desorption) experi-ments were carried out using both H2O and CO2 as probemolecules. For CO2 TPD, samples were loaded into a quartztubular reactor and held in place using quartz wool plugs.While the solid was kept under a flow of Ar (100mLmin-1),the reactor was housed in a furnace and heated at 110°C for30 minutes to remove any physisorbed species from thesurface. This system was then allowed to cool at 50°C, andthe catalyst was dosed with 5% CO2 in a flow of Ar(95mLmin-1) until saturation was reached (~1h). The CO2signal at this stage was recorded as a calibration factor, beforeCO2 was removed from the stream and replaced by an equiv-alent flow of Ar, retaining the overall flow (100mLmin-1).The temperature was lowered to 20°C, and the CO2 signal(as measured using an online mass spectrometer—Prolab)returned to background levels. The catalyst was then heatedfrom 20°C to 700°C at a ramp rate of 10°Cmin-1 while a por-tion of the exhaust gas was continuously monitored on theProlab instrument. For H2O TPD experiments, a mixtureH2O/Ar was produced by flowing Ar (50mLmin-1) througha bubbler containing 500mL of H2O immersed in a waterbath kept at 60°C. Considering the bubbler as an isolatedsystem and the relative vapour pressure of H2O at 60°C
20 25 30 35 40 45 50 55 60 65 70 75 80 85 90
(200)(101)(110)(101)
Anatase TiO2
2θ (°)
10%Ru/TiO
100%Ru10%TiO2/Ru
(100)
(002)
(101)
Ru0Inte
nsity
(au)
RuO2
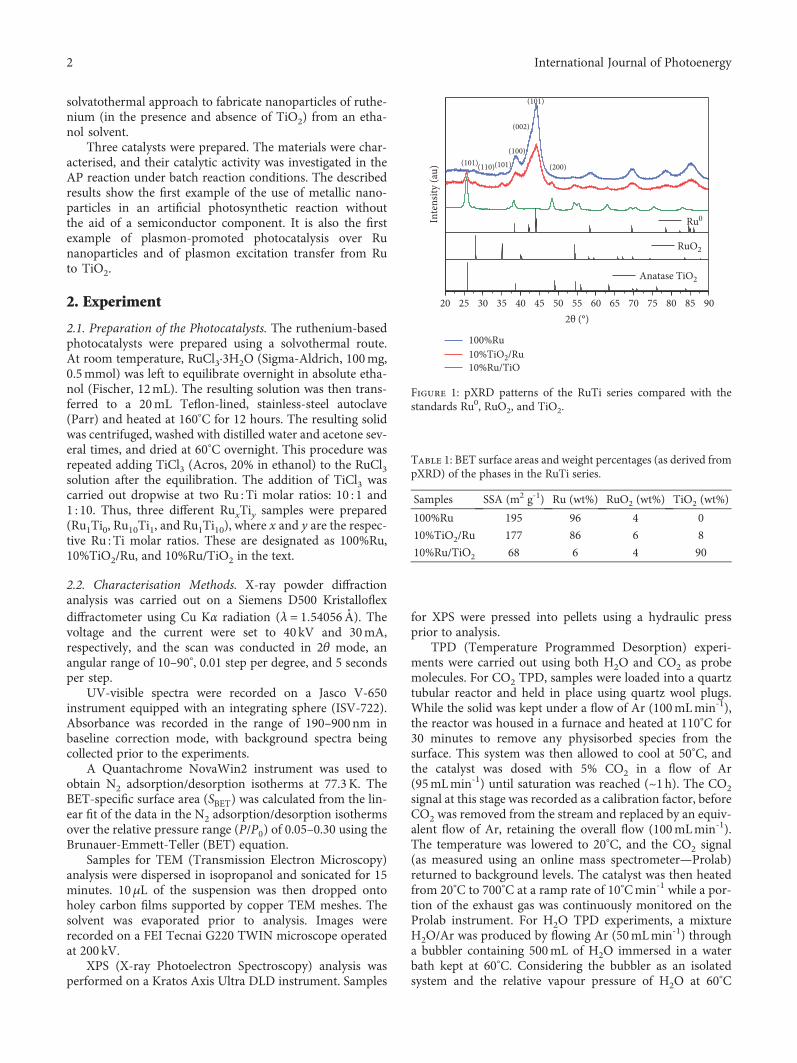
Figure 1: pXRD patterns of the RuTi series compared with thestandards Ru0, RuO2, and TiO2.
Table 1: BET surface areas and weight percentages (as derived frompXRD) of the phases in the RuTi series.
Samples SSA (m2 g-1) Ru (wt%) RuO2 (wt%) TiO2 (wt%)
100%Ru 195 96 4 0
10%TiO2/Ru 177 86 6 8
10%Ru/TiO2 68 6 4 90
2 International Journal of Photoenergy
(Pr 60°C ) as 0.1961 atm [5], the resulting mixture was 7.2%H2O (v/v). This was used to dose the catalyst at 50°C with3.9% H2O in a flow of Ar (96.1mLmin-1) until saturationwas reached (~1h). The H2O signal at this stage wasrecorded as a calibration factor, before H2O was removedfrom the stream and replaced by an equivalent flow of Ar,retaining the overall flow (100mLmin-1). The temperaturewas lowered to 20°C, and the H2O signal returned tobackground levels. The catalyst was then heated from20°C to 700°C at a ramp rate of 10°Cmin-1 while a portionof the exhaust gas was continuously monitored using anonline Prolab mass spectrometer.
2.3. Catalytic Activity Measurements. The catalytic evolutionof gaseous products was investigated with a top irradiationphotoreactor vessel under batch conditions. In a typicalexperiment, the catalyst (20mg) was loaded into the reactor
(73.5 cm3) and initially the system was held under a flow ofAr (100mLmin-1) while the temperature was increased to110°C for 30 minutes in order to ensure that any speciesattached to the surface by physisorption had been removed.The temperature was then lowered to 50°C, and a mixtureof H2O, CO2, and Ar (100mLmin-1) was switched into thestream. The catalyst in the reactor was held under a flow ofCO2 andH2O for 1 hour with a CO2 :H2O ratio of 1 : 14. After1 hour, the reactor was cooled at 25°C, sealed, and placed intothe chamber of anAtlas Suntest™CPS+ instrument and exter-nally irradiated by a 300W Xe lamp (Figure SI 1) that onlyemits visible light. During the reaction, the system wascooled to ensure that the temperature was kept constant at25°C. The reactor was equipped with a septum which allowedsample extraction for analysis. The extraction of gaseousaliquots for GC analysis was carried out periodically using a500μL Swagelok™ gastight syringe. The GC was Varian
50 nm1
40353025201510
50
2 3 4 5 6Size (nm)
Part
icle
s (n)
7 8 9 10
(a)
50 nm 1
5468
1012141618
02 3 4 5 6
Size (nm)
Part
icle
s (n)
7 8 9 10
(b)
20 nm 1
40353025201510
50
2 3 4 5 6Size (nm)
Part
icle
s (n)
7 8 9 10
(c)
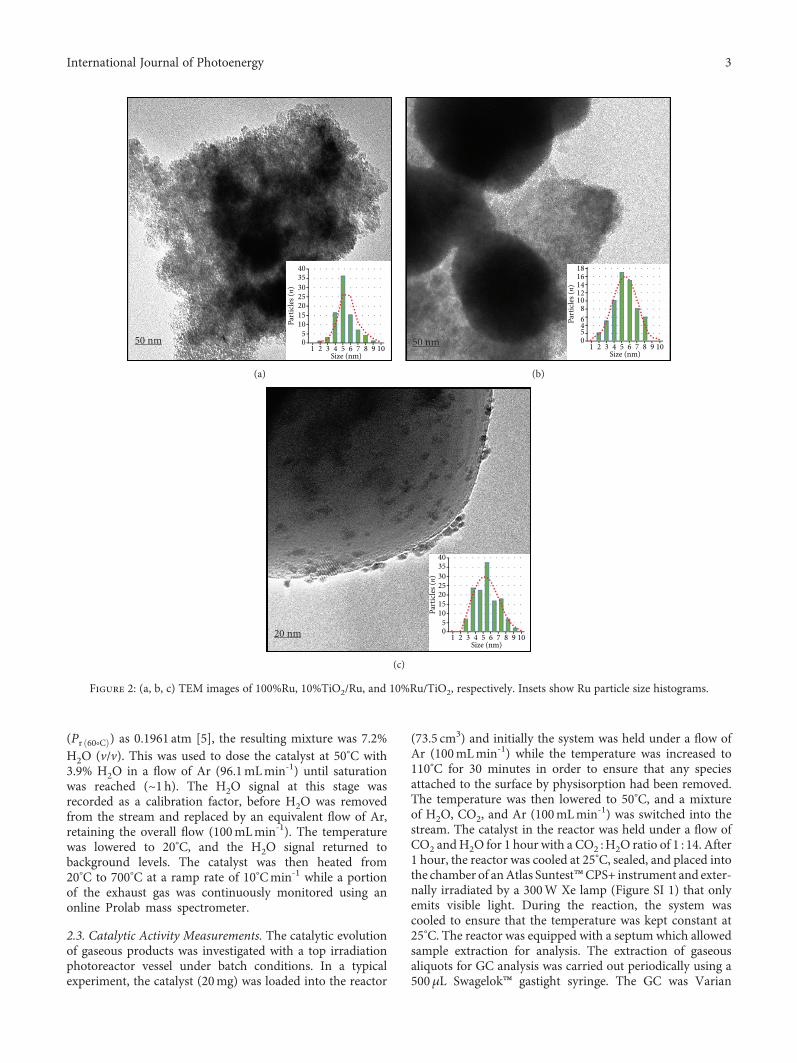
Figure 2: (a, b, c) TEM images of 100%Ru, 10%TiO2/Ru, and 10%Ru/TiO2, respectively. Insets show Ru particle size histograms.
3International Journal of Photoenergy
GC-450 equipped with CARBOWAX and Hayesep C packedcolumns, a methaniser, and detectors TCD and FID. Theinjector, the FID, and the TCD were held at 200°C, whilethe methaniser was held at 400°C. Ar was the carrier gaswith an overall flow of 50mLmin-1, and the pressure on thecolumn was set to 30 psi. For the analysis, the initialtemperature of the column was set to 50°C, and the columnwas then ramped at a rate of 20°Cmin-1 to 120°C and heldat the final temperature for 2 minutes.
3. Results and Discussion
The XRD patterns of the RuTi series and reference XRD pat-terns are shown in Figure 1. Hexagonal ruthenium metalwith a space group P63/mmc and lattice constants of a =2 704 (7) Å and c = 2 958 (4) Å was observed in all samplesvia the presence of (100), (002), and (101) diffraction peaksat 2θ = 38 7, 42.2, and 44.2°. A small fraction of tetragonalrutile-phase RuO2 (a = b = 4 593 (7) Å, c = 2 958 (7) Å;weight percentages shown in Table 1) with a space groupP42/mnm was also observed in all samples, detected via thepresence of (110) and (101) diffraction peaks at 2θ = 27 8and 35.1°. With regard to Ti phases, only anatase TiO2 wasdetected in the 10%TiO2/Ru and 10%Ru/TiO2 samples viathe presence of (101), (103), and (200) diffraction peaks at2θ = 25 7, 37.8, and 48.4°. The anatase TiO2 was obtained inthe tetragonal crystalline system with a space groupI41/amd and lattice constants of a = b = 3 793 (1) Å andc = 9 510 (4) Å. No other diffraction features associated withruthenium- or titanium-related species were found regard-less of the Ru : Ti molar ratio used in the preparation.
A small negative shift of 0.06° and 0.10° in the (110) and(101) peaks of the RuO2 phase was observed in the profilesof the 10%TiO2/Ru and 10%Ru/TiO2 samples, respectively
(when compared to the reference peaks of RuO2). Such ashift, which can be correlated with expansive residualstrain, defects, or change in electronic configuration oratomic structure, was not detectable in the pattern of the100%Ru sample. The shift is ascribed to the inclusion ofTi into the RuO2 matrix in these samples. This observationobeys Vegard’s law [14, 15] where the lattice of metallicsubstitutional solid solution is compressed with increasingsolute concentration as the atomic radius of solute atoms(Ti, 176 pm) is smaller than that of the solvent atoms (Ru,178 pm).
TEM images of the solids are presented in Figures 2(a),2(b) and 2(c). In all cases, the morphology of the rutheniummetal particles is spherical. This morphology can also beobserved in the SEM images (Figure SI 2). The inset ploton each image displays the corresponding particle sizedistribution histogram of the ruthenium metal nanoparticlesin the catalysts. The particle sizes ranged between 2 and10nm—with an average diameter of 5 nm across the threesamples. Neither the morphology nor the size of the Ruparticles was affected by the introduction of anatase TiO2.This is clear in Figure 2(c) in which the rutheniumnanoparticles can be observed on the larger TiO2 particles.As for the anatase TiO2 particles in 10%Ru/TiO2, theseare approximately spherical with an average size of 0.5–0.7μm.
It is also noteworthy that the extent of aggregation of theRu nanoparticles differs across the three prepared samples. Inthe 10%TiO2/Ru, the Ru nanoparticles appear more aggre-gated than those in the 100%Ru sample and in the10%Ru/TiO2 sample, and the aggregation is found to be theleast. The aggregation of Ru nanostructures into larger spher-ical features may decrease the surface area of the final mate-rial and affect the nature of the plasmon resonance, which is
0 50 100 150 200 250 300 350 400 450 500 550 600 650 7000
100
200
300
400
500
600
700
800
900
1000
100%Ru10%TiO2/Ru10%Ru/TiO2
CO2 c
once
ntra
tion
(ppm
)
Temperature (°C)
(a)
100%Ru10%TiO2/Ru10%Ru/TiO2
0 50 100 150 200 250 300 350 400 450 500 550 600 650 7000
500
1000
1500
2000
2500
3000
3500
4000
4500
5000
HO
2 con
cent
ratio
n (p
pm)
Temperature (°C)
(b)
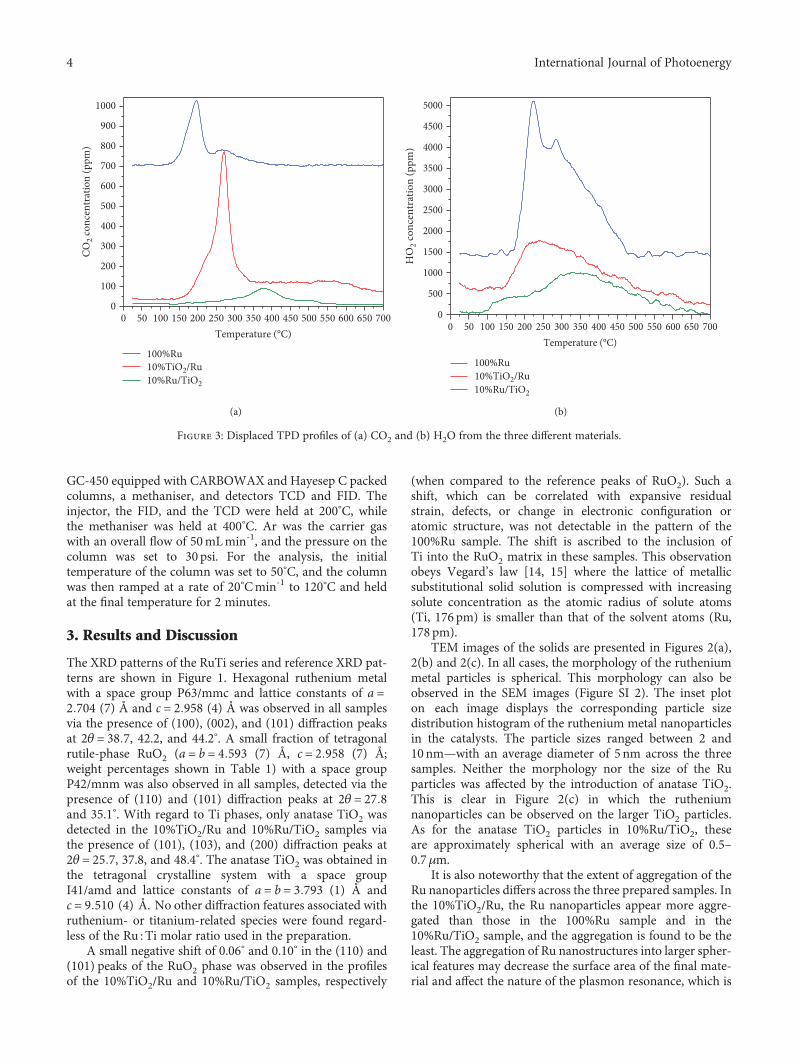
Figure 3: Displaced TPD profiles of (a) CO2 and (b) H2O from the three different materials.
4 International Journal of Photoenergy
known to be size dependent on these nanoparticles [16, 17].In turn, these characteristics may impact the catalytic proper-ties. However, the UV-visible spectra, which analyse the plas-mons, do not show any conclusive difference in the plasmonband across the three samples.
3.1. Surface and Optical Properties. These materials showedappreciable BET surface areas (Table 1). The multipointBET analysis plots are shown in Figure SI 3. The two Ru-abundant samples—100%Ru and 10%TiO2/Ru—have muchhigher BET surface areas than the Ti-abundant sample—10%Ru/TiO2. This can be attributed to the different sizes ofthe particles (see above).
Figure 3(a) shows TPDs of CO2 from the catalystseries. The 100%Ru and 10%TiO2/Ru materials show two
desorption events in each profile, confirming the presenceof two CO2 accessible adsorption sites. These are well sepa-rated peaking at T1 = 195°C and T2 = 270°C in the profilefrom the 100%Ru catalyst, while for 10%TiO2/Ru, there is amain peak at T2 = 270°C with a lower temperature shoulderat T1 = 220°C. The incorporation of 10%Ti strengthens theinteraction between CO2 and the surface (as seen by thechange in desorption temperatures) and reverses the relativeconcentrations of the adsorption sites. The 10%TiO2/Ru cat-alyst contains the highest concentration of CO2 desorptionsites with 645.6μmol g-1 of CO2 desorbing from the saturatedcatalyst, compared to 439.6 and 212.5μmol g-1 from 100%Ruand 10%Ru/TiO2, respectively.
Upon increasing the Ti loading to ~90%, the CO2 adsorp-tion/desorption characteristics were altered substantially.
284 283 282 281 280 279 278 277 276 275 274
Ru 3d3/2 Ru 3d5/2
Binding energy (eV)
Ru4+
Ru0
Run+
Experimental data pointsCumulative fit
Inte
nsity
(cps
)
(a)
Ru 3p3/2
Ti 2p3/2
Experimental data pointsCumulative fit
465 464 463 462 461 460 459 458 457 456
Ti4+
Ti4+ Ti3+
Binding energy (eV)
Ti 2p1/2
Inte
nsity
(cps
)
(b)
Experimental data pointsCumulative fit
284 283 282 281 280 279 278 277 276 275 274Binding energy (eV)
Inte
nsity
(cps
)
Ru4+
Ru0
Ru 3d3/2
Ru 3d5/2
(c)
Experimental data pointsCumulative fit
531 530 529 528 527 526 525 524 523
Binding energy (eV)
O–H
O 1sMetal–O
Inte
nsity
(cps
)
(d)
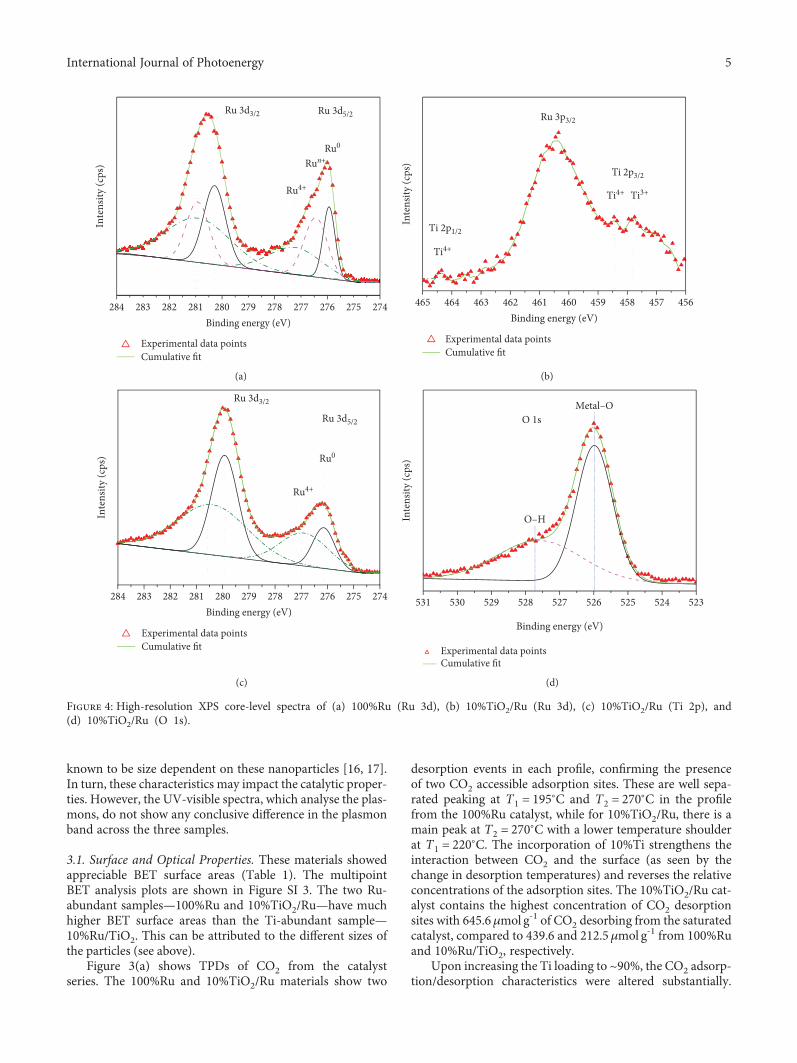
Figure 4: High-resolution XPS core-level spectra of (a) 100%Ru (Ru 3d), (b) 10%TiO2/Ru (Ru 3d), (c) 10%TiO2/Ru (Ti 2p), and(d) 10%TiO2/Ru (O 1s).
5International Journal of Photoenergy
The extent of desorption was much lower, and it occurred athigher temperatures (300–500°C), indicating the formationof stronger adsorption sites on the (mostly) TiO2 surface.These new (presumably TiO2-based) sites are more stablethan those on the 100%Ru and 10%TiO2/Ru materials; how-ever, they are less stable than the typical CO2 adsorption siteson anatase TiO2 [18]. Mao et al. have studied CO2 desorptionfrom various anatase TiO2 samples and reported that themain desorption events occur in the 500–600°C range. Thisshift in the CO2 peaks to lower temperatures suggests thatthe presence of Ru has weakened the CO2-TiO2 interactions.These catalysts are also capable of adsorbing and desorbingH2O (see the H2O-TPD profiles in Figure 3(b)). These pro-files show that the presence of TiO2 decreases the H2Oadsorption/desorption capacities of the materials. The Rusample without TiO2 shows a large peak at 225
°C with a sec-ondary peak at 300°C, while when TiO2 is added to the mate-rial the water desorption is singly (relatively broad feature)peaking at 250°C from the 10%TiO2/Ru sample and at~350°C from the 10%Ru/TiO2 material. These results con-firm that the samples can adsorb (and desorb) both reactantsrequired for the AP reaction.
XPSmeasurements shed light on the nature of the surfaceof these catalysts. Figure 4(a) shows the Ru 3d spectrum ofthe 100%Ru sample. The two peaks observed in the Ru 3dregion are related to electron emission from Ru 3d3/2 andRu 3d5/2 levels (with binding energies at 280.7 and276.2 eV, respectively). These peaks correspond mainly toemission from hexagonal Ru0 with a coordination numberof 12 and a spin-orbit splitting Δ of 4.5 eV [19]. Upon decon-volution of this spectrum, emission from small amounts ofRu4+ (at higher energies relative to those from Ru0) was alsodetected, confirming the presence of RuO2.
The Ru 3d spectrum of the 10%TiO2/Ru material showssignals related to Ru0 and Ru4+ (as above) but also signalsrelated to emission from Run+ (Figure 4(b) and Figure SI4). The existence of Run+ (0 < n < 4) species in this catalystmust be ascribed to the added Ti and its effect on theelectronic structure of Ru. Kim and Winograd consideredthat the substitution of metal ions into the RuO2 lattice ismost likely responsible for the formation of Run+ (0 < n < 4)ions via electron transfer from Ti to Ru4+ ions [20].
Such observations are in good agreement with the XRDresults which show dissolution of Ti into the RuO2 lattice.Furthermore, Rodriguez et al. reported the creation of inter-stitial Mn+ species in solid solutions of (Ti–Ru)O2, such asRu3+, which may lead to undercoordinated oxygen species(oxygen vacancies) preserving the electrostatic balance [21].
The Ti 2p spectrum of the 10%TiO2/Ru catalyst was alsorecorded (Figure 4(c)). Emission from the Ti 2p1/2 and 2p3/2levels with binding energies at 458.5 and 464.4 eV is related toemission from octahedrally coordinated Ti4+. However, asecond, less intense peak at lower energy, related to Ti3+,was also detected in the Ti 2p region. This peak must berelated to incorporation of Ti into the RuO2 lattice. The O1s spectrum of this catalyst shows the presence of both latticeand surface hydroxyl O atoms.
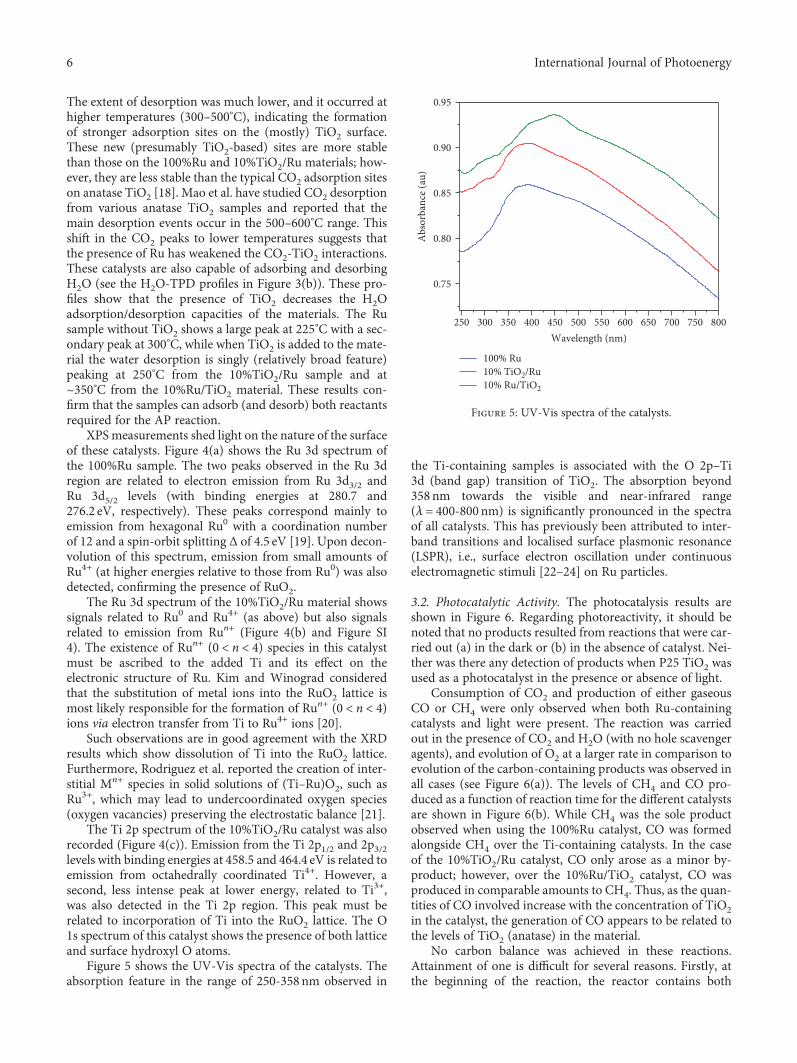
Figure 5 shows the UV-Vis spectra of the catalysts. Theabsorption feature in the range of 250-358 nm observed in
the Ti-containing samples is associated with the O 2p–Ti3d (band gap) transition of TiO2. The absorption beyond358 nm towards the visible and near-infrared range(λ = 400-800 nm) is significantly pronounced in the spectraof all catalysts. This has previously been attributed to inter-band transitions and localised surface plasmonic resonance(LSPR), i.e., surface electron oscillation under continuouselectromagnetic stimuli [22–24] on Ru particles.
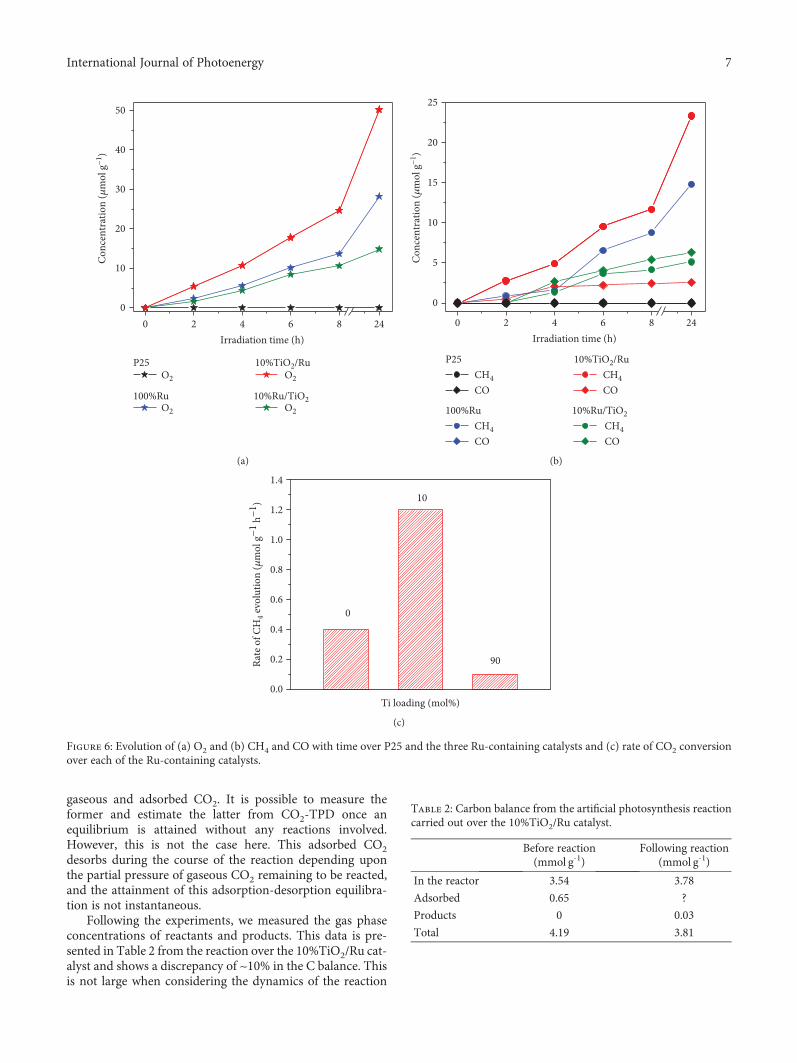
3.2. Photocatalytic Activity. The photocatalysis results areshown in Figure 6. Regarding photoreactivity, it should benoted that no products resulted from reactions that were car-ried out (a) in the dark or (b) in the absence of catalyst. Nei-ther was there any detection of products when P25 TiO2 wasused as a photocatalyst in the presence or absence of light.
Consumption of CO2 and production of either gaseousCO or CH4 were only observed when both Ru-containingcatalysts and light were present. The reaction was carriedout in the presence of CO2 and H2O (with no hole scavengeragents), and evolution of O2 at a larger rate in comparison toevolution of the carbon-containing products was observed inall cases (see Figure 6(a)). The levels of CH4 and CO pro-duced as a function of reaction time for the different catalystsare shown in Figure 6(b). While CH4 was the sole productobserved when using the 100%Ru catalyst, CO was formedalongside CH4 over the Ti-containing catalysts. In the caseof the 10%TiO2/Ru catalyst, CO only arose as a minor by-product; however, over the 10%Ru/TiO2 catalyst, CO wasproduced in comparable amounts to CH4. Thus, as the quan-tities of CO involved increase with the concentration of TiO2in the catalyst, the generation of CO appears to be related tothe levels of TiO2 (anatase) in the material.
No carbon balance was achieved in these reactions.Attainment of one is difficult for several reasons. Firstly, atthe beginning of the reaction, the reactor contains both
250 300 350 400 450 500 550 600 650 700 750 800
0.75
0.80
0.85
0.90
0.95
Abs
orba
nce (
au)
Wavelength (nm)
100% Ru10% TiO2/Ru10% Ru/TiO2
Figure 5: UV-Vis spectra of the catalysts.
6 International Journal of Photoenergy
gaseous and adsorbed CO2. It is possible to measure theformer and estimate the latter from CO2-TPD once anequilibrium is attained without any reactions involved.However, this is not the case here. This adsorbed CO2desorbs during the course of the reaction depending uponthe partial pressure of gaseous CO2 remaining to be reacted,and the attainment of this adsorption-desorption equilibra-tion is not instantaneous.
Following the experiments, we measured the gas phaseconcentrations of reactants and products. This data is pre-sented in Table 2 from the reaction over the 10%TiO2/Ru cat-alyst and shows a discrepancy of ~10% in the C balance. Thisis not large when considering the dynamics of the reaction
0 2 4 6 8 240
10
20
30
40
50Co
ncen
trat
ion
(�휇m
ol g
−1)
Irradiation time (h)
P25 10%TiO2/RuO2 O2
100%Ru 10%Ru/TiO2O2 O2
(a)
0 2 4 6 8 24
0
5
10
15
20
25
P25 10%TiO2/RuCH4 CH4CO CO
100%Ru 10%Ru/TiO2CH4 CH4CO CO
Irradiation time (h)
Conc
entr
atio
n (�휇
mol
g−1
)
(b)
Rate
of C
H4 e
volu
tion
(�휇m
ol g
−1 h
−1)
0.0
0.2
0.4
0.6
0.8
1.0
1.2
1.4
90
10
Ti loading (mol%)
0
(c)
Figure 6: Evolution of (a) O2 and (b) CH4 and CO with time over P25 and the three Ru-containing catalysts and (c) rate of CO2 conversionover each of the Ru-containing catalysts.
Table 2: Carbon balance from the artificial photosynthesis reactioncarried out over the 10%TiO2/Ru catalyst.
Before reaction(mmol g-1)
Following reaction(mmol g-1)
In the reactor 3.54 3.78
Adsorbed 0.65 ?
Products 0 0.03
Total 4.19 3.81
7International Journal of Photoenergy

and the factors affecting the attainment of adsorption-desorption and reaction equilibria.
The formation and adsorption of nongaseous products,e.g., CH3OH and CH2O, also need to be considered when try-ing to establish a mass balance. The FTIR spectrum of the10%TiO2/Ru catalyst following reaction shows alkyl, car-bonyl, and C–O vibrations (Figure 7).
The most reactive catalyst within the series was10%TiO2/Ru, converting approximately 1.2μmol of CO2 g
-
1 of catalyst h-1 (with an apparent quantum efficiency(AQE) of ~0.07%), compared to conversions of 0.4 and0.43μmol g-1 h-1 over the 100%Ru and 10%Ru/TiO2 cata-lysts, respectively (Figure 6(c)).
This photocatalyst is robust, maintaining a product evolu-tion rate of 1.2μmol of product g-1 h-1 for three reaction cycles(Figure 8(a)). Moreover, the pXRD pattern (Figure 8(b)) andthe XPS spectra (Figure 8(c)) of the 10%TiO2/Ru catalyst alsoremained unchanged after three reaction cycles, confirmingthe stability of this photocatalyst.
The photocatalytic activity of metallic Ru nanoparticles issurprising and may be ascribed to a number of factors.Firstly, as reported by Kim et al., upon chemisorption ontothe surface of Ru nanoparticles, CO2 molecules experiencea pronounced narrowing in the energy gap between theirHOMO (5σ bonding) and LUMO (2π antibonding) levels.They report a decrease from 8.5 eV (free CO2) to 2.4 eV(Ru-bound CO2 species) [25]. The new energy gap of Ru–CO2molecules falls within the visible region; hence, adsorbedCO2 molecules can absorb the incident irradiation and thiscan promote the dissociation reaction.
Secondly, the effect of localised surface plasmon reso-nance (LSPR) must be considered. It is widely known that“free electrons” on the surface of noble metals can absorblight in the visible range to trigger a collective oscillatorywave (plasmon) which gives rise to creation of hot electrons,electron transfer, and catalytic activity [26]. Also, as reportedby Christopher et al., the photocatalysis observed is likelydue to polarisation of the Ru nanoparticles’ surface intoelectron/hole-rich regions, ultimately generating “metallicelectrons and holes” [24].
Furthermore, the photocatalysis over pure Ru nanopar-ticles may be partially attributed to thermal promotion,since light absorption in the range of the LSPR band willlead to a slight temperature rise within the nanoparticles[27]. The combination of thermal and photoenergies to ini-tiate catalytic processes of CO2 conversion is deemed bene-ficial firstly by Thampi et al. [13] and recently by Kim et al.[25]. In their case, heat was purposefully used alongsidelight to carry out the hydrogenation of CO2 over Ru nano-particles, yielding better overall catalytic performance whenboth heat and light were used. Therefore, we conclude thatthe generation of hot electrons from the metallic nanoparti-cles, the reduced gap between the HOMO and LUMO levelsin the adsorbed CO2 molecules, and the photoinduced ther-mal energy all work in tandem to promote the CO2 photo-reduction [23–25, 28].
To our knowledge, this is the first example of Ru nano-particles catalysing the AP reaction. Furthermore, the absor-bance of light by the Ru particle generates plasmons (and
these plasmons yield the photocatalytic activity). This isthe first example of such plasmonic reactivity seen withRu catalysts.
Also, this result shows that anatase TiO2 has a role in thephotocatalytic process. Coupling Ru nanoparticles to anataseTiO2 led to higher photocatalytic activity in the case of10%TiO2/Ru, possibly owing to the combined effect of LSPRon Ru nanoparticles and charge separation at the semicon-ductor [26]. However, such improvements were not observedover the 10%Ru/TiO2 catalyst (suggesting that there is anoptimum loading of Ti for this promotion). Moreover, theactivity improvement cannot be assigned to enhancedabsorption of visible light as all catalysts’ absorption of visiblelight (Figure 5) is comparable.
The addition of TiO2 changes the reaction selectivity(increasing the proportion of CO in the product mixture)indicating that TiO2 plays a role in the catalysis. However,it must be noted that TiO2 itself cannot be photoexcitedunder these conditions. Given this, the reaction on TiO2must involve the transfer of excitons generated on Ru toTiO2 before they are used in the reaction. Plasmon-inducedphotocatalysis in TiO2 has previously only been seen inAu/TiO2 systems [26].
4. Conclusions
We have shown the preparation of ruthenium metal nano-particles using a facile one-pot solvothermal method with-out the use of templates or of structure-directing agents.The materials formed are nanoparticles with a narrow sizedistribution and relatively high surface areas and are capa-ble of adsorbing and desorbing CO2 and H2O. The Ru par-ticles absorb visible light and are active in the promotion ofthe CO2+H2O reaction under this light via a plasmonicexcited state. Incorporation of Ti-containing precursorsinto the preparation mixture (forming anatase TiO2 inthe final materials) changes the light absorption properties,the photocatalytic activity, and CH4/CO selectivity of the
3750 3375 3000 2625 2250 1875 1500 1125 750
Tran
smitt
ance
(au)
vs C–O
vas CH3
vs CO
Wavenumbers (cm−1)
PostcatalystFresh catalyst
Figure 7: FTIR spectrum of the 10%TiO2/Ru catalyst following theAP reaction shown in Figure 6.
8 International Journal of Photoenergy

catalysts. The effects of TiO2 appear to be derived from thetransfer of plasmon-induced excitons in the Ru to theTiO2 material.
Data Availability
The data used to support the findings of this study areavailable from the corresponding authors upon request.
Conflicts of Interest
The authors declare that there is no conflict of interestregarding the publication of this paper.
Acknowledgments
EM is funded by Coordenação de Aperfeiçoamento dePessoal de Nível Superior (CAPES) through the “Sciencewithout Borders (SwB) scheme” supported by the Ministryof Education, Brazil. The publication cost of this paper isprovided jointly by the University College Dublin (UCD)Output-Based Research Support Scheme (OBRSS) andUCD College of Engineering & Architecture internal fund.
Supplementary Materials
Figure SI 1: UV-visible emission spectrum of the Xe lampradiation (recorded inside the solar simulator). Figure SI 2:(a, b, c) SEM images of 100%Ru, 10%TiO2/Ru, and
0.0
0.2
0.4
0.6
0.8
1.0
1.2
1.4
Cycle 3Cycle 2
CO2 c
onve
rsio
n ra
te/�휇
mol
g−1
h−1
Cycle 1
10%TiO2/Ru
(a)
20 30 40 50 60 70 80 90
Ru10%TiO2/Ru
Inte
nsity
(au)
2�휃 (°)
10%Ru / TiO2
(b)
284 283 282 281 280 279 278 277 276 275 274
Ru 3d3/2
Ru 3d5/2
Binding energy (eV)
Ru4+
Ru0
Run+
Inte
nsity
(cps
)
Fresh catalystPost catalyst
465 464 463 462 461 460 459 458 457 456Binding energy (eV)
Fresh catalystPost catalyst
Inte
nsity
(cps
)
Ti4+
Ti 2p1/2
Ti 2p3/2
Ti3+Ti4+
(c)
Figure 8: (a) Reactivity of the 10%TiO2/Ru catalyst over three reaction cycles, (b) pXRD profiles for the three catalysts following reaction(compared to the profiles from the fresh catalysts), and (c) XPS profiles of the 10%TiO2/Ru catalyst before and following reaction showingthat no surface chemical changes had taken place.
9International Journal of Photoenergy
10%Ru/TiO2, respectively. Figure SI 3: (a, b, c) MultipointBET plots for the 100%Ru, 10%TiO2/Ru, and 10%Ru/TiO2catalysts, respectively. Figure SI 4: High-resolution XPS Ru3d core-level spectra of the 100%Ru and 10%TiO2/Ru mate-rials. (Supplementary Materials)
References
[1] K. Li, B. Peng, and T. Peng, “Recent advances in heterogeneousphotocatalytic CO2 conversion to solar fuels,” ACS Catalysis,vol. 6, no. 11, pp. 7485–7527, 2016.
[2] E. T. Kho, T. H. Tan, E. Lovell, R. J. Wong, J. Scott, andR. Amal, “A review on photo-thermal catalytic conversion ofcarbon dioxide,” Green Energy & Environment, vol. 2, no. 3,pp. 204–217, 2017.
[3] E. Alper and O. Yuksel Orhan, “CO2 utilization: developmentsin conversion processes,” Petroleum, vol. 3, no. 1, pp. 109–126,2017.
[4] W. Tu, Y. Zhou, and Z. Zou, “Photocatalytic conversion ofCO2 into renewable hydrocarbon fuels: state‐of‐the‐artaccomplishment, challenges, and prospects,” Advanced Mate-rials, vol. 26, no. 27, pp. 4607–4626, 2014.
[5] D. R. Lide, Handbook of Chemistry and Physics, J. R. Rumble,Ed., vol. 71CRC, 99th edition, 2018.
[6] S. N. Habisreutinger, L. Schmidt-Mende, and J. K. Stolarczyk,“Photocatalytic reduction of CO2 on TiO2 and other semicon-ductors,” Angewandte Chemie International Edition, vol. 52,no. 29, pp. 7372–7408, 2013.
[7] E. Albarrán-Zavala and F. Angulo-Brown, “A simple thermo-dynamic analysis of photosynthesis,” Entropy, vol. 9, no. 4,pp. 152–168, 2007.
[8] W. Fan, Q. Zhang, and Y. Wang, “Semiconductor-based nano-composites for photocatalytic H2 production and CO2 con-version,” Physical Chemistry Chemical Physics, vol. 15, no. 8,p. 2632, 2013.
[9] A. Dhakshinamoorthy, S. Navalon, A. Corma, and H. Garcia,“Photocatalytic CO2 reduction by TiO2 and related titaniumcontaining solids,” Energy & Environmental Science, vol. 5,no. 11, pp. 9217–9233, 2012.
[10] C. Yang, Y. Yu, B. LindenVan Der, and J. C. S. Wu, “ArtificialPhotosynthesis over Crystalline TiO2-Based Catalysts: Fact orFiction?,” Journal of the American Chemical Society, vol. 74,no. 13, pp. 8398–8406, 2010.
[11] Y. Xia, Y. Xiong, B. Lim, and S. E. Skrabalak, “Shape-controlledsynthesis of metal nanocrystals: simple chemistry meetscomplex physics?,” Angewandte Chemie International Edition,vol. 48, no. 1, pp. 60–103, 2009.
[12] T. Naota, H. Takaya, and S.-I. Murahashi, “Ruthenium-catalyzed reactions for organic synthesis,” Chemical Reviews,vol. 98, no. 7, pp. 2599–2660, 1998.
[13] K. R. Thampi, J. Kiwi, and M. Grätzel, “Methanation andphoto-methanation of carbon dioxide at room temperatureand atmospheric pressure,” Nature, vol. 327, no. 6122,pp. 506–508, 1987.
[14] H. W. King, “Quantitative size-factors for metallic solid solu-tions,” Materials Science, vol. 1, no. 1, pp. 79–90, 1966.
[15] A. R. Denton and N. W. Ashcroft, “Vegards law,” PhysicsReview A, vol. 43, no. 6, pp. 3161–3164, 1991.
[16] N. J. Halas, S. Lal, W. S. Chang, S. Link, and P. Nordlander,“Plasmons in strongly coupled metallic nanostructures,”Chemical Reviews, vol. 111, no. 6, pp. 3913–3961, 2011.
[17] D. D. E. Jr and G. Chumanov, “Synthesis and Optical Proper-ties of Silver Nanoparticles and Arrays,” ChemPhysChem,vol. 29634, no. 6, pp. 1221–1231, 2005.
[18] J. Mao, L. Ye, K. Li et al., “Pt-loading reverses the photocata-lytic activity order of anatase TiO2 {0 0 1} and {0 1 0} facetsfor photoreduction of CO2 to CH4,” Applied Catalysis B: Envi-ronmental, vol. 144, pp. 855–862, 2014.
[19] C. D. Wagner, W. M. Riggs, L. E. Davis, and J. F. Moulder,Handbook of X-Ray Photoelectron Spectroscopy, Perkin-ElmerCorporation, 1978.
[20] K. S. Kim and N. Winograd, “X-Ray photoelectron spectro-scopic studies of ruthenium-oxygen surfaces,” Journal ofCatalysis, vol. 35, no. 1, pp. 66–72, 1974.
[21] T.-D. Nguyen-Phan, S. Luo, D. Vovchok et al., “Three-dimen-sional ruthenium-doped TiO2 sea urchins for enhancedvisible-light-responsive H2 production,” Physical ChemistryChemical Physics, vol. 18, no. 23, pp. 15972–15979, 2016.
[22] M. Zayats, A. B. Kharitonov, S. P. Pogorelova,O. Lioubashevski, E. Katz, and I. Willner, “Probing photoelec-trochemical processes in au−cds nanoparticle arrays by surfaceplasmon resonance: application for the detection of acetylcho-line esterase inhibitors,” Journal of the American ChemicalSociety, vol. 125, no. 51, pp. 16006–16014, 2003.
[23] S. Sun, W. Wang, L. Zhang, M. Shang, and L. Wang, “Ag@Ccore/shell nanocomposite as a highly efficient plasmonicphotocatalyst,” Catalysis Communications, vol. 11, no. 4,pp. 290–293, 2009.
[24] P. Christopher, H. Xin, and S. Linic, “Visible-light-enhancedcatalytic oxidation reactions on plasmonic silver nanostruc-tures,” Nature Chemistry, vol. 3, no. 6, pp. 467–472, 2011.
[25] C. Kim, S. Hyeon, J. Lee et al., “Energy-efficient CO2 hydroge-nation with fast response using photoexcitation of CO2adsorbed on metal catalysts,” Nature Communications, vol. 9,no. 1, pp. 1–8, 2018.
[26] A. Furube, L. Du, K. Hara, R. Katoh, and M. Tachiya, “Ultra-fast plasmon-induced electron transfer from gold nanodotsinto TiO2 nanoparticles,” Journal of the American ChemicalSociety, vol. 129, no. 48, pp. 14852-14853, 2007.
[27] X. Zhang, Y. L. Chen, R. S. Liu, and D. P. Tsai, “Plasmonicphotocatalysis,” Reports on Progress in Physics, vol. 76, no. 4,pp. 46401–46441, 2013.
[28] L. Collado, A. Reynal, J. M. Coronado, D. P. Serrano, J. R.Durrant, and V. A. de la Peña O'Shea, “Effect of Au surfaceplasmon nanoparticles on the selective CO2 photoreductionto CH4,” Applied Catalysis B: Environmental, vol. 178,pp. 177–185, 2015.
10 International Journal of Photoenergy

TribologyAdvances in
Hindawiwww.hindawi.com Volume 2018
Hindawiwww.hindawi.com Volume 2018
International Journal ofInternational Journal ofPhotoenergy
Hindawiwww.hindawi.com Volume 2018
Journal of
Chemistry
Hindawiwww.hindawi.com Volume 2018
Advances inPhysical Chemistry
Hindawiwww.hindawi.com
Analytical Methods in Chemistry
Journal of
Volume 2018
Bioinorganic Chemistry and ApplicationsHindawiwww.hindawi.com Volume 2018
SpectroscopyInternational Journal of
Hindawiwww.hindawi.com Volume 2018
Hindawi Publishing Corporation http://www.hindawi.com Volume 2013Hindawiwww.hindawi.com
The Scientific World Journal
Volume 2018
Medicinal ChemistryInternational Journal of
Hindawiwww.hindawi.com Volume 2018
NanotechnologyHindawiwww.hindawi.com Volume 2018
Journal of
Applied ChemistryJournal of
Hindawiwww.hindawi.com Volume 2018
Hindawiwww.hindawi.com Volume 2018
Biochemistry Research International
Hindawiwww.hindawi.com Volume 2018
Enzyme Research
Hindawiwww.hindawi.com Volume 2018
Journal of
SpectroscopyAnalytical ChemistryInternational Journal of
Hindawiwww.hindawi.com Volume 2018
MaterialsJournal of
Hindawiwww.hindawi.com Volume 2018
Hindawiwww.hindawi.com Volume 2018
BioMed Research International Electrochemistry
International Journal of
Hindawiwww.hindawi.com Volume 2018
Na
nom
ate
ria
ls
Hindawiwww.hindawi.com Volume 2018
Journal ofNanomaterials
Submit your manuscripts atwww.hindawi.com


![Artificial Photosynthesis: Beyond Mimicking Nature · 2017. 12. 4. · Artificial Photosynthesis: Beyond Mimicking Nature. Holger Dau,* [a] Etsuko Fujita,* [b] and Licheng Sun* [c,](https://img.pdfslide.net/doc/110x75/60fe452775a71d1de4329da9/artificial-photosynthesis-beyond-mimicking-nature-2017-12-4-artificial-photosynthesis.jpg)