Embed Size (px)
Citation preview
JULY/AUGUST 2021
2VISION JULY/AUGUST 2021 |
Research Analysts
Economics & StrategyMontreal OfficeStéfane Marion 514-879-3781Chief Economist and Strategist
Matthieu Arseneau 514-879-2252Deputy Chief Economist
Kyle Dahms 514-879-3195Economist
Angelo Katsoras 514-879-6458Geopolitical Analyst
Daren King 514-412-2967Economist
Jocelyn Paquet 514-412-3693Economist
Paul-André Pinsonnault 514-879-3795Senior Economist
Toronto OfficeWarren Lovely 416-869-8598 Chief Rates and Public Sector Strategist
Taylor Schleich 416-869-6480 Rates Strategist
Alpa Atha 416-542-3936 Fixed Income Economist
Banking & InsuranceGabriel Dechaine 416-869-7442Associate: Will Flanigan 416-507-8006 Associate: Pranoy Kurian 416-507-9568
Diversified FinancialsJaeme Gloyn 416-869-8042 Associate: Julia Gul 416-869-7495
Diversified IndustrialsMichael Storry-Robertson 416-507-8007
ESG & Sustainability Amber Brown 403-290-5624 Associate: Josh Turanich 403-290-5625
ETFs & Financial Products Daniel Straus 416-869-8020 Linda Ma 416-507-8801 Tiffany Zhang 416-869-8022Associate: Shubo Yan 416-869-7942
Healthcare & BiotechnologyEndri Leno 416-869-8047Assoc: Eduardo Garcia Hubner 416-869-7476 Associate: Stephen Kwai 416-869-7571
Industrial Products Maxim Sytchev 416-869-6517Associate: Alizeh Haider 416-869-7937
Merchandising & Consumer ProductsVishal Shreedhar 416-869-7930Associate: Paul Hyung 416-507-9009Associate: Ryan Li 416-869-6767
Metals & MiningDon DeMarco 416-869-7572Associate: Yi Liu 416-869-8524Associate: Harmen Puri 416-869-8045
Shane Nagle 416-869-7936Associate: Lola Aganga 416-869-6516Associate: Ahmed Al-Saidi 416-869-7535
Michael Parkin 416-869-6766Associate: Alessandro Cairo 416-869-8511Associate: Jonathan Egilo 416-507-8177 Associate: Rabi Nizami 416-869-7925
Oil & Gas› Intermediate Oil & Gas and
Oilfield Services
Dan Payne 403-290-5441 Associate: Anthony Linton 416-507-9054 Associate: Baltej Sidhu 403-290-5627
› Large Cap Oil & Gas
Travis Wood 403-290-5102 Associate: Logan Fisher 403-441-0933 Associate: James Harwood 403-290-5445
Pipelines, Utilities & Energy InfrastructurePatrick Kenny 403-290-5451Associate: William Duforest 403-441-0952Associate: Zach Warnock 403-355-6643
Real EstateMatt Kornack 416-507-8104Associate: Hussam Maqbool 416-507-8108Associate: Ahmed Shethwala 416-507-8102
Tal Woolley 416-507-8009
Special SituationsZachary Evershed 514-412-0021Associate: Thomas Bolland 514-871-5013
Endri Leno 416-869-8047Assoc: Eduardo Garcia Hubner 416-869-7476 Associate: Stephen Kwai 416-869-7571
Sustainability & Clean Tech Rupert Merer 416-869-8008Associate: Louka Nadeau 416-869-7538 Associate: Viveck Panjabi 416-869-6763
Technology Richard Tse 416-869-6690Associate: James Burns 416-869-8808Associate: Mihir Raul 416-869-8049 Associate: John Shao 416-869-7938
Technical AnalysisDennis Mark 416-869-7427
Telecom & MediaAdam Shine 514-879-2302Associate: Ahmed Abdullah 514-879-2564Associate: Luc Troiani 416-869-6585
Transportation & Industrial ProductsCameron Doerksen 514-879-2579Associate: Alex Hutton 416-869-8281
AdministrationGreg Colman 416-869-6775Managing Director Head of Research
Tanya Bouchard 416-869-7934Supervisory Analyst
Research PublicationsVanda Bright 416-869-7141Manager Publishing Services
Wayne Chau 416-869-7140Publishing Associate
InformationGiuseppe Saltarelli [email protected]
3VISION JULY/AUGUST 2021 |Back to Research Analysts pageTable of Contents
Highlights . . . . . . . . . . . . . . . . . . . . . . . . . . . . . . 4
The Economy . . . . . . . . . . . . . . . . . . . . . . . . . . . 6
Interest Rates and Bond Markets . . . . . . . 16
Stock Market and Portfolio Strategy . . . . . 22
Technical Analysis . . . . . . . . . . . . . . . . . . . . . 30
Sector Analysis . . . . . . . . . . . . . . . . . . . . . . . 37
› NBF Selection List . . . . . . . . . . . . . . . . . . . . . 38
› Analysts' Tables Glossary . . . . . . . . . . . . . . 39
› Analyst Recommendations . . . . . . . . . . . . 40
› Alphabetical Listing . . . . . . . . . . . . . . . . . . . 71NBF Disclosures, please visit URL: http://www .nbcn .ca/contactus/disclosures .html
4VISION JULY/AUGUST 2021 |Back to Research Analysts pageHighlights
Economy› After substantial progress in the struggle against
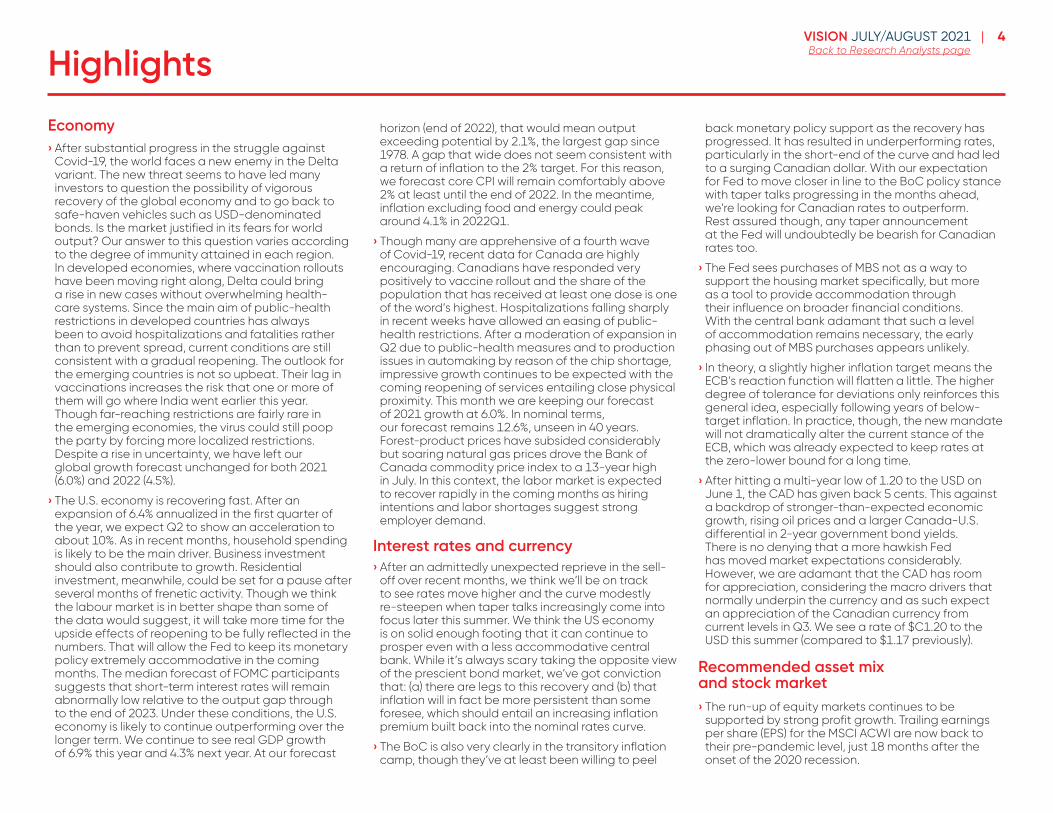
Covid-19, the world faces a new enemy in the Delta variant. The new threat seems to have led many investors to question the possibility of vigorous recovery of the global economy and to go back to safe-haven vehicles such as USD-denominated bonds. Is the market justified in its fears for world output? Our answer to this question varies according to the degree of immunity attained in each region. In developed economies, where vaccination rollouts have been moving right along, Delta could bring a rise in new cases without overwhelming health-care systems. Since the main aim of public-health restrictions in developed countries has always been to avoid hospitalizations and fatalities rather than to prevent spread, current conditions are still consistent with a gradual reopening. The outlook for the emerging countries is not so upbeat. Their lag in vaccinations increases the risk that one or more of them will go where India went earlier this year. Though far-reaching restrictions are fairly rare in the emerging economies, the virus could still poop the party by forcing more localized restrictions. Despite a rise in uncertainty, we have left our global growth forecast unchanged for both 2021 (6.0%) and 2022 (4.5%).
› The U.S. economy is recovering fast. After an expansion of 6.4% annualized in the first quarter of the year, we expect Q2 to show an acceleration to about 10%. As in recent months, household spending is likely to be the main driver. Business investment should also contribute to growth. Residential investment, meanwhile, could be set for a pause after several months of frenetic activity. Though we think the labour market is in better shape than some of the data would suggest, it will take more time for the upside effects of reopening to be fully reflected in the numbers. That will allow the Fed to keep its monetary policy extremely accommodative in the coming months. The median forecast of FOMC participants suggests that short-term interest rates will remain abnormally low relative to the output gap through to the end of 2023. Under these conditions, the U.S. economy is likely to continue outperforming over the longer term. We continue to see real GDP growth of 6.9% this year and 4.3% next year. At our forecast
horizon (end of 2022), that would mean output exceeding potential by 2.1%, the largest gap since 1978. A gap that wide does not seem consistent with a return of inflation to the 2% target. For this reason, we forecast core CPI will remain comfortably above 2% at least until the end of 2022. In the meantime, inflation excluding food and energy could peak around 4.1% in 2022Q1.
› Though many are apprehensive of a fourth wave of Covid-19, recent data for Canada are highly encouraging. Canadians have responded very positively to vaccine rollout and the share of the population that has received at least one dose is one of the word’s highest. Hospitalizations falling sharply in recent weeks have allowed an easing of public-health restrictions. After a moderation of expansion in Q2 due to public-health measures and to production issues in automaking by reason of the chip shortage, impressive growth continues to be expected with the coming reopening of services entailing close physical proximity. This month we are keeping our forecast of 2021 growth at 6.0%. In nominal terms, our forecast remains 12.6%, unseen in 40 years. Forest-product prices have subsided considerably but soaring natural gas prices drove the Bank of Canada commodity price index to a 13-year high in July. In this context, the labor market is expected to recover rapidly in the coming months as hiring intentions and labor shortages suggest strong employer demand.
Interest rates and currency› After an admittedly unexpected reprieve in the sell-
off over recent months, we think we’ll be on track to see rates move higher and the curve modestly re-steepen when taper talks increasingly come into focus later this summer. We think the US economy is on solid enough footing that it can continue to prosper even with a less accommodative central bank. While it’s always scary taking the opposite view of the prescient bond market, we’ve got conviction that: (a) there are legs to this recovery and (b) that inflation will in fact be more persistent than some foresee, which should entail an increasing inflation premium built back into the nominal rates curve.
› The BoC is also very clearly in the transitory inflation camp, though they’ve at least been willing to peel
back monetary policy support as the recovery has progressed. It has resulted in underperforming rates, particularly in the short-end of the curve and had led to a surging Canadian dollar. With our expectation for Fed to move closer in line to the BoC policy stance with taper talks progressing in the months ahead, we’re looking for Canadian rates to outperform. Rest assured though, any taper announcement at the Fed will undoubtedly be bearish for Canadian rates too.
› The Fed sees purchases of MBS not as a way to support the housing market specifically, but more as a tool to provide accommodation through their influence on broader financial conditions. With the central bank adamant that such a level of accommodation remains necessary, the early phasing out of MBS purchases appears unlikely.
› In theory, a slightly higher inflation target means the ECB’s reaction function will flatten a little. The higher degree of tolerance for deviations only reinforces this general idea, especially following years of below-target inflation. In practice, though, the new mandate will not dramatically alter the current stance of the ECB, which was already expected to keep rates at the zero-lower bound for a long time.
› After hitting a multi-year low of 1.20 to the USD on June 1, the CAD has given back 5 cents. This against a backdrop of stronger-than-expected economic growth, rising oil prices and a larger Canada-U.S. differential in 2-year government bond yields. There is no denying that a more hawkish Fed has moved market expectations considerably. However, we are adamant that the CAD has room for appreciation, considering the macro drivers that normally underpin the currency and as such expect an appreciation of the Canadian currency from current levels in Q3. We see a rate of $C1.20 to the USD this summer (compared to $1.17 previously).
Recommended asset mix and stock market› The run-up of equity markets continues to be
supported by strong profit growth. Trailing earnings per share (EPS) for the MSCI ACWI are now back to their pre-pandemic level, just 18 months after the onset of the 2020 recession.
5VISION JULY/AUGUST 2021 |Back to Research Analysts pageHighlights
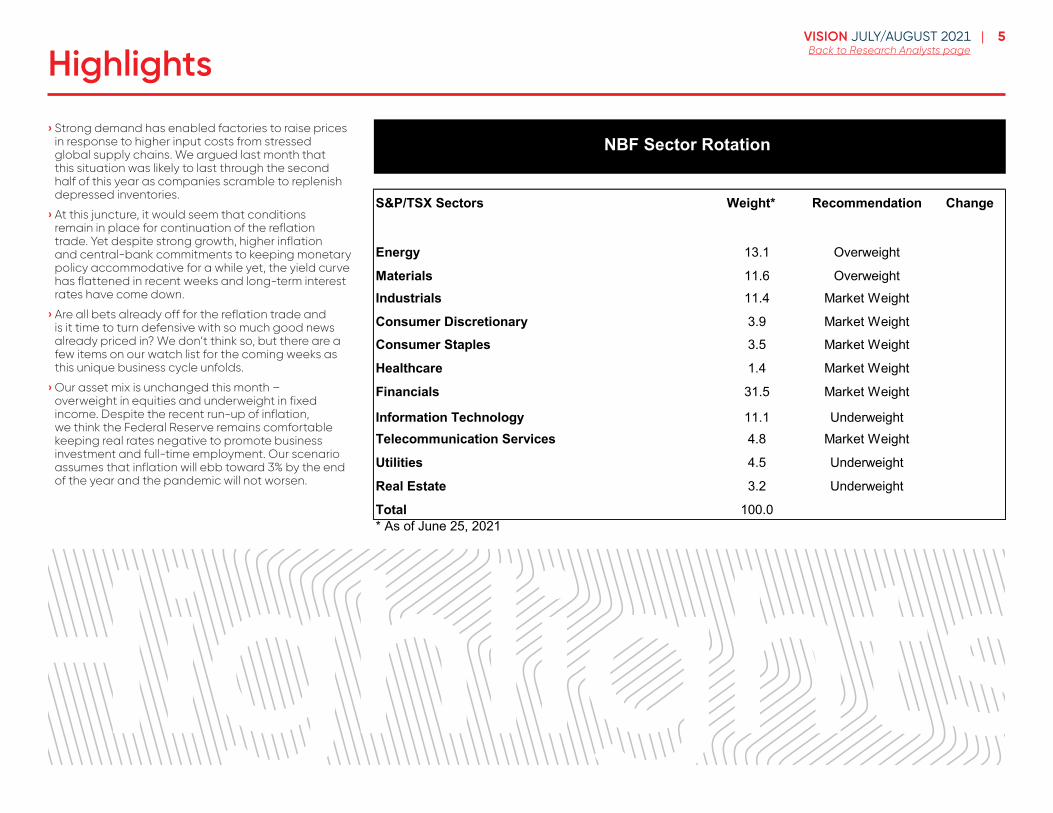
› Strong demand has enabled factories to raise prices in response to higher input costs from stressed global supply chains. We argued last month that this situation was likely to last through the second half of this year as companies scramble to replenish depressed inventories.
› At this juncture, it would seem that conditions remain in place for continuation of the reflation trade. Yet despite strong growth, higher inflation and central-bank commitments to keeping monetary policy accommodative for a while yet, the yield curve has flattened in recent weeks and long-term interest rates have come down.
› Are all bets already off for the reflation trade and is it time to turn defensive with so much good news already priced in? We don’t think so, but there are a few items on our watch list for the coming weeks as this unique business cycle unfolds.
› Our asset mix is unchanged this month – overweight in equities and underweight in fixed income. Despite the recent run-up of inflation, we think the Federal Reserve remains comfortable keeping real rates negative to promote business investment and full-time employment. Our scenario assumes that inflation will ebb toward 3% by the end of the year and the pandemic will not worsen.
S&P/TSX Sectors Weight* Recommendation Change
Energy 13.1 Overweight
Materials 11.6 OverweightIndustrials 11.4 Market Weight
Consumer Discretionary 3.9 Market Weight
Consumer Staples 3.5 Market Weight
Healthcare 1.4 Market Weight
Financials 31.5 Market Weight
Information Technology 11.1 UnderweightTelecommunication Services 4.8 Market Weight
Utilities 4.5 Underweight
Real Estate 3.2 Underweight
Total 100.0* As of June 25, 2021
NBF Sector Rotation
Highlights
6VISION JULY/AUGUST 2021 |Back to Research Analysts pageThe Economy
The Economy
7VISION JULY/AUGUST 2021 |Back to Research Analysts pageThe Economy
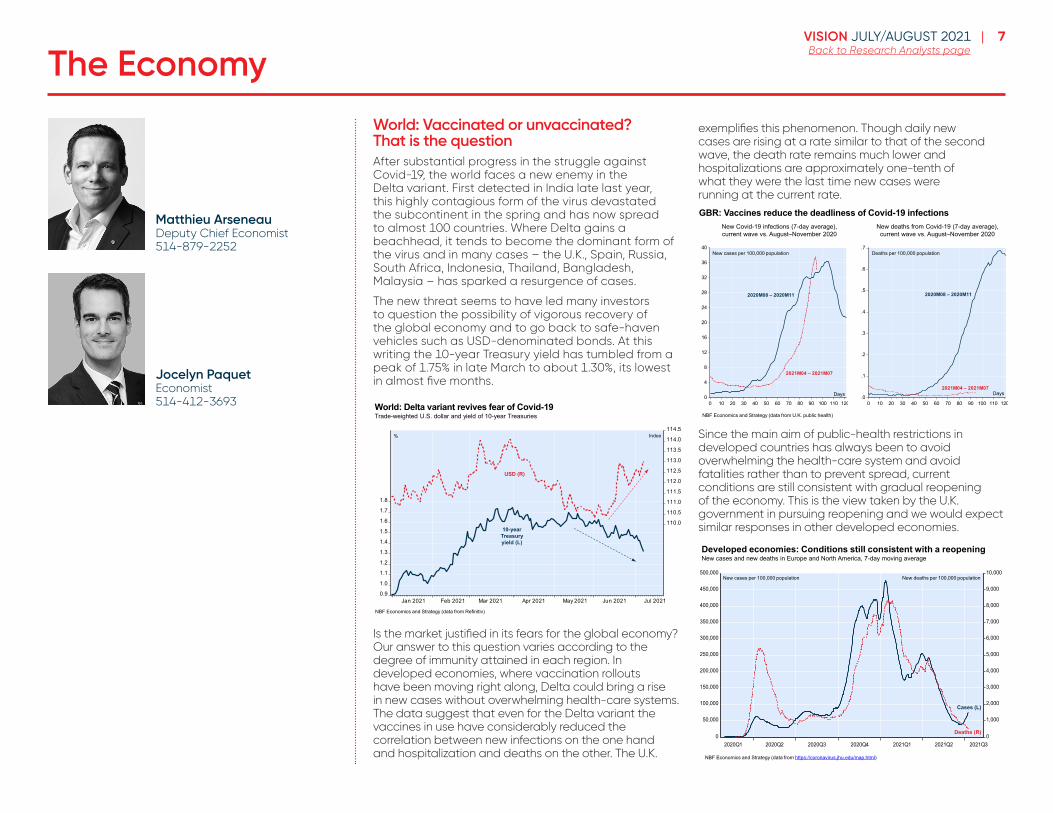
World: Vaccinated or unvaccinated? That is the questionAfter substantial progress in the struggle against Covid-19, the world faces a new enemy in the Delta variant. First detected in India late last year, this highly contagious form of the virus devastated the subcontinent in the spring and has now spread to almost 100 countries. Where Delta gains a beachhead, it tends to become the dominant form of the virus and in many cases – the U.K., Spain, Russia, South Africa, Indonesia, Thailand, Bangladesh, Malaysia – has sparked a resurgence of cases.
The new threat seems to have led many investors to question the possibility of vigorous recovery of the global economy and to go back to safe-haven vehicles such as USD-denominated bonds. At this writing the 10-year Treasury yield has tumbled from a peak of 1.75% in late March to about 1.30%, its lowest in almost five months.
0.9
1.0
1.1
1.2
1.3
1.4
1.5
1.6
1.7
1.8
110.0
110.5
111.0
111.5
112.0
112.5
113.0
113.5
114.0
114.5
Jan 2021 Feb 2021 Mar 2021 Apr 2021 May 2021 Jun 2021 Jul 2021
World: Delta variant revives fear of Covid-19Trade-weighted U.S. dollar and yield of 10-year Treasuries
NBF Economics and Strategy (data from Refinitiv)
%
USD (R)
10-year Treasury yield (L)
Index
Is the market justified in its fears for the global economy? Our answer to this question varies according to the degree of immunity attained in each region. In developed economies, where vaccination rollouts have been moving right along, Delta could bring a rise in new cases without overwhelming health-care systems. The data suggest that even for the Delta variant the vaccines in use have considerably reduced the correlation between new infections on the one hand and hospitalization and deaths on the other. The U.K.
exemplifies this phenomenon. Though daily new cases are rising at a rate similar to that of the second wave, the death rate remains much lower and hospitalizations are approximately one-tenth of what they were the last time new cases were running at the current rate.
0
4
8
12
16
20
24
28
32
36
40
0 10 20 30 40 50 60 70 80 90 100 110 120.0
.1
.2
.3
.4
.5
.6
.7
0 10 20 30 40 50 60 70 80 90 100 110 120
GBR: Vaccines reduce the deadliness of Covid-19 infectionsNew deaths from Covid-19 (7-day average),
current wave vs. August–November 2020New Covid-19 infections (7-day average),current wave vs. August–November 2020
New cases per 100,000 population
NBF Economics and Strategy (data from U.K. public health)
Deaths per 100,000 population
2021M04 – 2021M07
2020M08 – 2020M11
Days Days
2020M08 – 2020M11
2021M04 – 2021M07
Since the main aim of public-health restrictions in developed countries has always been to avoid overwhelming the health-care system and avoid fatalities rather than to prevent spread, current conditions are still consistent with gradual reopening of the economy. This is the view taken by the U.K. government in pursuing reopening and we would expect similar responses in other developed economies.
0
50,000
100,000
150,000
200,000
250,000
300,000
350,000
400,000
450,000
500,000
0
1,000
2,000
3,000
4,000
5,000
6,000
7,000
8,000
9,000
10,000
2020Q1 2020Q2 2020Q3 2020Q4 2021Q1 2021Q2 2021Q3
Developed economies: Conditions still consistent with a reopeningNew cases and new deaths in Europe and North America, 7-day moving average
New cases per 100,000 population New deaths per 100,000 population
Cases (L)
Deaths (R)
NBF Economics and Strategy (data from https://coronavirus.jhu.edu/map.html)
Matthieu ArseneauDeputy Chief Economist514-879-2252
Jocelyn PaquetEconomist514-412-3693
8VISION JULY/AUGUST 2021 |Back to Research Analysts pageThe Economy
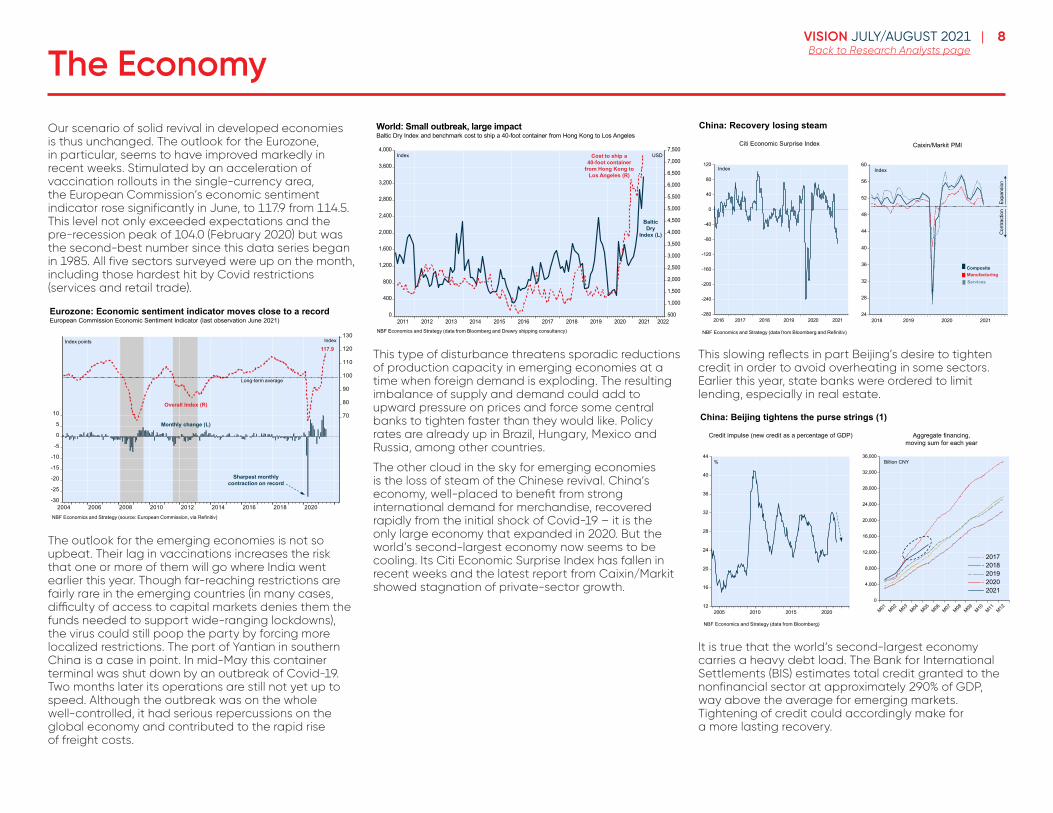
Our scenario of solid revival in developed economies is thus unchanged. The outlook for the Eurozone, in particular, seems to have improved markedly in recent weeks. Stimulated by an acceleration of vaccination rollouts in the single-currency area, the European Commission’s economic sentiment indicator rose significantly in June, to 117.9 from 114.5. This level not only exceeded expectations and the pre-recession peak of 104.0 (February 2020) but was the second-best number since this data series began in 1985. All five sectors surveyed were up on the month, including those hardest hit by Covid restrictions (services and retail trade).
-30
-25
-20
-15
-10
-5
0
5
10 70
80
90
100
110
120
130
2004 2006 2008 2010 2012 2014 2016 2018 2020
Eurozone: Economic sentiment indicator moves close to a record European Commission Economic Sentiment Indicator (last observation June 2021)
Index points
NBF Economics and Strategy (source: European Commission, via Refinitiv)
117.9
Sharpest monthly contraction on record
Monthly change (L)
Overall Index (R)
Index
Long-term average
The outlook for the emerging economies is not so upbeat. Their lag in vaccinations increases the risk that one or more of them will go where India went earlier this year. Though far-reaching restrictions are fairly rare in the emerging countries (in many cases, difficulty of access to capital markets denies them the funds needed to support wide-ranging lockdowns), the virus could still poop the party by forcing more localized restrictions. The port of Yantian in southern China is a case in point. In mid-May this container terminal was shut down by an outbreak of Covid-19. Two months later its operations are still not yet up to speed. Although the outbreak was on the whole well-controlled, it had serious repercussions on the global economy and contributed to the rapid rise of freight costs.
0
400
800
1,200
1,600
2,000
2,400
2,800
3,200
3,600
4,000
500
1,000
1,500
2,000
2,500
3,000
3,500
4,000
4,500
5,000
5,500
6,000
6,500
7,000
7,500
2011 2012 2013 2014 2015 2016 2017 2018 2019 2020 2021 2022
World: Small outbreak, large impactBaltic Dry Index and benchmark cost to ship a 40-foot container from Hong Kong to Los Angeles
NBF Economics and Strategy (data from Bloomberg and Drewry shipping consultancy)
Index Cost to ship a 40-foot container
from Hong Kong to Los Angeles (R)
Baltic Dry
Index (L)
USD
This type of disturbance threatens sporadic reductions of production capacity in emerging economies at a time when foreign demand is exploding. The resulting imbalance of supply and demand could add to upward pressure on prices and force some central banks to tighten faster than they would like. Policy rates are already up in Brazil, Hungary, Mexico and Russia, among other countries.
The other cloud in the sky for emerging economies is the loss of steam of the Chinese revival. China’s economy, well-placed to benefit from strong international demand for merchandise, recovered rapidly from the initial shock of Covid-19 – it is the only large economy that expanded in 2020. But the world’s second-largest economy now seems to be cooling. Its Citi Economic Surprise Index has fallen in recent weeks and the latest report from Caixin/Markit showed stagnation of private-sector growth.
-280
-240
-200
-160
-120
-80
-40
0
40
80
120
2016 2017 2018 2019 2020 202124
28
32
36
40
44
48
52
56
60
2018 2019 2020 2021
China: Recovery losing steam
Caixin/Markit PMICiti Economic Surprise Index
Index
NBF Economics and Strategy (data from Bloomberg and Refinitiv)
Index
Expa
nsio
nC
ontra
ctio
n
ManufacturingComposite
Services
This slowing reflects in part Beijing’s desire to tighten credit in order to avoid overheating in some sectors. Earlier this year, state banks were ordered to limit lending, especially in real estate.
0
4,000
8,000
12,000
16,000
20,000
24,000
28,000
32,000
36,000
M01 M02 M03 M04 M05 M06 M07 M08 M09 M10 M11 M12
20172018201920202021
12
16
20
24
28
32
36
40
44
2005 2010 2015 2020
China: Beijing tightens the purse strings (1)
Aggregate financing,moving sum for each year
Credit impulse (new credit as a percentage of GDP)
%
NBF Economics and Strategy (data from Bloomberg)
Billion CNY
It is true that the world’s second-largest economy carries a heavy debt load. The Bank for International Settlements (BIS) estimates total credit granted to the nonfinancial sector at approximately 290% of GDP, way above the average for emerging markets. Tightening of credit could accordingly make for a more lasting recovery.
9VISION JULY/AUGUST 2021 |Back to Research Analysts pageThe Economy
0
20
40
60
80
100
120
140
160
180
200
220
240
260
280
300
2002 2004 2006 2008 2010 2012 2014 2016 2018 2020 2022
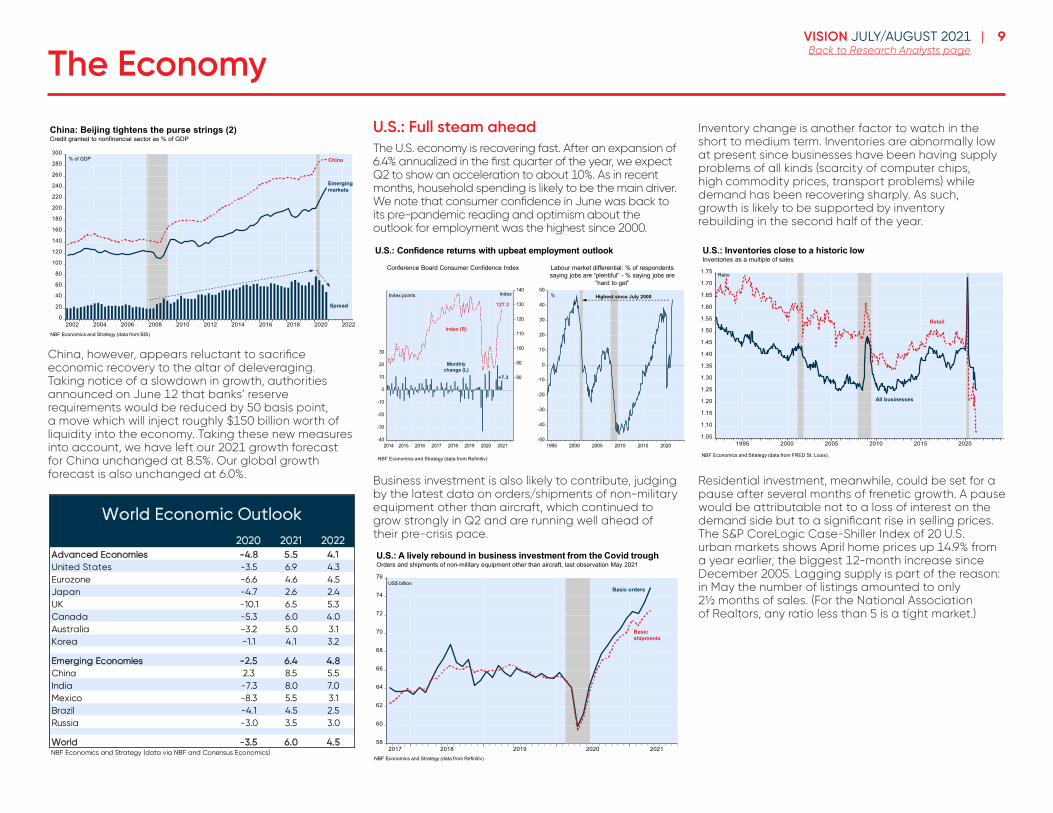
China: Beijing tightens the purse strings (2)Credit granted to nonfinancial sector as % of GDP
NBF Economics and Strategy (data from BIS)
% of GDP China
Emerging markets
Spread
China, however, appears reluctant to sacrifice economic recovery to the altar of deleveraging. Taking notice of a slowdown in growth, authorities announced on June 12 that banks’ reserve requirements would be reduced by 50 basis point, a move which will inject roughly $150 billion worth of liquidity into the economy. Taking these new measures into account, we have left our 2021 growth forecast for China unchanged at 8.5%. Our global growth forecast is also unchanged at 6.0%.
4
Economics and Strategy
Monthly Economic Monitor
China, however, appears reluctant to sacrifice economic recovery to the altar of deleveraging. Taking notice of a slowdown in growth, authorities announced on June 12 that banks’ reserve requirements would be reduced by 50 basis point, a move which will inject roughly $150 billion worth of liquidity into the economy. Taking these new measures into account, we have left our 2021 growth forecast for China unchanged at 8.5%. Our global growth forecast is also unchanged at 6.0%.
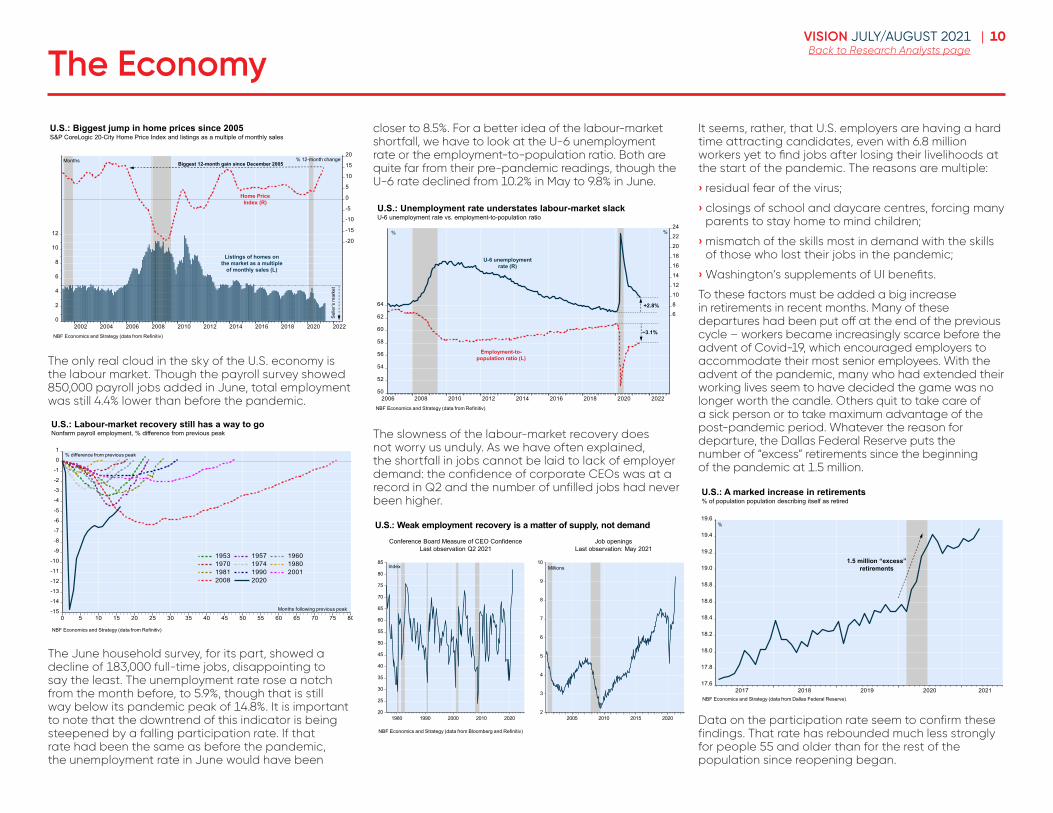
U.S.: Full steam ahead The U.S. economy is recovering fast. After an expansion of 6.4% annualized in the first quarter of the year, we expect Q2 to show an acceleration to about 10%. As in recent months, household spending is likely to be the main driver. We note that consumer confidence in June was back to its pre-pandemic reading and optimism about the outlook for employment was the highest since 2000.
Business investment is also likely to contribute, judging by the latest data on orders/shipments of non-military equipment other than aircraft, which continued to grow strongly in Q2 and are running well ahead of their pre-crisis pace.
Inventory change is another factor to watch in the short to medium term. Inventories are abnormally low at present since businesses have been having supply problems of all kinds (scarcity of computer chips, high commodity prices, transport problems) while demand has been recovering sharply. As such, growth is likely to be supported by inventory rebuilding in the second half of the year.
0
20
40
60
80
100
120
140
160
180
200
220
240
260
280
300
2002 2004 2006 2008 2010 2012 2014 2016 2018 2020 2022
China: Beijing tightens the purse strings (2)Credit granted to nonfinancial sector as % of GDP
NBF Economics and Strategy (data from BIS)
% of GDP China
Emerging markets
Spread
2020 2021 2022Advanced Economies -4.8 5.5 4.1United States -3.5 6.9 4.3Eurozone -6.6 4.6 4.5Japan -4.7 2.6 2.4UK -10.1 6.5 5.3Canada -5.3 6.0 4.0Australia -3.2 5.0 3.1Korea -1.1 4.1 3.2
Emerging Economies -2.5 6.4 4.8China 2.3 8.5 5.5India -7.3 8.0 7.0Mexico -8.3 5.5 3.1Brazil -4.1 4.5 2.5Russia -3.0 3.5 3.0
World -3.5 6.0 4.5NBF Economics and Strategy (data via NBF and Conensus Economics)
World Economic Outlook
-50
-40
-30
-20
-10
0
10
20
30
40
50
1995 2000 2005 2010 2015 2020-40
-30
-20
-10
0
10
20
30
80
90
100
110
120
130
140
2014 2015 2016 2017 2018 2019 2020 2021
U.S.: Confidence returns with upbeat employment outlookLabour market differential: % of respondents saying jobs are “plentiful” - % saying jobs are
“hard to get”
Conference Board Consumer Confidence Index
Index points %
127.3
Index
+7.3
Highest since July 2000
NBF Economics and Strategy (data from Refinitiv)
Index (R)
Monthly change (L)
58
60
62
64
66
68
70
72
74
76
2017 2018 2019 2020 2021
U.S.: A lively rebound in business investment from the Covid troughOrders and shipments of non-military equipment other than aircraft, last observation May 2021
US$ billionBasic orders
Basic shipments
NBF Economics and Strategy (data from Refinitiv)
U .S .: Full steam aheadThe U.S. economy is recovering fast. After an expansion of 6.4% annualized in the first quarter of the year, we expect Q2 to show an acceleration to about 10%. As in recent months, household spending is likely to be the main driver. We note that consumer confidence in June was back to its pre-pandemic reading and optimism about the outlook for employment was the highest since 2000.
-50
-40
-30
-20
-10
0
10
20
30
40
50
1995 2000 2005 2010 2015 2020-40
-30
-20
-10
0
10
20
30
80
90
100
110
120
130
140
2014 2015 2016 2017 2018 2019 2020 2021
U.S.: Confidence returns with upbeat employment outlook
Labour market differential: % of respondents saying jobs are “plentiful” - % saying jobs are
“hard to get”
Conference Board Consumer Confidence Index
Index points %
127.3
Index
+7.3
Highest since July 2000
NBF Economics and Strategy (data from Refinitiv)
Index (R)
Monthly change (L)
Business investment is also likely to contribute, judging by the latest data on orders/shipments of non-military equipment other than aircraft, which continued to grow strongly in Q2 and are running well ahead of their pre-crisis pace.
58
60
62
64
66
68
70
72
74
76
2017 2018 2019 2020 2021
U.S.: A lively rebound in business investment from the Covid troughOrders and shipments of non-military equipment other than aircraft, last observation May 2021
US$ billionBasic orders
Basic shipments
NBF Economics and Strategy (data from Refinitiv)
Inventory change is another factor to watch in the short to medium term. Inventories are abnormally low at present since businesses have been having supply problems of all kinds (scarcity of computer chips, high commodity prices, transport problems) while demand has been recovering sharply. As such, growth is likely to be supported by inventory rebuilding in the second half of the year.
1.05
1.10
1.15
1.20
1.25
1.30
1.35
1.40
1.45
1.50
1.55
1.60
1.65
1.70
1.75
1995 2000 2005 2010 2015 2020
U.S.: Inventories close to a historic lowInventories as a multiple of sales
Ratio
NBF Economics and Strategy (data from FRED St. Louis)
All businesses
Retail
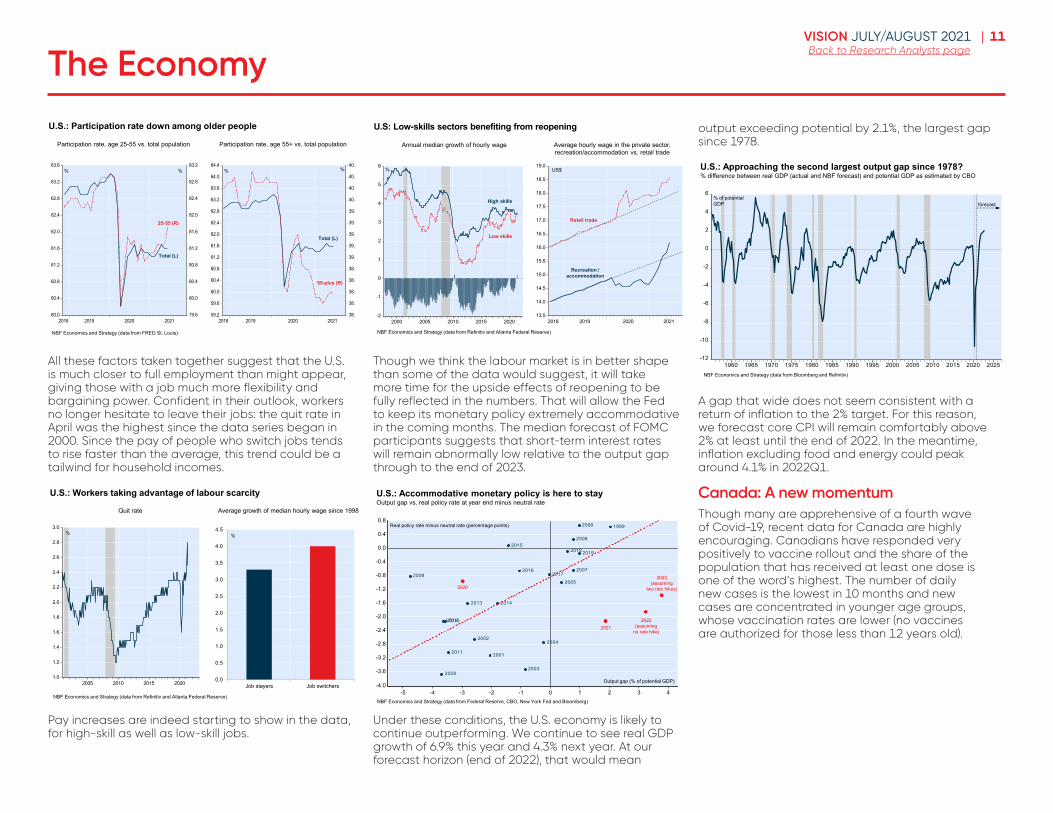
Residential investment, meanwhile, could be set for a pause after several months of frenetic growth. A pause would be attributable not to a loss of interest on the demand side but to a significant rise in selling prices. The S&P CoreLogic Case-Shiller Index of 20 U.S. urban markets shows April home prices up 14.9% from a year earlier, the biggest 12-month increase since December 2005. Lagging supply is part of the reason: in May the number of listings amounted to only 2½ months of sales. (For the National Association of Realtors, any ratio less than 5 is a tight market.)
10VISION JULY/AUGUST 2021 |Back to Research Analysts pageThe Economy
0
2
4
6
8
10
12-20
-15
-10
-5
0
5
10
15
20
2002 2004 2006 2008 2010 2012 2014 2016 2018 2020 2022
U.S.: Biggest jump in home prices since 2005S&P CoreLogic 20-City Home Price Index and listings as a multiple of monthly sales
Months
Home Price Index (R)
Listings of homes on the market as a multiple
of monthly sales (L)
% 12-month change
Selle
r’s m
arke
t
Biggest 12-month gain since December 2005
NBF Economics and Strategy (data from Refinitiv)
The only real cloud in the sky of the U.S. economy is the labour market. Though the payroll survey showed 850,000 payroll jobs added in June, total employment was still 4.4% lower than before the pandemic.
-15
-14
-13
-12
-11
-10
-9
-8
-7
-6
-5
-4
-3
-2
-1
0
1
0 5 10 15 20 25 30 35 40 45 50 55 60 65 70 75 80
1953 1957 19601970 1974 19801981 1990 20012008 2020
% difference from previous peak
Months following previous peak
U.S.: Labour-market recovery still has a way to goNonfarm payroll employment, % difference from previous peak
NBF Economics and Strategy (data from Refinitiv)
The June household survey, for its part, showed a decline of 183,000 full-time jobs, disappointing to say the least. The unemployment rate rose a notch from the month before, to 5.9%, though that is still way below its pandemic peak of 14.8%. It is important to note that the downtrend of this indicator is being steepened by a falling participation rate. If that rate had been the same as before the pandemic, the unemployment rate in June would have been
closer to 8.5%. For a better idea of the labour-market shortfall, we have to look at the U-6 unemployment rate or the employment-to-population ratio. Both are quite far from their pre-pandemic readings, though the U-6 rate declined from 10.2% in May to 9.8% in June.
50
52
54
56
58
60
62
64
6 8
10
12 14
16
18
20
22 24
2006 2008 2010 2012 2014 2016 2018 2020 2022
U.S.: Unemployment rate understates labour-market slackU-6 unemployment rate vs. employment-to-population ratio
%
Employment-to-population ratio (L)
U-6 unemployment rate (R)
+2.8%
−3.1%
%
NBF Economics and Strategy (data from Refinitiv)
The slowness of the labour-market recovery does not worry us unduly. As we have often explained, the shortfall in jobs cannot be laid to lack of employer demand: the confidence of corporate CEOs was at a record in Q2 and the number of unfilled jobs had never been higher.
2
3
4
5
6
7
8
9
10
2005 2010 2015 202020
25
30
35
40
45
50
55
60
65
70
75
80
85
1980 1990 2000 2010 2020
U.S.: Weak employment recovery is a matter of supply, not demandJob openings
Last observation: May 2021Conference Board Measure of CEO Confidence
Last observation Q2 2021
Index Millions
NBF Economics and Strategy (data from Bloomberg and Refinitiv)
It seems, rather, that U.S. employers are having a hard time attracting candidates, even with 6.8 million workers yet to find jobs after losing their livelihoods at the start of the pandemic. The reasons are multiple:
› residual fear of the virus;
› closings of school and daycare centres, forcing many parents to stay home to mind children;
› mismatch of the skills most in demand with the skills of those who lost their jobs in the pandemic;
› Washington’s supplements of UI benefits.
To these factors must be added a big increase in retirements in recent months. Many of these departures had been put off at the end of the previous cycle – workers became increasingly scarce before the advent of Covid-19, which encouraged employers to accommodate their most senior employees. With the advent of the pandemic, many who had extended their working lives seem to have decided the game was no longer worth the candle. Others quit to take care of a sick person or to take maximum advantage of the post-pandemic period. Whatever the reason for departure, the Dallas Federal Reserve puts the number of “excess” retirements since the beginning of the pandemic at 1.5 million.
17.6
17.8
18.0
18.2
18.4
18.6
18.8
19.0
19.2
19.4
19.6
2017 2018 2019 2020 2021
U.S.: A marked increase in retirements% of population population describing itself as retired
%
NBF Economics and Strategy (data from Dallas Federal Reserve)
1.5 million “excess” retirements
Data on the participation rate seem to confirm these findings. That rate has rebounded much less strongly for people 55 and older than for the rest of the population since reopening began.
11VISION JULY/AUGUST 2021 |Back to Research Analysts pageThe Economy
60.0
60.4
60.8
61.2
61.6
62.0
62.4
62.8
63.2
63.6
79.6
80.0
80.4
80.8
81.2
81.6
82.0
82.4
82.8
83.2
2018 2019 2020 202159.2
59.6
60.0
60.4
60.8
61.2
61.6
62.0
62.4
62.8
63.2
63.6
64.0
64.4
38.0
38.2
38.4
38.6
38.8
39.0
39.2
39.4
39.6
39.8
40.0
40.2
40.4
40.6
2018 2019 2020 2021
U.S.: Participation rate down among older people
Participation rate, age 55+ vs. total populationParticipation rate, age 25-55 vs. total population
%
NBF Economics and Strategy (data from FRED St. Louis)
% %%
55-plus (R)
Total (L)
Total (L)
25-55 (R)
All these factors taken together suggest that the U.S. is much closer to full employment than might appear, giving those with a job much more flexibility and bargaining power. Confident in their outlook, workers no longer hesitate to leave their jobs: the quit rate in April was the highest since the data series began in 2000. Since the pay of people who switch jobs tends to rise faster than the average, this trend could be a tailwind for household incomes.
0.0
0.5
1.0
1.5
2.0
2.5
3.0
3.5
4.0
4.5
Job stayers Job switchers1.0
1.2
1.4
1.6
1.8
2.0
2.2
2.4
2.6
2.8
3.0
2005 2010 2015 2020
U.S.: Workers taking advantage of labour scarcity
Average growth of median hourly wage since 1998Quit rate
%
NBF Economics and Strategy (data from Refinitiv and Atlanta Federal Reserve)
%
Pay increases are indeed starting to show in the data, for high-skill as well as low-skill jobs.
13.5
14.0
14.5
15.0
15.5
16.0
16.5
17.0
17.5
18.0
18.5
19.0
2018 2019 2020 2021-2
-1
0
1
2
3
4
5
6
2000 2005 2010 2015 2020
U.S: Low-skills sectors benefiting from reopening
Average hourly wage in the private sector, recreation/accommodation vs. retail trade
Annual median growth of hourly wage
% US$
High skills
Low skills
Retail trade
Recreation / accommodation
NBF Economics and Strategy (data from Refinitiv and Atlanta Federal Reserve)
Though we think the labour market is in better shape than some of the data would suggest, it will take more time for the upside effects of reopening to be fully reflected in the numbers. That will allow the Fed to keep its monetary policy extremely accommodative in the coming months. The median forecast of FOMC participants suggests that short-term interest rates will remain abnormally low relative to the output gap through to the end of 2023.
-4.0
-3.6
-3.2
-2.8
-2.4
-2.0
-1.6
-1.2
-0.8
-0.4
0.0
0.4
0.8
-5 -4 -3 -2 -1 0 1 2 3 4
19992000
2001
2002
2003
2004
2005
2006
2007
2008
2009
2010
2011
2012
2013 2014
2015
20162017
2018 2019
U.S.: Accommodative monetary policy is here to stayOutput gap vs. real policy rate at year end minus neutral rate
Output gap (% of potential GDP)
Real policy rate minus neutral rate (percentage points)
2020
20212022
(assuming no rate hike)
NBF Economics and Strategy (data from Federal Reserve, CBO, New York Fed and Bloomberg)
2023(assuming
two rate hikes)
Under these conditions, the U.S. economy is likely to continue outperforming. We continue to see real GDP growth of 6.9% this year and 4.3% next year. At our forecast horizon (end of 2022), that would mean
output exceeding potential by 2.1%, the largest gap since 1978.
-12
-10
-8
-6
-4
-2
0
2
4
6
1960 1965 1970 1975 1980 1985 1990 1995 2000 2005 2010 2015 2020 2025
U.S.: Approaching the second largest output gap since 1978?% difference between real GDP (actual and NBF forecast) and potential GDP as estimated by CBO
% of potential GDP forecast
NBF Economics and Strategy (data from Bloomberg and Refinitiv)
A gap that wide does not seem consistent with a return of inflation to the 2% target. For this reason, we forecast core CPI will remain comfortably above 2% at least until the end of 2022. In the meantime, inflation excluding food and energy could peak around 4.1% in 2022Q1.
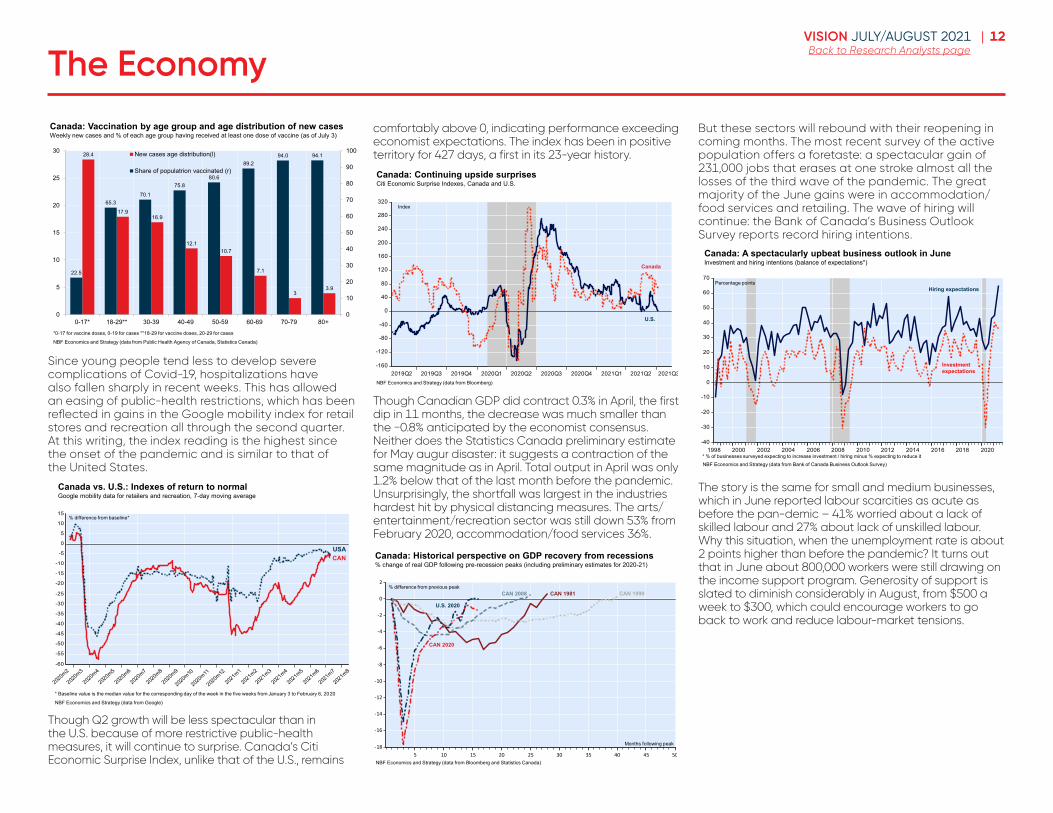
Canada: A new momentumThough many are apprehensive of a fourth wave of Covid-19, recent data for Canada are highly encouraging. Canadians have responded very positively to vaccine rollout and the share of the population that has received at least one dose is one of the word’s highest. The number of daily new cases is the lowest in 10 months and new cases are concentrated in younger age groups, whose vaccination rates are lower (no vaccines are authorized for those less than 12 years old).
12VISION JULY/AUGUST 2021 |Back to Research Analysts pageThe Economy
28.4
17.916.9
12.110.7
7.1
33.9
22.5
65.370.1
75.880.6
89.294.0 94.1
0
10
20
30
40
50
60
70
80
90
100
0
5
10
15
20
25
30
0-17* 18-29** 30-39 40-49 50-59 60-69 70-79 80+
New cases age distribution(l)
Share of populatrion vaccinated (r)
*0-17 for vaccine doses, 0-19 for cases **18-29 for vaccine doses, 20-29 for cases
NBF Economics and Strategy (data from Public Health Agency of Canada, Statistics Canada)
Canada: Vaccination by age group and age distribution of new casesWeekly new cases and % of each age group having received at least one dose of vaccine (as of July 3)
Since young people tend less to develop severe complications of Covid-19, hospitalizations have also fallen sharply in recent weeks. This has allowed an easing of public-health restrictions, which has been reflected in gains in the Google mobility index for retail stores and recreation all through the second quarter. At this writing, the index reading is the highest since the onset of the pandemic and is similar to that of the United States.
-60
-55
-50
-45
-40
-35
-30
-25
-20
-15
-10
-5
0
5
10
15
2020m2
2020m3
2020m4
2020m5
2020m6
2020m7
2020m8
2020m9
2020m10
2020m11
2020m12
2021m1
2021m2
2021m3
2021m4
2021m5
2021m6
2021m7
2021m8
Canada vs. U.S.: Indexes of return to normalGoogle mobility data for retailers and recreation, 7-day moving average
* Baseline value is the median value for the corresponding day of the week in the five weeks from January 3 to February 6, 2020
NBF Economics and Strategy (data from Google)
CANUSA
% difference from baseline*
Though Q2 growth will be less spectacular than in the U.S. because of more restrictive public-health measures, it will continue to surprise. Canada’s Citi Economic Surprise Index, unlike that of the U.S., remains
comfortably above 0, indicating performance exceeding economist expectations. The index has been in positive territory for 427 days, a first in its 23-year history.
-160
-120
-80
-40
0
40
80
120
160
200
240
280
320
2019Q2 2019Q3 2019Q4 2020Q1 2020Q2 2020Q3 2020Q4 2021Q1 2021Q2 2021Q3
Canada: Continuing upside surprisesCiti Economic Surprise Indexes, Canada and U.S.
NBF Economics and Strategy (data from Bloomberg)
U.S.
Canada
Index
Though Canadian GDP did contract 0.3% in April, the first dip in 11 months, the decrease was much smaller than the −0.8% anticipated by the economist consensus. Neither does the Statistics Canada preliminary estimate for May augur disaster: it suggests a contraction of the same magnitude as in April. Total output in April was only 1.2% below that of the last month before the pandemic. Unsurprisingly, the shortfall was largest in the industries hardest hit by physical distancing measures. The arts/entertainment/recreation sector was still down 53% from February 2020, accommodation/food services 36%.
-18
-16
-14
-12
-10
-8
-6
-4
-2
0
2
5 10 15 20 25 30 35 40 45 50
Canada: Historical perspective on GDP recovery from recessions% change of real GDP following pre-recession peaks (including preliminary estimates for 2020-21)
% difference from previous peak
NBF Economics and Strategy (data from Bloomberg and Statistics Canada)
U.S. 2020
CAN 1981CAN 2008 CAN 1990
Months following peak
CAN 2020
But these sectors will rebound with their reopening in coming months. The most recent survey of the active population offers a foretaste: a spectacular gain of 231,000 jobs that erases at one stroke almost all the losses of the third wave of the pandemic. The great majority of the June gains were in accommodation/food services and retailing. The wave of hiring will continue: the Bank of Canada’s Business Outlook Survey reports record hiring intentions.
-40
-30
-20
-10
0
10
20
30
40
50
60
70
1998 2000 2002 2004 2006 2008 2010 2012 2014 2016 2018 2020
Canada: A spectacularly upbeat business outlook in JuneInvestment and hiring intentions (balance of expectations*)
Percentage points
Investment expectations
Hiring expectations
* % of businesses surveyed expecting to increase investment / hiring minus % expecting to reduce it NBF Economics and Strategy (data from Bank of Canada Business Outlook Survey)
The story is the same for small and medium businesses, which in June reported labour scarcities as acute as before the pan-demic – 41% worried about a lack of skilled labour and 27% about lack of unskilled labour. Why this situation, when the unemployment rate is about 2 points higher than before the pandemic? It turns out that in June about 800,000 workers were still drawing on the income support program. Generosity of support is slated to diminish considerably in August, from $500 a week to $300, which could encourage workers to go back to work and reduce labour-market tensions.
13VISION JULY/AUGUST 2021 |Back to Research Analysts pageThe Economy
20
30
40
50
60
70
805
6 7 8 9
10 11 12 13 14
2009 2010 2011 2012 2013 2014 2015 2016 2017 2018 2019 2020 2021
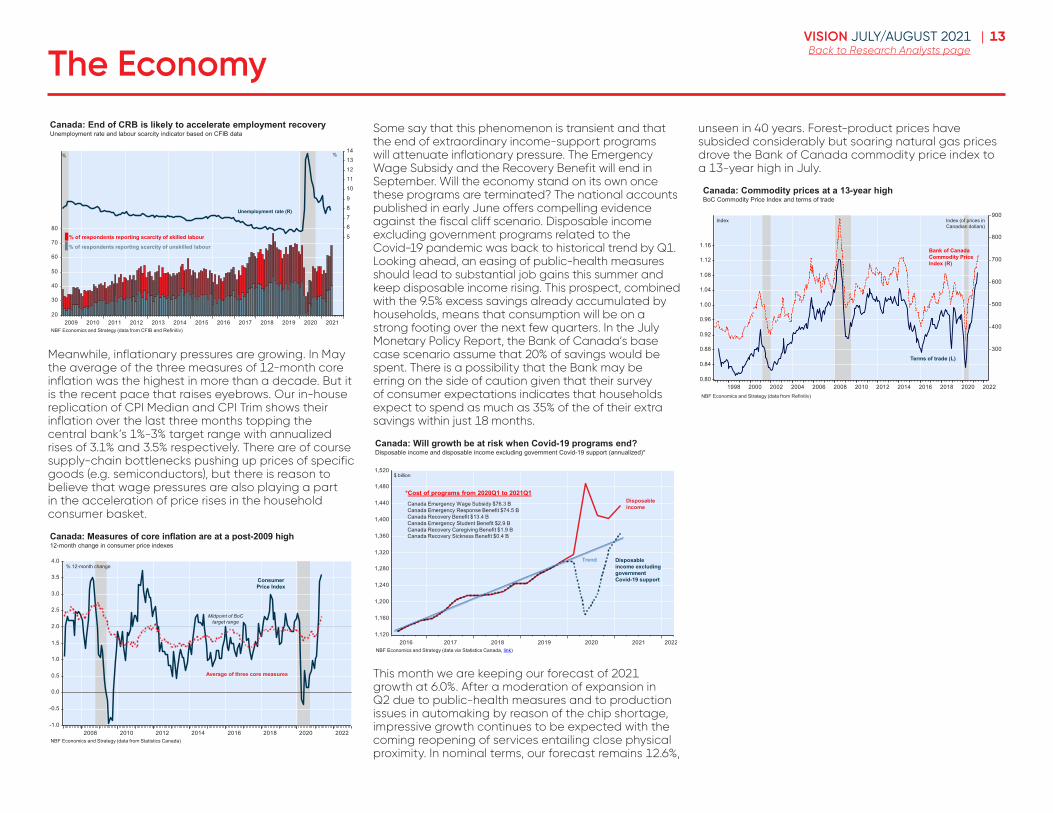
Canada: End of CRB is likely to accelerate employment recoveryUnemployment rate and labour scarcity indicator based on CFIB data
%
% of respondents reporting scarcity of skilled labour
Unemployment rate (R)
NBF Economics and Strategy (data from CFIB and Refinitiv)
%
% of respondents reporting scarcity of unskilled labour
Meanwhile, inflationary pressures are growing. In May the average of the three measures of 12-month core inflation was the highest in more than a decade. But it is the recent pace that raises eyebrows. Our in-house replication of CPI Median and CPI Trim shows their inflation over the last three months topping the central bank’s 1%-3% target range with annualized rises of 3.1% and 3.5% respectively. There are of course supply-chain bottlenecks pushing up prices of specific goods (e.g. semiconductors), but there is reason to believe that wage pressures are also playing a part in the acceleration of price rises in the household consumer basket.
-1.0
-0.5
0.0
0.5
1.0
1.5
2.0
2.5
3.0
3.5
4.0
2008 2010 2012 2014 2016 2018 2020 2022NBF Economics and Strategy (data from Statistics Canada)
Canada: Measures of core inflation are at a post-2009 high12-month change in consumer price indexes
Average of three core measures
Consumer Price Index
Midpoint of BoCtarget range
% 12-month change
Some say that this phenomenon is transient and that the end of extraordinary income-support programs will attenuate inflationary pressure. The Emergency Wage Subsidy and the Recovery Benefit will end in September. Will the economy stand on its own once these programs are terminated? The national accounts published in early June offers compelling evidence against the fiscal cliff scenario. Disposable income excluding government programs related to the Covid-19 pandemic was back to historical trend by Q1. Looking ahead, an easing of public-health measures should lead to substantial job gains this summer and keep disposable income rising. This prospect, combined with the 9.5% excess savings already accumulated by households, means that consumption will be on a strong footing over the next few quarters. In the July Monetary Policy Report, the Bank of Canada’s base case scenario assume that 20% of savings would be spent. There is a possibility that the Bank may be erring on the side of caution given that their survey of consumer expectations indicates that households expect to spend as much as 35% of the of their extra savings within just 18 months.
1,120
1,160
1,200
1,240
1,280
1,320
1,360
1,400
1,440
1,480
1,520
2016 2017 2018 2019 2020 2021 2022
Canada: Will growth be at risk when Covid-19 programs end?Disposable income and disposable income excluding government Covid-19 support (annualized)*
$ billion
NBF Economics and Strategy (data via Statistics Canada, link)
Disposable income
Disposable income excluding government Covid-19 support
Trend
Canada Emergency Wage Subsidy $76.3 BCanada Emergency Response Benefit $74.5 BCanada Recovery Benefit $13.4 BCanada Emergency Student Benefit $2.9 BCanada Recovery Caregiving Benefit $1.9 BCanada Recovery Sickness Benefit $0.4 B
*Cost of programs from 2020Q1 to 2021Q1
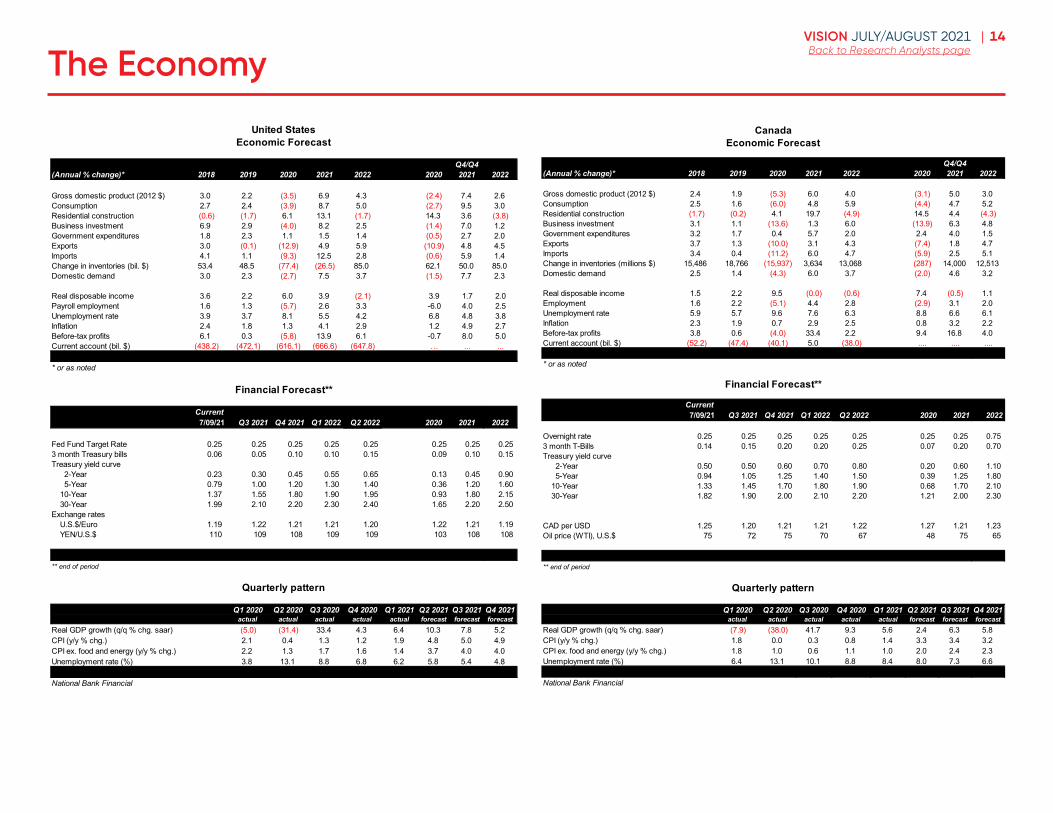
This month we are keeping our forecast of 2021 growth at 6.0%. After a moderation of expansion in Q2 due to public-health measures and to production issues in automaking by reason of the chip shortage, impressive growth continues to be expected with the coming reopening of services entailing close physical proximity. In nominal terms, our forecast remains 12.6%,
unseen in 40 years. Forest-product prices have subsided considerably but soaring natural gas prices drove the Bank of Canada commodity price index to a 13-year high in July.
0.80
0.84
0.88
0.92
0.96
1.00
1.04
1.08
1.12
1.16
300
400
500
600
700
800
900
1998 2000 2002 2004 2006 2008 2010 2012 2014 2016 2018 2020 2022
Canada: Commodity prices at a 13-year highBoC Commodity Price Index and terms of trade
Index
Bank of Canada Commodity Price Index (R)
Terms of trade (L)
NBF Economics and Strategy (data from Refinitiv)
Index (of prices in Canadian dollars)
14VISION JULY/AUGUST 2021 |Back to Research Analysts pageThe Economy
Q4/Q4(Annual % change)* 2018 2019 2020 2021 2022 2006 2020 2021 2022
Gross domestic product (2012 $) 3.0 2.2 (3.5) 6.9 4.3 (2.4) 7.4 2.6Consumption 2.7 2.4 (3.9) 8.7 5.0 (2.7) 9.5 3.0Residential construction (0.6) (1.7) 6.1 13.1 (1.7) 14.3 3.6 (3.8)Business investment 6.9 2.9 (4.0) 8.2 2.5 (1.4) 7.0 1.2Government expenditures 1.8 2.3 1.1 1.5 1.4 (0.5) 2.7 2.0Exports 3.0 (0.1) (12.9) 4.9 5.9 (10.9) 4.8 4.5Imports 4.1 1.1 (9.3) 12.5 2.8 (0.6) 5.9 1.4Change in inventories (bil. $) 53.4 48.5 (77.4) (26.5) 85.0 62.1 50.0 85.0Domestic demand 3.0 2.3 (2.7) 7.5 3.7 (1.5) 7.7 2.3
Real disposable income 3.6 2.2 6.0 3.9 (2.1) 3.9 1.7 2.0Payroll employment 1.6 1.3 (5.7) 2.6 3.3 -6.0 4.0 2.5Unemployment rate 3.9 3.7 8.1 5.5 4.2 6.8 4.8 3.8Inflation 2.4 1.8 1.3 4.1 2.9 1.2 4.9 2.7Before-tax profits 6.1 0.3 (5.8) 13.9 6.1 -0.7 8.0 5.0Current account (bil. $) (438.2) (472.1) (616.1) (666.6) (647.8) … ... ...
-304* or as noted
Current Q4 2020 Q4 2021 Q4 20227/09/21 Q3 2021 Q4 2021 Q1 2022 Q2 2022 2020 2021 2022
Fed Fund Target Rate 0.25 0.25 0.25 0.25 0.25 0.25 0.25 0.25 3 month Treasury bills 0.06 0.05 0.10 0.10 0.15 0.09 0.10 0.15 Treasury yield curve 2-Year 0.23 0.30 0.45 0.55 0.65 0.13 0.45 0.90 5-Year 0.79 1.00 1.20 1.30 1.40 0.36 1.20 1.60 10-Year 1.37 1.55 1.80 1.90 1.95 0.93 1.80 2.15 30-Year 1.99 2.10 2.20 2.30 2.40 1.65 2.20 2.50 Exchange rates U.S.$/Euro 1.19 1.22 1.21 1.21 1.20 1.22 1.21 1.19 YEN/U.S.$ 110 109 108 109 109 103 108 108
** end of period
Q1 2020 Q2 2020 Q3 2020 Q4 2020 Q1 2021 Q2 2021 Q3 2021 Q4 2021actual actual actual actual actual forecast forecast forecast
Real GDP growth (q/q % chg. saar) (5.0) (31.4) 33.4 4.3 6.4 10.3 7.8 5.2CPI (y/y % chg.) 2.1 0.4 1.3 1.2 1.9 4.8 5.0 4.9CPI ex. food and energy (y/y % chg.) 2.2 1.3 1.7 1.6 1.4 3.7 4.0 4.0Unemployment rate (%) 3.8 13.1 8.8 6.8 6.2 5.8 5.4 4.8
National Bank Financial
Financial Forecast**
Quarterly pattern
United StatesEconomic Forecast
Q4/Q4(Annual % change)* 2018 2019 2020 2021 2022 2020 2021 2022
Gross domestic product (2012 $) 2.4 1.9 (5.3) 6.0 4.0 (3.1) 5.0 3.0Consumption 2.5 1.6 (6.0) 4.8 5.9 (4.4) 4.7 5.2Residential construction (1.7) (0.2) 4.1 19.7 (4.9) 14.5 4.4 (4.3)Business investment 3.1 1.1 (13.6) 1.3 6.0 (13.9) 6.3 4.8Government expenditures 3.2 1.7 0.4 5.7 2.0 2.4 4.0 1.5Exports 3.7 1.3 (10.0) 3.1 4.3 (7.4) 1.8 4.7Imports 3.4 0.4 (11.2) 6.0 4.7 (5.9) 2.5 5.1Change in inventories (millions $) 15,486 18,766 (15,937) 3,634 13,068 (287) 14,000 12,513Domestic demand 2.5 1.4 (4.3) 6.0 3.7 (2.0) 4.6 3.2
Real disposable income 1.5 2.2 9.5 (0.0) (0.6) 7.4 (0.5) 1.1Employment 1.6 2.2 (5.1) 4.4 2.8 (2.9) 3.1 2.0Unemployment rate 5.9 5.7 9.6 7.6 6.3 8.8 6.6 6.1Inflation 2.3 1.9 0.7 2.9 2.5 0.8 3.2 2.2Before-tax profits 3.8 0.6 (4.0) 33.4 2.2 9.4 16.8 4.0Current account (bil. $) (52.2) (47.4) (40.1) 5.0 (38.0) .... .... ....
* or as noted
Current Q4 2020 Q4 2021 Q4 20227/09/21 Q3 2021 Q4 2021 Q1 2022 Q2 2022 2020 2021 2022
Overnight rate 0.25 0.25 0.25 0.25 0.25 0.25 0.25 0.75 3 month T-Bills 0.14 0.15 0.20 0.20 0.25 0.07 0.20 0.70 Treasury yield curve 2-Year 0.50 0.50 0.60 0.70 0.80 0.20 0.60 1.10 5-Year 0.94 1.05 1.25 1.40 1.50 0.39 1.25 1.80 10-Year 1.33 1.45 1.70 1.80 1.90 0.68 1.70 2.10 30-Year 1.82 1.90 2.00 2.10 2.20 1.21 2.00 2.30
CAD per USD 1.25 1.20 1.21 1.21 1.22 1.27 1.21 1.23 Oil price (WTI), U.S.$ 75 72 75 70 67 48 75 65
** end of period
Q1 2020 Q2 2020 Q3 2020 Q4 2020 Q1 2021 Q2 2021 Q3 2021 Q4 2021actual actual actual actual actual forecast forecast forecast
Real GDP growth (q/q % chg. saar) (7.9) (38.0) 41.7 9.3 5.6 2.4 6.3 5.8CPI (y/y % chg.) 1.8 0.0 0.3 0.8 1.4 3.3 3.4 3.2CPI ex. food and energy (y/y % chg.) 1.8 1.0 0.6 1.1 1.0 2.0 2.4 2.3Unemployment rate (%) 6.4 13.1 10.1 8.8 8.4 8.0 7.3 6.6
National Bank Financial
CanadaEconomic Forecast
Financial Forecast**
Quarterly pattern
15VISION JULY/AUGUST 2021 |Back to Research Analysts pageThe Economy
Provincial economic forecast2018 2019 2020f 2021f 2022f 2018 2019 2020f 2021f 2022f
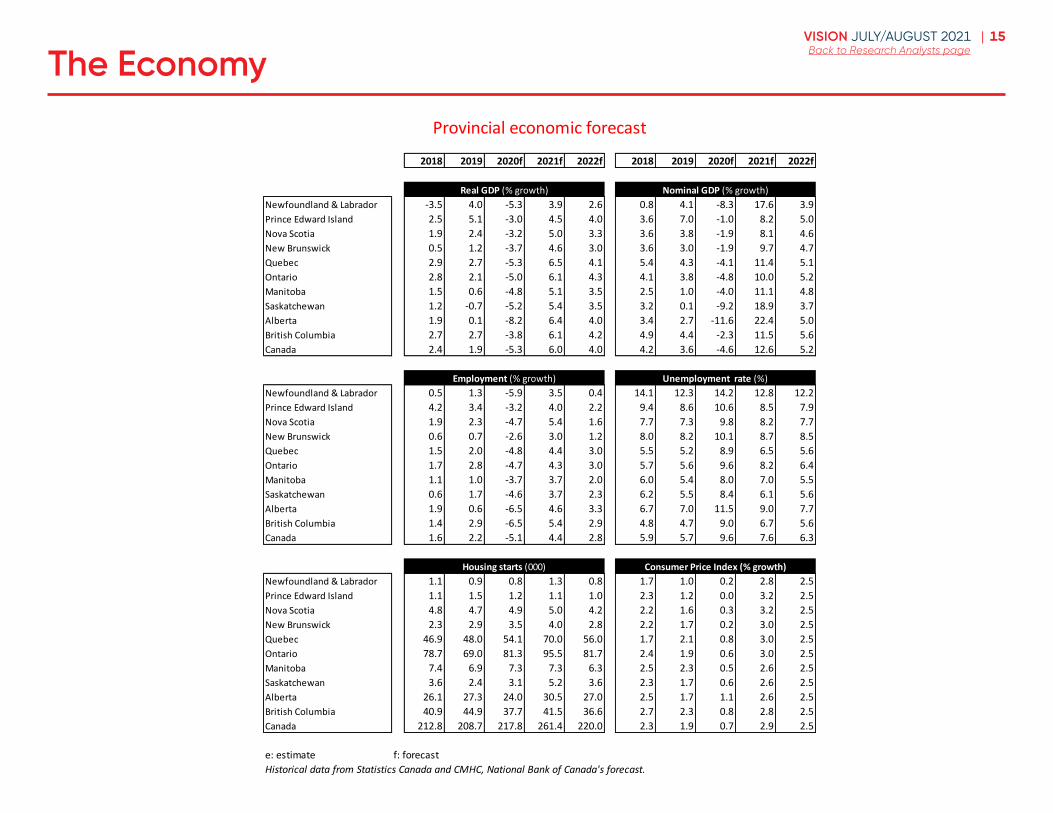
Real GDP (% growth) Nominal GDP (% growth)Newfoundland & Labrador -3.5 4.0 -5.3 3.9 2.6 0.8 4.1 -8.3 17.6 3.9Prince Edward Island 2.5 5.1 -3.0 4.5 4.0 3.6 7.0 -1.0 8.2 5.0Nova Scotia 1.9 2.4 -3.2 5.0 3.3 3.6 3.8 -1.9 8.1 4.6New Brunswick 0.5 1.2 -3.7 4.6 3.0 3.6 3.0 -1.9 9.7 4.7Quebec 2.9 2.7 -5.3 6.5 4.1 5.4 4.3 -4.1 11.4 5.1Ontario 2.8 2.1 -5.0 6.1 4.3 4.1 3.8 -4.8 10.0 5.2Manitoba 1.5 0.6 -4.8 5.1 3.5 2.5 1.0 -4.0 11.1 4.8Saskatchewan 1.2 -0.7 -5.2 5.4 3.5 3.2 0.1 -9.2 18.9 3.7Alberta 1.9 0.1 -8.2 6.4 4.0 3.4 2.7 -11.6 22.4 5.0British Columbia 2.7 2.7 -3.8 6.1 4.2 4.9 4.4 -2.3 11.5 5.6Canada 2.4 1.9 -5.3 6.0 4.0 4.2 3.6 -4.6 12.6 5.2
Employment (% growth) Unemployment rate (%)Newfoundland & Labrador 0.5 1.3 -5.9 3.5 0.4 14.1 12.3 14.2 12.8 12.2Prince Edward Island 4.2 3.4 -3.2 4.0 2.2 9.4 8.6 10.6 8.5 7.9Nova Scotia 1.9 2.3 -4.7 5.4 1.6 7.7 7.3 9.8 8.2 7.7New Brunswick 0.6 0.7 -2.6 3.0 1.2 8.0 8.2 10.1 8.7 8.5Quebec 1.5 2.0 -4.8 4.4 3.0 5.5 5.2 8.9 6.5 5.6Ontario 1.7 2.8 -4.7 4.3 3.0 5.7 5.6 9.6 8.2 6.4Manitoba 1.1 1.0 -3.7 3.7 2.0 6.0 5.4 8.0 7.0 5.5Saskatchewan 0.6 1.7 -4.6 3.7 2.3 6.2 5.5 8.4 6.1 5.6Alberta 1.9 0.6 -6.5 4.6 3.3 6.7 7.0 11.5 9.0 7.7British Columbia 1.4 2.9 -6.5 5.4 2.9 4.8 4.7 9.0 6.7 5.6Canada 1.6 2.2 -5.1 4.4 2.8 5.9 5.7 9.6 7.6 6.3
Housing starts (000) Consumer Price Index (% growth)Newfoundland & Labrador 1.1 0.9 0.8 1.3 0.8 1.7 1.0 0.2 2.8 2.5Prince Edward Island 1.1 1.5 1.2 1.1 1.0 2.3 1.2 0.0 3.2 2.5Nova Scotia 4.8 4.7 4.9 5.0 4.2 2.2 1.6 0.3 3.2 2.5New Brunswick 2.3 2.9 3.5 4.0 2.8 2.2 1.7 0.2 3.0 2.5Quebec 46.9 48.0 54.1 70.0 56.0 1.7 2.1 0.8 3.0 2.5Ontario 78.7 69.0 81.3 95.5 81.7 2.4 1.9 0.6 3.0 2.5Manitoba 7.4 6.9 7.3 7.3 6.3 2.5 2.3 0.5 2.6 2.5Saskatchewan 3.6 2.4 3.1 5.2 3.6 2.3 1.7 0.6 2.6 2.5Alberta 26.1 27.3 24.0 30.5 27.0 2.5 1.7 1.1 2.6 2.5British Columbia 40.9 44.9 37.7 41.5 36.6 2.7 2.3 0.8 2.8 2.5Canada 212.8 208.7 217.8 261.4 220.0 2.3 1.9 0.7 2.9 2.5
e: estimate f: forecastHistorical data from Statistics Canada and CMHC, National Bank of Canada's forecast.
16VISION JULY/AUGUST 2021 |Back to Research Analysts pageInterest Rates and Bond Markets
Interest Rates
and Bond Markets
17VISION JULY/AUGUST 2021 |Back to Research Analysts pageInterest Rates and Bond Markets
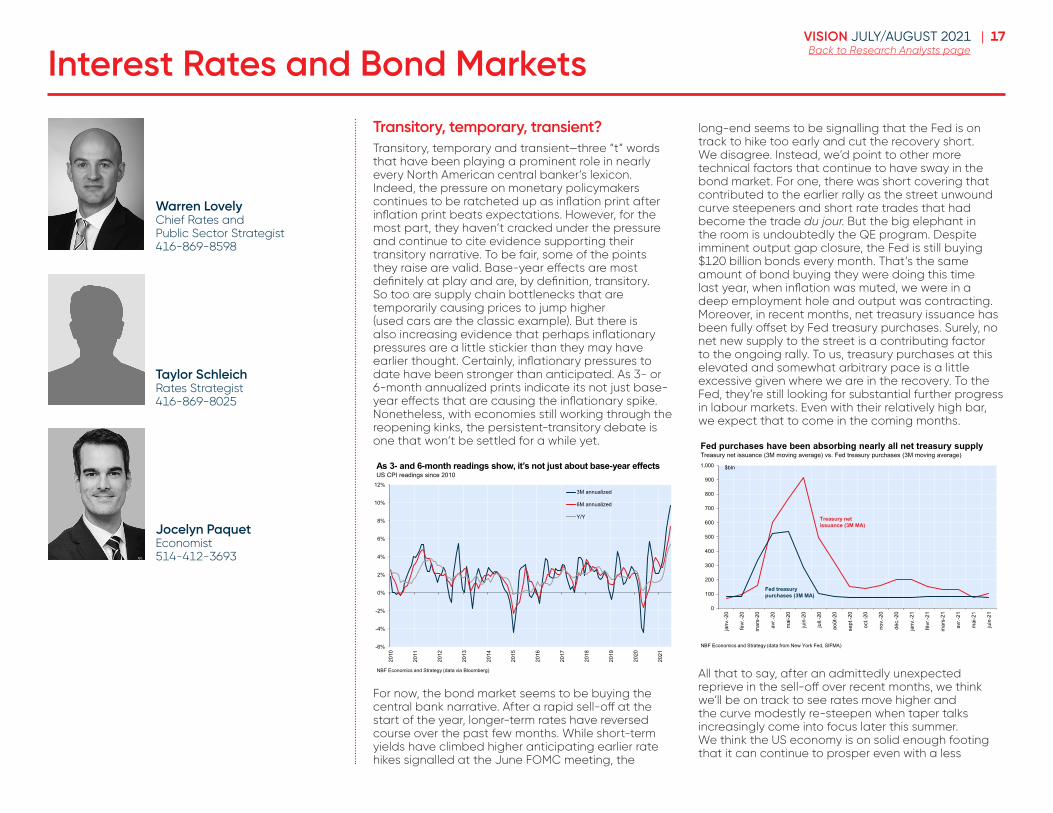
Transitory, temporary, transient?Transitory, temporary and transient—three “t” words that have been playing a prominent role in nearly every North American central banker’s lexicon. Indeed, the pressure on monetary policymakers continues to be ratcheted up as inflation print after inflation print beats expectations. However, for the most part, they haven’t cracked under the pressure and continue to cite evidence supporting their transitory narrative. To be fair, some of the points they raise are valid. Base-year effects are most definitely at play and are, by definition, transitory. So too are supply chain bottlenecks that are temporarily causing prices to jump higher (used cars are the classic example). But there is also increasing evidence that perhaps inflationary pressures are a little stickier than they may have earlier thought. Certainly, inflationary pressures to date have been stronger than anticipated. As 3- or 6-month annualized prints indicate its not just base-year effects that are causing the inflationary spike. Nonetheless, with economies still working through the reopening kinks, the persistent-transitory debate is one that won’t be settled for a while yet.
As 3- and 6-month readings show, it’s not just about base-year effectsUS CPI readings since 2010
NBF Economics and Strategy (data via Bloomberg)
-6%
-4%
-2%
0%
2%
4%
6%
8%
10%
12%
2010
2011
2012
2013
2014
2015
2016
2017
2018
2019
2020
2021
3M annualized
6M annualized
Y/Y
For now, the bond market seems to be buying the central bank narrative. After a rapid sell-off at the start of the year, longer-term rates have reversed course over the past few months. While short-term yields have climbed higher anticipating earlier rate hikes signalled at the June FOMC meeting, the
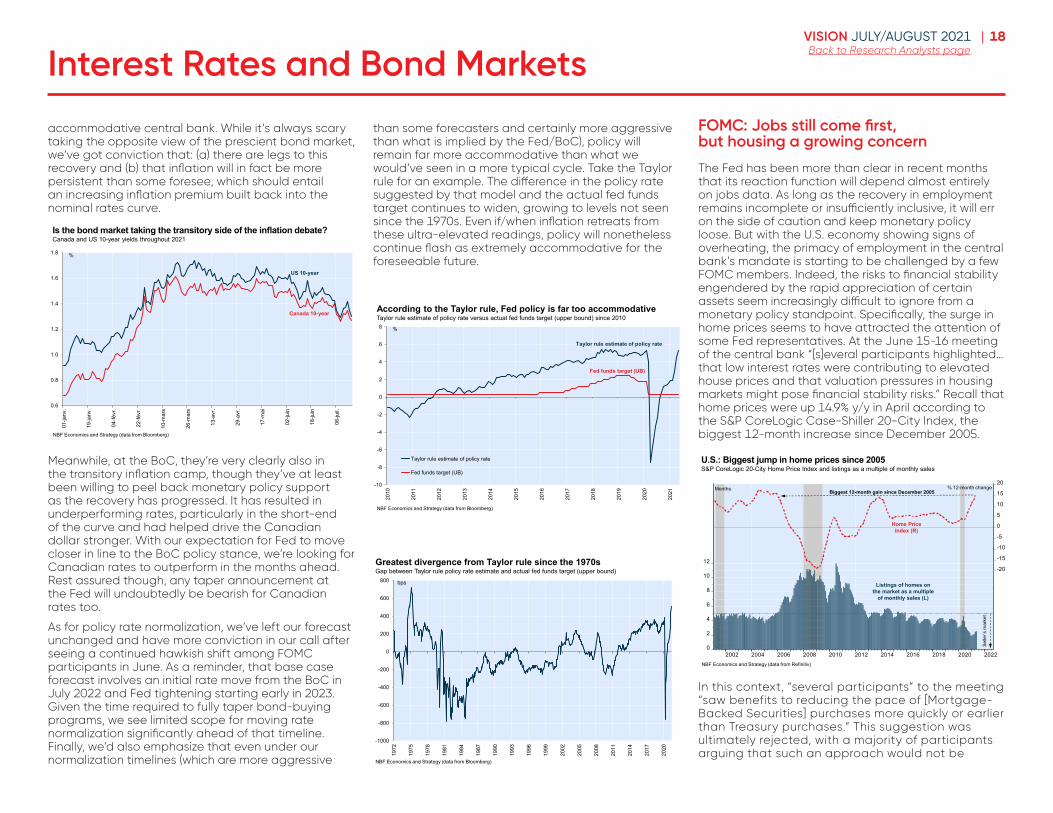
long-end seems to be signalling that the Fed is on track to hike too early and cut the recovery short. We disagree. Instead, we’d point to other more technical factors that continue to have sway in the bond market. For one, there was short covering that contributed to the earlier rally as the street unwound curve steepeners and short rate trades that had become the trade du jour. But the big elephant in the room is undoubtedly the QE program. Despite imminent output gap closure, the Fed is still buying $120 billion bonds every month. That’s the same amount of bond buying they were doing this time last year, when inflation was muted, we were in a deep employment hole and output was contracting. Moreover, in recent months, net treasury issuance has been fully offset by Fed treasury purchases. Surely, no net new supply to the street is a contributing factor to the ongoing rally. To us, treasury purchases at this elevated and somewhat arbitrary pace is a little excessive given where we are in the recovery. To the Fed, they’re still looking for substantial further progress in labour markets. Even with their relatively high bar, we expect that to come in the coming months.
Fed purchases have been absorbing nearly all net treasury supplyTreasury net issuance (3M moving average) vs. Fed treasury purchases (3M moving average)
NBF Economics and Strategy (data from New York Fed, SIFMA)
0
100
200
300
400
500
600
700
800
900
1,000
janv
.-20
févr
.-20
mar
s-20
avr.-
20
mai
-20
juin
-20
juil.
-20
août
-20
sept
.-20
oct.-
20
nov.
-20
déc.
-20
janv
.-21
févr
.-21
mar
s-21
avr.-
21
mai
-21
juin
-21
$bln
Treasury net issuance (3M MA)
Fed treasury purchases (3M MA)
All that to say, after an admittedly unexpected reprieve in the sell-off over recent months, we think we’ll be on track to see rates move higher and the curve modestly re-steepen when taper talks increasingly come into focus later this summer. We think the US economy is on solid enough footing that it can continue to prosper even with a less
Warren Lovely Chief Rates and Public Sector Strategist 416-869-8598
Taylor Schleich Rates Strategist 416-869-8025
Jocelyn PaquetEconomist514-412-3693
18VISION JULY/AUGUST 2021 |Back to Research Analysts pageInterest Rates and Bond Markets
accommodative central bank. While it’s always scary taking the opposite view of the prescient bond market, we’ve got conviction that: (a) there are legs to this recovery and (b) that inflation will in fact be more persistent than some foresee, which should entail an increasing inflation premium built back into the nominal rates curve.
Is the bond market taking the transitory side of the inflation debate?Canada and US 10-year yields throughout 2021
NBF Economics and Strategy (data from Bloomberg)
0.6
0.8
1.0
1.2
1.4
1.6
1.8
01-ja
nv.
19-ja
nv.
04-fé
vr.
22-fé
vr.
10-m
ars
26-m
ars
13-a
vr.
29-a
vr.
17-m
ai
02-ju
in
18-ju
in
06-ju
il.
%
US 10-year
Canada 10-year
Meanwhile, at the BoC, they’re very clearly also in the transitory inflation camp, though they’ve at least been willing to peel back monetary policy support as the recovery has progressed. It has resulted in underperforming rates, particularly in the short-end of the curve and had helped drive the Canadian dollar stronger. With our expectation for Fed to move closer in line to the BoC policy stance, we’re looking for Canadian rates to outperform in the months ahead. Rest assured though, any taper announcement at the Fed will undoubtedly be bearish for Canadian rates too.
As for policy rate normalization, we’ve left our forecast unchanged and have more conviction in our call after seeing a continued hawkish shift among FOMC participants in June. As a reminder, that base case forecast involves an initial rate move from the BoC in July 2022 and Fed tightening starting early in 2023. Given the time required to fully taper bond-buying programs, we see limited scope for moving rate normalization significantly ahead of that timeline. Finally, we’d also emphasize that even under our normalization timelines (which are more aggressive
than some forecasters and certainly more aggressive than what is implied by the Fed/BoC), policy will remain far more accommodative than what we would’ve seen in a more typical cycle. Take the Taylor rule for an example. The difference in the policy rate suggested by that model and the actual fed funds target continues to widen, growing to levels not seen since the 1970s. Even if/when inflation retreats from these ultra-elevated readings, policy will nonetheless continue flash as extremely accommodative for the foreseeable future.
According to the Taylor rule, Fed policy is far too accommodativeTaylor rule estimate of policy rate versus actual fed funds target (upper bound) since 2010
NBF Economics and Strategy (data from Bloomberg)
-10
-8
-6
-4
-2
0
2
4
6
8
2010
2011
2012
2013
2014
2015
2016
2017
2018
2019
2020
2021
Taylor rule estimate of policy rate
Fed funds target (UB)
%
Taylor rule estimate of policy rate
Fed funds target (UB)
Greatest divergence from Taylor rule since the 1970sGap between Taylor rule policy rate estimate and actual fed funds target (upper bound)
NBF Economics and Strategy (data from Bloomberg)
-1000
-800
-600
-400
-200
0
200
400
600
800
1972
1975
1978
1981
1984
1987
1990
1993
1996
1999
2002
2005
2008
2011
2014
2017
2020
bps
FOMC: Jobs still come first, but housing a growing concern
The Fed has been more than clear in recent months that its reaction function will depend almost entirely on jobs data. As long as the recovery in employment remains incomplete or insufficiently inclusive, it will err on the side of caution and keep monetary policy loose. But with the U.S. economy showing signs of overheating, the primacy of employment in the central bank’s mandate is starting to be challenged by a few FOMC members. Indeed, the risks to financial stability engendered by the rapid appreciation of certain assets seem increasingly difficult to ignore from a monetary policy standpoint. Specifically, the surge in home prices seems to have attracted the attention of some Fed representatives. At the June 15-16 meeting of the central bank “[s]everal participants highlighted… that low interest rates were contributing to elevated house prices and that valuation pressures in housing markets might pose financial stability risks.” Recall that home prices were up 14.9% y/y in April according to the S&P CoreLogic Case-Shiller 20-City Index, the biggest 12-month increase since December 2005.
U.S.: Biggest jump in home prices since 2005S&P CoreLogic 20-City Home Price Index and listings as a multiple of monthly sales
NBF Economics and Strategy (data from Refinitiv)
0
2
4
6
8
10
12-20
-15
-10
-5
0
5
10
15
20
2002 2004 2006 2008 2010 2012 2014 2016 2018 2020 2022
Months
Home Price Index (R)
Listings of homes on the market as a multiple
of monthly sales (L)
% 12-month change
Selle
r’s m
arke
t
Biggest 12-month gain since December 2005
In this context, “several participants” to the meeting “saw benefits to reducing the pace of [Mortgage-Backed Securities] purchases more quickly or earlier than Treasury purchases.” This suggestion was ultimately rejected, with a majority of participants arguing that such an approach would not be
19VISION JULY/AUGUST 2021 |Back to Research Analysts page
aligned with the Fed’s previous communications. It seems all but certain that the FOMC members who are uncomfortable with soaring property prices will once again call for an asymmetric reduction of asset purchases at the next meeting but we continue to expect that, once the Fed starts tapering its QE program, it will reduce the pace of Treasury and MBS purchases commensurately. In the eyes of many policymakers, the extremely close relationship between both asset classes means that reducing MBS purchases faster or earlier would not significantly alter conditions in the housing market. What’s more, the Fed sees purchases of MBSs not as a way to support the housing market specifically, but more as a tool to provide accommodation through their influence on broader financial conditions. With the central bank adamant that such a level of accommodation remains necessary, the early phasing out of MBS purchases appears unlikely.
More generally, though, the debate surrounding MBS purchases demonstrates growing divisions within the FOMC, with the minority group inclined to reduce policy accommodation faster, making its voice heard louder and louder. Whether it is the rise in house prices, the surge in inflation, or elevated valuation on the stock market, the hawkish camp will not be short of arguments in coming weeks to question the Fed’s pedal-to-the-metal-approach to monetary policy.
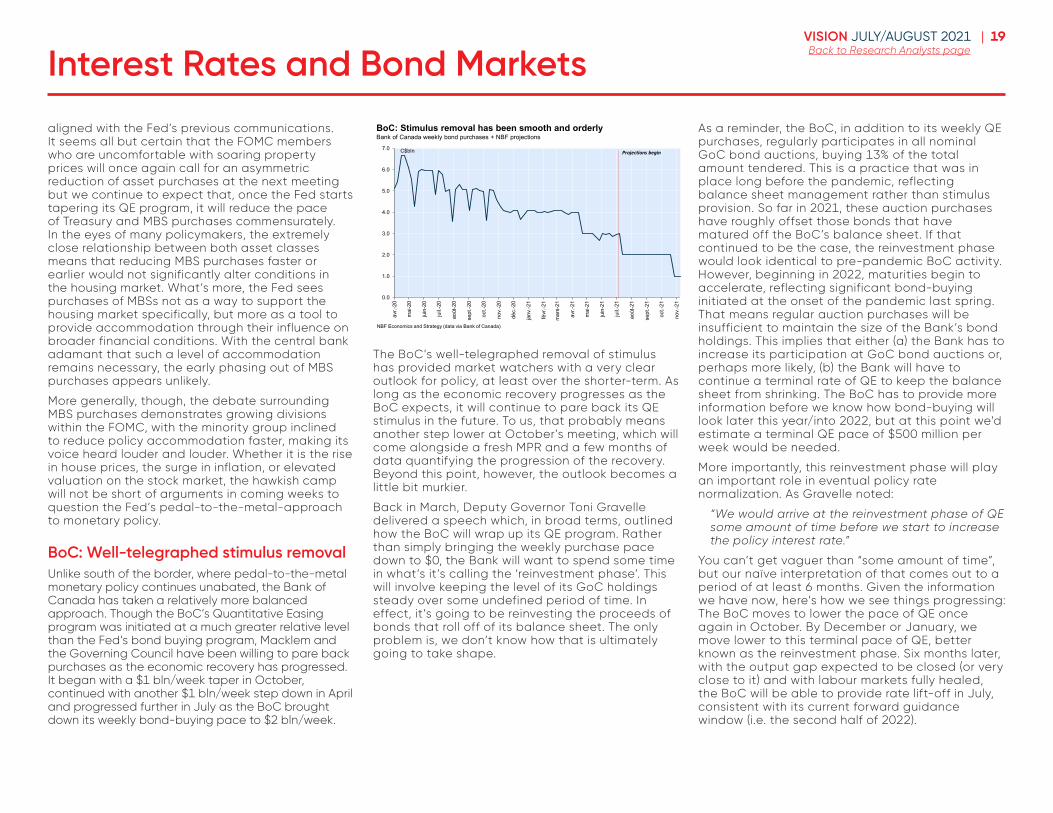
BoC: Well-telegraphed stimulus removalUnlike south of the border, where pedal-to-the-metal monetary policy continues unabated, the Bank of Canada has taken a relatively more balanced approach. Though the BoC’s Quantitative Easing program was initiated at a much greater relative level than the Fed’s bond buying program, Macklem and the Governing Council have been willing to pare back purchases as the economic recovery has progressed. It began with a $1 bln/week taper in October, continued with another $1 bln/week step down in April and progressed further in July as the BoC brought down its weekly bond-buying pace to $2 bln/week.
BoC: Stimulus removal has been smooth and orderlyBank of Canada weekly bond purchases + NBF projections
NBF Economics and Strategy (data via Bank of Canada)
%
0.0
1.0
2.0
3.0
4.0
5.0
6.0
7.0
avr.-
20
mai
-20
juin
-20
juil.
-20
août
-20
sept
.-20
oct.-
20
nov.
-20
déc.
-20
janv
.-21
févr
.-21
mar
s-21
avr.-
21
mai
-21
juin
-21
juil.
-21
août
-21
sept
.-21
oct.-
21
nov.
-21
C$bln Projections begin
The BoC’s well-telegraphed removal of stimulus has provided market watchers with a very clear outlook for policy, at least over the shorter-term. As long as the economic recovery progresses as the BoC expects, it will continue to pare back its QE stimulus in the future. To us, that probably means another step lower at October’s meeting, which will come alongside a fresh MPR and a few months of data quantifying the progression of the recovery. Beyond this point, however, the outlook becomes a little bit murkier.
Back in March, Deputy Governor Toni Gravelle delivered a speech which, in broad terms, outlined how the BoC will wrap up its QE program. Rather than simply bringing the weekly purchase pace down to $0, the Bank will want to spend some time in what’s it’s calling the ‘reinvestment phase’. This will involve keeping the level of its GoC holdings steady over some undefined period of time. In effect, it’s going to be reinvesting the proceeds of bonds that roll off of its balance sheet. The only problem is, we don’t know how that is ultimately going to take shape.
As a reminder, the BoC, in addition to its weekly QE purchases, regularly participates in all nominal GoC bond auctions, buying 13% of the total amount tendered. This is a practice that was in place long before the pandemic, reflecting balance sheet management rather than stimulus provision. So far in 2021, these auction purchases have roughly offset those bonds that have matured off the BoC’s balance sheet. If that continued to be the case, the reinvestment phase would look identical to pre-pandemic BoC activity. However, beginning in 2022, maturities begin to accelerate, reflecting significant bond-buying initiated at the onset of the pandemic last spring. That means regular auction purchases will be insufficient to maintain the size of the Bank’s bond holdings. This implies that either (a) the Bank has to increase its participation at GoC bond auctions or, perhaps more likely, (b) the Bank will have to continue a terminal rate of QE to keep the balance sheet from shrinking. The BoC has to provide more information before we know how bond-buying will look later this year/into 2022, but at this point we’d estimate a terminal QE pace of $500 million per week would be needed.
More importantly, this reinvestment phase will play an important role in eventual policy rate normalization. As Gravelle noted:
“We would arrive at the reinvestment phase of QE some amount of time before we start to increase the policy interest rate.”
You can’t get vaguer than “some amount of time”, but our naïve interpretation of that comes out to a period of at least 6 months. Given the information we have now, here’s how we see things progressing: The BoC moves to lower the pace of QE once again in October. By December or January, we move lower to this terminal pace of QE, better known as the reinvestment phase. Six months later, with the output gap expected to be closed (or very close to it) and with labour markets fully healed, the BoC will be able to provide rate lift-off in July, consistent with its current forward guidance window (i.e. the second half of 2022).
Interest Rates and Bond Markets
20VISION JULY/AUGUST 2021 |Back to Research Analysts pageInterest Rates and Bond Markets
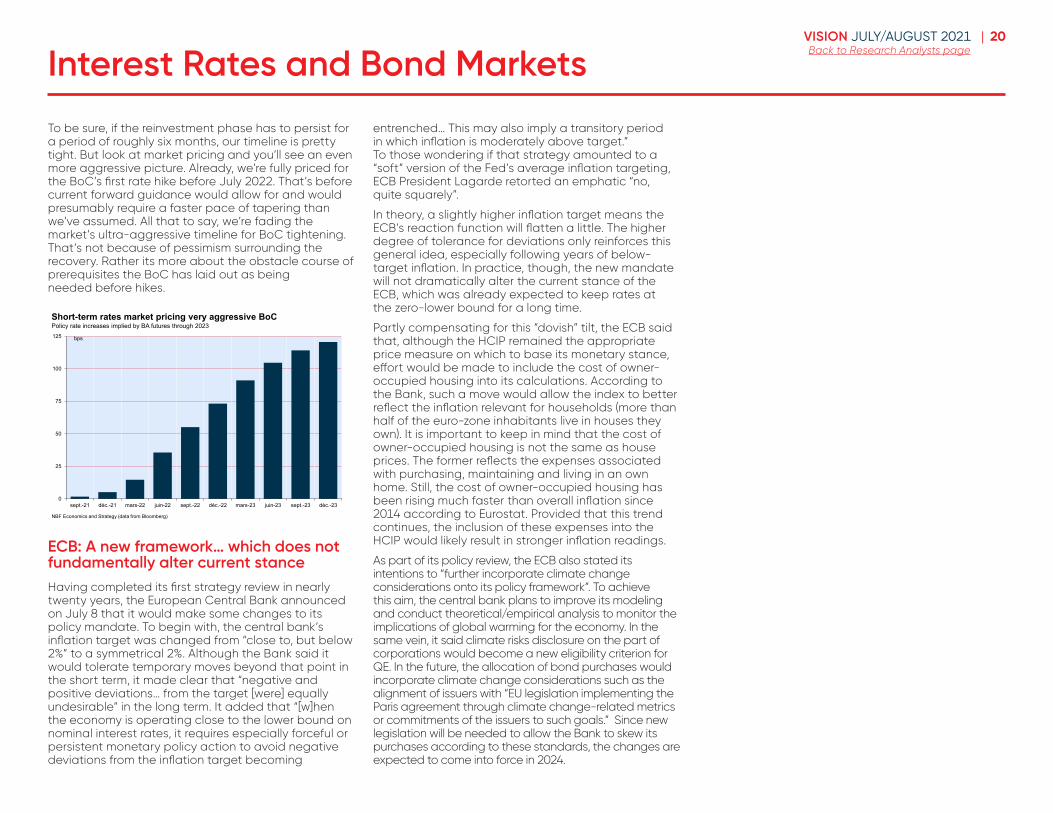
To be sure, if the reinvestment phase has to persist for a period of roughly six months, our timeline is pretty tight. But look at market pricing and you’ll see an even more aggressive picture. Already, we’re fully priced for the BoC’s first rate hike before July 2022. That’s before current forward guidance would allow for and would presumably require a faster pace of tapering than we’ve assumed. All that to say, we’re fading the market’s ultra-aggressive timeline for BoC tightening. That’s not because of pessimism surrounding the recovery. Rather its more about the obstacle course of prerequisites the BoC has laid out as being needed before hikes.
Short-term rates market pricing very aggressive BoCPolicy rate increases implied by BA futures through 2023
NBF Economics and Strategy (data from Bloomberg)
0
25
50
75
100
125
sept.-21 déc.-21 mars-22 juin-22 sept.-22 déc.-22 mars-23 juin-23 sept.-23 déc.-23
bps
ECB: A new framework… which does not fundamentally alter current stanceHaving completed its first strategy review in nearly twenty years, the European Central Bank announced on July 8 that it would make some changes to its policy mandate. To begin with, the central bank’s inflation target was changed from “close to, but below 2%” to a symmetrical 2%. Although the Bank said it would tolerate temporary moves beyond that point in the short term, it made clear that “negative and positive deviations… from the target [were] equally undesirable” in the long term. It added that “[w]hen the economy is operating close to the lower bound on nominal interest rates, it requires especially forceful or persistent monetary policy action to avoid negative deviations from the inflation target becoming
entrenched… This may also imply a transitory period in which inflation is moderately above target.” To those wondering if that strategy amounted to a “soft” version of the Fed’s average inflation targeting, ECB President Lagarde retorted an emphatic “no, quite squarely”.
In theory, a slightly higher inflation target means the ECB’s reaction function will flatten a little. The higher degree of tolerance for deviations only reinforces this general idea, especially following years of below-target inflation. In practice, though, the new mandate will not dramatically alter the current stance of the ECB, which was already expected to keep rates at the zero-lower bound for a long time.
Partly compensating for this “dovish” tilt, the ECB said that, although the HCIP remained the appropriate price measure on which to base its monetary stance, effort would be made to include the cost of owner-occupied housing into its calculations. According to the Bank, such a move would allow the index to better reflect the inflation relevant for households (more than half of the euro-zone inhabitants live in houses they own). It is important to keep in mind that the cost of owner-occupied housing is not the same as house prices. The former reflects the expenses associated with purchasing, maintaining and living in an own home. Still, the cost of owner-occupied housing has been rising much faster than overall inflation since 2014 according to Eurostat. Provided that this trend continues, the inclusion of these expenses into the HCIP would likely result in stronger inflation readings.
As part of its policy review, the ECB also stated its intentions to “further incorporate climate change considerations onto its policy framework”. To achieve this aim, the central bank plans to improve its modeling and conduct theoretical/empirical analysis to monitor the implications of global warming for the economy. In the same vein, it said climate risks disclosure on the part of corporations would become a new eligibility criterion for QE. In the future, the allocation of bond purchases would incorporate climate change considerations such as the alignment of issuers with “EU legislation implementing the Paris agreement through climate change-related metrics or commitments of the issuers to such goals.” Since new legislation will be needed to allow the Bank to skew its purchases according to these standards, the changes are expected to come into force in 2024.
21VISION JULY/AUGUST 2021 |Back to Research Analysts pageInterest Rates and Bond Markets
6
Economics and Strategy
Monthly Fixed Income Monitor
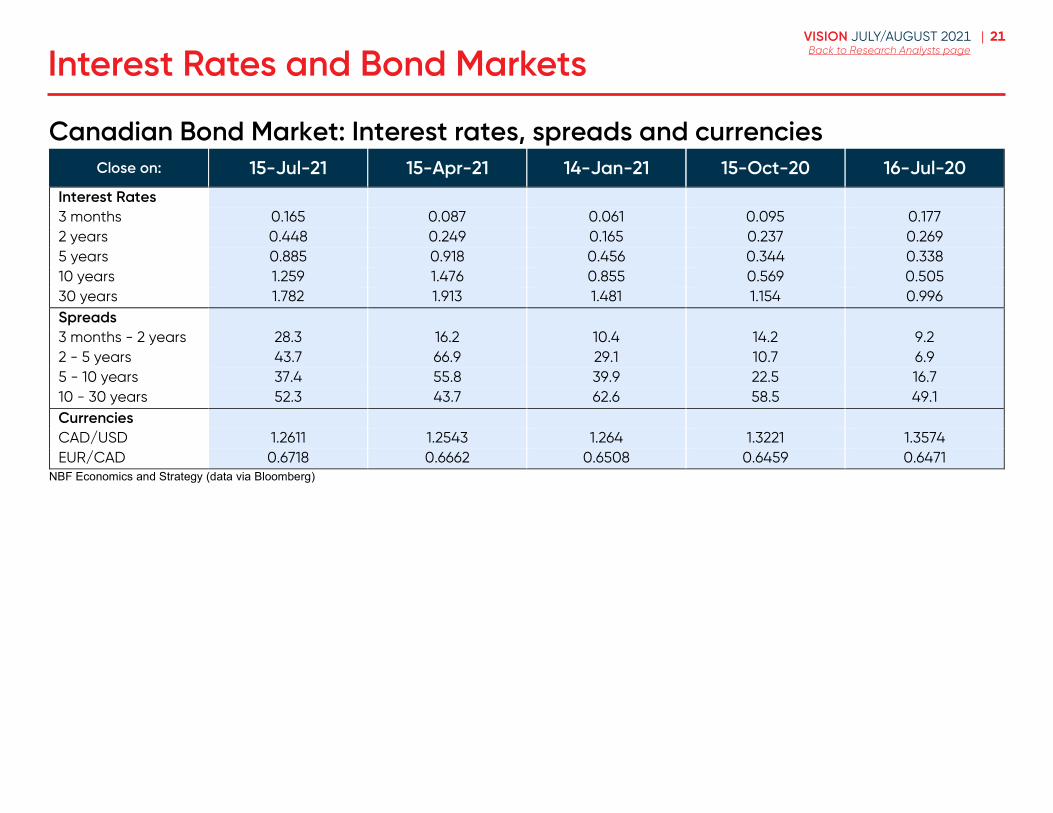
Canadian Bond Market: Interest rates, spreads and currencies
Close on: 15-Jul-21 15-Apr-21 14-Jan-21 15-Oct-20 16-Jul-20 Interest Rates 3 months 0.165 0.087 0.061 0.095 0.177 2 years 0.448 0.249 0.165 0.237 0.269 5 years 0.885 0.918 0.456 0.344 0.338 10 years 1.259 1.476 0.855 0.569 0.505 30 years 1.782 1.913 1.481 1.154 0.996 Spreads
3 months - 2 years 28.3 16.2 10.4 14.2 9.2 2 - 5 years 43.7 66.9 29.1 10.7 6.9 5 - 10 years 37.4 55.8 39.9 22.5 16.7 10 - 30 years 52.3 43.7 62.6 58.5 49.1 Currencies
CAD/USD 1.2611 1.2543 1.264 1.3221 1.3574 EUR/CAD 0.6718 0.6662 0.6508 0.6459 0.6471
NBF Economics and Strategy (data via Bloomberg)
22VISION JULY/AUGUST 2021 |Back to Research Analysts pageStock Market and Portfolio Strategy
Stock Market and
Portfolio Strategy
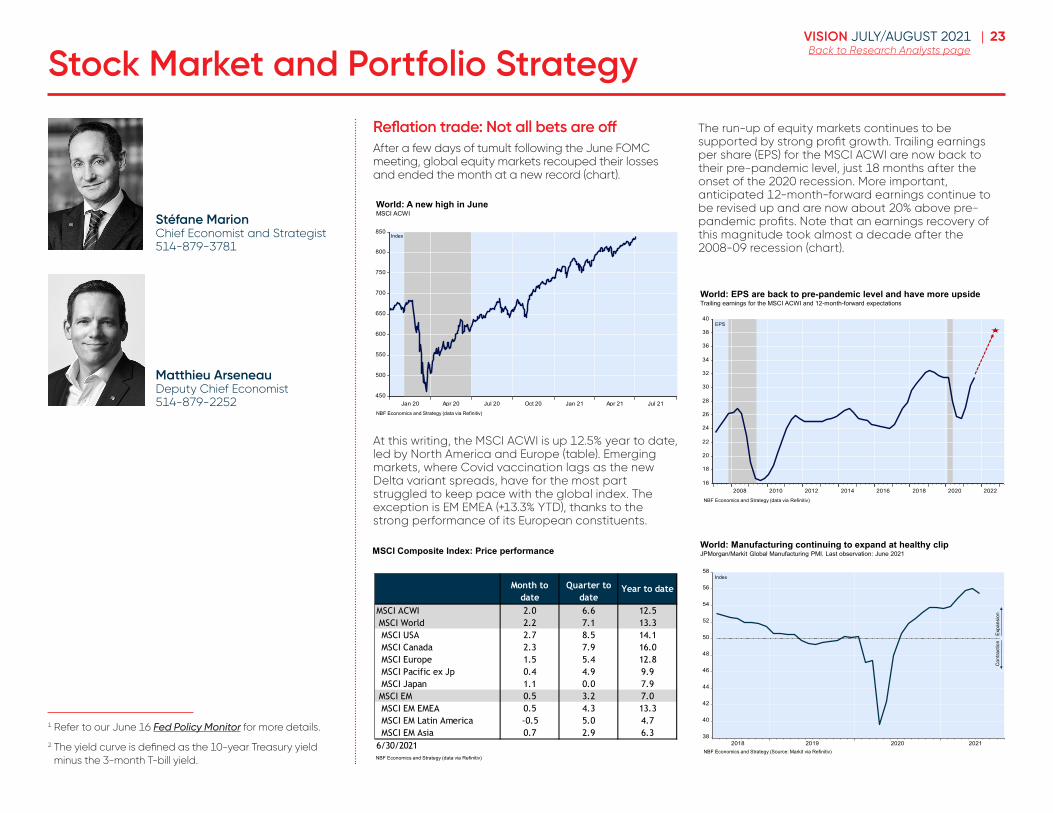
23VISION JULY/AUGUST 2021 |Back to Research Analysts pageStock Market and Portfolio Strategy
Reflation trade: Not all bets are offAfter a few days of tumult following the June FOMC meeting, global equity markets recouped their losses and ended the month at a new record (chart).
450
500
550
600
650
700
750
800
850
Jan 20 Apr 20 Jul 20 Oct 20 Jan 21 Apr 21 Jul 21NBF Economics and Strategy (data via Refinitiv)
World: A new high in JuneMSCI ACWI
Index
At this writing, the MSCI ACWI is up 12.5% year to date, led by North America and Europe (table). Emerging markets, where Covid vaccination lags as the new Delta variant spreads, have for the most part struggled to keep pace with the global index. The exception is EM EMEA (+13.3% YTD), thanks to the strong performance of its European constituents.
MSCI Composite Index: Price performance
NBF Economics and Strategy (data via Refinitiv)
Month to date
Quarter to date
Year to date
MSCI ACWI 2.0 6.6 12.5 MSCI World 2.2 7.1 13.3 MSCI USA 2.7 8.5 14.1 MSCI Canada 2.3 7.9 16.0 MSCI Europe 1.5 5.4 12.8 MSCI Pacific ex Jp 0.4 4.9 9.9 MSCI Japan 1.1 0.0 7.9 MSCI EM 0.5 3.2 7.0 MSCI EM EMEA 0.5 4.3 13.3 MSCI EM Latin America -0.5 5.0 4.7 MSCI EM Asia 0.7 2.9 6.36/30/2021
The run-up of equity markets continues to be supported by strong profit growth. Trailing earnings per share (EPS) for the MSCI ACWI are now back to their pre-pandemic level, just 18 months after the onset of the 2020 recession. More important, anticipated 12-month-forward earnings continue to be revised up and are now about 20% above pre-pandemic profits. Note that an earnings recovery of this magnitude took almost a decade after the 2008-09 recession (chart).
16
18
20
22
24
26
28
30
32
34
36
38
40
2008 2010 2012 2014 2016 2018 2020 2022NBF Economics and Strategy (data via Refinitiv)
World: EPS are back to pre-pandemic level and have more upside Trailing earnings for the MSCI ACWI and 12-month-forward expectations
EPS
38
40
42
44
46
48
50
52
54
56
58
2018 2019 2020 2021
World: Manufacturing continuing to expand at healthy clipJPMorgan/Markit Global Manufacturing PMI. Last observation: June 2021
Index
NBF Economics and Strategy (Source: Markit via Refinitiv)
Expa
nsio
nC
ontra
ctio
n
Stéfane Marion Chief Economist and Strategist 514-879-3781
Matthieu ArseneauDeputy Chief Economist514-879-2252
1 Refer to our June 16 Fed Policy Monitor for more details.
2 The yield curve is defined as the 10-year Treasury yield minus the 3-month T-bill yield.
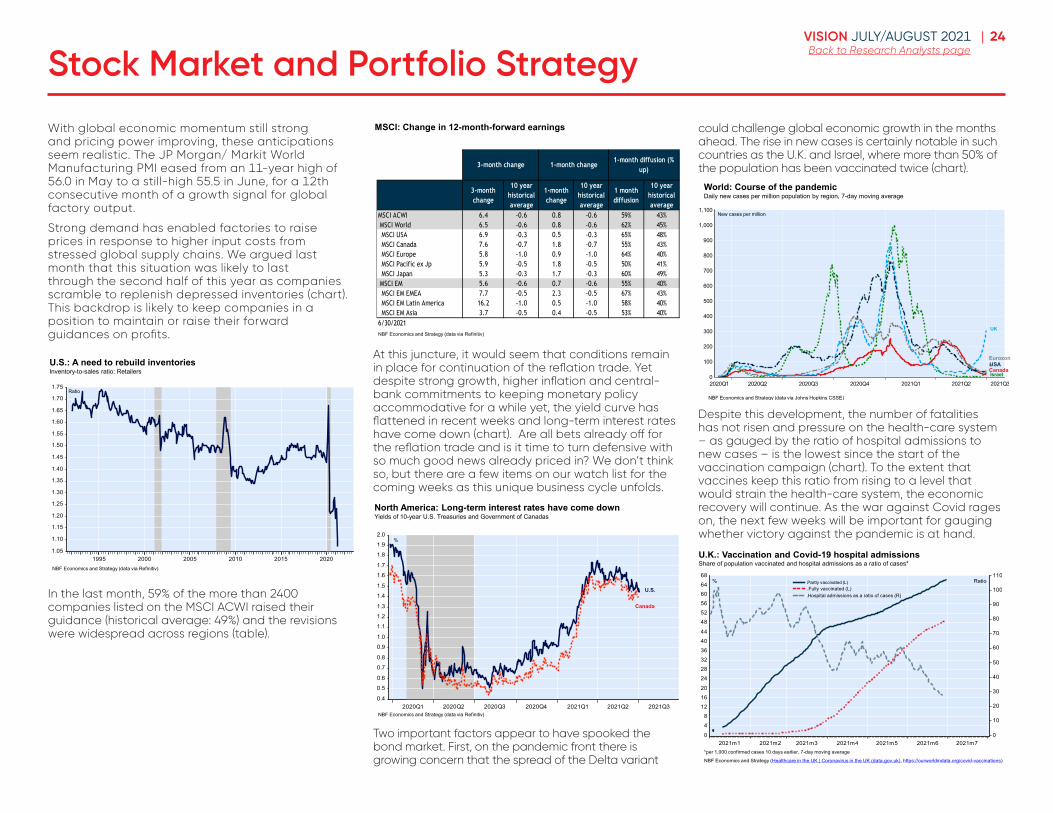
24VISION JULY/AUGUST 2021 |Back to Research Analysts pageStock Market and Portfolio Strategy
With global economic momentum still strong and pricing power improving, these anticipations seem realistic. The JP Morgan/ Markit World Manufacturing PMI eased from an 11-year high of 56.0 in May to a still-high 55.5 in June, for a 12th consecutive month of a growth signal for global factory output.
Strong demand has enabled factories to raise prices in response to higher input costs from stressed global supply chains. We argued last month that this situation was likely to last through the second half of this year as companies scramble to replenish depressed inventories (chart). This backdrop is likely to keep companies in a position to maintain or raise their forward guidances on profits.
1.05
1.10
1.15
1.20
1.25
1.30
1.35
1.40
1.45
1.50
1.55
1.60
1.65
1.70
1.75
1995 2000 2005 2010 2015 2020
U.S.: A need to rebuild inventoriesInventory-to-sales ratio: Retailers
NBF Economics and Strategy (data via Refinitiv)
Ratio
In the last month, 59% of the more than 2400 companies listed on the MSCI ACWI raised their guidance (historical average: 49%) and the revisions were widespread across regions (table).
MSCI: Change in 12-month-forward earnings
NBF Economics and Strategy (data via Refinitiv)
3-month change
10 year historical average
1-month change
10 year historical average
1 month diffusion
10 year historical average
MSCI ACWI 6.4 -0.6 0.8 -0.6 59% 43% MSCI World 6.5 -0.6 0.8 -0.6 62% 45% MSCI USA 6.9 -0.3 0.5 -0.3 65% 48% MSCI Canada 7.6 -0.7 1.8 -0.7 55% 43% MSCI Europe 5.8 -1.0 0.9 -1.0 64% 40% MSCI Pacific ex Jp 5.9 -0.5 1.8 -0.5 50% 41% MSCI Japan 5.3 -0.3 1.7 -0.3 60% 49% MSCI EM 5.6 -0.6 0.7 -0.6 55% 40% MSCI EM EMEA 7.7 -0.5 2.3 -0.5 67% 43% MSCI EM Latin America 16.2 -1.0 0.5 -1.0 58% 40% MSCI EM Asia 3.7 -0.5 0.4 -0.5 53% 40%6/30/2021
1-month diffusion (% up)
3-month change 1-month change
At this juncture, it would seem that conditions remain in place for continuation of the reflation trade. Yet despite strong growth, higher inflation and central-bank commitments to keeping monetary policy accommodative for a while yet, the yield curve has flattened in recent weeks and long-term interest rates have come down (chart). Are all bets already off for the reflation trade and is it time to turn defensive with so much good news already priced in? We don’t think so, but there are a few items on our watch list for the coming weeks as this unique business cycle unfolds.
0.4
0.5
0.6
0.7
0.8
0.9
1.0
1.1
1.2
1.3
1.4
1.5
1.6
1.7
1.8
1.9
2.0
2020Q1 2020Q2 2020Q3 2020Q4 2021Q1 2021Q2 2021Q3
North America: Long-term interest rates have come downYields of 10-year U.S. Treasuries and Government of Canadas
%
NBF Economics and Strategy (data via Refinitiv)
Canada
U.S.
Two important factors appear to have spooked the bond market. First, on the pandemic front there is growing concern that the spread of the Delta variant
could challenge global economic growth in the months ahead. The rise in new cases is certainly notable in such countries as the U.K. and Israel, where more than 50% of the population has been vaccinated twice (chart).
0
100
200
300
400
500
600
700
800
900
1,000
1,100
2020Q1 2020Q2 2020Q3 2020Q4 2021Q1 2021Q2 2021Q3
World: Course of the pandemicDaily new cases per million population by region, 7-day moving average
NBF Economics and Strategy (data via Johns Hopkins CSSE)
New cases per million
CanadaUSA
UK
Israel
Eurozone
Despite this development, the number of fatalities has not risen and pressure on the health-care system – as gauged by the ratio of hospital admissions to new cases – is the lowest since the start of the vaccination campaign (chart). To the extent that vaccines keep this ratio from rising to a level that would strain the health-care system, the economic recovery will continue. As the war against Covid rages on, the next few weeks will be important for gauging whether victory against the pandemic is at hand.
0
48
121620
242832364044
485256606468
0
10
20
30
40
50
60
70
80
90
100
110
2021m1 2021m2 2021m3 2021m4 2021m5 2021m6 2021m7
.
.
.
U.K.: Vaccination and Covid-19 hospital admissionsShare of population vaccinated and hospital admissions as a ratio of cases*
*per 1,000 confirmed cases 10 days earlier, 7-day moving average
NBF Economics and Strategy (Healthcare in the UK | Coronavirus in the UK (data.gov.uk), https://ourworldindata.org/covid-vaccinations)
% Partly vaccinated (L)Fully vaccinated (L)Hospital admissions as a ratio of cases (R)
Ratio
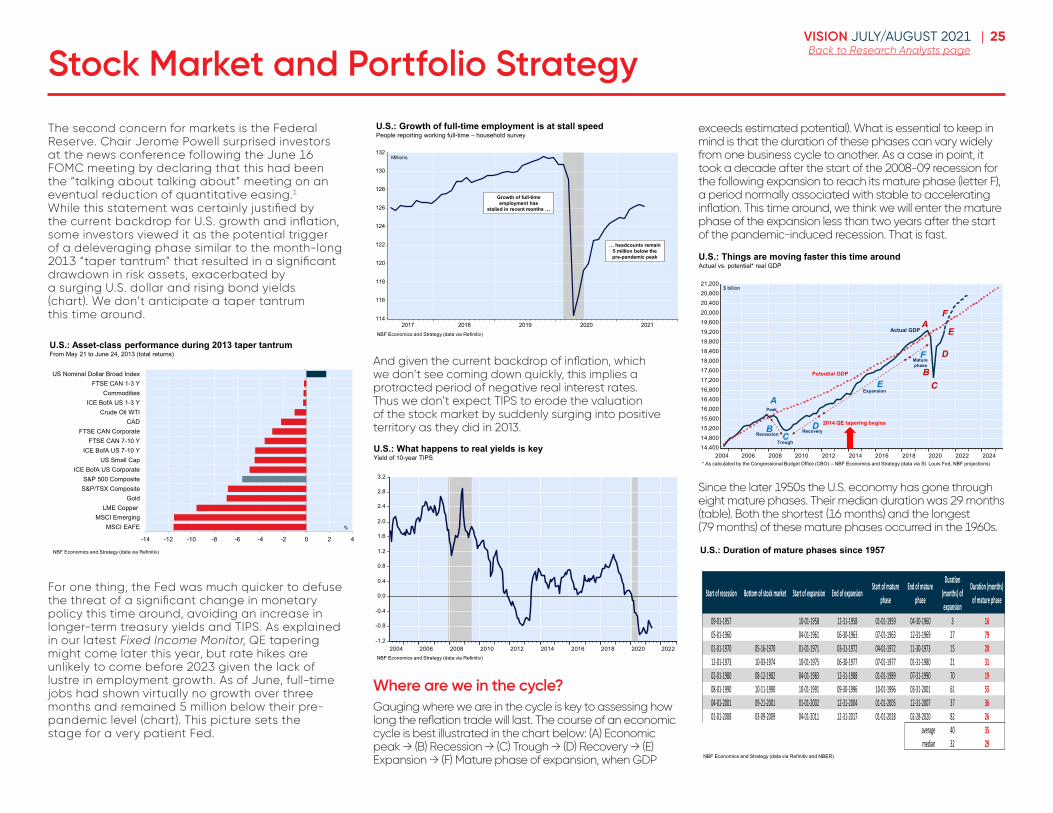
25VISION JULY/AUGUST 2021 |Back to Research Analysts page
The second concern for markets is the Federal Reserve. Chair Jerome Powell surprised investors at the news conference following the June 16 FOMC meeting by declaring that this had been the “talking about talking about” meeting on an eventual reduction of quantitative easing.1 While this statement was certainly justified by the current backdrop for U.S. growth and inflation, some investors viewed it as the potential trigger of a deleveraging phase similar to the month-long 2013 “taper tantrum” that resulted in a significant drawdown in risk assets, exacerbated by a surging U.S. dollar and rising bond yields (chart). We don’t anticipate a taper tantrum this time around.
-14 -12 -10 -8 -6 -4 -2 0 2 4
MSCI EAFEMSCI Emerging
LME CopperGold
S&P/TSX CompositeS&P 500 Composite
ICE BofA US CorporateUS Small Cap
ICE BofA US 7-10 YFTSE CAN 7-10 Y
FTSE CAN CorporateCAD
Crude Oil WTIICE BofA US 1-3 Y
CommoditiesFTSE CAN 1-3 Y
US Nominal Dollar Broad Index
U.S.: Asset-class performance during 2013 taper tantrumFrom May 21 to June 24, 2013 (total returns)
%
NBF Economics and Strategy (data via Refinitiv)
For one thing, the Fed was much quicker to defuse the threat of a significant change in monetary policy this time around, avoiding an increase in longer-term treasury yields and TIPS. As explained in our latest Fixed Income Monitor, QE tapering might come later this year, but rate hikes are unlikely to come before 2023 given the lack of lustre in employment growth. As of June, full-time jobs had shown virtually no growth over three months and remained 5 million below their pre-pandemic level (chart). This picture sets the stage for a very patient Fed.
114
116
118
120
122
124
126
128
130
132
2017 2018 2019 2020 2021NBF Economics and Strategy (data via Refinitiv)
Millions
U.S.: Growth of full-time employment is at stall speed People reporting working full-time – household survey
Growth of full-timeemployment has
stalled in recent months …
… headcounts remain 5 million below the pre-pandemic peak
And given the current backdrop of inflation, which we don’t see coming down quickly, this implies a protracted period of negative real interest rates. Thus we don’t expect TIPS to erode the valuation of the stock market by suddenly surging into positive territory as they did in 2013.
-1.2
-0.8
-0.4
0.0
0.4
0.8
1.2
1.6
2.0
2.4
2.8
3.2
2004 2006 2008 2010 2012 2014 2016 2018 2020 2022
U.S.: What happens to real yields is keyYield of 10-year TIPS
NBF Economics and Strategy (data via Refinitiv)
Where are we in the cycle?Gauging where we are in the cycle is key to assessing how long the reflation trade will last. The course of an economic cycle is best illustrated in the chart below: (A) Economic peak → (B) Recession → (C) Trough → (D) Recovery → (E) Expansion → (F) Mature phase of expansion, when GDP
exceeds estimated potential). What is essential to keep in mind is that the duration of these phases can vary widely from one business cycle to another. As a case in point, it took a decade after the start of the 2008-09 recession for the following expansion to reach its mature phase (letter F), a period normally associated with stable to accelerating inflation. This time around, we think we will enter the mature phase of the expansion less than two years after the start of the pandemic-induced recession. That is fast.
14,40014,80015,20015,60016,00016,40016,80017,20017,60018,00018,40018,80019,20019,60020,00020,40020,80021,200
2004 2006 2008 2010 2012 2014 2016 2018 2020 2022 2024
Potential GDP
Actual GDP
Peak
RecessionTrough
Recovery
Expansion
Maturephase
A
BC
D
E
F
A
BC
D
E
F
U.S.: Things are moving faster this time aroundActual vs. potential* real GDP
$ billion
* As calculated by the Congressional Budget Office (CBO) – NBF Economics and Strategy (data via St. Louis Fed, NBF projections)
2014 QE tapering begins
Since the later 1950s the U.S. economy has gone through eight mature phases. Their median duration was 29 months (table). Both the shortest (16 months) and the longest (79 months) of these mature phases occurred in the 1960s.
Start of recession Bottom of stock market Start of expansion End of expansion Start of mature phase
End of mature phase
Duration (months) of expansion
Duration (months) of mature phase
09-01-1957 10-01-1958 12-31-1958 01-01-1959 04-30-1960 3 1605-01-1960 04-01-1961 06-30-1963 07-01-1963 12-31-1969 27 7901-01-1970 05-16-1970 01-01-1971 03-31-1972 04-01-1972 11-30-1973 15 2012-01-1973 10-03-1974 10-01-1975 06-30-1977 07-01-1977 01-31-1980 21 3102-01-1980 08-12-1982 04-01-1983 12-31-1988 01-01-1989 07-31-1990 70 1908-01-1990 10-11-1990 10-01-1991 09-30-1996 10-01-1996 03-31-2001 61 5504-01-2001 09-21-2001 01-01-2002 12-31-2004 01-01-2005 12-31-2007 37 3601-01-2008 03-09-2009 04-01-2011 12-31-2017 01-01-2018 02-28-2020 82 26
average 40 35median 32 29
U.S.: Duration of mature phases since 1957
NBF Economics and Strategy (data via Refinitiv and NBER)
Stock Market and Portfolio Strategy
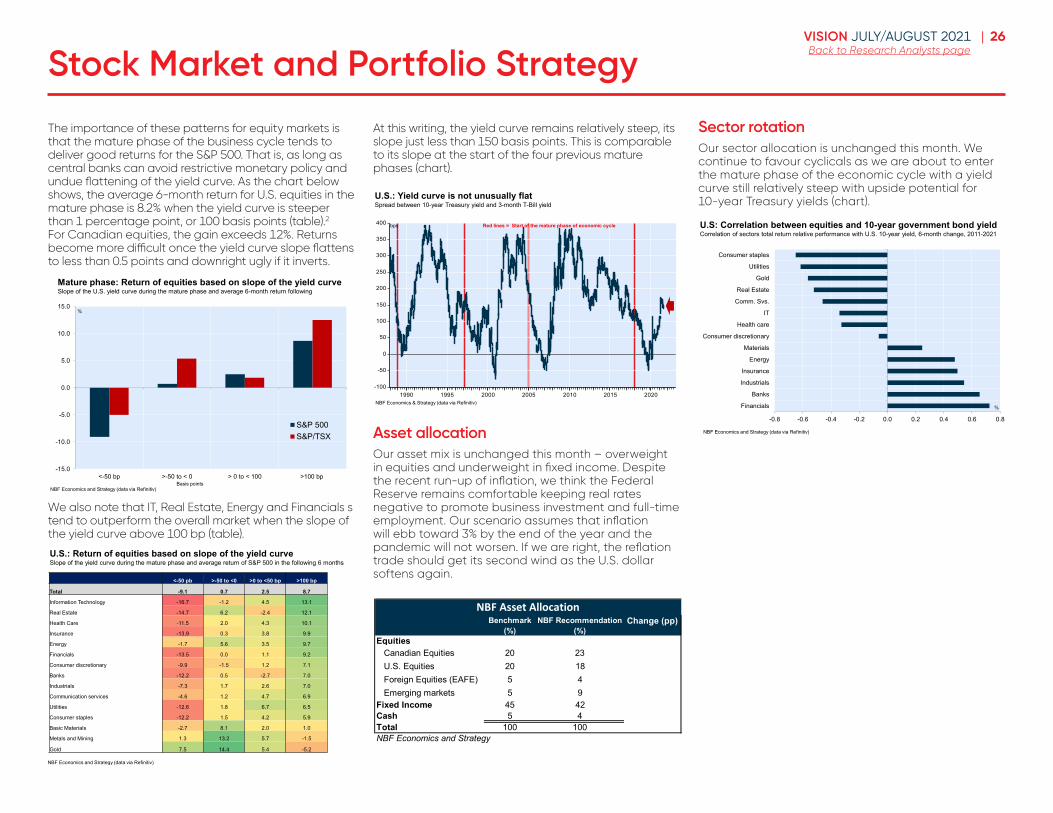
26VISION JULY/AUGUST 2021 |Back to Research Analysts pageStock Market and Portfolio Strategy
The importance of these patterns for equity markets is that the mature phase of the business cycle tends to deliver good returns for the S&P 500. That is, as long as central banks can avoid restrictive monetary policy and undue flattening of the yield curve. As the chart below shows, the average 6-month return for U.S. equities in the mature phase is 8.2% when the yield curve is steeper than 1 percentage point, or 100 basis points (table).2 For Canadian equities, the gain exceeds 12%. Returns become more difficult once the yield curve slope flattens to less than 0.5 points and downright ugly if it inverts.
Mature phase: Return of equities based on slope of the yield curveSlope of the U.S. yield curve during the mature phase and average 6-month return following
NBF Economics and Strategy (data via Refinitiv)
-15.0
-10.0
-5.0
0.0
5.0
10.0
15.0
<-50 bp >-50 to < 0 > 0 to < 100 >100 bp
S&P 500S&P/TSX
%
Basis points
We also note that IT, Real Estate, Energy and Financials s tend to outperform the overall market when the slope of the yield curve above 100 bp (table).
NBF Economics and Strategy (data via Refinitiv)
<-50 pb >-50 to <0 >0 to <50 bp >100 bp
Total -9.1 0.7 2.5 8.7
Information Technology -16.7 -1.2 4.5 13.1
Real Estate -14.7 6.2 -2.4 12.1
Health Care -11.5 2.0 4.3 10.1
Insurance -13.9 0.3 3.8 9.9
Energy -1.7 5.6 3.5 9.7
Financials -13.5 0.0 1.1 9.2
Consumer discretionary -9.9 -1.5 1.2 7.1
Banks -12.2 0.5 -2.7 7.0
Industrials -7.3 1.7 2.6 7.0
Communication services -4.6 1.2 4.7 6.9
Utilities -12.6 1.8 6.7 6.5
Consumer staples -12.2 1.5 4.2 5.9
Basic Materials -2.7 8.1 2.0 1.0
Metals and Mining 1.3 13.2 5.7 -1.5
Gold 7.5 14.4 5.4 -5.2
U.S.: Return of equities based on slope of the yield curveSlope of the yield curve during the mature phase and average return of S&P 500 in the following 6 months
At this writing, the yield curve remains relatively steep, its slope just less than 150 basis points. This is comparable to its slope at the start of the four previous mature phases (chart).
-100
-50
0
50
100
150
200
250
300
350
400
1990 1995 2000 2005 2010 2015 2020
U.S.: Yield curve is not unusually flatSpread between 10-year Treasury yield and 3-month T-Bill yield
NBF Economics & Strategy (data via Refinitiv)
bps Red lines = Start of the mature phase of economic cycle
Asset allocationOur asset mix is unchanged this month – overweight in equities and underweight in fixed income. Despite the recent run-up of inflation, we think the Federal Reserve remains comfortable keeping real rates negative to promote business investment and full-time employment. Our scenario assumes that inflation will ebb toward 3% by the end of the year and the pandemic will not worsen. If we are right, the reflation trade should get its second wind as the U.S. dollar softens again.
Benchmark (%)
NBF Recommendation (%)
Change (pp)
EquitiesCanadian Equities 20 23U.S. Equities 20 18Foreign Equities (EAFE) 5 4Emerging markets 5 9
Fixed Income 45 42Cash 5 4Total 100 100NBF Economics and Strategy
NBF Asset Allocation
Sector rotationOur sector allocation is unchanged this month. We continue to favour cyclicals as we are about to enter the mature phase of the economic cycle with a yield curve still relatively steep with upside potential for 10-year Treasury yields (chart).
-0.8 -0.6 -0.4 -0.2 0.0 0.2 0.4 0.6 0.8
Financials
Banks
Industrials
Insurance
Energy
Materials
Consumer discretionary
Health care
IT
Comm. Svs.
Real Estate
Gold
Utilities
Consumer staples
U.S: Correlation between equities and 10-year government bond yieldCorrelation of sectors total return relative performance with U.S. 10-year yield, 6-month change, 2011-2021
%
NBF Economics and Strategy (data via Refinitiv)
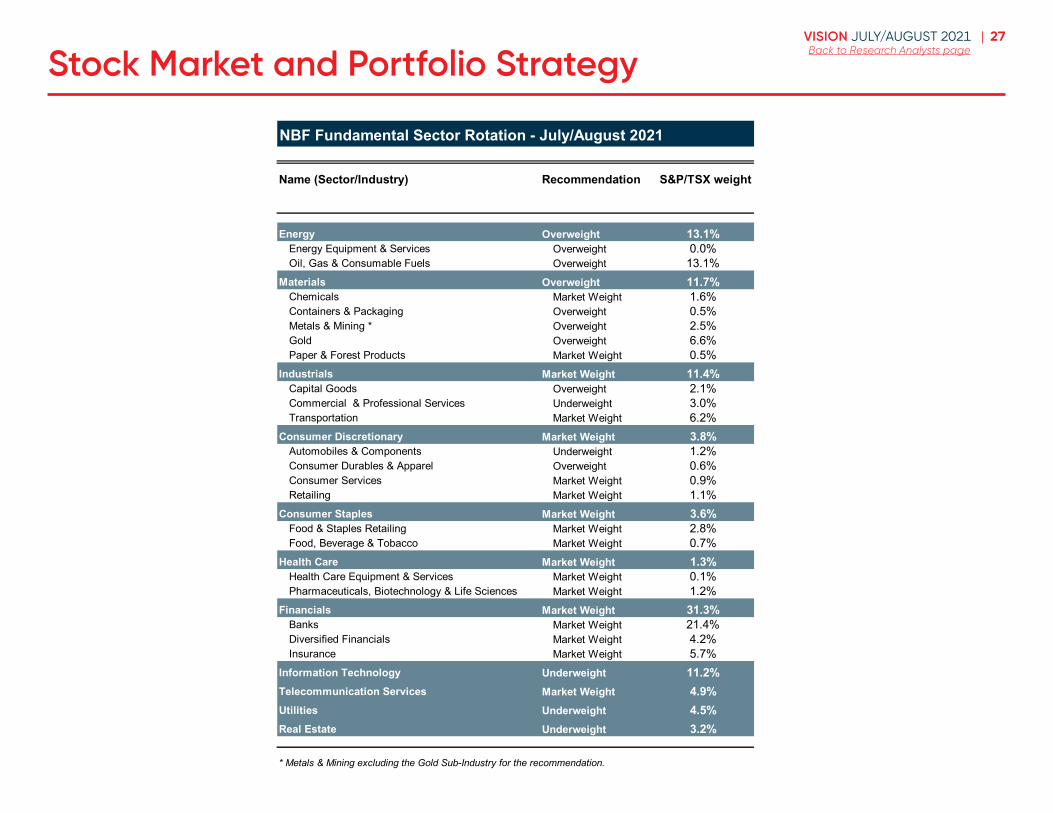
27VISION JULY/AUGUST 2021 |Back to Research Analysts pageStock Market and Portfolio Strategy
NBF Fundamental Sector Rotation - July/August 2021
Name (Sector/Industry) Recommendation S&P/TSX weight
Energy Overweight 13.1%Energy Equipment & Services Overweight 0.0%Oil, Gas & Consumable Fuels Overweight 13.1%
Materials Overweight 11.7%Chemicals Market Weight 1.6%Containers & Packaging Overweight 0.5%Metals & Mining * Overweight 2.5%Gold Overweight 6.6%Paper & Forest Products Market Weight 0.5%
Industrials Market Weight 11.4%Capital Goods Overweight 2.1%Commercial & Professional Services Underweight 3.0%Transportation Market Weight 6.2%
Consumer Discretionary Market Weight 3.8%Automobiles & Components Underweight 1.2%Consumer Durables & Apparel Overweight 0.6%Consumer Services Market Weight 0.9%Retailing Market Weight 1.1%
Consumer Staples Market Weight 3.6%Food & Staples Retailing Market Weight 2.8%Food, Beverage & Tobacco Market Weight 0.7%
Health Care Market Weight 1.3%Health Care Equipment & Services Market Weight 0.1%Pharmaceuticals, Biotechnology & Life Sciences Market Weight 1.2%
Financials Market Weight 31.3%Banks Market Weight 21.4%Diversified Financials Market Weight 4.2%Insurance Market Weight 5.7%
Information Technology Underweight 11.2%Telecommunication Services Market Weight 4.9%Utilities Underweight 4.5%Real Estate Underweight 3.2%
* Metals & Mining excluding the Gold Sub-Industry for the recommendation.
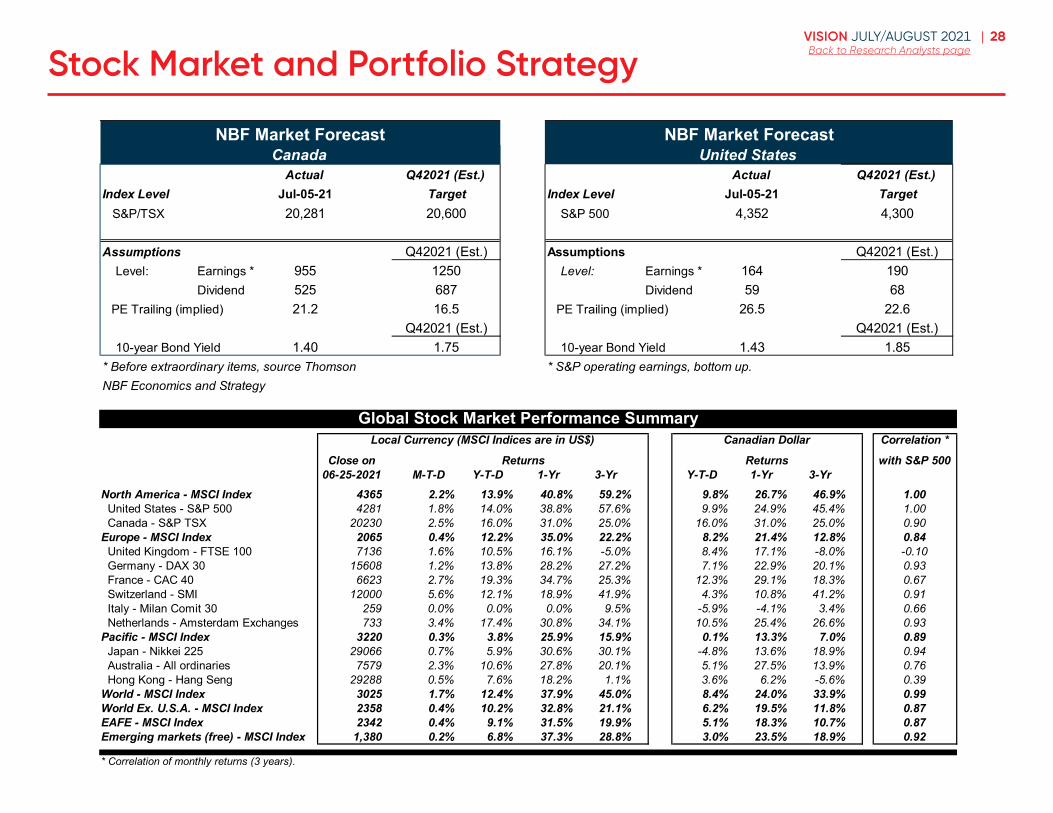
28VISION JULY/AUGUST 2021 |Back to Research Analysts page
Actual Q42021 (Est.) Actual Q42021 (Est.)Index Level Jul-05-21 Target Index Level Jul-05-21 Target S&P/TSX 20,281 20,600 S&P 500 4,352 4,300
Assumptions Q42021 (Est.) Assumptions Q42021 (Est.) Level: Earnings * 955 1250 Level: Earnings * 164 190
Dividend 525 687 Dividend 59 68PE Trailing (implied) 21.2 16.5 PE Trailing (implied) 26.5 22.6
Q42021 (Est.) Q42021 (Est.) 10-year Bond Yield 1.40 1.75 10-year Bond Yield 1.43 1.85* Before extraordinary items, source Thomson * S&P operating earnings, bottom up.NBF Economics and Strategy
NBF Market ForecastCanada
NBF Market ForecastUnited States
Local Currency (MSCI Indices are in US$) Canadian Dollar Correlation *
Close on with S&P 50006-25-2021 M-T-D Y-T-D 1-Yr 3-Yr Y-T-D 1-Yr 3-Yr
North America - MSCI Index 4365 2.2% 13.9% 40.8% 59.2% 9.8% 26.7% 46.9% 1.00 United States - S&P 500 4281 1.8% 14.0% 38.8% 57.6% 9.9% 24.9% 45.4% 1.00 Canada - S&P TSX 20230 2.5% 16.0% 31.0% 25.0% 16.0% 31.0% 25.0% 0.90Europe - MSCI Index 2065 0.4% 12.2% 35.0% 22.2% 8.2% 21.4% 12.8% 0.84 United Kingdom - FTSE 100 7136 1.6% 10.5% 16.1% -5.0% 8.4% 17.1% -8.0% -0.10 Germany - DAX 30 15608 1.2% 13.8% 28.2% 27.2% 7.1% 22.9% 20.1% 0.93 France - CAC 40 6623 2.7% 19.3% 34.7% 25.3% 12.3% 29.1% 18.3% 0.67 Switzerland - SMI 12000 5.6% 12.1% 18.9% 41.9% 4.3% 10.8% 41.2% 0.91 Italy - Milan Comit 30 259 0.0% 0.0% 0.0% 9.5% -5.9% -4.1% 3.4% 0.66 Netherlands - Amsterdam Exchanges 733 3.4% 17.4% 30.8% 34.1% 10.5% 25.4% 26.6% 0.93Pacific - MSCI Index 3220 0.3% 3.8% 25.9% 15.9% 0.1% 13.3% 7.0% 0.89 Japan - Nikkei 225 29066 0.7% 5.9% 30.6% 30.1% -4.8% 13.6% 18.9% 0.94 Australia - All ordinaries 7579 2.3% 10.6% 27.8% 20.1% 5.1% 27.5% 13.9% 0.76 Hong Kong - Hang Seng 29288 0.5% 7.6% 18.2% 1.1% 3.6% 6.2% -5.6% 0.39World - MSCI Index 3025 1.7% 12.4% 37.9% 45.0% 8.4% 24.0% 33.9% 0.99World Ex. U.S.A. - MSCI Index 2358 0.4% 10.2% 32.8% 21.1% 6.2% 19.5% 11.8% 0.87EAFE - MSCI Index 2342 0.4% 9.1% 31.5% 19.9% 5.1% 18.3% 10.7% 0.87Emerging markets (free) - MSCI Index 1,380 0.2% 6.8% 37.3% 28.8% 3.0% 23.5% 18.9% 0.92
* Correlation of monthly returns (3 years).
Global Stock Market Performance Summary
Returns Returns
Stock Market and Portfolio Strategy
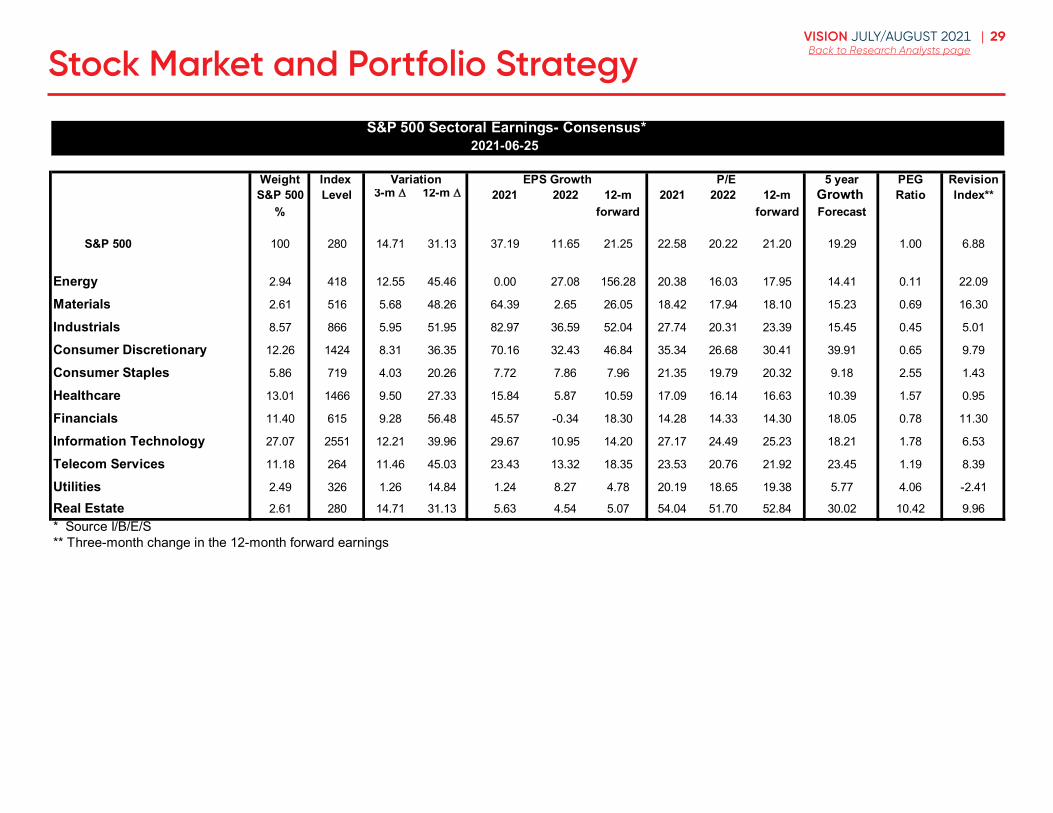
29VISION JULY/AUGUST 2021 |Back to Research Analysts page
S&P 500 Sectoral Earnings- Consensus*2021-06-25
Weight Index 5 year PEG RevisionS&P 500 Level 3-m D 12-m D 2021 2022 12-m 2021 2022 12-m Growth Ratio Index**
% forward forward Forecast
S&P 500 100 280 14.71 31.13 37.19 11.65 21.25 22.58 20.22 21.20 19.29 1.00 6.88
Energy 2.94 418 12.55 45.46 0.00 27.08 156.28 20.38 16.03 17.95 14.41 0.11 22.09
Materials 2.61 516 5.68 48.26 64.39 2.65 26.05 18.42 17.94 18.10 15.23 0.69 16.30
Industrials 8.57 866 5.95 51.95 82.97 36.59 52.04 27.74 20.31 23.39 15.45 0.45 5.01
Consumer Discretionary 12.26 1424 8.31 36.35 70.16 32.43 46.84 35.34 26.68 30.41 39.91 0.65 9.79
Consumer Staples 5.86 719 4.03 20.26 7.72 7.86 7.96 21.35 19.79 20.32 9.18 2.55 1.43
Healthcare 13.01 1466 9.50 27.33 15.84 5.87 10.59 17.09 16.14 16.63 10.39 1.57 0.95
Financials 11.40 615 9.28 56.48 45.57 -0.34 18.30 14.28 14.33 14.30 18.05 0.78 11.30
Information Technology 27.07 2551 12.21 39.96 29.67 10.95 14.20 27.17 24.49 25.23 18.21 1.78 6.53
Telecom Services 11.18 264 11.46 45.03 23.43 13.32 18.35 23.53 20.76 21.92 23.45 1.19 8.39
Utilities 2.49 326 1.26 14.84 1.24 8.27 4.78 20.19 18.65 19.38 5.77 4.06 -2.41
Real Estate 2.61 280 14.71 31.13 5.63 4.54 5.07 54.04 51.70 52.84 30.02 10.42 9.96* Source I/B/E/S** Three-month change in the 12-month forward earnings
Variation EPS Growth P/E
Stock Market and Portfolio Strategy
30VISION JULY/AUGUST 2021 |Back to Research Analysts pageTechnical Analysis
Technical Analysis
Dennis Mark, cfa Analyst 416-869-7427
Technical perspectives on the Energy marketThe energy sector has been one of the best performing sectors in 2021. Not bad for a sector that is so out of favour with growing competition from alternative sources. Prices have come a long way leaving investors wondering how much more is left. A long-term technical perspective on this sector suggests a continuing recovery is underway with potential for further upside. Investors should use weakness to add to energy stock positions.
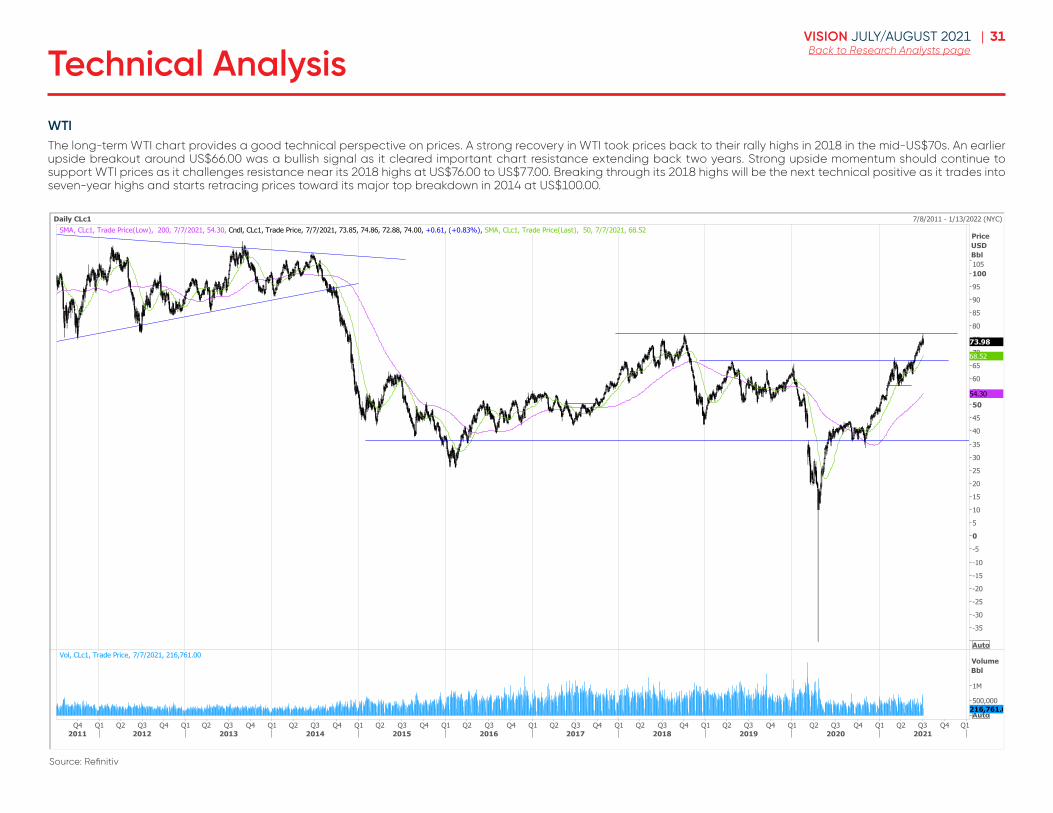
31VISION JULY/AUGUST 2021 |Back to Research Analysts pageTechnical Analysis
Daily CLc1 7/8/2011 - 1/13/2022 (NYC)SMA, CLc1, Trade Price(Low), 200, 7/7/2021, 54.30, Cndl, CLc1, Trade Price, 7/7/2021, 73.85, 74.86, 72.88, 74.00, +0.61, (+0.83%), SMA, CLc1, Trade Price(Last), 50, 7/7/2021, 68.52
PriceUSDBbl
Auto
-35
-30
-25
-20
-15
-10
-5
0
5
10
15
20
25
30
35
40
45
50
55
60
65
70
75
80
85
90
95
100105
54.30
73.98
68.52
Vol, CLc1, Trade Price, 7/7/2021, 216,761.00VolumeBbl
Auto
500,000
1M
216,761.00
Q4 Q1 Q2 Q3 Q4 Q1 Q2 Q3 Q4 Q1 Q2 Q3 Q4 Q1 Q2 Q3 Q4 Q1 Q2 Q3 Q4 Q1 Q2 Q3 Q4 Q1 Q2 Q3 Q4 Q1 Q2 Q3 Q4 Q1 Q2 Q3 Q4 Q1 Q2 Q3 Q4 Q12011 2012 2013 2014 2015 2016 2017 2018 2019 2020 2021
WTIThe long-term WTI chart provides a good technical perspective on prices. A strong recovery in WTI took prices back to their rally highs in 2018 in the mid-US$70s. An earlier upside breakout around US$66.00 was a bullish signal as it cleared important chart resistance extending back two years. Strong upside momentum should continue to support WTI prices as it challenges resistance near its 2018 highs at US$76.00 to US$77.00. Breaking through its 2018 highs will be the next technical positive as it trades into seven-year highs and starts retracing prices toward its major top breakdown in 2014 at US$100.00.
Source: Refinitiv
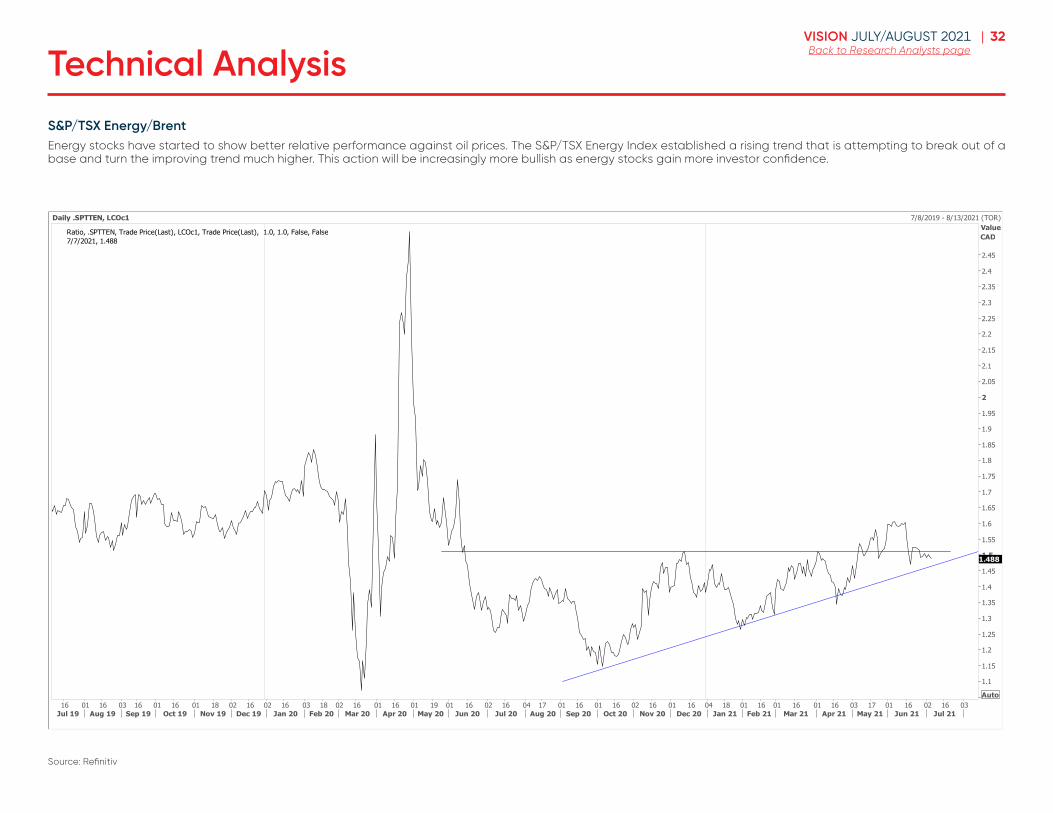
32VISION JULY/AUGUST 2021 |Back to Research Analysts pageTechnical Analysis
Daily .SPTTEN, LCOc1 7/8/2019 - 8/13/2021 (TOR)
Ratio, .SPTTEN, Trade Price(Last), LCOc1, Trade Price(Last), 1.0, 1.0, False, False7/7/2021, 1.488
ValueCAD
Auto
1.1
1.15
1.2
1.25
1.3
1.35
1.4
1.45
1.5
1.55
1.6
1.65
1.7
1.75
1.8
1.85
1.9
1.95
2
2.05
2.1
2.15
2.2
2.25
2.3
2.35
2.4
2.45
1.488
16 01 16 03 16 01 16 01 18 02 16 02 16 03 18 02 16 01 16 01 19 01 16 02 16 04 17 01 16 01 16 02 16 01 16 04 18 01 16 01 16 01 16 03 17 01 16 02 16 03Jul 19 Aug 19 Sep 19 Oct 19 Nov 19 Dec 19 Jan 20 Feb 20 Mar 20 Apr 20 May 20 Jun 20 Jul 20 Aug 20 Sep 20 Oct 20 Nov 20 Dec 20 Jan 21 Feb 21 Mar 21 Apr 21 May 21 Jun 21 Jul 21
S&P/TSX Energy/BrentEnergy stocks have started to show better relative performance against oil prices. The S&P/TSX Energy Index established a rising trend that is attempting to break out of a base and turn the improving trend much higher. This action will be increasingly more bullish as energy stocks gain more investor confidence.
Source: Refinitiv
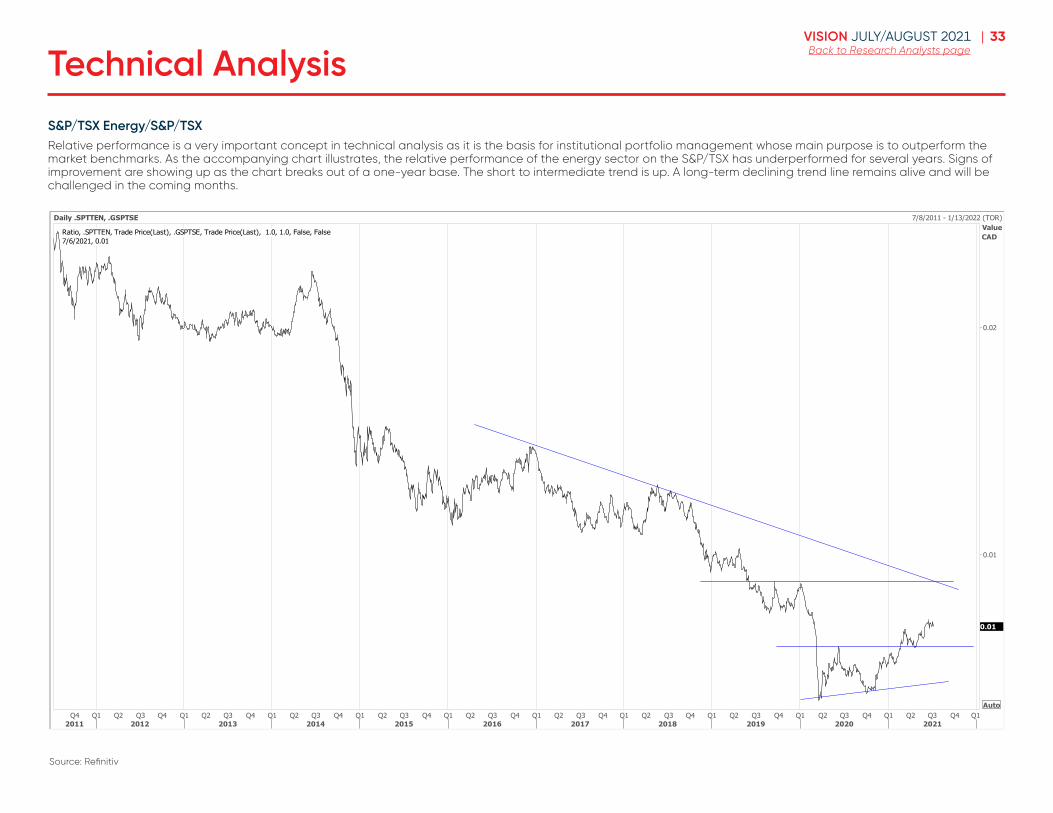
33VISION JULY/AUGUST 2021 |Back to Research Analysts pageTechnical Analysis
Daily .SPTTEN, .GSPTSE 7/8/2011 - 1/13/2022 (TOR)
Ratio, .SPTTEN, Trade Price(Last), .GSPTSE, Trade Price(Last), 1.0, 1.0, False, False7/6/2021, 0.01
ValueCAD
Auto
0.01
0.02
0.01
Q4 Q1 Q2 Q3 Q4 Q1 Q2 Q3 Q4 Q1 Q2 Q3 Q4 Q1 Q2 Q3 Q4 Q1 Q2 Q3 Q4 Q1 Q2 Q3 Q4 Q1 Q2 Q3 Q4 Q1 Q2 Q3 Q4 Q1 Q2 Q3 Q4 Q1 Q2 Q3 Q4 Q12011 2012 2013 2014 2015 2016 2017 2018 2019 2020 2021
S&P/TSX Energy/S&P/TSXRelative performance is a very important concept in technical analysis as it is the basis for institutional portfolio management whose main purpose is to outperform the market benchmarks. As the accompanying chart illustrates, the relative performance of the energy sector on the S&P/TSX has underperformed for several years. Signs of improvement are showing up as the chart breaks out of a one-year base. The short to intermediate trend is up. A long-term declining trend line remains alive and will be challenged in the coming months.
Source: Refinitiv

34VISION JULY/AUGUST 2021 |Back to Research Analysts pageTechnical Analysis
Daily PD.TO 7/8/2016 - 10/12/2021 (TOR)SMA, PD.TO, Trade Price(Low), 200, 7/7/2021, 28.57, Cndl, PD.TO, Trade Price, 7/7/2021, 51.95, 52.09, 50.23, 50.33, -1.77, (-3.40%), SMA, PD.TO, Trade Price(Last), 50, 7/7/2021, 41.38
PriceCAD
Auto10
15
20
25
30
35
40
45
50
55
60
65
70
75
80
85
90
95
100
105
110
115
120
125
130
135
140
145
150
155160
28.57
50.33
41.38
Vol, PD.TO, Trade Price, 7/7/2021, 25,193.00Volume
Auto200,000400,000
25,193.00A S O N D J F M A M J J A S O N D J F M A M J J A S O N D J F M A M J J A S O N D J F M A M J J A S O N D J F M A M J J A S O
Q3 2016 Q4 2016 Q1 2017 Q2 2017 Q3 2017 Q4 2017 Q1 2018 Q2 2018 Q3 2018 Q4 2018 Q1 2019 Q2 2019 Q3 2019 Q4 2019 Q1 2020 Q2 2020 Q3 2020 Q4 2020 Q1 2021 Q2 2021 Q3 2021
Precision Drilling Corp . (PD)The PD chart is well on the road to recovery as it breaks out of its basing action to the upside. A declining trend line over the past five years was recently severed as the stock continues to recover. Breakouts at $36.00 and $41.00 are technically positive as bottoming formations are completed and the stock emerges into a bull phase. The strong volume profile since late 2020 reflects the greatly improved buying interest. Use pullbacks to add to positions near $40.00. Target is $80.00.
Source: Refinitiv
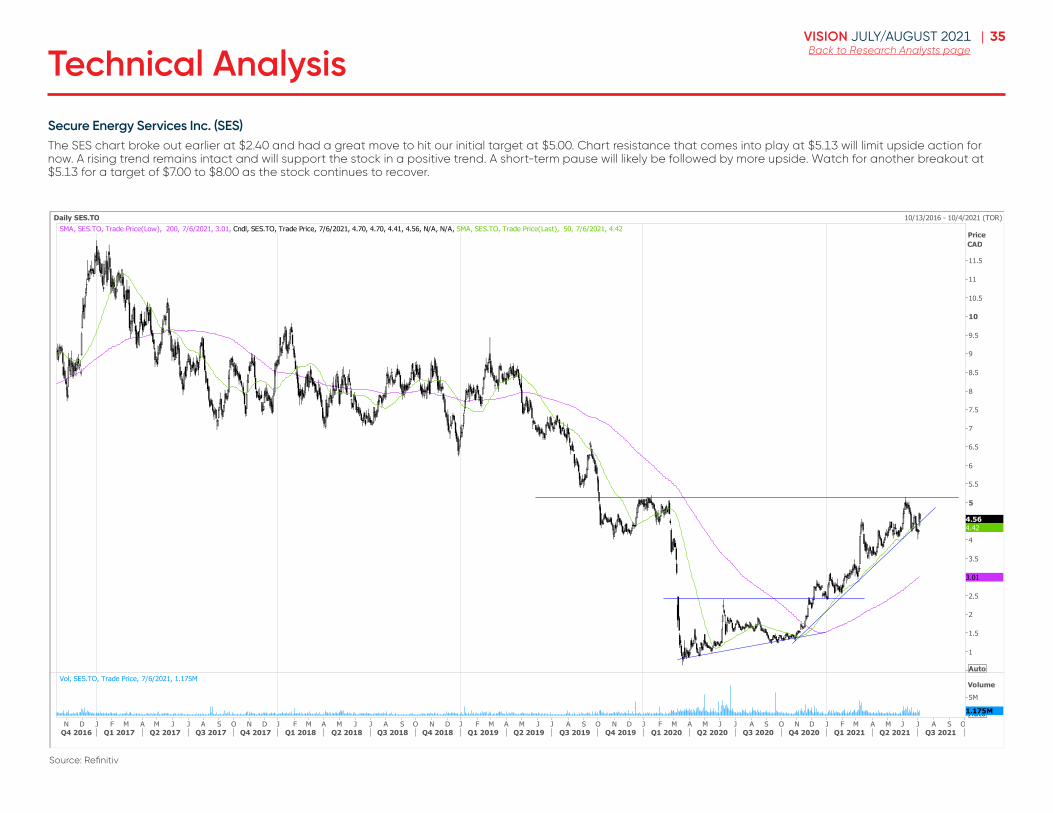
35VISION JULY/AUGUST 2021 |Back to Research Analysts pageTechnical Analysis
Daily SES.TO 10/13/2016 - 10/4/2021 (TOR)SMA, SES.TO, Trade Price(Low), 200, 7/6/2021, 3.01, Cndl, SES.TO, Trade Price, 7/6/2021, 4.70, 4.70, 4.41, 4.56, N/A, N/A, SMA, SES.TO, Trade Price(Last), 50, 7/6/2021, 4.42
PriceCAD
Auto
1
1.5
2
2.5
3
3.5
4
4.5
5
5.5
6
6.5
7
7.5
8
8.5
9
9.5
10
10.5
11
11.5
3.01
4.564.42
Vol, SES.TO, Trade Price, 7/6/2021, 1.175MVolume
Auto
5M
1.175M
N D J F M A M J J A S O N D J F M A M J J A S O N D J F M A M J J A S O N D J F M A M J J A S O N D J F M A M J J A S OQ4 2016 Q1 2017 Q2 2017 Q3 2017 Q4 2017 Q1 2018 Q2 2018 Q3 2018 Q4 2018 Q1 2019 Q2 2019 Q3 2019 Q4 2019 Q1 2020 Q2 2020 Q3 2020 Q4 2020 Q1 2021 Q2 2021 Q3 2021
Secure Energy Services Inc . (SES)The SES chart broke out earlier at $2.40 and had a great move to hit our initial target at $5.00. Chart resistance that comes into play at $5.13 will limit upside action for now. A rising trend remains intact and will support the stock in a positive trend. A short-term pause will likely be followed by more upside. Watch for another breakout at $5.13 for a target of $7.00 to $8.00 as the stock continues to recover.
Source: Refinitiv
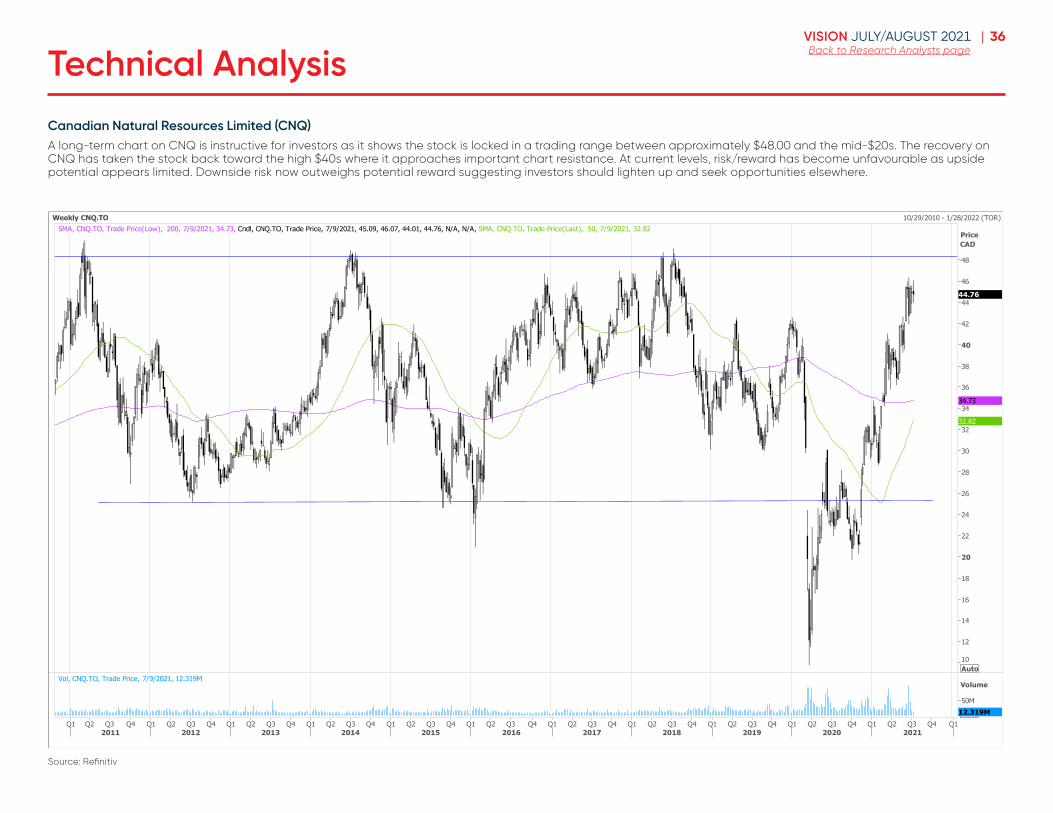
36VISION JULY/AUGUST 2021 |Back to Research Analysts pageTechnical Analysis
Weekly CNQ.TO 10/29/2010 - 1/28/2022 (TOR)SMA, CNQ.TO, Trade Price(Low), 200, 7/9/2021, 34.73, Cndl, CNQ.TO, Trade Price, 7/9/2021, 45.09, 46.07, 44.01, 44.76, N/A, N/A, SMA, CNQ.TO, Trade Price(Last), 50, 7/9/2021, 32.82
PriceCAD
Auto10
12
14
16
18
20
22
24
26
28
30
32
34
36
38
40
42
44
46
48
34.73
44.76
32.82
Vol, CNQ.TO, Trade Price, 7/9/2021, 12.319MVolume
Auto
50M12.319M
Q1 Q2 Q3 Q4 Q1 Q2 Q3 Q4 Q1 Q2 Q3 Q4 Q1 Q2 Q3 Q4 Q1 Q2 Q3 Q4 Q1 Q2 Q3 Q4 Q1 Q2 Q3 Q4 Q1 Q2 Q3 Q4 Q1 Q2 Q3 Q4 Q1 Q2 Q3 Q4 Q1 Q2 Q3 Q4 Q12011 2012 2013 2014 2015 2016 2017 2018 2019 2020 2021
Canadian Natural Resources Limited (CNQ)A long-term chart on CNQ is instructive for investors as it shows the stock is locked in a trading range between approximately $48.00 and the mid-$20s. The recovery on CNQ has taken the stock back toward the high $40s where it approaches important chart resistance. At current levels, risk/reward has become unfavourable as upside potential appears limited. Downside risk now outweighs potential reward suggesting investors should lighten up and seek opportunities elsewhere.
Source: Refinitiv
37VISION JULY/AUGUST 2021 |Back to Research Analysts pageSector Analysis
Sector Analysis
In this section, commentaries and stock closing prices are based on the information available up to July 8, 2021 .
Information in this section is based on NBF analysis and estimates and Refinitiv.
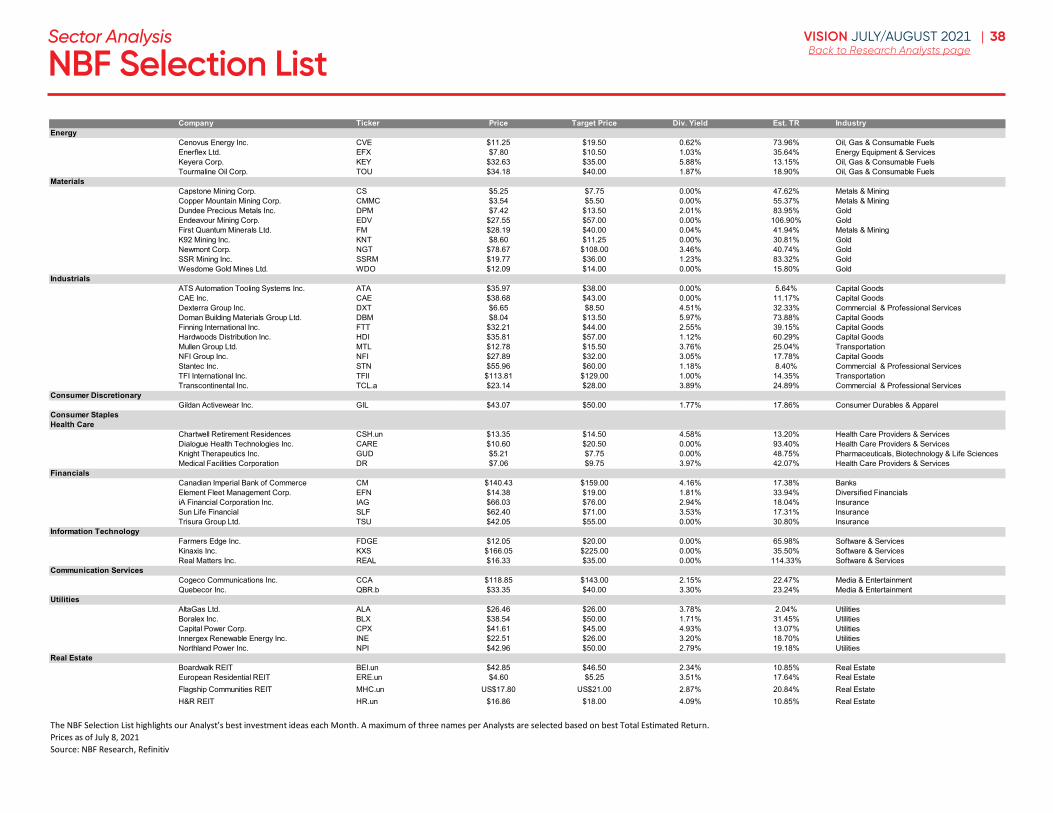
38VISION JULY/AUGUST 2021 |Back to Research Analysts pageNBF Selection List
Company Ticker Price Target Price Div. Yield Est. TR IndustryEnergy
Cenovus Energy Inc. CVE $11.25 $19.50 0.62% 73.96% Oil, Gas & Consumable FuelsEnerflex Ltd. EFX $7.80 $10.50 1.03% 35.64% Energy Equipment & ServicesKeyera Corp. KEY $32.63 $35.00 5.88% 13.15% Oil, Gas & Consumable FuelsTourmaline Oil Corp. TOU $34.18 $40.00 1.87% 18.90% Oil, Gas & Consumable Fuels
Materials Capstone Mining Corp. CS $5.25 $7.75 0.00% 47.62% Metals & MiningCopper Mountain Mining Corp. CMMC $3.54 $5.50 0.00% 55.37% Metals & MiningDundee Precious Metals Inc. DPM $7.42 $13.50 2.01% 83.95% GoldEndeavour Mining Corp. EDV $27.55 $57.00 0.00% 106.90% GoldFirst Quantum Minerals Ltd. FM $28.19 $40.00 0.04% 41.94% Metals & MiningK92 Mining Inc. KNT $8.60 $11.25 0.00% 30.81% GoldNewmont Corp. NGT $78.67 $108.00 3.46% 40.74% GoldSSR Mining Inc. SSRM $19.77 $36.00 1.23% 83.32% GoldWesdome Gold Mines Ltd. WDO $12.09 $14.00 0.00% 15.80% Gold
Industrials ATS Automation Tooling Systems Inc. ATA $35.97 $38.00 0.00% 5.64% Capital GoodsCAE Inc. CAE $38.68 $43.00 0.00% 11.17% Capital GoodsDexterra Group Inc. DXT $6.65 $8.50 4.51% 32.33% Commercial & Professional ServicesDoman Building Materials Group Ltd. DBM $8.04 $13.50 5.97% 73.88% Capital GoodsFinning International Inc. FTT $32.21 $44.00 2.55% 39.15% Capital GoodsHardwoods Distribution Inc. HDI $35.81 $57.00 1.12% 60.29% Capital GoodsMullen Group Ltd. MTL $12.78 $15.50 3.76% 25.04% TransportationNFI Group Inc. NFI $27.89 $32.00 3.05% 17.78% Capital GoodsStantec Inc. STN $55.96 $60.00 1.18% 8.40% Commercial & Professional ServicesTFI International Inc. TFII $113.81 $129.00 1.00% 14.35% TransportationTranscontinental Inc. TCL.a $23.14 $28.00 3.89% 24.89% Commercial & Professional Services
Consumer Discretionary Gildan Activewear Inc. GIL $43.07 $50.00 1.77% 17.86% Consumer Durables & Apparel
Consumer Staples Health Care
Chartwell Retirement Residences CSH.un $13.35 $14.50 4.58% 13.20% Health Care Providers & ServicesDialogue Health Technologies Inc. CARE $10.60 $20.50 0.00% 93.40% Health Care Providers & ServicesKnight Therapeutics Inc. GUD $5.21 $7.75 0.00% 48.75% Pharmaceuticals, Biotechnology & Life SciencesMedical Facilities Corporation DR $7.06 $9.75 3.97% 42.07% Health Care Providers & Services
Financials Canadian Imperial Bank of Commerce CM $140.43 $159.00 4.16% 17.38% BanksElement Fleet Management Corp. EFN $14.38 $19.00 1.81% 33.94% Diversified FinancialsiA Financial Corporation Inc. IAG $66.03 $76.00 2.94% 18.04% InsuranceSun Life Financial SLF $62.40 $71.00 3.53% 17.31% InsuranceTrisura Group Ltd. TSU $42.05 $55.00 0.00% 30.80% Insurance
Information Technology Farmers Edge Inc. FDGE $12.05 $20.00 0.00% 65.98% Software & ServicesKinaxis Inc. KXS $166.05 $225.00 0.00% 35.50% Software & ServicesReal Matters Inc. REAL $16.33 $35.00 0.00% 114.33% Software & Services
Communication Services Cogeco Communications Inc. CCA $118.85 $143.00 2.15% 22.47% Media & EntertainmentQuebecor Inc. QBR.b $33.35 $40.00 3.30% 23.24% Media & Entertainment
Utilities AltaGas Ltd. ALA $26.46 $26.00 3.78% 2.04% UtilitiesBoralex Inc. BLX $38.54 $50.00 1.71% 31.45% UtilitiesCapital Power Corp. CPX $41.61 $45.00 4.93% 13.07% UtilitiesInnergex Renewable Energy Inc. INE $22.51 $26.00 3.20% 18.70% UtilitiesNorthland Power Inc. NPI $42.96 $50.00 2.79% 19.18% Utilities
Real Estate Boardwalk REIT BEI.un $42.85 $46.50 2.34% 10.85% Real EstateEuropean Residential REIT ERE.un $4.60 $5.25 3.51% 17.64% Real EstateFlagship Communities REIT MHC.un US$17.80 US$21.00 2.87% 20.84% Real EstateH&R REIT HR.un $16.86 $18.00 4.09% 10.85% Real Estate
The NBF Selection List highlights our Analyst’s best investment ideas each Month. A maximum of three names per Analysts are selected based on best Total Estimated Return.Prices as of July 8, 2021Source: NBF Research, Refinitiv
Sector Analysis
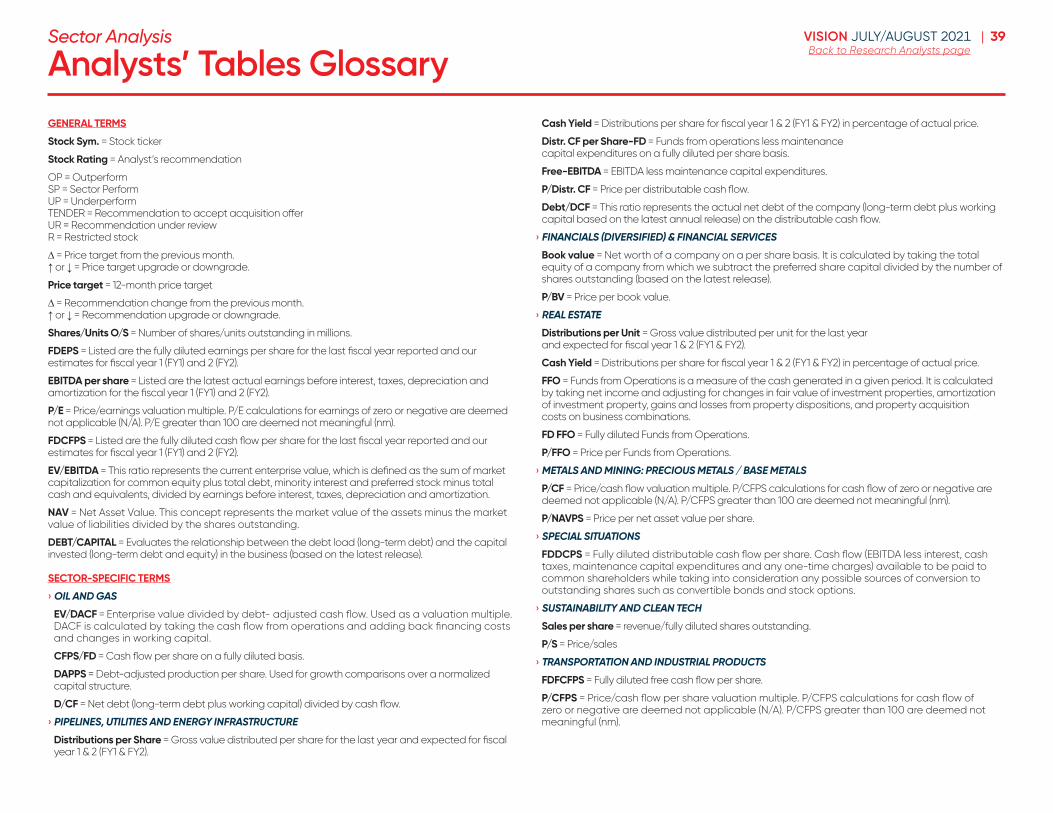
39VISION JULY/AUGUST 2021 |Back to Research Analysts pageAnalysts’ Tables Glossary
GENERAL TERMS
Stock Sym. = Stock ticker
Stock Rating = Analyst’s recommendation
OP = Outperform SP = Sector Perform UP = Underperform TENDER = Recommendation to accept acquisition offer UR = Recommendation under review R = Restricted stock
∆ = Price target from the previous month. ↑ or ↓ = Price target upgrade or downgrade.
Price target = 12-month price target
∆ = Recommendation change from the previous month. ↑ or ↓ = Recommendation upgrade or downgrade.
Shares/Units O/S = Number of shares/units outstanding in millions.
FDEPS = Listed are the fully diluted earnings per share for the last fiscal year reported and our estimates for fiscal year 1 (FY1) and 2 (FY2).
EBITDA per share = Listed are the latest actual earnings before interest, taxes, depreciation and amortization for the fiscal year 1 (FY1) and 2 (FY2).
P/E = Price/earnings valuation multiple. P/E calculations for earnings of zero or negative are deemed not applicable (N/A). P/E greater than 100 are deemed not meaningful (nm).
FDCFPS = Listed are the fully diluted cash flow per share for the last fiscal year reported and our estimates for fiscal year 1 (FY1) and 2 (FY2).
EV/EBITDA = This ratio represents the current enterprise value, which is defined as the sum of market capitalization for common equity plus total debt, minority interest and preferred stock minus total cash and equivalents, divided by earnings before interest, taxes, depreciation and amortization.
NAV = Net Asset Value. This concept represents the market value of the assets minus the market value of liabilities divided by the shares outstanding.
DEBT/CAPITAL = Evaluates the relationship between the debt load (long-term debt) and the capital invested (long-term debt and equity) in the business (based on the latest release).
SECTOR-SPECIFIC TERMS
› OIL AND GAS
EV/DACF = Enterprise value divided by debt- adjusted cash flow. Used as a valuation multiple. DACF is calculated by taking the cash flow from operations and adding back financing costs and changes in working capital.
CFPS/FD = Cash flow per share on a fully diluted basis.
DAPPS = Debt-adjusted production per share. Used for growth comparisons over a normalized capital structure.
D/CF = Net debt (long-term debt plus working capital) divided by cash flow.
› PIPELINES, UTILITIES AND ENERGY INFRASTRUCTURE
Distributions per Share = Gross value distributed per share for the last year and expected for fiscal year 1 & 2 (FY1 & FY2).
Cash Yield = Distributions per share for fiscal year 1 & 2 (FY1 & FY2) in percentage of actual price.
Distr. CF per Share-FD = Funds from operations less maintenance capital expenditures on a fully diluted per share basis.
Free-EBITDA = EBITDA less maintenance capital expenditures.
P/Distr. CF = Price per distributable cash flow.
Debt/DCF = This ratio represents the actual net debt of the company (long-term debt plus working capital based on the latest annual release) on the distributable cash flow.
› FINANCIALS (DIVERSIFIED) & FINANCIAL SERVICES
Book value = Net worth of a company on a per share basis. It is calculated by taking the total equity of a company from which we subtract the preferred share capital divided by the number of shares outstanding (based on the latest release).
P/BV = Price per book value.
› REAL ESTATE
Distributions per Unit = Gross value distributed per unit for the last year and expected for fiscal year 1 & 2 (FY1 & FY2).
Cash Yield = Distributions per share for fiscal year 1 & 2 (FY1 & FY2) in percentage of actual price.
FFO = Funds from Operations is a measure of the cash generated in a given period. It is calculated by taking net income and adjusting for changes in fair value of investment properties, amortization of investment property, gains and losses from property dispositions, and property acquisition costs on business combinations.
FD FFO = Fully diluted Funds from Operations.
P/FFO = Price per Funds from Operations.
› METALS AND MINING: PRECIOUS METALS / BASE METALS
P/CF = Price/cash flow valuation multiple. P/CFPS calculations for cash flow of zero or negative are deemed not applicable (N/A). P/CFPS greater than 100 are deemed not meaningful (nm).
P/NAVPS = Price per net asset value per share.
› SPECIAL SITUATIONS
FDDCPS = Fully diluted distributable cash flow per share. Cash flow (EBITDA less interest, cash taxes, maintenance capital expenditures and any one-time charges) available to be paid to common shareholders while taking into consideration any possible sources of conversion to outstanding shares such as convertible bonds and stock options.
› SUSTAINABILITY AND CLEAN TECH
Sales per share = revenue/fully diluted shares outstanding.
P/S = Price/sales
› TRANSPORTATION AND INDUSTRIAL PRODUCTS
FDFCFPS = Fully diluted free cash flow per share.
P/CFPS = Price/cash flow per share valuation multiple. P/CFPS calculations for cash flow of zero or negative are deemed not applicable (N/A). P/CFPS greater than 100 are deemed not meaningful (nm).
Sector Analysis
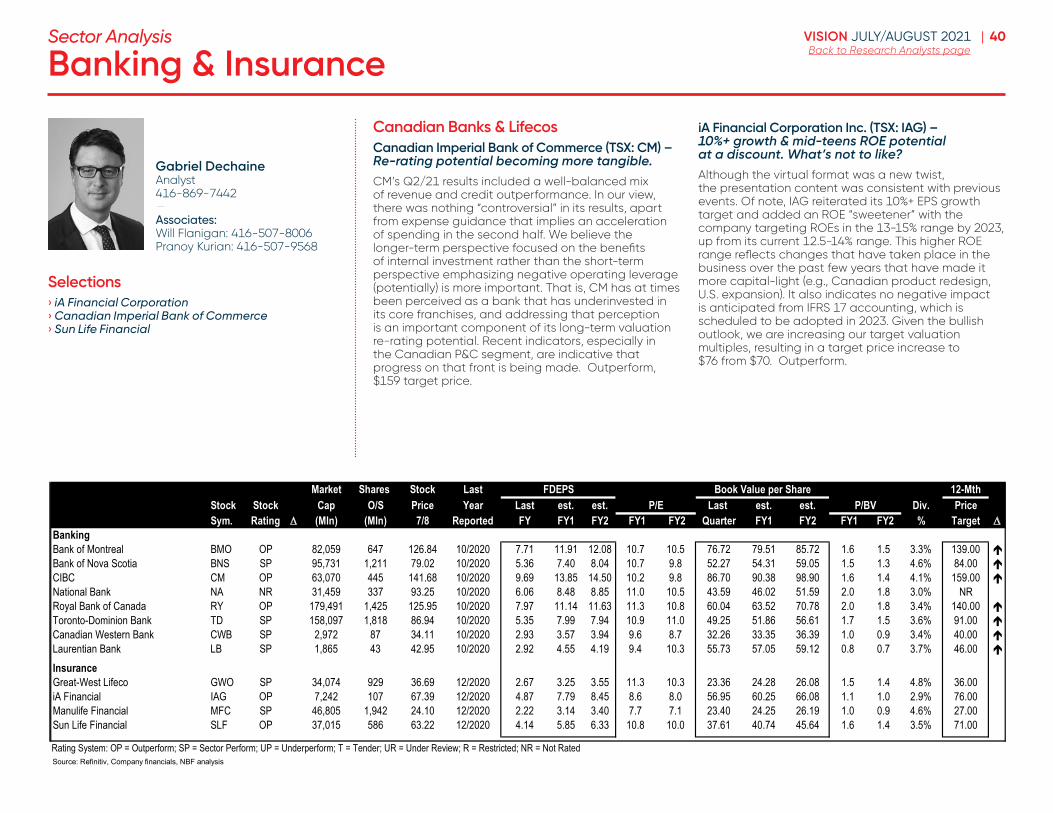
40VISION JULY/AUGUST 2021 |Back to Research Analysts pageBanking & Insurance
Canadian Banks & Lifecos Canadian Imperial Bank of Commerce (TSX: CM) – Re-rating potential becoming more tangible. CM’s Q2/21 results included a well-balanced mix of revenue and credit outperformance. In our view, there was nothing “controversial” in its results, apart from expense guidance that implies an acceleration of spending in the second half. We believe the longer-term perspective focused on the benefits of internal investment rather than the short-term perspective emphasizing negative operating leverage (potentially) is more important. That is, CM has at times been perceived as a bank that has underinvested in its core franchises, and addressing that perception is an important component of its long-term valuation re-rating potential. Recent indicators, especially in the Canadian P&C segment, are indicative that progress on that front is being made. Outperform, $159 target price.
iA Financial Corporation Inc . (TSX: IAG) – 10%+ growth & mid-teens ROE potential at a discount. What’s not to like? Although the virtual format was a new twist, the presentation content was consistent with previous events. Of note, IAG reiterated its 10%+ EPS growth target and added an ROE “sweetener” with the company targeting ROEs in the 13-15% range by 2023, up from its current 12.5-14% range. This higher ROE range reflects changes that have taken place in the business over the past few years that have made it more capital-light (e.g., Canadian product redesign, U.S. expansion). It also indicates no negative impact is anticipated from IFRS 17 accounting, which is scheduled to be adopted in 2023. Given the bullish outlook, we are increasing our target valuation multiples, resulting in a target price increase to $76 from $70. Outperform.
Gabriel Dechaine Analyst 416-869-7442 —Associates:Will Flanigan: 416-507-8006 Pranoy Kurian: 416-507-9568
Sector Analysis
Market Shares Stock Last FDEPS Book Value per Share 12-MthStock Stock Cap O/S Price Year Last est. est. P/E Last est. est. P/BV Div. PriceSym. Rating (Mln) (Mln) 7/8 Reported FY FY1 FY2 FY1 FY2 Quarter FY1 FY2 FY1 FY2 % Target
BankingBank of Montreal BMO OP 82,059 647 126.84 10/2020 7.71 11.91 12.08 10.7 10.5 76.72 79.51 85.72 1.6 1.5 3.3% 139.00 Bank of Nova Scotia BNS SP 95,731 1,211 79.02 10/2020 5.36 7.40 8.04 10.7 9.8 52.27 54.31 59.05 1.5 1.3 4.6% 84.00 CIBC CM OP 63,070 445 141.68 10/2020 9.69 13.85 14.50 10.2 9.8 86.70 90.38 98.90 1.6 1.4 4.1% 159.00 National Bank NA NR 31,459 337 93.25 10/2020 6.06 8.48 8.85 11.0 10.5 43.59 46.02 51.59 2.0 1.8 3.0% NRRoyal Bank of Canada RY OP 179,491 1,425 125.95 10/2020 7.97 11.14 11.63 11.3 10.8 60.04 63.52 70.78 2.0 1.8 3.4% 140.00 Toronto-Dominion Bank TD SP 158,097 1,818 86.94 10/2020 5.35 7.99 7.94 10.9 11.0 49.25 51.86 56.61 1.7 1.5 3.6% 91.00 Canadian Western Bank CWB SP 2,972 87 34.11 10/2020 2.93 3.57 3.94 9.6 8.7 32.26 33.35 36.39 1.0 0.9 3.4% 40.00 Laurentian Bank LB SP 1,865 43 42.95 10/2020 2.92 4.55 4.19 9.4 10.3 55.73 57.05 59.12 0.8 0.7 3.7% R 46.00
InsuranceGreat-West Lifeco GWO SP 34,074 929 36.69 12/2020 2.67 3.25 3.55 11.3 10.3 23.36 24.28 26.08 1.5 1.4 4.8% 36.00iA Financial IAG OP 7,242 107 67.39 12/2020 4.87 7.79 8.45 8.6 8.0 56.95 60.25 66.08 1.1 1.0 2.9% 76.00Manulife Financial MFC SP 46,805 1,942 24.10 12/2020 2.22 3.14 3.40 7.7 7.1 23.40 24.25 26.19 1.0 0.9 4.6% 27.00Sun Life Financial SLF OP 37,015 586 63.22 12/2020 4.14 5.85 6.33 10.8 10.0 37.61 40.74 45.64 1.6 1.4 3.5% 71.00
Rating System: OP = Outperform; SP = Sector Perform; UP = Underperform; T = Tender; UR = Under Review; R = Restricted; NR = Not RatedSource: Refinitiv, Company financials, NBF analysis
Selections› iA Financial Corporation› Canadian Imperial Bank of Commerce› Sun Life Financial
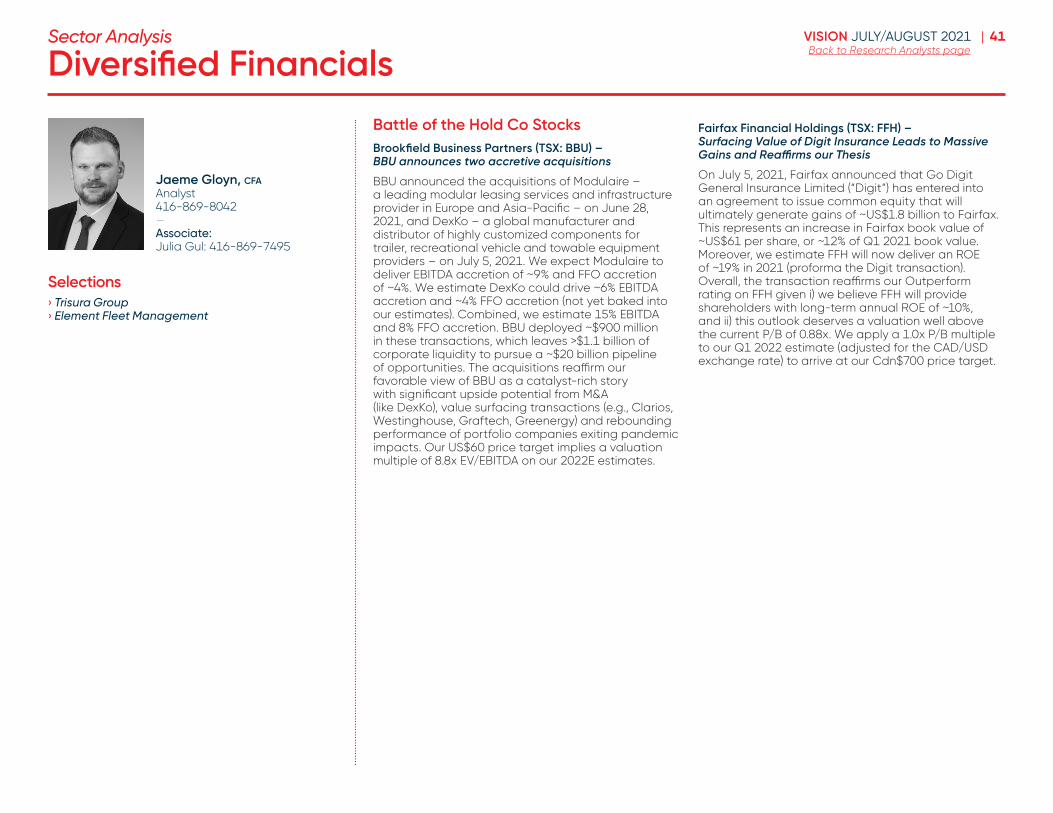
41VISION JULY/AUGUST 2021 |Back to Research Analysts pageDiversified Financials
Battle of the Hold Co Stocks Brookfield Business Partners (TSX: BBU) – BBU announces two accretive acquisitions
BBU announced the acquisitions of Modulaire – a leading modular leasing services and infrastructure provider in Europe and Asia-Pacific – on June 28, 2021, and DexKo – a global manufacturer and distributor of highly customized components for trailer, recreational vehicle and towable equipment providers – on July 5, 2021. We expect Modulaire to deliver EBITDA accretion of ~9% and FFO accretion of ~4%. We estimate DexKo could drive ~6% EBITDA accretion and ~4% FFO accretion (not yet baked into our estimates). Combined, we estimate 15% EBITDA and 8% FFO accretion. BBU deployed ~$900 million in these transactions, which leaves >$1.1 billion of corporate liquidity to pursue a ~$20 billion pipeline of opportunities. The acquisitions reaffirm our favorable view of BBU as a catalyst-rich story with significant upside potential from M&A (like DexKo), value surfacing transactions (e.g., Clarios, Westinghouse, Graftech, Greenergy) and rebounding performance of portfolio companies exiting pandemic impacts. Our US$60 price target implies a valuation multiple of 8.8x EV/EBITDA on our 2022E estimates.
Fairfax Financial Holdings (TSX: FFH) – Surfacing Value of Digit Insurance Leads to Massive Gains and Reaffirms our Thesis
On July 5, 2021, Fairfax announced that Go Digit General Insurance Limited (“Digit”) has entered into an agreement to issue common equity that will ultimately generate gains of ~US$1.8 billion to Fairfax. This represents an increase in Fairfax book value of ~US$61 per share, or ~12% of Q1 2021 book value. Moreover, we estimate FFH will now deliver an ROE of ~19% in 2021 (proforma the Digit transaction). Overall, the transaction reaffirms our Outperform rating on FFH given i) we believe FFH will provide shareholders with long-term annual ROE of ~10%, and ii) this outlook deserves a valuation well above the current P/B of 0.88x. We apply a 1.0x P/B multiple to our Q1 2022 estimate (adjusted for the CAD/USD exchange rate) to arrive at our Cdn$700 price target.
Jaeme Gloyn, cfa Analyst 416-869-8042 —Associate:Julia Gul: 416-869-7495
Sector Analysis
Selections› Trisura Group› Element Fleet Management
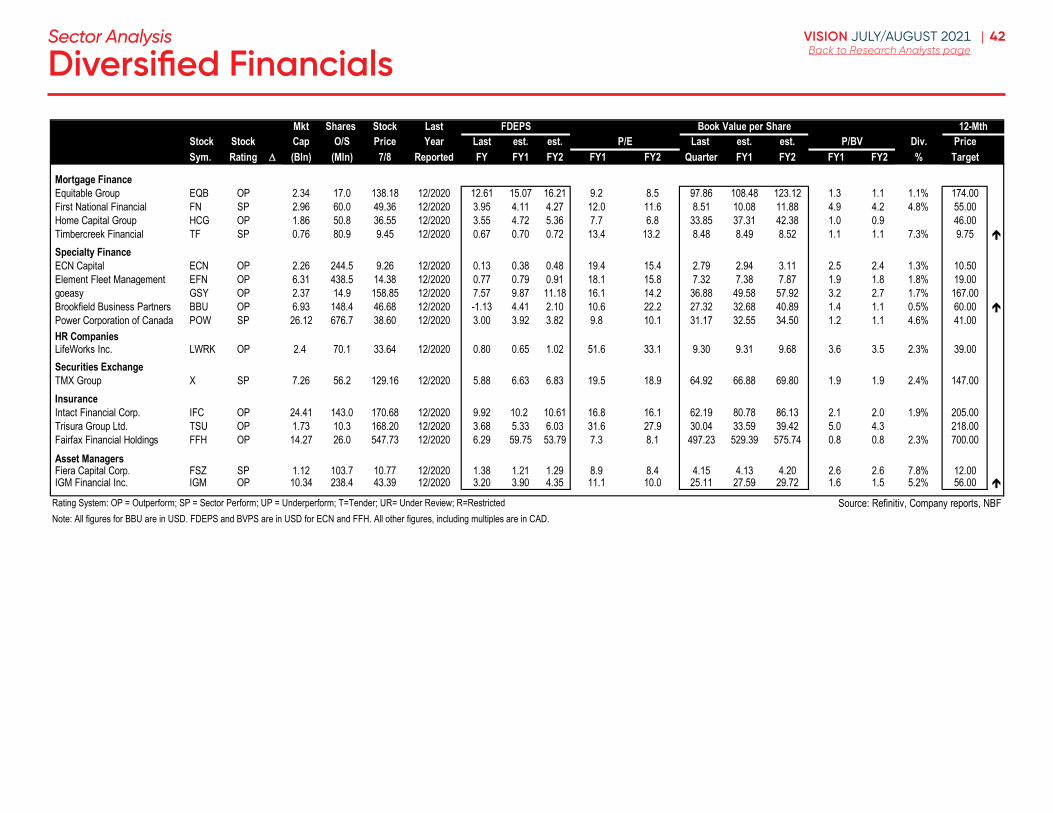
42VISION JULY/AUGUST 2021 |Back to Research Analysts page
Mkt Shares Stock Last FDEPS Book Value per Share 12-MthStock Stock Cap O/S Price Year Last est. est. P/E Last est. est. P/BV Div. PriceSym. Rating (Bln) (Mln) 7/8 Reported FY FY1 FY2 FY1 FY2 Quarter FY1 FY2 FY1 FY2 % Target
Mortgage FinanceEquitable Group EQB OP 2.34 17.0 138.18 12/2020 12.61 15.07 16.21 9.2 8.5 97.86 108.48 123.12 1.3 1.1 1.1% 174.00First National Financial FN SP 2.96 60.0 49.36 12/2020 3.95 4.11 4.27 12.0 11.6 8.51 10.08 11.88 4.9 4.2 4.8% 55.00Home Capital Group HCG OP 1.86 50.8 36.55 12/2020 3.55 4.72 5.36 7.7 6.8 33.85 37.31 42.38 1.0 0.9 46.00Timbercreek Financial TF SP 0.76 80.9 9.45 12/2020 0.67 0.70 0.72 13.4 13.2 8.48 8.49 8.52 1.1 1.1 7.3% 9.75
Specialty FinanceECN Capital ECN OP 2.26 244.5 9.26 12/2020 0.13 0.38 0.48 19.4 15.4 2.79 2.94 3.11 2.5 2.4 1.3% 10.50Element Fleet Management EFN OP 6.31 438.5 14.38 12/2020 0.77 0.79 0.91 18.1 15.8 7.32 7.38 7.87 1.9 1.8 1.8% 19.00goeasy GSY OP 2.37 14.9 158.85 12/2020 7.57 9.87 11.18 16.1 14.2 36.88 49.58 57.92 3.2 2.7 1.7% 167.00Brookfield Business Partners BBU OP 6.93 148.4 46.68 12/2020 -1.13 4.41 2.10 10.6 22.2 27.32 32.68 40.89 1.4 1.1 0.5% 60.00 Power Corporation of Canada POW SP 26.12 676.7 38.60 12/2020 3.00 3.92 3.82 9.8 10.1 31.17 32.55 34.50 1.2 1.1 4.6% 41.00HR CompaniesLifeWorks Inc. LWRK OP 2.4 70.1 33.64 12/2020 0.80 0.65 1.02 51.6 33.1 9.30 9.31 9.68 3.6 3.5 2.3% 39.00Securities ExchangeTMX Group X SP 7.26 56.2 129.16 12/2020 5.88 6.63 6.83 19.5 18.9 64.92 66.88 69.80 1.9 1.9 2.4% 147.00InsuranceIntact Financial Corp. IFC OP 24.41 143.0 170.68 12/2020 9.92 10.2 10.61 16.8 16.1 62.19 80.78 86.13 2.1 2.0 1.9% 205.00Trisura Group Ltd. TSU OP 1.73 10.3 168.20 12/2020 3.68 5.33 6.03 31.6 27.9 30.04 33.59 39.42 5.0 4.3 218.00Fairfax Financial Holdings FFH OP 14.27 26.0 547.73 12/2020 6.29 59.75 53.79 7.3 8.1 497.23 529.39 575.74 0.8 0.8 2.3% 700.00Asset ManagersFiera Capital Corp. FSZ SP 1.12 103.7 10.77 12/2020 1.38 1.21 1.29 8.9 8.4 4.15 4.13 4.20 2.6 2.6 7.8% 12.00IGM Financial Inc. IGM OP 10.34 238.4 43.39 12/2020 3.20 3.90 4.35 11.1 10.0 25.11 27.59 29.72 1.6 1.5 5.2% 56.00
Rating System: OP = Outperform; SP = Sector Perform; UP = Underperform; T=Tender; UR= Under Review; R=RestrictedNote: All figures for BBU are in USD. FDEPS and BVPS are in USD for ECN and FFH. All other figures, including multiples are in CAD.
Source: Refinitiv, Company reports, NBF
Diversified FinancialsSector Analysis
43VISION JULY/AUGUST 2021 |Back to Research Analysts pageDiversified Industrials
MTL puts dry powder to work in impressive M&A spree; offshore momentum building for SCLMullen announces closing of a handful of acquisitions as dry powder is put to work in the first half of 2021 . In late June, Mullen announced the closing of the acquisition of U.S. third-party logistics provider QuadExpress for US$40 mln, representing a new growth platform in the United States. We view the acquisition positively as we perceive QuadExpress’ asset-light logistics platform as a strategic steppingstone in expanding Mullen’s existing T&L network, opening up crossborder opportunities and a foothold in a significantly-larger U.S. market (with QuadExpress posting total gross revenue of US$135 mln in 2020). Days later, Mullen announced the closing of the acquisition of Winnipeg-based R.S. Harris Transport Ltd., an industry leading trucking and brokerage company specializing in open deck transportation (with annualized revenue in excess of $25.0 mln). After entering 2021 with considerable dry powder (including over $100 mln in cash on the balance sheet and an undrawn $150 mln credit facility), the announcements further an impressive M&A spree in the first half of the year (with Mullen having also recently closed the strategic acquisitions of APPS Transport Group, Bandstra Group and Tri Point Intermodal Services), representing (in sum) an estimated ~20% incremental EBITDA lift relative to management’s 2021 guidance (on an annualized basis). Despite the numerous acquisitions we believe Mullen’s balance sheet remains solid with our forecasts pointing to ample covenant flexibility and an improving leverage profile moving forward as FCF is applied to the balance sheet (with our estimates implying sub-3.0x net debt/ttm EBITDA exiting Q2/21, comfortably below the covenant limit of 3.5x). We maintain our Outperform rating and $15 .50 target driven by an unchanged 7 .6x 2022e EV/EBITDA in line with the current average of the broader peer group .
With oil and gas demand continuing to improve exiting the downturn, we note building momentum for several offshore projects of interest to Shawcor, reinforcing our confidence in our longer-term forecasts .With oil and gas demand continuing to improve exiting the downturn, we recently noted building momentum for several offshore projects of interest to Shawcor, including the development of the Bacalhau, Mero-3 and Dalma fields. Coupled with expectations for ramping activity levels offshore Australia in support of existing LNG commitments and steady investment offshore Norway, we see growing support for our offshore outlook in 2022 and beyond (with management previously guiding to an expected build in the backlog exiting 2021 and into 2022 as offshore oil and gas projects are sanctioned). While project momentum alone is no guarantee of eventual pipe coating contract awards for Shawcor, given SCL’s solid historical market share of offshore pipecoating contracts, we are encouraged by the positive headlines as we continue to see an intriguing set of strategic options for Shawcor moving forward (including potential asset/business segment sales as a means of expediting balance sheet improvement or M&A in other core divisions). With our positive outlook and forecasts unchanged at this juncture, we maintain our $8 .75 target driven by an unchanged 6 .7x 2022e EV/EBITDA multiple (more than a full-turn discount to SCL’s historical forward year EV/EBITDA average and materially below the broader peer group average) . We reiterate our Outperform rating as SCL transitions to a leaner footprint with improved profitability and a reduced leverage profile .
Michael Storry-Robertson, cfa Analyst 416-507-8007
Sector Analysis
Selections› Enerflex Ltd. › Mullen Group Ltd.
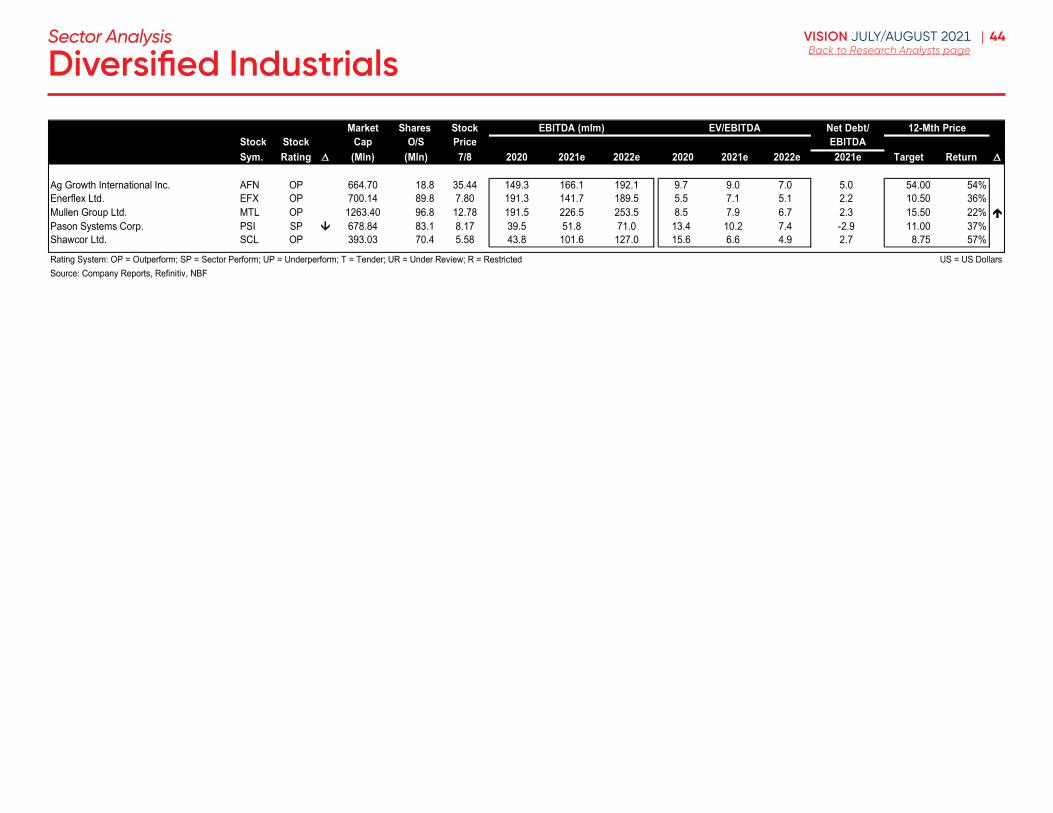
44VISION JULY/AUGUST 2021 |Back to Research Analysts page
Market Shares StockStock Stock Cap O/S PriceSym. Rating (Mln) (Mln) 7/8 2020 2021e 2022e 2020 2021e 2022e 2021e Target Return
Ag Growth International Inc. AFN OP 664.70 18.8 35.44 149.3 166.1 192.1 9.7 9.0 7.0 5.0 54.00 54%Enerflex Ltd. EFX OP 700.14 89.8 7.80 191.3 141.7 189.5 5.5 7.1 5.1 2.2 10.50 36%Mullen Group Ltd. MTL OP 1263.40 96.8 12.78 191.5 226.5 253.5 8.5 7.9 6.7 2.3 15.50 22% Pason Systems Corp. PSI SP 678.84 83.1 8.17 39.5 51.8 71.0 13.4 10.2 7.4 -2.9 11.00 37%Shawcor Ltd. SCL OP 393.03 70.4 5.58 43.8 101.6 127.0 15.6 6.6 4.9 2.7 8.75 57%
US = US DollarsSource: Company Reports, Refinitiv, NBFRating System: OP = Outperform; SP = Sector Perform; UP = Underperform; T = Tender; UR = Under Review; R = Restricted
EBITDA (mlm) EV/EBITDA 12-Mth PriceNet Debt/EBITDA
Diversified IndustrialsSector Analysis
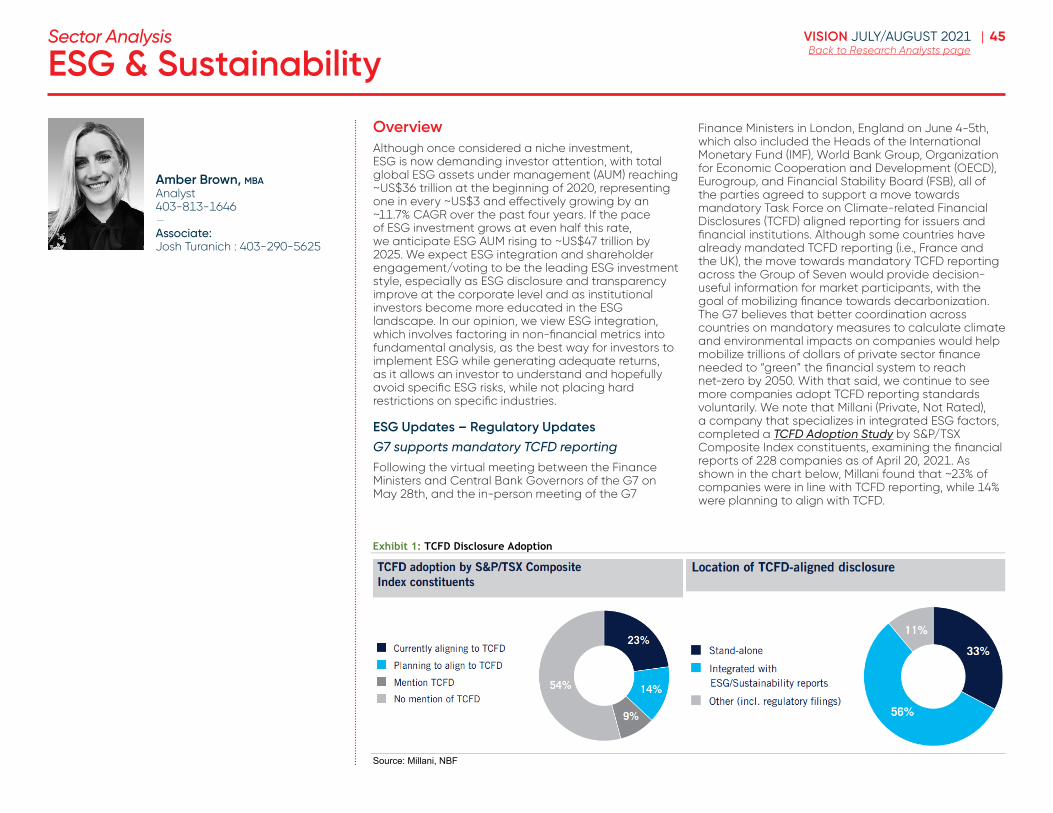
45VISION JULY/AUGUST 2021 |Back to Research Analysts pageESG & Sustainability
OverviewAlthough once considered a niche investment, ESG is now demanding investor attention, with total global ESG assets under management (AUM) reaching ~US$36 trillion at the beginning of 2020, representing one in every ~US$3 and effectively growing by an ~11.7% CAGR over the past four years. If the pace of ESG investment grows at even half this rate, we anticipate ESG AUM rising to ~US$47 trillion by 2025. We expect ESG integration and shareholder engagement/voting to be the leading ESG investment style, especially as ESG disclosure and transparency improve at the corporate level and as institutional investors become more educated in the ESG landscape. In our opinion, we view ESG integration, which involves factoring in non-financial metrics into fundamental analysis, as the best way for investors to implement ESG while generating adequate returns, as it allows an investor to understand and hopefully avoid specific ESG risks, while not placing hard restrictions on specific industries.
ESG Updates – Regulatory UpdatesG7 supports mandatory TCFD reportingFollowing the virtual meeting between the Finance Ministers and Central Bank Governors of the G7 on May 28th, and the in-person meeting of the G7
Finance Ministers in London, England on June 4-5th, which also included the Heads of the International Monetary Fund (IMF), World Bank Group, Organization for Economic Cooperation and Development (OECD), Eurogroup, and Financial Stability Board (FSB), all of the parties agreed to support a move towards mandatory Task Force on Climate-related Financial Disclosures (TCFD) aligned reporting for issuers and financial institutions. Although some countries have already mandated TCFD reporting (i.e., France and the UK), the move towards mandatory TCFD reporting across the Group of Seven would provide decision-useful information for market participants, with the goal of mobilizing finance towards decarbonization. The G7 believes that better coordination across countries on mandatory measures to calculate climate and environmental impacts on companies would help mobilize trillions of dollars of private sector finance needed to “green” the financial system to reach net-zero by 2050. With that said, we continue to see more companies adopt TCFD reporting standards voluntarily. We note that Millani (Private, Not Rated), a company that specializes in integrated ESG factors, completed a TCFD Adoption Study by S&P/TSX Composite Index constituents, examining the financial reports of 228 companies as of April 20, 2021. As shown in the chart below, Millani found that ~23% of companies were in line with TCFD reporting, while 14% were planning to align with TCFD.
Sector Analysis
Analyst: Amber Brown, MBA (403) 813-1646
78 Vision June 2020
ESG
SECTOR ANALYSIS
Overview Although once considered a niche investment, ESG is now demanding investor attention, with total global ESG assets under management (AUM) reaching ~US$36 trillion at the beginning of 2020, representing one in every ~US$3 and effectively growing by an ~11.7% CAGR over the past four years. If the pace of ESG investment grows at even half this rate, we anticipate ESG AUM rising to ~US$47 trillion by 2025. We expect ESG integration and shareholder engagement/voting to be the leading ESG investment style, especially as ESG disclosure and transparency improve at the corporate level and as institutional investors become more educated in the ESG landscape. In our opinion, we view ESG integration, which involves factoring in non-financial metrics into fundamental analysis, as the best way for investors to implement ESG while generating adequate returns, as it allows an investor to understand and hopefully avoid specific ESG risks, while not placing hard restrictions on specific industries. ESG Updates – Regulatory Updates G7 supports mandatory TCFD reporting
Following the virtual meeting between the Finance Ministers and Central Bank Governors of the G7 on May 28th, and the in-person meeting of the G7 Finance Ministers in London, England on June 4-5th, which also included the Heads of the International Monetary Fund (IMF), World Bank Group, Organization for Economic Cooperation and Development (OECD), Eurogroup, and Financial Stability Board (FSB), all of the parties agreed to support a move towards mandatory Task Force on Climate-related Financial Disclosures (TCFD) aligned reporting for issuers and financial institutions. Although some countries have already mandated TCFD reporting (i.e., France and the UK), the move towards mandatory TCFD reporting across the Group of Seven would provide decision-useful information for market participants, with the goal of mobilizing finance towards decarbonization. The G7 believes that better coordination across countries on mandatory measures to calculate climate and environmental impacts on companies would help mobilize trillions of dollars of private sector finance needed to “green” the financial system to reach net-zero by 2050. With that said, we continue to see more companies adopt TCFD reporting standards voluntarily. We note that Millani (Private, Not Rated), a company that specializes in integrated ESG factors, completed a TCFD Adoption Study by S&P/TSX Composite Index constituents, examining the financial reports of 228 companies as of April 20, 2021. As shown in the chart below, Millani found that ~23% of companies were in line with TCFD reporting, while 14% were planning to align with TCFD.
Exhibit 1: TCFD Disclosure Adoption
Source: Millani, NBF
The G7 members also officially welcomed the International Financial Reporting Standards (IFRS) Foundation’s programme as the prominent group to develop the global reporting standard baseline for sustainability, building off both the TCFD reporting methodology and off the work of other sustainability standard-setters (i.e., GRI, SASB, CDP). The Group of Seven also encouraged a final proposal from the IFRS on the establishment of an International Sustainability Standards Board (ISSB) ahead of COP 26 in November 2021. Meanwhile, the G7 Finance Ministers and Central Banks representatives agreed that central banks would start to assess the financial stability risks posed by climate change going forward, with the goal for central banks to provide disclosure based on TCFD recommendations in the future. Lastly, we highlight that the G7 supported the establishment of the Taskforce on
Amber Brown, mba Analyst 403-813-1646 —Associate:Josh Turanich : 403-290-5625
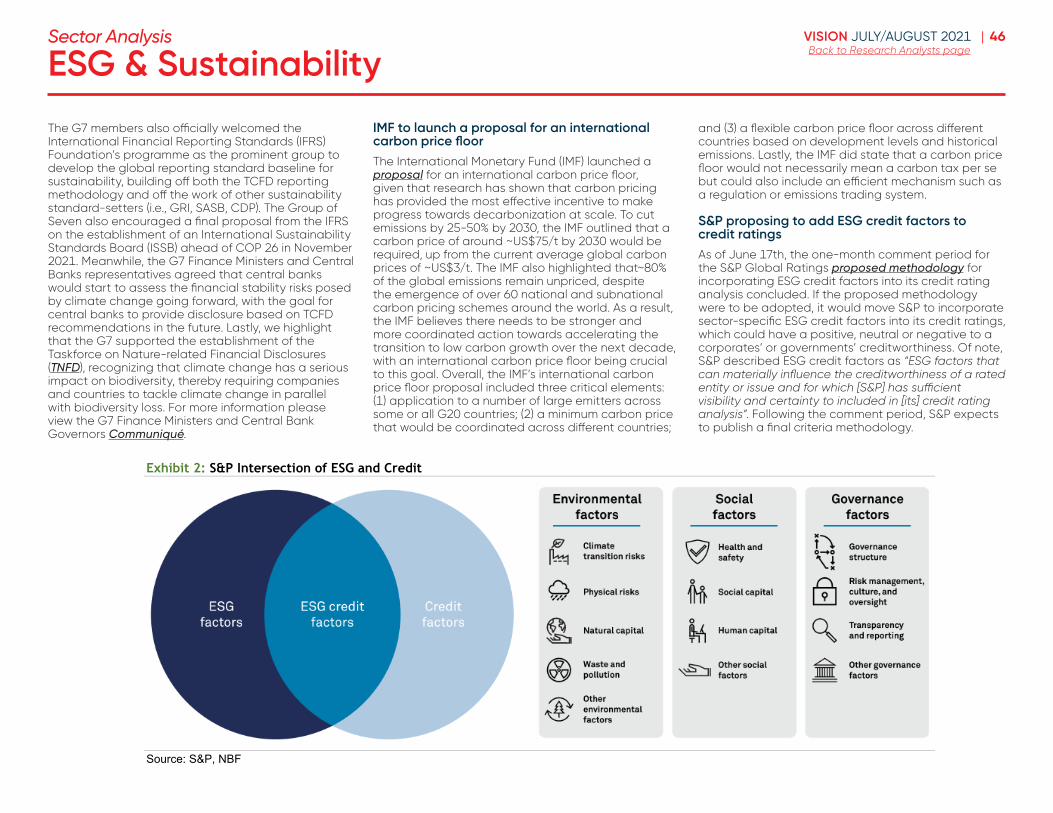
46VISION JULY/AUGUST 2021 |Back to Research Analysts pageESG & Sustainability
Sector Analysis
The G7 members also officially welcomed the International Financial Reporting Standards (IFRS) Foundation’s programme as the prominent group to develop the global reporting standard baseline for sustainability, building off both the TCFD reporting methodology and off the work of other sustainability standard-setters (i.e., GRI, SASB, CDP). The Group of Seven also encouraged a final proposal from the IFRS on the establishment of an International Sustainability Standards Board (ISSB) ahead of COP 26 in November 2021. Meanwhile, the G7 Finance Ministers and Central Banks representatives agreed that central banks would start to assess the financial stability risks posed by climate change going forward, with the goal for central banks to provide disclosure based on TCFD recommendations in the future. Lastly, we highlight that the G7 supported the establishment of the Taskforce on Nature-related Financial Disclosures (TNFD), recognizing that climate change has a serious impact on biodiversity, thereby requiring companies and countries to tackle climate change in parallel with biodiversity loss. For more information please view the G7 Finance Ministers and Central Bank Governors Communiqué.
IMF to launch a proposal for an international carbon price floorThe International Monetary Fund (IMF) launched a proposal for an international carbon price floor, given that research has shown that carbon pricing has provided the most effective incentive to make progress towards decarbonization at scale. To cut emissions by 25-50% by 2030, the IMF outlined that a carbon price of around ~US$75/t by 2030 would be required, up from the current average global carbon prices of ~US$3/t. The IMF also highlighted that~80% of the global emissions remain unpriced, despite the emergence of over 60 national and subnational carbon pricing schemes around the world. As a result, the IMF believes there needs to be stronger and more coordinated action towards accelerating the transition to low carbon growth over the next decade, with an international carbon price floor being crucial to this goal. Overall, the IMF’s international carbon price floor proposal included three critical elements: (1) application to a number of large emitters across some or all G20 countries; (2) a minimum carbon price that would be coordinated across different countries;
and (3) a flexible carbon price floor across different countries based on development levels and historical emissions. Lastly, the IMF did state that a carbon price floor would not necessarily mean a carbon tax per se but could also include an efficient mechanism such as a regulation or emissions trading system.
S&P proposing to add ESG credit factors to credit ratingsAs of June 17th, the one-month comment period for the S&P Global Ratings proposed methodology for incorporating ESG credit factors into its credit rating analysis concluded. If the proposed methodology were to be adopted, it would move S&P to incorporate sector-specific ESG credit factors into its credit ratings, which could have a positive, neutral or negative to a corporates’ or governments’ creditworthiness. Of note, S&P described ESG credit factors as “ESG factors that can materially influence the creditworthiness of a rated entity or issue and for which [S&P] has sufficient visibility and certainty to included in [its] credit rating analysis”. Following the comment period, S&P expects to publish a final criteria methodology.
SECTOR ANALYSIS
Vision June 2020 79
ESG
Nature-related Financial Disclosures (TNFD), recognizing that climate change has a serious impact on biodiversity, thereby requiring companies and countries to tackle climate change in parallel with biodiversity loss. For more information please view the G7 Finance Ministers and Central Bank Governors Communiqué.
IMF to launch a proposal for an international carbon price floor
The International Monetary Fund (IMF) launched a proposal for an international carbon price floor, given that research has shown that carbon pricing has provided the most effective incentive to make progress towards decarbonization at scale. To cut emissions by 25-50% by 2030, the IMF outlined that a carbon price of around ~US$75/t by 2030 would be required, up from the current average global carbon prices of ~US$3/t. The IMF also highlighted that~80% of the global emissions remain unpriced, despite the emergence of over 60 national and subnational carbon pricing schemes around the world. As a result, the IMF believes there needs to be stronger and more coordinated action towards accelerating the transition to low carbon growth over the next decade, with an international carbon price floor being crucial to this goal. Overall, the IMF’s international carbon price floor proposal included three critical elements: (1) application to a number of large emitters across some or all G20 countries; (2) a minimum carbon price that would be coordinated across different countries; and (3) a flexible carbon price floor across different countries based on development levels and historical emissions. Lastly, the IMF did state that a carbon price floor would not necessarily mean a carbon tax per se but could also include an efficient mechanism such as a regulation or emissions trading system.
S&P proposing to add ESG credit factors to credit ratings
As of June 17th, the one-month comment period for the S&P Global Ratings proposed methodology for incorporating ESG credit factors into its credit rating analysis concluded. If the proposed methodology were to be adopted, it would move S&P to incorporate sector-specific ESG credit factors into its credit ratings, which could have a positive, neutral or negative to a corporates’ or governments’ creditworthiness. Of note, S&P described ESG credit factors as “ESG factors that can materially influence the creditworthiness of a rated entity or issue and for which [S&P] has sufficient visibility and certainty to included in [its] credit rating analysis”. Following the comment period, S&P expects to publish a final criteria methodology.
Exhibit 2: S&P Intersection of ESG and Credit
Source: S&P, NBF

47VISION JULY/AUGUST 2021 |Back to Research Analysts pageHealthcare, Biotech & Special Situations
Highlights as of June 2021We highlight Dialogue Health Technologies (CARE: TSX) which provided several insights during National Bank’s 11th Annual Québec Conference and Knight Therapeutics (GUD: TSX) on a positive development for one of its oncology drugs.
Dialogue Health TechnologiesOn June 16, we hosted Cherif Habib (CEO) for a virtual fireside chat that reconfirmed our positive view on CARE and included the company’s acquisition and organic growth outlook and strategy as well as an overview of the current competitive landscape.
CARE’s primary growth venue to-date has been organic, and this will continue, with acquisitions playing a complimentary role aimed at 1) growing member count; 2) increasing number of services to increase the attach rate, and 3) entering new geographies. The company expects to execute on one to two acquisitions per year depending on the size. However, management noted that while public companies’ valuations have contracted, those of private companies have not and remain elevated. Meanwhile, CARE’s organic growth continues to be mainly driven by primary care for which clients, typically, initially subscribe for, although 2+ program subscriptions continue to increase and should, over time, result in a higher attach rate.
The competitive landscape remains unchanged with the B2B virtual health market dominated (90%+ share) by CARE, Maple and Telus Health, although, as per management, CARE remains the leader due its integrated platform. Similarly, the EAP market is dominated by three companies with CARE being the third largest, but rapidly gaining share due to 1) being fully virtual and 2) its very rapid service with a 24-hour turnaround vs. 1-3 weeks for legacy providers.
We maintain an Outperform rating and $20.50 target price, which implies 9.0x 2023e EV/Sales.
Knight TherapeuticsGUD announced that Health Canada approved NERLYNX, in combination with chemo drug capecitabine, for the treatment of adult patients with a certain form of metastatic breast cancer (HER2-overexpressed/amplified or HER2+) and who have previously received two or more prior treatments. This approval follows the July 2019 one for patients with early stage HER2+ cancer.
While we are not particularly surprised with the approval given a similar move by the FDA in February 2020, it is an incremental positive for GUD as we estimate that it increases patients eligible for treatment, as well as the drug’s TAM, by ~39% to an estimated value of ~$372 mln vs ~$267 mln prior. GUD launched the drug commercially in late 2019 and, currently, we expect minimal market share as 1) GUD continues to address patient access; and 2) Covid-related lockdowns have impacted physician access and, consequently, growth. However, we estimate potential sales of ~$14 mln for NERLYNX in Canada.
We reiterate our Outperform rating and $7.75 target price derived via a sum-of-part valuation.
Endri Leno Analyst 416-869-8047—Associates: Eduardo Garcia Hubner 416-869-7476
Stephen Kwai 416-869-7571
Sector Analysis
Selections› Dialogue Health Technologies › Jamieson Wellness › Knight Therapeutics › Medical Facilities
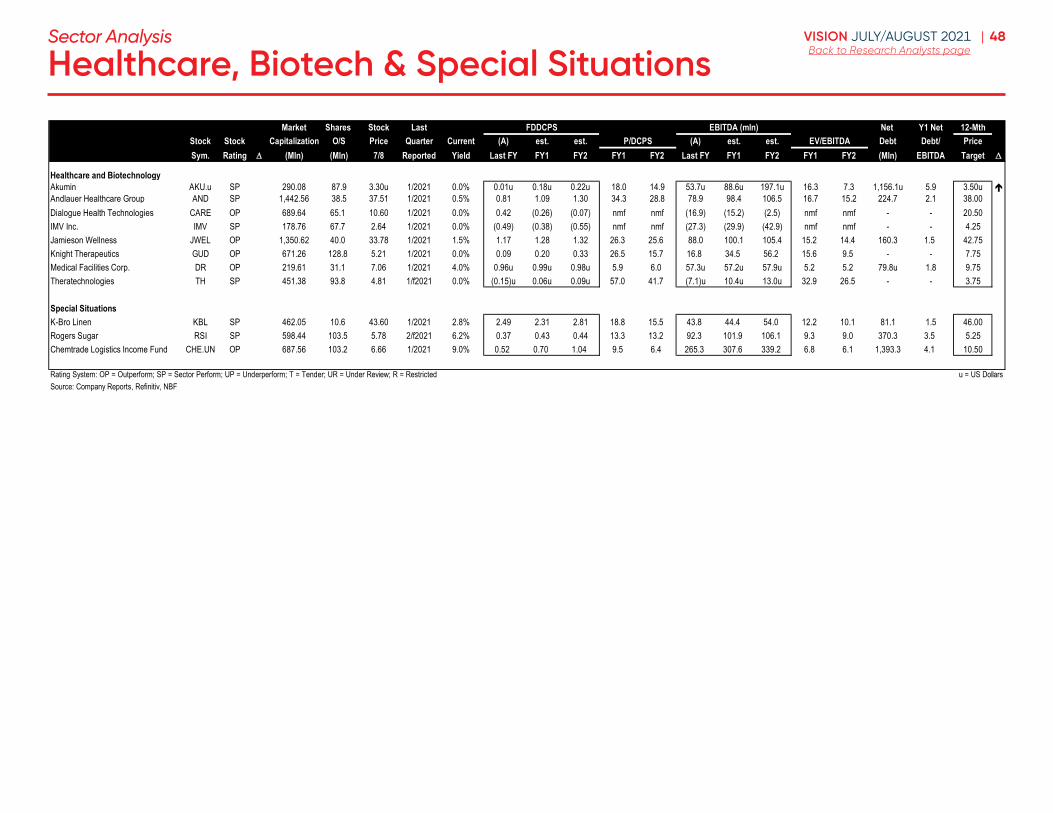
48VISION JULY/AUGUST 2021 |Back to Research Analysts page
Market Shares Stock Last FDDCPS EBITDA (mln) Net Y1 Net 12-MthStock Stock Capitalization O/S Price Quarter Current (A) est. est. P/DCPS (A) est. est. EV/EBITDA Debt Debt/ PriceSym. Rating (Mln) (Mln) 7/8 Reported Yield Last FY FY1 FY2 FY1 FY2 Last FY FY1 FY2 FY1 FY2 (Mln) EBITDA Target
Healthcare and BiotechnologyAkumin AKU.u SP 290.08 87.9 3.30u 1/2021 0.0% 0.01u 0.18u 0.22u 18.0 14.9 53.7u 88.6u 197.1u 16.3 7.3 1,156.1u 5.9 3.50u Andlauer Healthcare Group AND SP 1,442.56 38.5 37.51 1/2021 0.5% 0.81 1.09 1.30 34.3 28.8 78.9 98.4 106.5 16.7 15.2 224.7 2.1 38.00Dialogue Health Technologies CARE OP 689.64 65.1 10.60 1/2021 0.0% 0.42 (0.26) (0.07) nmf nmf (16.9) (15.2) (2.5) nmf nmf - - 20.50IMV Inc. IMV SP 178.76 67.7 2.64 1/2021 0.0% (0.49) (0.38) (0.55) nmf nmf (27.3) (29.9) (42.9) nmf nmf - - 4.25Jamieson Wellness JWEL OP 1,350.62 40.0 33.78 1/2021 1.5% 1.17 1.28 1.32 26.3 25.6 88.0 100.1 105.4 15.2 14.4 160.3 1.5 42.75Knight Therapeutics GUD OP 671.26 128.8 5.21 1/2021 0.0% 0.09 0.20 0.33 26.5 15.7 16.8 34.5 56.2 15.6 9.5 - - 7.75Medical Facilities Corp. DR OP 219.61 31.1 7.06 1/2021 4.0% 0.96u 0.99u 0.98u 5.9 6.0 57.3u 57.2u 57.9u 5.2 5.2 79.8u 1.8 9.75Theratechnologies TH SP 451.38 93.8 4.81 1/f2021 0.0% (0.15)u 0.06u 0.09u 57.0 41.7 (7.1)u 10.4u 13.0u 32.9 26.5 - - 3.75
Special SituationsK-Bro Linen KBL SP 462.05 10.6 43.60 1/2021 2.8% 2.49 2.31 2.81 18.8 15.5 43.8 44.4 54.0 12.2 10.1 81.1 1.5 46.00Rogers Sugar RSI SP 598.44 103.5 5.78 2/f2021 6.2% 0.37 0.43 0.44 13.3 13.2 92.3 101.9 106.1 9.3 9.0 370.3 3.5 5.25Chemtrade Logistics Income Fund CHE.UN OP 687.56 103.2 6.66 1/2021 9.0% 0.52 0.70 1.04 9.5 6.4 265.3 307.6 339.2 6.8 6.1 1,393.3 4.1 10.50
Rating System: OP = Outperform; SP = Sector Perform; UP = Underperform; T = Tender; UR = Under Review; R = Restricted u = US DollarsSource: Company Reports, Refinitiv, NBF
Healthcare, Biotech & Special SituationsSector Analysis
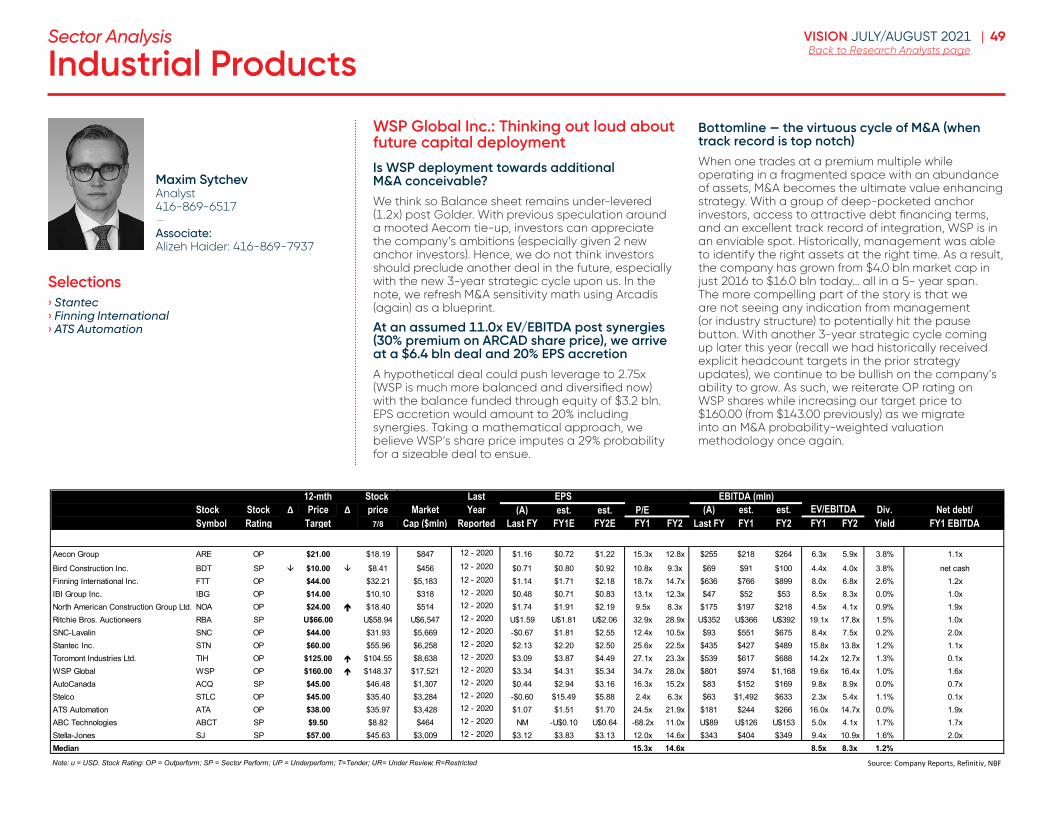
49VISION JULY/AUGUST 2021 |Back to Research Analysts pageIndustrial Products
WSP Global Inc .: Thinking out loud about future capital deployment
Is WSP deployment towards additional M&A conceivable? We think so Balance sheet remains under-levered (1.2x) post Golder. With previous speculation around a mooted Aecom tie-up, investors can appreciate the company’s ambitions (especially given 2 new anchor investors). Hence, we do not think investors should preclude another deal in the future, especially with the new 3-year strategic cycle upon us. In the note, we refresh M&A sensitivity math using Arcadis (again) as a blueprint.
At an assumed 11 .0x EV/EBITDA post synergies (30% premium on ARCAD share price), we arrive at a $6 .4 bln deal and 20% EPS accretion A hypothetical deal could push leverage to 2.75x (WSP is much more balanced and diversified now) with the balance funded through equity of $3.2 bln. EPS accretion would amount to 20% including synergies. Taking a mathematical approach, we believe WSP’s share price imputes a 29% probability for a sizeable deal to ensue.
Bottomline — the virtuous cycle of M&A (when track record is top notch)When one trades at a premium multiple while operating in a fragmented space with an abundance of assets, M&A becomes the ultimate value enhancing strategy. With a group of deep-pocketed anchor investors, access to attractive debt financing terms, and an excellent track record of integration, WSP is in an enviable spot. Historically, management was able to identify the right assets at the right time. As a result, the company has grown from $4.0 bln market cap in just 2016 to $16.0 bln today… all in a 5- year span. The more compelling part of the story is that we are not seeing any indication from management (or industry structure) to potentially hit the pause button. With another 3-year strategic cycle coming up later this year (recall we had historically received explicit headcount targets in the prior strategy updates), we continue to be bullish on the company’s ability to grow. As such, we reiterate OP rating on WSP shares while increasing our target price to $160.00 (from $143.00 previously) as we migrate into an M&A probability-weighted valuation methodology once again.
Maxim Sytchev Analyst 416-869-6517—Associate:Alizeh Haider: 416-869-7937
Sector Analysis
Selections› Stantec› Finning International› ATS Automation
12-mth Stock LastStock Stock ∆ Price ∆ price Year (A) est. est. P/E (A) est. est. Div. Net debt/Symbol Rating Target 7/8 Cap ($mln) Reported Last FY FY1E FY2E FY1 FY2 Last FY FY1 FY2 FY1 FY2 Yield FY1 EBITDA
Aecon Group ARE OP $21.00 $18.19 $847 12 - 2020 $1.16 $0.72 $1.22 15.3x 12.8x $255 $218 $264 6.3x 5.9x 3.8% 1.1x
Bird Construction Inc. BDT SP $10.00 $8.41 $456 12 - 2020 $0.71 $0.80 $0.92 10.8x 9.3x $69 $91 $100 4.4x 4.0x 3.8% net cashFinning International Inc. FTT OP $44.00 $32.21 $5,183 12 - 2020 $1.14 $1.71 $2.18 18.7x 14.7x $636 $766 $899 8.0x 6.8x 2.6% 1.2xIBI Group Inc. IBG OP $14.00 $10.10 $318 12 - 2020 $0.48 $0.71 $0.83 13.1x 12.3x $47 $52 $53 8.5x 8.3x 0.0% 1.0xNorth American Construction Group Ltd. NOA OP $24.00 $18.40 $514 12 - 2020 $1.74 $1.91 $2.19 9.5x 8.3x $175 $197 $218 4.5x 4.1x 0.9% 1.9xRitchie Bros. Auctioneers RBA SP U$66.00 U$58.94 U$6,547 12 - 2020 U$1.59 U$1.81 U$2.06 32.9x 28.9x U$352 U$366 U$392 19.1x 17.8x 1.5% 1.0xSNC-Lavalin SNC OP $44.00 $31.93 $5,669 12 - 2020 -$0.67 $1.81 $2.55 12.4x 10.5x $93 $551 $675 8.4x 7.5x 0.2% 2.0xStantec Inc. STN OP $60.00 $55.96 $6,258 12 - 2020 $2.13 $2.20 $2.50 25.6x 22.5x $435 $427 $489 15.8x 13.8x 1.2% 1.1xToromont Industries Ltd. TIH OP $125.00 $104.55 $8,638 12 - 2020 $3.09 $3.87 $4.49 27.1x 23.3x $539 $617 $688 14.2x 12.7x 1.3% 0.1xWSP Global WSP OP $160.00 $148.37 $17,521 12 - 2020 $3.34 $4.31 $5.34 34.7x 28.0x $801 $974 $1,168 19.6x 16.4x 1.0% 1.6xAutoCanada ACQ SP $45.00 $46.48 $1,307 12 - 2020 $0.44 $2.94 $3.16 16.3x 15.2x $83 $152 $169 9.8x 8.9x 0.0% 0.7xStelco STLC OP $45.00 $35.40 $3,284 12 - 2020 -$0.60 $15.49 $5.88 2.4x 6.3x $63 $1,492 $633 2.3x 5.4x 1.1% 0.1xATS Automation ATA OP $38.00 $35.97 $3,428 12 - 2020 $1.07 $1.51 $1.70 24.5x 21.9x $181 $244 $266 16.0x 14.7x 0.0% 1.9xABC Technologies ABCT SP $9.50 $8.82 $464 12 - 2020 NM -U$0.10 U$0.64 -68.2x 11.0x U$89 U$126 U$153 5.0x 4.1x 1.7% 1.7xStella-Jones SJ SP $57.00 $45.63 $3,009 12 - 2020 $3.12 $3.83 $3.13 12.0x 14.6x $343 $404 $349 9.4x 10.9x 1.6% 2.0xMedian 15.3x 14.6x 8.5x 8.3x 1.2%Note: u = USD. Stock Rating: OP = Outperform; SP = Sector Perform; UP = Underperform; T=Tender; UR= Under Review; R=Restricted
Market EV/EBITDA
Source: Company Reports, Refinitiv, NBF
EPS EBITDA (mln)
50VISION JULY/AUGUST 2021 |Back to Research Analysts pageMerchandising & Consumer Products
Empire Company Ltd (EMP .A: TSX)Q4 F2021 Results: Largely in-line results and outlook commentaryQ4/F21 EPS was $0 .64 vs . NBF at $0 .63 and cons . at $0 .60; last year was $0 .66We consider the results to be largely in line; the headline EPS beat was primarily aided by a favourable tax impact and slightly better Investment/ Other profitability. Food performance had better than forecast sales, but lower EBITDA. Same store sales growth (sssg) excl. fuel was -6.1% vs. NBF at -7.3%; last year was 18.0%. FR sales were $6,920 mln vs. NBF at $6,816 mln; last year was $7,012 mln. FR EBITDA was $499 mln vs. NBF at $512 mln; last year was $520 mln. Management noted COVID-19 related costs of ~$24 mln, above our $20 mln. The annual dividend increased by 15.3%.
Outlook largely in line with our viewEMP provided outlook commentary that is largely in line with our view. Looking ahead in F2022, EMP anticipates some normalization of business throughout the year as COVID-19 restrictions are relaxed. Specifically, management expects that: (a) sssg will decline (we model sssg of -3.4%) and
(b) margins will benefit from Project Horizon initiatives and the addition of Longo’s, partially offset by unfavourable sales mix y/y. While EMP doesn’t expect consumer behaviour to return fully to pre-pandemic levels for the foreseeable future, it expects that discount banners should experience higher relative sales. Management expects F2022 EPS dilution of $0.25 -$0.30 (F2021 dilution was $0.18) related to e-Commerce driven by higher costs (the Montreal CFC and additional store pick e-Commerce locations).
Project Horizon targets on trackEmpire indicated that it is on track to achieve Project Horizon targets; we note the following highlights: (a) Empire has now confirmed 44 Farm Boy locations in ON, with 39 stores currently opened; 5 stores to open in F2022 (net of one closure). (b) Empire has confirmed 40 of ~65 FreshCo locations in Western Canada and is on track to open 12 FreshCo stores in F2022. (c). The Vaughan CFC is exceeding all Food retailing targets (on-time delivery, fulfilment and customer satisfaction).
Maintain Outperform rating; price target is $46Our price target is based on 8.0x our F2023 Food Retailing EBITDA, plus the value of Empire’s investments (less a 10% discount).
Vishal Shreedhar Analyst 416-869-7930 —Associates: Paul Hyung: 416-507-9009 Ryan Li: 416-869-6767
Sector Analysis
Selection› Gildan
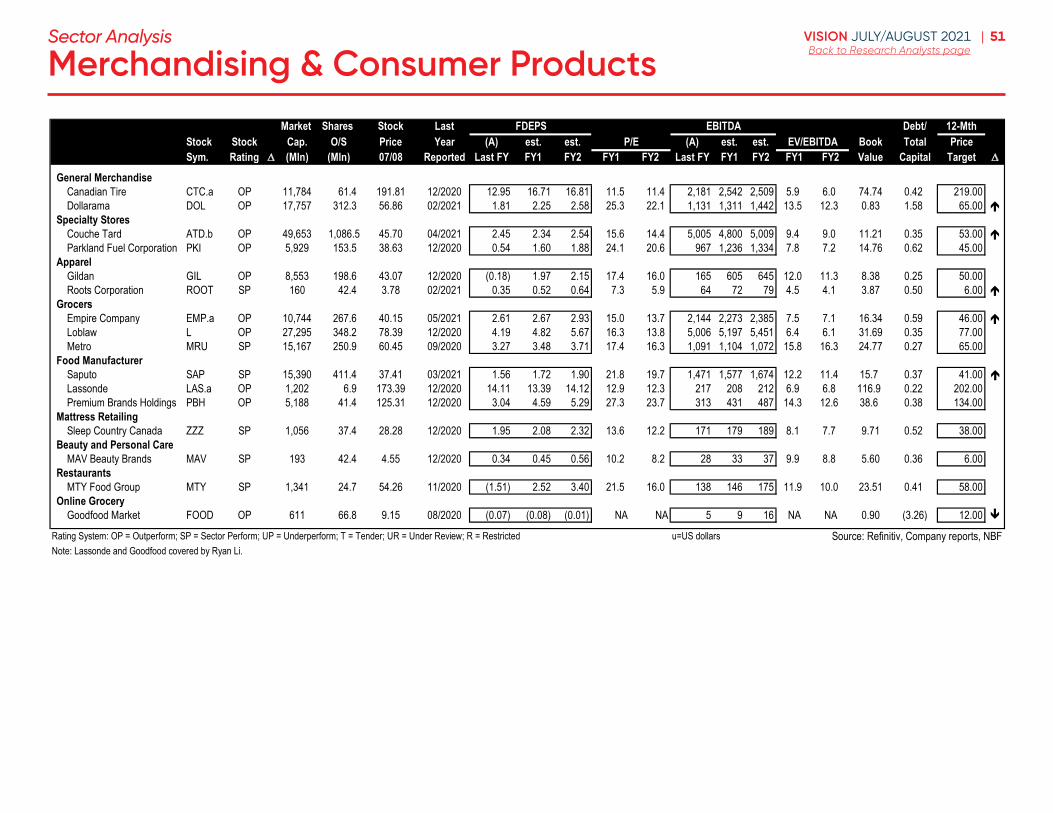
51VISION JULY/AUGUST 2021 |Back to Research Analysts pageMerchandising & Consumer Products
Sector Analysis
Market Shares Stock Last FDEPS EBITDA Debt/ 12-MthStock Stock Cap. O/S Price Year (A) est. est. P/E (A) est. est. EV/EBITDA Book Total PriceSym. Rating (Mln) (Mln) 07/08 Reported Last FY FY1 FY2 FY1 FY2 Last FY FY1 FY2 FY1 FY2 Value Capital Target
General MerchandiseCanadian Tire CTC.a OP 11,784 61.4 191.81 12/2020 12.95 16.71 16.81 11.5 11.4 2,181 2,542 2,509 5.9 6.0 74.74 0.42 219.00Dollarama DOL OP 17,757 312.3 56.86 02/2021 1.81 2.25 2.58 25.3 22.1 1,131 1,311 1,442 13.5 12.3 0.83 1.58 65.00
Specialty StoresCouche Tard ATD.b OP 49,653 1,086.5 45.70 04/2021 2.45 2.34 2.54 15.6 14.4 5,005 4,800 5,009 9.4 9.0 11.21 0.35 53.00 Parkland Fuel Corporation PKI OP 5,929 153.5 38.63 12/2020 0.54 1.60 1.88 24.1 20.6 967 1,236 1,334 7.8 7.2 14.76 0.62 45.00
ApparelGildan GIL OP 8,553 198.6 43.07 12/2020 (0.18) 1.97 2.15 17.4 16.0 165 605 645 12.0 11.3 8.38 0.25 50.00Roots Corporation ROOT SP 160 42.4 3.78 02/2021 0.35 0.52 0.64 7.3 5.9 64 72 79 4.5 4.1 3.87 0.50 6.00
GrocersEmpire Company EMP.a OP 10,744 267.6 40.15 05/2021 2.61 2.67 2.93 15.0 13.7 2,144 2,273 2,385 7.5 7.1 16.34 0.59 46.00 Loblaw L OP 27,295 348.2 78.39 12/2020 4.19 4.82 5.67 16.3 13.8 5,006 5,197 5,451 6.4 6.1 31.69 0.35 77.00Metro MRU SP 15,167 250.9 60.45 09/2020 3.27 3.48 3.71 17.4 16.3 1,091 1,104 1,072 15.8 16.3 24.77 0.27 65.00
Food ManufacturerSaputo SAP SP 15,390 411.4 37.41 03/2021 1.56 1.72 1.90 21.8 19.7 1,471 1,577 1,674 12.2 11.4 15.7 0.37 41.00 Lassonde LAS.a OP 1,202 6.9 173.39 12/2020 14.11 13.39 14.12 12.9 12.3 217 208 212 6.9 6.8 116.9 0.22 202.00Premium Brands Holdings PBH OP 5,188 41.4 125.31 12/2020 3.04 4.59 5.29 27.3 23.7 313 431 487 14.3 12.6 38.6 0.38 134.00
Mattress RetailingSleep Country Canada ZZZ SP 1,056 37.4 28.28 12/2020 1.95 2.08 2.32 13.6 12.2 171 179 189 8.1 7.7 9.71 0.52 38.00
Beauty and Personal CareMAV Beauty Brands MAV SP 193 42.4 4.55 12/2020 0.34 0.45 0.56 10.2 8.2 28 33 37 9.9 8.8 5.60 0.36 6.00
RestaurantsMTY Food Group MTY SP 1,341 24.7 54.26 11/2020 (1.51) 2.52 3.40 21.5 16.0 138 146 175 11.9 10.0 23.51 0.41 58.00
Online GroceryGoodfood Market FOOD OP 611 66.8 9.15 08/2020 (0.07) (0.08) (0.01) NA NA 5 9 16 NA NA 0.90 (3.26) 12.00
Rating System: OP = Outperform; SP = Sector Perform; UP = Underperform; T = Tender; UR = Under Review; R = Restricted u=US dollarsNote: Lassonde and Goodfood covered by Ryan Li.
Source: Refinitiv, Company reports, NBF
52VISION JULY/AUGUST 2021 |Back to Research Analysts pageMetals & Mining: Base Metals
Price Volatility to Persist in 2021While much of copper’s current bull run has been influenced by the ongoing distribution of COVID-19 vaccines, accommodative government policies/stimulus spending and reopening of the global economy, the main driver of increased prices in recent months remains a high influx of speculative investor interest. There remains some uncertainty as to the extent countries can contain new waves of infection in the near term, which may influence macroeconomic outcomes, and we expect prices to remain volatile.
In our view, long-term fundamentals remain driven by a lack of an advanced stage project pipeline and building structural deficit in the coming years. Green infrastructure and electric vehicles (EV) are emerging as the dominant story for long-term copper demand, expected to partially offset the reduced production of internal combustion engine vehicles.
Top picks: First Quantum Minerals Ltd . (FM: TSX) The company’s high-quality asset base, organic growth profile and long-term exposure to copper prices maintain its status as a ‘go-to’ copper producer. FM has the most potential to deliver meaningful news flow over the next 12 months with potential non-core asset sales, which may include a minority interest in its Zambian operations. The company recently announced a 30% equity stake sale in its Ravensthorpe project with proceeds to be used to repay its RCF. These strategic divestitures would be supportive of deleveraging the balance sheet and reduce the company’s overall exposure to future cost increases in Zambia. Any further clarity regarding the long-term tax/royalty structure in Panama and Zambia would further improve the outlook for the company.
Copper Mountain Mining Corp . (CMMC: TSX) Copper Mountain has a strong near-term production outlook at the Copper Mountain Mine, entering a high-grade sequence for 2021-2022 and the completion of the mill expansion to 45,000 tpd by Q3/21 (from 40,000 tpd), and recently improved balance sheet with the US$260 million note issuance freeing up cash flow to direct to future growth opportunities. Next to Copper Mountain Mine, CMMC has the Eva development project on the horizon with a development decision expected by year-end 2021.
Capstone Mining Corp . (CS: TSX) Capstone is set to deliver several catalysts that will define an improved near-term growth outlook including initiatives to achieve a sustained 57,000 tpd mill throughput by mid-year at Pinto Valley and mine life extension at Cozamin via incorporating an additional paste/backfill. Pinto Valley/Cozamin are expected to deliver ~30% production growth and ~10% reduction in costs by 2023. In addition, with the Cozamin silver stream sale and Santo Domingo gold stream sale, the company has no net debt and continues to advance partnership/financing agreements to deliver transformational growth from Santo Domingo.
Sector Analysis
Don DeMarco Analyst 416-869-7572 —Associates:Yi Liu: 416-869-8524 Harmen Puri: 416-869-8045
Shane Nagle, cfa Analyst 416-869-7936 —Associates: Lola Aganga: 416-869-6516 Ahmed Al-Saidi: 416-869-7535
Selections› First Quantum› Copper Mountain Mining › Capstone Mining
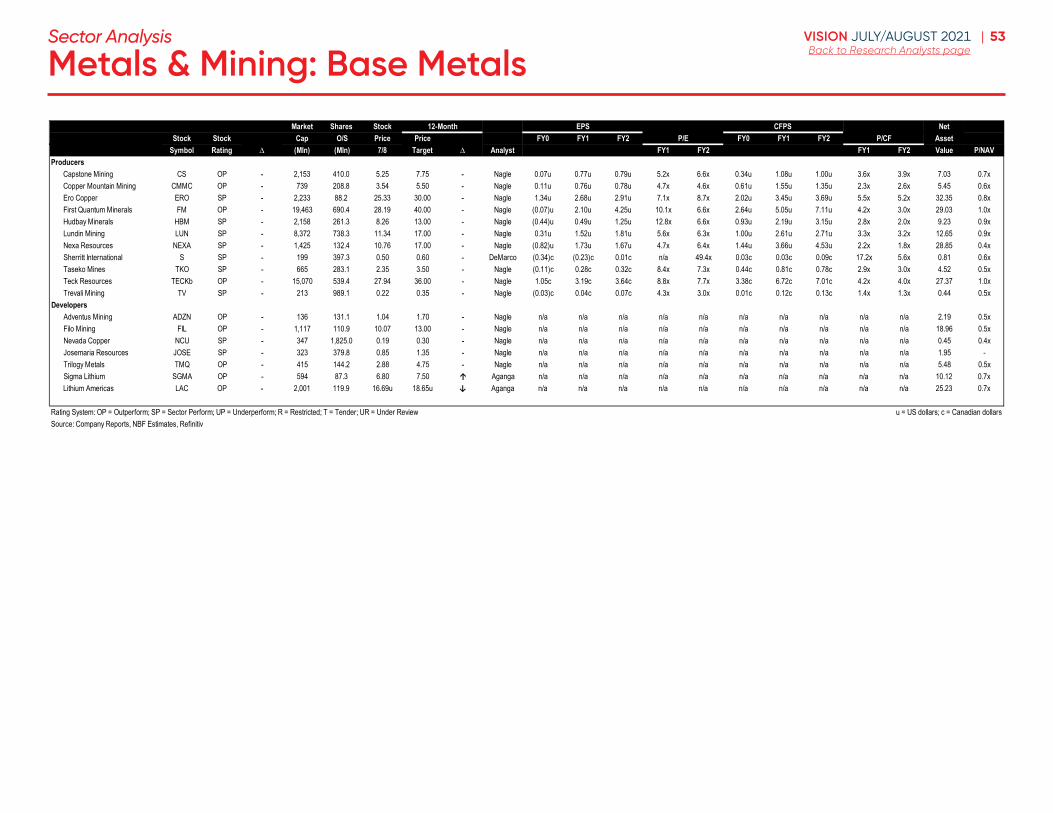
53VISION JULY/AUGUST 2021 |Back to Research Analysts pageMetals & Mining: Base Metals
Sector Analysis
Market Shares Stock 12-Month EPS CFPS NetStock Stock Cap O/S Price Price FY0 FY1 FY2 P/E FY0 FY1 FY2 P/CF Asset
Symbol Rating ∆ (Mln) (Mln) 7/8 Target ∆ Analyst FY1 FY2 FY1 FY2 Value P/NAVProducers
Capstone Mining CS OP - 2,153 410.0 5.25 7.75 - Nagle 0.07u 0.77u 0.79u 5.2x 6.6x 0.34u 1.08u 1.00u 3.6x 3.9x 7.03 0.7xCopper Mountain Mining CMMC OP - 739 208.8 3.54 5.50 - Nagle 0.11u 0.76u 0.78u 4.7x 4.6x 0.61u 1.55u 1.35u 2.3x 2.6x 5.45 0.6xEro Copper ERO SP - 2,233 88.2 25.33 30.00 - Nagle 1.34u 2.68u 2.91u 7.1x 8.7x 2.02u 3.45u 3.69u 5.5x 5.2x 32.35 0.8xFirst Quantum Minerals FM OP - 19,463 690.4 28.19 40.00 - Nagle (0.07)u 2.10u 4.25u 10.1x 6.6x 2.64u 5.05u 7.11u 4.2x 3.0x 29.03 1.0xHudbay Minerals HBM SP - 2,158 261.3 8.26 13.00 - Nagle (0.44)u 0.49u 1.25u 12.8x 6.6x 0.93u 2.19u 3.15u 2.8x 2.0x 9.23 0.9xLundin Mining LUN SP - 8,372 738.3 11.34 17.00 - Nagle 0.31u 1.52u 1.81u 5.6x 6.3x 1.00u 2.61u 2.71u 3.3x 3.2x 12.65 0.9xNexa Resources NEXA SP - 1,425 132.4 10.76 17.00 - Nagle (0.82)u 1.73u 1.67u 4.7x 6.4x 1.44u 3.66u 4.53u 2.2x 1.8x 28.85 0.4xSherritt International S SP - 199 397.3 0.50 0.60 - DeMarco (0.34)c (0.23)c 0.01c n/a 49.4x 0.03c 0.03c 0.09c 17.2x 5.6x 0.81 0.6xTaseko Mines TKO SP - 665 283.1 2.35 3.50 - Nagle (0.11)c 0.28c 0.32c 8.4x 7.3x 0.44c 0.81c 0.78c 2.9x 3.0x 4.52 0.5xTeck Resources TECKb OP - 15,070 539.4 27.94 36.00 - Nagle 1.05c 3.19c 3.64c 8.8x 7.7x 3.38c 6.72c 7.01c 4.2x 4.0x 27.37 1.0xTrevali Mining TV SP - 213 989.1 0.22 0.35 - Nagle (0.03)c 0.04c 0.07c 4.3x 3.0x 0.01c 0.12c 0.13c 1.4x 1.3x 0.44 0.5x
DevelopersAdventus Mining ADZN OP - 136 131.1 1.04 1.70 - Nagle n/a n/a n/a n/a n/a n/a n/a n/a n/a n/a 2.19 0.5xFilo Mining FIL OP - 1,117 110.9 10.07 13.00 - Nagle n/a n/a n/a n/a n/a n/a n/a n/a n/a n/a 18.96 0.5xNevada Copper NCU SP - 347 1,825.0 0.19 0.30 - Nagle n/a n/a n/a n/a n/a n/a n/a n/a n/a n/a 0.45 0.4xJosemaria Resources JOSE SP - 323 379.8 0.85 1.35 - Nagle n/a n/a n/a n/a n/a n/a n/a n/a n/a n/a 1.95 -Trilogy Metals TMQ OP - 415 144.2 2.88 4.75 - Nagle n/a n/a n/a n/a n/a n/a n/a n/a n/a n/a 5.48 0.5xSigma Lithium SGMA OP - 594 87.3 6.80 7.50 ↑ Aganga n/a n/a n/a n/a n/a n/a n/a n/a n/a n/a 10.12 0.7xLithium Americas LAC OP - 2,001 119.9 16.69u 18.65u ↓ Aganga n/a n/a n/a n/a n/a n/a n/a n/a n/a n/a 25.23 0.7x
Rating System: OP = Outperform; SP = Sector Perform; UP = Underperform; R = Restricted; T = Tender; UR = Under Review u = US dollars; c = Canadian dollarsSource: Company Reports, NBF Estimates, Refinitiv

54VISION JULY/AUGUST 2021 |Back to Research Analysts pageMetals & Mining: Precious Metals
Inflation Could Spark Gold RallyEye on US inflation which will drive spot gold prices .The economic impact of COVID-19 has forced governments to approve large stimulus programs to protect the economy. In addition to these stimulus measures, interest rates remain low and unprecedented support packages have been approved. The U.S. 10-year yield started the year off on a strong note, but more recently has softened, and thus, real rates have shifted rapidly negative, spurring gold to rally from sub-US$1,700/oz in late March. The U.S. Fed continues to voice support for keeping interest rates low, with no expected rate hike in 2021, and continuing with the QE program, focusing on job creation by any means necessary while accepting climbing inflation beyond the Fed target rate for a period of time. We believe a rising U.S. inflation rate will be the main driver for spot gold prices and consequently gold equities.
Top Picks offer dependable results, strong balance sheets and numerous catalysts . We believe the companies that are most likely to outperform are those with: (1) management teams with solid track records of executing on guidance, (2) strong balance sheets, (3) encouraging Y/Y guidance with growth in production and/or declining costs, (4) exiting heavy capital spending programs, and (5) a catalyst-packed calendar. On an EV/EBITDA valuation basis, we see some names trading at attractive multiples and those that have a history of achieving guidance and showing potential for delivering positive catalysts; we believe these names offer good investment opportunities.
Sector Analysis
Don DeMarco Analyst 416-869-7572 —Associates:Yi Liu: 416-869-8524 Harmen Puri: 416-869-8045
Shane Nagle, cfa Analyst 416-869-7936 —Associates: Lola Aganga: 416-869-6516 Ahmed Al-Saidi: 416-869-7535
Michael Parkin Analyst 416-869-6766 —Associates: Alessandro Cairo : 416-869-8511 Jonathan Egilo: 416-507-8177 Rabi Nizami: 416-869-7925
SelectionsGold/Silver Producers: › Dundee Precious Metals Inc. (DPM: TSX; C$13.50 target)› Endeavour Mining Corp. (EDV: TSX; C$57.00 target)› K92 Mining Corp. (KNT: TSX; C$11.25 target)› Newmont Corp. (NGT: TSX; C$108.00 target)› SSR Mining Inc. (SSRM: TSX; C$36.00 target)› Wesdome (WDO: TSX; C$14.00 target)
Royalties: › Sandstorm Gold Ltd. (SSL: TSX; C$13.00 target)
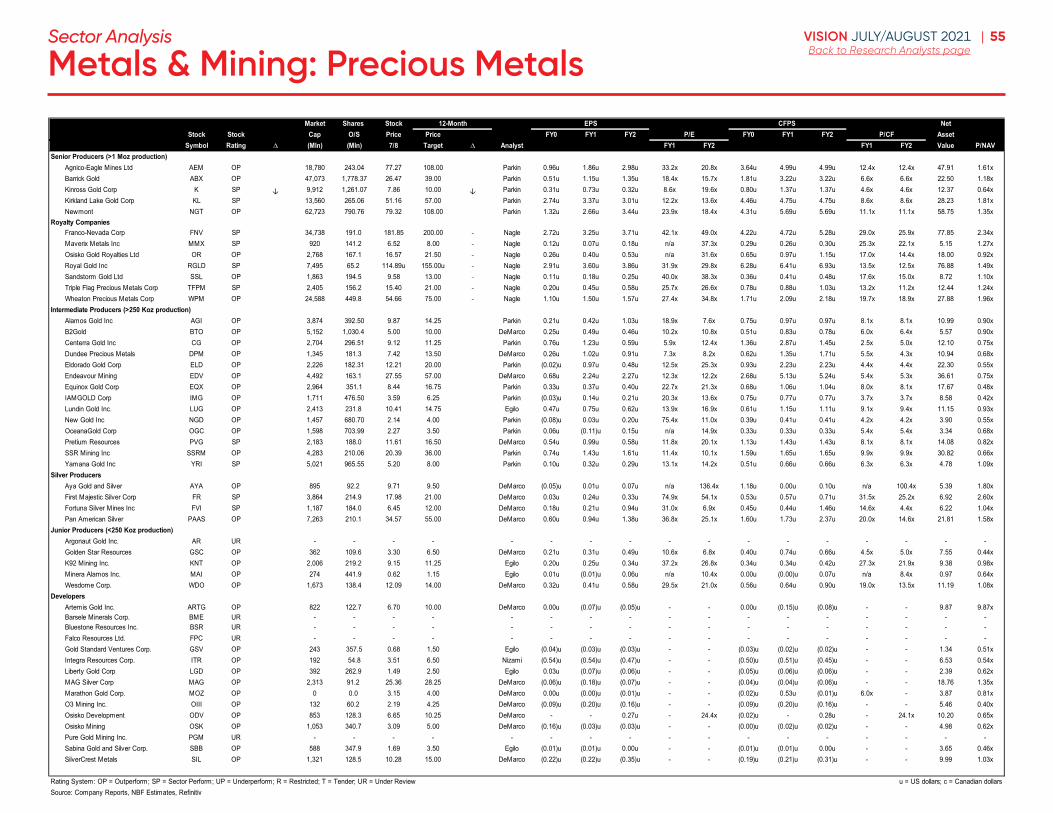
55VISION JULY/AUGUST 2021 |Back to Research Analysts pageMetals & Mining: Precious Metals
Sector Analysis
Market Shares Stock 12-Month EPS CFPS NetStock Stock Cap O/S Price Price FY0 FY1 FY2 P/E FY0 FY1 FY2 P/CF Asset
Symbol Rating ∆ (Mln) (Mln) 7/8 Target ∆ Analyst FY1 FY2 FY1 FY2 Value P/NAVSenior Producers (>1 Moz production)
Agnico-Eagle Mines Ltd AEM OP 18,780 243.04 77.27 108.00 Parkin 0.96u 1.86u 2.98u 33.2x 20.8x 3.64u 4.99u 4.99u 12.4x 12.4x 47.91 1.61xBarrick Gold ABX OP 47,073 1,778.37 26.47 39.00 Parkin 0.51u 1.15u 1.35u 18.4x 15.7x 1.81u 3.22u 3.22u 6.6x 6.6x 22.50 1.18xKinross Gold Corp K SP ↓ 9,912 1,261.07 7.86 10.00 ↓ Parkin 0.31u 0.73u 0.32u 8.6x 19.6x 0.80u 1.37u 1.37u 4.6x 4.6x 12.37 0.64xKirkland Lake Gold Corp KL SP 13,560 265.06 51.16 57.00 Parkin 2.74u 3.37u 3.01u 12.2x 13.6x 4.46u 4.75u 4.75u 8.6x 8.6x 28.23 1.81xNewmont NGT OP 62,723 790.76 79.32 108.00 Parkin 1.32u 2.66u 3.44u 23.9x 18.4x 4.31u 5.69u 5.69u 11.1x 11.1x 58.75 1.35x
Royalty CompaniesFranco-Nevada Corp FNV SP 34,738 191.0 181.85 200.00 - Nagle 2.72u 3.25u 3.71u 42.1x 49.0x 4.22u 4.72u 5.28u 29.0x 25.9x 77.85 2.34xMaverix Metals Inc MMX SP 920 141.2 6.52 8.00 - Nagle 0.12u 0.07u 0.18u n/a 37.3x 0.29u 0.26u 0.30u 25.3x 22.1x 5.15 1.27xOsisko Gold Royalties Ltd OR OP 2,768 167.1 16.57 21.50 - Nagle 0.26u 0.40u 0.53u n/a 31.6x 0.65u 0.97u 1.15u 17.0x 14.4x 18.00 0.92xRoyal Gold Inc RGLD SP 7,495 65.2 114.89u 155.00u - Nagle 2.91u 3.60u 3.86u 31.9x 29.8x 6.28u 6.41u 6.93u 13.5x 12.5x 76.88 1.49xSandstorm Gold Ltd SSL OP 1,863 194.5 9.58 13.00 - Nagle 0.11u 0.18u 0.25u 40.0x 38.3x 0.36u 0.41u 0.48u 17.6x 15.0x 8.72 1.10xTriple Flag Precious Metals Corp TFPM SP 2,405 156.2 15.40 21.00 - Nagle 0.20u 0.45u 0.58u 25.7x 26.6x 0.78u 0.88u 1.03u 13.2x 11.2x 12.44 1.24xWheaton Precious Metals Corp WPM OP 24,588 449.8 54.66 75.00 - Nagle 1.10u 1.50u 1.57u 27.4x 34.8x 1.71u 2.09u 2.18u 19.7x 18.9x 27.88 1.96x
Intermediate Producers (>250 Koz production)Alamos Gold Inc AGI OP 3,874 392.50 9.87 14.25 Parkin 0.21u 0.42u 1.03u 18.9x 7.6x 0.75u 0.97u 0.97u 8.1x 8.1x 10.99 0.90xB2Gold BTO OP 5,152 1,030.4 5.00 10.00 DeMarco 0.25u 0.49u 0.46u 10.2x 10.8x 0.51u 0.83u 0.78u 6.0x 6.4x 5.57 0.90xCenterra Gold Inc CG OP 2,704 296.51 9.12 11.25 Parkin 0.76u 1.23u 0.59u 5.9x 12.4x 1.36u 2.87u 1.45u 2.5x 5.0x 12.10 0.75xDundee Precious Metals DPM OP 1,345 181.3 7.42 13.50 DeMarco 0.26u 1.02u 0.91u 7.3x 8.2x 0.62u 1.35u 1.71u 5.5x 4.3x 10.94 0.68xEldorado Gold Corp ELD OP 2,226 182.31 12.21 20.00 Parkin (0.02)u 0.97u 0.48u 12.5x 25.3x 0.93u 2.23u 2.23u 4.4x 4.4x 22.30 0.55xEndeavour Mining EDV OP 4,492 163.1 27.55 57.00 DeMarco 0.68u 2.24u 2.27u 12.3x 12.2x 2.68u 5.13u 5.24u 5.4x 5.3x 36.61 0.75xEquinox Gold Corp EQX OP 2,964 351.1 8.44 16.75 Parkin 0.33u 0.37u 0.40u 22.7x 21.3x 0.68u 1.06u 1.04u 8.0x 8.1x 17.67 0.48xIAMGOLD Corp IMG OP 1,711 476.50 3.59 6.25 Parkin (0.03)u 0.14u 0.21u 20.3x 13.6x 0.75u 0.77u 0.77u 3.7x 3.7x 8.58 0.42xLundin Gold Inc. LUG OP 2,413 231.8 10.41 14.75 Egilo 0.47u 0.75u 0.62u 13.9x 16.9x 0.61u 1.15u 1.11u 9.1x 9.4x 11.15 0.93xNew Gold Inc NGD OP 1,457 680.70 2.14 4.00 Parkin (0.08)u 0.03u 0.20u 75.4x 11.0x 0.39u 0.41u 0.41u 4.2x 4.2x 3.90 0.55xOceanaGold Corp OGC OP 1,598 703.99 2.27 3.50 Parkin 0.06u (0.11)u 0.15u n/a 14.9x 0.33u 0.33u 0.33u 5.4x 5.4x 3.34 0.68xPretium Resources PVG SP 2,183 188.0 11.61 16.50 DeMarco 0.54u 0.99u 0.58u 11.8x 20.1x 1.13u 1.43u 1.43u 8.1x 8.1x 14.08 0.82xSSR Mining Inc SSRM OP 4,283 210.06 20.39 36.00 Parkin 0.74u 1.43u 1.61u 11.4x 10.1x 1.59u 1.65u 1.65u 9.9x 9.9x 30.82 0.66xYamana Gold Inc YRI SP 5,021 965.55 5.20 8.00 Parkin 0.10u 0.32u 0.29u 13.1x 14.2x 0.51u 0.66u 0.66u 6.3x 6.3x 4.78 1.09x
Silver ProducersAya Gold and Silver AYA OP 895 92.2 9.71 9.50 DeMarco (0.05)u 0.01u 0.07u n/a 136.4x 1.18u 0.00u 0.10u n/a 100.4x 5.39 1.80xFirst Majestic Silver Corp FR SP 3,864 214.9 17.98 21.00 DeMarco 0.03u 0.24u 0.33u 74.9x 54.1x 0.53u 0.57u 0.71u 31.5x 25.2x 6.92 2.60xFortuna Silver Mines Inc FVI SP 1,187 184.0 6.45 12.00 DeMarco 0.18u 0.21u 0.94u 31.0x 6.9x 0.45u 0.44u 1.46u 14.6x 4.4x 6.22 1.04xPan American Silver PAAS OP 7,263 210.1 34.57 55.00 DeMarco 0.60u 0.94u 1.38u 36.8x 25.1x 1.60u 1.73u 2.37u 20.0x 14.6x 21.81 1.58x
Junior Producers (<250 Koz production)Argonaut Gold Inc. AR UR - - - - - - - - - - - - - - - - -Golden Star Resources GSC OP 362 109.6 3.30 6.50 DeMarco 0.21u 0.31u 0.49u 10.6x 6.8x 0.40u 0.74u 0.66u 4.5x 5.0x 7.55 0.44xK92 Mining Inc. KNT OP 2,006 219.2 9.15 11.25 Egilo 0.20u 0.25u 0.34u 37.2x 26.8x 0.34u 0.34u 0.42u 27.3x 21.9x 9.38 0.98xMinera Alamos Inc. MAI OP 274 441.9 0.62 1.15 Egilo 0.01u (0.01)u 0.06u n/a 10.4x 0.00u (0.00)u 0.07u n/a 8.4x 0.97 0.64xWesdome Corp. WDO OP 1,673 138.4 12.09 14.00 DeMarco 0.32u 0.41u 0.58u 29.5x 21.0x 0.56u 0.64u 0.90u 19.0x 13.5x 11.19 1.08x
DevelopersArtemis Gold Inc. ARTG OP 822 122.7 6.70 10.00 DeMarco 0.00u (0.07)u (0.05)u - - 0.00u (0.15)u (0.08)u - - 9.87 9.87xBarsele Minerals Corp. BME UR - - - - - - - - - - - - - - - - -Bluestone Resources Inc. BSR UR - - - - - - - - - - - - - - - - -Falco Resources Ltd. FPC UR - - - - - - - - - - - - - - - - -Gold Standard Ventures Corp. GSV OP 243 357.5 0.68 1.50 Egilo (0.04)u (0.03)u (0.03)u - - (0.03)u (0.02)u (0.02)u - - 1.34 0.51xIntegra Resources Corp. ITR OP 192 54.8 3.51 6.50 Nizami (0.54)u (0.54)u (0.47)u - - (0.50)u (0.51)u (0.45)u - - 6.53 0.54xLiberty Gold Corp LGD OP 392 262.9 1.49 2.50 Egilo 0.03u (0.07)u (0.06)u - - (0.05)u (0.06)u (0.06)u - - 2.39 0.62xMAG Silver Corp MAG OP 2,313 91.2 25.36 28.25 DeMarco (0.06)u (0.18)u (0.07)u - - (0.04)u (0.04)u (0.06)u - - 18.76 1.35xMarathon Gold Corp. MOZ OP 0 0.0 3.15 4.00 DeMarco 0.00u (0.00)u (0.01)u - - (0.02)u 0.53u (0.01)u 6.0x - 3.87 0.81xO3 Mining Inc. OIII OP 132 60.2 2.19 4.25 DeMarco (0.09)u (0.20)u (0.16)u - - (0.09)u (0.20)u (0.16)u - - 5.46 0.40xOsisko Development ODV OP 853 128.3 6.65 10.25 DeMarco - - 0.27u - 24.4x (0.02)u - 0.28u - 24.1x 10.20 0.65xOsisko Mining OSK OP 1,053 340.7 3.09 5.00 DeMarco (0.16)u (0.03)u (0.03)u - - (0.00)u (0.02)u (0.02)u - - 4.98 0.62xPure Gold Mining Inc. PGM UR - - - - - - - - - - - - - - - - -Sabina Gold and Silver Corp. SBB OP 588 347.9 1.69 3.50 Egilo (0.01)u (0.01)u 0.00u - - (0.01)u (0.01)u 0.00u - - 3.65 0.46xSilverCrest Metals SIL OP 1,321 128.5 10.28 15.00 DeMarco (0.22)u (0.22)u (0.35)u - - (0.19)u (0.21)u (0.31)u - - 9.99 1.03x
Rating System: OP = Outperform; SP = Sector Perform; UP = Underperform; R = Restricted; T = Tender; UR = Under Review u = US dollars; c = Canadian dollarsSource: Company Reports, NBF Estimates, Refinitiv
56VISION JULY/AUGUST 2021 |Back to Research Analysts pageOil & Gas
Crude Oil OutlookWith five consecutive weeks of gains, WTI has settled just under its 5-year high of US$76.00/bbl. WTI averaged ~US$71.00 in June as a more robust supply and demand scenario continues to unfold while the global COVID-19 recovery continues. The market is anxiously awaiting the upcoming OPEC+ meeting as it is expected that details surrounding subsequent production increases in August and potentially beyond will be revealed. Recall, OPEC+ and Saudi Arabia are expected to ease their production cuts by 441 mbbl/d and 400 mbbl/d in July, respectively. Of note, July marks the last month of Saudi Arabia easing its voluntary 1 mmbbl/d production cut that assisted in balancing the market late last year. Before July’s meeting, Saudi Arabia’s energy minister communicated a cautionary tone surrounding its production increases and OPEC+’s role in taming and containing inflation. However, this bearish tone was offset by comments regarding the uncertainty surrounding the potential for further COVID-19 related demand impacts (Delta variant) and the risk of returning production from Iran and Venezuela. Prior to the July 1st OPEC meeting S&P Platts was forecasting an increase in OPEC+ output of 500,000 bbl/d for August, however the output increase has been delayed due to a disagreement in base level production between Saudi Arabia and UAE. Saudi is looking to increase its baseline production by 600 mbbl/d to 3.8 mmbbl/d and due to the stalemate discussions are expected to last into mid-July. Looking ahead, we expect OPEC+ will remain committed to maintaining balance in the market with its spare output capacity sitting at approximately 6.1 mmbbl/d after the previously agreed upon to July output increase.
The uncertainty surrounding the timing of Iranian barrels returning to the market hasn’t gotten any clearer as time progresses. One near-term catalyst out of the way is the conclusion of the Iranian election with Ebrahim Raisi rising to the top of the Conservative leadership. A key friction between the two sides continues to be the willingness to constrain the Iranian nuclear program. According to Bloomberg, deliberations will probably extend well into the summer months before the two countries can complete their negotiations. South of the border,
U.S production has increased slightly to exit June at 11.1 mbbl/d from May’s exit level of 10.8 mbbl/d. However, the primary driver of the production increase has been achieved through drawdowns of the DUC inventory as opposed to drilling gains. We expect the rig count to increase as WTI remains supported above the US$70/bbl level.
Reflecting on the current market conditions, we recently revised our commodity price deck assumptions. Our 2021 and 2022 forecast for WTI has increased to US$65.50/bbl (from US$59.50/bbl) and US$65.00/bbl (from US$55.00/bbl), respectively, which sit slightly below the forward strip at US$71.80/bbl for the remainder of 2021.
Natural Gas OutlookNatural Gas prices have performed strongly across major North American benchmarks throughout the shoulder season with spot prices averaging US$3.20/MMBtu and C$3.10/GJ for NYMEX and AECO in June, up 8% and 6% from the prior month, respectively. We are seeing a demonstrated stability returning to the market and the volatile swings in seasonality of the commodity being relatively muted (<10% variance between summer and winter) to provide for a more investible gas price landscape. North American rig activity has started to pick up, but U.S drilling activity remains relatively subdued as new production is primarily attributable to DUC inventory drawdowns as opposed to drilling activity. The majority of drilling activity this month is occurring in Canada, and primarily focused on oil. In June, the U.S added 13 total rigs (Oil:13) and in Canada a total of 64 rigs (Oil:54 / Gas:10) were added to bring the m/m increase to 3% and 103%, respectively.
U.S. production is estimated to have increased slightly to 91.0 Bcf/d in June from 90.6 Bcf/d in May. Both LNG and Mexican exports continue to remain elevated at 10 Bcf/d and 6.8 Bcf/d, respectively. Overall demand remains elevated in the United States and Alberta coming in at an estimated ~69.8 Bcf/d and ~5.1 Bcf/d, respectively, due to elevated temperatures in late June bolstering cooling demand.
Overall, we remain constructive on the natural gas complex. We increased our forecast for NYMEX to US$2.90/mcf (from US$2.75/mcf) for 2021 and reiterate
Sector Analysis
Dan Payne Analyst 403-290-5441 —Associates: Anthony Linton: 416-507-9054Baltej Sidhu: 403-290-5627
Travis Wood Analyst 403-290-5102 —Associates: Logan Fisher: 403-441-0933James Harwood, cpa: 403-290-5445
Intermediate Oil & Gas and Oilfield Services
Large Cap Oil & Gas
Selections› Cenovus› Tourmaline
57VISION JULY/AUGUST 2021 |Back to Research Analysts pageOil & Gas
our forecast of US$2.75/mcf for 2022. Additionally, we have increased our AECO forecast for 2021 to C$2.85/mcf (from C$2.70/mcf) and decreased our 2022 forecast to C$2.40/mcf (from $2.50/mcf). We continue to monitor gas fundamentals and forecasts for validation around our optimistic thesis that a more resilient price landscape is emerging in the medium term.
Top PicksCenovus Energy Inc . (CVE: TSX/NYSE)Underpinned by its strong base business and integrated capacity, the company can weather this commodity cycle and provide torque to the upside as global oil prices return. Cenovus has a top-quality asset base – in Foster Creek and Christina Lake – and has sustaining and breakeven costs that are amongst the lowest in the sector. Cenovus recently closed on its deal to acquire Husky and capture $1.2 billion in annual cost savings. We view this deal as necessary and strategic given the company’s high confidence in achieving the $1.2 billion in annual cost savings. Additionally, the added downstream integration and increased egress capacity will help reduce the company’s exposure to the WCS differential, which supports our recommendation for Cenovus as a top pick.
Tourmaline Oil Corp . (TOU: TSX) As one of Canada’s largest gas producers, TOU remains one of our top picks for its exposure to the natural gas trade, the result of well-capitalized and strong organic operations with fundamental tailwinds (cost, capital efficiencies and netback) to support a solid value proposition. Additional strength is seen in the balance sheet, deep inventory and top-tier cost structure as the company continues to generate extensive FCF. In the current macro environment, TOU is one of the most investable names, where it holds positive and well-supported liquidity, exposure to several value-additive themes (gas and Topaz), which in sum, support what is already an attractive valuation.
Sector Analysis
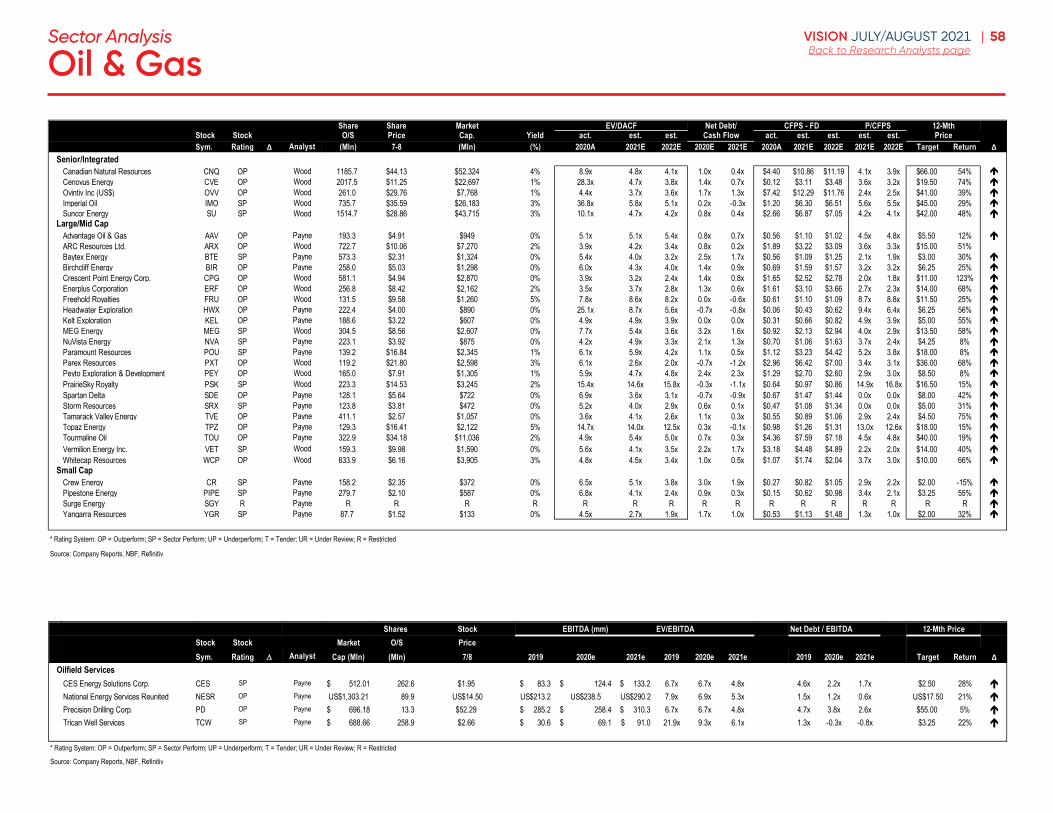
58VISION JULY/AUGUST 2021 |Back to Research Analysts pageOil & Gas
Sector Analysis
Share Share MarketStock Stock O/S Price Cap. Yield act. est. est. act. est. est. est. est.Sym. Rating ∆ Analyst (Mln) 7-8 (Mln) (%) 2020A 2021E 2022E 2020E 2021E 2020A 2021E 2022E 2021E 2022E Target Return ∆
Senior/Integrated HARDCODECanadian Natural Resources CNQ OP Wood 1185.7 $44.13 $52,324 4% 8.9x 4.8x 4.1x 1.0x 0.4x $4.40 $10.86 $11.19 4.1x 3.9x $66.00 54% Cenovus Energy CVE OP Wood 2017.5 $11.25 $22,697 1% 28.3x 4.7x 3.8x 1.4x 0.7x $0.12 $3.11 $3.48 3.6x 3.2x $19.50 74% Ovintiv Inc (US$) OVV OP Wood 261.0 $29.76 $7,768 1% 4.4x 3.7x 3.6x 1.7x 1.3x $7.42 $12.29 $11.76 2.4x 2.5x $41.00 39% Imperial Oil IMO SP Wood 735.7 $35.59 $26,183 3% 36.8x 5.8x 5.1x 0.2x -0.3x $1.20 $6.30 $6.51 5.6x 5.5x $45.00 29% Suncor Energy SU SP Wood 1514.7 $28.86 $43,715 3% 10.1x 4.7x 4.2x 0.8x 0.4x $2.66 $6.87 $7.05 4.2x 4.1x $42.00 48%
Large/Mid CapAdvantage Oil & Gas AAV OP Payne 193.3 $4.91 $949 0% 5.1x 5.1x 5.4x 0.8x 0.7x $0.56 $1.10 $1.02 4.5x 4.8x $5.50 12% ARC Resources Ltd. ARX OP Wood 722.7 $10.06 $7,270 2% 3.9x 4.2x 3.4x 0.8x 0.2x $1.89 $3.22 $3.09 3.6x 3.3x $15.00 51%Baytex Energy BTE SP Payne 573.3 $2.31 $1,324 0% 5.4x 4.0x 3.2x 2.5x 1.7x $0.56 $1.09 $1.25 2.1x 1.9x $3.00 30% Birchcliff Energy BIR OP Payne 258.0 $5.03 $1,298 0% 6.0x 4.3x 4.0x 1.4x 0.9x $0.69 $1.59 $1.57 3.2x 3.2x $6.25 25% Crescent Point Energy Corp. CPG OP Wood 581.1 $4.94 $2,870 0% 3.9x 3.2x 2.4x 1.4x 0.8x $1.65 $2.52 $2.78 2.0x 1.8x $11.00 123% Enerplus Corporation ERF OP Wood 256.8 $8.42 $2,162 2% 3.5x 3.7x 2.8x 1.3x 0.6x $1.61 $3.10 $3.66 2.7x 2.3x $14.00 68% Freehold Royalties FRU OP Wood 131.5 $9.58 $1,260 5% 7.8x 8.6x 8.2x 0.0x -0.6x $0.61 $1.10 $1.09 8.7x 8.8x $11.50 25% Headwater Exploration HWX OP Payne 222.4 $4.00 $890 0% 25.1x 8.7x 5.6x -0.7x -0.8x $0.06 $0.43 $0.62 9.4x 6.4x $6.25 56% Kelt Exploration KEL OP Payne 188.6 $3.22 $607 0% 4.9x 4.9x 3.9x 0.0x 0.0x $0.31 $0.66 $0.82 4.9x 3.9x $5.00 55% MEG Energy MEG SP Wood 304.5 $8.56 $2,607 0% 7.7x 5.4x 3.6x 3.2x 1.6x $0.92 $2.13 $2.94 4.0x 2.9x $13.50 58% NuVista Energy NVA SP Payne 223.1 $3.92 $875 0% 4.2x 4.9x 3.3x 2.1x 1.3x $0.70 $1.06 $1.63 3.7x 2.4x $4.25 8% Paramount Resources POU SP Payne 139.2 $16.84 $2,345 1% 6.1x 5.9x 4.2x 1.1x 0.5x $1.12 $3.23 $4.42 5.2x 3.8x $18.00 8% Parex Resources PXT OP Wood 119.2 $21.80 $2,598 3% 6.1x 2.6x 2.0x -0.7x -1.2x $2.96 $6.42 $7.00 3.4x 3.1x $36.00 68% Peyto Exploration & Development PEY OP Wood 165.0 $7.91 $1,305 1% 5.9x 4.7x 4.8x 2.4x 2.3x $1.29 $2.70 $2.60 2.9x 3.0x $8.50 8% PrairieSky Royalty PSK SP Wood 223.3 $14.53 $3,245 2% 15.4x 14.6x 15.8x -0.3x -1.1x $0.64 $0.97 $0.86 14.9x 16.8x $16.50 15% Spartan Delta SDE OP Payne 128.1 $5.64 $722 0% 6.9x 3.6x 3.1x -0.7x -0.9x $0.67 $1.47 $1.44 0.0x 0.0x $8.00 42% Storm Resources SRX SP Payne 123.8 $3.81 $472 0% 5.2x 4.0x 2.9x 0.6x 0.1x $0.47 $1.08 $1.34 0.0x 0.0x $5.00 31% Tamarack Valley Energy TVE OP Payne 411.1 $2.57 $1,057 0% 3.6x 4.1x 2.6x 1.1x 0.3x $0.55 $0.89 $1.06 2.9x 2.4x $4.50 75% Topaz Energy TPZ OP Payne 129.3 $16.41 $2,122 5% 14.7x 14.0x 12.5x 0.3x -0.1x $0.98 $1.26 $1.31 13.0x 12.6x $18.00 15% Tourmaline Oil TOU OP Payne 322.9 $34.18 $11,036 2% 4.9x 5.4x 5.0x 0.7x 0.3x $4.36 $7.59 $7.18 4.5x 4.8x $40.00 19% Vermilion Energy Inc. VET SP Wood 159.3 $9.98 $1,590 0% 5.6x 4.1x 3.5x 2.2x 1.7x $3.18 $4.48 $4.89 2.2x 2.0x $14.00 40% Whitecap Resources WCP OP Wood 633.9 $6.16 $3,905 3% 4.8x 4.5x 3.4x 1.0x 0.5x $1.07 $1.74 $2.04 3.7x 3.0x $10.00 66%
Small CapCrew Energy CR SP Payne 158.2 $2.35 $372 0% 6.5x 5.1x 3.8x 3.0x 1.9x $0.27 $0.82 $1.05 2.9x 2.2x $2.00 -15% Pipestone Energy PIPE SP Payne 279.7 $2.10 $587 0% 6.8x 4.1x 2.4x 0.9x 0.3x $0.15 $0.62 $0.98 3.4x 2.1x $3.25 55% Surge Energy SGY R Payne R R R R R R R R R R R R R R R R Yangarra Resources YGR SP Payne 87.7 $1.52 $133 0% 4.5x 2.7x 1.9x 1.7x 1.0x $0.53 $1.13 $1.48 1.3x 1.0x $2.00 32%
* Rating System: OP = Outperform; SP = Sector Perform; UP = Underperform; T = Tender; UR = Under Review; R = Restricted
Source: Company Reports, NBF, Refinitiv
Cash Flow PriceEV/DACF Net Debt/ CFPS - FD P/CFPS 12-Mth
Shares Stock EV/EBITDA Net Debt / EBITDAStock Stock Market O/S PriceSym. Rating Analyst Cap (Mln) (Mln) 7/8 2019 2020e 2021e 2019 2020e 2021e 2019 2020e 2021e Target Return ∆
Oilfield ServicesCES Energy Solutions Corp. CES SP Payne 512.01$ 262.6 $1.95 83.3$ 124.4$ 133.2$ 6.7x 6.7x 4.8x 4.6x 2.2x 1.7x $2.50 28% National Energy Services Reunited NESR OP Payne US$1,303.21 89.9 US$14.50 US$213.2 US$238.5 US$290.2 7.9x 6.9x 5.3x 1.5x 1.2x 0.6x US$17.50 21% Precision Drilling Corp. PD OP Payne 696.18$ 13.3 $52.29 285.2$ 258.4$ 310.3$ 6.7x 6.7x 4.8x 4.7x 3.8x 2.6x $55.00 5% Trican Well Services TCW SP Payne 688.66$ 258.9 $2.66 30.6$ 69.1$ 91.0$ 21.9x 9.3x 6.1x 1.3x -0.3x -0.8x $3.25 22%
* Rating System: OP = Outperform; SP = Sector Perform; UP = Underperform; T = Tender; UR = Under Review; R = Restricted
Source: Company Reports, NBF, Refinitiv
EBITDA (mm) 12-Mth Price

59VISION JULY/AUGUST 2021 |Back to Research Analysts pagePipelines, Utilities & Energy Infrastructure
OverviewThrough 2021 little has changed with regard to the market’s insatiable appetite for decarbonization, with a significant macro tailwind likely to remain in effect over the near term, as our coverage seeks to deploy an eye-popping ~$120 billion of free cash flow (net of dividends) through 2030 towards realigning long-term business plans with sustainable energy policies - while driving per share growth and valuation expansion. We note that the S&P TSX was up ~2% in June, while our Midstream benchmark was up ~4% and our NBF Utilities were up ~3%.
Commodities UpdateWith easing COVID-19 concerns and a favourable fundamental backdrop, commodity prices continued to climb, with WTI averaging ~US$71/bbl, ~9% higher than May levels of ~US$65/bbl, and now over 75% above the 2020 average price of ~US$40/bbl. Meanwhile, we note prices continue to trend higher, with WTI currently holding at ~US$72/bbl. On the gas front, AECO prices also moved higher, averaging $3.39/mcf, up ~10% from the May average of $3.08/mcf. Looking at Marketing prospects, the WCS heavy differential has begun to show signs of slack, averaging ~US$14/bbl, slightly wider than the May average of ~US$13.50/bbl, albeit modest volatility still suggests challenged conditions for crude oil marketing results.
Pipelines UpdateConstruction on the U.S. portion of the Line 3 Replacement project remains on track for a Q4/21 in-service date, with the Wisconsin and North Dakota sections in place, and the Minnesota section at 60%+ complete. Keeping the project on track, the Minnesota Court of Appeals announced a positive decision, citing substantial evidence supporting the Minnesota Public Utilities Commission’s issuance of a certificate of need, and also reaffirmed that the route was appropriately selected based upon respect for tribal sovereignty, while minimizing environmental impacts. On the Line 5 front, a federal judge recently appointed a mediator to advance discussions between the State of Michigan and Enbridge, which began on April 16th, to resolve the dispute outside of the courts. On a positive note, a multi-party Canadian House of Commons Special Committee released a report affirming the economic
importance of Line 5 to both Canada and the United States, while recommending urgent, bi-national executive action to resolve the dispute between the State of Michigan and Enbridge. Recall, Line 5 represents ~$500 million of annual EBITDA (~5% of AFFO), which we value at ~$3/sh within our target.
Meanwhile, in the Midstream space, Inter Pipeline has agreed to an all-stock transaction pursuant to which Pembina will acquire all issued and outstanding common shares of Inter Pipeline at an exchange ratio of 0.5 common shares of PPL for each outstanding IPL share, reflecting an offer currently valued at ~$19.50/sh. Brookfield Infrastructure Partners L.P. (BIP:NYSE; Outperform; US$60 Target Price; Analyst: Merer) has also submitted a revised offer to acquire IPL which includes the option for 100% cash consideration of $19.50/sh and/or 0.225 of a Brookfield Infrastructure Corp Class A exchangeable share up to a maximum of 23 mln aggregate BIPC common shares (26% of total offer), with access to an incremental 8 million BIPC shares for IPL shareholders electing to receive 100% of the consideration in BIPC shares on a tax-deferred basis. Further, Brookfield also mentioned that they have already received all regulatory and anti-trust approvals, implying that IPL shareholders could receive their consideration within three business days following the July 13th expiry date for the offer.
Following the merger agreement between IPL and PPL, Pembina released a business update outlining an ocean of future growth opportunities while announcing the reactivation of their Peace Pipeline Phase IX expansion project to accommodate increased activity in the NEBC Montney play, supporting long-term demand for intra-basin transportation. Pembina also announced that it has partnered with the Haisla Nation in the development of the proposed Cedar LNG Project, a $3.0 bln, ~0.4 bcf/d floating LNG facility to be located in Kitimat, B.C., on Haisla Nation-owned land in the Douglas Channel. Per the agreement, PPL will acquire a 50% equity interest in Cedar LNG and assume operatorship of the project moving forward. Elsewhere, we note PPL was chosen by the Western Indigenous Pipeline Group to be the industry partner in the formation of the Chinook Pathways Partnership, an Indigenous-lead partnership working towards obtaining ownership of the Trans Mountain Pipeline following the completion of the Trans Mountain Expansion.
Patrick Kenny, cfa Analyst 403-290-5451 —Associates:William Duforest: 403-441-0952Zach Warnock: 403-355-6643
Sector Analysis
Selections› AltaGas› Capital Power › Keyera
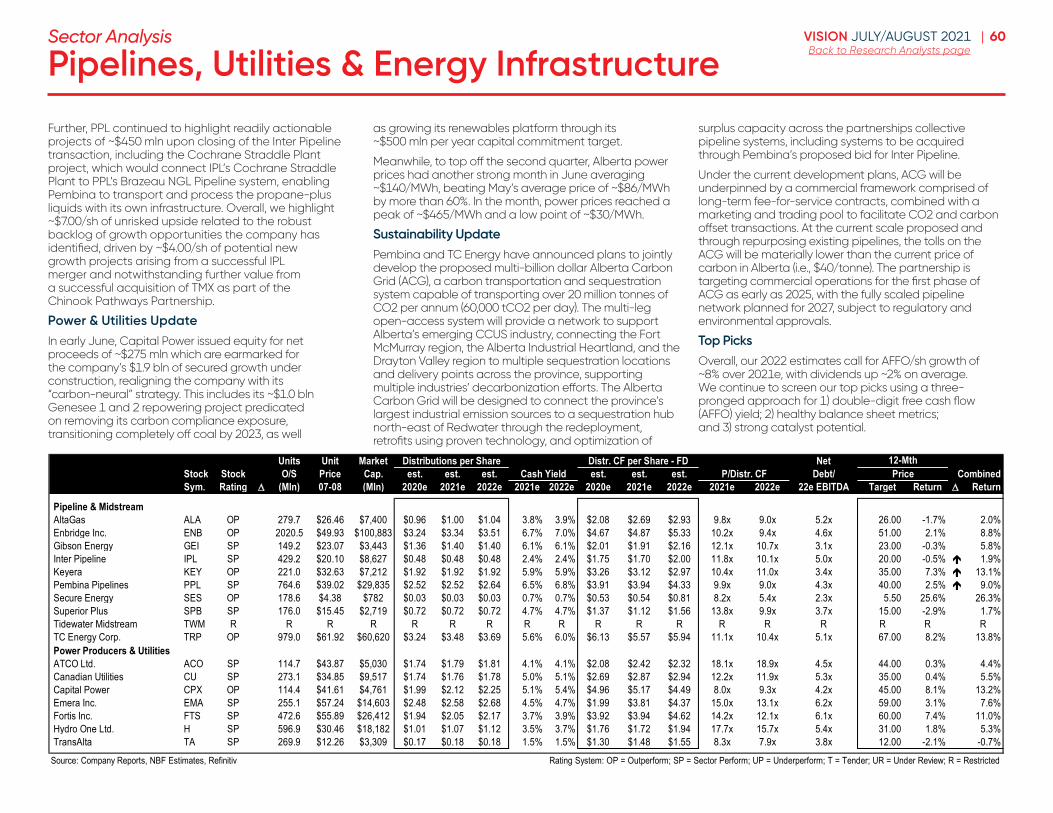
60VISION JULY/AUGUST 2021 |Back to Research Analysts pagePipelines, Utilities & Energy Infrastructure
Sector Analysis
Further, PPL continued to highlight readily actionable projects of ~$450 mln upon closing of the Inter Pipeline transaction, including the Cochrane Straddle Plant project, which would connect IPL’s Cochrane Straddle Plant to PPL’s Brazeau NGL Pipeline system, enabling Pembina to transport and process the propane-plus liquids with its own infrastructure. Overall, we highlight ~$7.00/sh of unrisked upside related to the robust backlog of growth opportunities the company has identified, driven by ~$4.00/sh of potential new growth projects arising from a successful IPL merger and notwithstanding further value from a successful acquisition of TMX as part of the Chinook Pathways Partnership.
Power & Utilities UpdateIn early June, Capital Power issued equity for net proceeds of ~$275 mln which are earmarked for the company’s $1.9 bln of secured growth under construction, realigning the company with its “carbon-neural” strategy. This includes its ~$1.0 bln Genesee 1 and 2 repowering project predicated on removing its carbon compliance exposure, transitioning completely off coal by 2023, as well
as growing its renewables platform through its ~$500 mln per year capital commitment target.
Meanwhile, to top off the second quarter, Alberta power prices had another strong month in June averaging ~$140/MWh, beating May’s average price of ~$86/MWh by more than 60%. In the month, power prices reached a peak of ~$465/MWh and a low point of ~$30/MWh.
Sustainability UpdatePembina and TC Energy have announced plans to jointly develop the proposed multi-billion dollar Alberta Carbon Grid (ACG), a carbon transportation and sequestration system capable of transporting over 20 million tonnes of CO2 per annum (60,000 tCO2 per day). The multi-leg open-access system will provide a network to support Alberta’s emerging CCUS industry, connecting the Fort McMurray region, the Alberta Industrial Heartland, and the Drayton Valley region to multiple sequestration locations and delivery points across the province, supporting multiple industries’ decarbonization efforts. The Alberta Carbon Grid will be designed to connect the province’s largest industrial emission sources to a sequestration hub north-east of Redwater through the redeployment, retrofits using proven technology, and optimization of
surplus capacity across the partnerships collective pipeline systems, including systems to be acquired through Pembina’s proposed bid for Inter Pipeline.
Under the current development plans, ACG will be underpinned by a commercial framework comprised of long-term fee-for-service contracts, combined with a marketing and trading pool to facilitate CO2 and carbon offset transactions. At the current scale proposed and through repurposing existing pipelines, the tolls on the ACG will be materially lower than the current price of carbon in Alberta (i.e., $40/tonne). The partnership is targeting commercial operations for the first phase of ACG as early as 2025, with the fully scaled pipeline network planned for 2027, subject to regulatory and environmental approvals.
Top PicksOverall, our 2022 estimates call for AFFO/sh growth of ~8% over 2021e, with dividends up ~2% on average. We continue to screen our top picks using a three-pronged approach for 1) double-digit free cash flow (AFFO) yield; 2) healthy balance sheet metrics; and 3) strong catalyst potential.
Units Unit Market NetStock Stock O/S Price Cap. est. est. est. est. est. est. Debt/ Price CombinedSym. Rating (Mln) 07-08 (Mln) 2020e 2021e 2022e 2021e 2022e 2020e 2021e 2022e 2021e 2022e 22e EBITDA Target Return Return
Pipeline & MidstreamAltaGas ALA OP 279.7 $26.46 $7,400 $0.96 $1.00 $1.04 3.8% 3.9% $2.08 $2.69 $2.93 9.8x 9.0x 5.2x 26.00 -1.7% 2.0%Enbridge Inc. ENB OP 2020.5 $49.93 $100,883 $3.24 $3.34 $3.51 6.7% 7.0% $4.67 $4.87 $5.33 10.2x 9.4x 4.6x 51.00 2.1% 8.8%Gibson Energy GEI SP 149.2 $23.07 $3,443 $1.36 $1.40 $1.40 6.1% 6.1% $2.01 $1.91 $2.16 12.1x 10.7x 3.1x 23.00 -0.3% 5.8%Inter Pipeline IPL SP 429.2 $20.10 $8,627 $0.48 $0.48 $0.48 2.4% 2.4% $1.75 $1.70 $2.00 11.8x 10.1x 5.0x 20.00 -0.5% 1.9%Keyera KEY OP 221.0 $32.63 $7,212 $1.92 $1.92 $1.92 5.9% 5.9% $3.26 $3.12 $2.97 10.4x 11.0x 3.4x 35.00 7.3% 13.1%Pembina Pipelines PPL SP 764.6 $39.02 $29,835 $2.52 $2.52 $2.64 6.5% 6.8% $3.91 $3.94 $4.33 9.9x 9.0x 4.3x 40.00 2.5% 9.0%Secure Energy SES OP 178.6 $4.38 $782 $0.03 $0.03 $0.03 0.7% 0.7% $0.53 $0.54 $0.81 8.2x 5.4x 2.3x 5.50 25.6% 26.3%Superior Plus SPB SP 176.0 $15.45 $2,719 $0.72 $0.72 $0.72 4.7% 4.7% $1.37 $1.12 $1.56 13.8x 9.9x 3.7x 15.00 -2.9% 1.7%Tidewater Midstream TWM R R R R R R R R R R R R R R R R R RTC Energy Corp. TRP OP 979.0 $61.92 $60,620 $3.24 $3.48 $3.69 5.6% 6.0% $6.13 $5.57 $5.94 11.1x 10.4x 5.1x 67.00 8.2% 13.8%Veresen Inc. VSN #N/A #N/A #N/A #N/A #N/A #N/A #N/A #N/A #N/A #N/A #N/A #N/A #N/A 12.7x #N/A #N/A #N/A #N/APower Producers & UtilitiesATCO Ltd. ACO SP 114.7 $43.87 $5,030 $1.74 $1.79 $1.81 4.1% 4.1% $2.08 $2.42 $2.32 18.1x 18.9x 4.5x 44.00 0.3% 4.4%Canadian Utilities CU SP 273.1 $34.85 $9,517 $1.74 $1.76 $1.78 5.0% 5.1% $2.69 $2.87 $2.94 12.2x 11.9x 5.3x 35.00 0.4% 5.5%Capital Power CPX OP 114.4 $41.61 $4,761 $1.99 $2.12 $2.25 5.1% 5.4% $4.96 $5.17 $4.49 8.0x 9.3x 4.2x 45.00 8.1% 13.2%Emera Inc. EMA SP 255.1 $57.24 $14,603 $2.48 $2.58 $2.68 4.5% 4.7% $1.99 $3.81 $4.37 15.0x 13.1x 6.2x 59.00 3.1% 7.6%Fortis Inc. FTS SP 472.6 $55.89 $26,412 $1.94 $2.05 $2.17 3.7% 3.9% $3.92 $3.94 $4.62 14.2x 12.1x 6.1x 60.00 7.4% 11.0%Hydro One Ltd. H SP 596.9 $30.46 $18,182 $1.01 $1.07 $1.12 3.5% 3.7% $1.76 $1.72 $1.94 17.7x 15.7x 5.4x 31.00 1.8% 5.3%TransAlta TA SP 269.9 $12.26 $3,309 $0.17 $0.18 $0.18 1.5% 1.5% $1.30 $1.48 $1.55 8.3x 7.9x 3.8x 12.00 -2.1% -0.7%
Source: Company Reports, NBF Estimates, Refinitiv Rating System: OP = Outperform; SP = Sector Perform; UP = Underperform; T = Tender; UR = Under Review; R = Restricted
12-MthDistributions per Share Distr. CF per Share - FDCash Yield P/Distr. CF

61VISION JULY/AUGUST 2021 |Back to Research Analysts pageReal Estate
Industrial Real Estate – Looking South for Comfort on TSX-Listed Industrial Valuations Industrial REITs in Canada have been the beneficiary of significant multiple expansion but an analysis of comparable U .S . names provides some comfort on valuation . Despite the strong performance of late, TSX-listed industrial REITs trade at a discount to their NYSE-listed peers. We looked at reasons for this gap with the conclusion that further multiple expansion is possible when it comes to Canadian names and could be compounded by an acceleration in earnings growth.
Leverage levels are higher here but this alone doesn’t warrant the valuation gap . Canadian debt ratios exceed those of the U.S. peers by a meaningful amount when looking at net debt / EV, which is an apples-to-apples approach to measuring leverage in light of different accounting methodologies for the book value of assets. That said, arithmetically adjusting for leverage levels while accounting for varied costs of capital doesn’t materially compress the trading gap.
Scale, structure and earnings growth favours U .S . peers . The most compelling arguments for divergent multiples would be the relative size, payout ratio levels and a history of generating higher FFO/unit growth. That said, this is in part related to the progression point in these entities’ life cycles, with TSX-listed names tending to be younger and still growth-focused. They are approaching an inflection point where the existing portfolio is likely to be a greater earnings driver. That said, further expansion will be limited by plummeting private market cap rates.
Canadian market fundamentals are improving combined with an institutionalization of ownership and a greater focus on pushing rents . TSX-listed industrial REITs have seen rent spreads converge with their U.S. peers, particularly for core markets. Meanwhile, supportive market fundamentals point to an extended period of growth with Toronto and Montreal having two of the lowest availability rates for industrial properties in North America.
Summit Industrial: A comparison with U.S. REITs is constructive for Summit given its core portfolio of properties in Toronto and Montreal, which compare favourably on fundamentals and rent growth with Rexford and Terreno’s geographic exposure. These names trade at almost 40x NTM FFO. We expect a ramping up in SMU’s earnings growth as leasing activity helps realize MTM related gains combined with a shift in focus from external growth to higher-yielding development opportunities.
Dream Industrial: While DIR trades at a discount and similarly has concentrations of assets in the GTA and Montreal, its global footprint and smaller size muddies the comparison. That’s not to say we don’t think there is upside to current trading multiples.
Granite: Granite’s geographic footprint presents similar issues to that of DIR, and its Magna / special purpose property ownership complicates things further; however, the REIT looks a lot more like U.S. peers with regard to the scale of the portfolio and structural attributes but trades at cheapest leverage adjusted multiple as far as TSX-listed industrial REITs are concerned.
WPT Industrial: Comparing WPT to U.S. industrial REITs is instructive given that it owns a portfolio exclusively in the U.S. Furthermore, on a leverage adjusted basis it trades at a discount to all but STAG industrial while owning a hybrid portfolio of core and secondary market assets (and access to a strong development pipeline). While on a relative multiple basis the valuation gap isn’t massive, the peer set is at least supportive of current trading levels.
Sector Analysis
Matt Kornack Analyst 416-507-8104 —Associates: Hussam Maqbool: 416-507-8108 Ahmed Shethwala: 416-507-8102
Tal Woolley Analyst 416-507-8009
Selections› ERES› Boardwalk› CAP REIT› Killam› Dream Industrial› Flagship› H&R› BSR› Summit Industrial› Chartwell
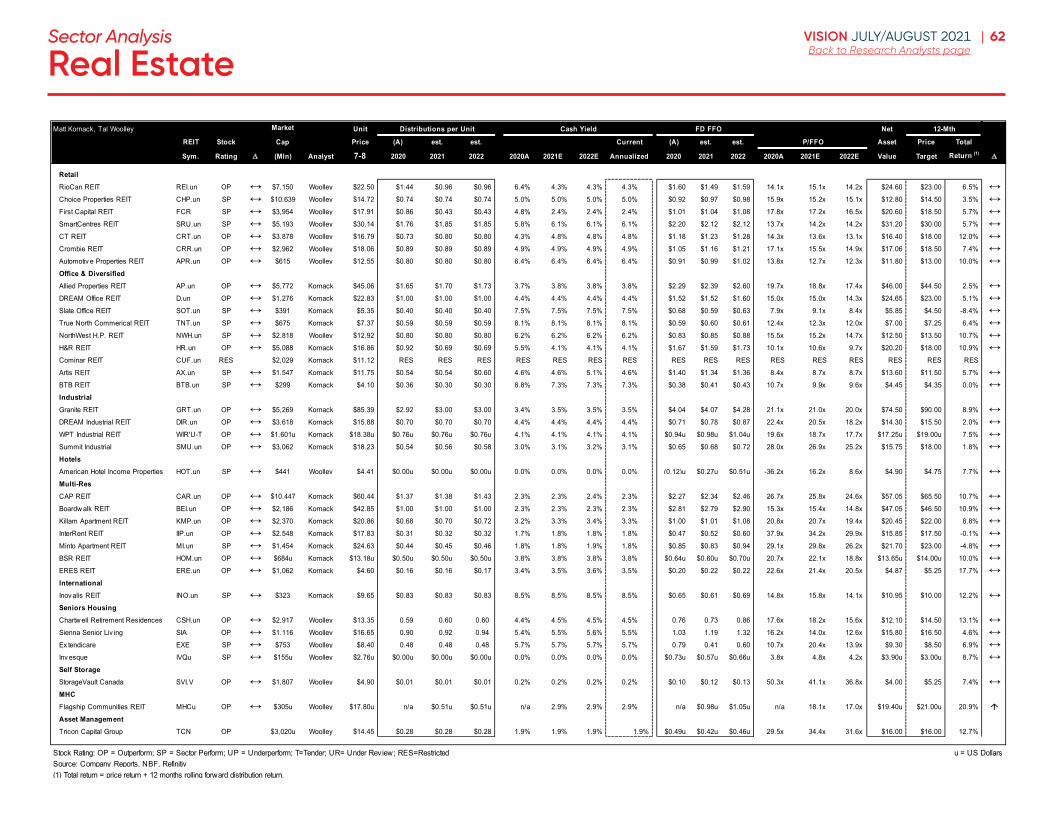
62VISION JULY/AUGUST 2021 |Back to Research Analysts pageReal Estate
Sector Analysis
Market Unit FD FFO Net
REIT Stock Cap Price (A) est. est. Current (A) est. est. P/FFO Asset Total
Sym. Rating (Mln) Analyst 7-8 2020 2021 2022 2020A 2021E 2022E Annualized 2020 2021 2022 2020A 2021E 2022E Value Target Return (1)
RetailRioCan REIT REI.un OP ↔ $7,150 Woolley $22.50 $1.44 $0.96 $0.96 6.4% 4.3% 4.3% 4.3% $1.60 $1.49 $1.59 14.1x 15.1x 14.2x $24.60 $23.00 6.5% ↔Choice Properties REIT CHP.un SP ↔ $10,639 Woolley $14.72 $0.74 $0.74 $0.74 5.0% 5.0% 5.0% 5.0% $0.92 $0.97 $0.98 15.9x 15.2x 15.1x $12.80 $14.50 3.5% ↔First Capital REIT FCR SP ↔ $3,954 Woolley $17.91 $0.86 $0.43 $0.43 4.8% 2.4% 2.4% 2.4% $1.01 $1.04 $1.08 17.8x 17.2x 16.5x $20.60 $18.50 5.7% ↔SmartCentres REIT SRU.un SP ↔ $5,193 Woolley $30.14 $1.76 $1.85 $1.85 5.8% 6.1% 6.1% 6.1% $2.20 $2.12 $2.12 13.7x 14.2x 14.2x $31.20 $30.00 5.7% ↔CT REIT CRT.un OP ↔ $3,878 Woolley $16.79 $0.73 $0.80 $0.80 4.3% 4.8% 4.8% 4.8% $1.18 $1.23 $1.28 14.3x 13.6x 13.1x $16.40 $18.00 12.0% ↔Crombie REIT CRR.un OP ↔ $2,962 Woolley $18.06 $0.89 $0.89 $0.89 4.9% 4.9% 4.9% 4.9% $1.05 $1.16 $1.21 17.1x 15.5x 14.9x $17.06 $18.50 7.4% ↔Automotiv e Properties REIT APR.un OP ↔ $615 Woolley $12.55 $0.80 $0.80 $0.80 6.4% 6.4% 6.4% 6.4% $0.91 $0.99 $1.02 13.8x 12.7x 12.3x $11.80 $13.00 10.0% ↔Office & DiversifiedAllied Properties REIT AP.un OP ↔ $5,772 Kornack $45.06 $1.65 $1.70 $1.73 3.7% 3.8% 3.8% 3.8% $2.29 $2.39 $2.60 19.7x 18.8x 17.4x $46.00 $44.50 2.5% ↔DREAM Office REIT D.un OP ↔ $1,276 Kornack $22.83 $1.00 $1.00 $1.00 4.4% 4.4% 4.4% 4.4% $1.52 $1.52 $1.60 15.0x 15.0x 14.3x $24.65 $23.00 5.1% ↔Slate Office REIT SOT.un SP ↔ $391 Kornack $5.35 $0.40 $0.40 $0.40 7.5% 7.5% 7.5% 7.5% $0.68 $0.59 $0.63 7.9x 9.1x 8.4x $5.85 $4.50 -8.4% ↔True North Commerical REIT TNT.un SP ↔ $675 Kornack $7.37 $0.59 $0.59 $0.59 8.1% 8.1% 8.1% 8.1% $0.59 $0.60 $0.61 12.4x 12.3x 12.0x $7.00 $7.25 6.4% ↔NorthWest H.P. REIT NWH.un SP ↔ $2,818 Woolley $12.92 $0.80 $0.80 $0.80 6.2% 6.2% 6.2% 6.2% $0.83 $0.85 $0.88 15.5x 15.2x 14.7x $12.50 $13.50 10.7% ↔H&R REIT HR.un OP ↔ $5,088 Kornack $16.86 $0.92 $0.69 $0.69 5.5% 4.1% 4.1% 4.1% $1.67 $1.59 $1.73 10.1x 10.6x 9.7x $20.20 $18.00 10.9% ↔Cominar REIT CUF.un RES $2,029 Kornack $11.12 RES RES RES RES RES RES RES RES RES RES RES RES RES RES RES RESArtis REIT AX.un SP ↔ $1,547 Kornack $11.75 $0.54 $0.54 $0.60 4.6% 4.6% 5.1% 4.6% $1.40 $1.34 $1.36 8.4x 8.7x 8.7x $13.60 $11.50 5.7% ↔BTB REIT BTB.un SP ↔ $299 Kornack $4.10 $0.36 $0.30 $0.30 8.8% 7.3% 7.3% 7.3% $0.38 $0.41 $0.43 10.7x 9.9x 9.6x $4.45 $4.35 0.0% ↔IndustrialGranite REIT GRT.un OP ↔ $5,269 Kornack $85.39 $2.92 $3.00 $3.00 3.4% 3.5% 3.5% 3.5% $4.04 $4.07 $4.28 21.1x 21.0x 20.0x $74.50 $90.00 8.9% ↔DREAM Industrial REIT DIR.un OP ↔ $3,618 Kornack $15.88 $0.70 $0.70 $0.70 4.4% 4.4% 4.4% 4.4% $0.71 $0.78 $0.87 22.4x 20.5x 18.2x $14.30 $15.50 2.0% ↔WPT Industrial REIT WIR'U-T OP ↔ $1,601u Kornack $18.38u $0.76u $0.76u $0.76u 4.1% 4.1% 4.1% 4.1% $0.94u $0.98u $1.04u 19.6x 18.7x 17.7x $17.25u $19.00u 7.5% ↔Summit Industrial SMU.un OP ↔ $3,062 Kornack $18.23 $0.54 $0.56 $0.58 3.0% 3.1% 3.2% 3.1% $0.65 $0.68 $0.72 28.0x 26.9x 25.2x $15.75 $18.00 1.8% ↔HotelsAmerican Hotel Income Properties HOT.un SP ↔ $441 Woolley $4.41 $0.00u $0.00u $0.00u 0.0% 0.0% 0.0% 0.0% (0.12)u $0.27u $0.51u -36.2x 16.2x 8.6x $4.90 $4.75 7.7% ↔Multi-ResCAP REIT CAR.un OP ↔ $10,447 Kornack $60.44 $1.37 $1.38 $1.43 2.3% 2.3% 2.4% 2.3% $2.27 $2.34 $2.46 26.7x 25.8x 24.6x $57.05 $65.50 10.7% ↔Boardw alk REIT BEI.un OP ↔ $2,186 Kornack $42.85 $1.00 $1.00 $1.00 2.3% 2.3% 2.3% 2.3% $2.81 $2.79 $2.90 15.3x 15.4x 14.8x $47.05 $46.50 10.9% ↔Killam Apartment REIT KMP.un OP ↔ $2,370 Kornack $20.86 $0.68 $0.70 $0.72 3.2% 3.3% 3.4% 3.3% $1.00 $1.01 $1.08 20.8x 20.7x 19.4x $20.45 $22.00 8.8% ↔InterRent REIT IIP.un OP ↔ $2,548 Kornack $17.83 $0.31 $0.32 $0.32 1.7% 1.8% 1.8% 1.8% $0.47 $0.52 $0.60 37.9x 34.2x 29.9x $15.85 $17.50 -0.1% ↔Minto Apartment REIT MI.un SP ↔ $1,454 Kornack $24.63 $0.44 $0.45 $0.46 1.8% 1.8% 1.9% 1.8% $0.85 $0.83 $0.94 29.1x 29.8x 26.2x $21.70 $23.00 -4.8% ↔BSR REIT HOM.un OP ↔ $684u Kornack $13.18u $0.50u $0.50u $0.50u 3.8% 3.8% 3.8% 3.8% $0.64u $0.60u $0.70u 20.7x 22.1x 18.8x $13.65u $14.00u 10.0% ↔ERES REIT ERE.un OP ↔ $1,062 Kornack $4.60 $0.16 $0.16 $0.17 3.4% 3.5% 3.6% 3.5% $0.20 $0.22 $0.22 22.6x 21.4x 20.5x $4.87 $5.25 17.7% ↔InternationalInov alis REIT INO.un SP ↔ $323 Kornack $9.65 $0.83 $0.83 $0.83 8.5% 8.5% 8.5% 8.5% $0.65 $0.61 $0.69 14.8x 15.8x 14.1x $10.95 $10.00 12.2% ↔Seniors Housing Chartw ell Retirement Residences CSH.un OP ↔ $2,917 Woolley $13.35 0.59 0.60 0.60 4.4% 4.5% 4.5% 4.5% 0.76 0.73 0.86 17.6x 18.2x 15.6x $12.10 $14.50 13.1% ↔Sienna Senior Liv ing SIA OP ↔ $1,116 Woolley $16.65 0.90 0.92 0.94 5.4% 5.5% 5.6% 5.5% 1.03 1.19 1.32 16.2x 14.0x 12.6x $15.80 $16.50 4.6% ↔Ex tendicare EXE SP ↔ $753 Woolley $8.40 0.48 0.48 0.48 5.7% 5.7% 5.7% 5.7% 0.79 0.41 0.60 10.7x 20.4x 13.9x $9.30 $8.50 6.9% ↔Inv esque IVQu SP ↔ $155u Woolley $2.76u $0.00u $0.00u $0.00u 0.0% 0.0% 0.0% 0.0% $0.73u $0.57u $0.66u 3.8x 4.8x 4.2x $3.90u $3.00u 8.7% ↔Self StorageStorageVault Canada SVI.V OP ↔ $1,807 Woolley $4.90 $0.01 $0.01 $0.01 0.2% 0.2% 0.2% 0.2% $0.10 $0.12 $0.13 50.3x 41.1x 36.8x $4.00 $5.25 7.4% ↔MHCFlagship Communities REIT MHCu OP ↔ $305u Woolley $17.80u n/a $0.51u $0.51u n/a 2.9% 2.9% 2.9% n/a $0.98u $1.05u n/a 18.1x 17.0x $19.40u $21.00u 20.9%
Asset ManagementTricon Capital Group TCN OP $3,020u Woolley $14.45 $0.28 $0.28 $0.28 1.9% 1.9% 1.9% 1.9% $0.49u $0.42u $0.46u 29.5x 34.4x 31.6x $16.00 $16.00 12.7%
Stock Rating: OP = Outperform; SP = Sector Perform; UP = Underperform; T=Tender; UR= Under Review; RES=Restricted u = US DollarsSource: Company Reports, NBF, Refinitiv(1) Total return = price return + 12 months rolling forward distribution return.
12-Mth
Price
Cash YieldMatt Kornack, Tal Woolley Distributions per Unit
63VISION JULY/AUGUST 2021 |Back to Research Analysts pageSpecial Situations
Zachary Evershed, cfa Analyst 514-412-0021—Associate: Thomas Bolland: 514-871-5013
Sector Analysis
Selections› DBM› DXT› HDI
Accretively deploying capital through M&A (TSX: DBM, HDI)
Following an eventful month of June within our coverage universe, we highlight the latest acquisitions from Hardwoods Distribution and Doman Building Materials.
Tripling U .S . sales via Hixson – Doman Building Materials (formerly CanWel) On June 4, 2021, Doman Building Materials announced the acquisition of Texas-based Hixson Lumber Sales for ~US$375 million in cash, including inventory, funded from DBM’s cash on hand and revolving credit facility. We estimate that in the current pricing environment, Hixson adds ~$1 billion in revenue, and runs at higher margins than DBM. Hixson is a manufacturer and wholesaler of lumber and treated lumber currently servicing 25 states with its 19 lumber treating plants, five specialty sawmills and captive trucking fleet. We believe the acquisition is highly complementary to DBM’s existing U.S. footprint as the acquired facilities share no overlap with DBM’s existing presence in Hawaii, California and Oregon, though the two share both major suppliers and customers. The combined size of DBM and Hixson will allow for synergy realization primarily on the treating chemical procurement front. Following the transaction, we calculate Net Debt/EBITDA of 3.6x, rapidly falling to 2.1x by year end as working capital unwinds seasonally, and believe DBM may execute on opportunistic tuck-ins whilst integrating Hixson. Our $13.50 target is based on 14.5x 2022e EPS, and we rate DBM Outperform.
Entering new markets via Novo – Hardwoods DistributionOn June 23, HDI announced it had entered into an agreement to acquire Novo
Building Products for US$303 million. Novo is a leading distributor of architectural grade building products to home centers and home builder distribution yards in the U.S., Canada and Mexico; the big box store and pro dealer markets are new to HDI. The company’s product portfolio includes moulding and millwork, stair systems, decorative boards, as well as doors, which are complementary to HDI’s existing offering. Novo operates out of 14 facilities, primarily in the Eastern and Midwestern U.S., Florida and Texas, and is anticipated to generate ~$640 million in sales and ~$55 million in EBITDA in 2021, representing an EBITDA acquisition multiple of ~6.2x pre-synergies. Supporting the acquisition, HDI announced an agreement for a new US$525 million credit facility, replacing its existing facilities. The agreement includes a revolving credit facility of $225 million, which can be drawn in US$ or Cdn$, and two separate term loans of up to US$225 and US$75 million. As we calculate pro forma leverage of 2.9x (pre-IFRS 16) at year end, just over management’s comfort zone, we believe HDI is likely to focus on Novo’s integration before conducting further meaningful M&A, though opportunistic tuck-ins likely remain in play as we calculate HDI will retain ~$90 million in dry powder post-acquisition. Our Cdn$57 target is based on 16x 2022e EPS, and we rate HDI Outperform.
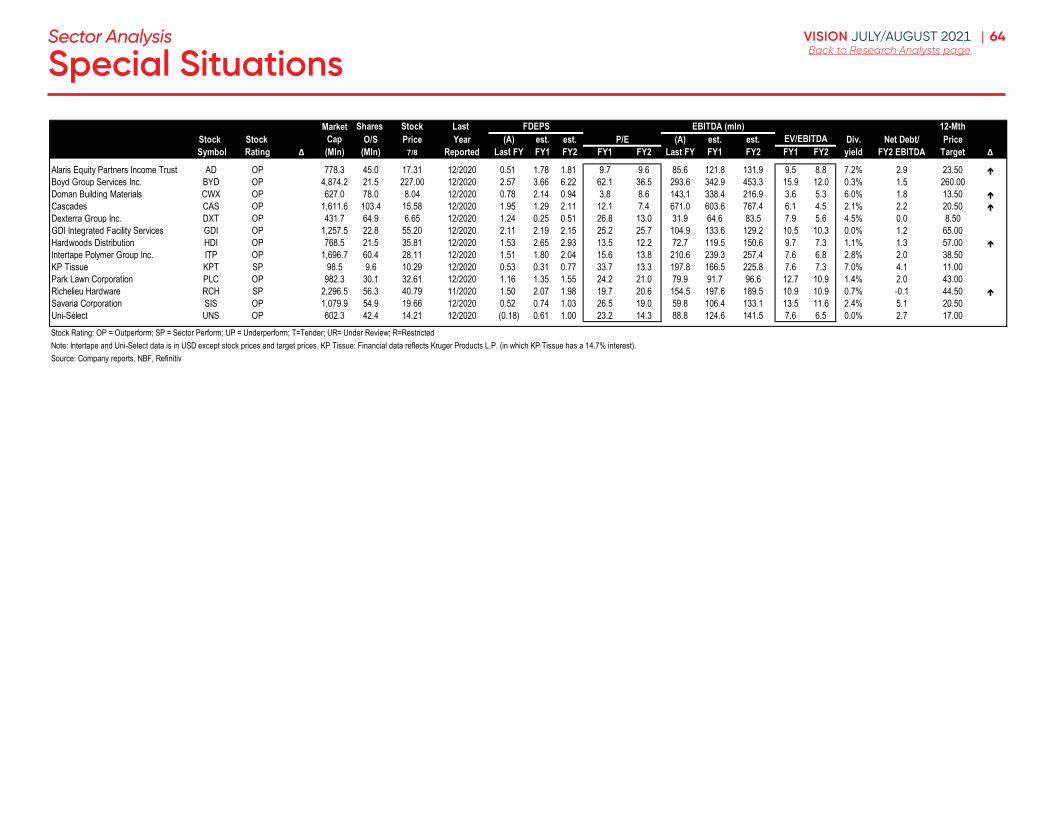
64VISION JULY/AUGUST 2021 |Back to Research Analysts pageSpecial Situations
Sector Analysis
Market Shares Stock Last 12-MthStock Stock Cap O/S Price Year (A) est. est. P/E (A) est. est. Div. Net Debt/ Price
Symbol Rating ∆ (Mln) (Mln) 7/8 Reported Last FY FY1 FY2 FY1 FY2 Last FY FY1 FY2 FY1 FY2 yield FY2 EBITDA Target ∆
Alaris Equity Partners Income Trust AD OP 778.3 45.0 17.31 12/2020 0.51 1.78 1.81 9.7 9.6 85.6 121.8 131.9 9.5 8.8 7.2% 2.9 23.50
Boyd Group Services Inc. BYD OP 4,874.2 21.5 227.00 12/2020 2.57 3.66 6.22 62.1 36.5 293.6 342.9 453.3 15.9 12.0 0.3% 1.5 260.00Doman Building Materials CWX OP 627.0 78.0 8.04 12/2020 0.78 2.14 0.94 3.8 8.6 143.1 338.4 216.9 3.6 5.3 6.0% 1.8 13.50
Cascades CAS OP 1,611.6 103.4 15.58 12/2020 1.95 1.29 2.11 12.1 7.4 671.0 603.6 767.4 6.1 4.5 2.1% 2.2 20.50
Dexterra Group Inc. DXT OP 431.7 64.9 6.65 12/2020 1.24 0.25 0.51 26.8 13.0 31.9 64.6 83.5 7.9 5.6 4.5% 0.0 8.50GDI Integrated Facility Services GDI OP 1,257.5 22.8 55.20 12/2020 2.11 2.19 2.15 25.2 25.7 104.9 133.6 129.2 10.5 10.3 0.0% 1.2 65.00Hardwoods Distribution HDI OP 768.5 21.5 35.81 12/2020 1.53 2.65 2.93 13.5 12.2 72.7 119.5 150.6 9.7 7.3 1.1% 1.3 57.00
Intertape Polymer Group Inc. ITP OP 1,696.7 60.4 28.11 12/2020 1.51 1.80 2.04 15.6 13.8 210.6 239.3 257.4 7.6 6.8 2.8% 2.0 38.50KP Tissue KPT SP 98.5 9.6 10.29 12/2020 0.53 0.31 0.77 33.7 13.3 197.8 166.5 225.8 7.6 7.3 7.0% 4.1 11.00Park Lawn Corporation PLC OP 982.3 30.1 32.61 12/2020 1.16 1.35 1.55 24.2 21.0 79.9 91.7 96.6 12.7 10.9 1.4% 2.0 43.00Richelieu Hardware RCH SP 2,296.5 56.3 40.79 11/2020 1.50 2.07 1.98 19.7 20.6 154.5 197.6 189.5 10.9 10.9 0.7% -0.1 44.50
Savaria Corporation SIS OP 1,079.9 54.9 19.66 12/2020 0.52 0.74 1.03 26.5 19.0 59.8 106.4 133.1 13.5 11.6 2.4% 5.1 20.50Uni-Sélect UNS OP 602.3 42.4 14.21 12/2020 (0.18) 0.61 1.00 23.2 14.3 88.8 124.6 141.5 7.6 6.5 0.0% 2.7 17.00Stock Rating: OP = Outperform; SP = Sector Perform; UP = Underperform; T=Tender; UR= Under Review; R=RestrictedNote: Intertape and Uni-Select data is in USD except stock prices and target prices. KP Tissue: Financial data reflects Kruger Products L.P. (in which KP Tissue has a 14.7% interest). Source: Company reports, NBF, Refinitiv
EV/EBITDAEBITDA (mln)FDEPS
65VISION JULY/AUGUST 2021 |Back to Research Analysts pageSustainability & Clean Tech
Company HighlightsOur renewable energy infrastructure coverage has performed relatively well over the past decade benefiting from accretive growth, supportive government policy, a low interest rate environment, and of late, a scarcity of green investments. It will be hard to replicate the performance of the past five years, but there are plenty of growth opportunities for companies in the sector. Inflation concerns have a direct impact on valuation recently and resulted in headwinds to some of the names under our coverage, but we believe the drop-in bond yields recently should help the stocks. Additionally, the renewable power sector should see increased interest in the back-half of this year with a focus on accelerating renewable production and a path to net-zero emissions, helped by the United Nations COP26 conference in November. Our top picks are BLX, NPI, and INE.
Northland Power Inc . (NPI: TSX; Outperform; $50.00 target):Northland Power is a global leader in the development of offshore wind and owns 2,266 MW (net) of operational capacity in renewable and thermal power generation, but that number could soon change as the company recently raised $990 million in equity (22.5 million shares at $44/sh), in part, to fund organic growth, but also to fund the acquisition of a 540 MW (net) portfolio of onshore wind and solar assets in Spain (acquisition expected to close in 3Q’21). NPI’s focus remains the offshore wind market, which offers large projects and high return potential. NPI intends to utilize $470 million from the proceeds towards development opportunities of 4 GW to 5 GW over the next decade, primarily in offshore wind projects, notably in Taiwan (1.8 GW of wind developments that could be bid in RFPs next year), Japan, South Korea, Poland and Germany. With its offshore wind platform, NPI is attracting large partners, like PKN Orlen in Poland and Tokyo Gas in Japan, which could help to boost returns. The first of its growth projects to be constructed should be the 1,044 MW Hai Long project in Taiwan (FID 2022E), possibly followed by the 1.2 GW Baltic project in Poland (FID 2023E and COD 2026E). For 2021, NPI expects adj. EBITDA of $1.1 billion to $1.2 billion (and FCF in the range of $1.30 to $1.50 /sh). Our target is based on a long-term DCF with a cost of equity of 4.75% on operating cash flows and $10/sh of growth.
Boralex Inc . (BLX: TSX; Outperform; $50.00 target):BLX is a renewable energy producer with wind, solar and hydro assets in the USA, France and Canada. It has ~2,455 MW of generating capacity, mostly under long-term contracts with an average contract life of ~13 years. In June, BLX unveiled its updated strategic plan for 2025 as well as a roadmap to 2030. The new plan focuses on growth, diversification, customers, and asset optimization while also further integrating its ESG strategy. BLX announced ambitious growth targets, aiming to invest $6 billion by 2025E to increase its capacity to 4.4 GW (from 2.2 GW in 2020), followed by further investment to reach 10 to 12 GW by 2030E. Most of its growth could come from the U.S. and new markets in Europe and would be focused largely on solar and battery storage projects. With this, we believe BLX could have the best visibility on growth within its peer group. BLX targets a CAGR for its normalized EBITDA and discretionary cash flow of 10%-12% and 14%-16%, respectively, by 2025E. In 2021, BLX acquired controlling interests in seven solar plants in the U.S. (weighted average PPA duration of 21.5 years) and signed a power purchase agreement for its 200 MW Apuiat wind farm in Québec. We believe it should see an increase in RFP activities in both Québec and N.Y. State and we think these developments could serve as a platform for future organic growth and provide BLX with room to realize operating synergies. BLX offers an interesting entry point as it looks to build the next leg of growth. Our target is based on a long-term DCF with a cost of equity of 4.5% on operating cash flows and $7/sh of growth.
Innergex Renewable Energy Inc . (INE: TSX; Outperform; $26.00 target):INE is one of Canada’s largest renewables focused IPPs with an operating capacity of 2,747 MW (net). INE’s production capacity is diversified across different renewable platforms (~29% hydro, ~58% wind and ~13% solar) and across geographies (~53% Canada, ~33% U.S., ~8% France and ~6% Chile). Some of INE’s latest developments have started bearing fruit, including the 6.9 MW Yonne II wind farm in France that reached full commissioning in Q1’21 and the 200 MW Hillcrest solar project in Ohio that reached COD earlier in May. INE’s 226 MW Griffin Trail wind project in Texas is
Rupert Merer, p. eng, cfa Analyst 416-869-8008—Associates: Louka Nadeau: 416-869-7538 Viveck Panjabi: 416-869-6763
Sector Analysis
Selections› Innergex Renewable Energy Inc. › Northland Power Inc. › Boralex
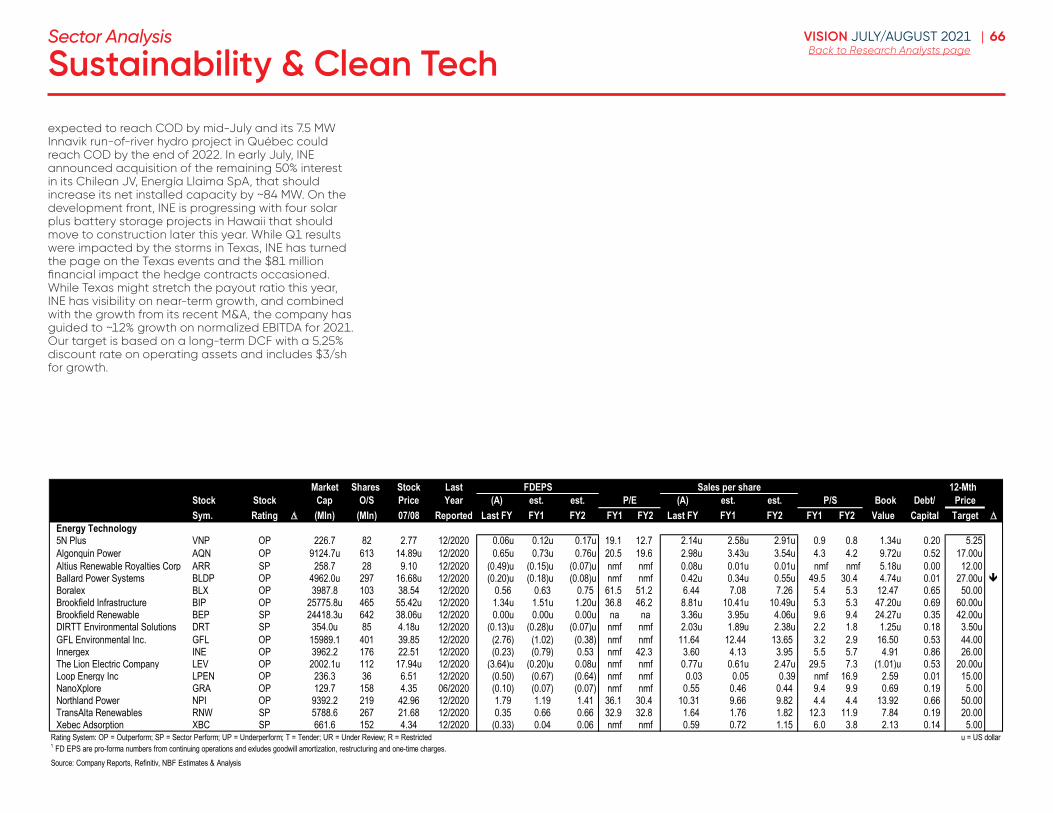
66VISION JULY/AUGUST 2021 |Back to Research Analysts pageSustainability & Clean Tech
Sector Analysis
expected to reach COD by mid-July and its 7.5 MW Innavik run-of-river hydro project in Québec could reach COD by the end of 2022. In early July, INE announced acquisition of the remaining 50% interest in its Chilean JV, Energía Llaima SpA, that should increase its net installed capacity by ~84 MW. On the development front, INE is progressing with four solar plus battery storage projects in Hawaii that should move to construction later this year. While Q1 results were impacted by the storms in Texas, INE has turned the page on the Texas events and the $81 million financial impact the hedge contracts occasioned. While Texas might stretch the payout ratio this year, INE has visibility on near-term growth, and combined with the growth from its recent M&A, the company has guided to ~12% growth on normalized EBITDA for 2021. Our target is based on a long-term DCF with a 5.25% discount rate on operating assets and includes $3/sh for growth.
Market Shares Stock LastStock Stock Cap O/S Price Year (A) est. est. (A) est. est. P/S Book Debt/ PriceSym. Rating (Mln) (Mln) 07/08 Reported Last FY FY1 FY2 FY1 FY2 Last FY FY1 FY2 FY1 FY2 Value Capital Target
Energy Technology5N Plus VNP OP 226.7 82 2.77 12/2020 0.06u 0.12u 0.17u 19.1 12.7 2.14u 2.58u 2.91u 0.9 0.8 1.34u 0.20 5.25Algonquin Power AQN OP 9124.7u 613 14.89u 12/2020 0.65u 0.73u 0.76u 20.5 19.6 2.98u 3.43u 3.54u 4.3 4.2 9.72u 0.52 17.00uAltius Renewable Royalties Corp ARR SP 258.7 28 9.10 12/2020 (0.49)u (0.15)u (0.07)u nmf nmf 0.08u 0.01u 0.01u nmf nmf 5.18u 0.00 12.00Ballard Power Systems BLDP OP 4962.0u 297 16.68u 12/2020 (0.20)u (0.18)u (0.08)u nmf nmf 0.42u 0.34u 0.55u 49.5 30.4 4.74u 0.01 27.00u Boralex BLX OP 3987.8 103 38.54 12/2020 0.56 0.63 0.75 61.5 51.2 6.44 7.08 7.26 5.4 5.3 12.47 0.65 50.00Brookfield Infrastructure BIP OP 25775.8u 465 55.42u 12/2020 1.34u 1.51u 1.20u 36.8 46.2 8.81u 10.41u 10.49u 5.3 5.3 47.20u 0.69 60.00uBrookfield Renewable BEP SP 24418.3u 642 38.06u 12/2020 0.00u 0.00u 0.00u na na 3.36u 3.95u 4.06u 9.6 9.4 24.27u 0.35 42.00uDIRTT Environmental Solutions DRT SP 354.0u 85 4.18u 12/2020 (0.13)u (0.28)u (0.07)u nmf nmf 2.03u 1.89u 2.38u 2.2 1.8 1.25u 0.18 3.50uGFL Environmental Inc. GFL OP 15989.1 401 39.85 12/2020 (2.76) (1.02) (0.38) nmf nmf 11.64 12.44 13.65 3.2 2.9 16.50 0.53 44.00Innergex INE OP 3962.2 176 22.51 12/2020 (0.23) (0.79) 0.53 nmf 42.3 3.60 4.13 3.95 5.5 5.7 4.91 0.86 26.00The Lion Electric Company LEV OP 2002.1u 112 17.94u 12/2020 (3.64)u (0.20)u 0.08u nmf nmf 0.77u 0.61u 2.47u 29.5 7.3 (1.01)u 0.53 20.00uLoop Energy Inc LPEN OP 236.3 36 6.51 12/2020 (0.50) (0.67) (0.64) nmf nmf 0.03 0.05 0.39 nmf 16.9 2.59 0.01 15.00NanoXplore GRA OP 129.7 158 4.35 06/2020 (0.10) (0.07) (0.07) nmf nmf 0.55 0.46 0.44 9.4 9.9 0.69 0.19 5.00Northland Power NPI OP 9392.2 219 42.96 12/2020 1.79 1.19 1.41 36.1 30.4 10.31 9.66 9.82 4.4 4.4 13.92 0.66 50.00TransAlta Renewables RNW SP 5788.6 267 21.68 12/2020 0.35 0.66 0.66 32.9 32.8 1.64 1.76 1.82 12.3 11.9 7.84 0.19 20.00Xebec Adsorption XBC SP 661.6 152 4.34 12/2020 (0.33) 0.04 0.06 nmf nmf 0.59 0.72 1.15 6.0 3.8 2.13 0.14 5.00
Rating System: OP = Outperform; SP = Sector Perform; UP = Underperform; T = Tender; UR = Under Review; R = Restricted u = US dollar1 FD EPS are pro-forma numbers from continuing operations and exludes goodwill amortization, restructuring and one-time charges.Source: Company Reports, Refinitiv, NBF Estimates & Analysis
12-MthFDEPSP/E
Sales per share
67VISION JULY/AUGUST 2021 |Back to Research Analysts pageTechnology
Back to FormYear to date, the S&P Technology Index is up 15.4% versus the 16.5% increase in the S&P 500. In Canada, the TSX Technology Index is up 26.7% versus the 18.1% increase in the TSX. That Canadian outperformance has been driven by some of our favourite growth names – namely, Shopify, Lightspeed and Nuvei which are all approaching all-time highs. Despite that, we believe the continued innovation and acceleration of digital transformation will continue to offer the broad group outsized growth potential looking ahead which has us remaining bullish on the sector – particularly if we take a longer-term view. With respect to the pending Q2 reporting season (where we will lap a full pandemic quarter in F20), we think the results have the potential to be more challenging for specific names that saw outsized benefit from the prior year’s lockdowns. We also expect FX to play a role in Q2 results which could be a headwind or tailwind depending on the individual company’s reporting currency and international revenue mix. With many of our growth names near all-time highs, we’d tread lightly into the quarter results when it comes to adding position in the short-term. At the same time, we continue to believe legacy names like OpenText and CGI remain fundamentally undervalued with strong underlying fundamentals – namely, strong free cash flow. From a stock selection standpoint, we’d continue to opportunistically add positions in growth names like Docebo, Farmers Edge, Kinaxis, Lightspeed, Nuvei, Real Matters, Shopify, TELUS International and Thinkific while balancing those names with legacy incumbents like CGI and OpenText with select special situations in names like Altus. The following provides an update on some of our Outperform-rated names:
Farmers Edge is an agriculture data and analytics platform provider. The Company’s core platform, FarmCommand, offers scalable subscription services that range from soil monitoring to crop planning. The Company has over 3,000 customers and over 23 million subscribed acres. Farmers Edge makes money by charging subscription revenue for its services with average contract terms ranging from three to five years. As we’ve seen other industries increasingly benefit from overlaying insight from data, we believe that’s also a scaling opportunity in farming. The difference is that adoption rates based on
our diligence are very early suggesting significant growth potential. We believe Farmers Edge is an early leader with one of the most comprehensive offerings in the market that’s further differentiated by its independence.
Lightspeed continues to capture share using a strategy of organic and acquisition measures. That’s elevating its ability to fortify a growing leadership position within its targeted segments. Equally impressive has been the Company’s resilience and ability to pivot during the health crisis. Looking ahead, as we exit the pandemic, it’s our view that a normalized environment would amplify that ability to execute that much more, a view supported by strength in leading reopening markets like Australia. Lightspeed is in the midst of a strategic shift with the company looking to shed its identity as “just” a POS provider to become a wholistic commerce platform. The recent acquisitions of Ecwid and NuOrder, aimed at expanding its product offering and a proposed name change to “Lightspeed Commerce” suggests to us the company is making progress in that shift.
Kinaxis should be a meaningful beneficiary from the secular changes from supply chain solutions. While it may (or may not) be obvious, supply chain management has been a critical technology / process in the current environment and from what we’ve heard, the pipeline of opportunity is up considerably, which should be of no surprise given the challenges across supply chains, particularly across larger enterprises. The complexity of the Company’s technology caused some delays in conversions of its pipeline; yet, that pipeline has only increased. We think those delays are being misread by the market – in our view, that represents an opportunity.
Shopify remains the leading technology platform for e-Commerce in our opinion. For investors, we see many avenues of growth - namely: 1) International, 2) increased take rate with new services; 3) fulfillment; and, 4) larger enterprise not to mention what we believe to be an overall accelerating industry shift to e-Commerce. It’s those drivers that offer the potential for a material lift in revenue going forward and given the execution thus far, we believe it’s reasonable to price in those potential drivers given the history of execution.
Richard Tse Analyst 416-869-6690 —Associates: James Burns: 416-869-8808Mihir Raul : 416-869-8049 John Shao: 416-869-7938
Sector Analysis
Selections› Docebo› Kinaxis› Lightspeed › Nuvei› Real Matters› Farmers Edge › Shopify› TELUS International › Thinkific
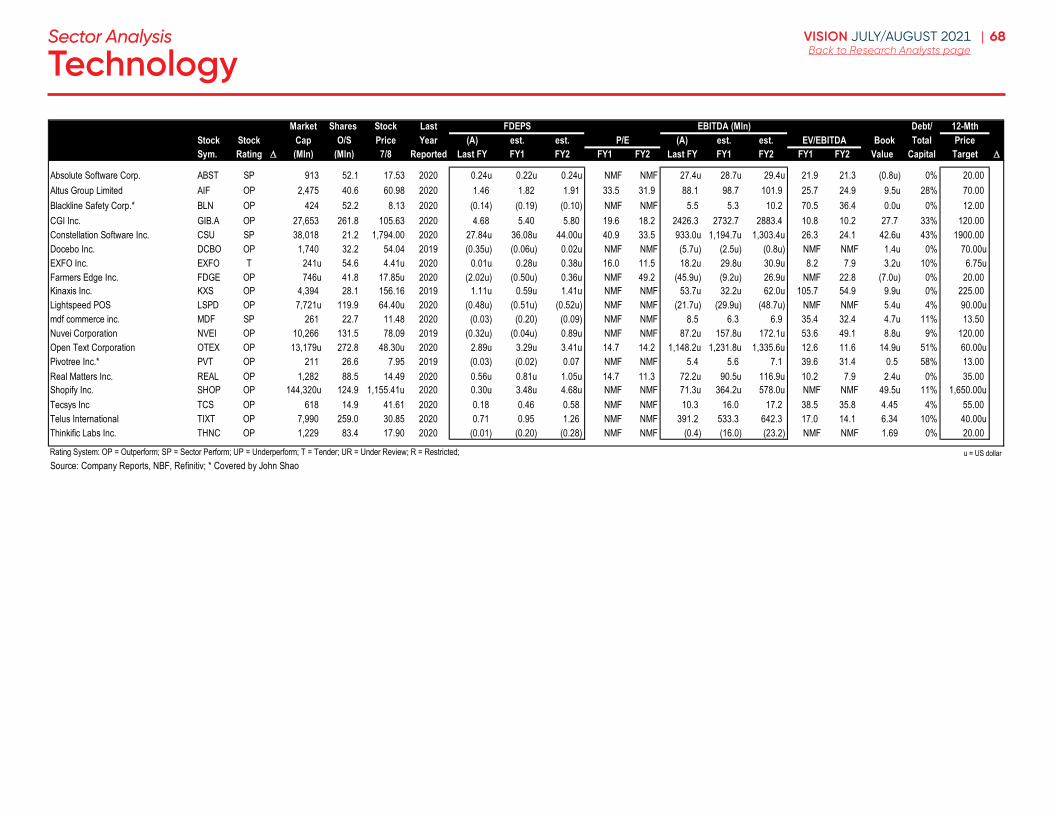
68VISION JULY/AUGUST 2021 |Back to Research Analysts pageTechnology
Sector Analysis
Market Shares Stock Last FDEPS Debt/ 12-MthStock Stock Cap O/S Price Year (A) est. est. P/E (A) est. est. EV/EBITDA Book Total PriceSym. Rating (Mln) (Mln) 7/8 Reported Last FY FY1 FY2 FY1 FY2 Last FY FY1 FY2 FY1 FY2 Value Capital Target
Absolute Software Corp. ABST SP 913 52.1 17.53 2020 0.24u 0.22u 0.24u NMF NMF 27.4u 28.7u 29.4u 21.9 21.3 (0.8u) 0% 20.00Altus Group Limited AIF OP 2,475 40.6 60.98 2020 1.46 1.82 1.91 33.5 31.9 88.1 98.7 101.9 25.7 24.9 9.5u 28% 70.00Blackline Safety Corp.* BLN OP 424 52.2 8.13 2020 (0.14) (0.19) (0.10) NMF NMF 5.5 5.3 10.2 70.5 36.4 0.0u 0% 12.00CGI Inc. GIB.A OP 27,653 261.8 105.63 2020 4.68 5.40 5.80 19.6 18.2 2426.3 2732.7 2883.4 10.8 10.2 27.7 33% 120.00Constellation Software Inc. CSU SP 38,018 21.2 1,794.00 2020 27.84u 36.08u 44.00u 40.9 33.5 933.0u 1,194.7u 1,303.4u 26.3 24.1 42.6u 43% 1900.00Docebo Inc. DCBO OP 1,740 32.2 54.04 2019 (0.35u) (0.06u) 0.02u NMF NMF (5.7u) (2.5u) (0.8u) NMF NMF 1.4u 0% 70.00uEXFO Inc. EXFO T 241u 54.6 4.41u 2020 0.01u 0.28u 0.38u 16.0 11.5 18.2u 29.8u 30.9u 8.2 7.9 3.2u 10% 6.75uFarmers Edge Inc. FDGE OP 746u 41.8 17.85u 2020 (2.02u) (0.50u) 0.36u NMF 49.2 (45.9u) (9.2u) 26.9u NMF 22.8 (7.0u) 0% 20.00Kinaxis Inc. KXS OP 4,394 28.1 156.16 2019 1.11u 0.59u 1.41u NMF NMF 53.7u 32.2u 62.0u 105.7 54.9 9.9u 0% 225.00Lightspeed POS LSPD OP 7,721u 119.9 64.40u 2020 (0.48u) (0.51u) (0.52u) NMF NMF (21.7u) (29.9u) (48.7u) NMF NMF 5.4u 4% 90.00umdf commerce inc. MDF SP 261 22.7 11.48 2020 (0.03) (0.20) (0.09) NMF NMF 8.5 6.3 6.9 35.4 32.4 4.7u 11% 13.50Nuvei Corporation NVEI OP 10,266 131.5 78.09 2019 (0.32u) (0.04u) 0.89u NMF NMF 87.2u 157.8u 172.1u 53.6 49.1 8.8u 9% 120.00Open Text Corporation OTEX OP 13,179u 272.8 48.30u 2020 2.89u 3.29u 3.41u 14.7 14.2 1,148.2u 1,231.8u 1,335.6u 12.6 11.6 14.9u 51% 60.00uPivotree Inc.* PVT OP 211 26.6 7.95 2019 (0.03) (0.02) 0.07 NMF NMF 5.4 5.6 7.1 39.6 31.4 0.5 58% 13.00Real Matters Inc. REAL OP 1,282 88.5 14.49 2020 0.56u 0.81u 1.05u 14.7 11.3 72.2u 90.5u 116.9u 10.2 7.9 2.4u 0% 35.00Shopify Inc. SHOP OP 144,320u 124.9 1,155.41u 2020 0.30u 3.48u 4.68u NMF NMF 71.3u 364.2u 578.0u NMF NMF 49.5u 11% 1,650.00uTecsys Inc TCS OP 618 14.9 41.61 2020 0.18 0.46 0.58 NMF NMF 10.3 16.0 17.2 38.5 35.8 4.45 4% 55.00Telus International TIXT OP 7,990 259.0 30.85 2020 0.71 0.95 1.26 NMF NMF 391.2 533.3 642.3 17.0 14.1 6.34 10% 40.00uThinkific Labs Inc. THNC OP 1,229 83.4 17.90 2020 (0.01) (0.20) (0.28) NMF NMF (0.4) (16.0) (23.2) NMF NMF 1.69 0% 20.00 Rating System: OP = Outperform; SP = Sector Perform; UP = Underperform; T = Tender; UR = Under Review; R = Restricted; u = US dollarSource: Company Reports, NBF, Refinitiv; * Covered by John Shao
EBITDA (Mln)
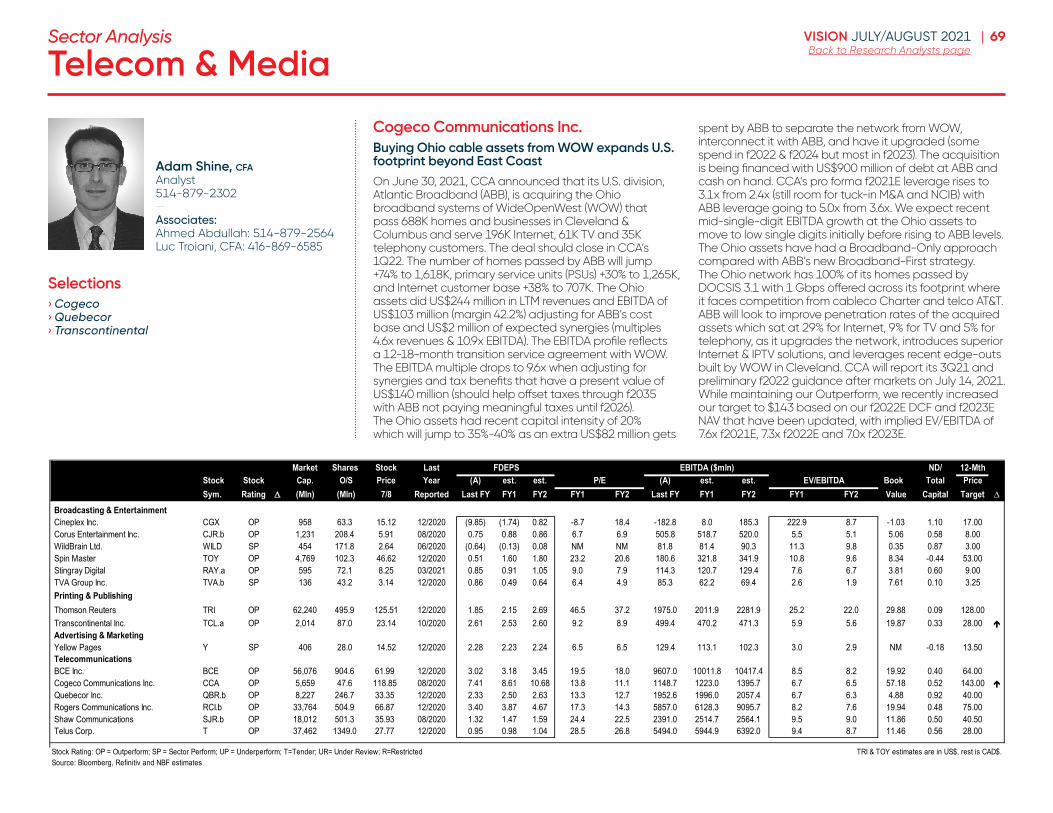
69VISION JULY/AUGUST 2021 |Back to Research Analysts pageTelecom & Media
Cogeco Communications Inc . Buying Ohio cable assets from WOW expands U .S . footprint beyond East CoastOn June 30, 2021, CCA announced that its U.S. division, Atlantic Broadband (ABB), is acquiring the Ohio broadband systems of WideOpenWest (WOW) that pass 688K homes and businesses in Cleveland & Columbus and serve 196K Internet, 61K TV and 35K telephony customers. The deal should close in CCA’s 1Q22. The number of homes passed by ABB will jump +74% to 1,618K, primary service units (PSUs) +30% to 1,265K, and Internet customer base +38% to 707K. The Ohio assets did US$244 million in LTM revenues and EBITDA of US$103 million (margin 42.2%) adjusting for ABB’s cost base and US$2 million of expected synergies (multiples 4.6x revenues & 10.9x EBITDA). The EBITDA profile reflects a 12-18-month transition service agreement with WOW. The EBITDA multiple drops to 9.6x when adjusting for synergies and tax benefits that have a present value of US$140 million (should help offset taxes through f2035 with ABB not paying meaningful taxes until f2026). The Ohio assets had recent capital intensity of 20% which will jump to 35%-40% as an extra US$82 million gets
spent by ABB to separate the network from WOW, interconnect it with ABB, and have it upgraded (some spend in f2022 & f2024 but most in f2023). The acquisition is being financed with US$900 million of debt at ABB and cash on hand. CCA’s pro forma f2021E leverage rises to 3.1x from 2.4x (still room for tuck-in M&A and NCIB) with ABB leverage going to 5.0x from 3.6x. We expect recent mid-single-digit EBITDA growth at the Ohio assets to move to low single digits initially before rising to ABB levels. The Ohio assets have had a Broadband-Only approach compared with ABB’s new Broadband-First strategy. The Ohio network has 100% of its homes passed by DOCSIS 3.1 with 1 Gbps offered across its footprint where it faces competition from cableco Charter and telco AT&T. ABB will look to improve penetration rates of the acquired assets which sat at 29% for Internet, 9% for TV and 5% for telephony, as it upgrades the network, introduces superior Internet & IPTV solutions, and leverages recent edge-outs built by WOW in Cleveland. CCA will report its 3Q21 and preliminary f2022 guidance after markets on July 14, 2021. While maintaining our Outperform, we recently increased our target to $143 based on our f2022E DCF and f2023E NAV that have been updated, with implied EV/EBITDA of 7.6x f2021E, 7.3x f2022E and 7.0x f2023E.
Adam Shine, cfa Analyst 514-879-2302 —Associates: Ahmed Abdullah: 514-879-2564 Luc Troiani, CFA: 416-869-6585
Sector Analysis
Selections› Cogeco› Quebecor› Transcontinental
Market Shares Stock Last FDEPS EBITDA ($mln) ND/ 12-MthStock Stock Cap. O/S Price Year (A) est. est. P/E (A) est. est. Book Total PriceSym. Rating (Mln) (Mln) 7/8 Reported Last FY FY1 FY2 FY1 FY2 Last FY FY1 FY2 FY1 FY2 Value Capital Target
Broadcasting & Entertainment Cineplex Inc. CGX OP 958 63.3 15.12 12/2020 (9.85) (1.74) 0.82 -8.7 18.4 -182.8 8.0 185.3 222.9 8.7 -1.03 1.10 17.00Corus Entertainment Inc. CJR.b OP 1,231 208.4 5.91 08/2020 0.75 0.88 0.86 6.7 6.9 505.8 518.7 520.0 5.5 5.1 5.06 0.58 8.00WildBrain Ltd. WILD SP 454 171.8 2.64 06/2020 (0.64) (0.13) 0.08 NM NM 81.8 81.4 90.3 11.3 9.8 0.35 0.87 3.00Spin Master TOY OP 4,769 102.3 46.62 12/2020 0.51 1.60 1.80 23.2 20.6 180.6 321.8 341.9 10.8 9.6 8.34 -0.44 53.00Stingray Digital RAY.a OP 595 72.1 8.25 03/2021 0.85 0.91 1.05 9.0 7.9 114.3 120.7 129.4 7.6 6.7 3.81 0.60 9.00TVA Group Inc. TVA.b SP 136 43.2 3.14 12/2020 0.86 0.49 0.64 6.4 4.9 85.3 62.2 69.4 2.6 1.9 7.61 0.10 3.25Printing & PublishingThomson Reuters TRI OP 62,240 495.9 125.51 12/2020 1.85 2.15 2.69 46.5 37.2 1975.0 2011.9 2281.9 25.2 22.0 29.88 0.09 128.00Transcontinental Inc. TCL.a OP 2,014 87.0 23.14 10/2020 2.61 2.53 2.60 9.2 8.9 499.4 470.2 471.3 5.9 5.6 19.87 0.33 28.00
Advertising & MarketingYellow Pages Y SP 406 28.0 14.52 12/2020 2.28 2.23 2.24 6.5 6.5 129.4 113.1 102.3 3.0 2.9 NM -0.18 13.50TelecommunicationsBCE Inc. BCE OP 56,076 904.6 61.99 12/2020 3.02 3.18 3.45 19.5 18.0 9607.0 10011.8 10417.4 8.5 8.2 19.92 0.40 64.00Cogeco Communications Inc. CCA OP 5,659 47.6 118.85 08/2020 7.41 8.61 10.68 13.8 11.1 1148.7 1223.0 1395.7 6.7 6.5 57.18 0.52 143.00
Quebecor Inc. QBR.b OP 8,227 246.7 33.35 12/2020 2.33 2.50 2.63 13.3 12.7 1952.6 1996.0 2057.4 6.7 6.3 4.88 0.92 40.00Rogers Communications Inc. RCI.b OP 33,764 504.9 66.87 12/2020 3.40 3.87 4.67 17.3 14.3 5857.0 6128.3 9095.7 8.2 7.6 19.94 0.48 75.00Shaw Communications SJR.b OP 18,012 501.3 35.93 08/2020 1.32 1.47 1.59 24.4 22.5 2391.0 2514.7 2564.1 9.5 9.0 11.86 0.50 40.50Telus Corp. T OP 37,462 1349.0 27.77 12/2020 0.95 0.98 1.04 28.5 26.8 5494.0 5944.9 6392.0 9.4 8.7 11.46 0.56 28.00
Stock Rating: OP = Outperform; SP = Sector Perform; UP = Underperform; T=Tender; UR= Under Review; R=Restricted TRI & TOY estimates are in US$, rest is CAD$.Source: Bloomberg, Refinitiv and NBF estimates
EV/EBITDA
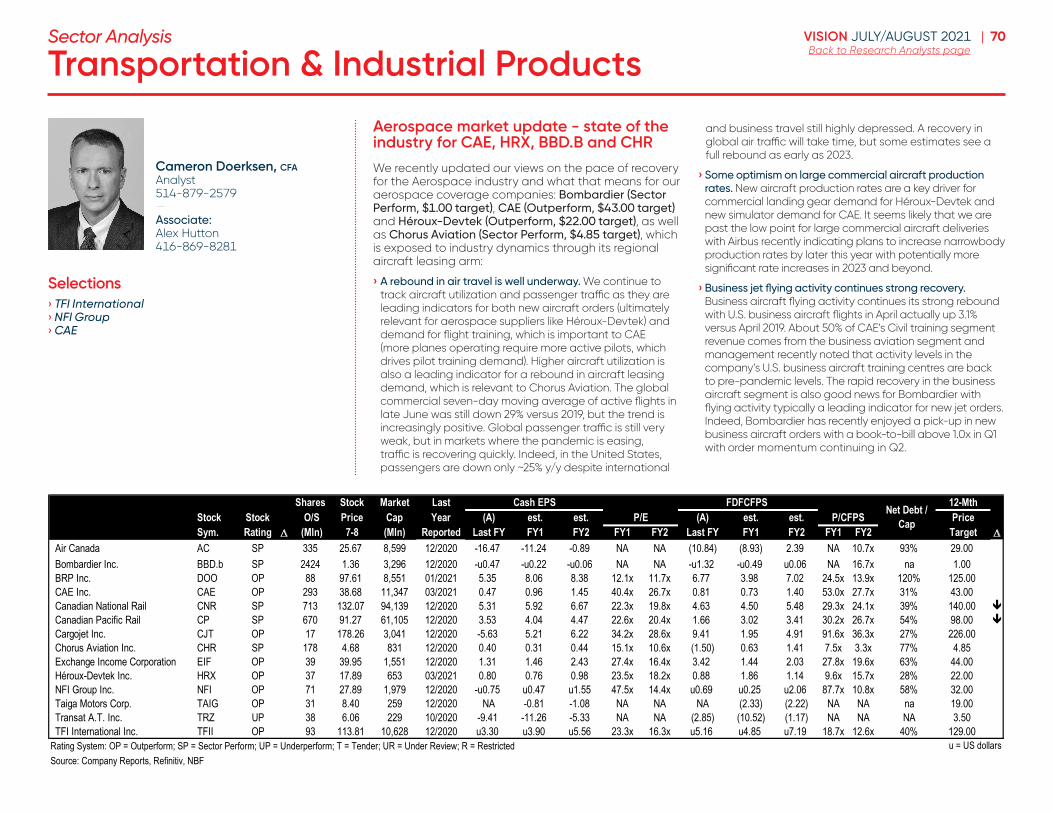
70VISION JULY/AUGUST 2021 |Back to Research Analysts pageTransportation & Industrial Products
Aerospace market update - state of the industry for CAE, HRX, BBD .B and CHR
We recently updated our views on the pace of recovery for the Aerospace industry and what that means for our aerospace coverage companies: Bombardier (Sector Perform, $1 .00 target), CAE (Outperform, $43 .00 target) and Héroux-Devtek (Outperform, $22 .00 target), as well as Chorus Aviation (Sector Perform, $4 .85 target), which is exposed to industry dynamics through its regional aircraft leasing arm:
› A rebound in air travel is well underway . We continue to track aircraft utilization and passenger traffic as they are leading indicators for both new aircraft orders (ultimately relevant for aerospace suppliers like Héroux-Devtek) and demand for flight training, which is important to CAE (more planes operating require more active pilots, which drives pilot training demand). Higher aircraft utilization is also a leading indicator for a rebound in aircraft leasing demand, which is relevant to Chorus Aviation. The global commercial seven-day moving average of active flights in late June was still down 29% versus 2019, but the trend is increasingly positive. Global passenger traffic is still very weak, but in markets where the pandemic is easing, traffic is recovering quickly. Indeed, in the United States, passengers are down only ~25% y/y despite international
and business travel still highly depressed. A recovery in global air traffic will take time, but some estimates see a full rebound as early as 2023.
› Some optimism on large commercial aircraft production rates . New aircraft production rates are a key driver for commercial landing gear demand for Héroux-Devtek and new simulator demand for CAE. It seems likely that we are past the low point for large commercial aircraft deliveries with Airbus recently indicating plans to increase narrowbody production rates by later this year with potentially more significant rate increases in 2023 and beyond.
› Business jet flying activity continues strong recovery . Business aircraft flying activity continues its strong rebound with U.S. business aircraft flights in April actually up 3.1% versus April 2019. About 50% of CAE’s Civil training segment revenue comes from the business aviation segment and management recently noted that activity levels in the company’s U.S. business aircraft training centres are back to pre-pandemic levels. The rapid recovery in the business aircraft segment is also good news for Bombardier with flying activity typically a leading indicator for new jet orders. Indeed, Bombardier has recently enjoyed a pick-up in new business aircraft orders with a book-to-bill above 1.0x in Q1 with order momentum continuing in Q2.
Cameron Doerksen, cfa Analyst 514-879-2579—Associate: Alex Hutton 416-869-8281
Sector Analysis
Selections› TFI International› NFI Group › CAE
Shares Stock Market Last Cash EPS FDFCFPS 12-MthStock Stock O/S Price Cap Year (A) est. est. P/E (A) est. est. P/CFPS PriceSym. Rating (Mln) 7-8 (Mln) Reported Last FY FY1 FY2 FY1 FY2 Last FY FY1 FY2 FY1 FY2 Target
Air Canada AC SP 335 25.67 8,599 12/2020 -16.47 -11.24 -0.89 NA NA (10.84) (8.93) 2.39 NA 10.7x 93% 29.00Bombardier Inc. BBD.b SP 2424 1.36 3,296 12/2020 -u0.47 -u0.22 -u0.06 NA NA -u1.32 -u0.49 u0.06 NA 16.7x na 1.00BRP Inc. DOO OP 88 97.61 8,551 01/2021 5.35 8.06 8.38 12.1x 11.7x 6.77 3.98 7.02 24.5x 13.9x 120% 125.00CAE Inc. CAE OP 293 38.68 11,347 03/2021 0.47 0.96 1.45 40.4x 26.7x 0.81 0.73 1.40 53.0x 27.7x 31% 43.00Canadian National Rail CNR SP 713 132.07 94,139 12/2020 5.31 5.92 6.67 22.3x 19.8x 4.63 4.50 5.48 29.3x 24.1x 39% 140.00 Canadian Pacific Rail CP SP 670 91.27 61,105 12/2020 3.53 4.04 4.47 22.6x 20.4x 1.66 3.02 3.41 30.2x 26.7x 54% 98.00 Cargojet Inc. CJT OP 17 178.26 3,041 12/2020 -5.63 5.21 6.22 34.2x 28.6x 9.41 1.95 4.91 91.6x 36.3x 27% 226.00Chorus Aviation Inc. CHR SP 178 4.68 831 12/2020 0.40 0.31 0.44 15.1x 10.6x (1.50) 0.63 1.41 7.5x 3.3x 77% 4.85Exchange Income Corporation EIF OP 39 39.95 1,551 12/2020 1.31 1.46 2.43 27.4x 16.4x 3.42 1.44 2.03 27.8x 19.6x 63% 44.00Héroux-Devtek Inc. HRX OP 37 17.89 653 03/2021 0.80 0.76 0.98 23.5x 18.2x 0.88 1.86 1.14 9.6x 15.7x 28% 22.00NFI Group Inc. NFI OP 71 27.89 1,979 12/2020 -u0.75 u0.47 u1.55 47.5x 14.4x u0.69 u0.25 u2.06 87.7x 10.8x 58% 32.00Taiga Motors Corp. TAIG OP 31 8.40 259 12/2020 NA -0.81 -1.08 NA NA NA (2.33) (2.22) NA NA na 19.00Transat A.T. Inc. TRZ UP 38 6.06 229 10/2020 -9.41 -11.26 -5.33 NA NA (2.85) (10.52) (1.17) NA NA NA 3.50TFI International Inc. TFII OP 93 113.81 10,628 12/2020 u3.30 u3.90 u5.56 23.3x 16.3x u5.16 u4.85 u7.19 18.7x 12.6x 40% 129.00
Rating System: OP = Outperform; SP = Sector Perform; UP = Underperform; T = Tender; UR = Under Review; R = RestrictedSource: Company Reports, Refinitiv, NBF
Net Debt / Cap
u = US dollars
71VISION JULY/AUGUST 2021 |Back to Research Analysts pageAlphabetical Listing
5N Plus VNP 66ABC Technologies ABCT 49Absolute Software Corp. ABST 68Advantage Oil & Gas AAV 58Adventus Mining ADZN 53Aecon Group ARE 49Ag Growth International Inc. AFN 44Agnico-Eagle Mines Ltd AEM 55Air Canada AC 70Akumin AKU.u 48Alamos Gold Inc AGI 55Alaris Equity Partners Income Trust AD 64Algonquin Power AQN 66Alio Gold Inc. ALO 55Alithya Group Inc. ALYA 68Allied Properties REIT AP.un 62AltaGas ALA 60AltaGas Canada Inc. ACI 60Altius Renewable Royalties Corp ARR 66Altus Group Limited AIF 68American Hotel Income Properties HOT.un 62Andlauer Healthcare Group AND 48ARC Resources Ltd. ARX 58Argonaut Gold Inc. AR 55Artemis Gold Inc. ARTG 55Artis REIT AX.un 62ATCO Ltd. ACO 60ATS Automation ATA 49AuRico Metals Inc AMI.TO 55AutoCanada ACQ 49Automotive Properties REIT APR.un 62Aya Gold and Silver AYA 55B2Gold BTO 55Ballard Power Systems BLDP 66Bank of Montreal BMO 40Bank of Nova Scotia BNS 40Barrick Gold ABX 55Barsele Minerals Corp. BME 55Baytex Energy BTE 58BCE Inc. BCE 69Birchcliff Energy BIR 58Bird Construction Inc. BDT 49Blackline Safety Corp. BLN 68Bluestone Resources Inc. BSR 55Boardwalk REIT BEI.un 62Bombardier Inc. BBD.b 70Boralex BLX 66Boyd Group Services Inc. BYD 64Brookfield Business Partners BBU 42Brookfield Infrastructure BIP 66Brookfield Renewable BEP 60Brookfield Renewable BEP 66BRP Inc. DOO 70BSR REIT HOM.un 62BTB REIT BTB.un 62CAE Inc. CAE 70Canadian National Rail CNR 70Canadian Natural Resources CNQ 58Canadian Pacific Rail CP 70Canadian Tire CTC.a 51Canadian Utilities CU 60Canadian Western Bank CWB 40CAP REIT CAR.un 62Capital Power CPX 60Capstone Mining CS 53Cargojet Inc. CJT 70Cascades CAS 64Cenovus Energy CVE 58Centerra Gold Inc CG 55
CES Energy Solutions Corp. CES 58CGI Inc. GIB.A 68Chartwell Retirement Residences CSH.un 62Chemtrade Logistics Income Fund CHE.UN 48Choice Properties REIT CHP.un 62Chorus Aviation Inc. CHR 70CIBC CM 40Cineplex Inc. CGX 69Cogeco Communications Inc. CCA 69Cominar REIT CUF.un 62Constellation Software Inc. CSU 68Copper Mountain Mining CMMC 53Corus Entertainment Inc. CJR.b 69Couche Tard ATD.b 51Crescent Point Energy Corp. CPG 58Crew Energy CR 58Crombie REIT CRR.un 62CT REIT CRT.un 62Dexterra Group Inc. DXT 64Dialogue Health Technologies CARE 48DIRTT Environmental Solutions DRT 66Docebo Inc. DCBO 68Dollarama DOL 51Doman Building Materials CWX 64DREAM Industrial REIT DIR.un 62DREAM Office REIT D.un 62Dundee Precious Metals DPM 55ECN Capital ECN 42Eldorado Gold Corp ELD 55Element Fleet Management EFN 42Emera Inc. EMA 60Empire Company EMP.a 51Enbridge Inc. ENB 60Enbridge Income Fund ENF 60Endeavour Mining EDV 55Enerflex Ltd. EFX 44Enerplus Corporation ERF 58Equinox Gold Corp EQX 55Equitable Group EQB 42ERES REIT ERE.un 62Ero Copper ERO 53Exchange Income Corporation EIF 70EXFO Inc. EXFO 68Extendicare EXE 62Fairfax Financial Holdings FFH 42Falco Resources Ltd. FPC 55Farmers Edge Inc. FDGE 68Fiera Capital Corp. FSZ 42Filo Mining FIL 53Finning International Inc. FTT 49First Capital REIT FCR 62First Majestic Silver Corp FR 55First National Financial FN 42First Quantum Minerals FM 53Flagship Communities REIT MHCu 62Fortis Inc. FTS 60Fortuna Silver Mines Inc FVI 55Franco-Nevada Corp FNV 55Freehold Royalties FRU 58GDI Integrated Facility Services GDI 64GFL Environmental Inc. GFL 66Gibson Energy GEI 60Gildan GIL 51goeasy GSY 42Gold Standard Ventures Corp. GSV 55Golden Star Resources GSC 55Goodfood Market FOOD 51Granite REIT GRT.un 62Great-West Lifeco GWO 40
H&R REIT HR.un 62Hardwoods Distribution HDI 64Headwater Exploration HWX 58Héroux-Devtek Inc. HRX 70Home Capital Group HCG 42Hudbay Minerals HBM 53Hydro One Ltd. H 60iA Financial IAG 40IAMGOLD Corp IMG 55IBI Group Inc. IBG 49IGM Financial Inc. IGM 42Imperial Oil IMO 58IMV Inc. IMV 48Innergex INE 66Inovalis REIT INO.un 62Intact Financial Corp. IFC 42Integra Resources Corp. ITR 55Inter Pipeline IPL 60InterRent REIT IIP.un 62Intertape Polymer Group Inc. ITP 64Invesque IVQu 62Jamieson Wellness JWEL 48Josemaria Resources JOSE 53K92 Mining Inc. KNT 55K-Bro Linen KBL 48Kelt Exploration KEL 58Keyera KEY 60Killam Apartment REIT KMP.un 62Kinaxis Inc. KXS 68Kinross Gold Corp K 55Kirkland Lake Gold Corp KL 55Knight Therapeutics GUD 48KP Tissue KPT 64Lassonde LAS.a 51Laurentian Bank LB 40Liberty Gold Corp LGD 55LifeWorks Inc. LWRK 42Lightspeed POS LSPD 68Lithium Americas LAC 53Loblaw L 51Loop Energy Inc LPEN 66Lundin Gold Inc. LUG 55Lundin Mining LUN 53MAG Silver Corp MAG 55Manulife Financial MFC 40Marathon Gold Corp. MOZ 55MAV Beauty Brands MAV 51Maverix Metals Inc MMX 55mdf commerce inc. MDF 68Medical Facilities Corp. DR 48MEG Energy MEG 58Metro MRU 51Minera Alamos Inc. MAI 55Minto Apartment REIT MI.un 62MTY Food Group MTY 51Mullen Group Ltd. MTL 44NanoXplore GRA 66National Bank NA 40National Energy Services Reunited NESR 58Nevada Copper NCU 53New Gold Inc NGD 55Newmont NGT 55Nexa Resources NEXA 53NFI Group Inc. NFI 70North American Construction Group Ltd. NOA 49Northland Power NPI 66NorthWest H.P. REIT NWH.un 62Nuvei Corporation NVEI 68NuVista Energy NVA 58
O3 Mining Inc. OIII 55OceanaGold Corp OGC 55Open Text Corporation OTEX 68Osisko Development ODV 55Osisko Gold Royalties Ltd OR 55Osisko Mining OSK 55Ovintiv Inc (US$) OVV 58Pan American Silver PAAS 55Paramount Resources POU 58Parex Resources PXT 58Park Lawn Corporation PLC 64Parkland Fuel Corporation PKI 51Pason Systems Corp. PSI 44Pembina Pipelines PPL 60Peyto Exploration & Development PEY 58Pipestone Energy PIPE 58Pivotree Inc. PVT 68Power Corporation of Canada POW 42PrairieSky Royalty PSK 58Precision Drilling Corp. PD 58Premium Brands Holdings PBH 51Pretium Resources PVG 55Pure Gold Mining Inc. PGM 55Quebecor Inc. QBR.b 69Real Matters Inc. REAL 68Richelieu Hardware RCH 64RioCan REIT REI.un 62Ritchie Bros. Auctioneers RBA 49Rogers Communications Inc. RCI.b 69Rogers Sugar RSI 48Roots Corporation ROOT 51Royal Bank of Canada RY 40Royal Gold Inc RGLD 55Sabina Gold and Silver Corp. SBB 55Sandstorm Gold Ltd SSL 55Saputo SAP 51Savaria Corporation SIS 64Secure Energy SES 60Shaw Communications SJR.b 69Shawcor Ltd. SCL 44Sherritt International S 53Shopify Inc. SHOP 68Sienna Senior Living SIA 62Sigma Lithium SGMA 53SilverCrest Metals SIL 55Slate Office REIT SOT.un 62Sleep Country Canada ZZZ 51SmartCentres REIT SRU.un 62SNC-Lavalin SNC 49Spartan Delta SDE 58Spin Master TOY 69SSR Mining Inc SSRM 55Stantec Inc. STN 49Stelco STLC 49Stella-Jones SJ 49Stingray Digital RAY.a 69StorageVault Canada SVI.V 62Storm Resources SRX 58Summit Industrial SMU.un 62Sun Life Financial SLF 40Suncor Energy SU 58Superior Plus SPB 60Surge Energy SGY 58Taiga Motors Corp. TAIG 70Tamarack Valley Energy TVE 58Taseko Mines TKO 53TC Energy Corp. TRP 60Teck Resources TECKb 53Tecsys Inc TCS 68
Telus Corp. T 69Telus International TIXT 68Tervita TEV 60TFI International Inc. TFII 70The Lion Electric Company LEV 66Theratechnologies TH 48Thinkific Labs Inc. THNC 68Thomson Reuters TRI 69Tidewater Midstream TWM 60Timbercreek Financial TF 42TMX Group X 42Topaz Energy TPZ 58Toromont Industries Ltd. TIH 49Toronto-Dominion Bank TD 40Tourmaline Oil TOU 58TransAlta TA 60TransAlta Renewables RNW 66Transat A.T. Inc. TRZ 70Transcontinental Inc. TCL.a 69Trevali Mining TV 53Trican Well Services TCW 58Tricon Capital Group TCN 62Trilogy Metals TMQ 53Triple Flag Precious Metals Corp TFPM 55Trisura Group Ltd. TSU 42True North Commerical REIT TNT.un 62TVA Group Inc. TVA.b 69Uni-Sélect UNS 64Veresen Inc. VSN 60Vermilion Energy Inc. VET 58Wesdome Corp. WDO 55Wheaton Precious Metals Corp WPM 55Whitecap Resources WCP 58WildBrain Ltd. WILD 69WPT Industrial REIT WIR’U-T 62WSP Global WSP 49Xebec Adsorption XBC 66Yamana Gold Inc YRI 55Yangarra Resources YGR 58Yellow Pages Y 69
72VISION JULY/AUGUST 2021 |Back to Research Analysts pageBranches
Ancaster • 911, Golf Links Road, Suite 201, Ancaster, ON, L9K 1H9 • 905-648-3813Baie-Comeau • 600, Boul. Laflèche, bureau 340-B, Baie-Comeau, QC, G5C 2X8 • 418-296-8838 Barrie • 126 Collier Street, Barrie, ON, L4M 1H4 • 705-719-1190Beauce • 11333, 1ière Avenue, bureau 200, Saint-Georges, QC, G5Y 2C6 • 418-227-0121Bellevue West Van • Suite #209, 1455 Bellevue Avenue, West Vancouver, BC, V7T 1C3 • 604-925-3734Berthierville • 779, rue Notre-Dame, Berthierville, QC, J0K 1A0 • 450-836-2727Bin-Scarth • 24 Binscarth Rd, Toronto, ON, M4W 1Y1 • 416-929-6432Brampton • 10520 Torbram Road (at Sandalwood Parkway), Brampton, ON, L6R 2S3 • 905-456-1515Brandon • 633-C, 18th Street, Brandon, MB, R7A 5B3 • 204-571-3200Calgary • 239 8th Ave., SW, Suite 100, Calgary, AB, T2P 1B9 • 403-476-0398Calgary - Southport • 10655 Southport Road SW, Suite 1100, Southland Tower, Calgary,AB, T2W 4Y1 • 403-301-4859Chatham • 380 St. Clair, Street, Chatham, ON, N7L 3K2 • 519-351-7645Chicoutimi • 1180, boulevard Talbot, Suite 201, Chicoutimi, QC, G7H 4B6 • 418-549-8888DIX30 • 9160, boulevard Leduc, Bureau 710, Brossard, QC, J4Y 0E3 • 450-462-2552Drumheller • 356 Centre Street, PO Box 2176, Drumheller, AB, T0J 0Y0 • (403) 823-6859Drummondville • 595, boulevard Saint-Joseph, Bureau 200, Drummondville, QC, J2C 2B6 • 819-477-5024Duncan • 2763 Beverly Street, Suite 206, Duncan, BC, V9L 6X2 • 250-715-3050Edmonton • 10175 – 101 Street NW, Suite 1800, Edmonton, AB, T5J 0H3 • 780-412-6600Edmonton-North • TD Tower, 10088 – 102 Avenue, Suite No. 1701, Edmonton, AB, T5J 2Z1 • 780-421-4455 FrederictonNB • 551 King Street, Fredericton , NB, E3B 4Z9 • 506-450-1740Gatineau • 920, St-Joseph, Bureau 100, Hull-Gatineau, QC, J8Z 1S9 • 819-770-5337Granby • 150, rue St-Jacques, Bureau 202, Granby, QC, J2G 8V6 • 450-378-0442Halifax • Purdy's Wharf Tower II, 1969 Upper Water Street, Suite 1601, Halifax, NS, B3J 3R7 • 902-496-7700Halifax-Spring Garden • 400-5657 Spring Garden Road, Parklane Terraces, Halifax, NS, B3J 3R4 • 902-425-1283Joliette • 40, rue Gauthier Sud, Bureau 3500, Joliette, QC, J6E 4J4 • 450-760-9595Kelowna • 1631 Dickson Ave. Suite 1710, Landmark 6, Kelowna, BC, V1Y 0B5 • 250-717-5510Lac-Mégantic • 3956, rue Laval, suite 100, QC, G6B 2W9 • 819-583-6035Laval • 2500, boulevard Daniel Johnson, Bureau 610, Laval, QC, H7T 2P6 • 450-686-5700Lethbridge • 404, 6th Street South, Lethbridge, AB, T1J 2C9 • 403-388-1900Lévis • 1550, boulevard Alphonse-Desjardins, Bureau 110, Lévis, QC, G6V 0G8 • 418-838-0456 London Pall Mall • 256 Pall Mall Street, Suite 201, London, ON, N6A 5P6 • 519-439-6228London-City Centre • 802-380 Wellington Street, London, ON, N6A 5B5 • 519-646-5711Metcalfe • 1155, rue Metcalfe, Suite 1450, Montréal, QC, H3B 2V6 • 514-879-4825Mississauga • 350, Burnhamthorpe road West, Suite 603, Mississauga, ON, L5B 3J1 • 905-272-2799Moncton • 735 Main Street, Suite 300, Moncton, NB, E1C 1E5 • 506-857-9926Mont Saint-Hilaire • 450 boul. Sir-Wilfrid-Laurier local 208 , Mont-St-Hilaire, Qc. J3H 3N9 • 450-467-4770Mont-Tremblant • 1104, rue de Saint-Jovite, 2e étage, Mont-Tremblant, QC, J8E 3J9 • 450-569-3440Montréal International • 1, Place Ville-Marie, Bureau 1700, Montréal, QC, H3B 2C1 • 514-879-5576Montréal L'Acadie • 9001, boulevard de l’Acadie, Bureau 802, Montréal, QC, H4N 3H5 • 514-389-5506North Bay • 680 Cassells Street, Suite 101, North Bay, ON, P1B 4A2 • 705-476-6360Oakville • 305 Church Street, Oakville, ON, L6J 7T2 • 905-849-3558 Oshawa • 575 Thornton Road North, Oshawa, ON, L1J 8L5 • 905-433-0210Ottawa • 50 O'Connor Street, Suite 1602, Ottawa, ON, K1P 6L2 • 613-236-0103Outremont • 1160, boulevard Laurier Ouest, App. 1, Outremont, QC, H2V 2L5 • 514-276-3532Owen Sound • 1717 2nd Ave. E., Suite 202, Owen Sound, ON, N4K 6V4. • 519-372-1277Peterborough • 201 George Street North, suite 401, Peterborough, ON, K9J 3G7 • 705-740-1110Plessisville • 1719, rue St-Calixte, Plessisville, QC, G6L 1R2 • 819-362-6000
Kirkland • 16,766 Route Transcanadienne, bureau 503, Kirkland, QC, H9H 4M7 • 514-426-2522PVM Montréal • 1, Place Ville-Marie, Bureau 1700, Montréal, QC, H3B 2C1 • 514-879-5200Québec • 500, Grande-Allée Est, Bureau 400, Québec, Qc, G1R 2J7 • 418-649-2525Québec - Sainte-Foy • Place de la Cité, 2600, boulevard Laurier, Bureau 700, Québec, QC, G1V 4W2 • 418-654-2323Red Deer • 4719 48th Avenue, Suite 200, Red Deer, AB, T4N 3T1 • 403-348-2600Regina • 2075, Prince Of Wales Drive, Suite 305, Regina, SK, S4V 3A3 • 306-781-0500Repentigny • 534, rue Notre-Dame, Bureau 201, Repentigny, QC, J6A 2T8 • 450-582-7001
Richmond • 135-8010 Saba Road, Richmond, BC, V6Y 4B2 • 604-658-8050Richmond Hill • 9130 Leslie Street, Suite 200, Richmond Hill, ON, L4B 0B9 • 416-753-4016Rimouski • 127, boulevard René-Lepage Est, Bureau 100, Rimouski, QC, G5L 1P1 • 418-721-6767Rivière-du-Loup • 10, rue Beaubien, Rivière-du-Loup, QC, G5R 1H7 • 418-867-7900 Rouyn-Noranda • 104, 8e rue, Rouyn-Noranda, QC, J9X 2A6 • 819-762-4347Saint John • 69 King Street, 2nd floor, St-John, NB, E2L 1G5 • 506-642-1740Sainte-Marie-de-Beauce • 249, Du Collège, Bureau 100, Ste-Marie, QC, G6E 3Y1 • 418-387-8155Saint-Félicien • 1120, boulevard Sacré-Cœur, Saint-Félicien, QC, G8K 1P7 • 418-679-2684Saint-Hyacinthe • 1355, rue Daniel-Johnson Ouest, bureau 4100, Saint-Hyacinthe, QC, J2S 8W7 • 450-774-5354Saint-Jean-sur-Richelieu • 395, boul. du Séminaire Nord, Suite 201, Saint-Jean-sur-Richelieu, QC, J3B 8C5 • 450-349-7777Saint-Jérôme • 265, rue St-George, Suite 100, Saint-Jérôme, QC, J7Z 5A1 • 450-569-8383Saskatoon - 8th St . • 1220 8th Street East, Saskatoon, SK, S7H 0S6 • 306-657-3465Sept-Îles • 805, boulevard Laure, Suite 200, Sept-Îles, QC, G4R 1Y6 • 418-962-9154Shawinigan • 550 Avenue De la Station, bureau 200, Shawinigan, QC, G9N 1W2 • 819-538-8628Sherbrooke • 1802, rue King Ouest, Suite 200, Sherbrooke, QC, J1J 0A2 • 819-566-7212Sidney • 2537, Beacon Avenue, Suite 205, Sidney, BC, V8L 1Y3 • 250-657-2200Sorel • 26, Pl. Charles-de-Montmagny, Suite 100, Sorel, QC, J3P 7E3 • 450-743-8474 St . Catharines • 40 King Street, St. Catharines, ON, L2R 3H4 • 905-641-1221Sudbury • 10 Elm Street, Suite 501, Sudbury, ON, P3C 1S8 • 705-671-1160Thedford Mines • 222, boulevard Frontenac Ouest, bureau 107, Thedford Mines, QC, G6G 6N7 • 418-338-6183Thunder Bay • 979, Alloy Dr, Suite 104, Thunder Bay, ON, P7B 5Z8 • 807-683-1777Toronto 1 • Exchange Tower, 130 King Street West, Suite 3200, Toronto, ON, M5X 1J9 • 416-869-3707 Toronto Midtown • 22 St. Clair Ave East, suite 1202, Toronto, ON, M4T 2S5 • 416-507-8870Trois-Rivières • 7200, rue Marion, Trois-Rivières, QC, G9A 0A5 • 819-379-0000Val d'Or • 840, 3e avenue, Val d'Or, QC, J9P 1T1 • 819-824-3687Valleyfield • 1356, boulevard Monseigneur-Langlois, Valleyfield, QC, J6S 1E3 • 450-370-4656Vancouver - PB1859 • 1076 Alberni Street, Suite 201, Vancouver, BC, V6A 1A3 • 778-783-6420Vancouver 1 • 475 Howe Street, Suite 3000, Vancouver, BC, V6C 2B3 • 604-623-6777 Victoria • 700-737 Yates Street, Victoria, BC, V8W 1L6 • 250-953-8400Victoriaville • 650, boulevard Jutras Est, Bureau 150, Victoriaville, QC, G6S 1E1 • 819-758-3191Waterloo • 180 King Street South, Suite 701, Waterloo, ON, N2J 1P8 • 519-742-9991White Rock • 2121 160th Street, Surrey, BC, V3Z 9N6 • 604-541-4925Windsor • 1 Riverside Drive West,Suite 600, Windsor, ON, N9A 5K3 • 519-258-5810Winnipeg • 200 Waterfront Drive, Suite 400, Winnipeg, MB, R3B 3P1 • 204-925-2250Yorkton • 89 Broadway Street West, Yorkton, SK, S3N 0L9 • 306-782-6450
InternationalNBF Securities UK(Regulated by The Financial Services Authority) 71 Fenchurch Street, 11th floor London, England EC3M 4HD Tel.: 44-207-680-9370 Tel.: 44-207-488-9379
New York65 East 55th Street, 31st Floor New York, NY 10022 Tel.: 212-632-8610
National Bank of Canada Financial Inc .New York65 East 55th Street, 34th Floor New York, NY 10022 Tel.: 212-546-7500
Member of› Montreal Exchange› Toronto Stock Exchange› Winnipeg Commodities
Exchange› Securities Industry Association› CNQ› Investment Dealers
Association of Canada› Canadian Investor
Protection Fund› Securities Investor Protection
Corporation
73VISION JULY/AUGUST 2021 |Back to Research Analysts pageCorporate Offices
This Report was prepared by National Bank Financial Inc. (NBF), a Canadian investment dealer, a dealer member of IIROC and an indirect wholly owned subsidiary of National Bank of Canada. National Bank of Canada is a public company listed on the Toronto Stock Exchange. The particulars contained herein were obtained from sources which we believe to be reliable but are not guaranteed by us and may be incomplete and may be subject to change without notice. The information is current as of the date of this document. Neither the author nor NBF assumes any obligation to update the information or advise on further developments relating to the topics or securities discussed. The opinions expressed are based upon the author(s) analysis and interpretation of these particulars and are not to be construed as a solicitation or offer to buy or sell the securities mentioned herein, and nothing in this Report constitutes a representation that any investment strategy or recommendation contained herein is suitable or appropriate to a recipient’s individual circumstances. In all cases, investors should conduct their own investigation and analysis of such information before taking or omitting to take any action in relation to securities or markets that are analyzed in this Report. The Report alone is not intended to form the basis for an investment decision, or to replace any due diligence or analytical work required by you in making an investment decision.This Report is for distribution only under such circumstances as may be permitted by applicable law. This Report is not directed at you if NBF or any affiliate distributing this Report is prohibited or restricted by any legislation or regulation in any jurisdiction from making it available to you. National Bank of Canada Financial Markets is a trade name used by National Bank Financial Inc. and National Bank of Canada Financial Inc. Research analysts: The Research Analyst(s) who prepared these reports certify that their respective report accurately reflects his or her personal opinion and that no part of his/her compensation was, is, or will be directly or indirectly related to the specific recommendations or views as to the securities or companies.NBF compensates its Research Analysts from a variety of sources. The Research Department is a cost centre and is funded by the business activities of NBF including Institutional Equity Sales and Trading, Retail Sales, the correspondent clearing business, and Corporate and Investment Banking. Since the revenues from these businesses vary, the funds for research compensation vary. No one business line has a greater influence than any other for Research Analyst compensation.Canadian Residents: NBF or its affiliates may engage in any trading strategies described herein for their own account or on a discretionary basis on behalf of certain clients and, as market conditions change, may amend or change investment strategy including full and complete divestment. The trading interests of NBF and its affiliates may also be contrary to any opinions expressed in this Report.NBF or its affiliates often act as financial advisor, agent, lender or underwriter or provides trading related services for certain issuers mentioned herein and may receive remuneration for its services. As well, NBF and its affiliates and/or their officers, directors, representatives, associates, may have a position in the securities mentioned herein and may make purchases and/or sales of these securities from time to time in the open market or otherwise. NBF and its affiliates may make a market in securities mentioned in this Report. This Report may not be independent of the proprietary interests of NBF and its affiliates.NBF is a member of the Canadian Investor Protection Fund.UK Residents: This Report is a marketing document. This Report has not been prepared in accordance with EU legal requirements designed to promote the independence of investment research and it is not subject to any prohibition on dealing ahead of the dissemination of investment research. In respect of the distribution of this Report to UK residents, NBF has approved the contents (including, where necessary, for the purposes of Section 21(1) of the Financial Services and Markets Act 2000). This Report is for information purposes only and does not constitute a personal recommendation, or investment, legal or tax advice. NBF and/or its parent and/or any companies within or affiliates of the National Bank of Canada group and/or any of their directors, officers and employees may have or may have had interests or long or short positions in, and may at any time make purchases and/or sales as principal or agent, or may act or may have acted as market maker in the relevant investments or related investments discussed in this Report, or may act or have acted as investment and/or commercial banker with respect hereto. The value of investments, and the income derived from them, can go down as well as up and you may not get back the amount invested. Past performance is not a guide to future performance. If an investment is denominated in a foreign currency, rates of exchange may have an adverse effect on the value of the investment. Investments which are illiquid may be difficult to sell or realise; it may also be difficult to obtain reliable information about their value or the extent of the risks to which they are exposed. Certain transactions, including those involving futures, swaps, and other derivatives, give rise to substantial risk and are not suitable for all investors. The investments contained in this Report are not available to retail customers and this Report is not for distribution to retail clients (within the meaning of the rules of the Financial Conduct Authority). Persons who are retail clients should not act or rely upon the information in this Report. This Report does not constitute or form part of any offer for sale or subscription of or solicitation of any offer to buy or subscribe for the securities described herein nor shall it or any part of it form the basis of or be relied on in connection with any contract or commitment whatsoever. This information is only for distribution to Eligible Counterparties and Professional Clients in the United Kingdom within the meaning of the rules of the Financial Conduct Authority. NBF is authorized and regulated by the Financial Conduct Authority and has its registered office at 70 St. Mary Axe, London, EC3A 8BE. NBF is not authorized by the Prudential Regulation Authority and the Financial Conduct Authority to accept deposits in the United Kingdom.U.S. Residents: With respect to the distribution of this report in the United States of America, National Bank of Canada Financial Inc. (“NBCFI”) is registered with the Securities Exchange Commission (SEC), the Financial Industry Regulatory Authority (FINRA), and is a member of the Securities Investor Protection Corporation (SIPC). NBCFI operates pursuant to a 15 a-6 Agreement with its Canadian affiliates, NBF and National Bank of Canada. This report has been prepared in whole or in part by research analysts employed by non-US affiliates of NBCFI that are not registered as broker/dealers in the US. These non-US research analysts are not registered as associated persons of NBCFI and are not licensed or qualified as research analysts with FINRA or any other US regulatory authority and, accordingly, may not be subject (among other things) to FINRA restrictions regarding communications by a research analyst with the subject company, public appearances by research analysts and trading securities held in a research analyst account.All of the views expressed in this research report accurately reflects the research analyst’s personal views regarding any and all of the subject securities or issuers. No part of the analyst’s compensation was, is, or will be, directly or indirectly, related to the specific recommendations or views expressed in this research report. The analyst responsible for the production of this report certifies that the views expressed herein reflect his or her accurate personal and technical judgment at the moment of publication. Because the views of analysts may differ, members of the National Bank Financial Group may have or may in the future issue reports that are inconsistent with this report, or that reach conclusions different from those in this report. To make further inquiry related to this report, United States residents should contact their NBCFI registered representative.HK Residents: With respect to the distribution of this report in Hong Kong by NBC Financial Markets Asia Limited (“NBCFMA”) which is licensed by the Securities and Futures Commission (“SFC”) to conduct Type 1 (dealing in securities) and Type 3 (leveraged foreign exchange trading) regulated activities, the contents of this report are solely for informational purposes. It has not been approved by, reviewed by, verified by or filed with any regulator in Hong Kong. Nothing herein is a recommendation, advice, offer or solicitation to buy or sell a product or service, nor an official confirmation of any transaction. None of the products issuers, NBCFMA or its affiliates or other persons or entities named herein are obliged to notify you of changes to any information and none of the foregoing assume any loss suffered by you in reliance of such information. The content of this report may contain information about investment products which are not authorized by SFC for offering to the public in Hong Kong and such information will only be available to those persons who are Professional Investors (as defined in the Securities and Futures Ordinance of Hong Kong (“SFO”)). If you are in any doubt as to your status you should consult a financial adviser or contact us. This material is not meant to be marketing materials and is not intended for public distribution. Please note that neither this material nor the product referred to is authorized for sale by SFC. Please refer to product prospectus for full details. There may be conflicts of interest relating to NBCFMA or its affiliates’ businesses. These activities and interests include potential multiple advisory, transactional and financial and other interests in securities and instruments that may be purchased or sold by NBCFMA or its affiliates, or in other investment vehicles which are managed by NBCFMA or its affiliates that may purchase or sell such securities and instruments. No other entity within the National Bank of Canada group, including National Bank of Canada and National Bank Financial Inc., is licensed or registered with the SFC. Accordingly, such entities and their employees are not permitted and do not intend to: (i) carry on a business in any regulated activity in Hong Kong; (ii) hold themselves out as carrying on a business in any regulated activity in Hong Kong; or (iii) actively market their services to the Hong Kong public.Copyright: This Report may not be reproduced in whole or in part, or further distributed or published or referred to in any manner whatsoever, nor may the information, opinions or conclusions contained in it be referred to without in each case the prior express written consent of NBF.
Montreal National Bank FinancialSun Life Building1155 Metcalfe StreetMontreal, QC H3B 4S9514-879-2222
Toronto National Bank FinancialThe Exchange Tower130 King Street West4th Floor PodiumToronto, ON M5X 1J9416-869-3707
Canada (Toll-Free)
1-800-361-88381-800-361-9522
United States (Toll-Free)
1-800-678-7155
2021/07-08