Embed Size (px)
DESCRIPTION
Visit by Government Officials from Mozambique COLUMBIA RIVER SYSTEM BRIEFING I U.S. Army Corps of Engineers Northwestern Division North Pacific Water Management Portland, Oregon 15-16 October 2001. Physical Settings 4 th largest in North America - PowerPoint PPT Presentation
Citation preview

Visit by Government Officials from Mozambique
COLUMBIA RIVER SYSTEM BRIEFING ICOLUMBIA RIVER SYSTEM BRIEFING I
U.S. Army Corps of Engineers
Northwestern Division
North Pacific Water Management
Portland, Oregon
15-16 October 2001


Physical SettingsPhysical Settings• 4th largest in North America• F= 259,000 mi2 (669,500 km2); 219 in 7 states + 39.5 in Canada• Source in B.C. ; L= 1,214 mi. (1,950 km)• Sub-basins: Upper-C; mid-C; Snake; Willamette •Climate: winter (wet, mild); summer (dry, warm)• Temperature: maritime Jan36-Jul62 (2-17C) to desert (Jan32-Jul76)• Precip: 6 - 180 “(150 – 4600 mm); max. in winter• Snow: 400 “(10,000 mm) in fall - early spring• Evaporation: 35 – 55 “ (900-1,400mm)
•Runoff (Cascade: East=snow; West=rain)•Annual Runoff at The Dalles : Min=78 maf; Ave=134 maf (165xKm3); 189 kcfs (5,400 m3/s); Wet=193 maf• Peak Floods, kcfs (UnReg/Reg): 1948:1,101/1,010; 1972:1,053/618; 1974:1,007/588; STP:1,560/850; PMF:2,720/2,120

Mozambique DataMozambique Data Area: 801,000 km2 (309,000 mi2) ( 1 mi2=2.59 km2)
- Ann.Hydro. n: 2x10⁹ Kwh
- Cahora Bassa Reservoir:
52 x 109 m3 (42.1 maf);
2,070 MW Inst. Cap.
- Cariba Reservoir
(Zimbabwe): 76 maf;
1,300 mw Inst. Cap.
- Zambezi River:
2,740 km (1,700mi)
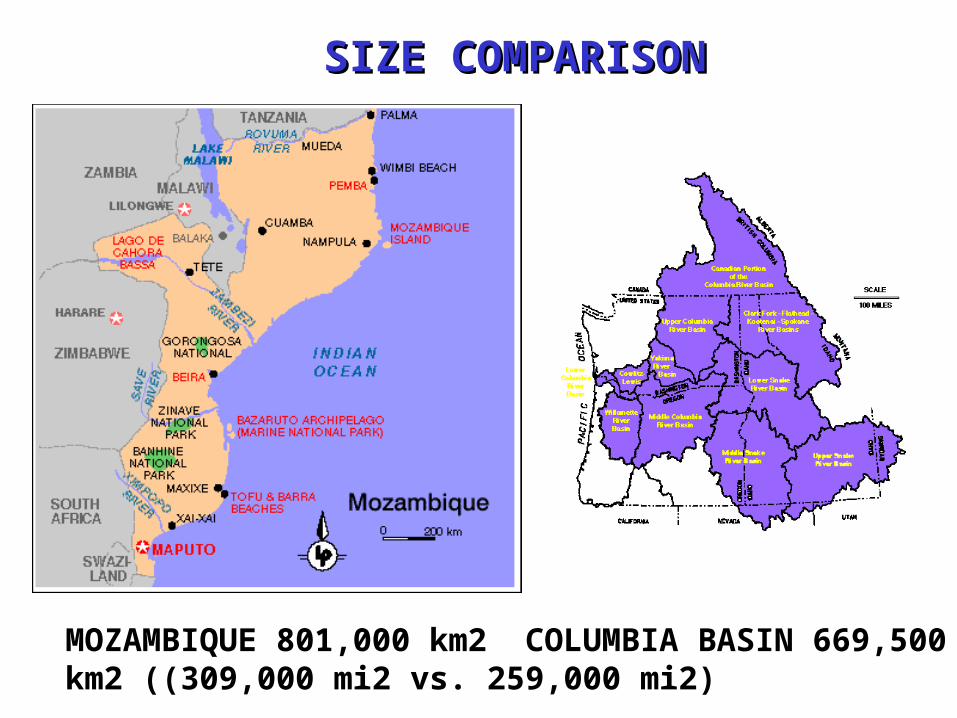
SIZE COMPARISONSIZE COMPARISON
MOZAMBIQUE 801,000 km2 COLUMBIA BASIN 669,500 km2 ((309,000 mi2 vs. 259,000 mi2)

Daily Flows at The DallesDaily Flows at The Dalles

Major Columbia River BenefitsMajor Columbia River BenefitsHYDROPOWER: HYDROPOWER: serves up to 80% of electricity in NW ; inexpensive, renewable, efficient; Al, food processing, plutonium, aerospace, mining
FLOOD CONTROL: FLOOD CONTROL: since ’48, uses 39.7 Maf of storage; winter (rain) and spring/summer (snowmelt+rain) floods; levels; floodwalls, bank protection, land use regulation.
NAVIGATION: NAVIGATION: 17 x 106 tons; 465 mi waterways (106 mi @40’; 359 mi @ 14’); 8 locks, open river channel, year-long navigation
IRRIGATION: IRRIGATION: use 6% ann. runoff; 8x10⁶ acres (33,400 km2); major centers: Grand Coulee/Banks Lake, and Upper Snake
RECREATION: RECREATION: fishing, swimming, camping, water skiing, rafting, boating, sightseeing.
(1 Maf = 1.23 Km3)

Mica (Canadian) 12.0
Arrow (Canadian) 7.4
Duncan (Canadian) 1.4
Libby 5.0
Hungry Horse 3.1
Grand Coulee 5.2
Dworshak 2.0
Others 5.9
Total Useable Storage 42.0 maf
Average Annual Runoff Volume (The Dalles) 134.0 maf
(1 Maf = 1.23 Km3)
Major Columbia ReservoirsMajor Columbia Reservoirs

0
20
40
60
80
100
120
140
160
180
200
Vo
lum
e (M
af)
Annual Runoff Storage
USA
CanadaDry Years (78)
Average Years (134)
Wet Years (193)
Storage Volume vs. RunoffStorage Volume vs. Runoff

Northwest Power SystemNorthwest Power SystemFirm Generating Resources
Resource aMW Percent
Firm Hydro 11,853 56
Coal 5,750 27
Combustion Turbine 2,070 10
Nuclear 880 4
Wind 23 <1
Other 60 <1
Biomass 520 2
Total Resources 21,156 100
Conservation (since 1980) 1,200 (6% of 21,156)

0
1 00
2 00
3 00
4 00
5 00
6 00
Sep Oct Nov Dec Jan Feb Mar Apr May Jun Jul Aug
River FlowElectricity Demand
Flows & Flows & Electricity DemandElectricity Demand

0
50
100
150
200
250
300
350
400
450
500
Sep Oct Nov Dec Jan Feb Mar Apr May Jun Jul Aug
Flo
w (
Kcf
s)
NaturalRegulated
Natural & Natural & RegulatedRegulated Flows Flows

Col. River Basin Water Resources DevelopmentCol. River Basin Water Resources Development Pre-1930’s: single-purpose dams only. Mainstem: Rock Island (1932)
Post 1930’s: first multi-purpose: Bonneville, ‘33; Grand Coulee, ‘35
Bonneville Power Administration to market energy generated (1937)
After World War II: major dams (McNary, Chief Joseph, The Dalles, Hungry Horse)
1950’s: “No new starts”, then John Day (1959), Libby, Dworshak, and Lower Snake dams, and non-Federal dams (after 1956)
1964: Columbia River Treaty and Pacific Northwest Coordination Agreement; NW-SW high voltage transmission
NOTES:
Total Capacity of 75 Corps dams is 20,700 Mw. The 10 largest of those dams (12,000 Mw) are in Northwestern Division.
The Corps is the prime Federal agency in charge of flood control.

US Dams and Canadian Treaty ProjectsUS Dams and Canadian Treaty Projects