Embed Size (px)
Citation preview
VisIt Tutorial
Why are we teaching you VisIt? • Interactive (GUI) Visualization and Analysis tool • Multiplatform, Free and Open Source • The interface looks the same whether you run locally or
remotely, serial or in parallel • Manipulate data or create new data using operators/
expressions • Python scripting interface
Ge#ng VisIt • https://wci.llnl.gov/simulation/computer-codes/visit/
• Binary Distribu3ons • Source Code • Documenta3on/Tutorials/Sample Data

Data Types • Supports a wide variety (over
100) of data types – Structured grids – Unstructured grids – Molecules – Polygonal data – Images – AMR
• Time series support • Reader plug-ins can be
developed for new formats
Visualization Algorithms
• VisIt’s visualization capabilities are grouped into two categories: – Plots are used to visualize data and include
boundary, contour, label, mesh, pseudocolor, scatter, streamline, and others
– Operators consist of operations that can be performed on the data prior to visualization. (Examples include slice, isosurface, threshold among others)
VisIt Test-Drive (demo) Useful reference to VisIt interface and plots:
https://wci.llnl.gov/simulation/computer-codes/visit/manuals
Getting Started
• Download example data file ‘noise.silo’ – https://vis.tacc.utexas.edu/training/ – Right-click, Save link as…
• Open VisIt
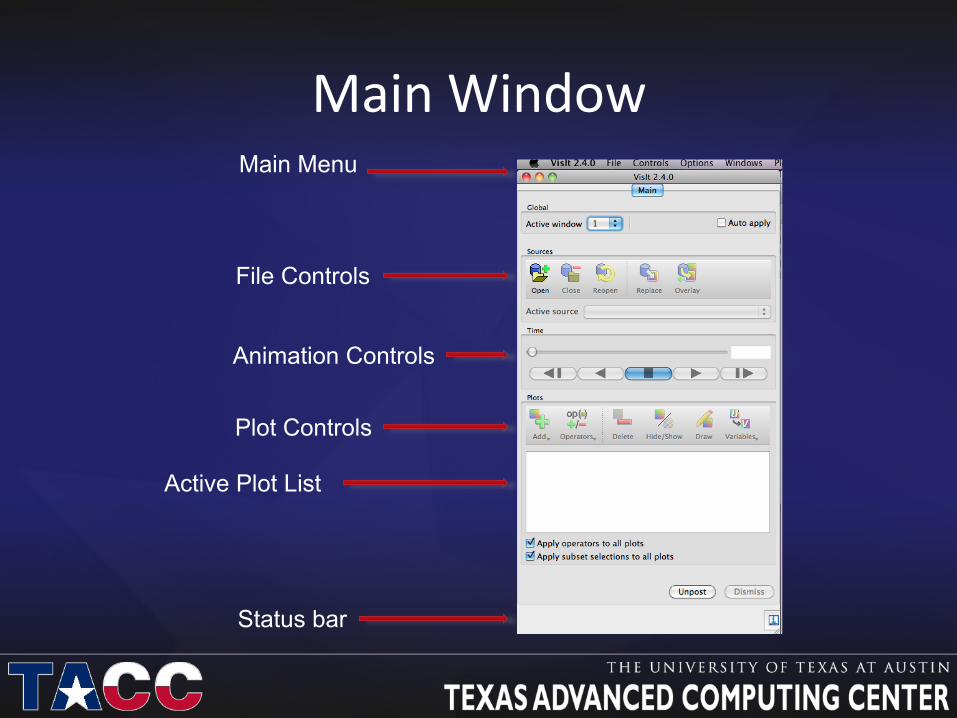
Main Window Main Menu
File Controls
Animation Controls
Plot Controls
Active Plot List
Status bar
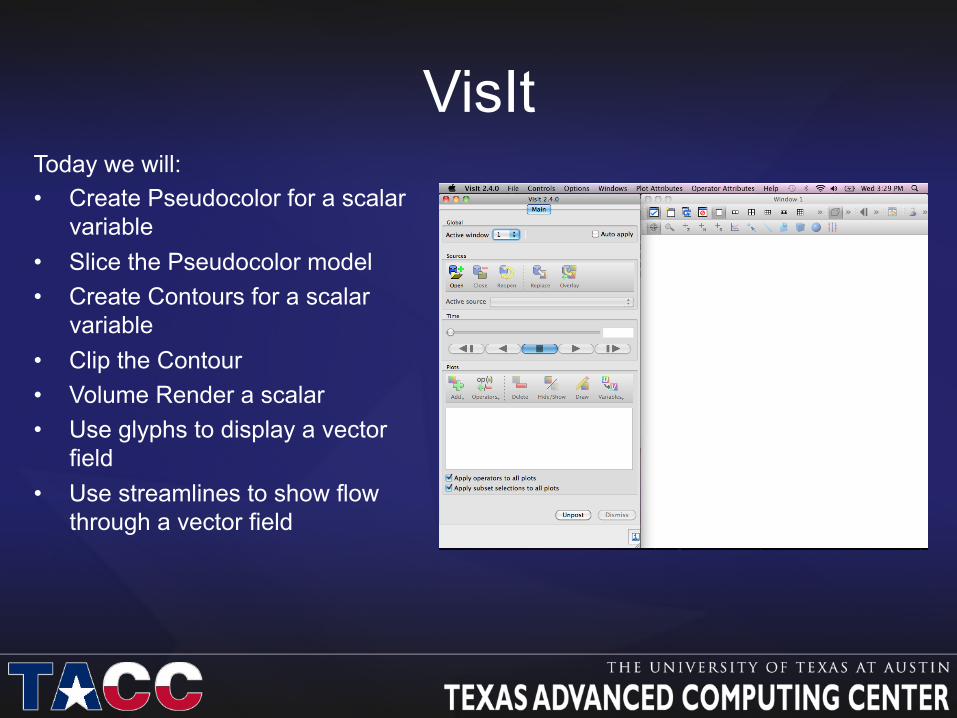
VisIt Today we will: • Create Pseudocolor for a scalar
variable • Slice the Pseudocolor model • Create Contours for a scalar
variable • Clip the Contour • Volume Render a scalar • Use glyphs to display a vector
field • Use streamlines to show flow
through a vector field
VisIt
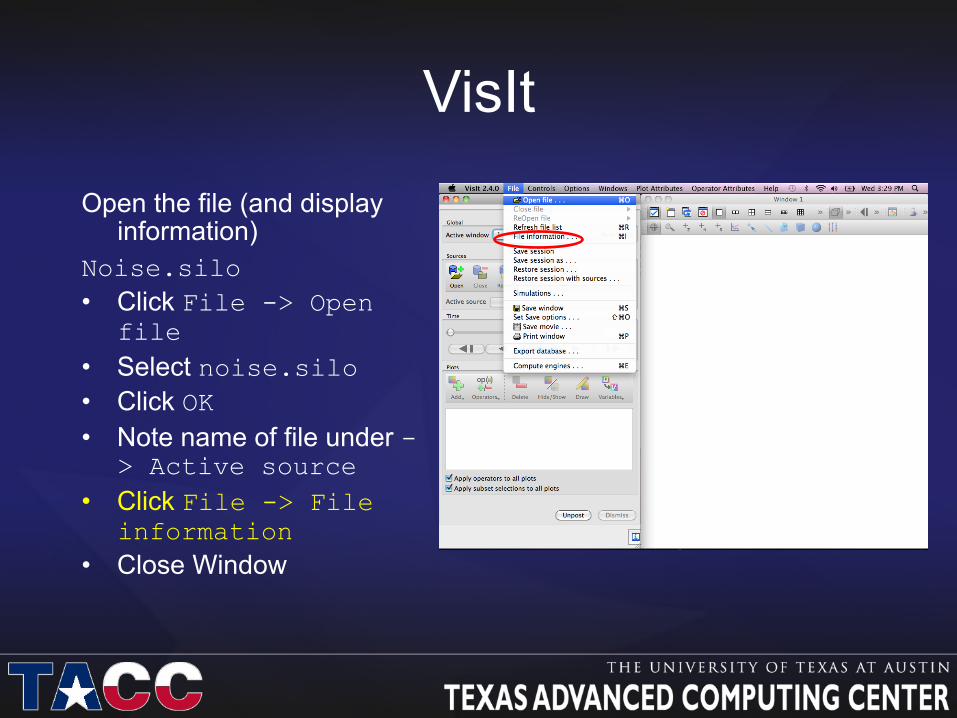
Open the file (and display information)
Noise.silo • Click File -> Open
file • Select noise.silo • Click OK • Note name of file under -
> Active source • Click File -> File
information • Close Window
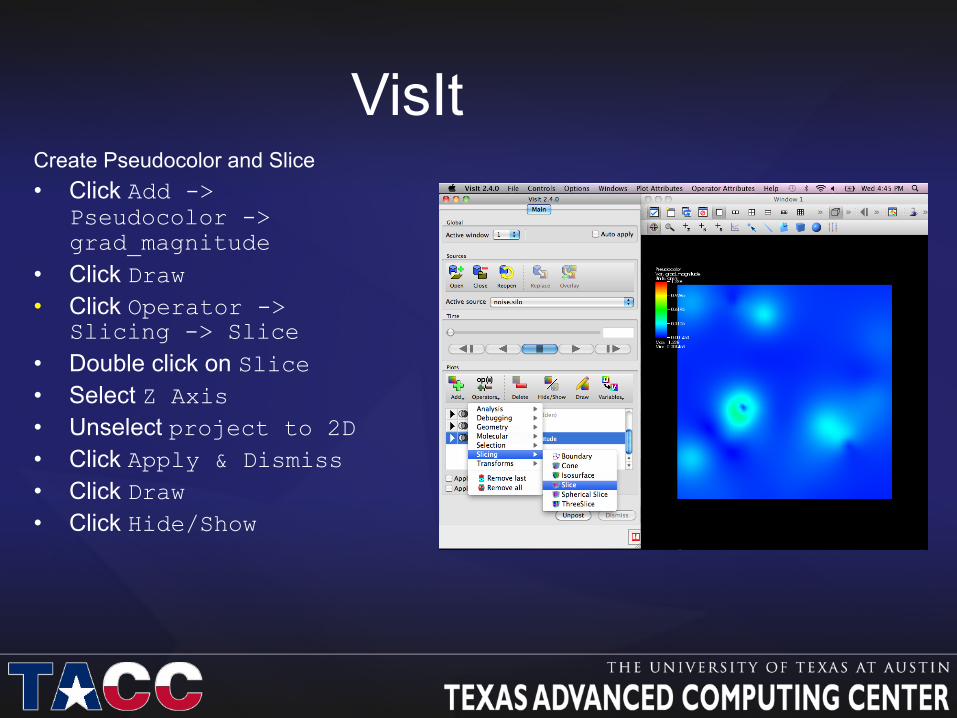
VisIt Create Pseudocolor and Slice • Click Add ->
Pseudocolor -> grad_magnitude
• Click Draw • Click Operator ->
Slicing -> Slice • Double click on Slice • Select Z Axis • Unselect project to 2D • Click Apply & Dismiss • Click Draw • Click Hide/Show
VisIt
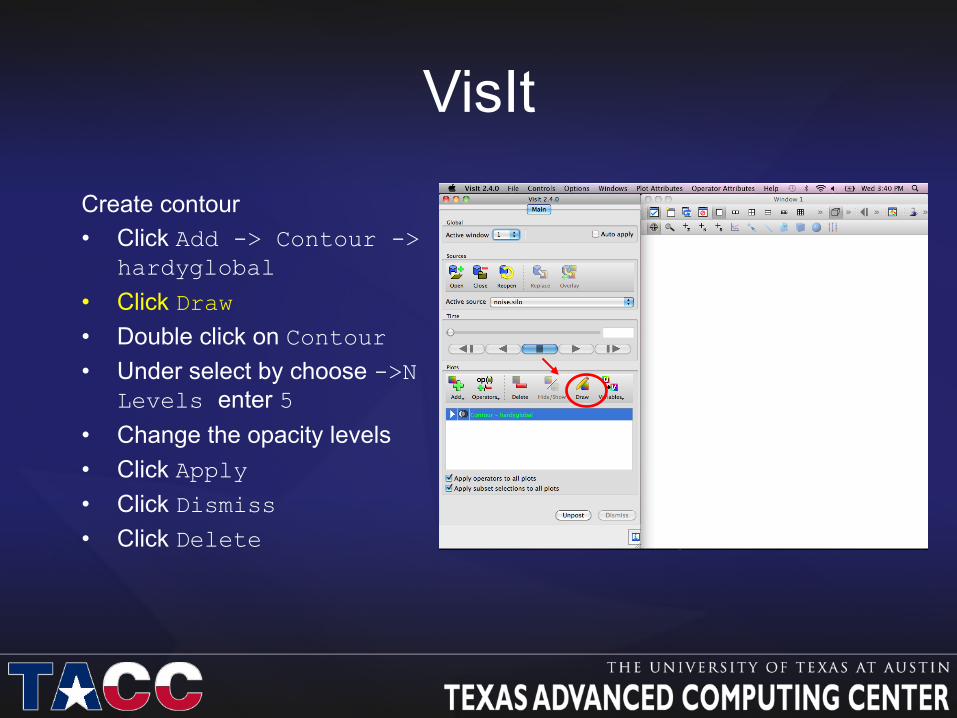
Create contour • Click Add -> Contour ->
hardyglobal
• Click Draw • Double click on Contour • Under select by choose ->N
Levels enter 5 • Change the opacity levels • Click Apply • Click Dismiss • Click Delete
VisIt
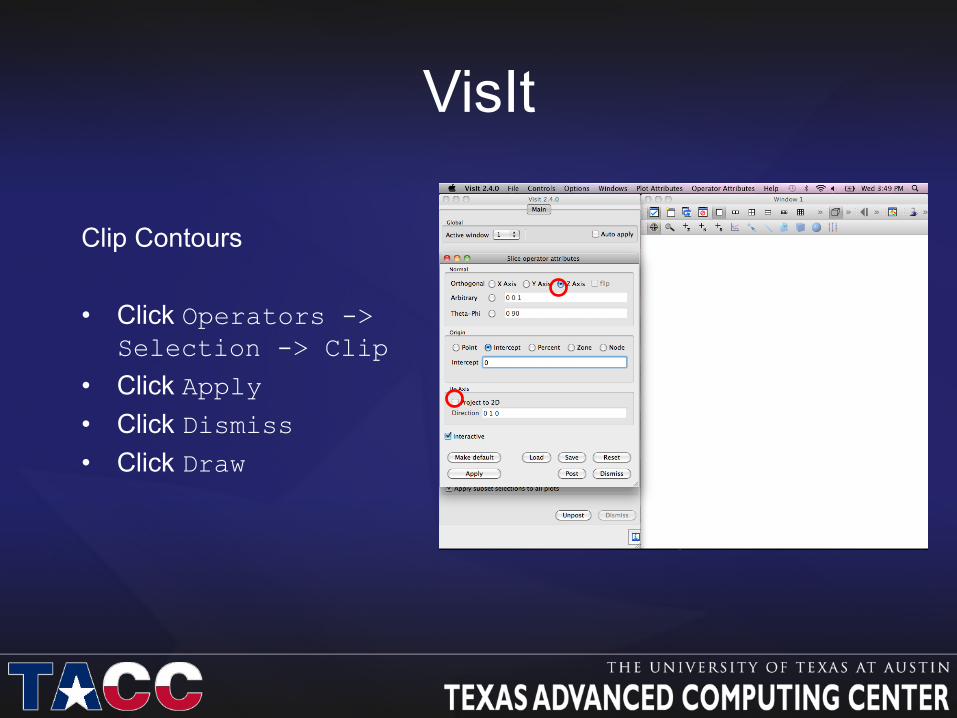
Clip Contours • Click Operators ->
Selection -> Clip
• Click Apply • Click Dismiss • Click Draw
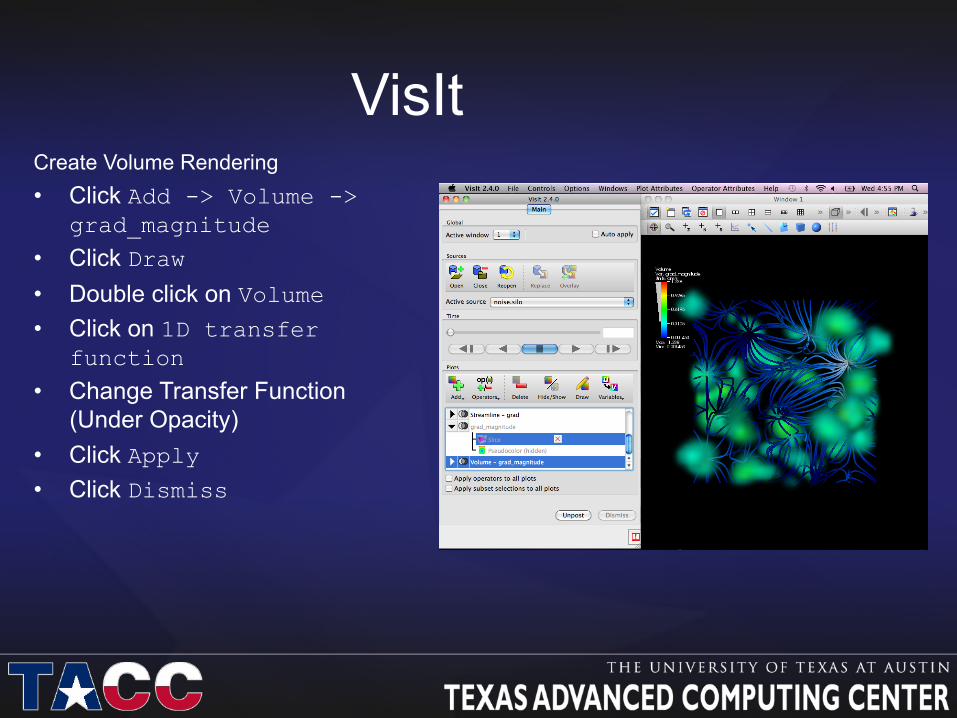
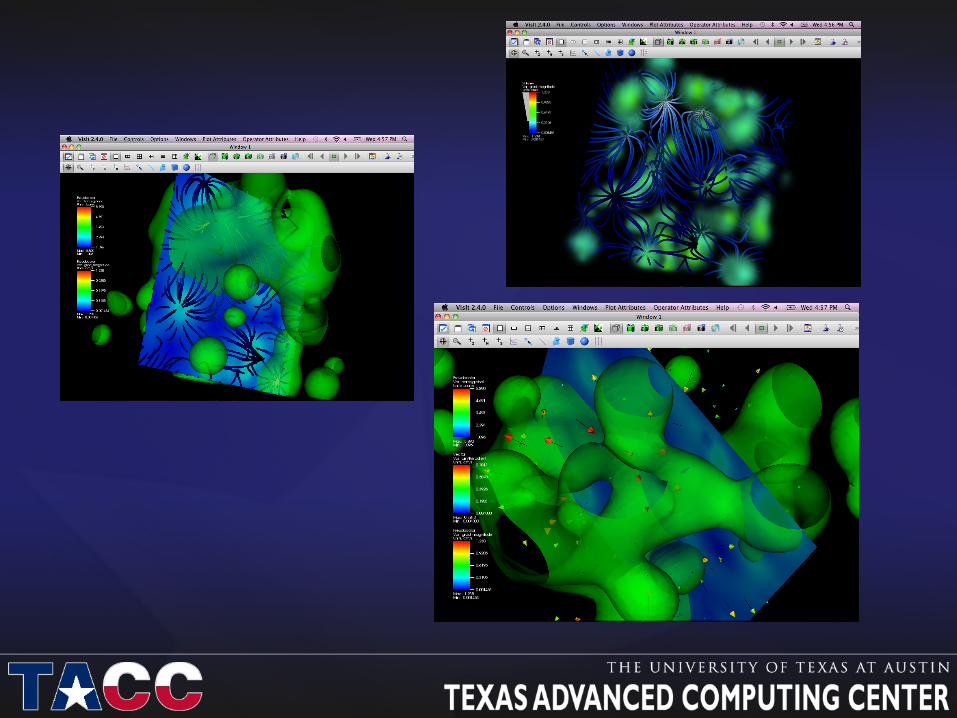
VisIt Create Volume Rendering • Click Add -> Volume ->
grad_magnitude • Click Draw • Double click on Volume • Click on 1D transfer
function • Change Transfer Function
(Under Opacity) • Click Apply • Click Dismiss
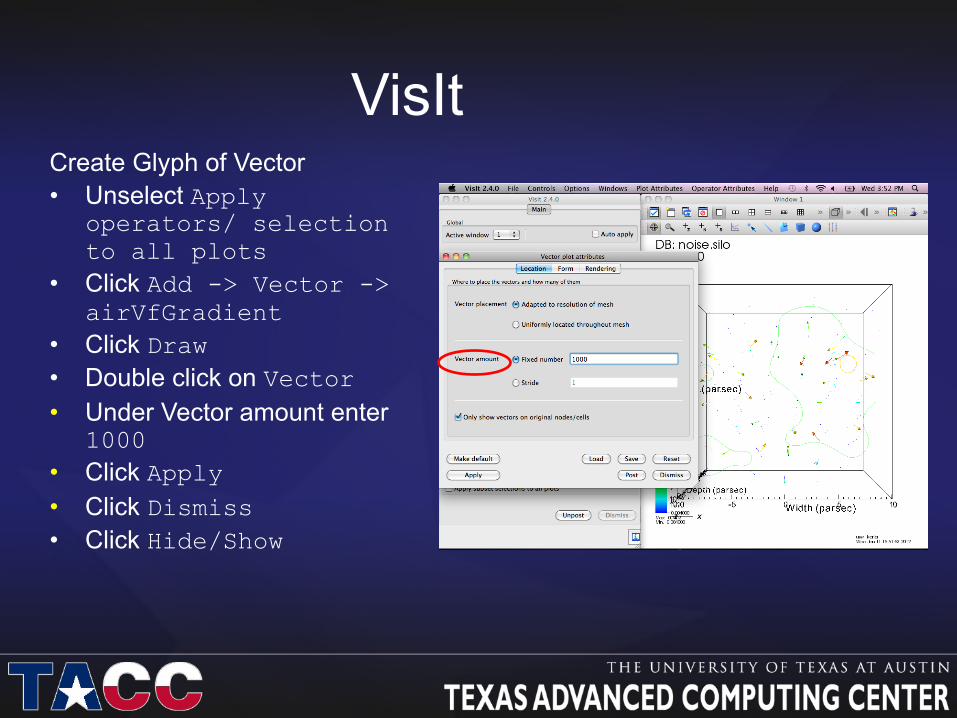
VisIt Create Glyph of Vector • Unselect Apply
operators/ selection to all plots
• Click Add -> Vector -> airVfGradient
• Click Draw • Double click on Vector • Under Vector amount enter
1000 • Click Apply • Click Dismiss • Click Hide/Show
VisIt
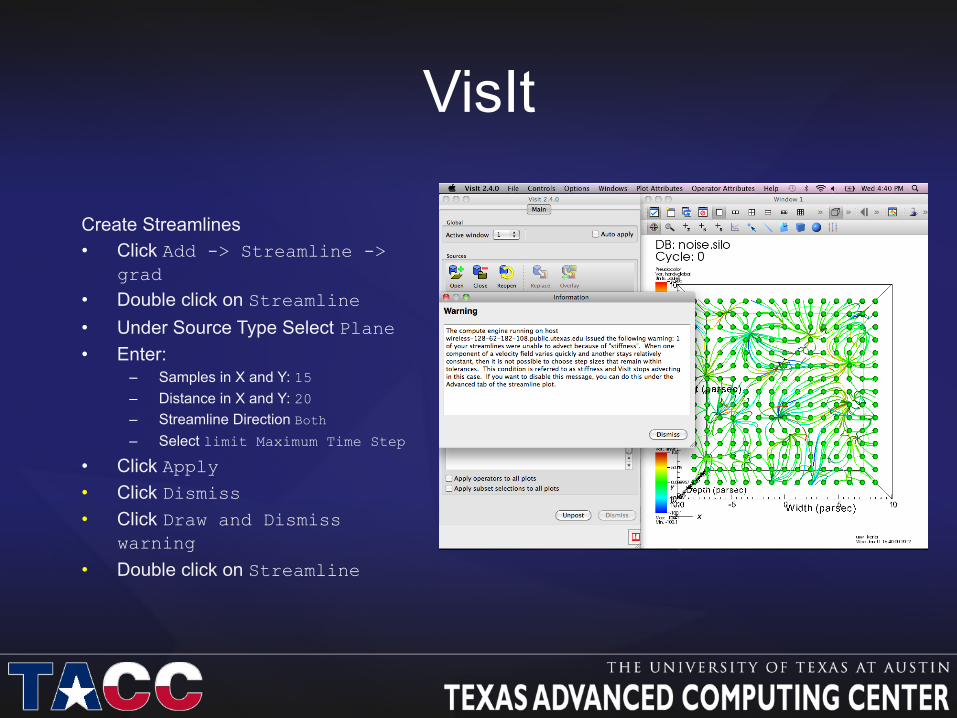
Create Streamlines • Click Add -> Streamline ->
grad • Double click on Streamline • Under Source Type Select Plane • Enter:
– Samples in X and Y: 15 – Distance in X and Y: 20 – Streamline Direction Both – Select limit Maximum Time Step
• Click Apply • Click Dismiss • Click Draw and Dismiss
warning
• Double click on Streamline
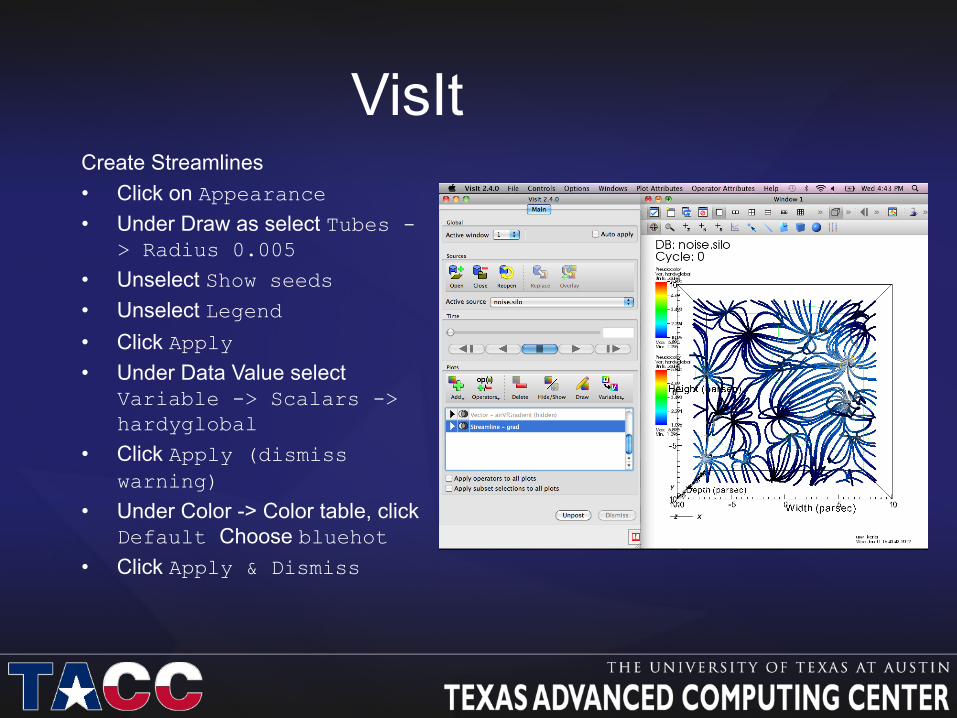
VisIt Create Streamlines • Click on Appearance • Under Draw as select Tubes -
> Radius 0.005
• Unselect Show seeds • Unselect Legend • Click Apply • Under Data Value select
Variable -> Scalars -> hardyglobal
• Click Apply (dismiss warning)
• Under Color -> Color table, click Default Choose bluehot
• Click Apply & Dismiss
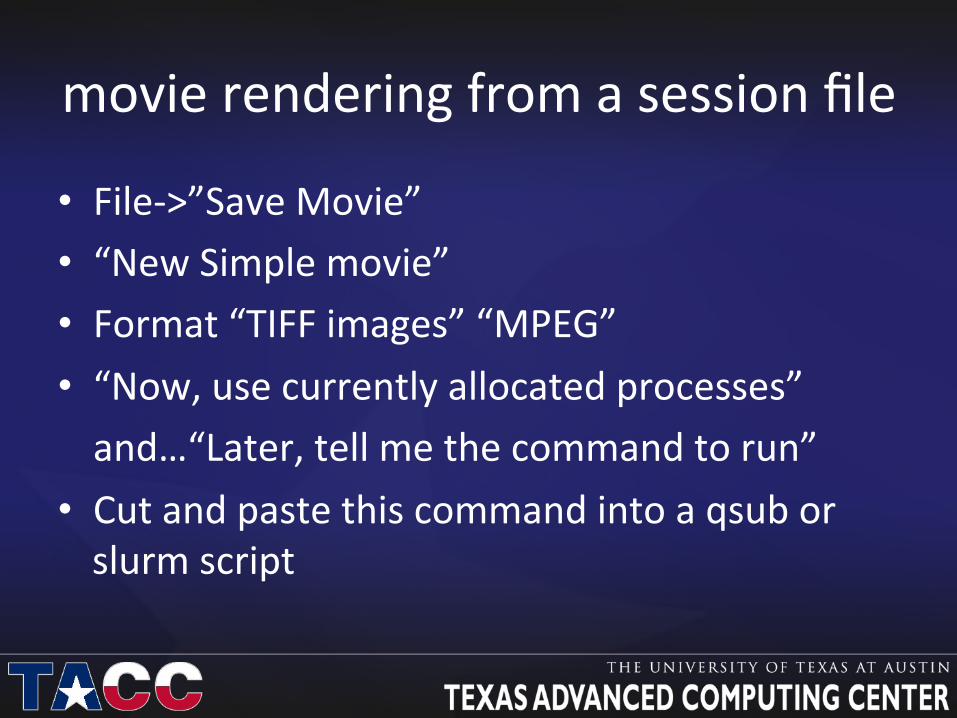
movie rendering from a session file
• File-‐>”Save Movie” • “New Simple movie” • Format “TIFF images” “MPEG” • “Now, use currently allocated processes” and…“Later, tell me the command to run”
• Cut and paste this command into a qsub or slurm script
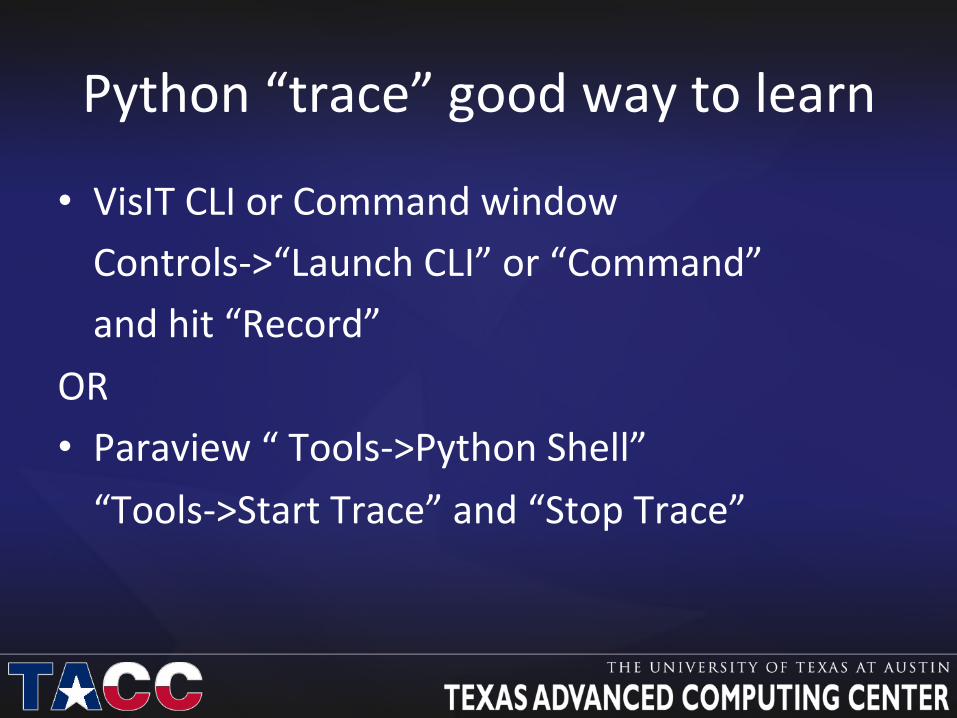
Python “trace” good way to learn
• VisIT CLI or Command window Controls-‐>“Launch CLI” or “Command” and hit “Record”
OR • Paraview “ Tools-‐>Python Shell” “Tools-‐>Start Trace” and “Stop Trace”
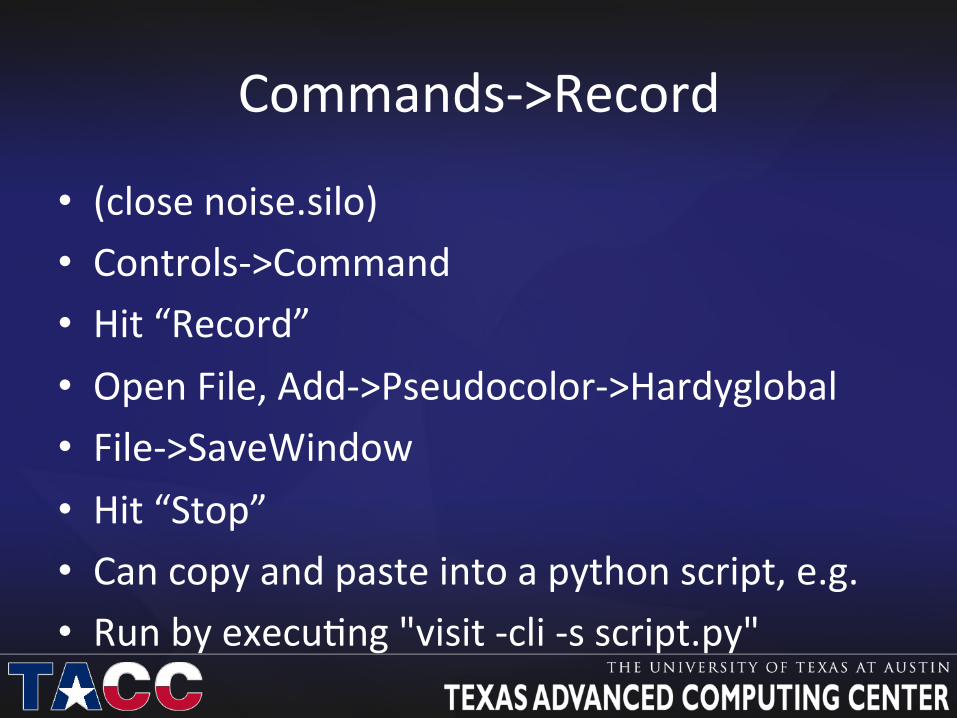
Commands-‐>Record
• (close noise.silo) • Controls-‐>Command • Hit “Record” • Open File, Add-‐>Pseudocolor-‐>Hardyglobal • File-‐>SaveWindow • Hit “Stop” • Can copy and paste into a python script, e.g. • Run by execu3ng "visit -‐cli -‐s script.py"
Questions?
• More tutorials available: – https://wci.llnl.gov/simulation/computer-codes/
visit/manuals
• More information: – www.visitusers.org
• More help: – Visit User mailing list: [email protected]