Embed Size (px)
Citation preview

Visitation Forecasting and Predicting Use ofNPS Parks and Visitor Centers:
Focus Group Report
James H. GramannVisiting Chief Social Scientist
National Park Service Social Science Program
August 2003
NPS SOCIAL SCIENCE PROGRAM
Visitation Forecasting and Predicting Use of NPS Parks and Visitor Centers 2
Executive Summary
On March 12, 2003 a focus group organized by the NPS Park Planning and Special Studies Program andthe NPS Social Science Program met at Turkey Run Park on the George Washington Memorial Parkway.The purpose of the meeting was to assist the NPS in planning visitor centers and related projects thatare cost-effective and of appropriate scope and size. The focus group provided information on trendsin visitation forecasting and recreation and tourism demand modeling that could inform the planningand design of visitor centers and other park facilities.
Group participants discussed ways in which qualitative and quantitative approaches to forecastingpopulation change and participation in recreation and tourism activities could be applied to predict useof parks and visitor centers up to 20 years into the future. Key points from the discussion include:
C Little change has occurred in the past 50 years in the fundamental approaches to populationforecasting; however, the data used in forecasting models has been refined. For example,information on race and ethnicity has become more detailed, and forecasting population changecan be done for smaller geographic areas due to developments in GIS and related databases.
C For projections of visitation two to three years into the future, trend line extensions often workwell and can be locality-specific.
C Qualitative methods are best for long-term forecasts of park or visitor center use. One approachis to develop alternative scenarios on a large scale, e.g., based on lifestyle or environmentalchanges, and consider how these might affect visitation in the future. Delphi panels and cross-impact simulations are two methods for doing this.
C In long-term forecasting and planning, one strategy is to work actively to shape the future,rather than wait for it to occur. For example, in “normative forecasting” a desirable futurecondition is defined and the sequence of steps to achieve it described.
C The amount of visitation a site receives can be influenced by marketing; this will determine thenumber of visitors to a location more than demographics will.
C The most important key to forecasting park visitation and use of visitor facilities is continuousresearch that tracks trends in who visitors are and correlates these with factors known to affectvisitation and facility use.
1NPS internal discussion paper, “General management plans and visitor facilities,” December 7, 2001.
Visitation Forecasting and Predicting Use of NPS Parks and Visitor Centers 3
Visitation Forecasting and Predicting Use of NPS Parks and Visitor Centers:
Focus Group Report
James H. GramannVisiting Chief Social Scientist
National Park Service Social Science Program
Introduction
This report describes the results of a focus group conducted for the Park Planning and Special StudiesProgram of the National Park Service (NPS). The purpose of the focus group was to assist the NPS inplanning visitor centers and related projects that are cost-effective and of appropriate scope and size.More specifically, the focus group provided information on the state of the art in visitation forecastingand demand modeling related to recreation, heritage tourism, and the use of associated visitor facilitiesin the National Park System.
BackgroundThe House Appropriations Committee Report for FY 2002 expressed concern about the cost and sizeof proposed visitor centers, heritage centers, and environmental education centers in some nationalparks.1 The committee asserted that several recent proposals for visitor facilities were unacceptablebecause they were predicated on unrealistic increases in visitation and staff. These concerns wererepeated in the conference committee report, specifically asserting that NPS General Management Plans(GMPs) tended to include oversized buildings and other projects that were not essential to the missionsof the parks.
According to a review by the NPS, plans that appear to have attracted the committee’s attention werethose for parks with relatively small annual visitation coupled with what seemed to be costly new visitorfacilities. Examples included Homestead National Monument, Grand Portage National Monument, andWashita National Battlefield. In response, the NPS Park Planning and Special Studies Program developeda series of actions that could be taken to examine the committee’s concerns. Two of these were:
C Analyze the role of visitor facilities in light of the NPS mission, emerging technologies, andchanging functions in education, interpretation, and orientation.
C Evaluate the accuracy of past visitation projections in GMPs, and prepare guidelines on effectivevisitation forecasting methodologies.
Visitation Forecasting and Predicting Use of NPS Parks and Visitor Centers 4
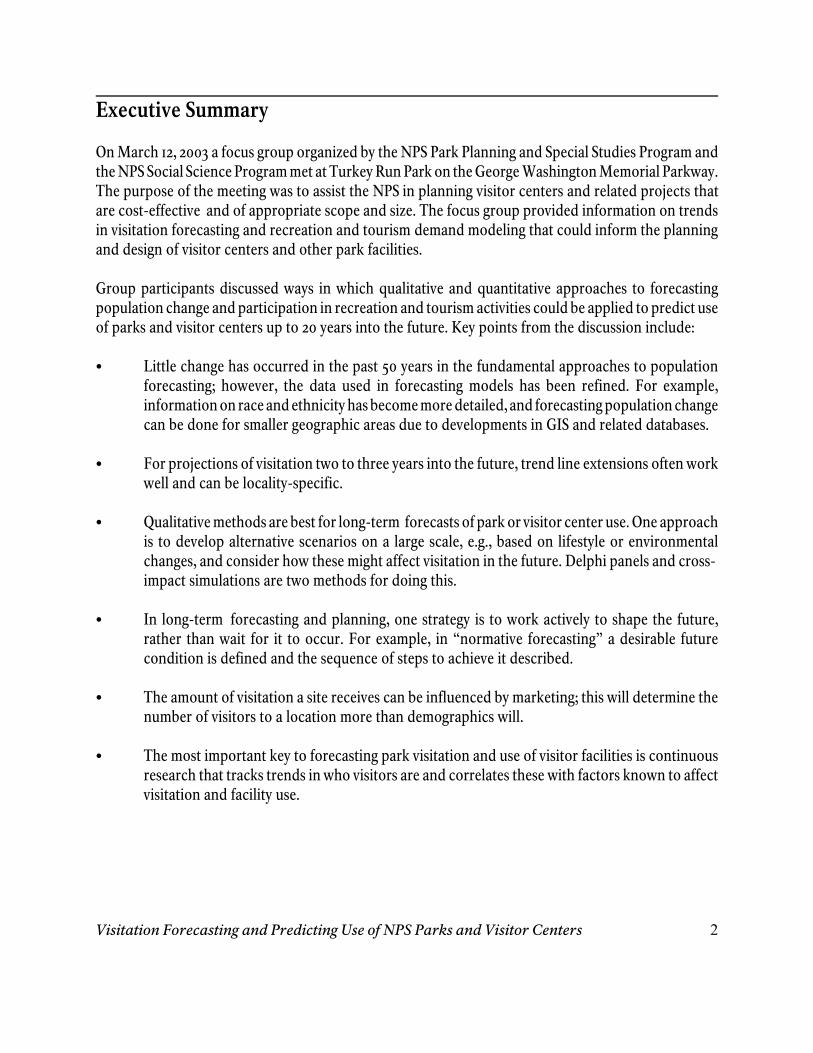
Figure 1 Visitation-forecasting focus group, TurkeyRun Park, March 12, 2003.
The focus group described in this report is one measure taken to address the second of these twoactions. A separate report, “Trends in Demographic and Information Technology Affecting VisitorCenter Use,” addresses the first action.
Focus-group PlanningThe focus group on visitation forecasting was organized in consultation with a professional facilitatorexperienced in NPS planning issues. Participants in the focus group were identified by the NPS VisitingChief Social Scientist with the approval of the Chief of Planning. Those recruited either had nationalreputations for their work in population forecasting and demand modeling, or were recommended bysuch individuals.
Population forecasters employ qualitative and quantitative techniques to predict population changes ina region. The qualitative methods used in population forecasting directly incorporate human judgmentinto projections, while the quantitative methods employ mathematical models. The focus group includedexperts in population forecasting because change in the regional population around a park is one driverof visitation. The second group of participants were those with expertise in recreation and tourismdemand modeling. Demand modelers use statistical methods to describe which types of residents in aregion’s population tend to be park-goers and participate in particular recreation activities. (See theappendix for a list of participants.)
MethodThe visitation-forecasting focus group met atTurkey Run Park on the George WashingtonMemorial Parkway on March 12, 2003.Members were sent a detailed guide beforethe meeting which included an agenda and alist of questions to be discussed. During thesession, the facilitator led the participantsthrough the guide, focusing on each questionin turn. Participants were asked to considerforecasting up to 20 years into the future, thetime frame typical of a park’s GMP. Theoverall approach was to begin with broadtrends and developments in regionalforecasting and demand modeling and thenturn to the problem of visitation forecasting at a smaller spatial scale, i.e., parks and facilities withinparks. To help direct the latter discussion, participants visited Great Falls Park, a nearby NPS unit innorthern Virginia. This visit included an evaluation of the park’s visitor center and a discussion withpark staff about current visitation and use of park facilities.
2Billson, J.M. 2003. The power of focus groups - A training manual. Barrington, RI: Skywood Press.
Visitation Forecasting and Predicting Use of NPS Parks and Visitor Centers 5
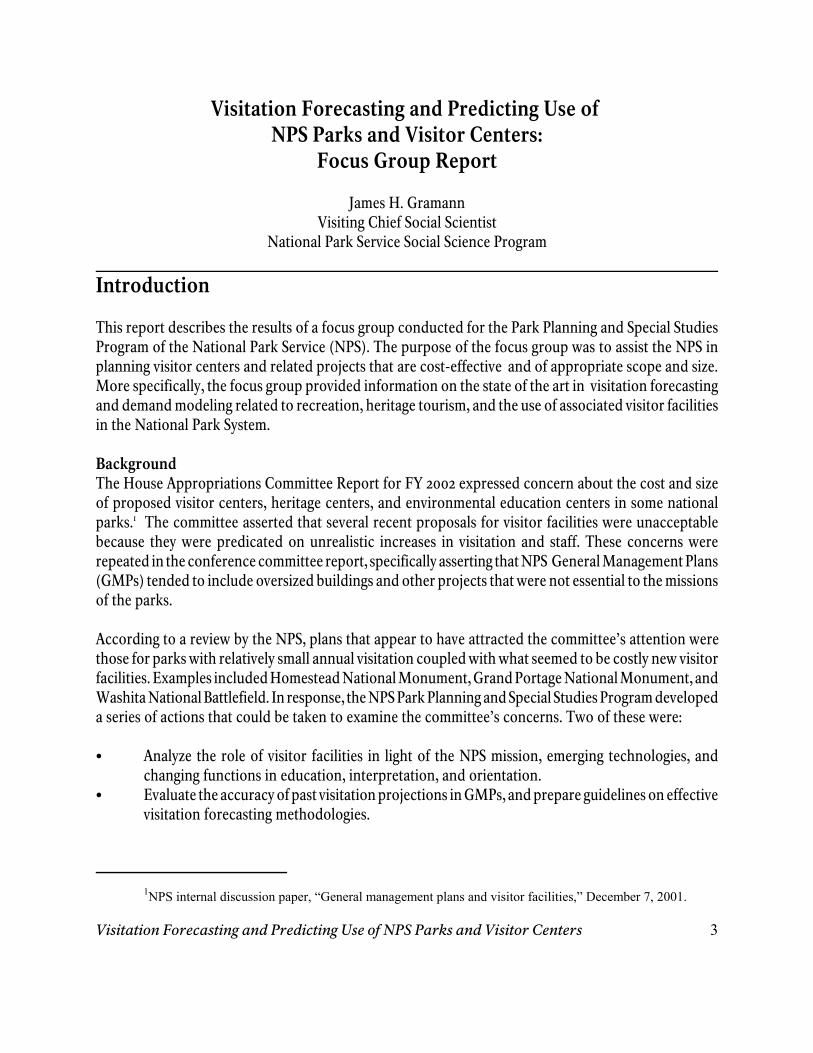
Figure 2 Visitation-forecasting focus group.
Comments made by participants during the focus group were recorded on flip charts. In line with thefacilitator’s preference, no other recording method was used.
Following the group discussion, the facilitator compiled the comments. These were reviewed by theSocial Science Program and the Park Planning and Special Studies Program. In addition, the notes weresent to all participants for their review. Clarifications were incorporated into the notes. Additionalcomments were recorded separately.
It is important to understand what focus groups can and cannot do. Focus groups do not providecomprehensive information on a subject, suchas visitation forecasting or demand modeling.Other review methods are more suited to thattask. Nor are focus groups designed to help agroup reach a consensus or make decisions.Instead, focus groups elicit the full range ofparticipants’ ideas, experiences, and opinionson a selected topic.2 Through facilitated,focused interaction, members provide a wealthof qualitative data not typically available fromsurveys, and group members stimulate eachother with an exchange of ideas not possible inindividual interviews.
Presentation of ResultsThe results of the visitation-forecasting focus group are presented in three sections:
C State of the art in forecasting population change and modeling recreation and heritage tourismdemand.
C Implications of the state of the art for predicting use of NPS parks and visitor centers.C General implications for the NPS.
Each of the sections is prefaced with a synopsis of principal questions asked during the discussion.Following this, sub- topics are introduced with bold- faced titles, and brief background paragraphs placethe participants’ discussion in the larger context of forecasting and modeling. Specific comments arethen detailed in bullet statements drawn from the facilitator’s notes. This allows for a broad synthesisof the discussion, while also preserving insights of focus-group participants that illustrate the synthesis.
Visitation Forecasting and Predicting Use of NPS Parks and Visitor Centers 6
State of the Art in Forecasting Population Change and Modeling Recreationand Heritage Tourism Demand
SynopsisImportant trends and new developments in forecasting population change and change in recreation andheritage tourism activity:C There have been few new developments in population forecasting in the last 50 years.Ways population change can be forecast effectively:C When forecasting population change, three sub-populations are relevant: permanent residents,
seasonal residents, and transients.C Forecasting population change at smaller spatial scales, such as states and counties, presents
more problems than forecasting at a national level. Ways recreation organizations can effectively forecast visitation or tourism and recreation activity:C For projections two to three years into the future, time-series or trend line extensions usually
work well and can be locality-specific.C For long-term projections, qualitative forecasting methods are often more appropriate than
quantitative ones.C The type of area and facility visited must be considered in projecting visitation.C When forecasting participation in recreation activities (rather than visits to locations),
projections based on demographic change have been of limited accuracy. C The Army Corps of Engineers is looking at spatial trends in visitation and analyzing them with
respect to demographic trends.C The gap between site- specific forecasts and national forecasts could be reduced if more
information were collected regularly from visitors.C Blips in recreation and tourism participation can be forecast if their causes are known.C The tourism industry through the Travel Industry Association uses county-level data in
projecting tourism demand and arrivals at travel destinations.Ways use of a single facility can be effectively forecast:C For facilities with a history of use, changes in ease of access, in the market for the facility, and
in the mix of products offered by it can all affect future use and should be considered inforecasts.
C For new facilities without a previous history of use, both qualitative and quantitativecomparisons with similar facilities can be used to forecast visitation.
Other ways to forecast visitation not linked to population forecasts:C Surveys of travel intentions, trends in recreation equipment sales, and projections of community
growth patterns are all used to predict tourism travel and recreation participation.
What Are Some of the Important Trends and New Developments in Forecasting PopulationChange and Change in Recreation and Heritage Tourism Activity?The focus group opened with a discussion of current trends in population forecasting and recreationand tourism demand modeling. This was done because most visits to NPS units occur in the context of
3US Department of Transportation. (2001). Population forecasting methods: A report on estimating andforecasting methods. http://tmip.fhwa.dot.gov/clearinghouse/docs/landuse/pfm/ch1.stm
Visitation Forecasting and Predicting Use of NPS Parks and Visitor Centers 7
Forecasting can be done for smaller andsmaller areas. Because of GIS and newdatabases, geographic detail is more precise.
recreational outings, including heritage tourism. Focus- group members discussed both populationforecasting and estimates. Forecasts are projections of change into the future. Estimates are informedappraisals of current (or past) populations in the absence of actual counts.
There have been few new developments in population forecasting in the last 50 years:C Little change has occurred in how population estimators think about forecasting. However, there
has been some refinement of the data used for forecasting and estimating population.C The US Census Bureau cooperates with the Internal Revenue Service and with Medicare, which
has helped it refine its data, but this doesn’t represent change in the underlying way forecastsand estimates are calculated.
C Data on race has become more detailed – population forecasts are being made for an increasingnumber of racial and ethnic categories.
C Forecasting can be done for smaller andsmaller areas. Because of GIS and newdatabases, geographic detail is moreprecise.
C The frequency of population estimates isalso increasing. The Census Bureau is nowredoing its estimates every two years. In retail and commerce, estimates of the size andcharacteristics of market populations are redone annually.
In What Ways Can Population Change Be Forecast Effectively?Three demographic factors affect whether the population of an area increases, decreases, or remainsstable over time. These are fertility rate, mortality rate, and migration in and out of the region (netmigration).3 Population forecasts start with the current number of people living in an area, then projectfertility, mortality, and net migration rates to arrive at a future population. The US Census Bureauprojects the size and composition of the US population 100 years into the future using high-, low-, andmid- range forecasts. These variants incorporate different assumptions about changes in birth, death,and migration rates. In most cases, fertility and mortality rates are relatively predictable, especially overthe short or medium term. Net migration is less so and tends to be influenced by factors not consideredin demographic forecasting models, such as seasonal cycles, economic fluctuations, and geopoliticalfactors that influence the movement of populations. Migration can be permanent or seasonal. Seasonalmigration is characteristic of campus communities, retirement counties, and recreation- dependentregions, including those surrounding many NPS units. Focus- group participants commented on thecurrent state of the art in population forecasting, and on the challenge of doing usable state- andcounty-level projections of populations.
4Johnson, K. & Beale, C. 2002. Nonmetro recreation counties – Their identification and rapid growth.Rural America 17(4):12-19.
Visitation Forecasting and Predicting Use of NPS Parks and Visitor Centers 8
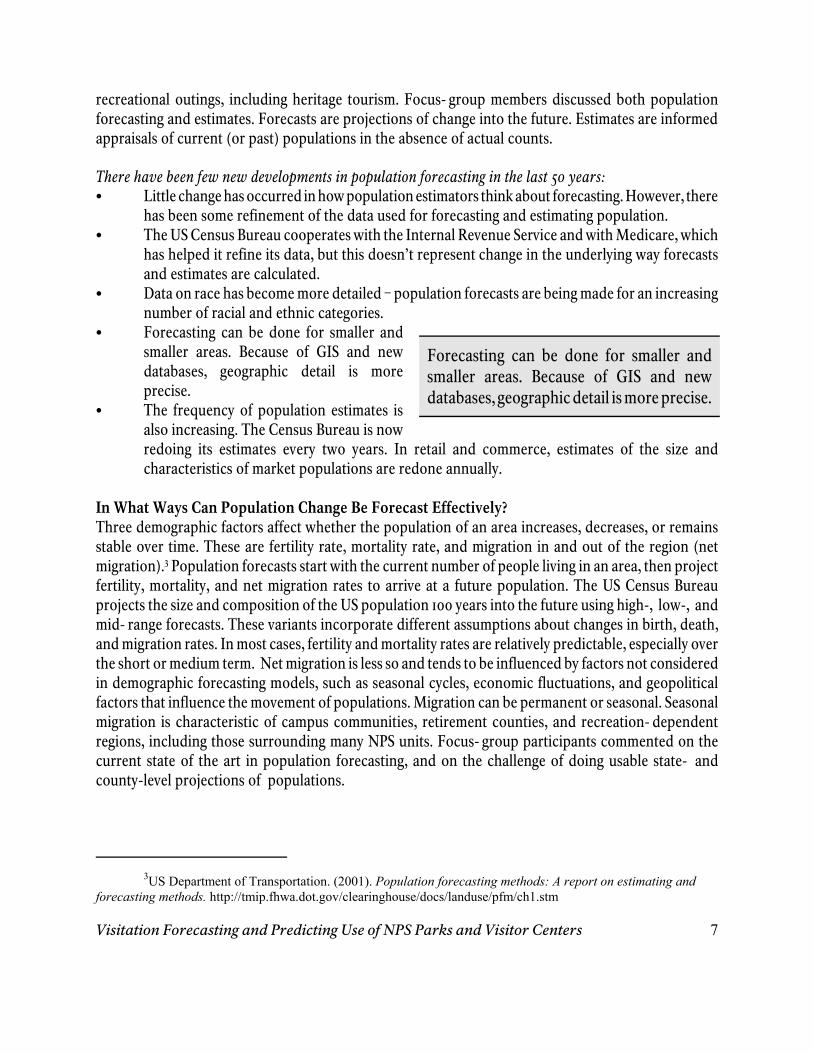
Figure 3. Non-metropolitan recreation counties in the US (Johnsonand Beale, op. cit.).
When forecasting population change, three sub-populations are relevant: permanent residents, seasonalresidents, and transients (i.e., people who don’t live either temporarily or permanently in an area):C For the resident population, census data provides a good basis for projections.C The Census Bureau has not done a good job of counting seasonal and transient populations, but
this is changing for seasonal residents. The Census Bureau’s American Community Survey is anew canvassing of 3 million households per year. The 2003 survey includes a question asking ifresidents are staying at their address because it is a seasonal or vacation address.
C Internal migration (population movement within the boundaries of a nation or region) is thebiggest component of population change, but predicting migration rates is the weakest link inpopulation forecasting. However, if it were known, the number of seasonal residents could bea good predictor of migration rates in many areas.
C The smallest practicable unit for considering migration in population forecasts is the county ormetropolitan area. Below this, migration cannot be factored in as well.
C One way to characterize areas at the county level is by migration patterns. Counties in whichrecreation or tourism are important to the economy can be identified by their migrationpatterns. Maps exist showing recreation and tourism- dependent counties in the non-metropolitan US (Figure 3).4
Visitation Forecasting and Predicting Use of NPS Parks and Visitor Centers 9
Forecasting population change at smaller spatial scales, such as states and counties, presents more problemsthan forecasting at a national level:C The Census Bureau produces state population projections and does a good job where population
is changing slowly. States with explosive growth (e.g., Nevada) are more difficult to forecast.C One problem with state-level Census Bureau projections is that the approach is purely
demographic, e.g., based on birth rates, death rates, and net migration rates. No effort is madeto incorporate the influence of economic swings on population change.
C The Census Bureau does not project population change at the county level. This is left to theindividual states. Therefore, the method of forecasting at the county level is not standardized.
C Each state has a data center that works cooperatively with the Census Bureau to do county-levelforecasts and other population analyses. Individual state demographers are more familiar withtheir states than is the Census Bureau.
C Commercially produced population estimates and projections are available. Woods and Pooleand NPA Data Services use similar methods, combining economic data from the Bureau ofEconomic Analysis with a population- cohort model. These include estimates and projectionsdown to the county and metropolitan level, but few analysts are working on them.
In What Ways Can Recreation Organizations Effectively Forecast Visitation or Tourism andRecreation Activity?For visitation forecasts two to three years ahead, simple trend line extensions often work well. However,in long-term forecasting, qualitative approaches based on expert judgement, or a combination ofjudgment and quantitative methods, is more appropriate. A factor that is often ignored in forecastingis the power of marketing to influence consumer choice. The future does not simply happen; in manycases it can be influenced toward specific end-goals by marketing and education. More attention hasbeen given to forecasting participation in different recreation activities than to forecasting visits tospecific locations. For example, modeling activity participation and forecasting future participationbased on the demographic characteristics is a major component of many statewide comprehensiveoutdoor recreation plans. However, the explanatory power of demographic models is usually low, rarelyaccounting for more than 30 percent of the variance in current participation, making their utility forlong-term forecasts questionable. One area in which locality-based forecasts are made is tourismdemand modeling, where travel to specific destinations is predicted based on such factors as surveys oftravel intentions, population size at points of origin, distance to destinations, destination attractiveness,and macro-economic trends. Even in this case, projections vary in their accuracy, with short- termforecasts generally being more accurate than long-term predictions of visitor behavior.
For projections two to three years into the future, time- series or trend line extensions usually work welland can be locality-specific:C Trend-line extensions can show good short-term forecasts if visitation data is captured
regularly.
Visitation Forecasting and Predicting Use of NPS Parks and Visitor Centers 10
Two- or three-year forecasts off a time-series trend often work well and can bedone at the park or facility level.
C Two- or three-year forecasts off a time-series trend often work well and can be done at the parkor facility level. However, it is risky to push this kind of forecast out to 20 years. The confidencelevel is very low.
C In time- series data, sometimes the total useis stable, but the mix of users changes. Time-series projections are for the number ofvisitors, not the mix, so they don’t predictchanges in the composition of the visitorpopulation.
For long-term projections, qualitative forecasting methods based on expert judgment are often moreappropriate than quantitative ones:C One qualitative approach to long- term forecasting is to develop future scenarios on a large scale,
e.g., based on lifestyle or environmental changes, and consider how these might affect visitation.A Delphi panel could be used to assess which of the scenarios are most likely.
C For long-term forecasts it’s best to look ahead at five- or ten-year intervals.C One problem with qualitative forecasting is that often the participants are processing the same
information, but the world is always changing. Good qualitative approaches involve people witha wide range of expertise and knowledge.
C Some approaches to long- term forecasting, such as cross- impact simulation, quantify expertjudgments about important trends and how the elements of a system interact. These simulationmodels can be used to perform policy experiments that evaluate what happens when a chosenaction ripples through the system.
The type of area and facility visited must be considered in projecting visitation:C Facilities that are designed for repeat visitors will be affected differently by changes in the local
population than facilities that are designed for one- time visitors or those who travel from distantorigin points.
C Non-local use of a facility is generally higher if it is located near a major interstate. For example,Corps of Engineers campgrounds near an interstate receive a lot of non-local use.
C Ideally, several projection models would be developed based on site characteristics: one forurban vs. rural sites, a site-age model, and models distinguishing other characteristics of sites,such as size and types of facilities.
When forecasting participation in recreation activities (rather than visits to locations), projections basedon demographic change have been of limited accuracy: C The traditional approach to forecasting recreation demand is to take population data and
establish a visitation or participation rate, assuming that if the population doubles then thevisitation or participation will double.
C This approach can be refined by breaking the population down into different cohorts based ondemographic characteristics, such as age or race, and projecting separately for each cohort.
Visitation Forecasting and Predicting Use of NPS Parks and Visitor Centers 11
The amount of use a site receives can beaffected by marketing; promotion andpricing influence participation and visitornumbers more than demographics do.
C However, one reason forecasts of recreation and tourism demand based on demographic changedon’t work well is that participation rates in some activities are so small that it leads to too mucherror in the process. When participation rates are two percent plus or minus two percent,forecasts can’t be very accurate.
C Another reason for the limited success of demographic- based projections is that the relationshipbetween demographic characteristics and activity-participation rates may not remain constant,especially over the long-term.
C When predicting visits to specific locations,another limitation of standard forecastingtechniques is that, although it is knownwhich demographic groups are most likely toparticipate in many activities, this data is notsite-specific.
C A final shortcoming of standard recreationdemand projections is that the amount of use a site receives can be affected by marketing;promotion and pricing influence participation and visitor numbers more than demographics do.
The Army Corps of Engineers is looking at spatial trends in visitation and analyzing them with respect todemographic trends:C Nationally, visitation to Corps lakes has been flat for the last ten to 12 years, but within the 456
water projects, visitation trends are highly variable. There is huge spatial variability betweensites, which affects trends in the use of those sites.
C The Corps of Engineers needs more spatially explicit information to better account for changesin visits at the project level. It also needs to know the extent to which demographic variabilityand spatial variability interact to influence visitation to locations.
C The Corps sees this interaction in the case of minority recreation use. In areas where there areincreases in the Latino population, there are also increases in Latino recreational use.
C There is a lot of internal migration by the US Latino population, and this is affecting use of Corpsof Engineers lakes. In 1980, one-quarter of Corps projects were used by Latinos. In 2003, all are.
C If increases in the Asian population in the US are mapped, the areas of increase coincide withupswings in Asian visitation to Corps recreation areas.
C It’s possible that the same interaction of space and demographics holds in the case of age, butthe Corps has yet to evaluate those numbers.
The gap between site-specific forecasts and national forecasts could be reduced if more information werecollected regularly from visitors:C Recreation management agencies need five basic pieces of information that should be asked
regularly of visitors: ZIP code, persons-per-vehicle, length of stay in the area, whether there isan overnight stay, and lodging type.
5ESRI. 2002. The sourcebook of ZIP code demographics. ESRI Press, Redlands, CA.
Visitation Forecasting and Predicting Use of NPS Parks and Visitor Centers 12
Using ZIP codes a wealth, of additionaldemographic and lifestyle informationabout visitors can be profiled at usefullevels of accuracy.
C Using ZIP codes, a wealth of additionaldemographic and lifestyle information aboutvisitors can be profiled at useful levels ofaccuracy. For example, ESRI5 publishesdescriptive profiles and five- year projectionsof the population for every residential andnon-residential ZIP code in the US.
C There are passive ways to get information about visitors without questioning them. Vehicles canbe observed to record party size, gender, race, approximate age, and vehicle model.
C License plates can be converted to ZIP codes, although there is a charge for such a service, andin some states it’s very expensive. Also, because of privacy concerns, the trend over the last tenyears has been to restrict access to that data. In some recreation areas the utility of license platedata is limited by the high percentage of visitors driving rental vehicles.
C The Army Corps of Engineers and the US Forest Service use the National Recreation ReservationService for campground reservations. This is a source of additional data about visitors. The NPSis joining this service, but one problem with using reservation data to describe visitors is thatreservations don’t necessarily translate into visits.
C The Corps of Engineers is also beginning to ask visitors about camping experiences and activityparticipation.
C Recreation.gov is the online recreation portal for the federal government. Potentially, peoplewho query the site for information could be sampled with a Web-based survey to find out whothey are and the types of recreation areas and activities they prefer. However, there are problemsin identifying Web-site users in ways that don’t violate federal privacy protections.
Blips in recreation and tourism participation can be forecast if their causes are known:C There are both negative blips, such as September 11th, and positive blips, such as special events.C Visitation at special events can be forecast, looking at the market for the event, similar events,
and the amount of promotion. Along with use, the economic impact of events can be predicted.C Changes in gasoline prices and gasoline availability have created blips in travel, but this
phenomenon may not continue if people become conditioned to higher prices.C There are other predictable blips every year tied to season, holidays, and recurring events.C The visibility of a place or the publicity it receives is an important factor that can create blips.
For example, when a site is used as a location in a major motion picture it frequently experiencesa subsequent increase in tourism.
The tourism industry through the Travel Industry Association (TIA) uses county-level data in projectingtourism demand and arrivals at travel destinations:C The TIA methodology is high-quality, with good inputs, including age, sex, and race. The
forecasting model is re-calibrated at every census.
Visitation Forecasting and Predicting Use of NPS Parks and Visitor Centers 13
C The TIA forecasts are made with a proprietary model that incorporates macro- economic trends,trend data from a panel of American households, and periodic surveys of travel intentions.
C At the national level the tourism industry does a good job analyzing projected vs. actual demand,comparing where people went with where they thought they’d go.
In What Ways Can Use of a Single Facility Be Effectively Forecast?Because forecasting is more reliable at large spatial scales and over short time periods, doing long-termvisitation forecasts for a single visitor center presents many challenges. A further complication is thatpredicting use of an existing facility differs from predicting visitation to a new facility. In the second case,there are no previous visitor statistics to analyze or trend lines to extend. In long-term projections, analternative approach to predicting visitation and waiting to see if the forecast is correct is to practice“normative forecasting.” Using this approach, a desired future condition is set and the sequence of stepsto achieve it is laid out. Normative forecasting has been popular in the defense and space communities.One example was the plan to put a man on the moon by the end of the 1960s.
For facilities with a history of use, changes in ease of access, in the market for a facility, and in the mix ofproducts offered by it can all affect future use and should be considered in forecasts:C To effectively forecast, it’s important to understand the current market for the facility and the
segments that make it up. Forecasting changes in the segments can help predict future visitation.C Some providers, such as Disney, are very good at marketing for local residents. Looking 20 years
into the future, this is one way to go: build the facility and promote it to the local populationusing lecture series and other activities as attractions. In this way, at least a portion of future useis predictable because it is controlled by the park.
C One problem with projecting visitor center use is that, for a resource- based area, the visitorcenter is not the attraction; it is the resource itself that draws visitors.
C Changes in pricing and maintenance level are other factors affecting visits to existing facilities.
For new facilities without a previous history of use, both quantitative and qualitative comparisons withsimilar facilities can be employed to forecast visitation:C A multiple regression model can be constructed using variables that predict use at similar
existing facilities. One model can be developed from visitation at several existing sites, but theinputs have to be consistent across all sites.
C As predictors, it is important to use measures for which good data exists and which alsosignificantly affect facility visitation. Population within 500 miles, square footage of the visitorcenter, and average distance traveled are examples of predictors in multiple regression models.
C Forecasting models must be refined over time. This requires an active tracking program in whichvisitation and the inputs affecting it are monitored continually.
C In the future, access to many types of personal data may be increasingly restricted by privacyconcerns. This could affect the ability of the NPS to track the characteristics of visitors and non-visitors.
Visitation Forecasting and Predicting Use of NPS Parks and Visitor Centers 14
In long-term forecasting and planning,the NPS could work actively to shape thefuture, rather than wait for it to occur.
C When forecasting visits to a specific location or facility, existing substitute sites are importantto consider because they compete for visitors with new facilities. But substitutes are one of themost difficult variables to incorporate into quantitative forecasting models. An alternativeapproach is to employ a measure of the new facility’s uniqueness.
C In long-term forecasting and planning, theNPS could work actively to shape the future,rather than wait for it to occur. This is “normative forecasting,” i.e., setting a goalthen systematically laying out the sequence ofsteps needed to reach it.
C It is desirable to use both qualitative andquantitative approaches to forecasting the use of new facilities. In a qualitative approach, theNPS could look at similar existing facilities and their use patterns when they were opened.Employing a quantitative approach, data on factors affecting visits at similar facilities could becollected and input into a multiple regression model to forecast visitation to the new facility.
Are There Other Ways to Forecast Visitation that Are Not Linked to Population Forecasts?Focus-group members discussed several approaches to forecasting that do not rely on applyingparticipation rates to changes in population or to the market segments within a population.
Surveys of travel intentions, trends in recreation equipment sales, and projections of community growthpatterns are all used to predict tourism travel and recreation participation:C Surveys of travel intentions can be reliable predictors of actual behavior in the short- term if
there is no major event that causes intentions to change on a large scale.C The Travel Industry Association (http://www.tia.org/Travel/) estimates US resident domestic
pleasure travel volumes by season (fall, winter, spring, and summer). The forecasts are based ona proprietary forecasting model that includes as inputs a survey of US adults’ intentions to travelin the upcoming season, as well as macro-economic trends and historical travel survey data.
C Economic data, such as recreational equipment sales and license sales, can be used to show thenumber of hunters, anglers, and boaters in an area and trends in those numbers over time.
C Local communities and major developments such as Disney World map long- term build- out(i.e., development potential). This could help forecast use of parks and recreation facilities thatdraw their visitors primarily from local populations.
Visitation Forecasting and Predicting Use of NPS Parks and Visitor Centers 15
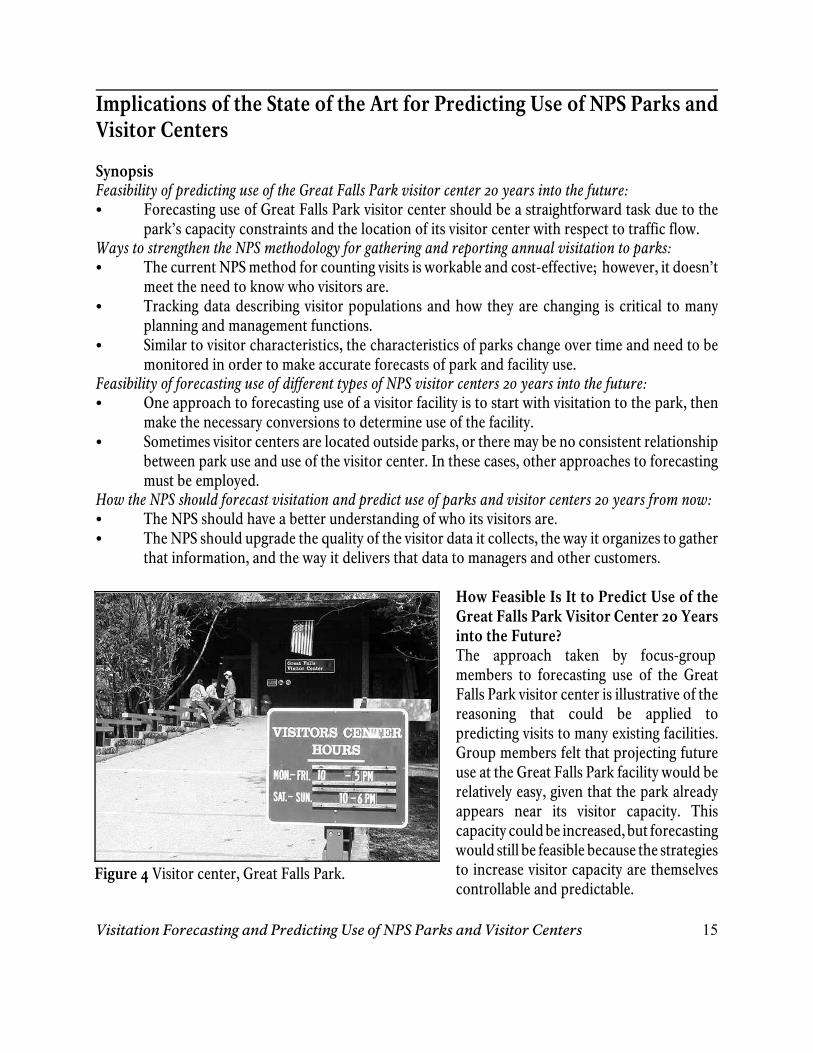
Figure 4 Visitor center, Great Falls Park.
Implications of the State of the Art for Predicting Use of NPS Parks andVisitor Centers
SynopsisFeasibility of predicting use of the Great Falls Park visitor center 20 years into the future:C Forecasting use of Great Falls Park visitor center should be a straightforward task due to the
park’s capacity constraints and the location of its visitor center with respect to traffic flow.Ways to strengthen the NPS methodology for gathering and reporting annual visitation to parks:C The current NPS method for counting visits is workable and cost-effective; however, it doesn’t
meet the need to know who visitors are.C Tracking data describing visitor populations and how they are changing is critical to many
planning and management functions.C Similar to visitor characteristics, the characteristics of parks change over time and need to be
monitored in order to make accurate forecasts of park and facility use.Feasibility of forecasting use of different types of NPS visitor centers 20 years into the future:C One approach to forecasting use of a visitor facility is to start with visitation to the park, then
make the necessary conversions to determine use of the facility.C Sometimes visitor centers are located outside parks, or there may be no consistent relationship
between park use and use of the visitor center. In these cases, other approaches to forecastingmust be employed.
How the NPS should forecast visitation and predict use of parks and visitor centers 20 years from now:C The NPS should have a better understanding of who its visitors are.C The NPS should upgrade the quality of the visitor data it collects, the way it organizes to gather
that information, and the way it delivers that data to managers and other customers.
How Feasible Is It to Predict Use of theGreat Falls Park Visitor Center 20 Yearsinto the Future?The approach taken by focus-groupmembers to forecasting use of the GreatFalls Park visitor center is illustrative of thereasoning that could be applied topredicting visits to many existing facilities.Group members felt that projecting futureuse at the Great Falls Park facility would berelatively easy, given that the park alreadyappears near its visitor capacity. Thiscapacity could be increased, but forecastingwould still be feasible because the strategiesto increase visitor capacity are themselvescontrollable and predictable.
Visitation Forecasting and Predicting Use of NPS Parks and Visitor Centers 16
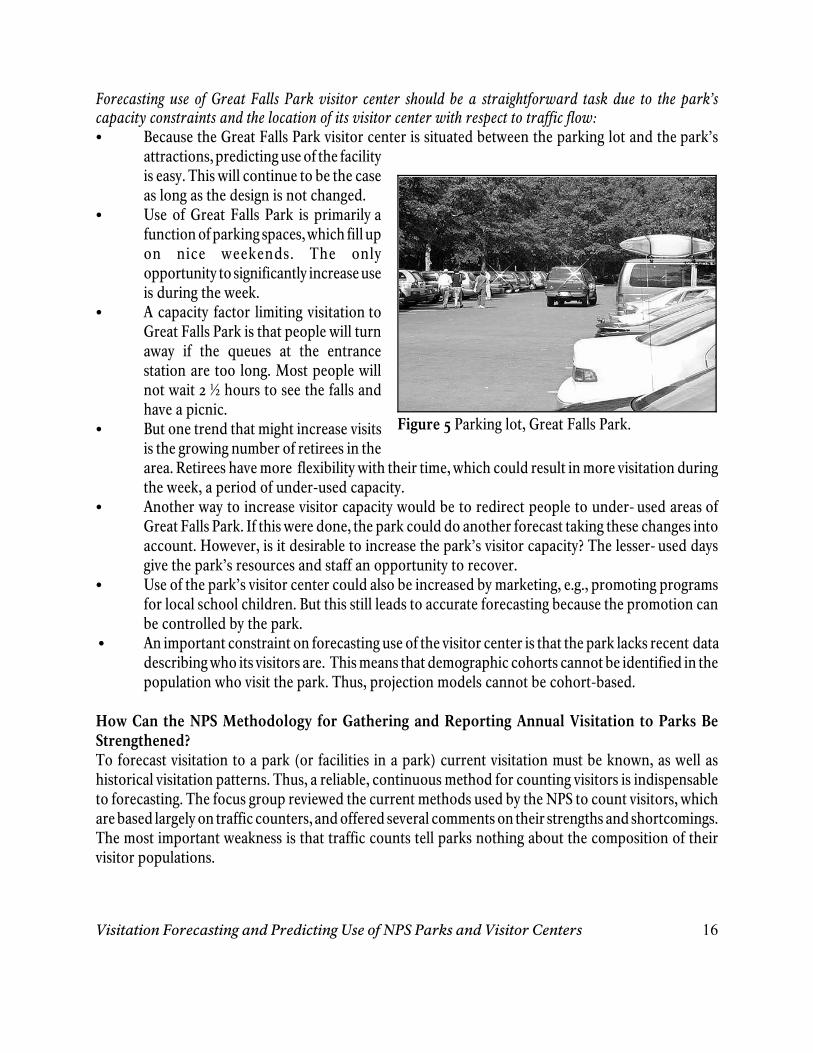
Figure 5 Parking lot, Great Falls Park.
Forecasting use of Great Falls Park visitor center should be a straightforward task due to the park’scapacity constraints and the location of its visitor center with respect to traffic flow: C Because the Great Falls Park visitor center is situated between the parking lot and the park’s
attractions, predicting use of the facilityis easy. This will continue to be the caseas long as the design is not changed.
C Use of Great Falls Park is primarily afunction of parking spaces, which fill upon nice weekends. The onlyopportunity to significantly increase useis during the week.
C A capacity factor limiting visitation toGreat Falls Park is that people will turnaway if the queues at the entrancestation are too long. Most people willnot wait 2 ½ hours to see the falls andhave a picnic.
C But one trend that might increase visitsis the growing number of retirees in thearea. Retirees have more flexibility with their time, which could result in more visitation duringthe week, a period of under-used capacity.
C Another way to increase visitor capacity would be to redirect people to under- used areas ofGreat Falls Park. If this were done, the park could do another forecast taking these changes intoaccount. However, is it desirable to increase the park’s visitor capacity? The lesser- used daysgive the park’s resources and staff an opportunity to recover.
C Use of the park’s visitor center could also be increased by marketing, e.g., promoting programsfor local school children. But this still leads to accurate forecasting because the promotion canbe controlled by the park.
C An important constraint on forecasting use of the visitor center is that the park lacks recent datadescribing who its visitors are. This means that demographic cohorts cannot be identified in thepopulation who visit the park. Thus, projection models cannot be cohort-based.
How Can the NPS Methodology for Gathering and Reporting Annual Visitation to Parks BeStrengthened?To forecast visitation to a park (or facilities in a park) current visitation must be known, as well ashistorical visitation patterns. Thus, a reliable, continuous method for counting visitors is indispensableto forecasting. The focus group reviewed the current methods used by the NPS to count visitors, whichare based largely on traffic counters, and offered several comments on their strengths and shortcomings.The most important weakness is that traffic counts tell parks nothing about the composition of theirvisitor populations.
Visitation Forecasting and Predicting Use of NPS Parks and Visitor Centers 17
An ongoing visitor survey is needed in allparks, tracking activities, where visitorscome from, the reasons for their visits,their demographic characteristics, andwhether or not they use a visitor center.
The current NPS method for counting visits is workable and cost-effective; however, it doesn’t meet the needto know who visitors are:C Party size estimates are updated on an
irregular basis. Generally, party sizes aredecreasing, so caution must be used whendoing time-series analyses of visitation data.
C An ongoing visitor survey is needed in allparks, tracking activities, where visitorscome from, the reasons for their visits, theirdemographic characteristics, and whether ornot they use a visitor center. Visitor centercharacteristics should be measured as part of the tracking system.
C An ideal visitor-tracking process would sort out the monitoring data needed for visitorforecasting from the data required for a more comprehensive market survey every five to tenyears.
C Traffic counters are not the optimal way to measure visitation. There are re-entry problems andmaintenance problems with the equipment. A tremendous amount of research is needed behindthe scenes to compute conversion factors, and traffic counters are still not a good way to count.
C Sales receipts are a another way to track use of a visitor center. Conversion factors could bedeveloped that are applied to the number of transactions or the total dollar amount.
C Fee collection works well as a way to count visits in some parks. Cave tour fees at CarlsbadCaverns National Park are one example.
C A problem with using entrance-fee collection as a way to count visitors is that there may be littlecorrelation between entrance fees paid and the number of visits. Visitors can use a pass, with onepass representing one visit or 150 visits.
C The US Forest Service is encountering problems with counting visits in situations where one feepays for use of multiple forests. This could be a problem in the NPS as well, e.g., at Yellowstone-Grand Teton national parks.
Tracking data describing visitor populations and how they are changing is critical to many planning andmanagement functions, including forecasting:C In developing a new way to measure visitation, the initial goal of the US Forest Service was to
come up with visitation forecasts and counts that were defensible before Congress. But theagency now realizes that the value added from understanding who its visitors are will drive thefuture of the Forest Service.
C The NPS has also found that it’s useful to know the basic demographics of visitors, even if thisinformation is not used for forecasting. For many reasons, it’s also important to understand thecustomer base at different types of parks, e.g., urban parks vs. rural parks.
Visitation Forecasting and Predicting Use of NPS Parks and Visitor Centers 18
Since 1987, NPS visitation has been flat ordecreasing. Is this because visitor capacityhas been reached in some parks? The NPSneeds to know this to do accurateforecasting.
C To improve visitation forecasts, research is needed on the stability of the relationship betweendemographic characteristics and the probability of visiting parks. Some demographic groups aremore likely to be park- goers than others, but patterns change over generations. Also, differencesin visitation rates between racial groups diminish with increasing education.
C What is counted and how it’s counted depends on what question needs an answer. The numberof nights visitors spend in an area is useful for economic impact analyses, but the number ofhours visitors spend in a park is useful for staffing and maintenance.
C Market research helps evaluate the need for new facilities and programs. If residents around anational park demand a Ferris wheel, does the NPS give it to them? Not necessarily, but then thepark knows these people are less likely to visit.
Similar to visitor characteristics, the characteristics of parks change over time and need to be monitoredin order to make accurate forecasts of park and facility use:C A database is needed for all parks that includes a visitor capacity measure, number of hotels in
the area, types of visitor centers, and access to the park. This should be updated at regularintervals.
C Social scientists and planners don’t fullyunderstand how a park’s visitor capacityfunctions. This is a serious hindrance toforecasting. Since 1987, NPS visitation hasbeen flat or decreasing. Is this because visitorcapacity has been reached in some parks?The NPS needs to know this to do accurateforecasting.
C To improve the ability to forecast visits it would be useful to break the NPS system into sub-systems – parkways, urban parks, rural parks, and destination parks – and develop separateforecasts for each sub-system.
How Feasible Is it to Forecast Use of Different Types of NPS Visitor Centers 20 Years into theFuture?In some cases, forecasting use of a visitor center is tantamount to predicting visitation to the park inwhich it is located. In other cases, the correlation between park visits and use of the visitor center maybe weak. Even so, park visitation is still an essential input into the forecast of visitor center use in mostparks.
One approach to forecasting use of a visitor facility is to start with visitation to the park, then make thenecessary conversions to determine use of the facility:C For visitor centers that people must pass through to enter the park, the NPS can forecast use the
same way it forecasts visitation to the park as a whole.
Visitation Forecasting and Predicting Use of NPS Parks and Visitor Centers 19
When predictions are much higher orlower than actual visits, a lot is learnedabout what affects or does not affectvisitation. This can be used to refinefuture forecasts.
C If the visitor center is drawing solely from park users, a good approach is to start with the park’svisitation and estimate how much of this the visitor center will capture. As at Great Falls Park,location of the facility is critical in determining this.
C The past history of existing visitor centers in areas with similar visitation levels can be used toforecast use of a new facility.
Sometimes visitor centers are located outside parks, or there may be no consistent relationship betweenpark use and use of the visitor center. In these cases, other approaches to forecasting must be employed:C Gravity models can be used to forecast visitor center use based on the distance from major trip-
origin points.C For facilities located along major travel routes, the number of cars exiting a ramp vs. how many
pass by on the highway could be a good predictor of use.C The functions of a visitor center affect its use and should be incorporated into forecasting. Is the
facility a learning center that draws school groups or field schools? Does the park hostconferences? Are there special events at the visitor center or park?
C If the NPS works actively with communities and school districts to promote use of a visitorcenter through special programs and events, it is determining a portion of the visitor center’suse, making forecasting easier.
C In some cases, an initial forecast might be based on average use of park visitor centers in general,perhaps combined with other methods, such as multiple regression models and qualitativecomparisons with existing facilities judged to be similar.
C Some visitor facilities may over-perform orunder-perfor m based on their forecasts oron comparisons with similar facilities. This isnot necessarily bad. When predictions aremuch higher or lower than actual visits, a lotis learned about what affects or does notaffect visitation. This can be used to refinefuture forecasts.
C If a new facility is unique, forecasting use ofit is more difficult because there are no similar cases for comparison. The Gettysburg map wasan example. Originally, it was a privately owned attraction, but went out of business becauseadmissions did not reach the level forecast.
In Your Dreams, How Should the NPS Forecast Visitation and Predict Use of Parks and VisitorCenters 20 Years from Now?The visitation-forecasting focus group concluded its discussion with each participant describing his orher view of the ideal forecasting system of the future. Two points were emphasized: 1) the NPS needsbetter ways to track who its visitors are, and 2) the NPS needs a better structure for monitoring andforecasting visitation.
Visitation Forecasting and Predicting Use of NPS Parks and Visitor Centers 20
The NPS should have a continuousplanning process. It would predictvisitation by park type or attraction. Therewould be regular tracking of visitors witha feedback loop to compare the forecastwith actual counts in order to calibratethe model.
The NPS should have a better understanding of who its visitors are:C The most important point is that the NPS needs to know a lot more about its customers. With
a tracking system in place, the forecasting models will be developed along the way.C Everyone entering a park would have an NPS card with their name and address that gets scanned
into a database.C The NPS would conduct a regular national survey to profile visitors and non-visitors, including
their demographic characteristics, types of parks visited, and preferred services and facilities.
The NPS should upgrade the quality of the visitor data it collects, the way it organizes to gather thatinformation, and the way it delivers that data to managers and other customers:C The NPS should develop a means to continuously collect high-quality data about its visitors that
is based on something more than tire counts. It should forecast visitation from its owninformation, which would be comprehensive and of good quality.
C The NPS should have a continuous planningprocess. It would predict visitation by parktype or attraction. There would be regulartracking of visitors with a feedback loop tocompare the forecast with actual counts inorder to calibrate the model.
C Park-based visitor data would be input intoa large GIS system and mapped, using modelsthat tie all the data together and makeforecasts.
C Every park would have a forecaster and an economist who understand the forecasting model.The forecasters in parks would be coordinated through a national research office.
C The NPS would develop various scenarios for visitation and play them out – low, high, and mid-range forecasts. Comparing these projections with actual visitation would result in a better graspof how to forecast, including an improved understanding of which predictors to use inprojection models and the validity of underlying assumptions.
6As one example, Disney samples visitors to its parks every day.
Visitation Forecasting and Predicting Use of NPS Parks and Visitor Centers 21
The most important key to forecasting iscontinuous research that tracks trends invisitation.
General Implications for the National Park Service
This section presents a summary and synthesis of the focus-group proceedings as interpreted by theauthor. Its purpose is to place the discussion at Turkey Run Park squarely in the context of larger issuesfaced by the NPS in forecasting visitation and predicting use of visitor centers. A second purpose is toconsider the implications of the discussion for social science research in the NPS.
Two important points integrate many of the comments from the group’s participants. The first is theneed to understand a park’s products and markets, as well as the various forecasting approaches. Thesecond is the power of the NPS to influence, as well as predict, future use of visitor centers and relatedfacilities.
C Forecasting visitation requires an understanding of agency goals, a knowledge of market trends,and continuous tracking to refine visitor projection models. It also requires an understanding ofthe limitations of quantitative and qualitative approaches to forecasting.
Fundamental approaches to visitation and population forecasting have not changed for 50 years. Instead,improvements have come largely from refinements in the types and quality of data input into projectionmodels. For example, census information on race and ethnicity is more detailed than in the past andcontinues to evolve. Also, due to continued advances in geographic information systems and databases,demographic and lifestyle information can be geo-coded at smaller spatial scales than before. This givesforecasters more detailed information on local populations, something that is critical to doing site-specific projections.
But knowledge of the market “out there” is not as important as knowledge of the specific marketsegments parks want to reach. In one sense, the NPS serves the entire American public – even a globalpublic – but many parks also have populations of visitors and potential visitors that are of specialinterest, including school children, seasonal residents, local residents, retirees, or specific racial andethnic groups. Forecasting visitation depends onknowledge of these strategically important marketsegments, including changes in their size, geographicdistribution, and share of the overall population.Because of this, the most important key to forecastingis continuous research that tracks trends invisitation.6 However, tracking should be more thancounting the number of tire tracks over a counter in the road, since that tells little about who parkvisitors are. It should involve routinely collecting data that describes how the mix of visitors is changing,either in response to outside events, such as September 11th, as a result of broad demographic shifts in
7The NPS uses trend-line extensions in its two-year forecasts of park visitation.
Visitation Forecasting and Predicting Use of NPS Parks and Visitor Centers 22
Applying quantitative methods to the longterm is almost certain to yield inaccurateforecasts because most such models make thedubious assumption that conditions thatprevail in the present will continue into thefuture.
Some of the factors influencing use arecontrollable, such as marketing, pricing,and promoting a visitor center’s programsand services.
a region’s population, or because management actions directly or indirectly affect the types of peoplewho visit. Continuous tracking also is helpful in identifying and reliably anticipating recurring blips invisitation caused by time of year, special events, and other recurring factors.
The type of forecasting depends on the time period for which projections are made and the desired levelof precision. Short-term forecasts are more amenable to formal quantitative approaches, such as time-
series extensions, moving averages, andstructural equation models.7 However, applyingthese methods to the long term is almost certainto yield inaccurate forecasts because most suchmodels make the dubious assumption thatconditions that prevail in the present willcontinue into the future. In the case of long-term projections, e.g., 20 years ahead, variousqualitative approaches are more useful. Theseinclude models in which expert judgment is a
direct input, as in describing alternative future conditions or in evaluating the trends and relationshipsemployed in cross-impact simulation models. Even more than in the short term, when forecastingvisitation into the distant future it is essential to understand market segments and the many extraneousfactors affecting their behavior, including competing opportunities. It is also important to understandthat precision will differ substantially between short- term and long- term forecasts. Planners and policy-makers should expect greater precision in short-term predictions than is possible in the long-term.
C The NPS does not have to wait for the future to happen. It can play an active role in shaping futureevents, including use of its parks and visitor centers.
How many people visit parks is not totally under thecontrol of the NPS. In both the long term and theshort term many events and trends beyond theagency’s reach significantly affect visitation. But someof the factors influencing use are controllable, such asmarketing, pricing, and promoting a visitor center’sprograms and services. Forecasting is much easier ifthe effects of these factors on the populations the facility is trying to attract are understood. One schoolof practice – normative forecasting – establishes desirable future conditions and then lays out the stepsnecessary to reach them. This approach could be applied to forecasting use of new visitor centers.Important steps toward reaching future visitation goals might include establishing visitor- capacity limitsand square footage for facilities, managing ease of access through location, using publicity and specialevents to reach targeted populations, cooperating with partners in offering programs, and employing
Visitation Forecasting and Predicting Use of NPS Parks and Visitor Centers 23
promotional pricing. Continuous tracking of visitation would allow the park to understand how thesecontrollable factors influence the market segments the park is trying to reach, providing anunderstanding of customer behavior that could be used to refine forecasts for other parks and facilities.
Implications for Social Science Research in the NPSJust as improvements in population forecasting have their roots in better data employed in predictionmodels, improvements in projecting use of NPS parks and visitor centers will come from better and moredetailed social science data tracking visitor populations and describing market segments. For example,visitors’ ZIP codes – input into cash registers at purchase points in park stores and fee stations – wouldprovide a wealth of market information helpful in understanding the populations that are being servedand in refining projection models. The US Forest Service has developed such a system – Point O Sale –at its Land-Between-the-Lakes demonstration forest. The Smithsonian Institution employs a similarsystem in its museum stores.
There is much that social scientists and planners do not yet understand about the factors affecting futuredemand for park experiences and use of visitor centers. These knowledge gaps have been detailed inprevious sections of this report, but the most important are summarized here.
In order to improve its ability to forecast visitation, the NPS needs social science research to:
C Continuously track the characteristics of park visitors.
C Accurately describe non-visitors and their reasons for not using parks and visitor facilities.
C Identify the significant factors influencing visitation at the national level, including:C macro-economic cycles and other large-scale trends;C park-specific events, including natural disasters and changes in regional access;C changes in the size and composition of populations in terms of age, race, and ethnicity;C management actions, including facility development and fee policies;C the effects of marketing.
C Better understand the effects on demand of crowding, traffic congestion, and waiting times forreservations.
C Identify factors affecting visitation to different types of NPS units, such as parkways, destinationparks, urban sites, and remote parks.
In summary, the success of the NPS in forecasting use of parks and visitor centers will depend on itsunderstanding of the variables affecting visitation at different types of units and its ability to measurethese on a continual basis. As one focus-group member stated, “In forecasting, any information ishelpful if it’s a predictor and you measure it at all of your sites.”

Visitation Forecasting and Predicting Use of NPS Parks and Visitor Centers 24
Appendix: Focus-Group Participants, Affiliations, and Interests
Dr. Donald EnglishResearch Scientist, US Forest Service Southern Center for Urban Forestry Research and Information.Interests: Outdoor recreation demand modeling and visitation counting.
Dr. Ashley Goldhor-WilcockSocial Scientist, Bureau of Land Management National Recreation Group. Interests: Environmentaleconomics, visitor counting systems, carrying capacity, economic impacts, and other recreation andvisitor issues.
Mr. Richard KasulStatistician, Engineer Research and Development Center, US Army Engineers Waterways ExperimentStation. Interests: Statistical design and analysis associated with wildlife and recreation resources,projecting demographic change in visitation.
Mr. Butch StreetManagement Analyst, National Park Service Public Use Statistics Office. Interests: Measuring nationalpark visitation, short-term forecasts of national park visitation.
Dr. Daniel StynesProfessor of Recreation Economics, Michigan State University. Interests: Recreation demand modelingand forecasting, economic significance of national park visitation.
Mr. Stephen TordellaPresident, Decision Demographics. Interests: Demographic analysis as applied to market research,population estimates and projections, strategic planning, and evaluations.
Dr. Timothy TyrrellProfessor of Natural Resource Economics and Director, Office of Travel, Tourism, and Recreation,University of Rhode Island. Interests: Recreation and tourism demand modeling, spatial analysis oftourism growth and sustainability.
Dr. Paul VossProfessor of Rural Sociology and Director, Applied Population Laboratory, University of Wisconsin-Madison. Interests: Applied demography, census survey development, population projections.
Cover photo: Rickey Ridge visitor center, Shenandoah National Park. All photos courtesy NPSSocial Science Program.
Visitation Forecasting and Predicting Use of NPS Parks and Visitor Centers 25
Cover photo: Rickey Ridge visitor center, Shenandoah National Park. All photos courtesy NPS Social Science Program.
About the NPS Social Science Program
The role and functions of the NPS Social ScienceProgram are to: provide leadership and direction to the socialscience activities of the NPS, coordinate social scienceactivities with other programs of the NPS, act as liaison withthe USGS Biological Resources Division and other federalagencies on social science activities, provide technical supportto parks, park clusters, support offices, and regional offices,and support a program of applied social science researchrelated to national research needs of the NPS.
For more information, contact:
Dr. Jim GramannVisiting Chief Social ScientistNational Park Service1849 C Street, NW (2300)Washington, DC 20240Telephone: (202) 513-7189Email: [email protected] site: http://www.nps.gov/socialscience/