Embed Size (px)
Citation preview

380
390
400
410
420
430
440
450
460
470
2001 2002
Visitor arrivals
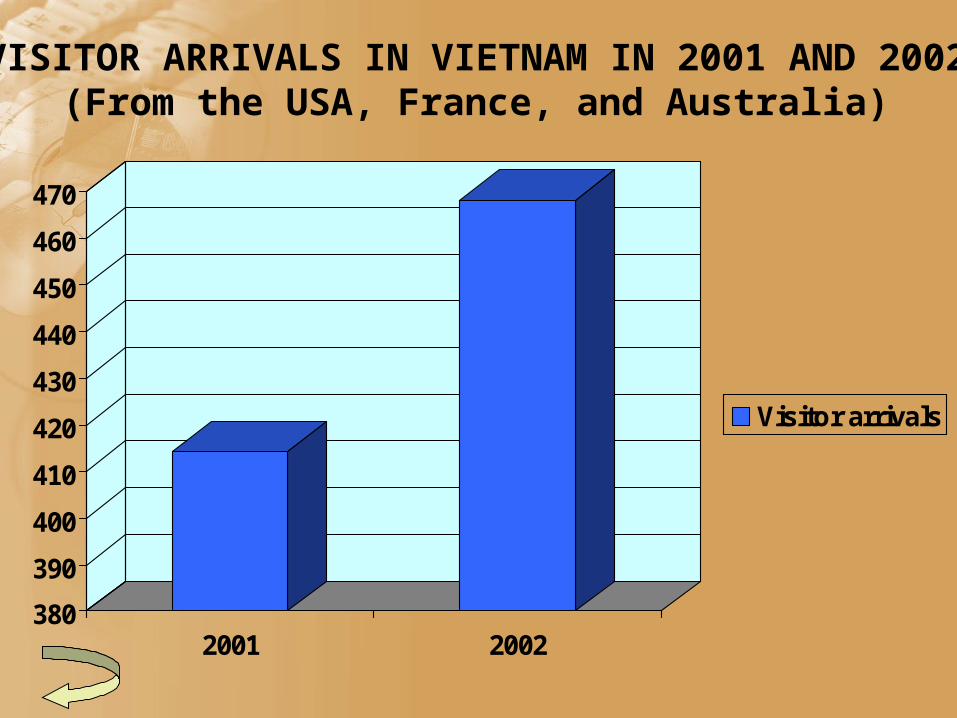
VISITOR ARRIVALS IN VIETNAM IN 2001 AND 2002(From the USA, France, and Australia)

What is it? It is a chart.
What can you say when seeing this chart?
The number of visitors to Vietnam in 2002 is bigger than that in 2001.
1
2

SOME STRUCTRURES USED IN DESCRIBING A CHART:
The chart shows that…The chart describes…It is clear from the chart that…
To begin describing:
To compare the data: Equality comparison: …as+adj/adv+as... Comparative: ...short adj/adv+er than... …more+long adj/advSuperative: …the short adj/adv+est… most+long adj/adv…

Introductory sentences:Tell what the chart is about, the time, the location… Body sentences:Begin with the sentence that sums up the general trendDescribe the chart in detail (in a logical order of time, importance level…) Concluding sentence:Summarize the main points
To organize a description:
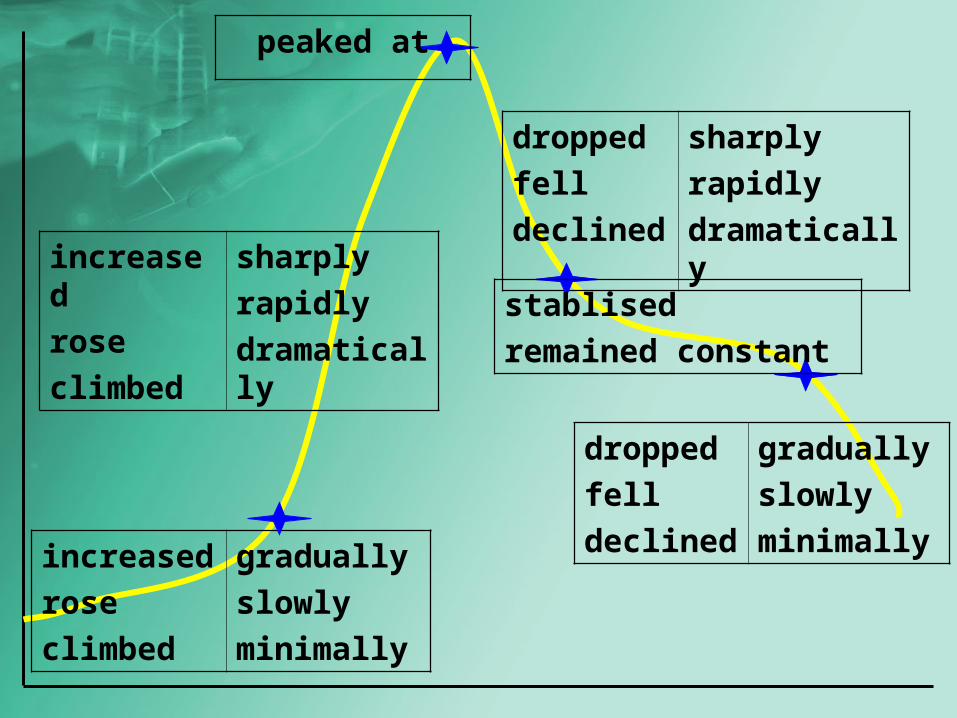
increased
rose
climbed
gradually
slowly
minimally
increased
rose
climbed
sharply
rapidly
dramatically
dropped
fell
declined
sharply
rapidly
dramatically
dropped
fell
declined
gradually
slowly
minimally
peaked at
stablised
remained constant
230,470
99,70084,085
259,967
111,54696,624
0
50,000
100,000
150,000
200,000
250,000
300,000
2001 2002
USA
FRANCE
AUSTRALIA
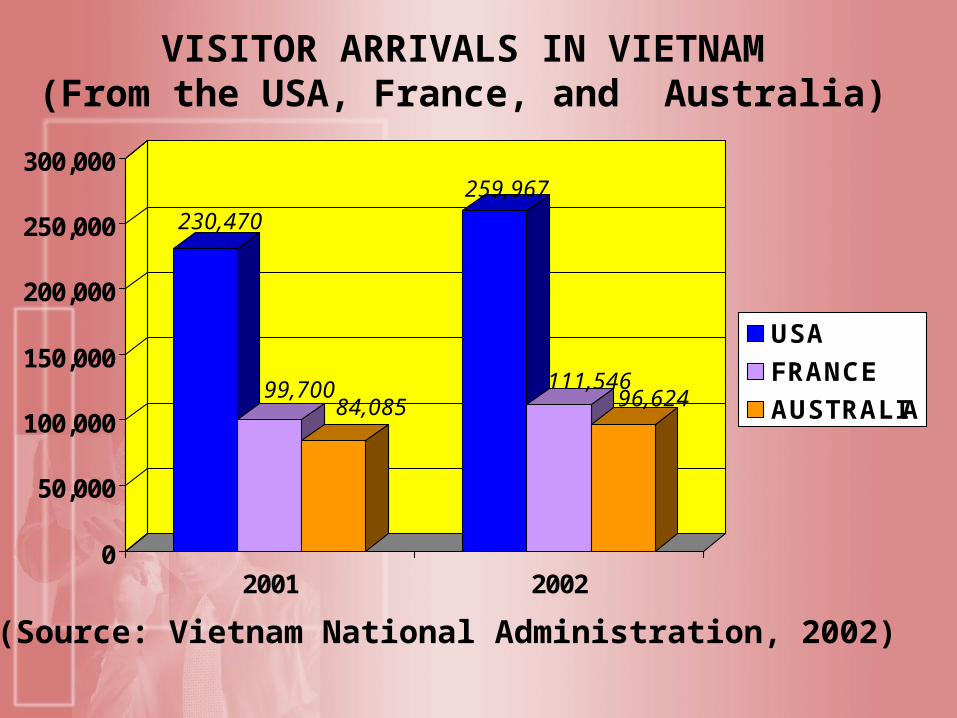
VISITOR ARRIVALS IN VIETNAM(From the USA, France, and Australia)
(Source: Vietnam National Administration, 2002)
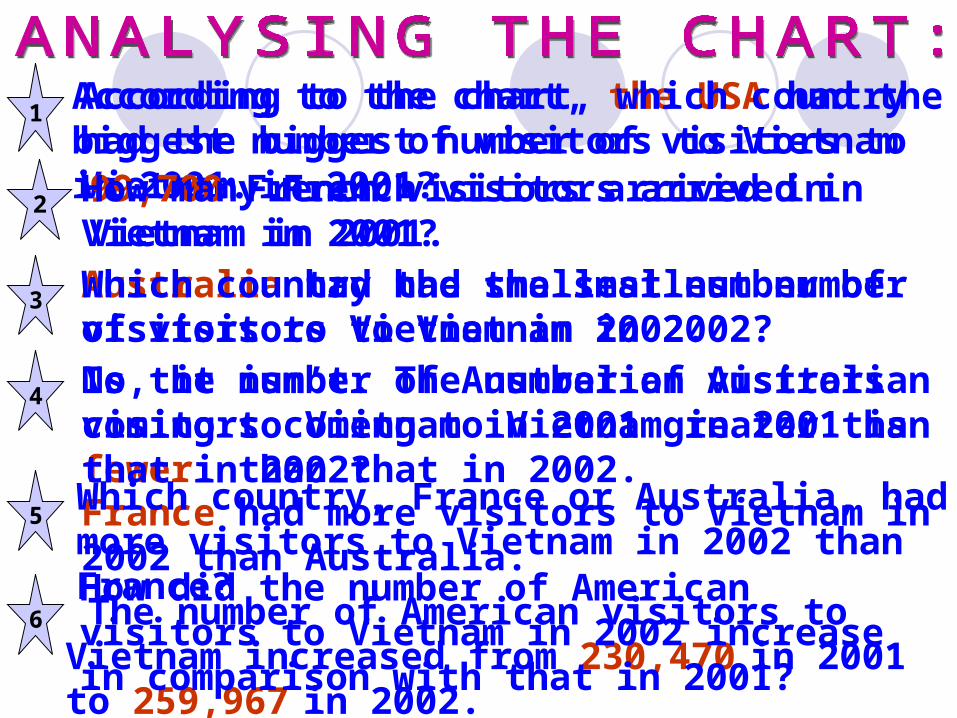
1 According to the chart, the USA had the biggest number of visitors to Vietnam in 2001.According to the chart, which country had the biggest number of visitors to Vietnam in 2001?
2 99,700 French visitors arrived in Vietnam in 2001.How many French visitors arrived in Vietnam in 2001?
3 Australia had the smallest number of visitors to Vietnam in 2002.Which country had the smallest number of visitors to Vietnam in 2002?
4 No, it isn’t. The number of Australian visitors coming to Vietnam in 2001 is fewer than that in 2002.
Is the number of Australian visitors coming to Vietnam in 2001 greater than that in 2002?
France had more visitors to Vietnam in 2002 than Australia.
5Which country, France or Australia, had more visitors to Vietnam in 2002 than France?
The number of American visitors to Vietnam increased from 230,470 in 2001 to 259,967 in 2002.
6How did the number of American visitors to Vietnam in 2002 increase in comparison with that in 2001?
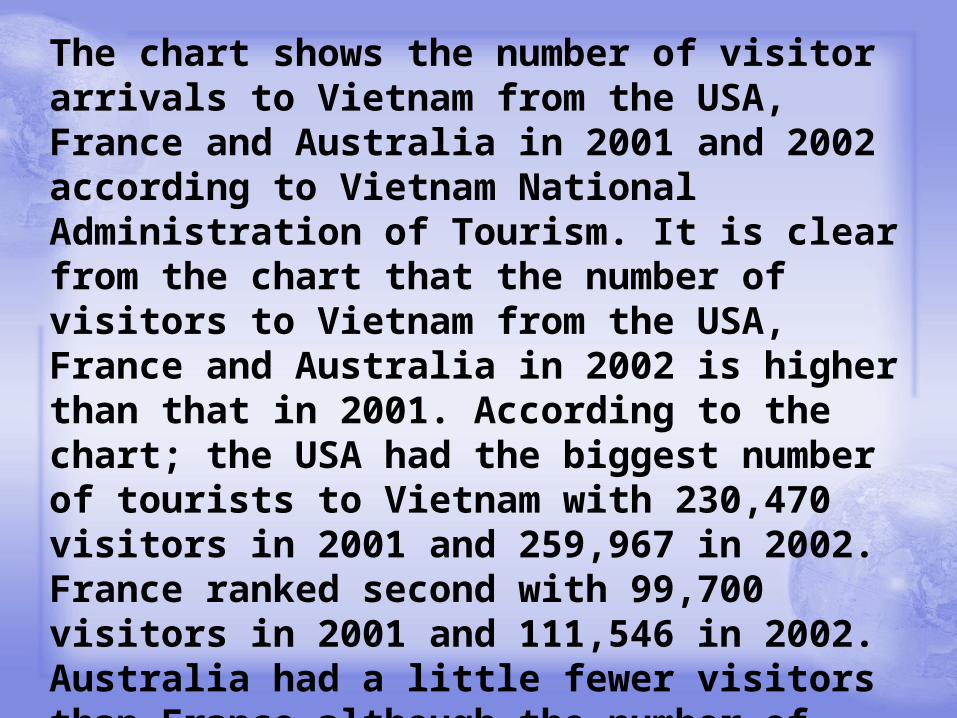
The chart shows the number of visitor arrivals to Vietnam from the USA, France and Australia in 2001 and 2002 according to Vietnam National Administration of Tourism. It is clear from the chart that the number of visitors to Vietnam from the USA, France and Australia in 2002 is higher than that in 2001. According to the chart; the USA had the biggest number of tourists to Vietnam with 230,470 visitors in 2001 and 259,967 in 2002. France ranked second with 99,700 visitors in 2001 and 111,546 in 2002. Australia had a little fewer visitors than France although the number of Australia sightseers to Vietnam increased from 84,085 in 2001 to 96,924 in 2002.

Study the following chart and decide whether the given statements are true (T) or false (F).
0
5
10
15
20
25
30
35
40
bus car bike foot
1960
1980
2000
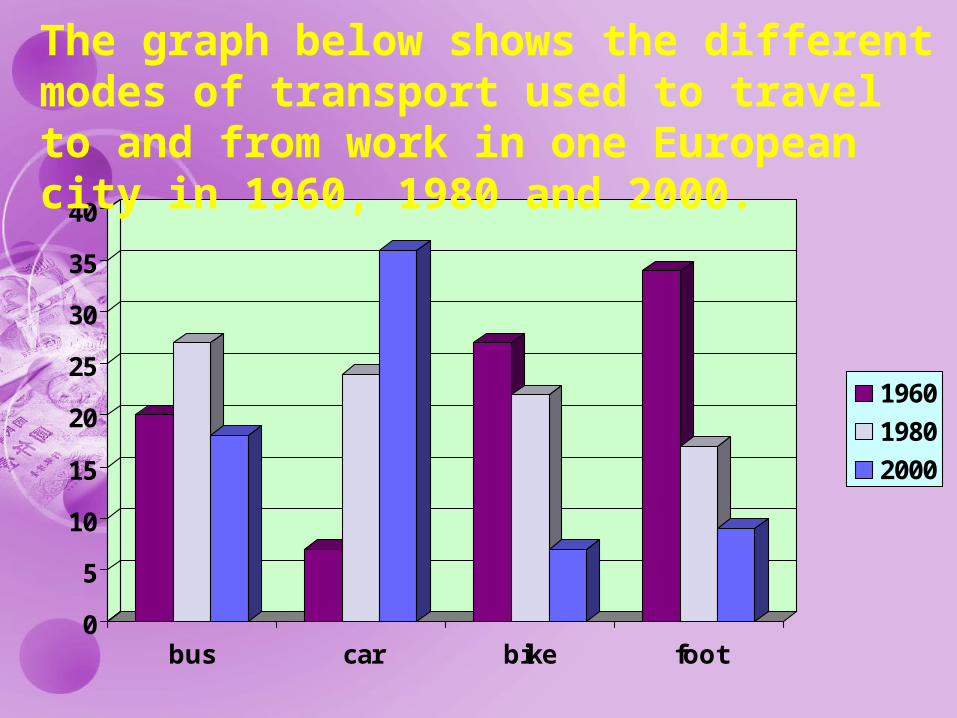
The graph below shows the different modes of transport used to travel to and from work in one European city in 1960, 1980 and 2000.
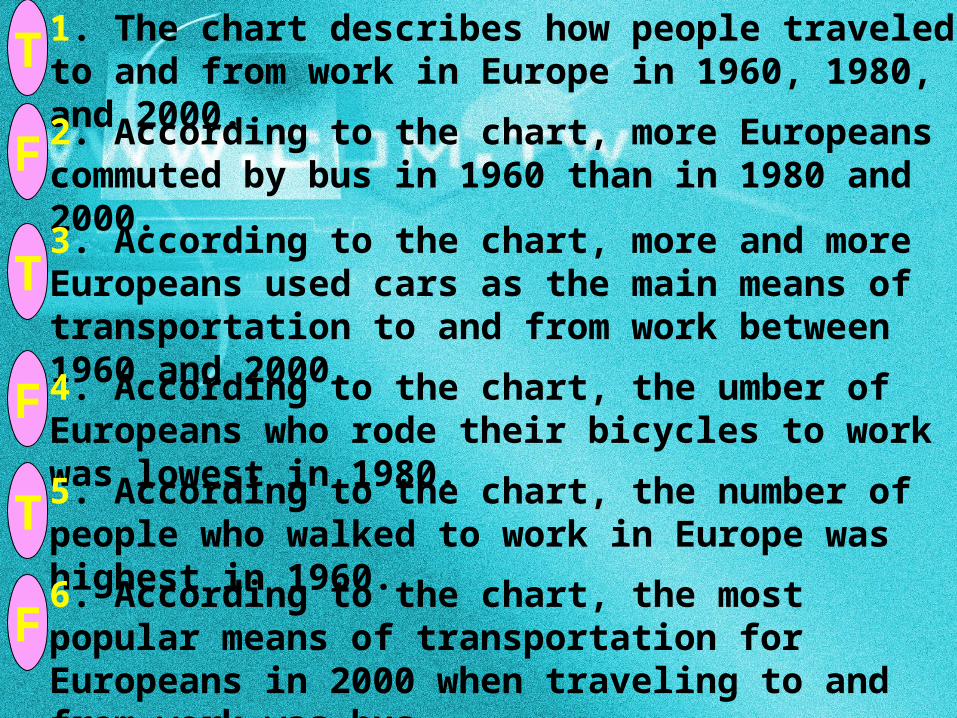
1. The chart describes how people traveled to and from work in Europe in 1960, 1980, and 2000.
2. According to the chart, more Europeans commuted by bus in 1960 than in 1980 and 2000.
3. According to the chart, more and more Europeans used cars as the main means of transportation to and from work between 1960 and 2000.
4. According to the chart, the umber of Europeans who rode their bicycles to work was lowest in 1980.
5. According to the chart, the number of people who walked to work in Europe was highest in 1960.
6. According to the chart, the most popular means of transportation for Europeans in 2000 when traveling to and from work was bus.
T
F
T
F
T
F

Find a chart and write a description.