Embed Size (px)
Citation preview
VisMOOC: Visualizing Video Clickstream Datafrom Massive Open Online Courses
Conglei Shi∗ Siwei Fu† Qing Chen‡ Huamin Qu §
ABSTRACT
Massive Open Online Courses (MOOCs) are becoming increas-ingly popular and have attracted much research attention. Analyz-ing clickstreams on MOOC videos poses a special analytical chal-lenge but provides a good opportunity for understanding how stu-dents interact with course videos, which in turn can help instructorsand educational analysts gain insights into online learning behavior.In this poster, we develop a visual analytical system, VisMOOC, tohelp instructors analyze the clickstream data. VisMOOC consists ofthree main views: the List View to list all course videos for analyststo select the video they are interested in; the Content-based View toshow how each type of click actions change along the video time-line, which enables the most viewed sections to be observed andthe most interesting patterns to be discovered; The Dashboard Viewshows the information of the clickstream data in different aspects,including the course information, the geographic distribution, thevideo temporal information, the video popularity, and the anima-tion. Furthermore, case studies made by the instructors demonstratethe usefulness of VisMOOC and helped them gaining deep insightsinto learning behavior for MOOCs.
1 INTRODUCTION
Massive Open Online Courses (MOOCs) have attracted a lot ofpublic attention over the past few years [4, 5]. The considerableamount of data generated from MOOCs offer a great opportunityfor educational analysts to analyze the learning behavior [1]. Rel-evant data include student profiles, posts in the course forum, sur-veys, course videos and clickstreams of the course videos. Partic-ularly, in the clickstreams, there are six types of clicks, namely,“play”, “pause”, “seek”, “stalled”, “ratechange”, and “error”.
A lot of statistical studies have been done to analyze the datafrom different aspects, providing valuable insights into learner be-havior in MOOCs [1, 2, 6, 7]. Particularly, recent research showsthat students who take online courses spend the majority of timewatching lecture videos [1, 6]. Therefore, it is important for in-structors to understand how learners behave when watching videos.For instance, they can revise the video accordingly to make it morecomprehensive by better understanding of learning behavior.
Recently, a large-scale analysis of click streams for lecturevideos has been reported [3]. This analysis provides insights intodropout behavior and reasons underling the interaction peaks invideos. Also, it is the first work to study the click-level interac-tions in MOOC videos. However, when we interviewed the instruc-tors of MOOCs, they said that there lacks tools for them to analyzelearning behavior.
In this project, we collaborated with domain experts to itera-tively design VisMOOC, a visual analytical system to help themunderstand online learning behavior. We used the log data of coursevideos and followed a user-centered process to develop the system.
∗e-mail: [email protected]†e-mail: [email protected]‡e-mail: [email protected]§e-mail: [email protected]
All the authors are from CSE Department, the Hong Kong University ofScience and Technology
To demonstrate the usefulness of our system, case studies are con-ducted about how experts used VisMOOC to explore the data andwhat they found. To the best of our knowledge, our study is thefirst to provide such a visual analytical system for domain expertsto combine content-based analysis with video clickstream data oflecture videos.
2 VISMOOC DESIGN
P1 P2
Figure 1: A screenshot of VisMOOC. It consists of three views: theList View on the left, the Content-based View (including the videoplayer, the seek graph and the event graph) in the middle, and theDashboard View on the right. The Dashboard View includes thecourse information, the geographic distribution, the video temporalinformation, the video popularity, and the animation.
The main interface of VisMOOC consists of three coordinatedviews that show clickstream data in different aspects as well as atdifferent levels of details. The List View shows the list of all coursevideos, and analysts can select the video they are interested in. TheDashboard View shows the information of the clickstream data indifferent aspects, including the course information, the geographicdistribution, the video temporal information, the video popularity,and the animation. We also support multiple interactions such asfiltering and selecting.
The Content-based View is the center part of our system, whichprovides an in-depth analysis of the clickstream along with thevideo content. In this view, two visualizations are used to encodedifferent types of information. The event graph shows the distribu-tion of events on a video. We construct second-by-second countsfor six types of events and use a stacked graph to visualize them.We use the color channel to encode the event type, and the heightis used to encode the number of events. The graph helps analyzehow learners are engaged with the video content. The seek graphuses two parallel axes to encode the starting position and the endingposition of seeks. A line is drawn between two axes to connect thestarting and ending positions together for each seek event. We usedifferent colors to encode seek events happened on first watching(blue) or reviewing (orange). The upper part of the seek graph indi-cates forward seeks while the lower part represents backward seeks.We align the video with three visualizations using a highlighted lineto help connect the video content and detailed clickstream informa-tion together for better analysis.
277
IEEE Symposium on Visual Analytics Science and Technology 2014November 9-14, Paris, France978-1-4799-6227-3/14/$31.00 ©2014 IEEE

Together, these views form a complete system that allows ana-lysts to analyze the clickstream data.
3 FINDINGS
To demonstrate the usefulness and effectiveness of our system, weconduct case studies together with five experts. They can freelyexplore the clickstream data by using VisMOOC with their owncomputers. We select the major findings below.
Figure 2: The event graphs showing the clickstream data of thesame course during the same time period but for learners from dif-ferent countries. a) Learners from the U.S; b) Learners from China.
Finding I: We selected two user groups from the U.S. and China.The event graph clearly shows that the percentage of seek events inthe U.S is much larger than the one in China and this was not a sin-gle case: we explored more videos and found that the clickstreamdata of all the videos followed the same pattern. The experts triedto explain the phenomenon. One possible reason is that, from theirown experience in face-to-face education, more Chinese studentsprefer taking notes. Thus, when watching MOOC videos, Chineselearners may prefer pausing the video, taking notes, and playingit again. This can explain the lower percentage of seek events ofChinese learners.
Finding II: By exploring the data, the experts found that for dif-ferent in-video questions, although the event graphs show a simi-lar pattern, in the seek graphs, we can clearly observe the differ-ences. For instance, Figure 3 shows the differences between seekgraphs of two videos with in-video questions. For the video onthe left, there is a considerably large percentage of backward seeksaround the question while there are less backward seeks around thein-video question of the video on the right. This pattern clearly in-dicates that the first in-video question is harder for the learners. Theinstructors of this course also confirmed this finding.
Figure 3: Comparison between the Content-based views of twovideos with a in-video question. We can see that: there are a con-siderable number of forward seeks from the starting position to theposition of the in-video questions in both views; there are larger num-ber of backward seeks in view (a) than the number in view (b).
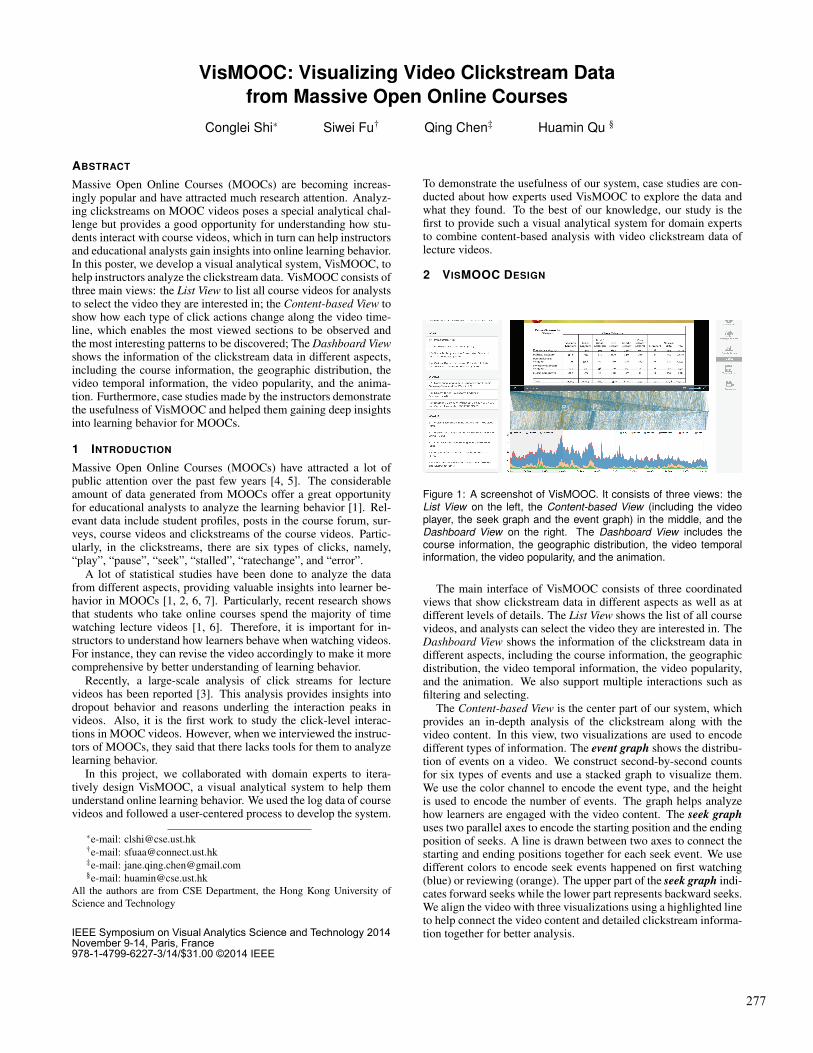
Figure 4: Two Content-based Views for the same video shown inFigure 1 but with different time periods. a) the clickstream data fromthe first week when the video was released; b) the clickstream datafrom the week when the related assignment was released.
Finding III: When the experts saw the Content-based View inFigure 1, they pointed out a strange pattern in the seek graph. Thereare two positions with dense backward seek events, however, theearlier position (P1) is mostly filled with orange seeks that hap-pened when learners reviewed the video, and the later one (P2) isdominated by blue seeks that happened when learners first watchedthe video. From the event graph, both positions correspond toa peak. By examining the video content at position (P1), the in-structors of this course figured out that the video content relates tothe assignment as well as the final exam. Thus, when we selectedonly the clickstream data before the assignment and the exam (Fig-ure 4(a)), the first peak of re-watched seek events disappeared. Tofurther confirm whether the assignment or the exam led to the phe-nomenon, the instructors selected the assignment release day andthe exam day separately, and finally confirmed that this pattern wastriggered by the assignment (Figure 4(b)).
4 CONCLUSION AND FUTURE WORK
In this paper, we have presented VisMOOC, a visual analytical sys-tem to help instructors and educational analysts understand onlinevideo watching behavior using clickstream data from Coursera. Inthe future, our work can be extended in two directions. The first di-rection is to extend VisMOOC by analyzing forum data and gradingdata together with clickstream data. Such conjoint analysis couldfurther help experts understand the learning behavior. For instance,the grading information can provide the ground truth about howwell the learners perform, which would offer a new opportunity toidentify different learning patterns between learners who get highergrades and those with lower grades. The other direction is to gener-alize this system for analyzing general online videos, which wouldbenefit online advertising and video making.
REFERENCES
[1] L. Breslow and D. Pritchard. Studying Learning in the Worldwide:Classroom Research into edXs First MOOC. Research and Practice inAssessment 8, 8(Summer 2013):13–25, 2013.
[2] A. D. Ho, J. Reich, S. O. Nesterko, D. T. Seaton, T. Mullaney, J. Waldo,and I. Chuang. HarvardX and MITx: The First Year of Open OnlineCourses, Fall 2012-Summer 2013. SSRN Electronic Journal, (1), 2014.
[3] J. Kim, P. J. Guo, D. T. Seaton, P. Mitros, K. Z. Gajos, and R. C. Miller.Understanding In-Video Dropouts and Interaction Peaks in Online Lec-ture Videos. In ACM Conference on Learning at Scale, pages 51–60.ACM Press, 2014.
[4] A. McAuley, B. Stewart, G. Siemens, and D. Cormier. The MOOCmodel for digital practice. SSHRC Knowledge Synthesis Grant on theDigital Economy, 2010.
[5] L. Pappano. The Year of the MOOC. The New York Times, 2012.[6] D. T. Seaton, Y. Bergner, I. Chuang, P. Mitros, and D. E. Pritchard.
Who Does What in a Massive Open Online Course ? Communicationsof the ACM, 2013.
[7] K. Stephens-Martinez, M. Hearst, and A. Fox. Monitoring MOOCs:Which Information Sources Do Instructors Value? In ACM Conferenceon Learning at Scale, pages 79–88. ACM Press, 2014.
278


![Reading between Lines: High-rate, Non-intrusive Visual ...winlab.rutgers.edu/~gruteser/papers/p157-shi.pdf(e.g., see Figure 1 of [16]), and often link the physical objects (or products](https://img.pdfslide.net/doc/110x75/5ebb5a587b60fc08946ac864/reading-between-lines-high-rate-non-intrusive-visual-gruteserpapersp157-shipdf.jpg)


![VisMOOC: Visualizing Video Clickstream Data from Massive ...conglei.me/files/publication/vismooc.pdf · specially designed for e-learning lecture videos. CLAS [22] is a collaborative](https://img.pdfslide.net/doc/110x75/5fb544511c0d0646e616605b/vismooc-visualizing-video-clickstream-data-from-massive-specially-designed.jpg)