Embed Size (px)
Citation preview
VISTA GROUP 2017 FULL YEAR RESULTS
28 February 2018
• Introduction and 2017 Highlights
• Financial Results
• Operational update
• Vista China – Opportunities and increase in equity
• Outlook
• Questions
22

VISTA GROUP FY17 SUMMARY• Another great year of growth advancing global leadership for Vista Group
o 20% increase in Revenue – the 4th consecutive year of 20+% growth
o 57% increase in Operating Profit
o 104% increase in Operating Cash Flow
o 20% increase in recurring revenue to $64m – 60% of total revenue
o 31% CAGR for Revenue and 38% CAGR for EBITDA since IPO
• Maintained very strong balance sheet, low debt and strong cash position
• Advanced our strategy of moving to controlling positions in our investments through
transactions in China and Latin America
• Appointment and transition of new CEO
• Outlook remains very strong.
3

FINANCIAL HIGHLIGHTS
TOTAL REVENUE
$106.6m(up 20%)
OPERATING PROFIT
$20.4m(up 57%)
OPERATING CASHFLOW
$11.0m(up 104%)
EBITDA1
$25.0m(up 42%)
FINAL DIVIDEND
1.74CENTS P/SHARE
(Total FY17 dividend up 28%)
RECURRING REVENUE
$64.3m(up 20%)
EBITDA is a Non-GAAP measure and is defined as earnings before net finance expense, income tax, depreciation, amortisation, acquisition costs and equity-accounted results from associate companies.
Expenses related to the VCL deferred consideration is also excluded. This is consistent with the measure used in the Prospectus dated 3 July 2014. Depreciation and amortisation in 2017 $3.6m (2016: $3.3m).
4

• As announced on 24 January Kimbal will take over the
role of VGL Chief Executive from 3 April 2018
• Kimbal will take part in the investor call and roadshow to
meet major stakeholders
• Kimbal has lead Vista Entertainment for the last 4 years,
a period of significant growth and development for the
business which has seen that business unit as a high
growth driver for VGL as a whole
• Prior to his role within VGL Kimbal has had an extensive
career in senior executive roles in the IT and services
industries in New Zealand and overseas.
5
INTRODUCING –KIMBAL RILEY
• Focusing on Group Wide product strategy to improve synergies across Vista Group
• Working directly with product managers to assist in product directions
• Ensuring we maximise the commercial value of our products
• Meeting more with customers and industry to better determine market requirements
• Assist with our product marketing initiatives
• Evaluating new development opportunities and possible acquisitions
• Continuing work with the Vista Board.
MURRAY HOLDAWAYCHIEF PRODUCT OFFICER
6

ADDITIONAL GROUP
COMPANIES
CINEMA
MOVIO
ASSOCIATES
EARLY STAGE
INVESTMENTS
OPERATING SEGMENTS

TRADING PERFORMANCE
• Another year of 20%+ Revenue Growth
• Profit and EBITDA improvements as some operating leverage achieved across the Group.
For twelve months ended
NZ$m 31 Dec 2017 31 Dec 2016 %
Revenue 106.6 88.6 20.3%
Expenses 87.0 74.2 17.3%
Foreign exchange losses / (gains) (0.8) 1.4
Operating Profit 20.4 13.0 56.9%
Other Revenue / (costs)excluding capital gain on 2016 China transaction
(3.6) (1.1)
Profit Before TaxExcluding capital gain on 2016 China transaction
16.8 11.9 41.2%
Capital Gain – 2016 China transaction 0.0 41.1
Profit Before Tax 16.8 53.0 -68.3%
Net Profit attributable to Vista Group Shareholders 9.7 48.6 -80.0%
NZ$m 2017 Actual 2016 Actual
EBITDA 25.0 17.6 42.0%
Note: EBITDA is a Non-GAAP measure and is defined as earnings before net finance expense, income tax, depreciation, amortisation, acquisition costs and
equity-accounted results from associate companies. Expenses related to the VCL deferred consideration is also excluded. This is consistent with the
measure used in the Prospectus dated 3 July 2014. Depreciation and amortisation in 2017 $3.6m (2016: $3.3m).
8

VISTA GROUP – Revenue Analysis
0
20
40
60
80
100
120
2013 2014 2015 2016 2017
$m
's
REVENUE ANALYSIS
Other
Maintenance
License Fees
21%INCREASE IN VALUE OF
RECURRING REVENUE
OVER 2016 TO $64M
20%REVENUE GROWTH
OVER 2016
9

OPERATING SEGMENTS
2017Cinema Movio
Additional
Group
Companies
Early Stage
Investments Corporate TotalNZ$M
Revenue 67.6 15.5 12.3 1.2 10.0 106.6
EBITDA 19.8 3.6 0.6 (1.7) 2.7 25.0
2016Cinema Movio
Additional
Group
Companies
Early Stage
Investments Corporate TotalNZ$M
Revenue 62.1 11.3 12.1 0.6 2.5 88.6
EBITDA 14.8 1.7 3.6 (1.3) (1.2) 17.6
Note: EBITDA is a Non-GAAP measure and is defined as earnings before net finance expense, income tax, depreciation, amortisation, acquisition costs and equity-accounted results from associate companies.
Expenses related to the VCL deferred consideration is also excluded. This is consistent with the measure used in the Prospectus dated 3 July 2014. Depreciation and amortisation in 2017 $3.6m (2016: $3.3m).
• Cinema segment grew 22% on a like for like basis excluding Vista China revenue in 2016 ($6.7m).
• China localisation revenue reported in Corporate but the cost of delivery is embedded within Vista Cinema and Movio.
• Strong growth in core segments. Below par result in Additional Group Companies segment. Significant Opportunity for
uplift in future periods in this segment.
10
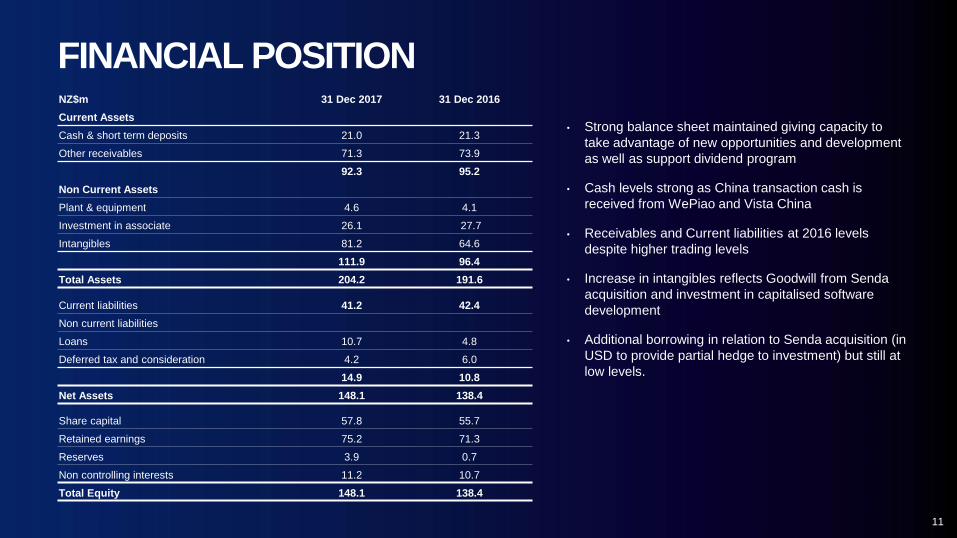
• Strong balance sheet maintained giving capacity to
take advantage of new opportunities and development
as well as support dividend program
• Cash levels strong as China transaction cash is
received from WePiao and Vista China
• Receivables and Current liabilities at 2016 levels
despite higher trading levels
• Increase in intangibles reflects Goodwill from Senda
acquisition and investment in capitalised software
development
• Additional borrowing in relation to Senda acquisition (in
USD to provide partial hedge to investment) but still at
low levels.
FINANCIAL POSITIONNZ$m 31 Dec 2017 31 Dec 2016
Current Assets
Cash & short term deposits 21.0 21.3
Other receivables 71.3 73.9
92.3 95.2
Non Current Assets
Plant & equipment 4.6 4.1
Investment in associate 26.1 27.7
Intangibles 81.2 64.6
111.9 96.4
Total Assets 204.2 191.6
Current liabilities 41.2 42.4
Non current liabilities
Loans 10.7 4.8
Deferred tax and consideration 4.2 6.0
14.9 10.8
Net Assets 148.1 138.4
Share capital 57.8 55.7
Retained earnings 75.2 71.3
Reserves 3.9 0.7
Non controlling interests 11.2 10.7
Total Equity 148.1 138.4
11

• Strong cash receipts from trading drives increase in operating cash flow
• Investment activity includes investment in Senda, capitalised software development and operating assets offset by cash receipts from WePiao for Vista China share sale
• Loans and borrowings shows the additional USD loan in relation to the Senda acquisition
• 2016 final dividend paid in March and 2017 interim dividend paid in September
• Overall cash outlook remains strong with the business generating cash and some receipts (circa $10m) still due from Vista China.
CASH FLOWFor twelve months ended
NZ$m 31 Dec 2017 31 Dec 2016
Receipts from customers 105.1 69.7
Cash was applied to:
Payments to suppliers (87.1) (58.5)
Tax & interest (7.0) (5.8)
(94.1) (64.3)
Net cash flow from operating 11.0 5.4
Cash applied to investing activities
Investments – including business acquisitions (10.4) (12.1)
Proceeds from divestments 8.3 0.0
Other investing activities (8.3) (5.9)
(10.4) (18.0)
Cash from financing activities
Proceeds from Share Issue 0.0 8.0
Loans and borrowings 6.5 0.0
Dividends paid (6.4) -
0.1 8.0
Net movement in cash held (0.7) (4.6)
Foreign exchange differences (1.0) (1.4)
Cash balance 21.0 21.3
12
• The directors have resolved to pay a final dividend at the top of the
policy range (50%) and that the dividend will carry full imputation credits
• The value of the dividend will be 1.74 cents per share representing a
total payment of $2.9m
• The record date for the dividend is 5pm on Monday, 12 March 2018 with
the payment date set for Friday, 23 March 2018
• This is in addition to the interim dividend declared and paid in
September 2017 of 2.40 cents per share (equivalent to 1.20 cents per
share after the 2 for 1 share split undertaken in November 2017)
• Total FY17 dividend 28% increase on FY16.
DIVIDEND PROPOSAL
13

VISTA GROUPOPERATIONAL HIGHLIGHTS
14

CINEMA SEGMENT
15
-
200
400
600
800
1,000
1,200
2009 2010 2011 2012 2013 2014 2015 2016 2017
NEW SITES ADDED
existing customers new customers
0
1000
2000
3000
4000
5000
6000
7000
2009 2010 2011 2012 2013 2014 2015 2016 2017
TOTAL SITE COUNT
Total Sites
14%growth in total
sites to 6,350
10%increase in average site
license to $30k
Vista Cinema provides cinema management software to the world’s largest cinema exhibitors
• 793 new sites in 2017 bringing total to 6350
• New markets — Brazil and Italy
• 93 installed countries - increase of 11
• 8 out of the 10 largest cinema exhibitors use Vista Cinema within their circuits.

CINEMA SEGMENT - continued
Provides cinema management software to the world’s independent cinema exhibitors
• 112 sites bring site numbers to 643. 8% increase in revenue per site.
• Release of new chargeable additional modules, including Kiosk and Veezi Voucher & Gift Card Manager
• New business partners signed in EMEA
• Your Cinema by Flicks web sites added as additional service, helping drive online sales and revenue.
Over 50 signups in 2017
• Revenue sharing deals signed with payment providers.
16
23%growth in contracted
sites to 643
8%increase in site
revenue to $517 p.mth
30%increase in ARR
to $4.0m
0
100
200
300
400
500
600
700
2013 2014 2015 2016 2017
VEEZI - TOTAL SITE COUNT
27
countries with
sites using Veezi

• Cloud version for Vista Cinema on track with first modules
delivered Q1 2018. Expectation of new demand for this
product
• Continued product innovation meeting new market demands
Complex Food & Beverage, Mobile self service
• Competitive wins in USA
• Expansion into new markets – Brazil, Italy, Japan
• Significant demand in Latin America, Eastern Europe and new
market of Saudi Arabia
• New direct presence in South Africa to capture expected
growth in Africa
• China – refer to separate slide.
• Strong expectation of growth in China
• Legislative changes driving demand in France
• Packaging hardware to address 500+ sites in USA
• Revenue Share deals with partners to drive added
revenue per site
• Virtual Reality rooms.
CINEMA SEGMENT - continued
17
DRIVERS FOR GROWTH
MOVIO SEGMENT
18
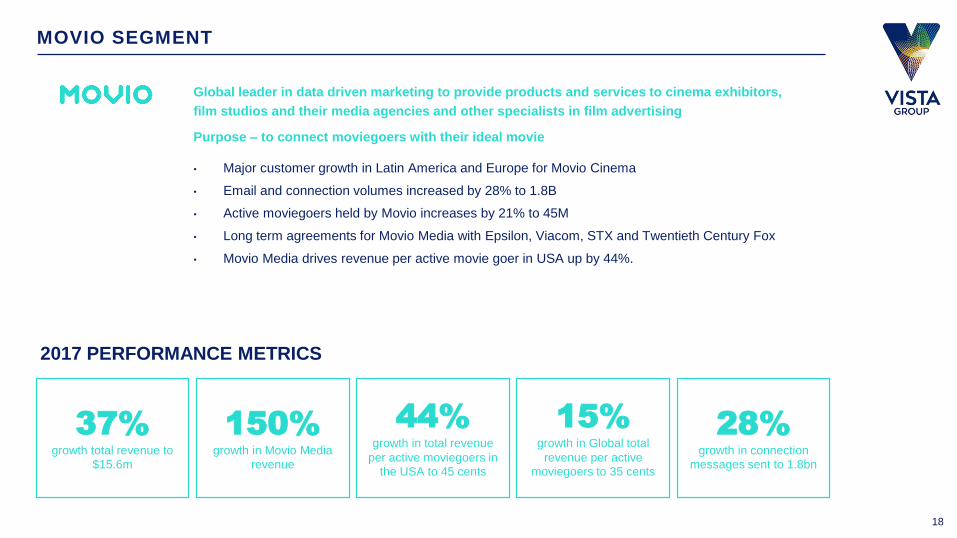
37%growth total revenue to
$15.6m
150%growth in Movio Media
revenue
15%growth in Global total
revenue per active
moviegoers to 35 cents
28%growth in connection
messages sent to 1.8bn
44%growth in total revenue
per active moviegoers in
the USA to 45 cents
Global leader in data driven marketing to provide products and services to cinema exhibitors,
film studios and their media agencies and other specialists in film advertising
Purpose – to connect moviegoers with their ideal movie
• Major customer growth in Latin America and Europe for Movio Cinema
• Email and connection volumes increased by 28% to 1.8B
• Active moviegoers held by Movio increases by 21% to 45M
• Long term agreements for Movio Media with Epsilon, Viacom, STX and Twentieth Century Fox
• Movio Media drives revenue per active movie goer in USA up by 44%.
2017 PERFORMANCE METRICS

MOVIO SEGMENT
19
GROWTH STRATEGY
• Increase active moviegoers held by Movio
o Increase Movio Cinema users including non Vista Cinema
users
o Increase access to online moviegoers outside direct loyalty
membership
o Increase channels to access data on active moviegoers to
increase overall potential data set
• Increase Revenue per active moviegoer
o Increase USA revenue per active movie goer as media
campaigns usage lifts and number of channels grows
o Activate Movio Media in additional territories outside the USA
o Increase Revenue per active movie goer outside the USA as
media campaigns commence using USA successes as a
template.
Active Moviegoers
(millions)
2016 2017
Revenue/Active
Moviegoer (NZD cents)
2016 2017
USA 22 24 31 45
Rest of World 16 21 28 23
Global 38 45 30 35
MOVIEGOERS
• Extend reach through Vista
Cinema user base
• Extend use of generic API for
non Vista Cinema users. In use
with Cinemark Brazil.
AUDIENCE
• Productisation of Movio Insights
module for advanced targeting of
active members
• Employ machine learning to
move beyond simple demographic
targeting
CONNECT
• Increase the channels to reach
moviegoers with targeted
campaigns
• Beyond email & SMS to digital
targeting via the web, social and
mobile applications
• Extend relationships with channel
partners (Epsilon, Viacom etc)
MEASURE
• Unique benefit of the ability to
track actual transaction activity (via
cinema POS partners) driven by a
campaign
• Enhance post campaign
measurement of campaign
effectiveness
World leading film marketing products
• Strong growth in revenue and EBITDA
• Created 46% more movie destination sites (1,300) in 2017
• 87 of the top 100 grossing movies used the Powster Movie platform with total site visits up 290% to 422m
• Opened LA studio and completed successful entry to the USA.
Provides world leading theatrical distribution software• Tough year for MACCS which impacted on this segments overall result
• Heavily focused on completion of Warner Bros. USA implementation - large and complex
• New CEO to be appointed to lead next phase
• 5,500+ cinema sites delivering weekly audited box office results to MACCSBox.
Movie and cinema review and showtime guide
• Site visits up 34% to 6.6m and page visits up 42% to 17.9m in Australia
• Now the largest independent movie site in Australasia.
ADDITIONAL GROUP COMPANIES SEGMENT
20

Software to optimise film forecasting and scheduling
• Strong 2nd half performance with high percentage of recurring revenue
• Increased pipeline and closure of 2 significant contracts for 2018 implementation
• Market opportunity large as penetration of Vista Cinema customers still low
• Many opportunities for new products to complement the Vista Cinema product suite
• Targeted to have positive EBITDA in 2018.
A new platform to share film digital assets & enable new cinema
ticketing sales channels to access cinema exhibitors
• MX Film now producing revenue with 10 customers in USA and Australia
• MX Film has very wide potential customer set
• MX Tickets had transaction volumes and revenue ahead of internal targets in FY17
• Currently only deployed in USA but a global opportunity.
Social app to share video reaction to movies and tv shows
• Active user numbers growing well since launch now at 24,000 and on target to reach key milestone of 50,000
• Activity rates (videos posted and reactions) increasing month on month. 20K reaction videos posted in December 2017.
EARLY STAGE INVESTMENTS SEGMENT
21

ASSOCIATE COMPANIES
Box office tracking and reporting product
• Reached $1M NZD ARR by Q4 2017
• Targeting positive EBITDA by end of 2018
• Transitioning Australasian trial users to full commercial terms through 2018
• Customer feedback on product is very positive
• China cinema data being reported with 3 major US studios contracted
• Collection for Korea, South Africa, Malaysia/Singapore services commenced, other key territories being added
through 2018
• USA market a key focus for 2018.
22

CHINA – A POTENTIAL GROWTH ENGINE
• Revenue of NZ$17m, an increase of 71% over FY16
• Vista Cinema 12% of large competitive market
• Veezi gained first sites in China in 2017
• $21m NZD cash repatriated to New Zealand to date.
23
GROWTH
• Third Party revenue (Vista share of online ticket sales) – already significant with huge upside
• Mobile and Web opportunities for cinemas
• Site market share – huge opportunity to grow from present market share as China cinema matures
• Movio – huge data opportunity with assistance from JV partner; localisation now complete
• Veezi – almost ‘unlimited’ upside with opportunities to gain sites in large ‘batches’
• Wider sales for Numero China data.
VISTA CHINA TRANSACTION DETAILS
• Execution of strategy to consolidate or achieve control of our investments.
• Vista Group to acquire 7.9% of the equity in Vista China which was held by WePiao – Vista
Group and WePiao will each own 47.5% of Vista China.
• Vista China will become a controlled entity and its results will be consolidated from the date
regulatory approval is obtained.
• The $NZD7.7m price for this 7.9% stake (based on the original valuation of Vista China in
2016) has been ‘off-set’ against the monies outstanding from WePiao to Vista Group. Final
amounts owed by WePiao under the transaction have now been settled.
• This is a very positive result for Vista Group and will enable the growth in Vista China, and
the impact of the China market as a whole, to be better reflected within the Vista Group
results.
• This will be revenue and earnings accretive to Vista Group from the date of consolidation.
24

• Strong pipeline across the Group supports a 5th consecutive year of 20+% revenue
growth
• New CEO and Chief Product Officer brings new focus to each role to benefit the
Group overall
• Penetration of new markets and emerging large markets provides significant
growth opportunities across all businesses
• Exciting new capabilities in the Movio product suite, and Increased take-up of
Movio Media with signed deals and increasing digital spend provides strong driver
of revenue per active movie goer
• Vista China is ideally positioned to exploit the size continued growth to now be
consolidated in Vista Group results
• The Global cinema market continues to show strength, admissions and box office
increasing in many territories, driving a continued growth in sites and screens,
which create opportunities for all group companies
OUTLOOK
25

QUESTIONS?

IMPORTANT NOTICEThis presentation has been prepared by Vista Group International Limited (“Vista Group”).
Information in this presentation:
• is provided for general information purposes only, does not purport to be complete or comprehensive and is not
an offer or invitation for subscription, purchase or recommendation of securities in Vista Group. This presentation
does not constitute investment advice;
• should be read in conjunction with, and is subject to, Vista Group’s financial statements, market releases and
information published on Vista Group’s website (www.vistagroup.co.nz);
• may include projections or forward looking statements about Vista Group and the environment in which Vista
Group operates. Such forward-looking statements are based upon current expectations and involve risks,
uncertainties and contingencies outside of Vista Group’s control. Vista Group’s actual results or performance
may differ materially from these statements. Although management may indicate and believe the assumptions
underlying the forward looking statements are reasonable, any assumptions could prove inaccurate or incorrect
and, therefore, there can be no assurance that the results contemplated in the forward looking statements will be
realised;
• may include statements relating to past performance, which should not be regarded as a reliable indicator of
future performance.
While all reasonable care has been taken in compiling this presentation, Vista Group accepts no responsibility for any
errors or omissions.
All information in this presentation is current at the date of this presentation, unless otherwise stated.
All currency amounts are in NZ dollars, unless stated otherwise.
2