Embed Size (px)
Citation preview
VISTA GROUP INTERNATIONAL
ANNUAL FINANCIALSTATEMENTS

01Vista Group International Limited
2 Corporate Information
4 Directors’ Report
5 Independent Auditors’ Report
7 Financial Statements
11 Notes to the Financial Statements
TABLE OF
CONTENTS
02Vista Group International Limited
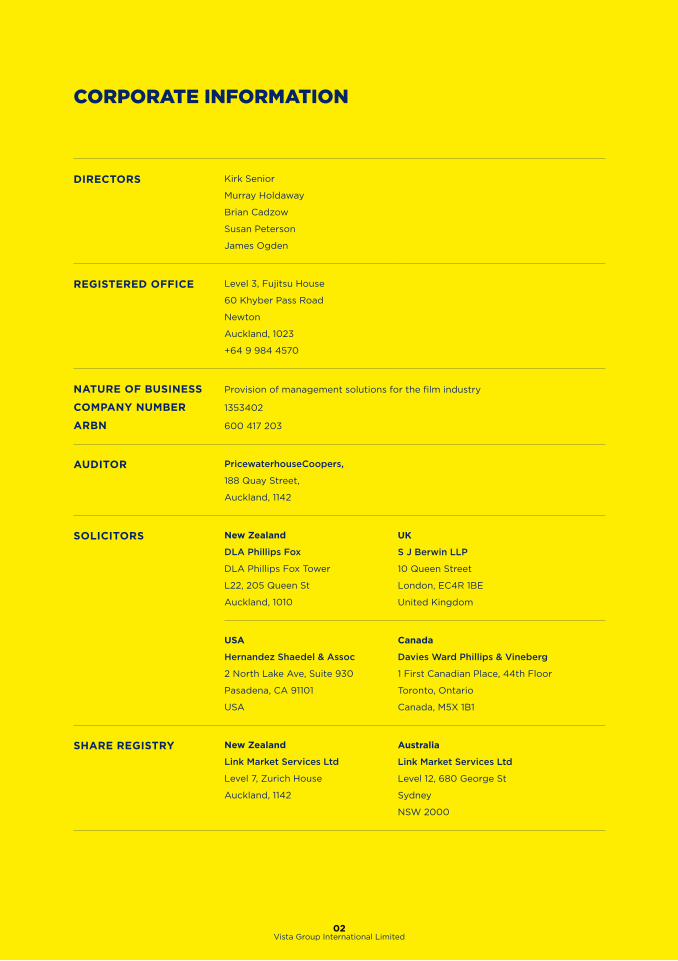
DIRECTORS Kirk Senior
Murray Holdaway
Brian Cadzow
Susan Peterson
James Ogden
REGISTERED OFFICE Level 3, Fujitsu House
60 Khyber Pass Road
Newton
Auckland, 1023
+64 9 984 4570
NATURE OF BUSINESS Provision of management solutions for the film industry
COMPANY NUMBER 1353402
ARBN 600 417 203
AUDITOR PricewaterhouseCoopers,
188 Quay Street,
Auckland, 1142
SOLICITORS New Zealand
DLA Phillips Fox
DLA Phillips Fox Tower
L22, 205 Queen St
Auckland, 1010
UK
S J Berwin LLP
10 Queen Street
London, EC4R 1BE
United Kingdom
USA
Hernandez Shaedel & Assoc
2 North Lake Ave, Suite 930
Pasadena, CA 91101
USA
Canada
Davies Ward Phillips & Vineberg
1 First Canadian Place, 44th Floor
Toronto, Ontario
Canada, M5X 1B1
SHARE REGISTRY New Zealand
Link Market Services Ltd
Level 7, Zurich House
Auckland, 1142
Australia
Link Market Services Ltd
Level 12, 680 George St
Sydney
NSW 2000
CORPORATE INFORMATION

03Vista Group International Limited
BANKERS New Zealand
ASB Bank Limited
PO Box 35
Shortland Street
Auckland, 1140
Bank of New Zealand
Deloitte Centre
80 Queen Street
Auckland, 1142
UK
Barclays Bank PLC
1 Churchill Place
London, E14 5HP
United Kingdom
HSBC Bank PLC
2nd Floor, 62-76 Park Street
London, SE1 9DZ
United Kingdom
USA
HSBC Bank USA, NA
660 South Figueroa Street
Los Angeles
California 90017
United States of America
Union Bank of California
Beverly Hills Priority 560
P O Box 512380
Los Angeles
California 90051
United States of America
Bank of America
San Francisco
P O Box 37000
California 94137
United States of America
China
HSBC Bank (China) Coy. Ltd.
Level 30, HSBC Building
Shanghai ifc
8 Century Avenue, Pudong
Shanghai 200120
People’s Republic of China
China Merchant Bank
18F, Bus Plaza
No.398 Huaihai Zhong Road
Shanghai 200020
People’s Republic of China
Australia
Commonwealth Bank of Australia
Level 10, 101 George Street
Parramatta
NSW 2150
Australia
04Vista Group International Limited
DIRECTORS’ REPORT
The Board of Directors present the financial statements of the Group for the year ended 31 December 2015 and the
independent auditor’s report thereon.
For and on behalf of the Board of Directors who approved these financial statements for issue on 26 February 2016.
Kirk Senior M Holdaway
CHAIRMAN DIRECTOR
26 February 2016 26 February 2016
05Vista Group International Limited
Report on the Financial StatementsWe have audited the Group financial statements of Vista Group International Limited (“the Company”) on pages 7 to 49, which comprise the statement of financial position as at 31 December 2015, the statement of comprehensive income, the statement of changes in equity and the statement of cash flows for the year then ended, and the notes to the financial statements that include a summary of significant accounting policies and other explanatory information for the Group. The Group comprises the Company and the entities it controlled at 31 December 2015 or from time to time during the financial year.
Directors’ Responsibility for the Financial StatementsThe Directors are responsible for the preparation and fair presentation of these financial statements in accordance with New Zealand Equivalents to International Financial Reporting Standards and International Financial Reporting Standards and for such internal controls as the Directors determine are necessary to enable the preparation of financial statements that are free from material misstatement, whether due to fraud or error.
Auditors’ ResponsibilityOur responsibility is to express an opinion on these financial statements based on our audit. We conducted our audit in accordance with International Standards on Auditing (New Zealand) and International Standards on Auditing. These standards require that we comply with relevant ethical requirements and plan and perform the audit to obtain reasonable assurance about whether the financial statements are free from material misstatement.
An audit involves performing procedures to obtain audit evidence about the amounts and disclosures in the financial statements. The procedures selected depend on the auditors’ judgement, including the assessment of the risks of material misstatement of the financial statements, whether due to fraud or error. In making those risk assessments, the auditors consider the internal controls relevant to the Company’s preparation and fair presentation of the financial statements in order to design audit procedures that are appropriate in the circumstances, but not for the purpose of expressing an opinion on the effectiveness of the Company’s internal control. An audit also includes evaluating the appropriateness of accounting policies used and the reasonableness of accounting estimates, as well as evaluating the overall presentation of the financial statements.
We believe that the audit evidence we have obtained is sufficient and appropriate to provide a basis for our audit opinion.
We are independent of the Group. Our firm carries out other services for the Group in the areas of related assurance services and executive remuneration advice. The provision of these other services has not impaired our independence.
Independent Auditors’ Reportto the shareholders of Vista Group International Limited
PricewaterhouseCoopers, 188 Quay Street, Private Bag 92162, Auckland 1142, New Zealand T: +64 9 355 8000, F: +64 9 355 8001, pwc.co.nz
06Vista Group International Limited
Independent Auditors’ ReportVista Group International Limited
OpinionIn our opinion, the financial statements on pages 7 to 49 present fairly, in all material respects, the financial position of the Group as at 31 December 2015, and its financial performance and cash flows for the year then ended in accordance with New Zealand Equivalents to International Financial Reporting Standards and International Financial Reporting Standards.
Restriction on Use of our ReportThis report is made solely to the Company’s shareholders, as a body, in accordance with the Companies Act 1993. Our audit work has been undertaken so that we might state those matters which we are required to state to them in an auditors’ report and for no other purpose. To the fullest extent permitted by law, we do not accept or assume responsibility to anyone other than the Company and the Company’s shareholders, as a body, for our audit work, for this report or for the opinions we have formed.
Chartered Accountants Auckland, New Zealand 26 February 2016
07Vista Group International Limited
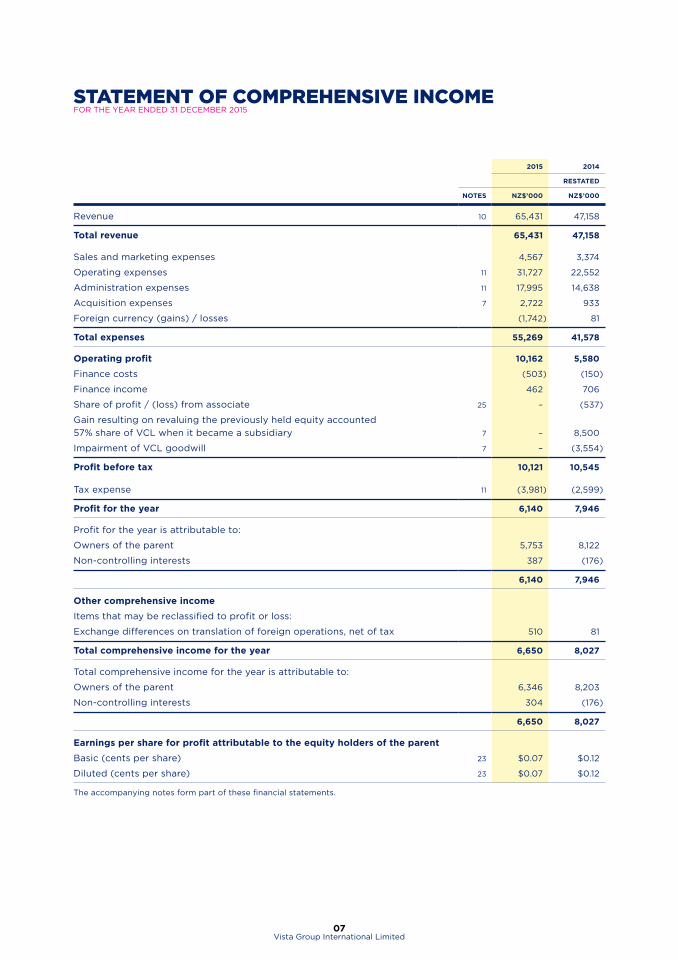
STATEMENT OF COMPREHENSIVE INCOMEFOR THE YEAR ENDED 31 DECEMBER 2015
2015 2014
RESTATED
NOTES NZ$’000 NZ$’000
Revenue 10 65,431 47,158
Total revenue 65,431 47,158
Sales and marketing expenses 4,567 3,374
Operating expenses 11 31,727 22,552
Administration expenses 11 17,995 14,638
Acquisition expenses 7 2,722 933
Foreign currency (gains) / losses (1,742) 81
Total expenses 55,269 41,578
Operating profit 10,162 5,580
Finance costs (503) (150)
Finance income 462 706
Share of profit / (loss) from associate 25 – (537)
Gain resulting on revaluing the previously held equity accounted
57% share of VCL when it became a subsidiary 7 – 8,500
Impairment of VCL goodwill 7 – (3,554)
Profit before tax 10,121 10,545
Tax expense 11 (3,981) (2,599)
Profit for the year 6,140 7,946
Profit for the year is attributable to:
Owners of the parent 5,753 8,122
Non-controlling interests 387 (176)
6,140 7,946
Other comprehensive income
Items that may be reclassified to profit or loss:
Exchange differences on translation of foreign operations, net of tax 510 81
Total comprehensive income for the year 6,650 8,027
Total comprehensive income for the year is attributable to:
Owners of the parent 6,346 8,203
Non-controlling interests 304 (176)
6,650 8,027
Earnings per share for profit attributable to the equity holders of the parent
Basic (cents per share) 23 $0.07 $0.12
Diluted (cents per share) 23 $0.07 $0.12
The accompanying notes form part of these financial statements.
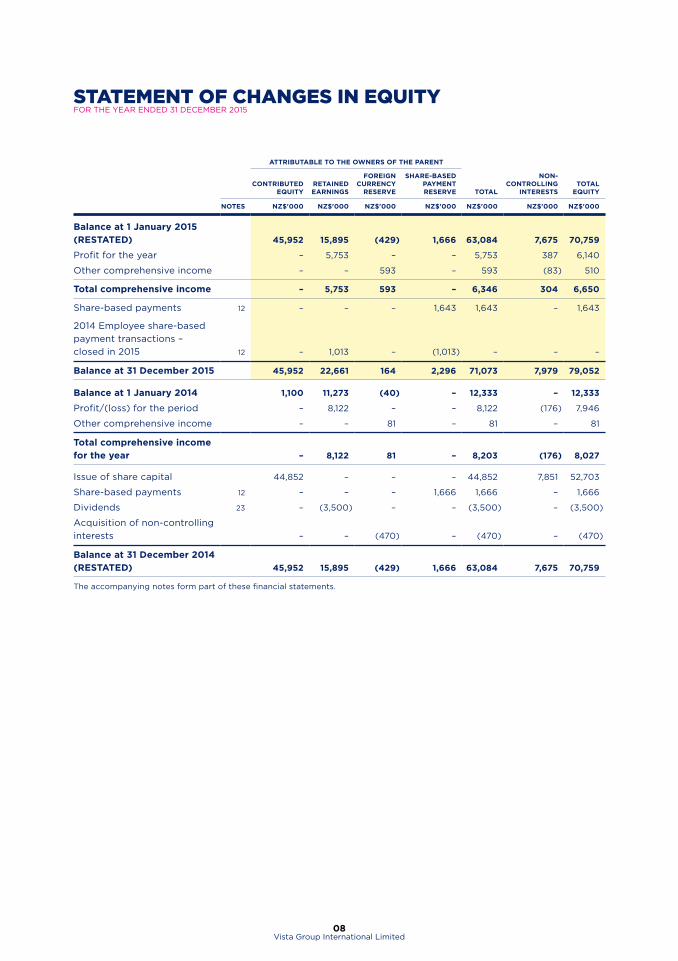
08Vista Group International Limited
ATTRIBUTABLE TO THE OWNERS OF THE PARENT
CONTRIBUTED EQUITY
RETAINED EARNINGS
FOREIGN CURRENCY
RESERVE
SHARE-BASED PAYMENT RESERVE TOTAL
NON-CONTROLLING
INTERESTSTOTAL
EQUITY
NOTES NZ$'000 NZ$'000 NZ$'000 NZ$'000 NZ$'000 NZ$'000 NZ$'000
Balance at 1 January 2015
(RESTATED) 45,952 15,895 (429) 1,666 63,084 7,675 70,759
Profit for the year – 5,753 – – 5,753 387 6,140
Other comprehensive income – – 593 – 593 (83) 510
Total comprehensive income – 5,753 593 – 6,346 304 6,650
Share-based payments 12 – – – 1,643 1,643 – 1,643
2014 Employee share-based
payment transactions –
closed in 2015 12 – 1,013 – (1,013) – – –
Balance at 31 December 2015 45,952 22,661 164 2,296 71,073 7,979 79,052
Balance at 1 January 2014 1,100 11,273 (40) – 12,333 – 12,333
Profit/(loss) for the period – 8,122 – – 8,122 (176) 7,946
Other comprehensive income – – 81 – 81 – 81
Total comprehensive income
for the year – 8,122 81 – 8,203 (176) 8,027
Issue of share capital 44,852 – – – 44,852 7,851 52,703
Share-based payments 12 – – – 1,666 1,666 – 1,666
Dividends 23 – (3,500) – – (3,500) – (3,500)
Acquisition of non-controlling
interests – – (470) – (470) – (470)
Balance at 31 December 2014
(RESTATED) 45,952 15,895 (429) 1,666 63,084 7,675 70,759
The accompanying notes form part of these financial statements.
STATEMENT OF CHANGES IN EQUITYFOR THE YEAR ENDED 31 DECEMBER 2015
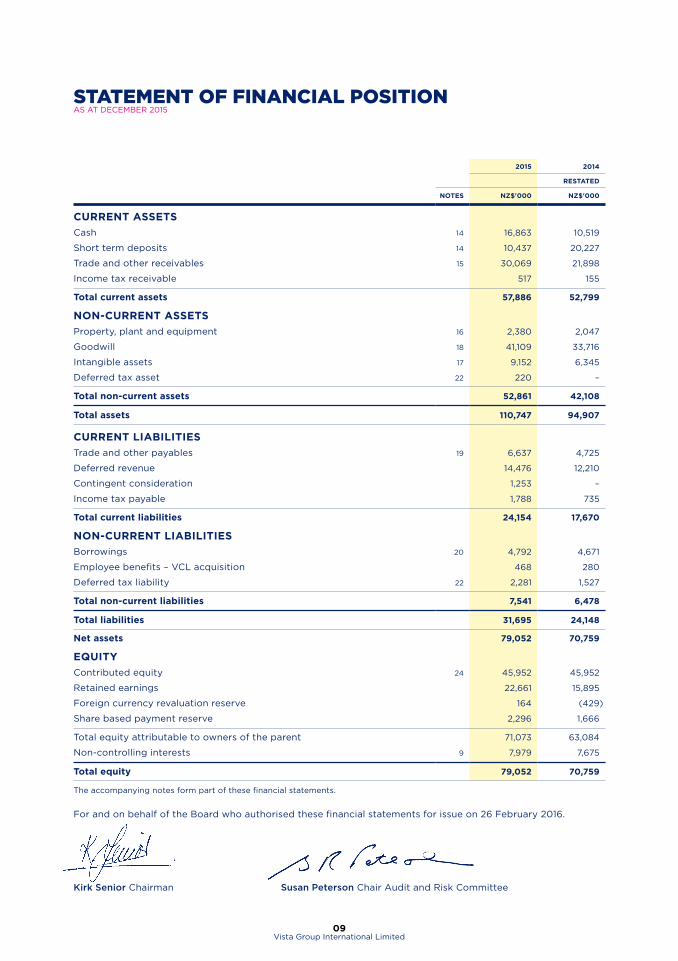
09Vista Group International Limited
STATEMENT OF FINANCIAL POSITIONAS AT DECEMBER 2015
2015 2014
RESTATED
NOTES NZ$'000 NZ$'000
CURRENT ASSETS
Cash 14 16,863 10,519
Short term deposits 14 10,437 20,227
Trade and other receivables 15 30,069 21,898
Income tax receivable 517 155
Total current assets 57,886 52,799
NON-CURRENT ASSETS
Property, plant and equipment 16 2,380 2,047
Goodwill 18 41,109 33,716
Intangible assets 17 9,152 6,345
Deferred tax asset 22 220 –
Total non-current assets 52,861 42,108
Total assets 110,747 94,907
CURRENT LIABILITIES
Trade and other payables 19 6,637 4,725
Deferred revenue 14,476 12,210
Contingent consideration 1,253 –
Income tax payable 1,788 735
Total current liabilities 24,154 17,670
NON-CURRENT LIABILITIES
Borrowings 20 4,792 4,671
Employee benefits – VCL acquisition 468 280
Deferred tax liability 22 2,281 1,527
Total non-current liabilities 7,541 6,478
Total liabilities 31,695 24,148
Net assets 79,052 70,759
EQUITY
Contributed equity 24 45,952 45,952
Retained earnings 22,661 15,895
Foreign currency revaluation reserve 164 (429)
Share based payment reserve 2,296 1,666
Total equity attributable to owners of the parent 71,073 63,084
Non-controlling interests 9 7,979 7,675
Total equity 79,052 70,759
The accompanying notes form part of these financial statements.
For and on behalf of the Board who authorised these financial statements for issue on 26 February 2016.
Kirk Senior Chairman Susan Peterson Chair Audit and Risk Committee
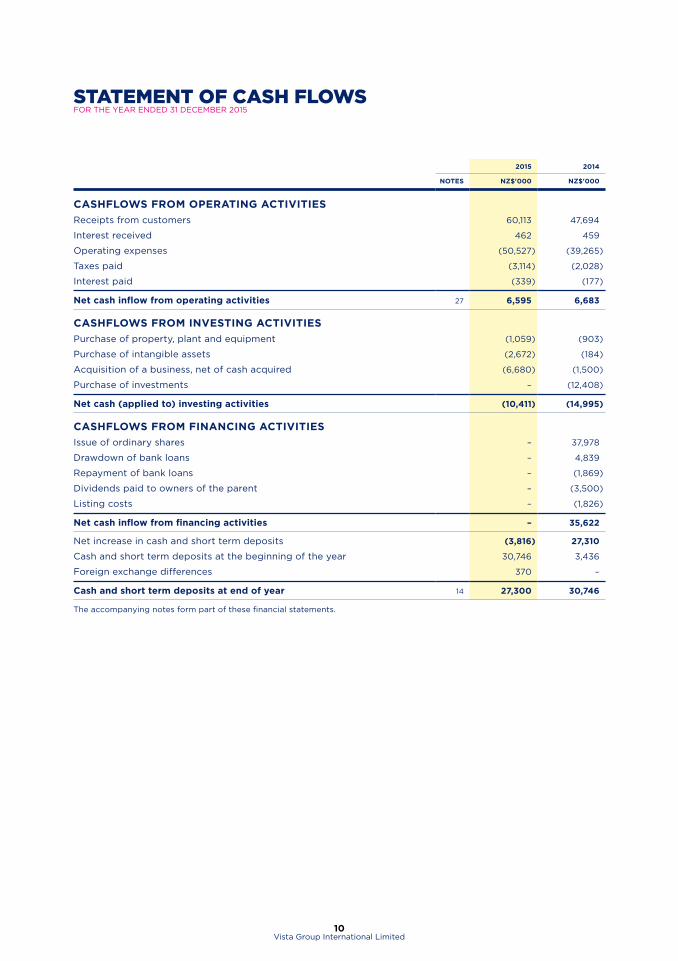
10Vista Group International Limited
2015 2014
NOTES NZ$'000 NZ$'000
CASHFLOWS FROM OPERATING ACTIVITIES
Receipts from customers 60,113 47,694
Interest received 462 459
Operating expenses (50,527) (39,265)
Taxes paid (3,114) (2,028)
Interest paid (339) (177)
Net cash inflow from operating activities 27 6,595 6,683
CASHFLOWS FROM INVESTING ACTIVITIES
Purchase of property, plant and equipment (1,059) (903)
Purchase of intangible assets (2,672) (184)
Acquisition of a business, net of cash acquired (6,680) (1,500)
Purchase of investments – (12,408)
Net cash (applied to) investing activities (10,411) (14,995)
CASHFLOWS FROM FINANCING ACTIVITIES
Issue of ordinary shares – 37,978
Drawdown of bank loans – 4,839
Repayment of bank loans – (1,869)
Dividends paid to owners of the parent – (3,500)
Listing costs – (1,826)
Net cash inflow from financing activities – 35,622
Net increase in cash and short term deposits (3,816) 27,310
Cash and short term deposits at the beginning of the year 30,746 3,436
Foreign exchange differences 370 –
Cash and short term deposits at end of year 14 27,300 30,746
The accompanying notes form part of these financial statements.
STATEMENT OF CASH FLOWSFOR THE YEAR ENDED 31 DECEMBER 2015
11Vista Group International Limited
1. GENERAL INFORMATIONVista Group International Limited (the ‘Company’ and its subsidiaries, collectively the Group) is a company incorporated
and domiciled in New Zealand, and whose shares are publicly traded on the New Zealand Stock Exchange (NZX)
and the Australian Securities Exchange (ASX). Vista Group International Limited completed an IPO in August 2014.
The principal activity of the Group is the sale, support and associated development of software for the film industry.
2. STATEMENT OF COMPLIANCEVista Group International Limited is a company registered under the Companies Act 1993 and is an FMC reporting
entity under Part 7 of the Financial Markets Conduct Act 2013. The financial statements of the Group have been
prepared in accordance with the requirements of Part 7 of the Financial Markets Conduct Act 2013 and the NZX
Main Board Listing Rules. In accordance with the Financial Markets Conduct Act 2013 because group financial
statements are prepared and presented for Vista Group International Limited and its subsidiaries, separate financial
statements for Vista Group International Limited are no longer required to be prepared and presented.
The consolidated financial statements of the Group have been prepared in accordance with Generally Accepted
Accounting Practice in New Zealand (NZ GAAP). The Group is a for-profit entity for the purposes of complying
with NZ GAAP. The consolidated financial statements comply with New Zealand equivalents to International
Financial Reporting Standards (NZ IFRS), other New Zealand financial reporting standards and authoritative
notices that are applicable to entities that apply NZ IFRS. The consolidated financial statements also comply
with International Financial Reporting Standards (IFRS).
3. ADOPTION OF NEW ACCOUNTING STANDARDSCertain new accounting standards and interpretations have been published that are not mandatory for 31 December
2015 reporting period and have not been early adopted by the Group. The key items applicable to the Group are:
NZ IFRS 15: Revenue from contracts with customers (effective date: annual periods beginning on or after 1 January 2018)
NZ IFRS 15 deals with revenue recognition and establishes principles for reporting useful information to users of
financial statements about the nature, amount, timing and uncertainty of revenue and cash flows arising from an
entity’s contracts with customers. Revenue is recognised when a customer obtains control of a good or service
and thus has the ability to direct the use and obtain the benefits from the good or service. The standard replaces
NZ IAS 18 ‘Revenue’ and NZ IAS 11 ‘Construction contracts’ and related interpretations. The standard is effective
for annual periods beginning on or after 1 January 2018. The Group intends to adopt NZ IFRS 15 on its effective
date and has yet to assess its full impact.
NZ IFRS 9: Financial Instruments (effective date: annual periods beginning on or after 1 January 2018)
IFRS 9 addresses the classification, measurement and derecognition of financial assets and financial liabilities and
introduces new rules for hedge accounting. In July 2014, the IASB made further changes to the classification and
measurement rules and also introduced a new impairment model. These latest amendments now complete the new
financial instruments standard. The standard is effective for accounting periods beginning on or after 1 January
2018. The Group intends to adopt NZ IFRS 9 on its effective date and has yet to assess its full impact.
IFRS 16: Leases (Effective date: periods beginning on or after 1 January 2019)
IFRS 16, ‘Leases’, which replaces the current guidance in IAS 17, was published by the International Accounting
Standards Board (IASB) in January 2016. The standard is yet to be issued by the External Reporting Board in
New Zealand. Under IFRS 16, a contract is, or contains, a lease if the contract conveys the right to control the use
of an identified asset for a period of time in exchange for consideration. Under IAS 17, a lessee was required to
make a distinction between a finance lease (on balance sheet) and an operating lease (off balance sheet). IFRS
16 now requires a lessee to recognise a lease liability reflecting future lease payments and a ‘right-of-use asset’
for virtually all lease contracts. The IASB has included an optional exemption for certain short-term leases and
leases of low-value assets; however, this exemption can only be applied by lessees. The standard is effective for
accounting periods beginning on or after 1 January 2019. Early adoption is permitted but only in conjunction with
NZ IFRS 15, ‘Revenue from Contracts with Customers. The Group intends to adopt IFRS 16 on its effective date
and has yet to assess its full impact.
There are no other standards that are not yet effective and that would be expected to have a material impact
on the Group.
NOTES TO THE FINANCIAL STATEMENTS
12Vista Group International Limited
4. SUMMARY OF SIGNIFICANT ACCOUNTING POLICIES
4.1 BASIS OF PREPARATION OF FINANCIAL STATEMENTS
The financial statements have been prepared on the basis of historical cost.
The statement of comprehensive income and the statement of changes in equity for the year ended 31 December
2014 and the statement of financial position as at 31 December 2014 have been restated, refer to Note 7.
4.2 BASIS OF CONSOLIDATION
The Group’s financial statements consolidate those of the company, Vista Group International Limited, and its
subsidiaries as at 31 December 2015. A subsidiary is an entity over which the Group has control. Control is achieved
when the Group is exposed, or has rights, to variable returns from its involvement with the investee and has the
ability to affect those returns through its power to direct the activities of the investee.
Consolidation of a subsidiary begins when the Group obtains control over the subsidiary and ceases when the
Group loses control of the subsidiary. Income and expenses of a subsidiary acquired or disposed of during the
year are included within the statement of comprehensive income from the date the Group gains control until
the date the Group ceases to control the subsidiary. All subsidiaries have a reporting date of 31 December. In
preparing the consolidated financial statements, all inter entity balances and transactions and unrealised profits
and losses arising within the consolidated entity have been eliminated in full. A change in the ownership interest
of a subsidiary without a loss of control is accounted for as an equity transaction.
Non-controlling interests, presented as part of equity, represent the portion of a subsidiary’s profit or loss and
net assets that is not held by the Group. The Group attributes total comprehensive income or loss of subsidiaries
to the amounts of the company and the non-controlling interests based on their ownership interests.
The group treats transactions with non-controlling interests that do not result in a loss of control as transactions
with equity owners of the group. A change in ownership interest results in an adjustment between the carrying
amounts of the controlling and non-controlling interests to reflect their relative interests in the subsidiary. Any
difference between the amount of the adjustment to non-controlling interests and any consideration paid or
received is recognised in a separate reserve within equity attributable to the owners of the Company.
4.3 INVESTMENT IN ASSOCIATE
Associates are those entities over which the Group is able to exert significant influence but which are not
subsidiaries. The Group’s investment in its associate is accounted for using the equity method. Under the equity
method, the investment in an associate is initially recognised at cost. The carrying amount of the investment in
associates is increased or decreased to recognise the Group’s share of the profit or loss and other comprehensive
income of the associate after the acquisition date. Dividends received or receivable from associates and joint
ventures are recognised as a reduction in the carrying amount of the investment.
When the Group’s share of losses in an equity-accounted investment equals or exceeds its interest in the entity,
including any other unsecured long-term receivables, the Group does not recognise further losses, unless it has
incurred obligations or made payments on behalf of the other entity. Unrealised gains on transactions between the
Group and its associates are eliminated to the extent of the Group’s interest in these entities. Unrealised losses are also
eliminated unless the transaction provides evidence of an impairment of the asset transferred. The carrying amount
of equity-accounted investment is tested for impairment in accordance with the policy described in Note 4.10.
The financial statements of the associate are prepared for the same reporting period as the Group. When
necessary, adjustments are made to bring the accounting policies in line with those of the Group.
NOTES TO THE FINANCIAL STATEMENTS CONTINUED
13Vista Group International Limited
NOTES TO THE FINANCIAL STATEMENTS CONTINUED
4.4 FOREIGN CURRENCY
Functional and presentation currency
Items included in the financial statements of each of the Group’s entities are measured using the currency of the
primary economic environment in which the entity operates (‘the functional currency’). The consolidated financial
statements are presented in New Zealand Dollars (NZD), which is the Group’s presentation currency. All financial
information has been presented rounded to the nearest thousand dollars ($000).
Transactions and balances
Foreign currency transactions are translated into the functional currency using the exchange rates prevailing at
the dates of the transactions. Foreign exchange gains and losses resulting from the settlement of such transactions
and from the translation at year-end exchange rates of monetary assets and liabilities denominated in foreign
currencies are recognised in the statement of comprehensive income.
Group companies
The results and financial position of all the group entities (none of which has the currency of a hyper-inflationary
economy) that have a functional currency different from the presentation currency are translated into the
presentation currency as follows
(a) assets and liabilities for each balance sheet presented are translated at the closing rate at the date of that
balance sheet
(b) income and expenses for each income statement and statement of other comprehensive income, are translated
at average exchange rates (unless this average is not a reasonable approximation of the cumulative effect of
the rates prevailing on the transaction dates, in which case income and expenses are translated at the rate on
the dates of the transactions); and
(c) all resulting exchange differences are recognised in other comprehensive income
(d) Goodwill and fair value adjustments arising on the acquisition of a foreign entity are treated as assets and
liabilities of the foreign entity and translated at the closing rate. Exchange differences arising are recognised
in other comprehensive income.
Foreign exchange gains and losses that relate to borrowings are presented in the statement of comprehensive
income, within finance costs. All other foreign exchange gains and losses are presented in the statement of
comprehensive income on a net basis within other income or other expenses.
4.5 BUSINESS COMBINATIONS
The acquisition method of accounting is used to account for all business combinations, regardless of whether
equity instruments or other assets are acquired. The consideration transferred for the acquisition of a subsidiary
comprises the:
• fair values of the assets transferred
• liabilities incurred to the former owners of the acquired business
• equity interests issued by the group
• fair value of any asset or liability resulting from a contingent consideration arrangement, and
• fair value of any pre-existing equity interest in the subsidiary.
Identifiable assets acquired and liabilities and contingent liabilities assumed in a business combination are,
with limited exceptions, measured initially at their fair values at the acquisition date. The Group recognises any
non-controlling interest in the acquired entity on an acquisition-by-acquisition basis either at fair value or at the
non-controlling interest’s proportionate share of the acquired entity’s net identifiable assets.
Acquisition-related costs are expensed as incurred.

14Vista Group International Limited
The excess of the:
• consideration transferred,
• amount of any non-controlling interest in the acquired entity, and
• acquisition-date fair value of any previous equity interest in the acquired entity
over the fair value of the net identifiable assets acquired is recorded as goodwill. If those amounts are less than
the fair value of the net identifiable assets of the subsidiary acquired, the difference is recognised directly in the
statement of comprehensive income as a bargain purchase.
Where settlement of any part of cash consideration is deferred, the amounts payable in the future are discounted
to their present value as at the date of exchange. The discount rate used is the entity’s incremental borrowing rate,
being the rate at which a similar borrowing could be obtained from an independent financier under comparable
terms and conditions.
Contingent consideration is classified either as equity or a financial liability. Amounts classified as a financial liability
are subsequently remeasured to fair value with changes recognised in the statement of comprehensive income.
If the business combination is achieved in stages, the acquisition date carrying value of the acquirer’s previously
held equity interest in the acquiree is remeasured to fair value at the acquisition date. Any gains or losses arising
from such remeasurement are recognised in the statement of comprehensive income.
4.6 REVENUE
Revenue is recognised to the extent that it is probable that the economic benefits will flow to the Group and
the revenue can be reliably measured. The following specific recognition criteria must also be met before revenue
is recognised.
Products
Product revenue comprises the sale of computer software licenses and is recognised when the significant risks
and rewards of ownership have been transferred by making the software usable to the licensee. No revenue is
recognised if there are significant uncertainties regarding recovery of the consideration due, associated costs
or the possible non implementation and return of the software.
Maintenance
Maintenance services are billed in advance for a fixed term. Revenue is recorded within deferred revenue on the
statement of financial position and recognised on a straight line basis over the term of the contract billing period,
as services are provided.
Services
Services comprise of service and development fees which are one-off charges. Revenue is recognised when
the service is complete or on a stage of completion basis.
Interest income
Interest income is recognised using the effective interest method.
4.7 GOVERNMENT GRANTS
Government grants are recognised where there is reasonable assurance that the grant will be received and all attached
conditions will be complied with. When the grant relates to an expense item it is recognised as a deduction against
that cost on a systematic basis over the periods that the related costs, for which it is intended to compensate, are
expensed. When the grant relates to an asset, it is recognised as income in equal amounts over the expected useful
life of the related asset.
NOTES TO THE FINANCIAL STATEMENTS CONTINUED
15Vista Group International Limited
4.8 FINANCIAL INSTRUMENTS
The classification of financial assets and liabilities depends on the purpose for which the financial assets were
acquired. Management determines the classification of the Group’s financial assets and liabilities at initial recognition.
The Group has only had loans and receivables in the periods covered by these financial statements.
The Group has only financial liabilities measured at amortised cost in the periods covered by these financial statements.
(a) Loans and receivables
Loans and receivables are non-derivative financial assets with fixed or determinable payments that are
not quoted in an active market. They are included in current assets, except for loans and receivables with
maturities greater than 12 months after the balance sheet date. These are classified as non-current assets.
The Group’s loans and receivables comprise ‘trade and other receivables’ in the statement of financial position.
(b) Financial liabilities measured at amortised cost
Financial liabilities measured at amortised cost are non-derivative financial liabilities with fixed or determinable
payments that are not quoted in an active market. Trade and other payables, loans and borrowings are
classified as financial liabilities measured at amortised cost.
Recognition and derecognition
Financial assets are derecognised when the rights to receive cash flows from the financial assets have expired or
have been transferred and the Group has transferred substantially all the risks and rewards of ownership. Financial
liabilities are derecognised if the Group’s obligations specified in the contract expire or are discharged or cancelled.
Measurement
At initial recognition, the Group measures a financial asset and liability at its fair value plus transaction costs that
are directly attributable to the acquisition of the financial asset.
After initial recognition, loans and receivables are subsequently carried at amortised cost using the effective interest
method. After initial recognition, financial liabilities are measured at amortised cost using the effective interest method.
Impairment
The Group assesses at the end of each reporting period whether there is objective evidence that a financial asset
or group of financial assets is impaired. A financial asset or a group of financial assets is impaired and impairment
losses are incurred only if there is objective evidence of impairment as a result of one or more events that
occurred after the initial recognition of the asset (a ‘loss event’) and that loss event (or events) has an impact on
the estimated future cash flows of the financial asset or group of financial assets that can be reliably estimated.
Evidence of impairment may include indications that the debtor or group of debtors is experiencing significant
financial difficulty, default or delinquency in interest or principal payments, the probability that they will enter
bankruptcy or other financial reorganisation and observable data indicating that there is a measureable decrease
in the estimated future cashflows, such as changes in arrears or economic conditions that correlate with defaults.
For loans and receivables, the amount of the loss is measured as the difference between the asset’s carrying
amount and the present value of estimated future cash flows (excluding future credit losses that have not been
incurred) discounted at the financial asset’s original effective interest rate. The carrying amount of the asset is
reduced and the amount of the loss is recognised in the statement of comprehensive income.
If, in a subsequent period, the amount of the impairment loss decreases and the decrease can be related
objectively to an event occurring after the impairment was recognised (such as an improvement in the debtor’s
credit rating), the reversal of the previously recognised impairment loss is recognised in the statement of
comprehensive income.
4.9 INTANGIBLE ASSETS
Intangible assets acquired separately are measured on initial recognition at cost. The cost of intangible assets
acquired in a business combination is their fair value at the date of acquisition. Following initial recognition,
intangible assets are carried at cost less any accumulated amortisation and accumulated impairment losses.
Intangible assets with finite lives are amortised over the useful economic life. The amortisation period and the
amortisation method for an intangible asset with a finite life are reviewed at least at the end of each reporting
period. The amortisation expense on intangible assets with finite lives is recognised in the statement of
comprehensive income in the expense category that is consistent with the function of the intangible assets.
NOTES TO THE FINANCIAL STATEMENTS CONTINUED
16Vista Group International Limited
Development costs
Costs associated with maintaining computer software programmes are recognised as an expense within the
statement of comprehensive income as incurred. Development costs that are directly attributable to the design
and testing of identifiable and unique software products controlled by the Group are recognised as intangible
assets only when all of the following criteria are met:
• it is technically feasible to complete the software product so that it will be available for use;
• management intends to complete the software product and use or sell it;
• there is an ability to use or sell the software product;
• it can be demonstrated how the software product will generate probable future economic benefits;
• adequate technical, financial and other resources to complete the development and to use or sell the software
product are available; and
• the expenditure attributable to the software product during its development can be reliably measured.
Other development expenditures that do not meet these criteria are recognised as an expense as incurred within
operating expenses.
Development costs previously recognised as an expense are not recognised as an asset in a subsequent period.
Intellectual property has been acquired through business combination. Customer relationships include the
purchase of existing customer bases via an existing license agreement or business combination. Software licenses
include the purchase of third party software in the normal course of business. Internally generated software is
recognised on the basis as described above.
Intangible assets are amortised on a straight line basis over the following useful economic lives:
• Intellectual property 10 to 15 years;
• Customer relationships 10 years;
• Software licenses 2.5 years;
• Internally generated software 3 to 5 years based on their estimated useful life
Refer to Notes 4.5 and 4.10 for policies on goodwill measurement and impairment testing.
4.10 IMPAIRMENT TESTING OF GOODWILL, OTHER INTANGIBLE ASSETS AND PROPERTY, PLANT AND EQUIPMENT
The carrying amounts of the Group’s definite life, intangible assets and property plant and equipment are reviewed
at each reporting date to determine whether there is any indication of impairment. If any such indication exists
then the asset’s recoverable amount is estimated.
Other assets are tested for impairment whenever events or changes in circumstances indicate that the carrying
amount may not be recoverable.
Goodwill and other indefinite life intangible assets are not amortised and are tested for impairment annually
irrespective of whether there is any indication of impairment. After initial recognition goodwill is measured at cost
less any accumulated impairment losses
An impairment loss is recognised if the carrying amount of an asset exceeds its recoverable amount. Impairment
losses are recognised in the statement of comprehensive income.
The recoverable amount of an asset is the greater of its value in use and its fair value less costs to sell. For the
purposes of assessing impairment, assets are grouped at the lowest levels for which there are separately identifiable
cash inflows which are largely independent of the cash inflows from other assets or groups of assets (cash-
generating units). The allocation is made to those cash generating units that are expected to benefit from the
business combination in which goodwill arose. In assessing value in use, the estimated future cash flows are
discounted to their present value using a pre-tax discount rate that reflects current market assessments of the
time value of money and the risks specific to the asset (see Note 6 for key assumptions).
4.11 PROPERTY, PLANT AND EQUIPMENT
Items of property, plant and equipment are measured at cost less accumulated depreciation and impairment
losses. Cost includes expenditure that is directly attributable to the acquisition of the asset.
NOTES TO THE FINANCIAL STATEMENTS CONTINUED
17Vista Group International Limited
The cost of replacing part of an item of property, plant and equipment is recognised in the carrying amount of the
item if it is probable that the future economic benefits embodied within the part will flow to the Group and its cost
can be measured reliably. The costs of the day-to-day servicing of property, plant and equipment are recognised
within the statement of comprehensive income as incurred.
Depreciation is provided on fixtures, fittings and computers. Depreciation is recognised in the profit or loss to write
off the cost of an item of property, plant and equipment, less any residual value, over its expected useful life:
• Fixtures and fittings 6 to 14 years straight line
• Computer equipment 2.5 to 6 years straight line
4.12 LEASED ASSETS
All leases are operating leases. Leases in which a significant portion of the risks and rewards of ownership are not
transferred to the Group as a lessee are classified as an operating lease. Payments made under operating leases
(net of any incentives received from the lessor) are charged to statement of comprehensive income on a straight
line basis over the period of the lease. Associated costs, such as maintenance and insurance, are expensed as
incurred in the statement of comprehensive income.
4.13 CASH
Cash comprises cash at bank and on hand.
4.14 SHORT-TERM DEPOSITS
Short term deposits with a maturity of more than three months, which are subject to an insignificant risk of changes
in value are presented on the statement of financial position. Short term deposits are highly liquid and available
on demand.
4.15 SHORT-TERM EMPLOYEE BENEFITS
Accruals for wages, salaries, including non-monetary benefits, commissions and annual leave expected to be settled
within 12 months of the reporting date are recognised in respect of employees’ services up to the reporting date.
They are measured at the amounts expected to be paid using the remuneration rate expected to apply at the time
of settlement, on an undiscounted basis. Expenses for non-accumulating sick leave are recognised when the leave
is taken and are measured at the rates paid or payable.
The Group has pension obligations in respect of various defined contribution plans. The Group pays contributions
to publicly or privately administered pension insurance plans on a mandatory or contractual basis. The Group has
no further payment obligations once the contributions have been paid. The contributions are recognised as an
employee entitlement expense when they are due.
4.16 SHARE BASED PAYMENTS
Gift, offer and reward plans 2014 – now closed and all options exercised
In 2014 there were three share-based payment plans which comprised of gifted shares and shares that had been sold
to eligible employees for consideration less than fair value. No service or performance conditions were attached to
these plans. That cost was recognised within the statement of comprehensive income, together with a corresponding
increase in the share based payment reserve within equity. The amount recognised within share based payment
reserve in 2014 has been reclassified to retained earnings.
Virtual Concepts Limited (VCL) Incentive scheme
Certain employees of VCL receive remuneration in the form of share based payments contingent upon achieving
certain annual milestones. The cost is recognised within acquisition expenses, refer to Note 6.2 for more details of the
scheme. The amount recognised within share based payment reserve in 2014 has been reclassified to retained earnings.
Equity settled long-term incentive scheme
During the year the Directors approved and implemented an equity settled long-term incentive scheme for
selected key management personnel. This plan is intended to focus performance on achievement of key long term
performance metrics, refer to Note 12.2 for more details of the scheme.
NOTES TO THE FINANCIAL STATEMENTS CONTINUED
18Vista Group International Limited
4.17 INCOME TAXES
The tax expense for the period comprises current and deferred tax. Tax is recognised in profit or loss in the
statement of comprehensive income, except to the extent that it relates to items recognised in other comprehensive
income or directly in equity. In this case, the tax is also recognised in other comprehensive income or directly in
equity, respectively.
The current income tax charge is calculated on the basis of the tax laws enacted or substantively enacted at
the balance sheet date in the countries where the Group’s subsidiaries operate and generate taxable income.
Management periodically evaluates positions taken in tax returns with respect to situations in which applicable
tax regulations are subject to interpretation and establishes provisions where appropriate on the basis of amounts
expected to be paid to the tax authorities.
Deferred income tax is provided in full, using the liability method, on temporary differences arising between tax
bases of assets and liabilities and their carrying amounts in the consolidated financial statements. However, the
deferred income tax is not accounted for if it arises from initial recognition of an asset or liability in a transaction
other than a business combination that at the time of the transaction affects neither accounting nor taxable profit
or loss. Deferred income tax is determined using tax rates (and laws) that have been enacted or substantially
enacted by the balance sheet date and are expected to apply when the related deferred income tax asset is
realised or the deferred income tax liability is settled.
Deferred income tax assets are recognised to the extent that it is probable that future taxable profit will be
available against which the temporary differences can be utilised.
Deferred income tax is provided on temporary differences arising on investments in subsidiaries and associates,
except where the timing of the reversal of the temporary difference is controlled by the Group and it is probable
that the temporary difference will not reverse in the foreseeable future.
Deferred income tax assets and liabilities are offset when there is a legally enforceable right to offset current tax
assets against current tax liabilities and when the deferred income taxes assets and liabilities relate to income
taxes levied by the same taxation authority on either the same taxable entity or different taxable entities where
there is an intention to settle the balances on a net basis.
4.18 EQUITY, RESERVES AND DIVIDEND PAYMENTS
Share capital represents the nominal value of shares that have been issued. Incremental costs directly attributable
to the issue of ordinary shares are recognised as a deduction from equity. Retained earnings include all current and
prior period retained profits. Dividend distributions payable to equity shareholders are included in Trade and other
payables when the dividends have been approved by the Board on or before the end of the reporting period but
not yet distributed. All transactions with owners of the parent are recorded separately within equity.
Foreign Currency Translation Reserve (FCTR)
The foreign currency translation reserve is used to record exchange differences arising from the translation of the
financial statements of foreign subsidiaries for consolidation purposes.
Share Based Payment Reserve
The share based payment reserve is used to record any equity share based incentives. The reserve value represents
the difference between the value at the time of allocation and the cash received incentives plus the equity
component of contingent consideration payable.
4.19 EARNINGS PER SHARE
The Group presents basic and diluted earnings per share (EPS) data for its ordinary shares. Basic EPS is calculated
by dividing the profit or loss attributable to ordinary shareholders of the Parent by the weighted average number
of ordinary shares in issue during the year.
Diluted EPS reflects any commitments the Group has to issue shares in the future that would decrease EPS. In
2015, these are in the form of share based payments and performance rights. To calculate the impact it is assumed
that share based payments related to FY15 earning targets are achieved and all the performance rights are taken,
therefore adjusting the weighted average number of shares.
NOTES TO THE FINANCIAL STATEMENTS CONTINUED
19Vista Group International Limited
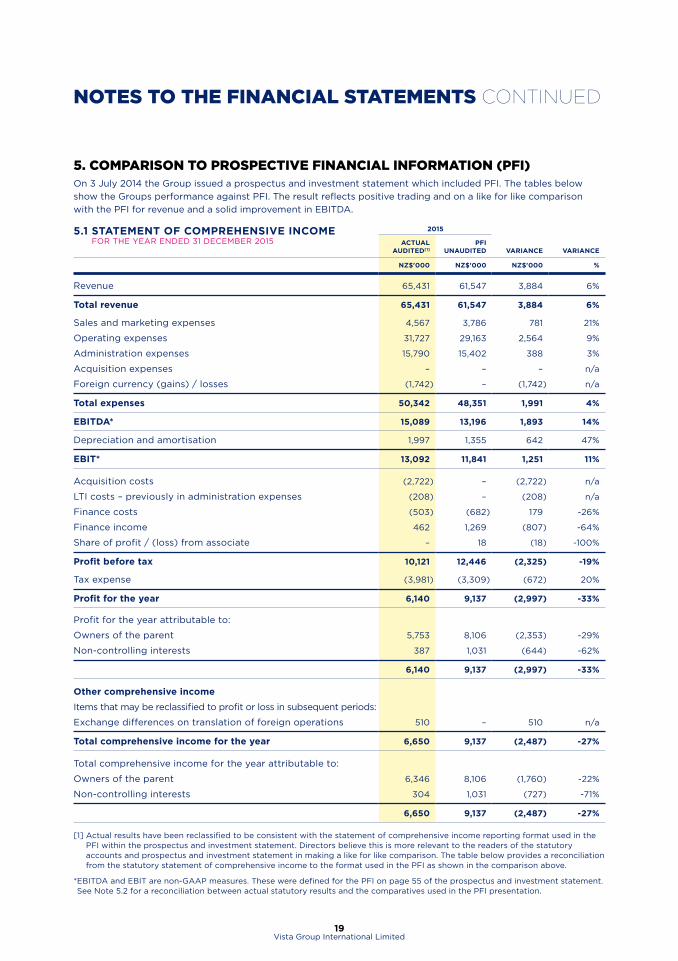
5. COMPARISON TO PROSPECTIVE FINANCIAL INFORMATION (PFI)On 3 July 2014 the Group issued a prospectus and investment statement which included PFI. The tables below
show the Groups performance against PFI. The result reflects positive trading and on a like for like comparison
with the PFI for revenue and a solid improvement in EBITDA.
5.1 STATEMENT OF COMPREHENSIVE INCOME FOR THE YEAR ENDED 31 DECEMBER 2015
2015
ACTUAL AUDITED[1]
PFI UNAUDITED VARIANCE VARIANCE
NZ$'000 NZ$'000 NZ$'000 %
Revenue 65,431 61,547 3,884 6%
Total revenue 65,431 61,547 3,884 6%
Sales and marketing expenses 4,567 3,786 781 21%
Operating expenses 31,727 29,163 2,564 9%
Administration expenses 15,790 15,402 388 3%
Acquisition expenses – – – n/a
Foreign currency (gains) / losses (1,742) – (1,742) n/a
Total expenses 50,342 48,351 1,991 4%
EBITDA* 15,089 13,196 1,893 14%
Depreciation and amortisation 1,997 1,355 642 47%
EBIT* 13,092 11,841 1,251 11%
Acquisition costs (2,722) – (2,722) n/a
LTI costs – previously in administration expenses (208) – (208) n/a
Finance costs (503) (682) 179 -26%
Finance income 462 1,269 (807) -64%
Share of profit / (loss) from associate – 18 (18) -100%
Profit before tax 10,121 12,446 (2,325) -19%
Tax expense (3,981) (3,309) (672) 20%
Profit for the year 6,140 9,137 (2,997) -33%
Profit for the year attributable to:
Owners of the parent 5,753 8,106 (2,353) -29%
Non-controlling interests 387 1,031 (644) -62%
6,140 9,137 (2,997) -33%
Other comprehensive income
Items that may be reclassified to profit or loss in subsequent periods:
Exchange differences on translation of foreign operations 510 – 510 n/a
Total comprehensive income for the year 6,650 9,137 (2,487) -27%
Total comprehensive income for the year attributable to:
Owners of the parent 6,346 8,106 (1,760) -22%
Non-controlling interests 304 1,031 (727) -71%
6,650 9,137 (2,487) -27%
[1] Actual results have been reclassified to be consistent with the statement of comprehensive income reporting format used in the PFI within the prospectus and investment statement. Directors believe this is more relevant to the readers of the statutory accounts and prospectus and investment statement in making a like for like comparison. The table below provides a reconciliation from the statutory statement of comprehensive income to the format used in the PFI as shown in the comparison above.
* EBITDA and EBIT are non-GAAP measures. These were defined for the PFI on page 55 of the prospectus and investment statement. See Note 5.2 for a reconciliation between actual statutory results and the comparatives used in the PFI presentation.
NOTES TO THE FINANCIAL STATEMENTS CONTINUED
20Vista Group International Limited
• Revenue was boosted by a strong finish to the year, in particular from VESL along with an improvement in the
foreign currency profile over the year. The FX gain was partly offset by the year end lift in the NZD/USD cross
in particular.
• Increases in operating expenses were below the rate of revenue increase against PFI and as a result EBITDA,
a key measure of operating performance, showed an increase against PFI.
• Depreciation and amortisation includes $530k of intangible amortisation on 2015 acquisitions not included in PFI.
• Acquisition costs (VCL deferred consideration and transactional costs associated with acquisitions) and LTI
costs not in the PFI, result in a reduction in reported NPBT. These expenses and the amortisation of intangibles
are not deductible for tax, resulting in a higher tax expense against PFI.
• The lower return from MACCS in the 2015 year due to delays in the invoicing and subsequent recognition of
US project revenues, resulted in the lower non-controlling interest adjustment.
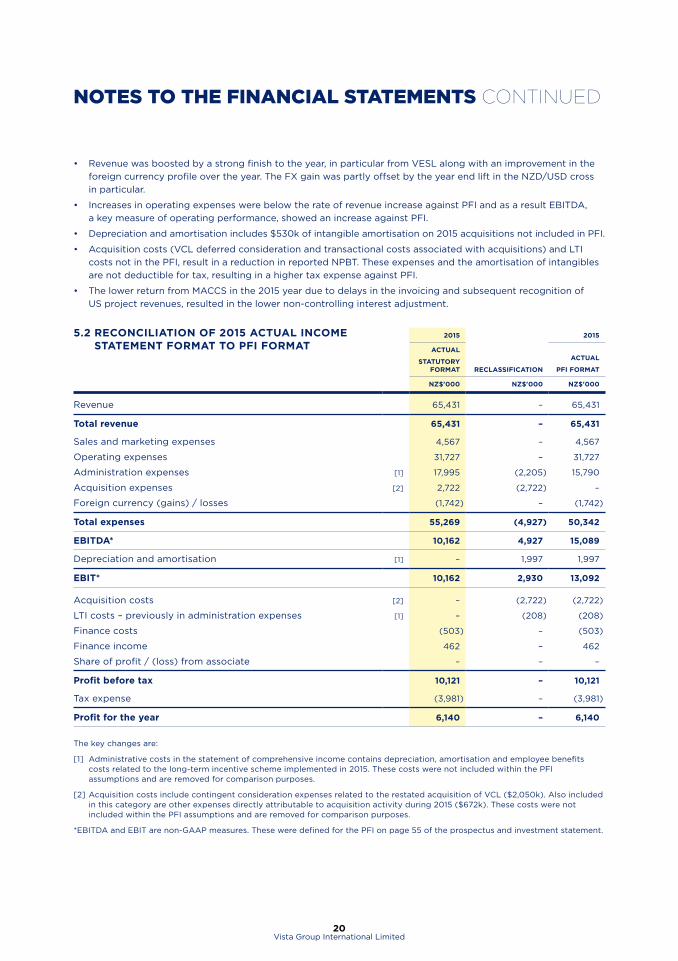
5.2 RECONCILIATION OF 2015 ACTUAL INCOME STATEMENT FORMAT TO PFI FORMAT
2015 2015
ACTUAL
STATUTORY FORMAT RECLASSIFICATION
ACTUAL
PFI FORMAT
NZ$'000 NZ$'000 NZ$'000
Revenue 65,431 – 65,431
Total revenue 65,431 – 65,431
Sales and marketing expenses 4,567 – 4,567
Operating expenses 31,727 – 31,727
Administration expenses [1] 17,995 (2,205) 15,790
Acquisition expenses [2] 2,722 (2,722) –
Foreign currency (gains) / losses (1,742) – (1,742)
Total expenses 55,269 (4,927) 50,342
EBITDA* 10,162 4,927 15,089
Depreciation and amortisation [1] – 1,997 1,997
EBIT* 10,162 2,930 13,092
Acquisition costs [2] – (2,722) (2,722)
LTI costs – previously in administration expenses [1] – (208) (208)
Finance costs (503) – (503)
Finance income 462 – 462
Share of profit / (loss) from associate – – –
Profit before tax 10,121 – 10,121
Tax expense (3,981) – (3,981)
Profit for the year 6,140 – 6,140
The key changes are:
[1] Administrative costs in the statement of comprehensive income contains depreciation, amortisation and employee benefits costs related to the long-term incentive scheme implemented in 2015. These costs were not included within the PFI assumptions and are removed for comparison purposes.
[2] Acquisition costs include contingent consideration expenses related to the restated acquisition of VCL ($2,050k). Also included in this category are other expenses directly attributable to acquisition activity during 2015 ($672k). These costs were not included within the PFI assumptions and are removed for comparison purposes.
*EBITDA and EBIT are non-GAAP measures. These were defined for the PFI on page 55 of the prospectus and investment statement.
NOTES TO THE FINANCIAL STATEMENTS CONTINUED

21Vista Group International Limited
5.3 STATEMENT OF FINANCIAL POSITION AS AT DECEMBER 2015
2015
ACTUAL AUDITED
PFI UNAUDITED VARIANCE VARIANCE
NZ$’000 NZ$’000 NZ$’000 %
CURRENT ASSETS
Cash 16,863 25,068 (8,205) -33%
Short term deposits 10,437 18,462 (8,025) -43%
Trade and other receivables 30,069 19,534 10,535 54%
Income tax receivable 517 – 517 n/a
Total current assets 57,886 63,064 (5,178) -8%
NON-CURRENT ASSETS
Property, plant and equipment 2,380 3,091 (711) -23%
Investment in associate – 216 (216) -100%
Goodwill 41,109 33,972 7,137 21%
Intangible assets 9,152 6,050 3,102 51%
Deferred tax asset 220 – 220 n/a
Total non-current assets 52,861 43,329 9,532 22%
Total assets 110,747 106,393 4,354 4%
CURRENT LIABILITIES
Trade and other payables (incl. deferred revenue) 21,113 20,106 1,007 5%
Contingent consideration 1,253 5,647 (4,394) -78%
Income tax payable 1,788 481 1,307 272%
Total current liabilities 24,154 26,234 (2,080) -8%
NON-CURRENT LIABILITIES
Borrowings 4,792 4,823 (31) -1%
Employee benefits – VCL acquisition 468 – 468 n/a
Deferred tax liability 2,281 1,694 587 35%
Total non-current liabilities 7,541 6,517 1,024 16%
Total liabilities 31,695 32,751 (1,056) -3%
Net assets 79,052 73,642 5,410 7%
EQUITY
Contributed equity 45,952 45,985 (33) 0%
Retained earnings 22,661 18,551 4,110 22%
Foreign currency revaluation reserve 164 – 164 n/a
Share based payment reserve 2,296 – 2,296 n/a
Total equity attributable to owners of the parent 71,073 64,536 6,537 10%
Non-controlling interests 7,979 9,106 (1,127) -12%
Total equity 79,052 73,642 5,410 7%
• Trade and other receivables have increased due to the strong finish to the sales year by VESL and the higher
level of December maintenance renewals. This is seen as a timing difference.
• Cash and short term deposits are lower due to the investment activity (see cash flow statement) and the timing
effect of the higher receivables balance at balance date.
• Goodwill and intangibles reflect the increases from the acquisition of Ticketsoft ($7,933k refer Note 7) and CCG
($1,929k refer Note 17) less amortisation in the 2015 year.
NOTES TO THE FINANCIAL STATEMENTS CONTINUED
22Vista Group International Limited
• The restated acquisition accounting method for VCL, as first disclosed in the FY15 half year results (refer
Note 7) accounts for the majority of the differences in the contingent consideration, retained earnings and
share based payment reserve.
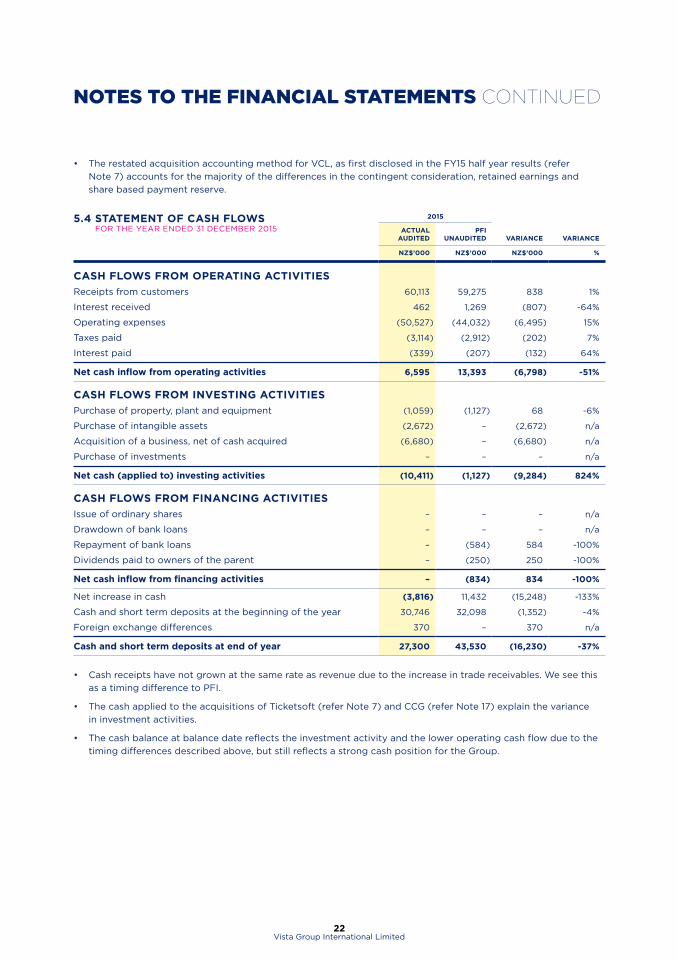
5.4 STATEMENT OF CASH FLOWS FOR THE YEAR ENDED 31 DECEMBER 2015
2015
ACTUAL AUDITED
PFI UNAUDITED VARIANCE VARIANCE
NZ$’000 NZ$’000 NZ$’000 %
CASH FLOWS FROM OPERATING ACTIVITIES
Receipts from customers 60,113 59,275 838 1%
Interest received 462 1,269 (807) -64%
Operating expenses (50,527) (44,032) (6,495) 15%
Taxes paid (3,114) (2,912) (202) 7%
Interest paid (339) (207) (132) 64%
Net cash inflow from operating activities 6,595 13,393 (6,798) -51%
CASH FLOWS FROM INVESTING ACTIVITIES
Purchase of property, plant and equipment (1,059) (1,127) 68 -6%
Purchase of intangible assets (2,672) – (2,672) n/a
Acquisition of a business, net of cash acquired (6,680) – (6,680) n/a
Purchase of investments – – – n/a
Net cash (applied to) investing activities (10,411) (1,127) (9,284) 824%
CASH FLOWS FROM FINANCING ACTIVITIES
Issue of ordinary shares – – – n/a
Drawdown of bank loans – – – n/a
Repayment of bank loans – (584) 584 -100%
Dividends paid to owners of the parent – (250) 250 -100%
Net cash inflow from financing activities – (834) 834 -100%
Net increase in cash (3,816) 11,432 (15,248) -133%
Cash and short term deposits at the beginning of the year 30,746 32,098 (1,352) -4%
Foreign exchange differences 370 – 370 n/a
Cash and short term deposits at end of year 27,300 43,530 (16,230) -37%
• Cash receipts have not grown at the same rate as revenue due to the increase in trade receivables. We see this
as a timing difference to PFI.
• The cash applied to the acquisitions of Ticketsoft (refer Note 7) and CCG (refer Note 17) explain the variance
in investment activities.
• The cash balance at balance date reflects the investment activity and the lower operating cash flow due to the
timing differences described above, but still reflects a strong cash position for the Group.
NOTES TO THE FINANCIAL STATEMENTS CONTINUED
23Vista Group International Limited
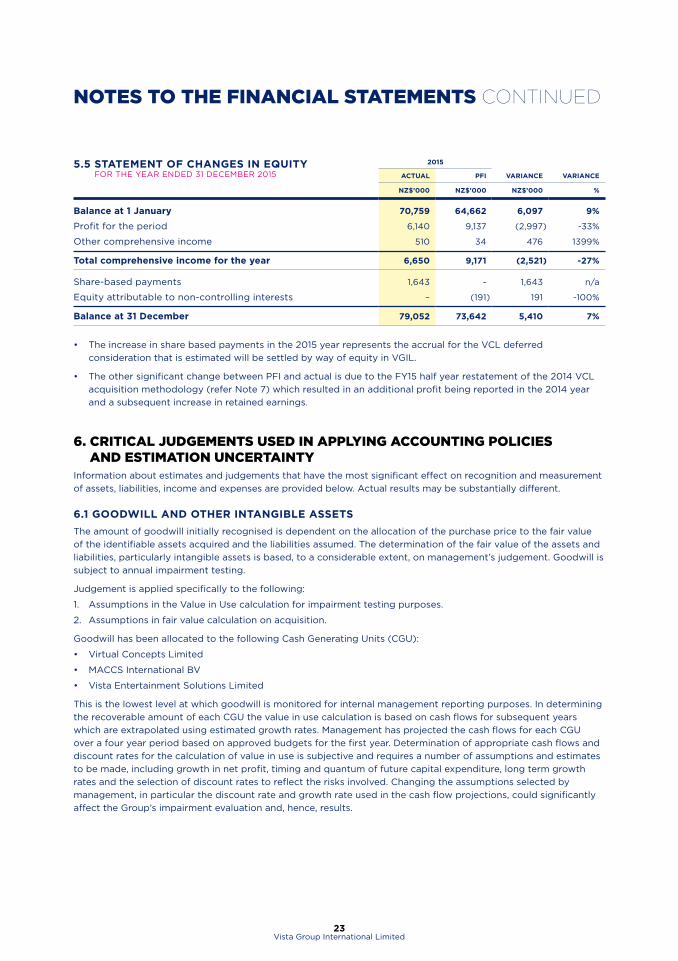
5.5 STATEMENT OF CHANGES IN EQUITY FOR THE YEAR ENDED 31 DECEMBER 2015
2015
ACTUAL PFI VARIANCE VARIANCE
NZ$’000 NZ$’000 NZ$’000 %
Balance at 1 January 70,759 64,662 6,097 9%
Profit for the period 6,140 9,137 (2,997) -33%
Other comprehensive income 510 34 476 1399%
Total comprehensive income for the year 6,650 9,171 (2,521) -27%
Share-based payments 1,643 - 1,643 n/a
Equity attributable to non-controlling interests – (191) 191 -100%
Balance at 31 December 79,052 73,642 5,410 7%
• The increase in share based payments in the 2015 year represents the accrual for the VCL deferred
consideration that is estimated will be settled by way of equity in VGIL.
• The other significant change between PFI and actual is due to the FY15 half year restatement of the 2014 VCL
acquisition methodology (refer Note 7) which resulted in an additional profit being reported in the 2014 year
and a subsequent increase in retained earnings.
6. CRITICAL JUDGEMENTS USED IN APPLYING ACCOUNTING POLICIES AND ESTIMATION UNCERTAINTY
Information about estimates and judgements that have the most significant effect on recognition and measurement
of assets, liabilities, income and expenses are provided below. Actual results may be substantially different.
6.1 GOODWILL AND OTHER INTANGIBLE ASSETS
The amount of goodwill initially recognised is dependent on the allocation of the purchase price to the fair value
of the identifiable assets acquired and the liabilities assumed. The determination of the fair value of the assets and
liabilities, particularly intangible assets is based, to a considerable extent, on management’s judgement. Goodwill is
subject to annual impairment testing.
Judgement is applied specifically to the following:
1. Assumptions in the Value in Use calculation for impairment testing purposes.
2. Assumptions in fair value calculation on acquisition.
Goodwill has been allocated to the following Cash Generating Units (CGU):
• Virtual Concepts Limited
• MACCS International BV
• Vista Entertainment Solutions Limited
This is the lowest level at which goodwill is monitored for internal management reporting purposes. In determining
the recoverable amount of each CGU the value in use calculation is based on cash flows for subsequent years
which are extrapolated using estimated growth rates. Management has projected the cash flows for each CGU
over a four year period based on approved budgets for the first year. Determination of appropriate cash flows and
discount rates for the calculation of value in use is subjective and requires a number of assumptions and estimates
to be made, including growth in net profit, timing and quantum of future capital expenditure, long term growth
rates and the selection of discount rates to reflect the risks involved. Changing the assumptions selected by
management, in particular the discount rate and growth rate used in the cash flow projections, could significantly
affect the Group’s impairment evaluation and, hence, results.
NOTES TO THE FINANCIAL STATEMENTS CONTINUED
24Vista Group International Limited
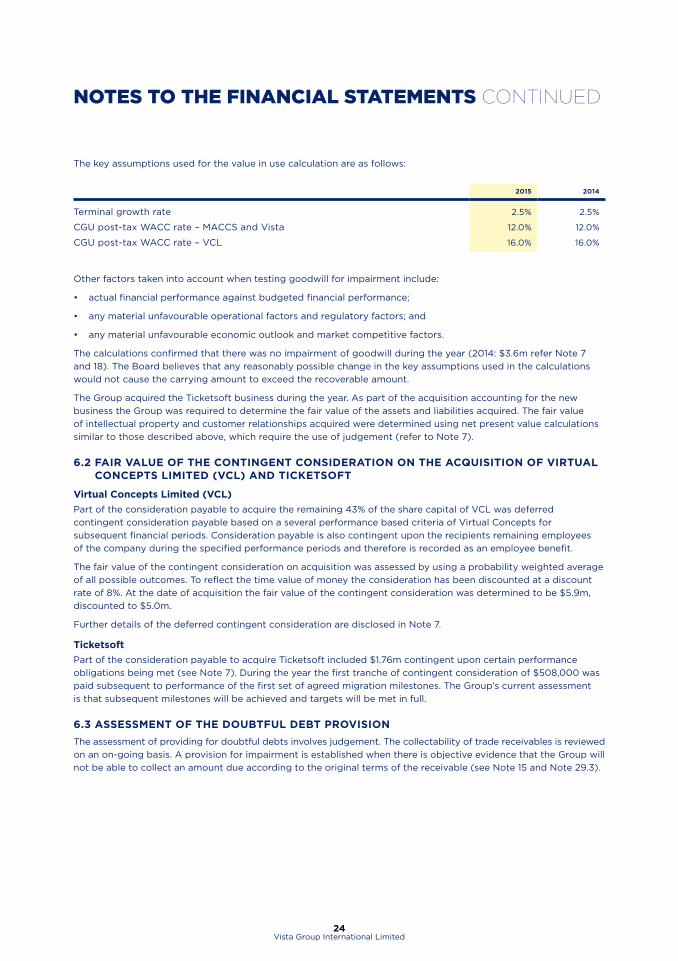
The key assumptions used for the value in use calculation are as follows:
2015 2014
Terminal growth rate 2.5% 2.5%
CGU post-tax WACC rate – MACCS and Vista 12.0% 12.0%
CGU post-tax WACC rate – VCL 16.0% 16.0%
Other factors taken into account when testing goodwill for impairment include:
• actual financial performance against budgeted financial performance;
• any material unfavourable operational factors and regulatory factors; and
• any material unfavourable economic outlook and market competitive factors.
The calculations confirmed that there was no impairment of goodwill during the year (2014: $3.6m refer Note 7
and 18). The Board believes that any reasonably possible change in the key assumptions used in the calculations
would not cause the carrying amount to exceed the recoverable amount.
The Group acquired the Ticketsoft business during the year. As part of the acquisition accounting for the new
business the Group was required to determine the fair value of the assets and liabilities acquired. The fair value
of intellectual property and customer relationships acquired were determined using net present value calculations
similar to those described above, which require the use of judgement (refer to Note 7).
6.2 FAIR VALUE OF THE CONTINGENT CONSIDERATION ON THE ACQUISITION OF VIRTUAL CONCEPTS LIMITED (VCL) AND TICKETSOFT
Virtual Concepts Limited (VCL)
Part of the consideration payable to acquire the remaining 43% of the share capital of VCL was deferred
contingent consideration payable based on a several performance based criteria of Virtual Concepts for
subsequent financial periods. Consideration payable is also contingent upon the recipients remaining employees
of the company during the specified performance periods and therefore is recorded as an employee benefit.
The fair value of the contingent consideration on acquisition was assessed by using a probability weighted average
of all possible outcomes. To reflect the time value of money the consideration has been discounted at a discount
rate of 8%. At the date of acquisition the fair value of the contingent consideration was determined to be $5.9m,
discounted to $5.0m.
Further details of the deferred contingent consideration are disclosed in Note 7.
Ticketsoft
Part of the consideration payable to acquire Ticketsoft included $1.76m contingent upon certain performance
obligations being met (see Note 7). During the year the first tranche of contingent consideration of $508,000 was
paid subsequent to performance of the first set of agreed migration milestones. The Group’s current assessment
is that subsequent milestones will be achieved and targets will be met in full.
6.3 ASSESSMENT OF THE DOUBTFUL DEBT PROVISION
The assessment of providing for doubtful debts involves judgement. The collectability of trade receivables is reviewed
on an on-going basis. A provision for impairment is established when there is objective evidence that the Group will
not be able to collect an amount due according to the original terms of the receivable (see Note 15 and Note 29.3).
NOTES TO THE FINANCIAL STATEMENTS CONTINUED
25Vista Group International Limited
7. BUSINESS COMBINATIONS
RESTATEMENT RELATING TO ACQUISITION OF REMAINING 43% OF SHARE CAPITAL OF VIRTUAL CONCEPTS LIMITED (VCL) IN 2014:
Following the appointment of PwC as auditors, a review of the accounting treatment adopted in relation to
the acquisition of VCL during the year ended 31 December 2014 was undertaken. This review indicated that the
accounting treatment of contingent consideration payable under the sale and purchase agreement was not in
accordance with NZ IFRS 2, Share Based Payments and NZ IFRS 3, Business Combinations. The most significant
impact of this is that the liability for contingent consideration previously recognised on acquisition has been
derecognised resulting in an equivalent reduction in the goodwill arising from the acquisition and the associated
impairment charge recognised for the year ended 31 December 2014.
As the contingent consideration is conditional on the vendors remaining employed by the Group, the contingent
consideration under NZ IFRS 3 needs to be recognised as an employee cost over the earn out period with a liability
recognised for the cash component and an amount recognised in the share based payment reserve for the share
based payment component.
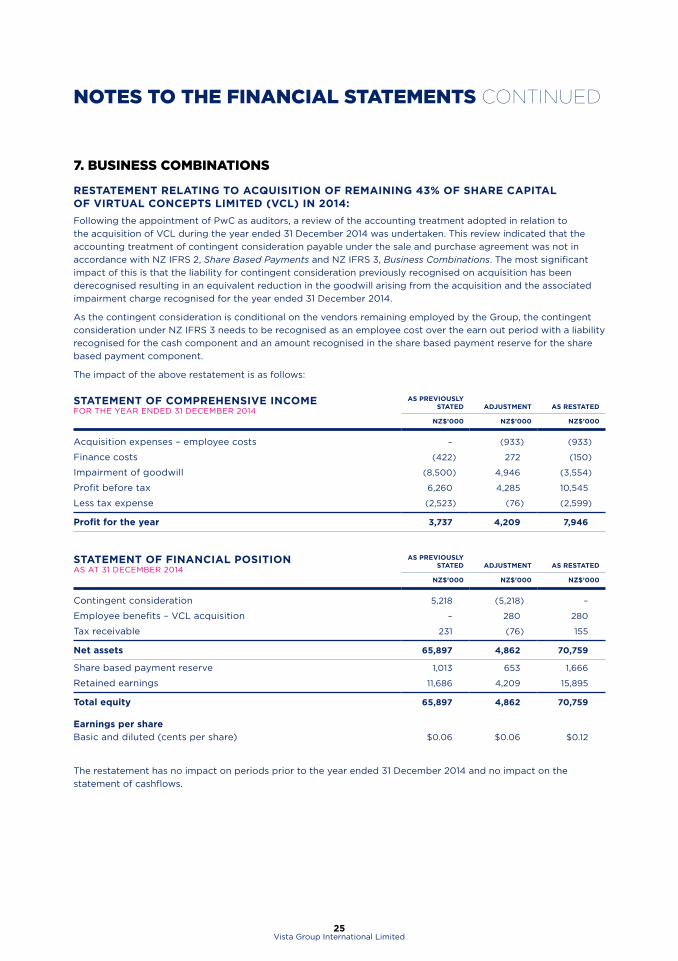
The impact of the above restatement is as follows:
STATEMENT OF COMPREHENSIVE INCOME FOR THE YEAR ENDED 31 DECEMBER 2014
AS PREVIOUSLY STATED ADJUSTMENT AS RESTATED
NZ$’000 NZ$’000 NZ$’000
Acquisition expenses – employee costs – (933) (933)
Finance costs (422) 272 (150)
Impairment of goodwill (8,500) 4,946 (3,554)
Profit before tax 6,260 4,285 10,545
Less tax expense (2,523) (76) (2,599)
Profit for the year 3,737 4,209 7,946
STATEMENT OF FINANCIAL POSITION AS AT 31 DECEMBER 2014
AS PREVIOUSLY STATED ADJUSTMENT AS RESTATED
NZ$’000 NZ$’000 NZ$’000
Contingent consideration 5,218 (5,218) –
Employee benefits – VCL acquisition – 280 280
Tax receivable 231 (76) 155
Net assets 65,897 4,862 70,759
Share based payment reserve 1,013 653 1,666
Retained earnings 11,686 4,209 15,895
Total equity 65,897 4,862 70,759
Earnings per share
Basic and diluted (cents per share) $0.06 $0.06 $0.12
The restatement has no impact on periods prior to the year ended 31 December 2014 and no impact on the
statement of cashflows.
NOTES TO THE FINANCIAL STATEMENTS CONTINUED

26Vista Group International Limited
The value of contingent consideration recognised as an employee cost for the year ended 31 December 2015,
is as follows:
31 DECEMBER 2015
31 DECEMBER 2014
NZ$’000 NZ$’000
Share based payment (Note 12) 1,435 653
Payable in cash 615 280
Total included within acquisition expenses 2,050 933
CONTINGENT CONSIDERATION VCL
2014
Part of the consideration payable to acquire the remaining 43% of the share capital of VCL was deferred
contingent consideration, originally payable in two tranches for the performance periods ended 1 April 2016 and
1 April 2017. The value of contingent consideration payable was based upon several performance based criteria
being achieved for VCL for the financial years ended 31 December 2015 and 2016. Contingent consideration is
payable as a minimum 30% in cash with the remainder in Group shares for each tranche.
The fair value of the consideration on acquisition was assessed by using a probability weighted average of all
possible outcomes. To reflect the time value of money the consideration has been discounted at a discount rate
of 8%. At the date of acquisition the fair value of the contingent consideration was determined to be $5.9m,
discounted to $5.0m.
2015
During the year the contingent consideration arrangement was renegotiated. The performance period was
extended by a year to cover the financial period ended 31 December 2017. The total fair value of contingent
consideration remains the same as previous, however it is now payable over 3 tranches on 1 April 2016, 1 April
2017 and 1 April 2018. New operating performance criteria have been established upon which the contingent
consideration will be paid. The consideration payable is contingent upon the recipients remaining employees
of the company during the performance period.
At the current reporting date the fair value of the contingent consideration related to the specified performance
criteria was reassessed and a portion of the discounting relating only to the cash component reversed. The gross
amount of the contingent consideration related to operating performance criteria at 31 December 2015 was $5.9m.
Also as part of the renegotiation a specific strategic goal achievement was identified to be achieved within the 2016
financial year. The achievement of this goal has the potential to increase the contingent consideration to $6.7m.
Costs related to contingent consideration are recognised under Acquisition costs in the statement of comprehensive
income for the discounted amounts of contingent consideration, with a finance charge recognised under finance
costs for the interest unwind component. In the statement of financial position, the cash component is recognised
under employee benefits – VCL contingent consideration, with this amount split into current and non-current
liabilities based on the expected timing of payments. Share based components are recognised under the share
based payment reserve.
NOTES TO THE FINANCIAL STATEMENTS CONTINUED
27Vista Group International Limited
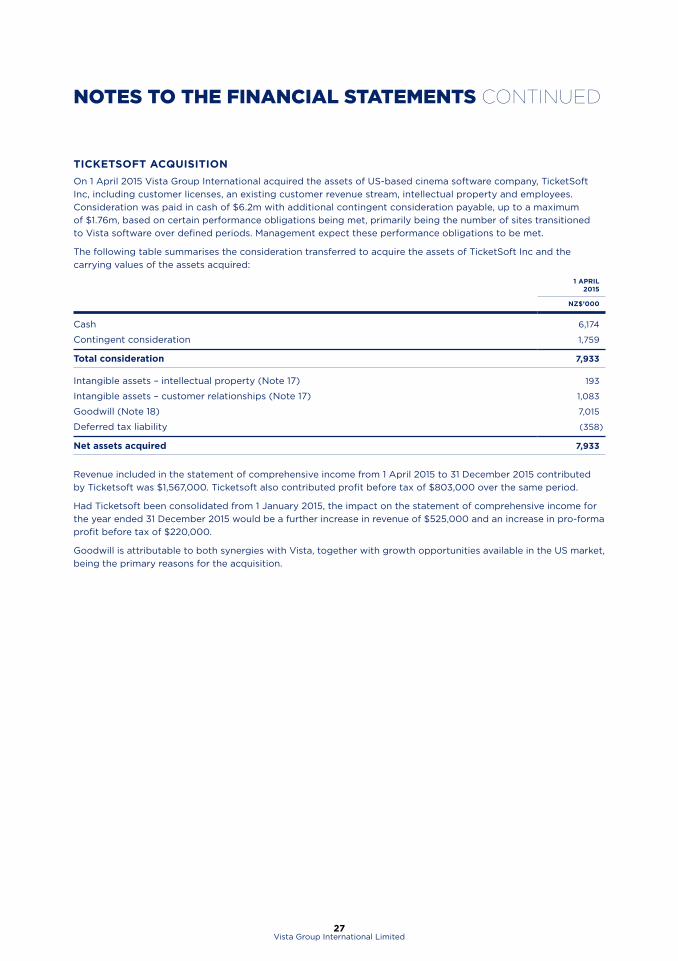
TICKETSOFT ACQUISITION
On 1 April 2015 Vista Group International acquired the assets of US-based cinema software company, TicketSoft
Inc, including customer licenses, an existing customer revenue stream, intellectual property and employees.
Consideration was paid in cash of $6.2m with additional contingent consideration payable, up to a maximum
of $1.76m, based on certain performance obligations being met, primarily being the number of sites transitioned
to Vista software over defined periods. Management expect these performance obligations to be met.
The following table summarises the consideration transferred to acquire the assets of TicketSoft Inc and the
carrying values of the assets acquired:
1 APRIL 2015
NZ$’000
Cash 6,174
Contingent consideration 1,759
Total consideration 7,933
Intangible assets – intellectual property (Note 17) 193
Intangible assets – customer relationships (Note 17) 1,083
Goodwill (Note 18) 7,015
Deferred tax liability (358)
Net assets acquired 7,933
Revenue included in the statement of comprehensive income from 1 April 2015 to 31 December 2015 contributed
by Ticketsoft was $1,567,000. Ticketsoft also contributed profit before tax of $803,000 over the same period.
Had Ticketsoft been consolidated from 1 January 2015, the impact on the statement of comprehensive income for
the year ended 31 December 2015 would be a further increase in revenue of $525,000 and an increase in pro-forma
profit before tax of $220,000.
Goodwill is attributable to both synergies with Vista, together with growth opportunities available in the US market,
being the primary reasons for the acquisition.
NOTES TO THE FINANCIAL STATEMENTS CONTINUED
28Vista Group International Limited
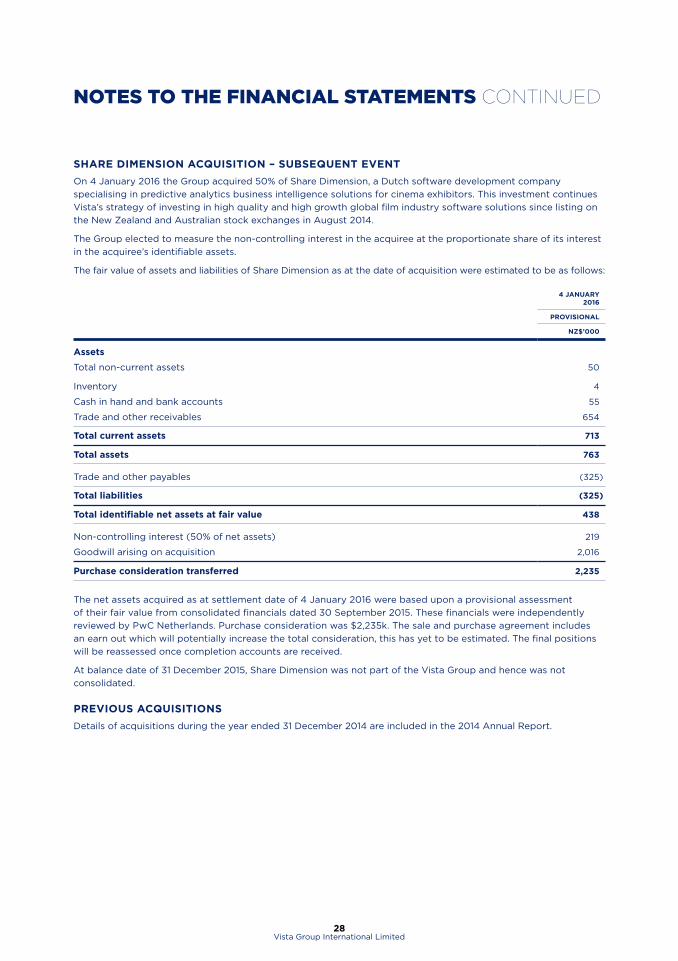
SHARE DIMENSION ACQUISITION – SUBSEQUENT EVENT
On 4 January 2016 the Group acquired 50% of Share Dimension, a Dutch software development company
specialising in predictive analytics business intelligence solutions for cinema exhibitors. This investment continues
Vista’s strategy of investing in high quality and high growth global film industry software solutions since listing on
the New Zealand and Australian stock exchanges in August 2014.
The Group elected to measure the non-controlling interest in the acquiree at the proportionate share of its interest
in the acquiree’s identifiable assets.
The fair value of assets and liabilities of Share Dimension as at the date of acquisition were estimated to be as follows:
4 JANUARY 2016
PROVISIONAL
NZ$’000
Assets
Total non-current assets 50
Inventory 4
Cash in hand and bank accounts 55
Trade and other receivables 654
Total current assets 713
Total assets 763
Trade and other payables (325)
Total liabilities (325)
Total identifiable net assets at fair value 438
Non-controlling interest (50% of net assets) 219
Goodwill arising on acquisition 2,016
Purchase consideration transferred 2,235
The net assets acquired as at settlement date of 4 January 2016 were based upon a provisional assessment
of their fair value from consolidated financials dated 30 September 2015. These financials were independently
reviewed by PwC Netherlands. Purchase consideration was $2,235k. The sale and purchase agreement includes
an earn out which will potentially increase the total consideration, this has yet to be estimated. The final positions
will be reassessed once completion accounts are received.
At balance date of 31 December 2015, Share Dimension was not part of the Vista Group and hence was not
consolidated.
PREVIOUS ACQUISITIONS
Details of acquisitions during the year ended 31 December 2014 are included in the 2014 Annual Report.
NOTES TO THE FINANCIAL STATEMENTS CONTINUED
29Vista Group International Limited
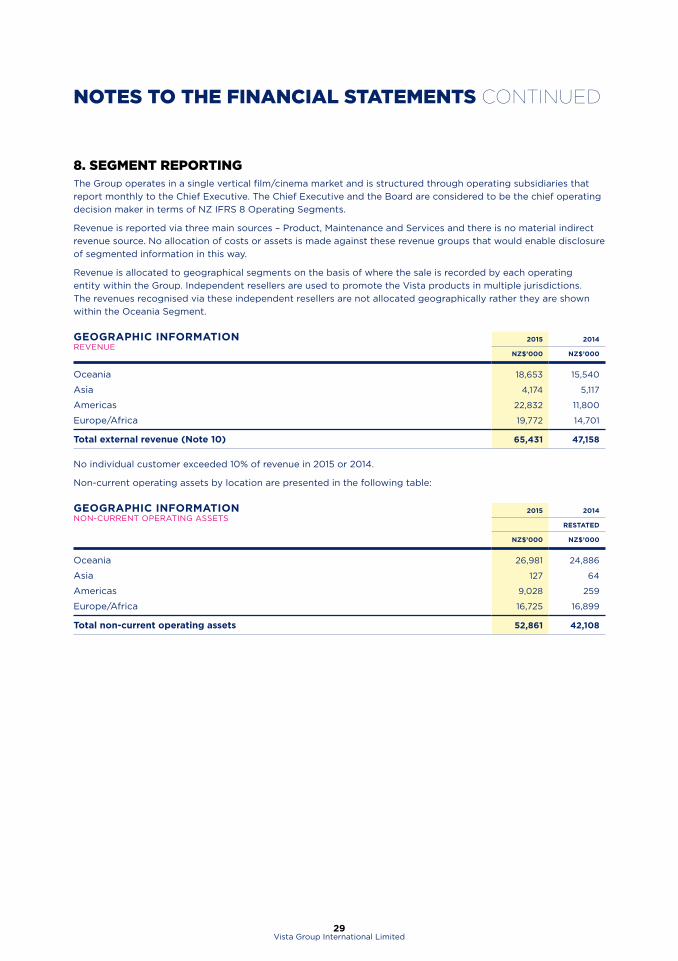
8. SEGMENT REPORTINGThe Group operates in a single vertical film/cinema market and is structured through operating subsidiaries that
report monthly to the Chief Executive. The Chief Executive and the Board are considered to be the chief operating
decision maker in terms of NZ IFRS 8 Operating Segments.
Revenue is reported via three main sources – Product, Maintenance and Services and there is no material indirect
revenue source. No allocation of costs or assets is made against these revenue groups that would enable disclosure
of segmented information in this way.
Revenue is allocated to geographical segments on the basis of where the sale is recorded by each operating
entity within the Group. Independent resellers are used to promote the Vista products in multiple jurisdictions.
The revenues recognised via these independent resellers are not allocated geographically rather they are shown
within the Oceania Segment.
GEOGRAPHIC INFORMATION REVENUE
2015 2014
NZ$’000 NZ$’000
Oceania 18,653 15,540
Asia 4,174 5,117
Americas 22,832 11,800
Europe/Africa 19,772 14,701
Total external revenue (Note 10) 65,431 47,158
No individual customer exceeded 10% of revenue in 2015 or 2014.
Non-current operating assets by location are presented in the following table:
GEOGRAPHIC INFORMATION NON-CURRENT OPERATING ASSETS
2015 2014
RESTATED
NZ$’000 NZ$’000
Oceania 26,981 24,886
Asia 127 64
Americas 9,028 259
Europe/Africa 16,725 16,899
Total non-current operating assets 52,861 42,108
NOTES TO THE FINANCIAL STATEMENTS CONTINUED

30Vista Group International Limited
9. GROUP INFORMATION
INVESTMENT IN SUBSIDIARIES
The financial statements of the group include the following significant subsidiaries:
NAME PRINCIPAL ACTIVITYCOUNTRY OF INCORPORATION
SHAREHOLDING 2015
SHAREHOLDING 2014
Vista Entertainment Solutions
Limited
Software development and
licensing
New Zealand 100% 100%
Virtual Concepts Limited Provision of online loyalty
data analytics and marketing
New Zealand 100% 100%
Movio Limited Provision of online loyalty
data analytics and marketing
New Zealand 100% 100%
Movio (USA) Inc Provision of online loyalty
data analytics and marketing
USA 100% 100%
MACCS International BV Software development
and licensing
Netherlands 50.1% 50.1%
Vista Entertainment Solutions
(UK) Limited
Software licensing England 100.0% 100.0%
Vista Entertainment Solutions
(USA) Inc
Software licensing USA 100.0% 100.0%
Vista Entertainment Solutions
Shanghai Limited
Software licensing China 100.0% 100.0%
Book My Show Limited Online cinema ticketing website New Zealand 74.0% 74.0%
Book My Show (NZ) Limited Online cinema ticketing website New Zealand 74.0% 74.0%
Vista Group Limited Dormant New Zealand 100.0% 100.0%
NOTES TO THE FINANCIAL STATEMENTS CONTINUED
31Vista Group International Limited
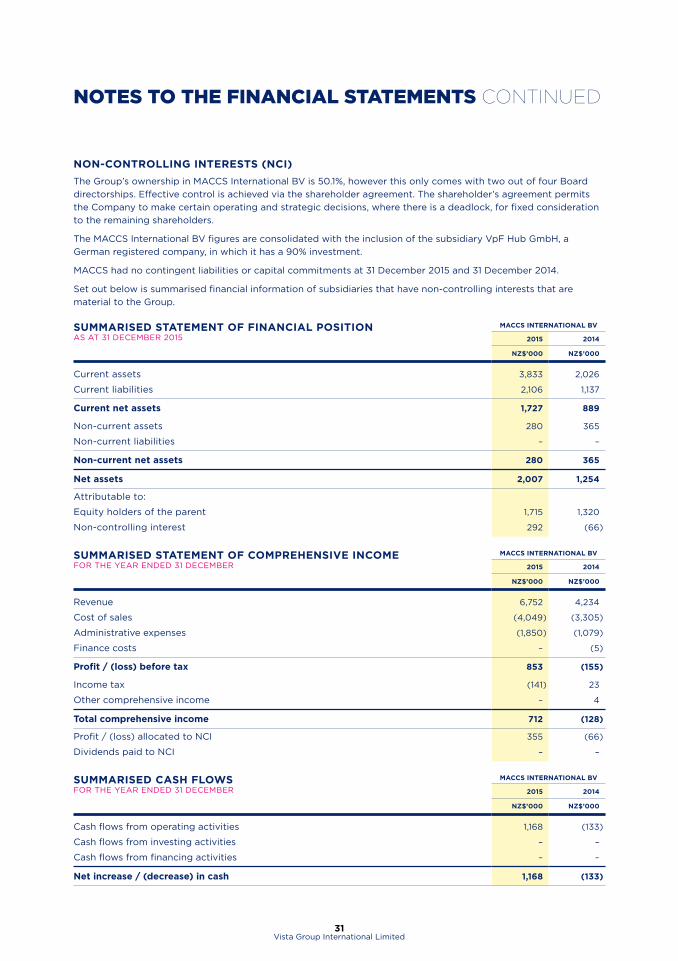
NON-CONTROLLING INTERESTS (NCI)
The Group’s ownership in MACCS International BV is 50.1%, however this only comes with two out of four Board
directorships. Effective control is achieved via the shareholder agreement. The shareholder’s agreement permits
the Company to make certain operating and strategic decisions, where there is a deadlock, for fixed consideration
to the remaining shareholders.
The MACCS International BV figures are consolidated with the inclusion of the subsidiary VpF Hub GmbH, a
German registered company, in which it has a 90% investment.
MACCS had no contingent liabilities or capital commitments at 31 December 2015 and 31 December 2014.
Set out below is summarised financial information of subsidiaries that have non-controlling interests that are
material to the Group.
SUMMARISED STATEMENT OF FINANCIAL POSITION AS AT 31 DECEMBER 2015
MACCS INTERNATIONAL BV
2015 2014
NZ$’000 NZ$’000
Current assets 3,833 2,026
Current liabilities 2,106 1,137
Current net assets 1,727 889
Non-current assets 280 365
Non-current liabilities – –
Non-current net assets 280 365
Net assets 2,007 1,254
Attributable to:
Equity holders of the parent 1,715 1,320
Non-controlling interest 292 (66)
SUMMARISED STATEMENT OF COMPREHENSIVE INCOME FOR THE YEAR ENDED 31 DECEMBER
MACCS INTERNATIONAL BV
2015 2014
NZ$’000 NZ$’000
Revenue 6,752 4,234
Cost of sales (4,049) (3,305)
Administrative expenses (1,850) (1,079)
Finance costs – (5)
Profit / (loss) before tax 853 (155)
Income tax (141) 23
Other comprehensive income – 4
Total comprehensive income 712 (128)
Profit / (loss) allocated to NCI 355 (66)
Dividends paid to NCI – –
SUMMARISED CASH FLOWS FOR THE YEAR ENDED 31 DECEMBER
MACCS INTERNATIONAL BV
2015 2014
NZ$’000 NZ$’000
Cash flows from operating activities 1,168 (133)
Cash flows from investing activities – –
Cash flows from financing activities – –
Net increase / (decrease) in cash 1,168 (133)
NOTES TO THE FINANCIAL STATEMENTS CONTINUED
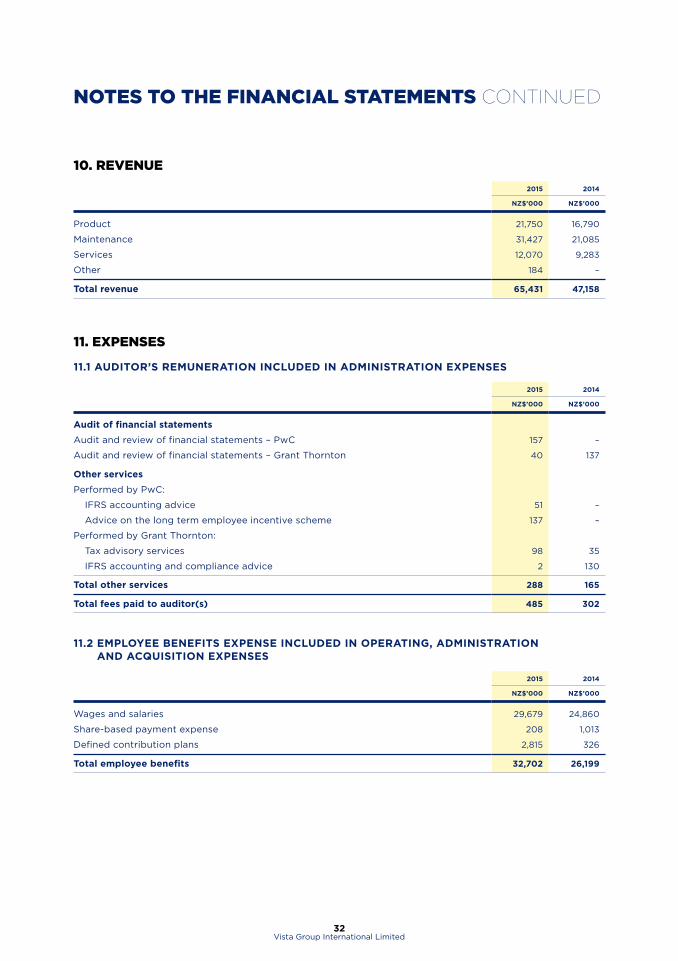
32Vista Group International Limited
10. REVENUE
2015 2014
NZ$’000 NZ$’000
Product 21,750 16,790
Maintenance 31,427 21,085
Services 12,070 9,283
Other 184 –
Total revenue 65,431 47,158
11. EXPENSES
11.1 AUDITOR’S REMUNERATION INCLUDED IN ADMINISTRATION EXPENSES
2015 2014
NZ$’000 NZ$’000
Audit of financial statements
Audit and review of financial statements – PwC 157 –
Audit and review of financial statements – Grant Thornton 40 137
Other services
Performed by PwC:
IFRS accounting advice 51 –
Advice on the long term employee incentive scheme 137 –
Performed by Grant Thornton:
Tax advisory services 98 35
IFRS accounting and compliance advice 2 130
Total other services 288 165
Total fees paid to auditor(s) 485 302
11.2 EMPLOYEE BENEFITS EXPENSE INCLUDED IN OPERATING, ADMINISTRATION AND ACQUISITION EXPENSES
2015 2014
NZ$’000 NZ$’000
Wages and salaries 29,679 24,860
Share-based payment expense 208 1,013
Defined contribution plans 2,815 326
Total employee benefits 32,702 26,199
NOTES TO THE FINANCIAL STATEMENTS CONTINUED
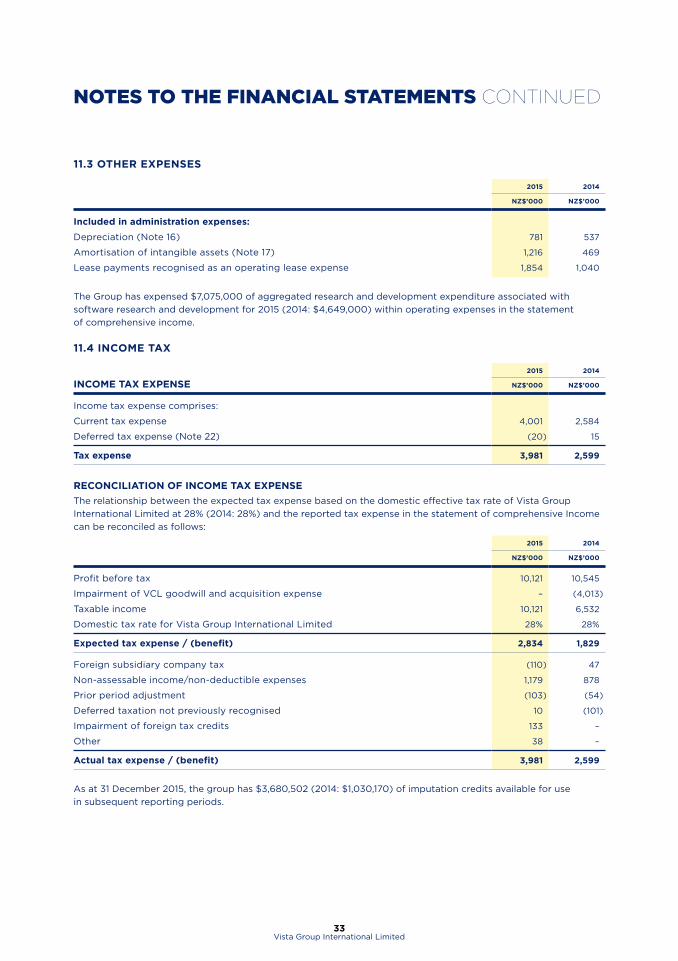
33Vista Group International Limited
11.3 OTHER EXPENSES
2015 2014
NZ$’000 NZ$’000
Included in administration expenses:
Depreciation (Note 16) 781 537
Amortisation of intangible assets (Note 17) 1,216 469
Lease payments recognised as an operating lease expense 1,854 1,040
The Group has expensed $7,075,000 of aggregated research and development expenditure associated with
software research and development for 2015 (2014: $4,649,000) within operating expenses in the statement
of comprehensive income.
11.4 INCOME TAX
INCOME TAX EXPENSE
2015 2014
NZ$’000 NZ$’000
Income tax expense comprises:
Current tax expense 4,001 2,584
Deferred tax expense (Note 22) (20) 15
Tax expense 3,981 2,599
RECONCILIATION OF INCOME TAX EXPENSE
The relationship between the expected tax expense based on the domestic effective tax rate of Vista Group
International Limited at 28% (2014: 28%) and the reported tax expense in the statement of comprehensive Income
can be reconciled as follows:
2015 2014
NZ$’000 NZ$’000
Profit before tax 10,121 10,545
Impairment of VCL goodwill and acquisition expense – (4,013)
Taxable income 10,121 6,532
Domestic tax rate for Vista Group International Limited 28% 28%
Expected tax expense / (benefit) 2,834 1,829
Foreign subsidiary company tax (110) 47
Non-assessable income/non-deductible expenses 1,179 878
Prior period adjustment (103) (54)
Deferred taxation not previously recognised 10 (101)
Impairment of foreign tax credits 133 –
Other 38 –
Actual tax expense / (benefit) 3,981 2,599
As at 31 December 2015, the group has $3,680,502 (2014: $1,030,170) of imputation credits available for use
in subsequent reporting periods.
NOTES TO THE FINANCIAL STATEMENTS CONTINUED

34Vista Group International Limited
12. SHARE BASED PAYMENTS
12.1 EXPENSES ARISING FROM SHARE BASED PAYMENT TRANSACTIONS
The expense recognised for employee services received during the year is shown in the following table and are
included within operating expenses:
2015 2014
AUDITED / RESTATED
NOTES NZ$’000 NZ$’000
Expenses arising from employee share based payment transactions 4.16 – 1,013
Expenses arising from VCL acquisition 7 1,435 653
Equity settled LTI scheme 208 –
Total expense 1,643 1,666
The amount of $1,013,000 relates to the gift, offer and reward plans 2014, refer to Note 4.16.
12.2 EQUITY SETTLED LONG-TERM INCENTIVE SCHEME
During the year the Directors approved an equity settled long-term incentive scheme for selected key
management personnel (“Participants”). The plan is intended to focus performance on achievement of key
long term performance metrics.
The allocation of performance rights is based on a percentage of annual base salary, adjusted by a risk factor
calculated using the Monte Carlo valuation model. Performance rights are granted under the plan for no consideration
and carry no dividend or voting rights. Participation in the scheme is at the board’s discretion and participants in the
scheme are not guaranteed a place from year to year.
The amount of performance rights that will vest depends on Vista’s relative Total Shareholder Return (“TSR”) to
shareholders. Vesting of performance rights is dependent upon the Group achieving relative TSR targets over a
two and three year performance period, against all other NZX50 companies (excluding Vista), with 50% of the
value of rights allocated under each target. Vesting of the performance rights is defined by the following table:
PERCENTILE PERFORMANCE AGAINST NZX50 COMPANIES VESTING PERFORMANCE RIGHTS
Less than 50th percentile zero
50th – 75th percentile 50% to 75% pro-rata on a straight line basis
Greater than 75th percentile 100%
TSR is measured by the change in TSR from the start date of the grant period until the end of the performance
period (two years and three years). The scheme allows the carry forward of any performance rights that do not
vest in the first vesting period to be eligible to vest in the vesting period for the second tranche of performance
rights. The scale at which carried over rights may vest at the end of the tranche two vesting period shall commence
at the TSR percentile achieved in respect of the tranche one vesting period.
The fair value of rights granted is recognised as an employee expense in the statement of comprehensive income
with a corresponding increase in the employee share based payments reserve. The fair value is measured at grant
date and amortised over the vesting periods. The Group has recognised $208,000 of employee expenses during
the year ended 31 December 2015.
NOTES TO THE FINANCIAL STATEMENTS CONTINUED
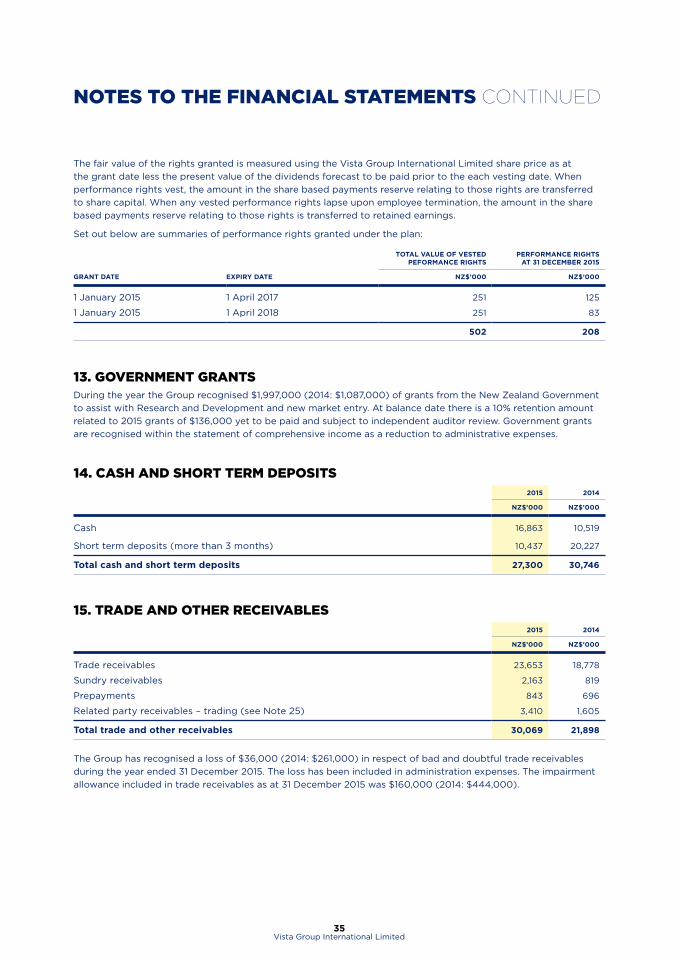
35Vista Group International Limited
The fair value of the rights granted is measured using the Vista Group International Limited share price as at
the grant date less the present value of the dividends forecast to be paid prior to the each vesting date. When
performance rights vest, the amount in the share based payments reserve relating to those rights are transferred
to share capital. When any vested performance rights lapse upon employee termination, the amount in the share
based payments reserve relating to those rights is transferred to retained earnings.
Set out below are summaries of performance rights granted under the plan:
TOTAL VALUE OF VESTED PEFORMANCE RIGHTS
PERFORMANCE RIGHTS AT 31 DECEMBER 2015
GRANT DATE EXPIRY DATE NZ$’000 NZ$’000
1 January 2015 1 April 2017 251 125
1 January 2015 1 April 2018 251 83
502 208
13. GOVERNMENT GRANTSDuring the year the Group recognised $1,997,000 (2014: $1,087,000) of grants from the New Zealand Government
to assist with Research and Development and new market entry. At balance date there is a 10% retention amount
related to 2015 grants of $136,000 yet to be paid and subject to independent auditor review. Government grants
are recognised within the statement of comprehensive income as a reduction to administrative expenses.
14. CASH AND SHORT TERM DEPOSITS2015 2014
NZ$’000 NZ$’000
Cash 16,863 10,519
Short term deposits (more than 3 months) 10,437 20,227
Total cash and short term deposits 27,300 30,746
15. TRADE AND OTHER RECEIVABLES2015 2014
NZ$’000 NZ$’000
Trade receivables 23,653 18,778
Sundry receivables 2,163 819
Prepayments 843 696
Related party receivables – trading (see Note 25) 3,410 1,605
Total trade and other receivables 30,069 21,898
The Group has recognised a loss of $36,000 (2014: $261,000) in respect of bad and doubtful trade receivables
during the year ended 31 December 2015. The loss has been included in administration expenses. The impairment
allowance included in trade receivables as at 31 December 2015 was $160,000 (2014: $444,000).
NOTES TO THE FINANCIAL STATEMENTS CONTINUED
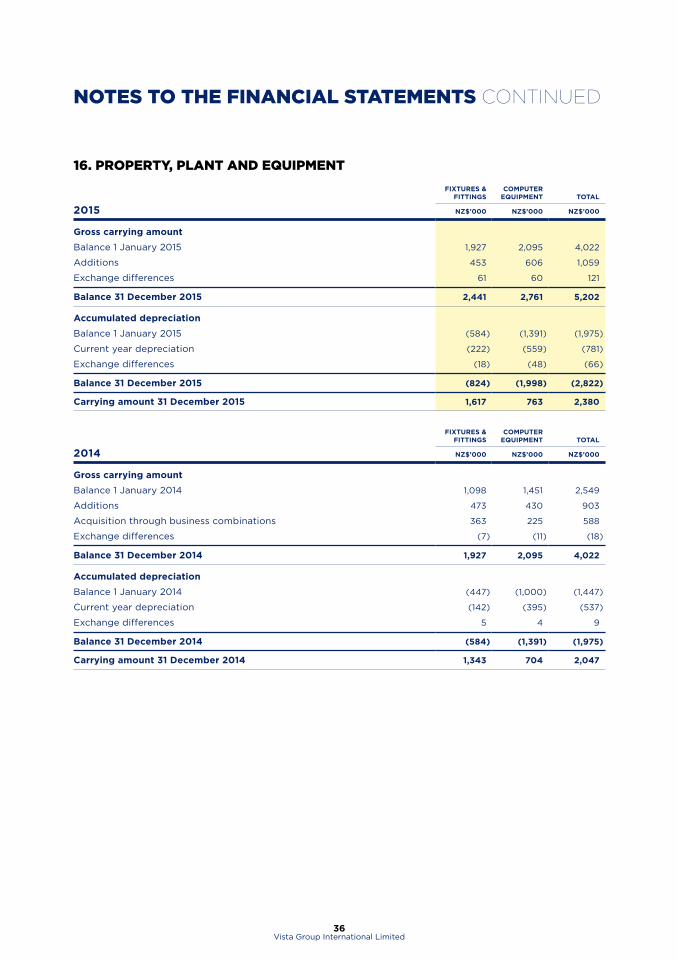
36Vista Group International Limited
16. PROPERTY, PLANT AND EQUIPMENT
2015
FIXTURES & FITTINGS
COMPUTER EQUIPMENT TOTAL
NZ$’000 NZ$’000 NZ$’000
Gross carrying amount
Balance 1 January 2015 1,927 2,095 4,022
Additions 453 606 1,059
Exchange differences 61 60 121
Balance 31 December 2015 2,441 2,761 5,202
Accumulated depreciation
Balance 1 January 2015 (584) (1,391) (1,975)
Current year depreciation (222) (559) (781)
Exchange differences (18) (48) (66)
Balance 31 December 2015 (824) (1,998) (2,822)
Carrying amount 31 December 2015 1,617 763 2,380
2014
FIXTURES & FITTINGS
COMPUTER EQUIPMENT TOTAL
NZ$’000 NZ$’000 NZ$’000
Gross carrying amount
Balance 1 January 2014 1,098 1,451 2,549
Additions 473 430 903
Acquisition through business combinations 363 225 588
Exchange differences (7) (11) (18)
Balance 31 December 2014 1,927 2,095 4,022
Accumulated depreciation
Balance 1 January 2014 (447) (1,000) (1,447)
Current year depreciation (142) (395) (537)
Exchange differences 5 4 9
Balance 31 December 2014 (584) (1,391) (1,975)
Carrying amount 31 December 2014 1,343 704 2,047
NOTES TO THE FINANCIAL STATEMENTS CONTINUED
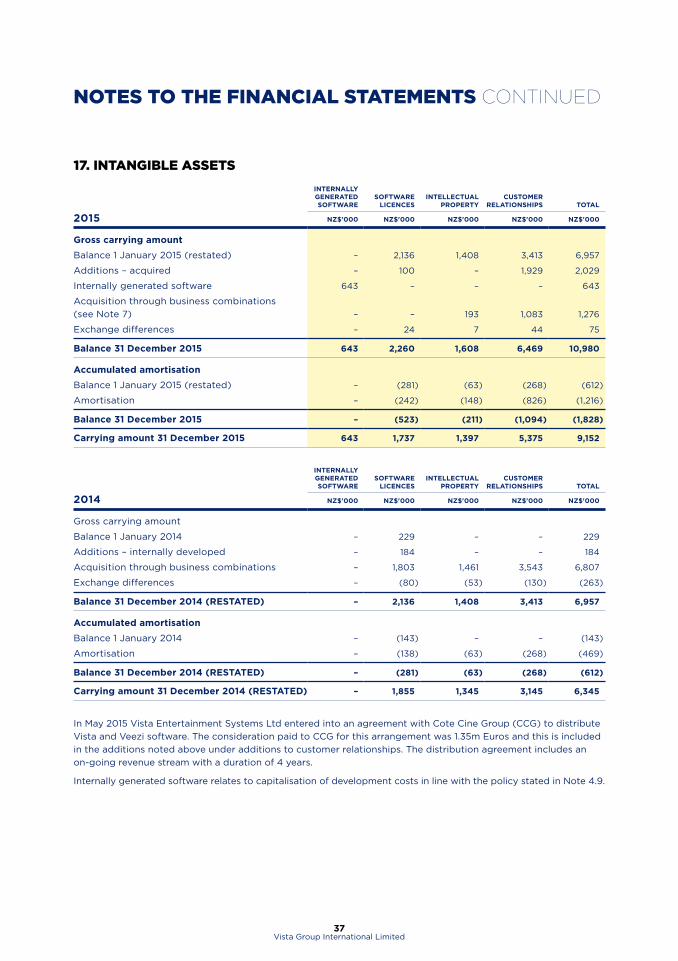
37Vista Group International Limited
17. INTANGIBLE ASSETS
2015
INTERNALLY GENERATED SOFTWARE
SOFTWARE LICENCES
INTELLECTUAL PROPERTY
CUSTOMER RELATIONSHIPS TOTAL
NZ$'000 NZ$'000 NZ$'000 NZ$'000 NZ$'000
Gross carrying amount
Balance 1 January 2015 (restated) – 2,136 1,408 3,413 6,957
Additions – acquired – 100 – 1,929 2,029
Internally generated software 643 – – – 643
Acquisition through business combinations
(see Note 7) – – 193 1,083 1,276
Exchange differences – 24 7 44 75
Balance 31 December 2015 643 2,260 1,608 6,469 10,980
Accumulated amortisation
Balance 1 January 2015 (restated) – (281) (63) (268) (612)
Amortisation – (242) (148) (826) (1,216)
Balance 31 December 2015 – (523) (211) (1,094) (1,828)
Carrying amount 31 December 2015 643 1,737 1,397 5,375 9,152
2014
INTERNALLY GENERATED SOFTWARE
SOFTWARE LICENCES
INTELLECTUAL PROPERTY
CUSTOMER RELATIONSHIPS TOTAL
NZ$'000 NZ$'000 NZ$'000 NZ$'000 NZ$'000
Gross carrying amount
Balance 1 January 2014 – 229 – – 229
Additions – internally developed – 184 – – 184
Acquisition through business combinations – 1,803 1,461 3,543 6,807
Exchange differences – (80) (53) (130) (263)
Balance 31 December 2014 (RESTATED) – 2,136 1,408 3,413 6,957
Accumulated amortisation
Balance 1 January 2014 – (143) – – (143)
Amortisation – (138) (63) (268) (469)
Balance 31 December 2014 (RESTATED) – (281) (63) (268) (612)
Carrying amount 31 December 2014 (RESTATED) – 1,855 1,345 3,145 6,345
In May 2015 Vista Entertainment Systems Ltd entered into an agreement with Cote Cine Group (CCG) to distribute
Vista and Veezi software. The consideration paid to CCG for this arrangement was 1.35m Euros and this is included
in the additions noted above under additions to customer relationships. The distribution agreement includes an
on-going revenue stream with a duration of 4 years.
Internally generated software relates to capitalisation of development costs in line with the policy stated in Note 4.9.
NOTES TO THE FINANCIAL STATEMENTS CONTINUED
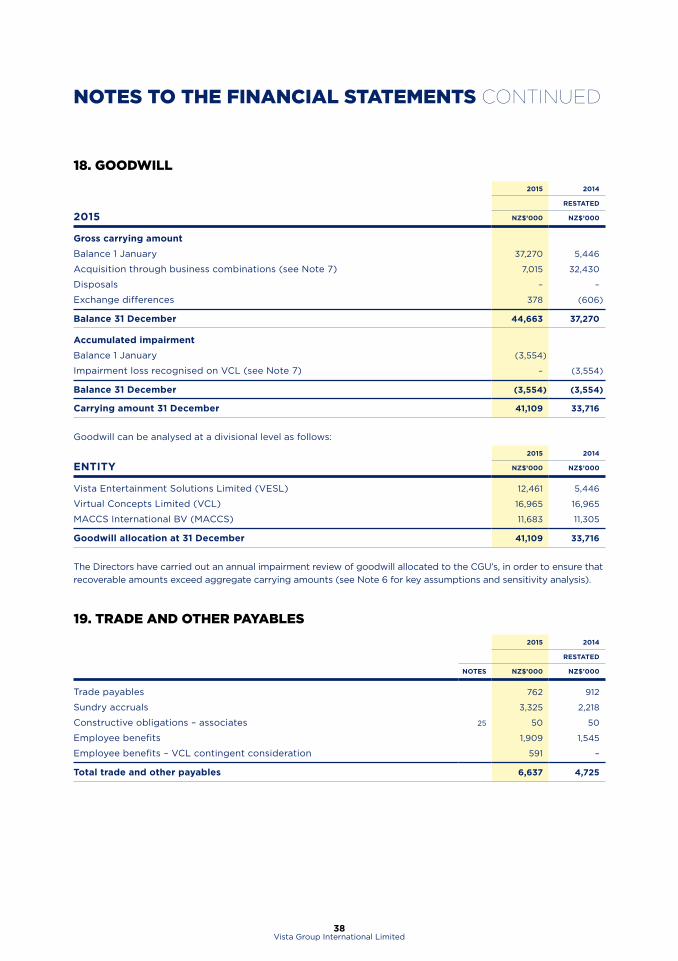
38Vista Group International Limited
18. GOODWILL
2015
2015 2014
RESTATED
NZ$’000 NZ$’000
Gross carrying amount
Balance 1 January 37,270 5,446
Acquisition through business combinations (see Note 7) 7,015 32,430
Disposals – –
Exchange differences 378 (606)
Balance 31 December 44,663 37,270
Accumulated impairment
Balance 1 January (3,554)
Impairment loss recognised on VCL (see Note 7) – (3,554)
Balance 31 December (3,554) (3,554)
Carrying amount 31 December 41,109 33,716
Goodwill can be analysed at a divisional level as follows:
ENTITY2015 2014
NZ$’000 NZ$’000
Vista Entertainment Solutions Limited (VESL) 12,461 5,446
Virtual Concepts Limited (VCL) 16,965 16,965
MACCS International BV (MACCS) 11,683 11,305
Goodwill allocation at 31 December 41,109 33,716
The Directors have carried out an annual impairment review of goodwill allocated to the CGU’s, in order to ensure that
recoverable amounts exceed aggregate carrying amounts (see Note 6 for key assumptions and sensitivity analysis).
19. TRADE AND OTHER PAYABLES
2015 2014
RESTATED
NOTES NZ$’000 NZ$’000
Trade payables 762 912
Sundry accruals 3,325 2,218
Constructive obligations – associates 25 50 50
Employee benefits 1,909 1,545
Employee benefits – VCL contingent consideration 591 –
Total trade and other payables 6,637 4,725
NOTES TO THE FINANCIAL STATEMENTS CONTINUED
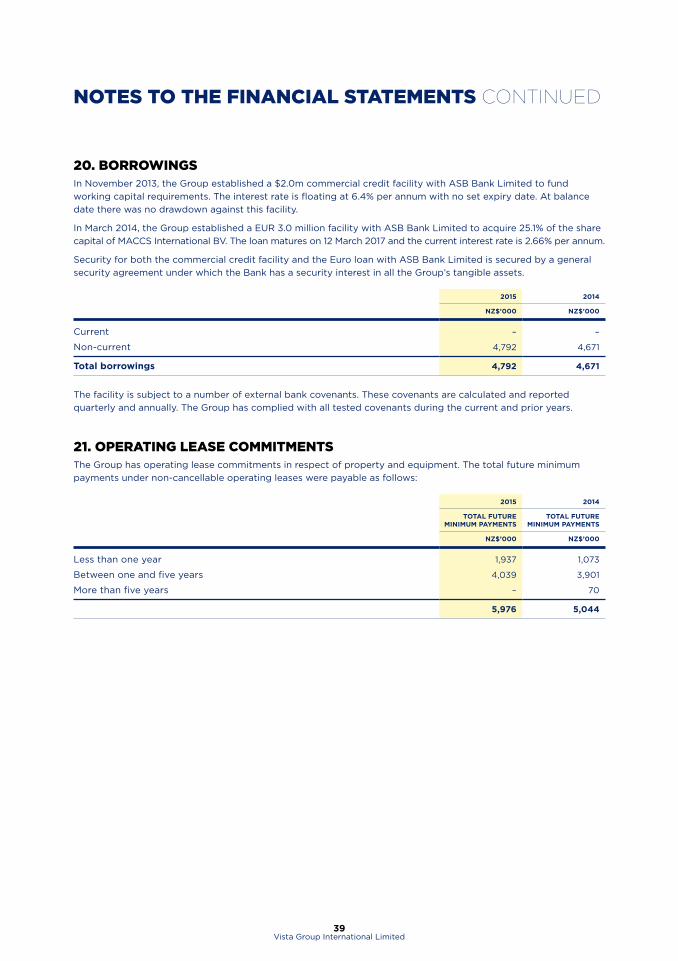
39Vista Group International Limited
20. BORROWINGSIn November 2013, the Group established a $2.0m commercial credit facility with ASB Bank Limited to fund
working capital requirements. The interest rate is floating at 6.4% per annum with no set expiry date. At balance
date there was no drawdown against this facility.
In March 2014, the Group established a EUR 3.0 million facility with ASB Bank Limited to acquire 25.1% of the share
capital of MACCS International BV. The loan matures on 12 March 2017 and the current interest rate is 2.66% per annum.
Security for both the commercial credit facility and the Euro loan with ASB Bank Limited is secured by a general
security agreement under which the Bank has a security interest in all the Group’s tangible assets.
2015 2014
NZ$’000 NZ$’000
Current – –
Non-current 4,792 4,671
Total borrowings 4,792 4,671
The facility is subject to a number of external bank covenants. These covenants are calculated and reported
quarterly and annually. The Group has complied with all tested covenants during the current and prior years.
21. OPERATING LEASE COMMITMENTSThe Group has operating lease commitments in respect of property and equipment. The total future minimum
payments under non-cancellable operating leases were payable as follows:
2015 2014
TOTAL FUTURE MINIMUM PAYMENTS
TOTAL FUTURE MINIMUM PAYMENTS
NZ$’000 NZ$’000
Less than one year 1,937 1,073
Between one and five years 4,039 3,901
More than five years – 70
5,976 5,044
NOTES TO THE FINANCIAL STATEMENTS CONTINUED
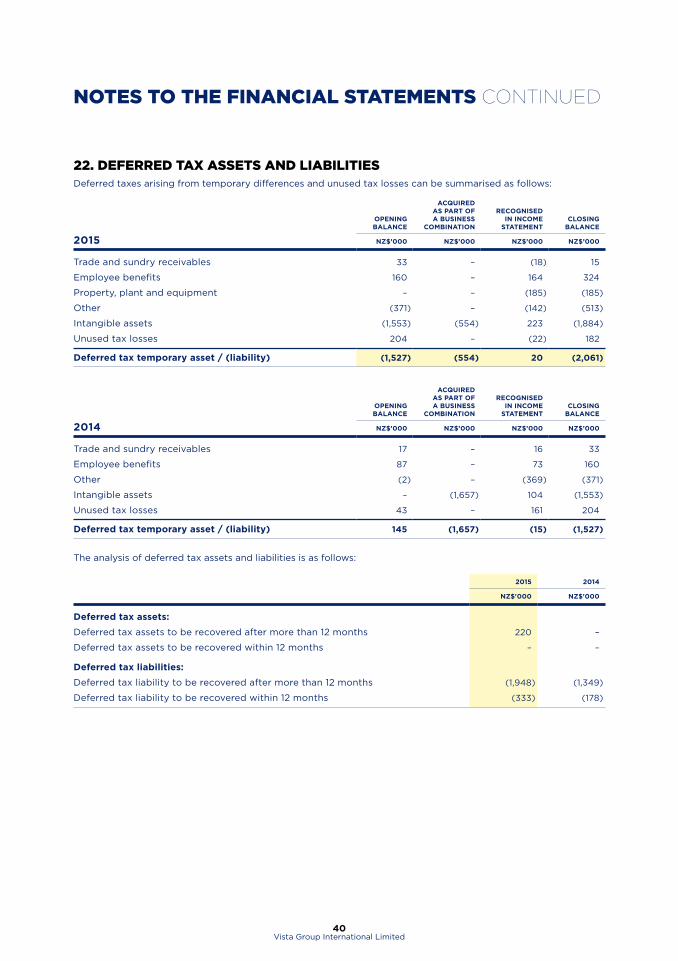
40Vista Group International Limited
22. DEFERRED TAX ASSETS AND LIABILITIESDeferred taxes arising from temporary differences and unused tax losses can be summarised as follows:
2015
OPENING BALANCE
ACQUIRED AS PART OF A BUSINESS
COMBINATION
RECOGNISED IN INCOME
STATEMENTCLOSING
BALANCE
NZ$’000 NZ$’000 NZ$’000 NZ$’000
Trade and sundry receivables 33 – (18) 15
Employee benefits 160 – 164 324
Property, plant and equipment – – (185) (185)
Other (371) – (142) (513)
Intangible assets (1,553) (554) 223 (1,884)
Unused tax losses 204 – (22) 182
Deferred tax temporary asset / (liability) (1,527) (554) 20 (2,061)
2014
OPENING BALANCE
ACQUIRED AS PART OF A BUSINESS
COMBINATION
RECOGNISED IN INCOME
STATEMENTCLOSING
BALANCE
NZ$’000 NZ$’000 NZ$’000 NZ$’000
Trade and sundry receivables 17 – 16 33
Employee benefits 87 – 73 160
Other (2) – (369) (371)
Intangible assets – (1,657) 104 (1,553)
Unused tax losses 43 – 161 204
Deferred tax temporary asset / (liability) 145 (1,657) (15) (1,527)
The analysis of deferred tax assets and liabilities is as follows:
2015 2014
NZ$'000 NZ$'000
Deferred tax assets:
Deferred tax assets to be recovered after more than 12 months 220 –
Deferred tax assets to be recovered within 12 months – –
Deferred tax liabilities:
Deferred tax liability to be recovered after more than 12 months (1,948) (1,349)
Deferred tax liability to be recovered within 12 months (333) (178)
NOTES TO THE FINANCIAL STATEMENTS CONTINUED
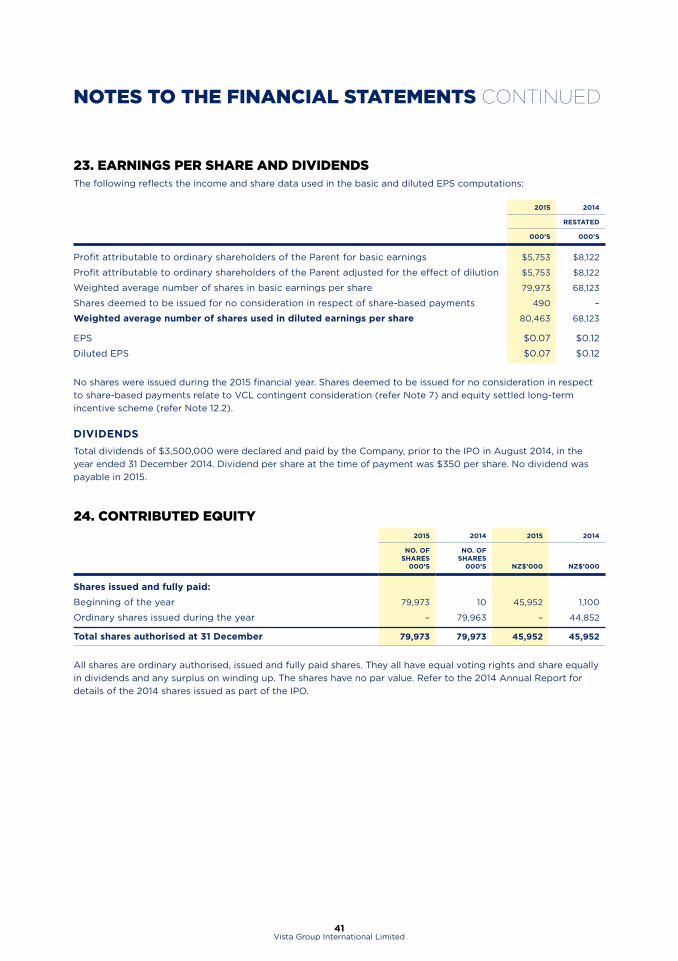
41Vista Group International Limited
23. EARNINGS PER SHARE AND DIVIDENDSThe following reflects the income and share data used in the basic and diluted EPS computations:
2015 2014
RESTATED
000’S 000’S
Profit attributable to ordinary shareholders of the Parent for basic earnings $5,753 $8,122
Profit attributable to ordinary shareholders of the Parent adjusted for the effect of dilution $5,753 $8,122
Weighted average number of shares in basic earnings per share 79,973 68,123
Shares deemed to be issued for no consideration in respect of share-based payments 490 –
Weighted average number of shares used in diluted earnings per share 80,463 68,123
EPS $0.07 $0.12
Diluted EPS $0.07 $0.12
No shares were issued during the 2015 financial year. Shares deemed to be issued for no consideration in respect
to share-based payments relate to VCL contingent consideration (refer Note 7) and equity settled long-term
incentive scheme (refer Note 12.2).
DIVIDENDS
Total dividends of $3,500,000 were declared and paid by the Company, prior to the IPO in August 2014, in the
year ended 31 December 2014. Dividend per share at the time of payment was $350 per share. No dividend was
payable in 2015.
24. CONTRIBUTED EQUITY2015 2014 2015 2014
NO. OF SHARES
000’S
NO. OF SHARES
000’S NZ$’000 NZ$’000
Shares issued and fully paid:
Beginning of the year 79,973 10 45,952 1,100
Ordinary shares issued during the year – 79,963 – 44,852
Total shares authorised at 31 December 79,973 79,973 45,952 45,952
All shares are ordinary authorised, issued and fully paid shares. They all have equal voting rights and share equally
in dividends and any surplus on winding up. The shares have no par value. Refer to the 2014 Annual Report for
details of the 2014 shares issued as part of the IPO.
NOTES TO THE FINANCIAL STATEMENTS CONTINUED
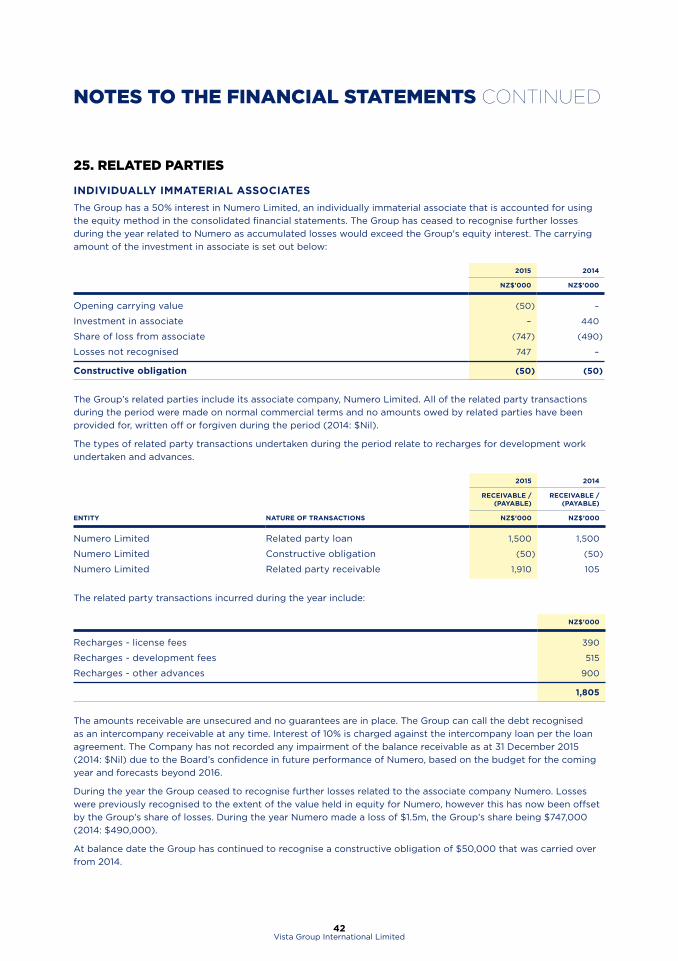
42Vista Group International Limited
25. RELATED PARTIES
INDIVIDUALLY IMMATERIAL ASSOCIATES
The Group has a 50% interest in Numero Limited, an individually immaterial associate that is accounted for using
the equity method in the consolidated financial statements. The Group has ceased to recognise further losses
during the year related to Numero as accumulated losses would exceed the Group's equity interest. The carrying
amount of the investment in associate is set out below:
2015 2014
NZ$'000 NZ$'000
Opening carrying value (50) –
Investment in associate – 440
Share of loss from associate (747) (490)
Losses not recognised 747 –
Constructive obligation (50) (50)
The Group’s related parties include its associate company, Numero Limited. All of the related party transactions
during the period were made on normal commercial terms and no amounts owed by related parties have been
provided for, written off or forgiven during the period (2014: $Nil).
The types of related party transactions undertaken during the period relate to recharges for development work
undertaken and advances.
2015 2014
RECEIVABLE /(PAYABLE)
RECEIVABLE /(PAYABLE)
ENTITY NATURE OF TRANSACTIONS NZ$’000 NZ$’000
Numero Limited Related party loan 1,500 1,500
Numero Limited Constructive obligation (50) (50)
Numero Limited Related party receivable 1,910 105
The related party transactions incurred during the year include:
NZ$'000
Recharges - license fees 390
Recharges - development fees 515
Recharges - other advances 900
1,805
The amounts receivable are unsecured and no guarantees are in place. The Group can call the debt recognised
as an intercompany receivable at any time. Interest of 10% is charged against the intercompany loan per the loan
agreement. The Company has not recorded any impairment of the balance receivable as at 31 December 2015
(2014: $Nil) due to the Board’s confidence in future performance of Numero, based on the budget for the coming
year and forecasts beyond 2016.
During the year the Group ceased to recognise further losses related to the associate company Numero. Losses
were previously recognised to the extent of the value held in equity for Numero, however this has now been offset
by the Group’s share of losses. During the year Numero made a loss of $1.5m, the Group’s share being $747,000
(2014: $490,000).
At balance date the Group has continued to recognise a constructive obligation of $50,000 that was carried over
from 2014.
NOTES TO THE FINANCIAL STATEMENTS CONTINUED
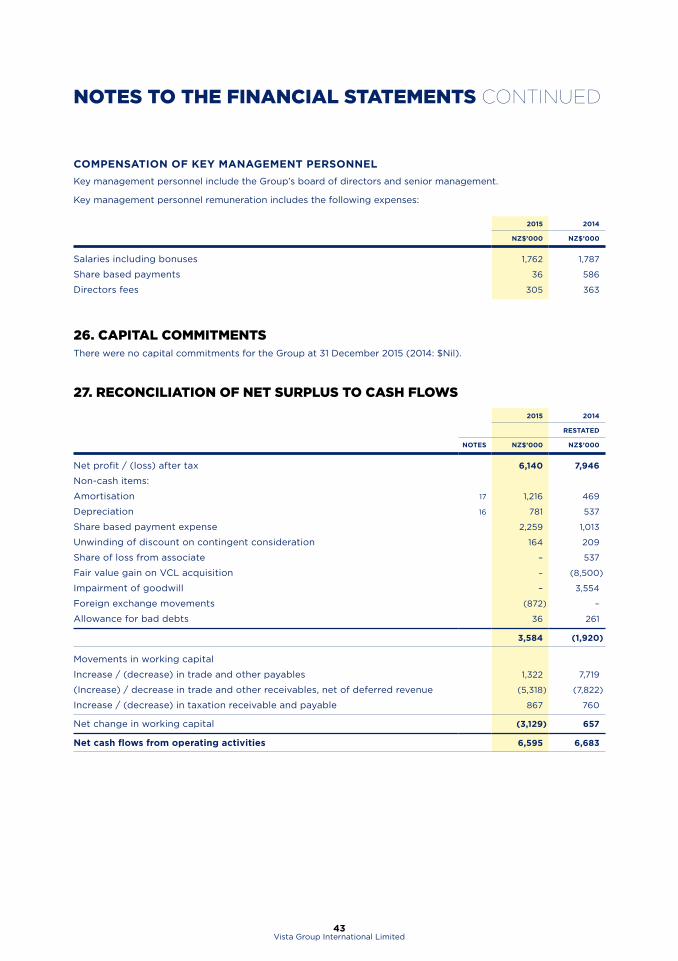
43Vista Group International Limited
COMPENSATION OF KEY MANAGEMENT PERSONNEL
Key management personnel include the Group’s board of directors and senior management.
Key management personnel remuneration includes the following expenses:
2015 2014
NZ$’000 NZ$’000
Salaries including bonuses 1,762 1,787
Share based payments 36 586
Directors fees 305 363
26. CAPITAL COMMITMENTSThere were no capital commitments for the Group at 31 December 2015 (2014: $Nil).
27. RECONCILIATION OF NET SURPLUS TO CASH FLOWS
2015 2014
RESTATED
NOTES NZ$’000 NZ$’000
Net profit / (loss) after tax 6,140 7,946
Non-cash items:
Amortisation 17 1,216 469
Depreciation 16 781 537
Share based payment expense 2,259 1,013
Unwinding of discount on contingent consideration 164 209
Share of loss from associate – 537
Fair value gain on VCL acquisition – (8,500)
Impairment of goodwill – 3,554
Foreign exchange movements (872) –
Allowance for bad debts 36 261
3,584 (1,920)
Movements in working capital
Increase / (decrease) in trade and other payables 1,322 7,719
(Increase) / decrease in trade and other receivables, net of deferred revenue (5,318) (7,822)
Increase / (decrease) in taxation receivable and payable 867 760
Net change in working capital (3,129) 657
Net cash flows from operating activities 6,595 6,683
NOTES TO THE FINANCIAL STATEMENTS CONTINUED
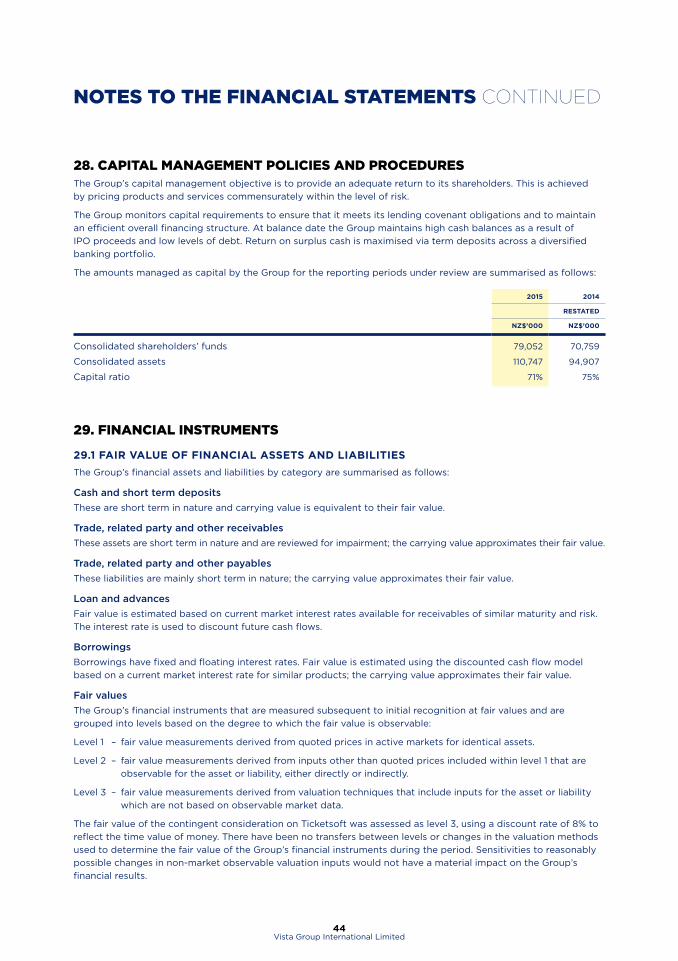
44Vista Group International Limited
28. CAPITAL MANAGEMENT POLICIES AND PROCEDURESThe Group’s capital management objective is to provide an adequate return to its shareholders. This is achieved
by pricing products and services commensurately within the level of risk.
The Group monitors capital requirements to ensure that it meets its lending covenant obligations and to maintain
an efficient overall financing structure. At balance date the Group maintains high cash balances as a result of
IPO proceeds and low levels of debt. Return on surplus cash is maximised via term deposits across a diversified
banking portfolio.
The amounts managed as capital by the Group for the reporting periods under review are summarised as follows:
2015 2014
RESTATED
NZ$’000 NZ$’000
Consolidated shareholders’ funds 79,052 70,759
Consolidated assets 110,747 94,907
Capital ratio 71% 75%
29. FINANCIAL INSTRUMENTS
29.1 FAIR VALUE OF FINANCIAL ASSETS AND LIABILITIES
The Group’s financial assets and liabilities by category are summarised as follows:
Cash and short term deposits
These are short term in nature and carrying value is equivalent to their fair value.
Trade, related party and other receivables
These assets are short term in nature and are reviewed for impairment; the carrying value approximates their fair value.
Trade, related party and other payables
These liabilities are mainly short term in nature; the carrying value approximates their fair value.
Loan and advances
Fair value is estimated based on current market interest rates available for receivables of similar maturity and risk.
The interest rate is used to discount future cash flows.
Borrowings
Borrowings have fixed and floating interest rates. Fair value is estimated using the discounted cash flow model
based on a current market interest rate for similar products; the carrying value approximates their fair value.
Fair values
The Group’s financial instruments that are measured subsequent to initial recognition at fair values and are
grouped into levels based on the degree to which the fair value is observable:
Level 1 – fair value measurements derived from quoted prices in active markets for identical assets.
Level 2 – fair value measurements derived from inputs other than quoted prices included within level 1 that are
observable for the asset or liability, either directly or indirectly.
Level 3 – fair value measurements derived from valuation techniques that include inputs for the asset or liability
which are not based on observable market data.
The fair value of the contingent consideration on Ticketsoft was assessed as level 3, using a discount rate of 8% to
reflect the time value of money. There have been no transfers between levels or changes in the valuation methods
used to determine the fair value of the Group’s financial instruments during the period. Sensitivities to reasonably
possible changes in non-market observable valuation inputs would not have a material impact on the Group’s
financial results.
NOTES TO THE FINANCIAL STATEMENTS CONTINUED

45Vista Group International Limited
29.2 FINANCIAL INSTRUMENTS BY CATEGORY
2015 2014
NOTES NZ$’000 NZ$’000
Loans and receivables
Cash 14 16,863 10,519
Short term deposits 14 10,437 20,227
Trade receivables 15 23,653 18,778
Sundry receivables 15 2,163 819
Related party receivables – trading 15 3,410 1,605
56,526 51,948
Financial liabilities measured at amortised cost
Trade payables 19 762 912
Sundry accruals 2,918 –
Borrowings 20 4,792 4,671
Financial liabilities measured at fair value
Contingent consideration 1,253 –
9,725 5,583
29.3 FINANCIAL RISK MANAGEMENT
The Group is exposed to three main types of risks in relation to financial instruments, which are market (foreign
currency risk and interest rate risk), credit and liquidity.
The Group’s risk management is coordinated at its headquarters, in close cooperation with the board of directors,
and focuses on actively monitoring and securing the Group’s short to medium-term cash flows by minimising the
exposure to financial markets. The most significant financial risks to which the Group is exposed are described below.
Foreign currency risk
Most of the Group’s transactions carry a component that is ultimately repatriated back to NZD. Exposures to
currency exchange rates arise from the Group’s overseas sales, which are primarily denominated in US dollars
(USD), Pounds Sterling (GBP), Australian dollars (AUD) and Euros (EUR).
To mitigate the Group’s exposure to foreign currency risk, non-NZD cash flows are monitored in accordance with
the Group’s risk management policies. The Group’s risk management policies include Treasury management
and Foreign exchange policies the implementation of which is reviewed regularly by the Board. The Group’s risk
management procedures distinguish short-term foreign currency cash flows (due within 6 months) from longer-
term cash flows (due after 6 months). Where the amounts to be paid and received in a specific currency are
expected to largely offset one another, no further hedging activity is undertaken. The Foreign exchange policy
does allow for the use of hedging activity, however to date these instruments have not been utilised.
NOTES TO THE FINANCIAL STATEMENTS CONTINUED
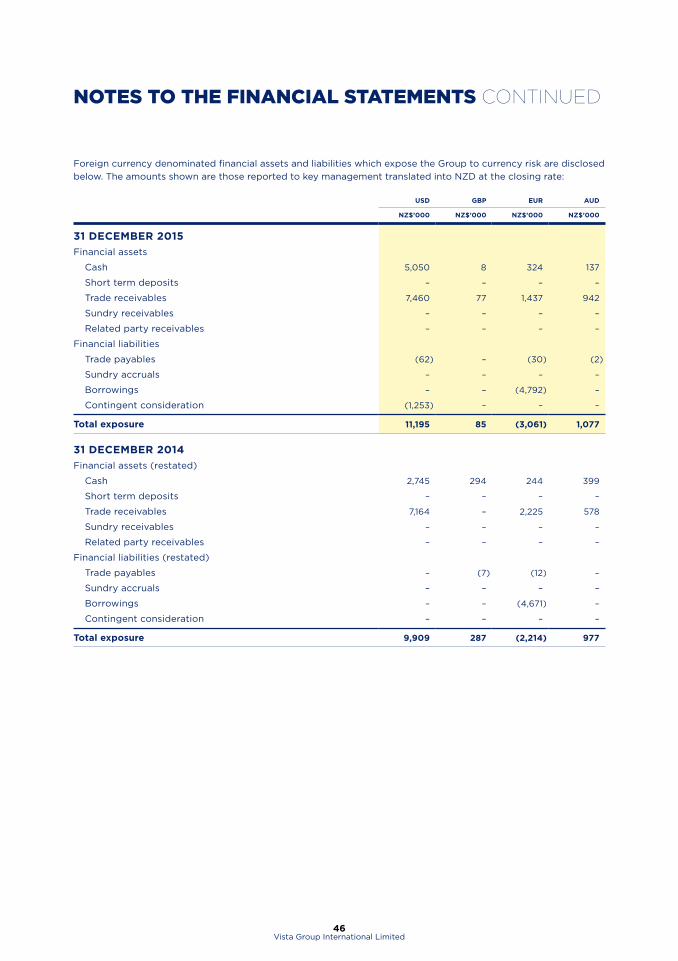
46Vista Group International Limited
NOTES TO THE FINANCIAL STATEMENTS CONTINUED
Foreign currency denominated financial assets and liabilities which expose the Group to currency risk are disclosed
below. The amounts shown are those reported to key management translated into NZD at the closing rate:
USD GBP EUR AUD
NZ$’000 NZ$’000 NZ$’000 NZ$’000
31 DECEMBER 2015
Financial assets
Cash 5,050 8 324 137
Short term deposits – – – –
Trade receivables 7,460 77 1,437 942
Sundry receivables – – – –
Related party receivables – – – –
Financial liabilities
Trade payables (62) – (30) (2)
Sundry accruals – – – –
Borrowings – – (4,792) –
Contingent consideration (1,253) – – –
Total exposure 11,195 85 (3,061) 1,077
31 DECEMBER 2014
Financial assets (restated)
Cash 2,745 294 244 399
Short term deposits – – – –
Trade receivables 7,164 – 2,225 578
Sundry receivables – – – –
Related party receivables – – – –
Financial liabilities (restated)
Trade payables – (7) (12) –
Sundry accruals – – – –
Borrowings – – (4,671) –
Contingent consideration – – – –
Total exposure 9,909 287 (2,214) 977
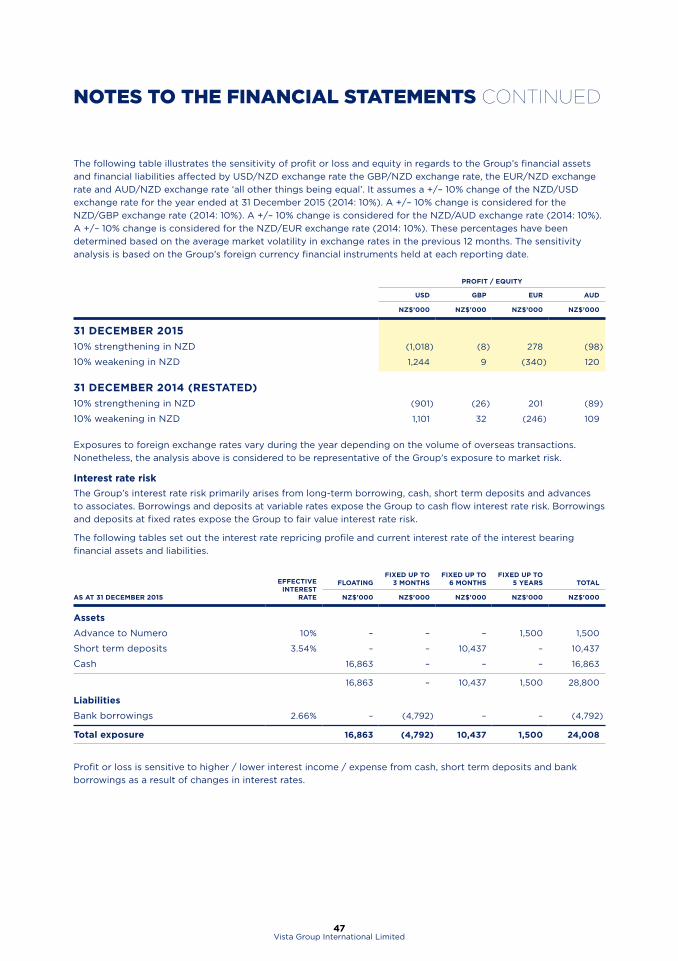
47Vista Group International Limited
The following table illustrates the sensitivity of profit or loss and equity in regards to the Group’s financial assets
and financial liabilities affected by USD/NZD exchange rate the GBP/NZD exchange rate, the EUR/NZD exchange
rate and AUD/NZD exchange rate ‘all other things being equal’. It assumes a +/– 10% change of the NZD/USD
exchange rate for the year ended at 31 December 2015 (2014: 10%). A +/– 10% change is considered for the
NZD/GBP exchange rate (2014: 10%). A +/– 10% change is considered for the NZD/AUD exchange rate (2014: 10%).
A +/– 10% change is considered for the NZD/EUR exchange rate (2014: 10%). These percentages have been
determined based on the average market volatility in exchange rates in the previous 12 months. The sensitivity
analysis is based on the Group’s foreign currency financial instruments held at each reporting date.
PROFIT / EQUITY
USD GBP EUR AUD
NZ$’000 NZ$’000 NZ$’000 NZ$’000
31 DECEMBER 2015
10% strengthening in NZD (1,018) (8) 278 (98)
10% weakening in NZD 1,244 9 (340) 120
31 DECEMBER 2014 (RESTATED)
10% strengthening in NZD (901) (26) 201 (89)
10% weakening in NZD 1,101 32 (246) 109
Exposures to foreign exchange rates vary during the year depending on the volume of overseas transactions.
Nonetheless, the analysis above is considered to be representative of the Group’s exposure to market risk.
Interest rate risk
The Group’s interest rate risk primarily arises from long-term borrowing, cash, short term deposits and advances
to associates. Borrowings and deposits at variable rates expose the Group to cash flow interest rate risk. Borrowings
and deposits at fixed rates expose the Group to fair value interest rate risk.
The following tables set out the interest rate repricing profile and current interest rate of the interest bearing
financial assets and liabilities.
AS AT 31 DECEMBER 2015
EFFECTIVE INTEREST
RATE
FLOATINGFIXED UP TO
3 MONTHSFIXED UP TO
6 MONTHSFIXED UP TO
5 YEARS TOTAL
NZ$'000 NZ$'000 NZ$'000 NZ$'000 NZ$'000
Assets
Advance to Numero 10% – – – 1,500 1,500
Short term deposits 3.54% – – 10,437 – 10,437
Cash 16,863 – – – 16,863
16,863 – 10,437 1,500 28,800
Liabilities
Bank borrowings 2.66% – (4,792) – – (4,792)
Total exposure 16,863 (4,792) 10,437 1,500 24,008
Profit or loss is sensitive to higher / lower interest income / expense from cash, short term deposits and bank
borrowings as a result of changes in interest rates.
NOTES TO THE FINANCIAL STATEMENTS CONTINUED
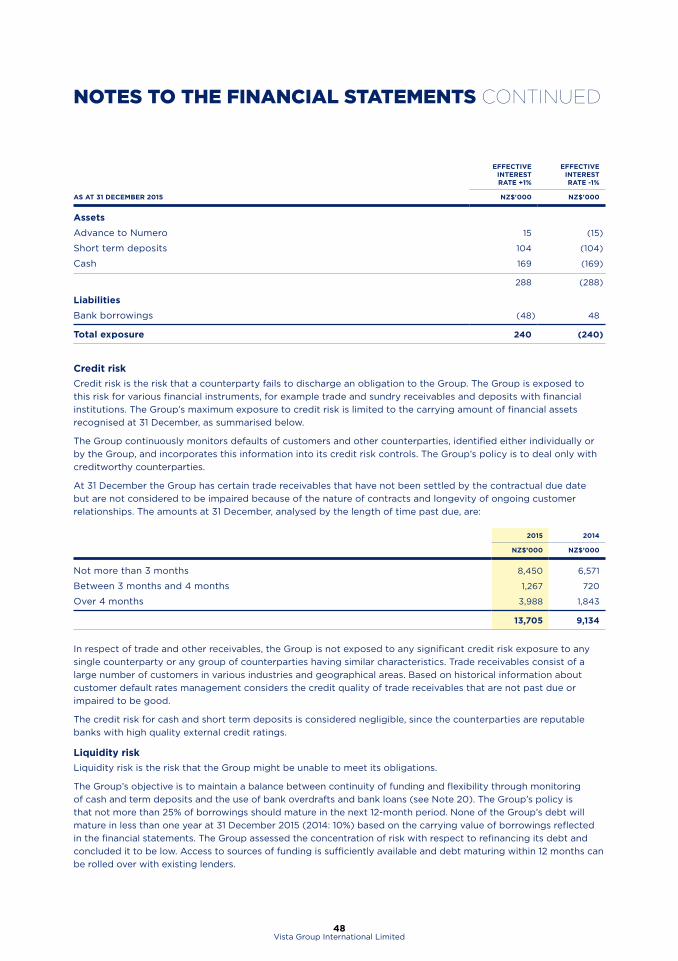
48Vista Group International Limited
NOTES TO THE FINANCIAL STATEMENTS CONTINUED
AS AT 31 DECEMBER 2015
EFFECTIVE INTEREST RATE +1%
EFFECTIVE INTEREST RATE -1%
NZ$'000 NZ$'000
Assets
Advance to Numero 15 (15)
Short term deposits 104 (104)
Cash 169 (169)
288 (288)
Liabilities
Bank borrowings (48) 48
Total exposure 240 (240)
Credit risk
Credit risk is the risk that a counterparty fails to discharge an obligation to the Group. The Group is exposed to
this risk for various financial instruments, for example trade and sundry receivables and deposits with financial
institutions. The Group’s maximum exposure to credit risk is limited to the carrying amount of financial assets
recognised at 31 December, as summarised below.
The Group continuously monitors defaults of customers and other counterparties, identified either individually or
by the Group, and incorporates this information into its credit risk controls. The Group’s policy is to deal only with
creditworthy counterparties.
At 31 December the Group has certain trade receivables that have not been settled by the contractual due date
but are not considered to be impaired because of the nature of contracts and longevity of ongoing customer
relationships. The amounts at 31 December, analysed by the length of time past due, are:
2015 2014
NZ$’000 NZ$’000
Not more than 3 months 8,450 6,571
Between 3 months and 4 months 1,267 720
Over 4 months 3,988 1,843
13,705 9,134
In respect of trade and other receivables, the Group is not exposed to any significant credit risk exposure to any
single counterparty or any group of counterparties having similar characteristics. Trade receivables consist of a
large number of customers in various industries and geographical areas. Based on historical information about
customer default rates management considers the credit quality of trade receivables that are not past due or
impaired to be good.
The credit risk for cash and short term deposits is considered negligible, since the counterparties are reputable
banks with high quality external credit ratings.
Liquidity risk
Liquidity risk is the risk that the Group might be unable to meet its obligations.
The Group’s objective is to maintain a balance between continuity of funding and flexibility through monitoring
of cash and term deposits and the use of bank overdrafts and bank loans (see Note 20). The Group’s policy is
that not more than 25% of borrowings should mature in the next 12-month period. None of the Group’s debt will
mature in less than one year at 31 December 2015 (2014: 10%) based on the carrying value of borrowings reflected
in the financial statements. The Group assessed the concentration of risk with respect to refinancing its debt and
concluded it to be low. Access to sources of funding is sufficiently available and debt maturing within 12 months can
be rolled over with existing lenders.
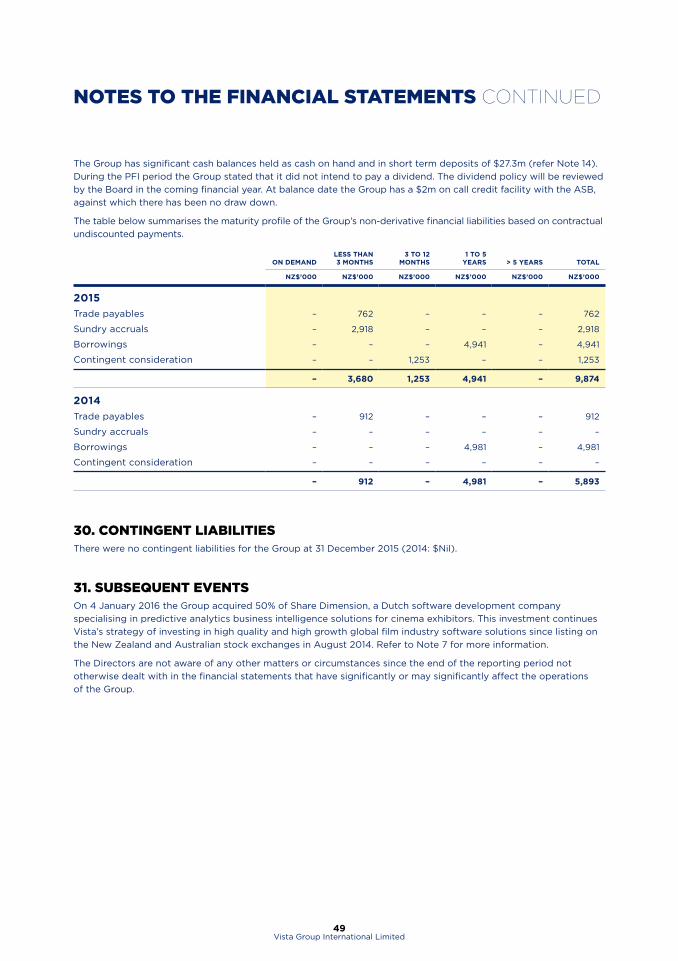
49Vista Group International Limited
The Group has significant cash balances held as cash on hand and in short term deposits of $27.3m (refer Note 14).
During the PFI period the Group stated that it did not intend to pay a dividend. The dividend policy will be reviewed
by the Board in the coming financial year. At balance date the Group has a $2m on call credit facility with the ASB,
against which there has been no draw down.
The table below summarises the maturity profile of the Group’s non-derivative financial liabilities based on contractual
undiscounted payments.
ON DEMANDLESS THAN 3 MONTHS
3 TO 12 MONTHS
1 TO 5 YEARS > 5 YEARS TOTAL
NZ$’000 NZ$’000 NZ$’000 NZ$’000 NZ$’000 NZ$’000
2015
Trade payables – 762 – – – 762
Sundry accruals – 2,918 – – – 2,918
Borrowings – – – 4,941 – 4,941
Contingent consideration – – 1,253 – – 1,253
– 3,680 1,253 4,941 – 9,874
2014
Trade payables – 912 – – – 912
Sundry accruals – – – – – –
Borrowings – – – 4,981 – 4,981
Contingent consideration – – – – – –
– 912 – 4,981 – 5,893
30. CONTINGENT LIABILITIESThere were no contingent liabilities for the Group at 31 December 2015 (2014: $Nil).
31. SUBSEQUENT EVENTSOn 4 January 2016 the Group acquired 50% of Share Dimension, a Dutch software development company
specialising in predictive analytics business intelligence solutions for cinema exhibitors. This investment continues
Vista’s strategy of investing in high quality and high growth global film industry software solutions since listing on
the New Zealand and Australian stock exchanges in August 2014. Refer to Note 7 for more information.
The Directors are not aware of any other matters or circumstances since the end of the reporting period not
otherwise dealt with in the financial statements that have significantly or may significantly affect the operations
of the Group.
NOTES TO THE FINANCIAL STATEMENTS CONTINUED

VISTA GROUP INTERNATIONAL LIMITEDLevel 3, 60 Khyber Pass Road
Newton, Auckland 1023
Phone: +64 9 984 4570 Fax: +64 9 379 0685
Email: [email protected] Website: www.vistagroup.co.nz