Embed Size (px)
Citation preview

1
Visual Acuity
Excerpts from a lecture by:
Harold E. Bedell
Physiological Optics & Vision Science
Visual acuity
Visual acuity is the smallest spatial detail that can be detected or identified.
Types of acuity tasks:
– Detection acuity
– Resolution acuity
– Localization acuity
– Identification (letter or optotype) acuity

2
Detection acuity: bright targets
The retinal image size of a bright point is constrained by the point spread function (PSF) of the eye.
Optimal width of PSF ≈ 1 arc min.
Detection acuity: bright targets
Detection “acuity” for a bright point or line does not depend on its angular size, but on the number of photons in the target’s image.
A bright target on a dark background (e.g., a star at night) is detected when its energy exceeds the retinal light threshold, despite an angular size < 1 sec arc.

3
Detection acuity: dark targets
Smallest detectable line ≈ 0.5 ‐ 1 arc sec. Smallest detectable dot ≈ 15 arc sec.
Threshold size depends on retinal contrast threshold ≈ 1 ‐ 2% after image spread due to retinal PSF or LSF.
Resolution acuity: two lines
Two lines can be resolved when their images fall on non‐adjacent cones with a relatively unstimulated cone in between.
Cone separation (or “sampling”) places a potential limit on acuity.
4
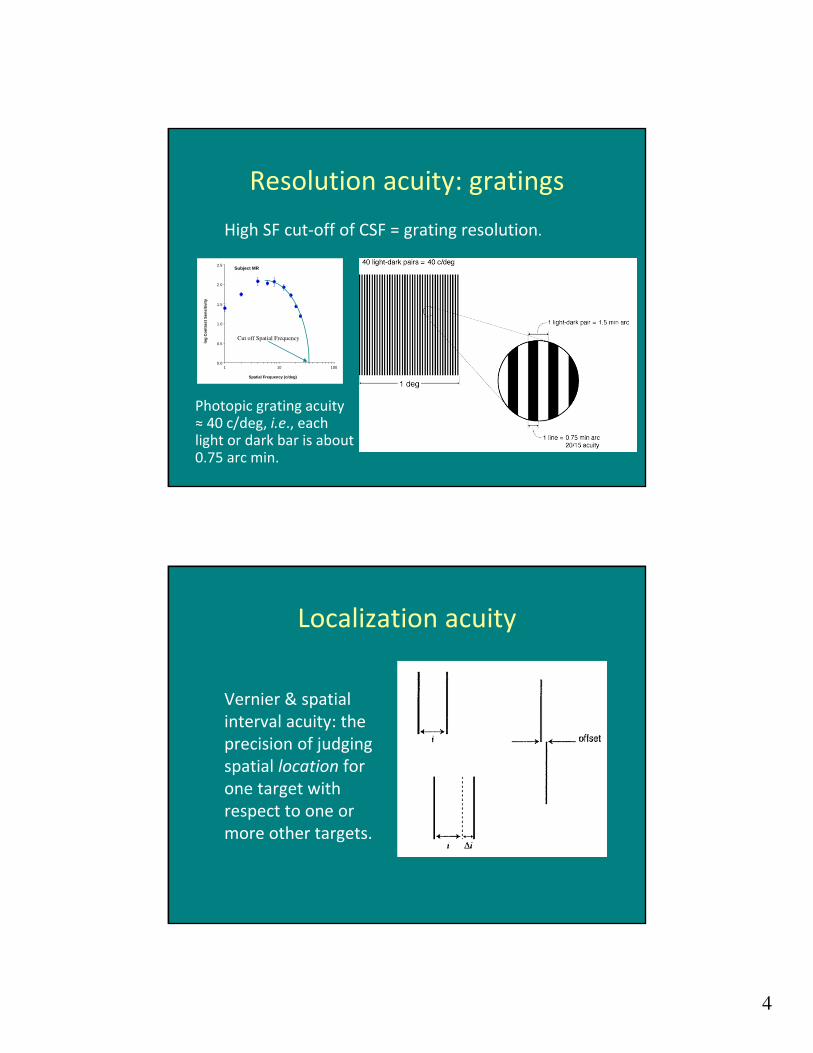
Resolution acuity: gratings
High SF cut‐off of CSF = grating resolution.
Photopic grating acuity ≈ 40 c/deg, i.e., each light or dark bar is about 0.75 arc min.
1001010.0
0.5
1.0
1.5
2.0
2.5Subject MR
Spatial Frequency (c/deg)
log
Co
ntr
as
t S
en
sit
ivit
y
Cut off Spatial Frequency
Localization acuity
Vernier & spatial interval acuity: the precision of judging spatial location for one target with respect to one or more other targets.
5
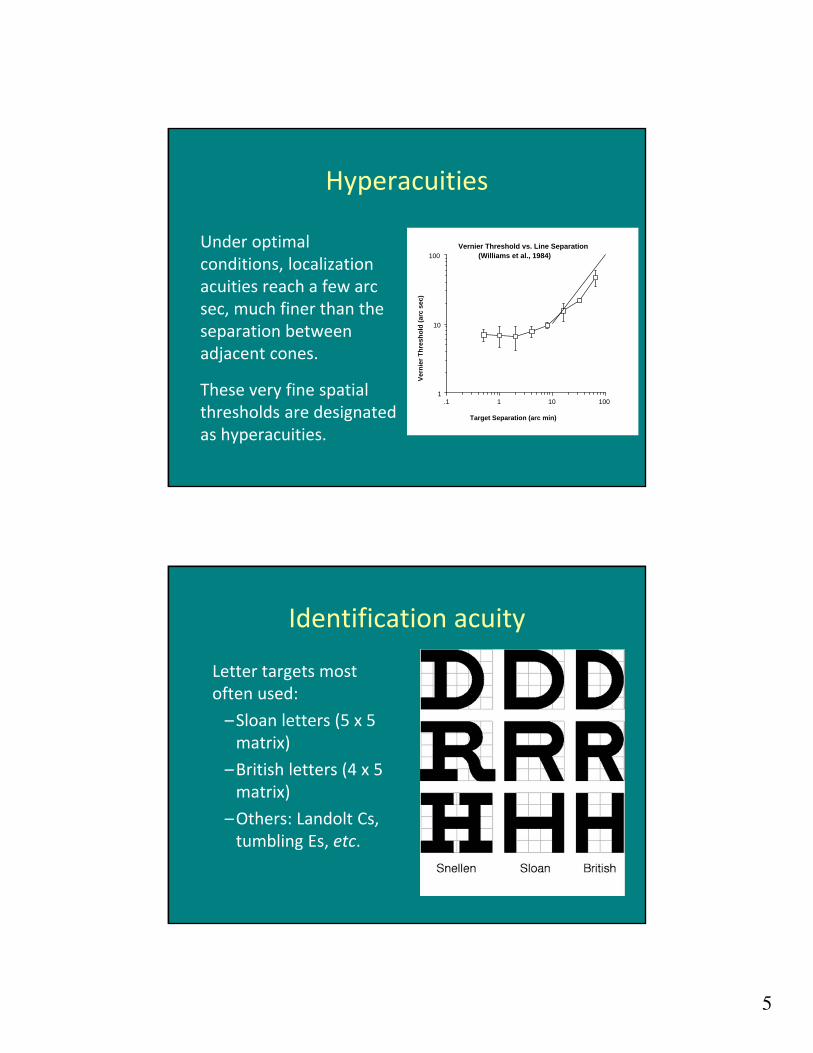
Hyperacuities
Under optimal conditions, localization acuities reach a few arc sec, much finer than the separation between adjacent cones.
These very fine spatial thresholds are designated as hyperacuities.
100101.11
10
100
Vernier Threshold vs. Line Separation (Williams et al., 1984)
Target Separation (arc min)V
ern
ier
Th
resh
old
(ar
c se
c)
Identification acuity
Letter targets most often used:
–Sloan letters (5 x 5 matrix)
–British letters (4 x 5 matrix)
–Others: Landolt Cs, tumbling Es, etc.
6
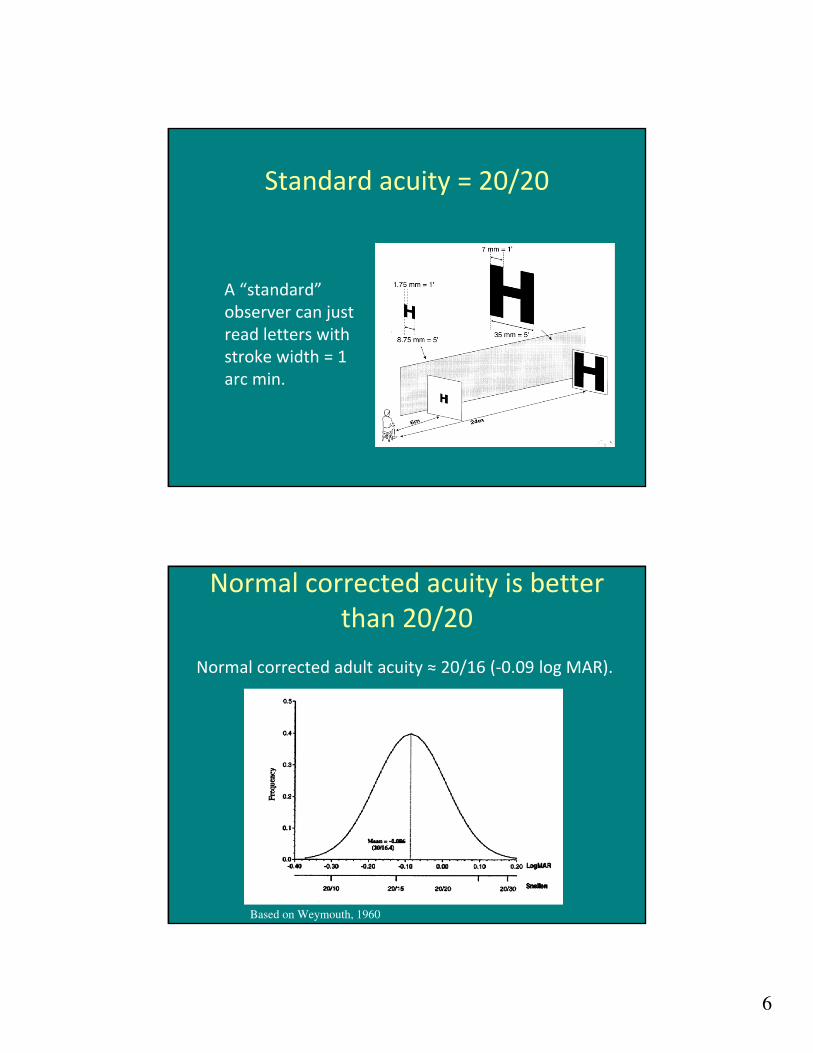
Standard acuity = 20/20
A “standard” observer can just read letters with stroke width = 1 arc min.
Normal corrected acuity is better than 20/20
Normal corrected adult acuity ≈ 20/16 (‐0.09 log MAR).
Based on Weymouth, 1960

7
Comparisons among acuity tasks
Acuity Task Typical Stimulus Optimal Threshold
Detection Bright line or spot ca. 0 sec arc
Single dark line 0.5 ‐ 1.0 sec arc
Single dark spot 15 ‐ 20 sec arc
Resolution Two bright lines/spots 40 ‐ 60 sec arc
Two dark lines/spots 30 ‐ 40 sec arc
Grating 30 ‐ 40 sec arc
Localization Spatial interval 2 ‐ 4 sec arc
Vernier lines 3 ‐ 6 sec arc
Identification Letters or numerals 30 ‐ 40 sec arc
CSF and Acuity
Spatial Frequency (c/deg)
high SF cut-off(hi-C acuity)
low CS = high contrast
high CS = low contrast
high SF cut-off(lo-C acuity)

8
Acuity and contrast
Acuity improves gradually with contrast, as predicted by the high‐SF limb of the CSF.
Consequently, small changes in chart contrast should not affect clinical acuity measurements.
SF and Acuity
2.5 cycles
• If each spatial detail subtends an angle of 1 arc min, the whole letter subtends 5 arc min.
• There are 60 arc min in a degree.Therefore 2.5 cycles / 5 arc min = 30 cpd
• To convert to Snellen: 600/cpd = Snellen DenominatorThus 30 cpd letter = 20/20

9
More Examples
More Examples
10
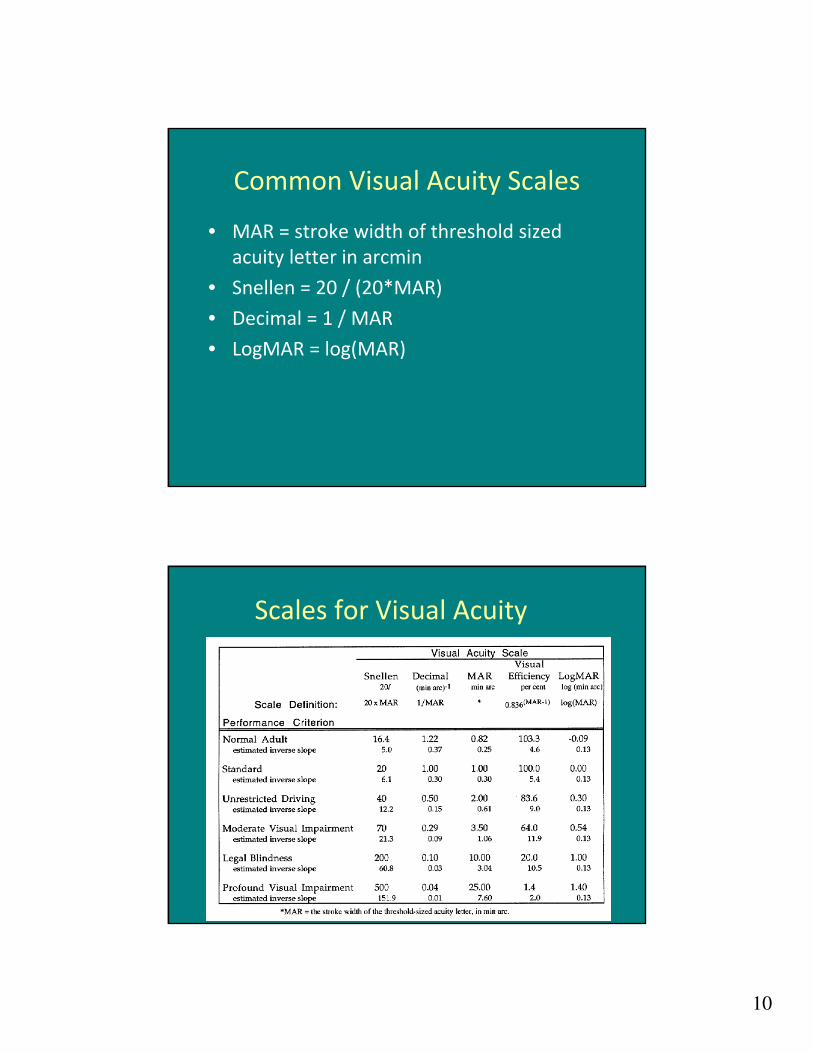
Common Visual Acuity Scales
• MAR = stroke width of threshold sized acuity letter in arcmin
• Snellen = 20 / (20*MAR)
• Decimal = 1 / MAR
• LogMAR = log(MAR)
Scales for Visual Acuity
11
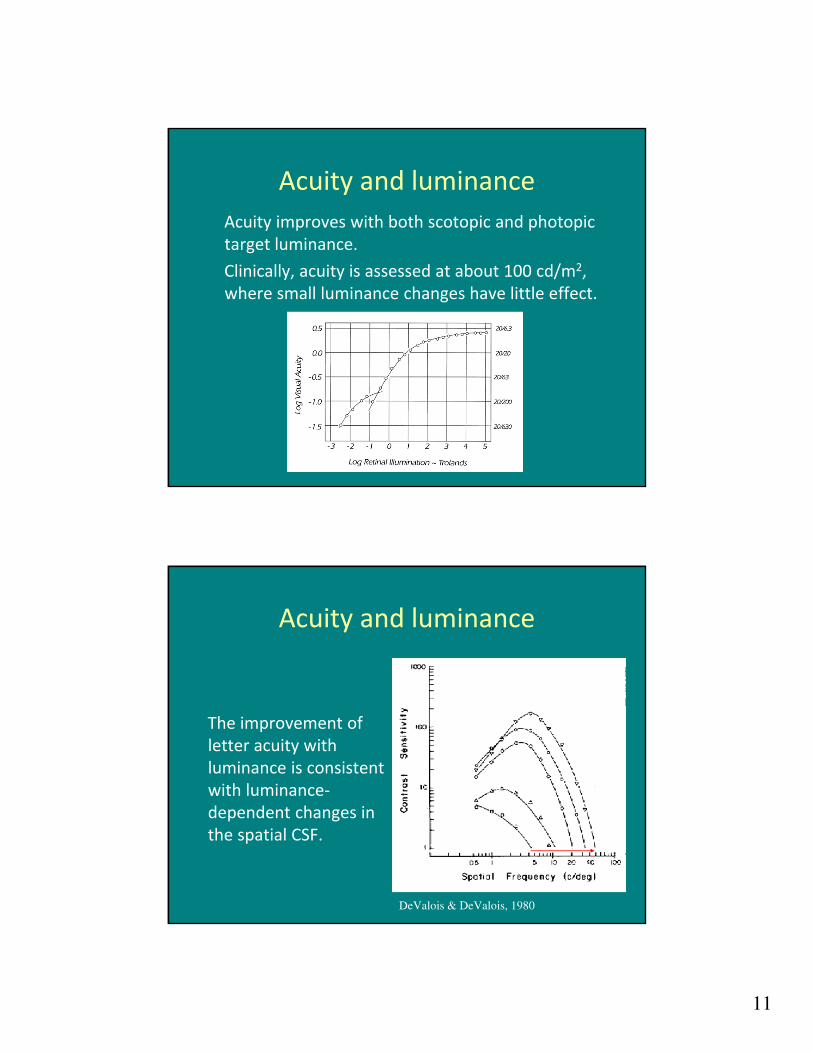
Acuity and luminance
Acuity improves with both scotopic and photopic target luminance.
Clinically, acuity is assessed at about 100 cd/m2, where small luminance changes have little effect.
Acuity and luminance
The improvement of letter acuity with luminance is consistent with luminance‐dependent changes in the spatial CSF.
DeValois & DeValois, 1980
12
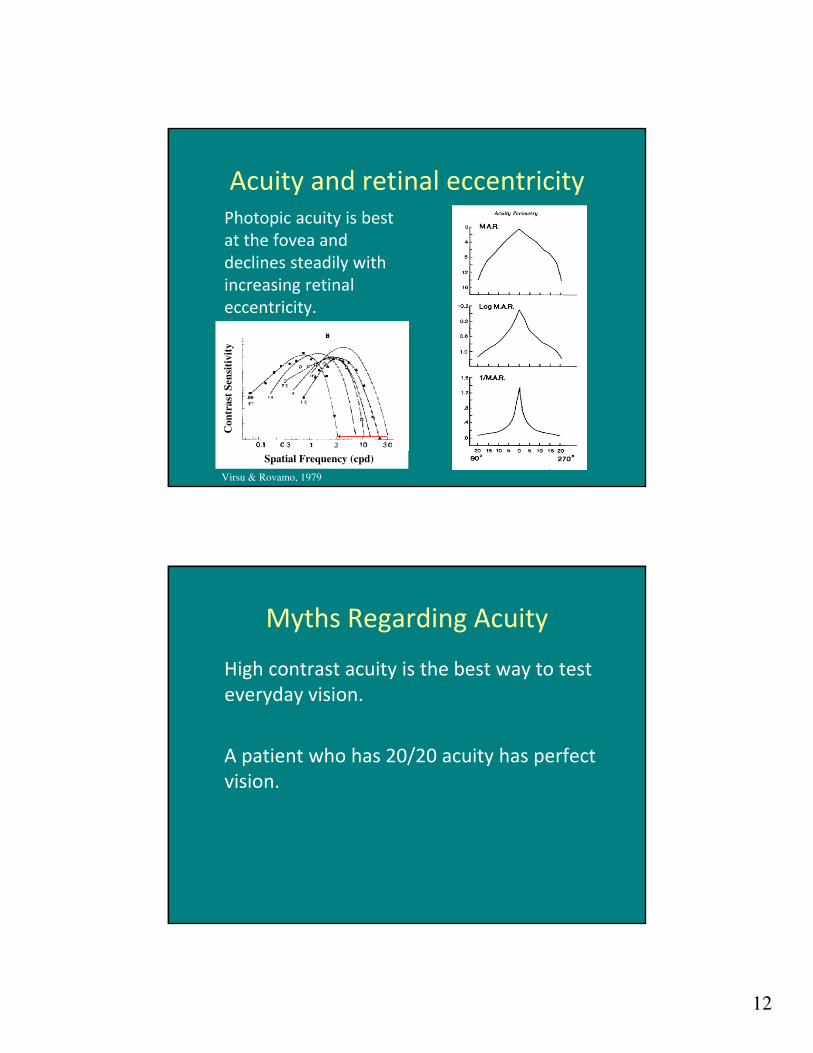
Acuity and retinal eccentricityPhotopic acuity is best at the fovea and declines steadily with increasing retinal eccentricity.
Virsu & Rovamo, 1979
Spatial Frequency (cpd)
Con
tras
t Se
nsit
ivit
y
Myths Regarding Acuity
High contrast acuity is the best way to test everyday vision.
A patient who has 20/20 acuity has perfect vision.