Embed Size (px)
Citation preview
International Symposium on Visual Analytics Science and Technology (2010)J. Kohlhammer and D. Keim (Editors)
Visual Analytics in Software Maintenance: Challenges and
Opportunities
A. Telea1 and and O. Ersoy1 and L. Voinea2
1Institute Johann Bernoulli, University of Groningen, the Netherlands2SolidSource BV, Eindhoven, the Netherlands
Abstract
Visual analytics (VA) is an emerging science at the crossroads of data and information visualization, graphics, data min-
ing, and knowledge representation, with many successful applications in engineering, business and finance, security, geo-
sciences, and e-governance and health. Tools using visualization, data mining, and data analysis are also prominently
present in a different field: software maintenance. However, an integrated VA is relatively new for this field. In this paper,
we discuss the specific challenges and particularities of applying VA in software engineering, highlight the added value of
a VA approach, as distilled by us from several large-scale software engineering industrial projects.
1. Introduction
The modern IT industry is confronted with large, complex soft-ware and increased pressure on delivery time and product qual-ity. Studies over 15 years estimate that 80% of the software costsare maintenance, of which 40% goes into program understand-
ing [Sta84, Cor99].
Visual analytics (VA) integrates techniques from graphics, vi-sualization, interaction, data analysis, and data mining to supportreasoning and sensemaking for complex problem solving in engi-neering, finances, security, and geosciences [WT04,TC05]. Thesefields share many similarities with software maintenance in termsof data (databases with millions of records, highly structured text,and graphs), tasks (making sense of data by hypothesis creation,refinement, and validation), and tools (combined analysis and vi-sualization).
However, software visualization (SV) is still only marginallyaccepted in the industry. Explanations include the limited matu-rity, learning ease, and integration of SV tools [Kos03]. Promi-nent researchers have voiced concerns over this situation [Rei05,CTM03], which echoes similar concerns in the field of data visu-alization [Lor04].
In this paper, we discuss the reasons for limited penetration ofSV tools in the IT industry. We argue that similarities in data,tasks, and tools between VA and SV advocate for a VA approachto software understanding in maintenance. We support this claimby analyzing several industrial maintenance projects involvingSV tools we took part in, and use this insight to better under-stand the acceptance challenges of SV. In contrast to other studieson SV tool acceptance, we use an approach based on value and
waste as perceived by stakeholders, inspired from the lean devel-opment philosophy [PP06].
This paper is structured as follows. Section 2 provides a back-ground on software analysis and visualization. Section 3 intro-duces our value-based model for SV for three user groups: devel-opers, management, and consultants. Section 4 discusses severalindustrial projects in which SV was used, and discusses relationsbetween VA and software analysis and visualization. Section 5discusses observed challenges to SV adoption and indicates pos-sible ways forward. Section 6 concludes the paper.
2. Background
Two types of techniques are present in software understand-ing for maintenance. Analysis tools extract facts from software,e.g. syntax trees, dependency graphs, and execution informa-tion [BF03, TV08a, LHM03, BPM04]. Facts can be refined intoquality metrics, e.g. code readability, complexity, cohesion, andcoupling [LM06], or higher-level artifacts like design patterns orcode smells [Kos03, TWSM94]. Visualization tools present thesefacts using techniques such as data-annotated graphs [TWSM94,Lan04,LKG07,TMR02], table lenses and treemaps [TV08a], andmetric-annotated code [ESS92]. An overview of SV is givenby [Die07].
Most studies on the challenges and difficulties of SV adoptionfor program understanding in the industry focus on specific SVtools or techniques [DD06, HDS02, ED06]. In this paper, we areinterested in understanding the adoption challenges of SV as an
integral technique, at equal level with other technologies such assoftware analysis or testing.
c© The Eurographics Association 2010.

A. Telea and O. Ersoy and L. Voinea / Visual Software Analytics
3. Value Model
In the past seven years, we participated in over 20 industryprojects involving SV and analysis tools for software understand-ing in maintenance in projects of tens of thousands up to 17 mil-lion lines of code; teams of 10 up to 600 developers; differentprogramming languages, platforms, and architectures; and devel-opment methods from agile and extreme programming to strictlystandardized workflows. In nearly all cases, we observed moder-ate to strong skepticism on SV. Technical issues such as tool scal-ability, limited visual clutter, details on demand, customizabilitywere not the main blockers [SOT08, SOT09]. To quote a seniorproject manager, the central issue was "what does a SV tool bringas measurable added value to me?" Precisely the same issue wasrecently raised for the adoption of software static analysis by amajor tool vendor [BBC∗10].
We try to answer this question by a different approach fromtypical tool evaluations. We formulate SV adoption as a lean de-
velopment problem [PP06]: To be accepted, SV must ultimatelyyield value and/or diminish waste as perceived by its users.
Obviously, different user groups have different definitions ofvalue. In our work, we have observed three such groups:
1. Technical users focus mainly on creating a software product,and include developers, designers, testers, and architects;
2. Managers focus on the integral execution of projects over longperiods of time;
3. Consultants work over relatively short periods of time and as-sist in integral strategic decision making.
We argue that a VA approach is highly beneficial to increas-ing value and decreasing waste for all these user groups, but indifferent ways. This point is detailed next.
4. Case Studies
To refine our understanding of the challenges and opportunities ofVA in software maintenance, we have gathered insight from threetypes of studies over a period of several years. Each study type fo-cuses on a user type (Sec. 3), tries to elicit perceived value driversand translates these to tool and process requirements. These stud-ies are presented next.
4.1. User group 1: Technical stakeholders
SV tools in corrective maintenance: Four different SV toolswere considered: CodePro Analytix [Ins09], Ispace [I. 09],SonarJ [Hel09], and SolidSX [Sol10] (Fig. 1). These tools in-tegrate with IDEs to support corrective maintenance (debug-ging) by hierarchy-and-dependency visualizations linked withcode views. The tools were pre-selected to meet features deemeddesirable by developers, as identified by earlier studies, e.g. scal-ability, ease of use, IDE integration, quick learning, and robust-ness [SOT08,SOT09], and also to have a similar look and feel. 29professional developers used the tools to debug a known issue ina Java Mobile application of 10000 lines.
From the collected quantitative and qualitative feed-back [SOT10], as well as silent user observation, we gathered thefollowing points:
• all users (except one) ranked the degree of IDE integrationas the most important tool effectiveness aspect. Tools withstronger integration, e.g. easy search/selection-based naviga-tion across the dependency and code views, scored better;
• all users required ’what-if’ scenario support, e.g. have the toolsuggest code areas affected by a certain modification;
• all users required multiple views to correlate code text, struc-ture, and execution;
In particular, a seamless integration between analysis (e.g. de-bugging and static source code analysis) and visualization wasfound absolutely crucial. Similar statements are made by otherresearchers in SV, e.g. [TH02,Kos03,Sto98,CTM03,SM05]. Yet,most existing SV tools lack such integration, which we believe tobe a major blocker for their wider adoption.
Program structure comprehension: Ten developers used twoSV tools (Tulip [Aub09] and SolidSX [Sol10]) for programstructure-and-dependency visualization to answer modularity-related questions on several large C/C++ systems (bison, MozillaFirefox, and the C++ parser from [HERT09]). Both SV toolsscore strongly on scalability, speed, robustness, ease of use, inter-active navigation, and query facilities. Data extraction was doneby a separate static analysis tool [HERT09]. Although the tasksand data were different, user feedback matched insight from theprevious study. Multiple views and easy cross-view navigationwere highly appreciated. The lack of integration between thestatic analysis and visualization was named as the most importantdrawback, which seriously reduced the perceived added value ofthe visualization.
4.2. User group 2: Project leading and management
Build process optimization: A major hardware company has anembedded C system of over 17 million lines. In maintenance,even small changes to some headers can cause huge build (com-pilation) times. The system is developed by 600 programmersworldwide, so build bottlenecks significantly delay testing and ul-timately product releases. The project managers needed to answerthe following questions [TV08b]:
• what is the exact model of the build impact, i.e. how can onepredict the build cost (time) given a certain code change? Thisis a typical ’what if’ question (what if I modify this file?)
• how is the build cost spread over the entire system? Which arethe main build bottlenecks, now and in the future?
We approached these questions following a VA approach. First,we measured actual build time upon changing each header. An-alyzing this data showed that 80% of the headers have smallimpacts, so build bottlenecks indeed exist (Fig. 2). Next, wedesigned a build cost and build impact model. We first hy-pothesized that a header’s build impact equals the number ofsources which use it directly or indirectly, and computed this im-pact using a file dependency graph extracted with static analysistools [Spi09,TV08a]. Comparison with actual build times showedthat this model is close, but not exact, to measured build times(see outliers in Fig. 3. We next refined our hypothesis: a header’simpact is the sum of the build costs of all sources using it directlyor not. This compound model matched measured costs includingoutliers. Further measurements revealed that the build time of a
c© The Eurographics Association 2010.
A. Telea and O. Ersoy and L. Voinea / Visual Software Analytics
b) Ispacea) CodePro Analytix c) SonarJ d) SolidSX
Figure 1: Visual tools for corrective maintenance (Sec. 4.1). From left to right: CodePro Analytix [Ins09], Ispace [I. 09],
SonarJ [Hel09], and SolidSX [Sol10]
Figure 2: Build impact: actual measurements (top), simple model
(middle), compound model (bottom). Headers (x axis entries) are
sorted on increasing build impact in the simple model. The y axis
shows build time
source is dominated by pure file access, and not file sizes, whichsupports our compound model.
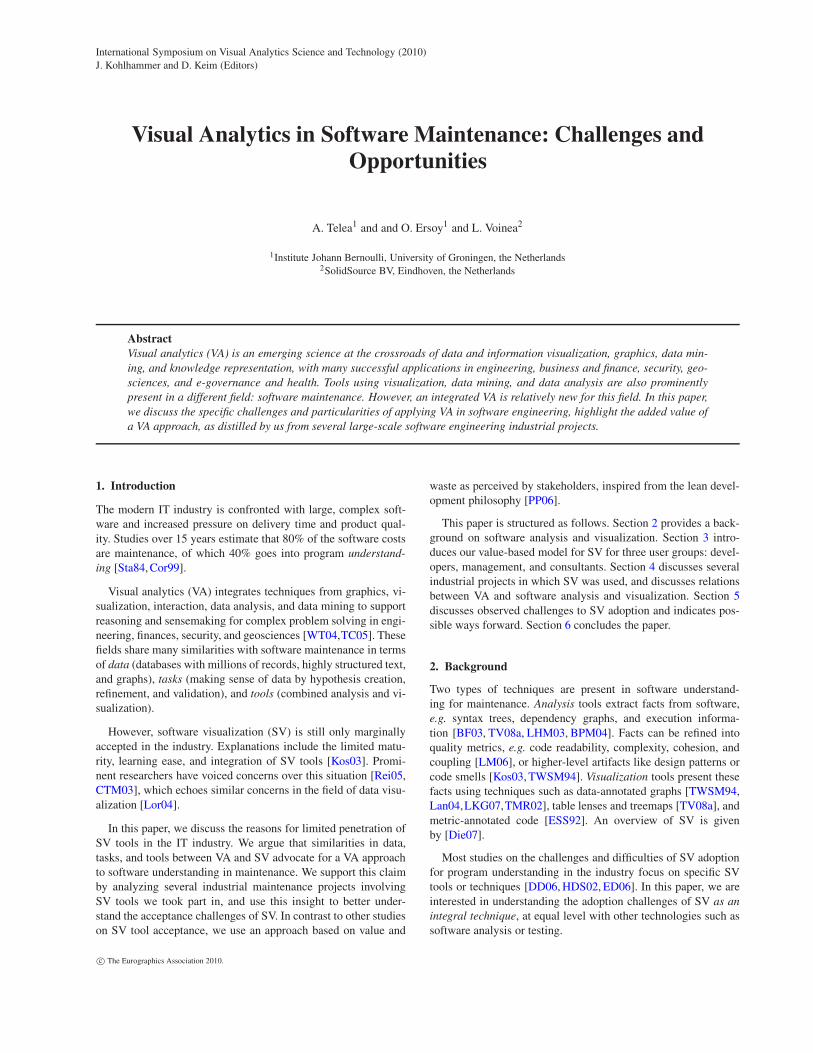
Figure 3: Build analysis visual tool (Sec. 4.2)
To answer the posed questions, we designed an interactivetool [TV08b] that integrates our build cost model with severalvisualizations (Fig. 3). The archictecture view shows the project
hierarchy with subsystems colored by total build time. For a se-lected subsystem, the cost/impact view uses a table lens to showmetrics for all files in that subsystem: the Þle name (A), impact(B), simple cost (C), and compound cost (D). Sorting this tablequickly helps project managers to quickly locate high impact filesto e.g. plan changes and selectively grant change access to suchfiles. Sorting the table on build impact times change frequency(E) further allows finding if high impact files are potential buildbottlenecks in the future. System headers, for instance, have veryhigh impact, but zero change frequency, so are thus eliminatedfrom true build bottlenecks.
4.3. User group 3: Consultants
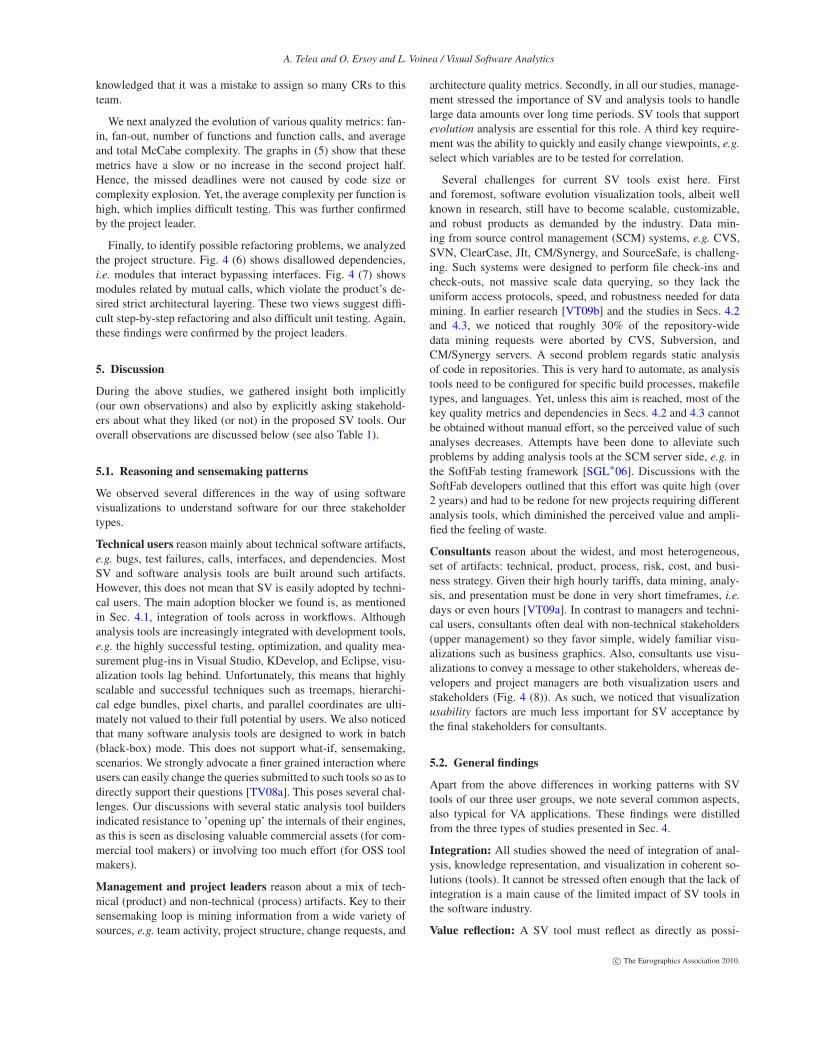
Product and process assessment: A major automotive companydeveloped an embedded software stack of 3.5 million lines ofcode in 15 releases over 6 years with three developer teams inWestern Europe, Eastern Europe, and Asia. Towards the end, itwas seen that the project could not be finished on schedule andthat new features were hard to introduce. The management wasnot sure what went wrong. The main questions were: was the fail-ure caused by bad architecture, coding, or management; and howto follow up - start from scratch or redesign the existing code. Anexternal consultant team performed a post-mortem analysis. Thisteam had only one week to deliver its findings and only the coderepository as information source [VT09a].
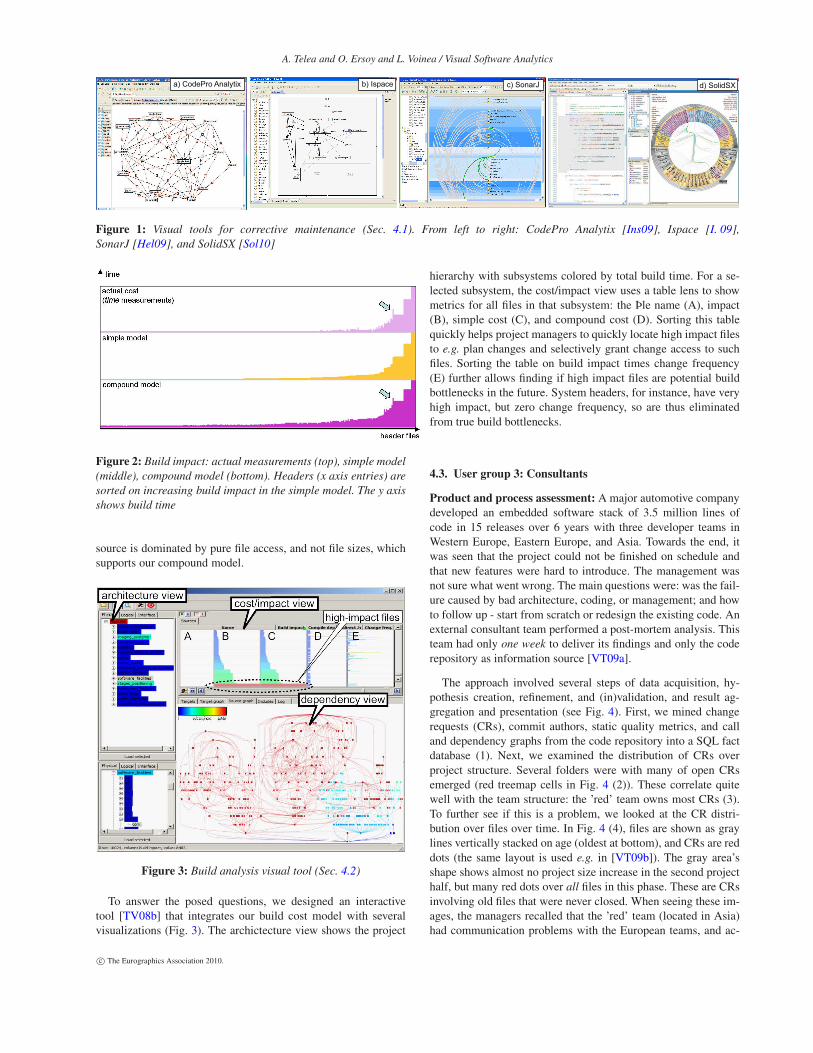
The approach involved several steps of data acquisition, hy-pothesis creation, refinement, and (in)validation, and result ag-gregation and presentation (see Fig. 4). First, we mined changerequests (CRs), commit authors, static quality metrics, and calland dependency graphs from the code repository into a SQL factdatabase (1). Next, we examined the distribution of CRs overproject structure. Several folders were with many of open CRsemerged (red treemap cells in Fig. 4 (2)). These correlate quitewell with the team structure: the ’red’ team owns most CRs (3).To further see if this is a problem, we looked at the CR distri-bution over files over time. In Fig. 4 (4), files are shown as graylines vertically stacked on age (oldest at bottom), and CRs are reddots (the same layout is used e.g. in [VT09b]). The gray area’sshape shows almost no project size increase in the second projecthalf, but many red dots over all files in this phase. These are CRsinvolving old files that were never closed. When seeing these im-ages, the managers recalled that the ’red’ team (located in Asia)had communication problems with the European teams, and ac-
c© The Eurographics Association 2010.
A. Telea and O. Ersoy and L. Voinea / Visual Software Analytics
knowledged that it was a mistake to assign so many CRs to thisteam.
We next analyzed the evolution of various quality metrics: fan-in, fan-out, number of functions and function calls, and averageand total McCabe complexity. The graphs in (5) show that thesemetrics have a slow or no increase in the second project half.Hence, the missed deadlines were not caused by code size orcomplexity explosion. Yet, the average complexity per function ishigh, which implies difficult testing. This was further confirmedby the project leader.
Finally, to identify possible refactoring problems, we analyzedthe project structure. Fig. 4 (6) shows disallowed dependencies,i.e. modules that interact bypassing interfaces. Fig. 4 (7) showsmodules related by mutual calls, which violate the product’s de-sired strict architectural layering. These two views suggest diffi-cult step-by-step refactoring and also difficult unit testing. Again,these findings were confirmed by the project leaders.
5. Discussion
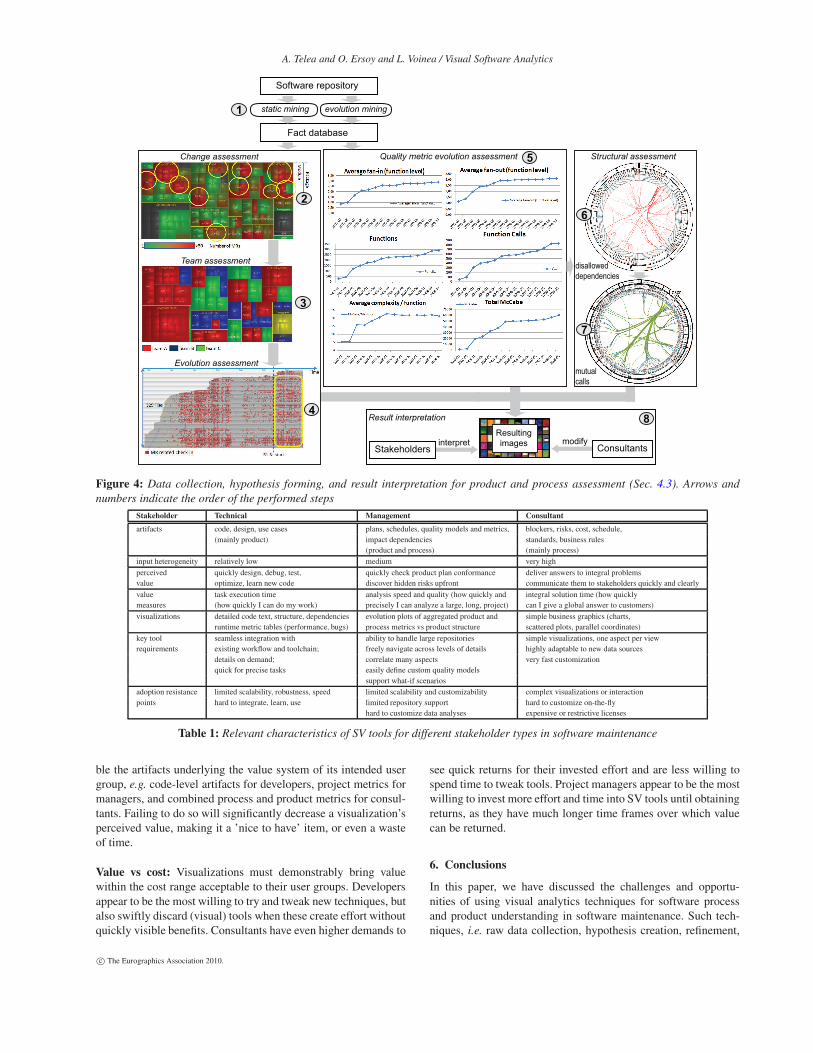
During the above studies, we gathered insight both implicitly(our own observations) and also by explicitly asking stakehold-ers about what they liked (or not) in the proposed SV tools. Ouroverall observations are discussed below (see also Table 1).
5.1. Reasoning and sensemaking patterns
We observed several differences in the way of using softwarevisualizations to understand software for our three stakeholdertypes.
Technical users reason mainly about technical software artifacts,e.g. bugs, test failures, calls, interfaces, and dependencies. MostSV and software analysis tools are built around such artifacts.However, this does not mean that SV is easily adopted by techni-cal users. The main adoption blocker we found is, as mentionedin Sec. 4.1, integration of tools across in workflows. Althoughanalysis tools are increasingly integrated with development tools,e.g. the highly successful testing, optimization, and quality mea-surement plug-ins in Visual Studio, KDevelop, and Eclipse, visu-alization tools lag behind. Unfortunately, this means that highlyscalable and successful techniques such as treemaps, hierarchi-cal edge bundles, pixel charts, and parallel coordinates are ulti-mately not valued to their full potential by users. We also noticedthat many software analysis tools are designed to work in batch(black-box) mode. This does not support what-if, sensemaking,scenarios. We strongly advocate a finer grained interaction whereusers can easily change the queries submitted to such tools so as todirectly support their questions [TV08a]. This poses several chal-lenges. Our discussions with several static analysis tool buildersindicated resistance to ’opening up’ the internals of their engines,as this is seen as disclosing valuable commercial assets (for com-mercial tool makers) or involving too much effort (for OSS toolmakers).
Management and project leaders reason about a mix of tech-nical (product) and non-technical (process) artifacts. Key to theirsensemaking loop is mining information from a wide variety ofsources, e.g. team activity, project structure, change requests, and
architecture quality metrics. Secondly, in all our studies, manage-ment stressed the importance of SV and analysis tools to handlelarge data amounts over long time periods. SV tools that supportevolution analysis are essential for this role. A third key require-ment was the ability to quickly and easily change viewpoints, e.g.
select which variables are to be tested for correlation.
Several challenges for current SV tools exist here. Firstand foremost, software evolution visualization tools, albeit wellknown in research, still have to become scalable, customizable,and robust products as demanded by the industry. Data min-ing from source control management (SCM) systems, e.g. CVS,SVN, ClearCase, JIt, CM/Synergy, and SourceSafe, is challeng-ing. Such systems were designed to perform file check-ins andcheck-outs, not massive scale data querying, so they lack theuniform access protocols, speed, and robustness needed for datamining. In earlier research [VT09b] and the studies in Secs. 4.2and 4.3, we noticed that roughly 30% of the repository-widedata mining requests were aborted by CVS, Subversion, andCM/Synergy servers. A second problem regards static analysisof code in repositories. This is very hard to automate, as analysistools need to be configured for specific build processes, makefiletypes, and languages. Yet, unless this aim is reached, most of thekey quality metrics and dependencies in Secs. 4.2 and 4.3 cannotbe obtained without manual effort, so the perceived value of suchanalyses decreases. Attempts have been done to alleviate suchproblems by adding analysis tools at the SCM server side, e.g. inthe SoftFab testing framework [SGL∗06]. Discussions with theSoftFab developers outlined that this effort was quite high (over2 years) and had to be redone for new projects requiring differentanalysis tools, which diminished the perceived value and ampli-fied the feeling of waste.
Consultants reason about the widest, and most heterogeneous,set of artifacts: technical, product, process, risk, cost, and busi-ness strategy. Given their high hourly tariffs, data mining, analy-sis, and presentation must be done in very short timeframes, i.e.
days or even hours [VT09a]. In contrast to managers and techni-cal users, consultants often deal with non-technical stakeholders(upper management) so they favor simple, widely familiar visu-alizations such as business graphics. Also, consultants use visu-alizations to convey a message to other stakeholders, whereas de-velopers and project managers are both visualization users andstakeholders (Fig. 4 (8)). As such, we noticed that visualizationusability factors are much less important for SV acceptance bythe final stakeholders for consultants.
5.2. General findings
Apart from the above differences in working patterns with SVtools of our three user groups, we note several common aspects,also typical for VA applications. These findings were distilledfrom the three types of studies presented in Sec. 4.
Integration: All studies showed the need of integration of anal-ysis, knowledge representation, and visualization in coherent so-lutions (tools). It cannot be stressed often enough that the lack ofintegration is a main cause of the limited impact of SV tools inthe software industry.
Value reflection: A SV tool must reflect as directly as possi-
c© The Eurographics Association 2010.
A. Telea and O. Ersoy and L. Voinea / Visual Software Analytics
Software repository
static mining evolution mining
Fact database
Stakeholders Consultantsinterpret modify
Resulting
images
Change assessment
Evolution assessment
Quality metric evolution assessment Structural assessment
disallowed
dependencies
mutual
calls
1
2
3
4
5
6
7
8
Team assessment
Result interpretation
Figure 4: Data collection, hypothesis forming, and result interpretation for product and process assessment (Sec. 4.3). Arrows and
numbers indicate the order of the performed steps
Stakeholder Technical Management Consultant
artifacts code, design, use cases plans, schedules, quality models and metrics, blockers, risks, cost, schedule,
(mainly product) impact dependencies standards, business rules
(product and process) (mainly process)
input heterogeneity relatively low medium very high
perceived quickly design, debug, test, quickly check product plan conformance deliver answers to integral problems
value optimize, learn new code discover hidden risks upfront communicate them to stakeholders quickly and clearly
value task execution time analysis speed and quality (how quickly and integral solution time (how quickly
measures (how quickly I can do my work) precisely I can analyze a large, long, project) can I give a global answer to customers)
visualizations detailed code text, structure, dependencies evolution plots of aggregated product and simple business graphics (charts,
runtime metric tables (performance, bugs) process metrics vs product structure scattered plots, parallel coordinates)
key tool seamless integration with ability to handle large repositories simple visualizations, one aspect per view
requirements existing workflow and toolchain; freely navigate across levels of details highly adaptable to new data sources
details on demand; correlate many aspects very fast customization
quick for precise tasks easily define custom quality models
support what-if scenarios
adoption resistance limited scalability, robustness, speed limited scalability and customizability complex visualizations or interaction
points hard to integrate, learn, use limited repository support hard to customize on-the-fly
hard to customize data analyses expensive or restrictive licenses
Table 1: Relevant characteristics of SV tools for different stakeholder types in software maintenance
ble the artifacts underlying the value system of its intended usergroup, e.g. code-level artifacts for developers, project metrics formanagers, and combined process and product metrics for consul-tants. Failing to do so will significantly decrease a visualization’sperceived value, making it a ’nice to have’ item, or even a wasteof time.
Value vs cost: Visualizations must demonstrably bring valuewithin the cost range acceptable to their user groups. Developersappear to be the most willing to try and tweak new techniques, butalso swiftly discard (visual) tools when these create effort withoutquickly visible benefits. Consultants have even higher demands to
see quick returns for their invested effort and are less willing tospend time to tweak tools. Project managers appear to be the mostwilling to invest more effort and time into SV tools until obtainingreturns, as they have much longer time frames over which valuecan be returned.
6. Conclusions
In this paper, we have discussed the challenges and opportu-nities of using visual analytics techniques for software processand product understanding in software maintenance. Such tech-niques, i.e. raw data collection, hypothesis creation, refinement,
c© The Eurographics Association 2010.

A. Telea and O. Ersoy and L. Voinea / Visual Software Analytics
and (in)validation, map perfectly to the problems and challengesof software understanding. We have presented several industrialcase studies in which we observed, or followed, a ’VA way ofworking’, as well as several challenges to current software vi-sualizations. Overall, these challenges mix technical issues withless-than-optimal matches of features with the value drivers oftheir target user groups. We do not claim universality for our ob-servations. Still, the size and variety of our sample set makes usto consider these findings as very relevant.
Wider adoption of VA principles in this industry has huge po-tentials. IT professionals are well aware of the high cost of pro-gram understanding [Cor99]. Yet, for increased adoption, soft-ware visualization designers should focus more on visualization-analysis integration and designing simple visual metaphors thatconvey precisely and directly the value drivers and way of work-ing of specific user groups. If such aspects are considered, we areconvinced that VA will make a significant impact to the softwareindustry.
References
[Aub09] AUBER D.: Tulip visualization system. tulip.labri.fr.
[BBC∗10] BESSEY A., BLOCK K., CHELF B., CHOU A., FULTON
B., HALLEM S., GROS C. H., CAMSKY A., MCPEAK S., ENGLER
D.: A few billion of lones of code later: Using static analysis to findbugs in the real world. Comm. of the ACM 53, 2 (2010), 66–75.
[BF03] BALANYI Z., FERENC R.: Mining design patterns from C++source code. In Proc. ICSM (2003), IEEE, pp. 305–314.
[BPM04] BAXTER I., PIDGEON C., MEHLICH M.: DMS: Programtransformations for practical scalable software evolution. In Proc.
ICSE (2004), IEEE, pp. 625–634.
[Cor99] CORBI T.: Program understanding: Challenge for the 1990s.IBM Systems Journal 28, 2 (1999), 294–306.
[CTM03] CHARTERS S., THOMAS N., MUNRO M.: The end of theline for Software Visualisation? In Proc. Vissoft (2003), pp. 27–35.
[DD06] DILUCCA G., DIPENTA M.: Experimental settings in programcomprehension: Challenges and open issues. In Proc. ICPC (2006),pp. 229–234.
[Die07] DIEHL S.: Software Visualization Visualizing the Structure,
Behaviour, and Evolution of Software. Springer, 2007.
[ED06] ELLIS G., DIX A.: An explorative analysis of user evaluationstudies in information visualisation. In Proc. AVI Workshop on Beyond
Time and Errors: Novel Evaluation methods for information visualiza-
tion (2006).
[ESS92] EICK S., STEFFEN S., SUMNER E.: Seesoft-a tool for vi-sualizing line oriented software statistics. IEEE TSE 18, 11 (1992),957–968.
[HDS02] HUNDHAUSEN C., DOUGLAS S., STASKO J.: A meta-studyof software visualization effectiveness. J. Vis. Lang. Comput. (2002),259–290.
[Hel09] HELLO2MORROW, INC.: SonarJ. www.hello2morrow.com.
[HERT09] HOOGENDORP H., ERSOY O., RENIERS D., TELEA A.:Extraction and visualization of call dependencies for large C/C++ codebases: A comparative study. In Proc. ACM Vissoft (2009), pp. 137–145.
[I. 09] I. ARACIC: Ispace. website, 2009. ispace.stribor.de.
[Ins09] INSTANTIATIONS, INC.: CodePro Analytix. website, 2009.www.instantiations.com.
[Kos03] KOSCHKE R.: Software visualization in software mainte-nance, reverse engineering, and re-engineering: a research survey. J. ofSoftware Maintenance and Evolution, 15 (2003), 87–109.
[Lan04] LANZA M.: CodeCrawler - polymetric views in action. InProc. ASE (2004), pp. 394–395.
[LHM03] LIN Y., HOLT R. C., MALTON A. J.: Completeness of a factextractor. In Proc. WCRE (2003), IEEE, pp. 196–204.
[LKG07] LIENHARDT A., KUHN A., GREEVY O.: Rapid prototyp-ing of visualizations using Mondrian. In Proc. IEEE Vissoft (2007),pp. 67–70.
[LM06] LANZA M., MARINESCU R.: Object-Oriented Metrics in
Practice. Springer, 2006.
[Lor04] LORENSEN B.: On the death of visualization: Can it survivewithout customers? In Proc. of the NIH/NSF Fall Workshop on Visual-ization Research Challenges (2004).
[PP06] POPPENDIECK M., POPPENDIECK T.: Lean Software Develop-
ment: An Agile Toolkit for Software Development Managers. Addison-Wesley, 2006.
[Rei05] REISS S.: The paradox of software visualization. In Proc Vis-soft (2005), pp. 59–63.
[SGL∗06] SPANJERS H., GRAAF B. T., LORMANS M., BENDAS D.,SOLINGEN R. V.: Tool support for distributed software engineeringexport. In Proc. ICGSE (2006), pp. 187–198.
[SM05] SCHAFER T., MENZINI M.: Towards more flexibility in soft-ware visualization tools. In Proc. Vissoft (2005), pp. 20–26.
[Sol10] SOLIDSOURCE: SolidSX. www.solidsourceit.com.
[SOT08] SENSALIRE M., OGAO P., TELEA A.: Classifying desirablefeatures of software visualization tools for corrective maintenance. InProc. ACM SOFTVIS (2008), pp. 87–90.
[SOT09] SENSALIRE M., OGAO P., TELEA A.: Evaluation of softwarevisualization tools: Lessons learned. In Proc. Vissoft (2009), pp. 156–164.
[SOT10] SENSALIRE M., OGAO P., TELEA A.: Analysis of desir-able features for software visualization tools in corrective maintenance,2010. www.cs.rug.nl/~alext/PAPERS/SeOgTe10.pdf.
[Spi09] SPINELLIS D.: Cscout, 2009. www.spinellis.gr.
[Sta84] STANDISH T. A.: An essay on software reuse. IEEE Trans. on
Software Engineering 10, 5 (1984), 494–497.
[Sto98] STOREY M. A.: A Cognitive Framework for Describing and
Evaluating Software Exploration Tools. PhD thesis, Simon Fraser Uni-versity, Canada, 1998.
[TC05] THOMAS J. J., COOK K. A.: Illuminating the Path: The Re-search and Development Agenda for Visual Analytics. National Visu-alization and Analytics Center, 2005.
[TH02] TILLEY S., HUANG S.: On selecting software visualizationtools for program understanding in an industrial context. In Proc.IWPC (2002), IEEE, pp. 285–288.
[TMR02] TELEA A., MACCARI A., RIVA C.: An open toolkit for pro-totyping reverse engineering visualizations. In Proc. Data Visualiza-
tion (IEEE VisSym) (2002), IEEE.
[TV08a] TELEA A., VOINEA L.: An interactive reverse-engineeringenvironment for large-scale C++ code. In Proc. ACM SOFTVIS (2008),pp. 67–76.
[TV08b] TELEA A., VOINEA L.: A tool for optimizing the buildperformance of large software code bases. In Proc. CSMR (2008),pp. 153–156.
[TWSM94] TILLEY S., WONG K., STOREY M., MÜLLER H.: Pro-grammable reverse engineering. Intl. J. Software Engineering and
Knowledge Engineering 4, 4 (1994), 501–520.
[VT09a] VOINEA L., TELEA A.: Case study: Visual analytics in soft-ware product assessments. In Proc. VISSOFT (2009), pp. 57–45.
[VT09b] VOINEA L., TELEA A.: Visual querying and analysis of largesoftware repositories. Empirical Software Engineering 14, 3 (2009),316–340.
[WT04] WONG P. C., THOMAS J. J.: Visual analytics. IEEE Computer
Graphics and Applications 24, 5 (2004), 20–21.
c© The Eurographics Association 2010.