Embed Size (px)
Citation preview

DART
Visual Analyticsof (Aircraft) Trajectory Data
June 25, 2018
Georg Fuchs, Gennady Andrienko, Natalia Andrienko

Visual Analytics
The science of analytical reasoning facilitated byinteractive visual interfaces.
Visual analytics tools and techniques are used to
Synthesize information and derive insight from massive,dynamic, ambiguous, and often conflicting data
Detect the expected and discover the unexpected
Provide timely, defensible, and understandable assessments
Communicate assessment effectively for action
2ICRAT’18 Data-Enhanced TBO Workshop, Barcelona 2018-06-25
Information
Data
Knowledge
Decisions
IEEE Computer Society 2005http://nvac.pnl.gov/
EuroGraphics 2010http://www.vismaster.eu/book

Visual Analytics of Movement Data:Principal Transformations
Different representations of movement data suitable for different analysis tasks / reporting requirements
3ICRAT’18 Data-Enhanced TBO Workshop, Barcelona 2018-06-25
Spatial time series
(place-based)
Trajectories
Spatial time series
(link-based)
Local time
series
Spatial
situations
aggregateprojections (views)
Spatial events
integrate
disintegrate, extract
aggregate extract

Principal Transformations of Movement Data
4ICRAT’18 Data-Enhanced TBO Workshop, Barcelona 2018-06-25
Trajectories
divide into trips
extract
events
aggregate
aggregate
presence of movers in areas by
time intervals
flows (aggregate moves) of
movers between areas by
time intervals
integrate

Visual Data Exploration –Data Understanding & Data Quality
Movement happens in context – airspace design is a 4D spatio-temporal puzzle
Identification of most common types of errors, data gaps, ingestion problems
• ADS-B data: positional messages aggregated into trajectories
• Flight Plans + Regulations
• DDR Airblock/Configuration/Capacity data
5ICRAT’18 Data-Enhanced TBO Workshop, Barcelona 2018-06-25

The capacity excess events are shown in a space-time cube based on the original (red) and CFMU-regulated (blue) flight data. The vertical dimension, from bottom to top, represents time.
Visualizations of DART solutions
ICRAT’18 Data-Enhanced TBO Workshop, Barcelona 2018-06-25 7

Visualizations of solutions
Flight delays are represented by circles positioned at the sector centroids. The sizes are proportional to the delay durations.From top to bottom and from left to right: CFMU, AgentBased, Hierarchical, IndLearners, EdgeBased.
ICRAT’18 Data-Enhanced TBO Workshop, Barcelona 2018-06-25 8

Visualizations of solutions
The space-time cubes show the spatio-temporal distribution of the delays. The time axis is oriented upwards. From top to bottom and from left to right: CFMU, AgentBased, Hierarchical, IndLearners, EdgeBased.
ICRAT’18 Data-Enhanced TBO Workshop, Barcelona 2018-06-25 9

Visually supported Trajectory Comparison
Why compare flight trajectories?
• Flight plan vs. actual flight trajectory
• Two versions of flight plan
• Actual trajectory vs. a typical trajectory of a given flight / representative of a cluster
• Actual trajectory vs. predicted trajectory
• …
ICRAT’18 Data-Enhanced TBO Workshop, Barcelona 2018-06-25 10

Visually supported Trajectory Comparison
ICRAT’18 Data-Enhanced TBO Workshop, Barcelona 2018-06-25 11

Visually supported Trajectory Comparison
Key ingredient: Computing and visualizing pairwise distances
12ICRAT’18 Data-Enhanced TBO Workshop, Barcelona 2018-06-25
Description of the algorithm:let M = <(1,1)>; /* list M contains the pair (1,1) */let i = 2; let j = 2;while i <= P.length and j <= Q.length do /* scan the trajectories from the start to the end */
let cp = next_candidate_pair (P, Q, M, i, j); /* account for different inter-point distances, if needed */let i = cp.first; let j = cp.second; /* indexes of currently considered points in P and Q */let mi = M.lastElement[1]; let mj = M.lastElement[2]; /* indexes of the last matched points from P and Q */let n = argmin(distance(P[i],Q[j]), distance(P[i], Q[mj]), distance(P[mi], Q[j]), distance(P[mi], Q[mj]));if n = 2 and /* point P[i] is a better match to point Q[mj] than P[mi] */
distance(P[i], Q[mj]) < distance(P[i], Q[j+1]) /* point P[i] does not match Q[j+1] better than Q[mj] */then
let M = M – (mi, mj) + (i, mj); /* replace the pair (mi, mj) in M by (i, mj) */let i=i+1; /* proceed to the next point in P */
end_if;else
if n = 3 and /* point Q[j] is a better match to point P[mi] than Q[mj] */distance(P[mi], Q[j]) < distance(P[i+1], Q[j]) /* point Q[j] does not match P[i+1] better than P[mi] */
thenlet M = M – (mi, mj) + (mi, j); /* replace the pair (mi, mj) in M by (mi, j) */let j = j +1; /* proceed to the next point in Q */
end_if;else
let n = argmin(distance(P[i],Q[j]), distance(P[i], Q[j+1]), distance(P[i+1], Q[j]));if n = 2 and /* point Q[j+1] is a better match to point P[i] than Q[j] */
distance(P[i], Q[j+1]) < distance(P[i+1], Q[j+1]) /* point Q[j+1] is not a better match to P[i+1] than to P[i] */then
let j = j +1; /* proceed to the next point in Q */end_if;else
if n = 3 and /* point P[i+1] is a better match to point Q[j] than P[i] */distance(P[i+1], Q[j]) < distance(P[i+1], Q[j+1]) /* point P[i+1] is not a better match to Q[j+1] than to Q[j] */
thenlet i = i +1; /* proceed to the next point in P */
end_if;else
let M = M + (i,j); /* add the pair (i, j) to M */let i = i +1; let j = j +1; /* proceed to the next points in P and Q */
end_else;end_else;
end_else;end_else;
end_while;return M;
function next_candidate_pair (P, Q, M, i, j):if i > P.length or j > Q.length return null;let mi = M.lastElement[1]; let mj = M.lastElement[2]; /* (mi, mj) is the last matched pair */let d1 = distance(P[i], P[mi]); let d2 = distance(Q[j], Q[mj]); /* inter-point distances in P and Q */if d1 > d2 then
while d1 > d2 * TT and j < Q.length do /* much larger inter-point gap in P */
let j = j+1; let d2 = distance(Q[j], Q[mj]); /* proceed to the next point in Q */
end_while;end_if;else
while d2 > d1 * TT and i < P.length do /* much larger inter-point gap in Q */
let i = i+1; let d1 = distance(P[i], P[mi]); /* proceed to the next point in P */
end_while;end_else;return (i, j);

WP2: Single Trajectory Prediction
D2.2 Visually supported Trajectory Comparison
ICRAT’18 Data-Enhanced TBO Workshop, Barcelona 2018-06-25 13

WP2: Single Trajectory Prediction
D2.2 Visually supported Trajectory Comparison
ICRAT’18 Data-Enhanced TBO Workshop, Barcelona 2018-06-25 14
All matched points
Points deviating in space by >= 10 km
Points attained earlier by >= 10 minutes

This project has received funding from the SESAR Joint Undertaking under the European Union’s Horizon 2020 research and innovation programme under grant agreement No [number]
The opinions expressed herein reflect the author’s view only. Under no circumstances shall the SESAR Joint Undertaking be responsible for any use that may be made of the information contained herein.
Case Study I –Approach Route Analysis
15ICRAT’18 Data-Enhanced TBO Workshop, Barcelona 2018-06-25

Task: Extract the airport approach routes and observe the wind impact
16
Challenge: The holding loops are not essential parts of the approach routes
ICRAT’18 Data-Enhanced TBO Workshop, Barcelona 2018-06-25

Visual support to interactive filtering
Filter-aware rendering Filtering Boolean attribute visual encoding
Different level of detail for active and inactive parts
Workflow: filter cluster summarize analyse
17ICRAT’18 Data-Enhanced TBO Workshop, Barcelona 2018-06-25

Progressive clustering
Application of clustering with different distance functions or parameter settings to different data subsets
Particularly, subsets may be defined by previous clustering runs
Useful when clustering of the whole set produces clusters of differing quality
“Bad” clusters (with high internal variation) can be refined through further clustering and good clusters can be preserved
18
Workflow: filter cluster summarize analyse
ICRAT’18 Data-Enhanced TBO Workshop, Barcelona 2018-06-25

An example of cluster refinement
Workflow: filter cluster summarize analyse
19ICRAT’18 Data-Enhanced TBO Workshop, Barcelona 2018-06-25

21
Resulting clusters by approach routes(loops disregarded)
Central trajectories of the clusters represent the routes.
ICRAT’18 Data-Enhanced TBO Workshop, Barcelona 2018-06-25
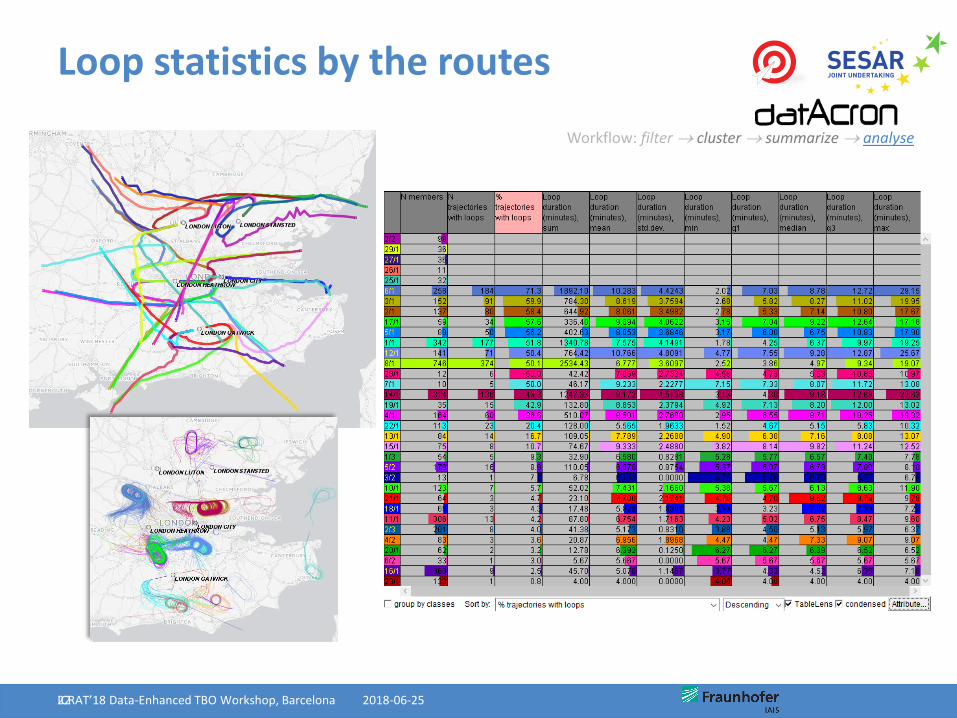
Loop statistics by the routes
22
Workflow: filter cluster summarize analyse
ICRAT’18 Data-Enhanced TBO Workshop, Barcelona 2018-06-25

Use of the routes over time
23
Day 1 Day 3
Workflow: filter cluster summarize analyse
ICRAT’18 Data-Enhanced TBO Workshop, Barcelona 2018-06-25

Understanding the wind impact
24
Workflow: filter cluster summarize analyse
ICRAT’18 Data-Enhanced TBO Workshop, Barcelona 2018-06-25

The routes to Stansted
25
Before 01/12/2016, 18:40
After 01/12/2016, 18:40
Workflow: filter cluster summarize analyse
ICRAT’18 Data-Enhanced TBO Workshop, Barcelona 2018-06-25

This project has received funding from the SESAR Joint Undertaking under the European Union’s Horizon 2020 research and innovation programme under grant agreement No [number]
The opinions expressed herein reflect the author’s view only. Under no circumstances shall the SESAR Joint Undertaking be responsible for any use that may be made of the information contained herein.
Case Study II –Route Choice Criteria Analysis
26ICRAT’18 Data-Enhanced TBO Workshop, Barcelona 2018-06-25

Task: Identify and compare the major flight routes from Paris to Istanbul
27ICRAT’18 Data-Enhanced TBO Workshop, Barcelona 2018-06-25
Gennady Andrienko, Natalia Andrienko, Georg Fuchs, Jose Manuel Cordero Garcia
Clustering Trajectories by Relevant Parts for Air Traffic Analysis
IEEE Transactions on Visualization and Computer Graphics(proceedings IEEE VAST 2017), 2018, vol. 24(1): 34-44
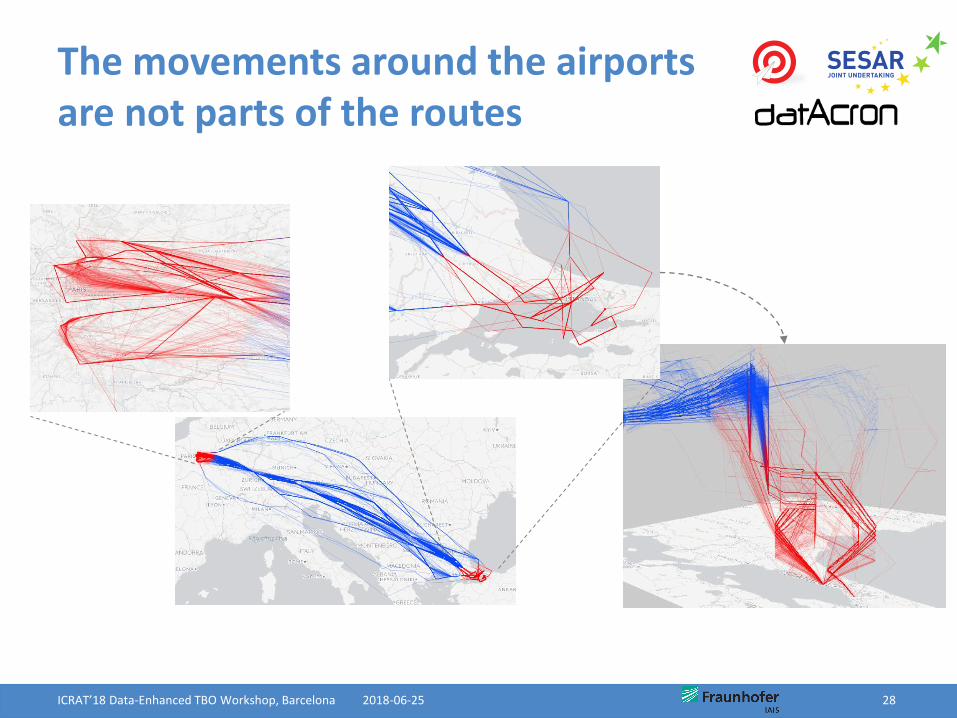
The movements around the airports are not parts of the routes
28ICRAT’18 Data-Enhanced TBO Workshop, Barcelona 2018-06-25

Route popularity and navigation charges
30ICRAT’18 Data-Enhanced TBO Workshop, Barcelona 2018-06-25

Route choices
32ICRAT’18 Data-Enhanced TBO Workshop, Barcelona 2018-06-25

Route variability
33ICRAT’18 Data-Enhanced TBO Workshop, Barcelona 2018-06-25

Conclusions
Visual Analytics – human expert in the loop
„Detect the expected, discover the unexpected“
Data Exploration & Understanding (raw data)
Pattern Extraction & Feature Engineering (refined data)
Visual exploration of modeling results
„What-if“ Analyses
Application to the ATM domain @ DART, datAcron
Complex data (4D trajectories; weather, airspace design, … contextual data)
Complex algorithms in moving towards TBO
Decision support (vs. autonomous „black box“ decision making)
34ICRAT’18 Data-Enhanced TBO Workshop, Barcelona 2018-06-25

This project has received funding from the SESAR Joint Undertaking under the European Union’s Horizon 2020 research and innovation programme under grant agreement No [number]
The opinions expressed herein reflect the author’s view only. Under no circumstances shall the SESAR Joint Undertaking be responsible for any use that may be made of the information contained herein.
Thank you very much for your attention!